Revamping the Regional Railway Systems in Eastern and Southern AfricaMark Pearson and Bo GiersingRegional Integration Research Network Discussion Paper (RIRN/DP/12/01)
Mineral Resource Based Growth Pole Industrialisation Growth Poles and Value Chains
Regional Integration Research NetworkOpen Dialogues for Regional Innovation
C.C. Callaghan

Mineral Resource Based Growth Pole Industrialisation – Value Chains Report
Page i
Preface
Since its establishment in 2009, Trade Mark Southern Africa (TMSA) has supported the
Tripartite of the Common Market of Eastern and Southern Africa (COMESA), the Southern
African Development Community (SADC) and the East African Community (EAC), in
developing and implementing its regional integration agenda. This involves supporting the
design and planned implementation of the Tripartite Free Trade Area (FTA), improving the
economic competitiveness of the region and reducing costs of cross-border transactions
through a transport corridor approach addressing both trade facilitation issues and
infrastructure constraints.
Focused industrial development is essential in the COMESA-EAC-SADC Tripartite region to
fundamentally change the economy and to promote high yield sectors. Such development
brings not only an improvement in the GDP and job provision, but promotes knowledge
accumulation and technological sophistication that have far reaching benefits for the
economy.
This research was conducted under the topic “Tripartite ‘Growth Pole’ Diagnostic Reports:
Analysis of Potentials and Prospects for Minerals-Based Industrialisation.” The research is
packaged in four (4) Sub-Sector Reports on hydrocarbons, ferrous metals, base metals and
phosphates and a Consolidated ‘Growth Poles’ Report. The reports profile and prioritise a
number of potential regional ‘growth poles’ throughout eastern and southern Africa. In the
‘first sort’ each known minerals deposit was analysed through three (3) filters as follows:
1. By size of deposit (size of known indicated resource);
2. By status of deposit (levels of investment in developing the deposit); and,
3. By ‘expert group’ assessment (market conditions and supporting infrastructure).
The research reviewed available information on mineral deposits and the status of their
development and analysed the extent to which realisable mining and mineral development
opportunities can contribute to and enhance regional development. Data constraints limited
the research to the Eastern and Southern Africa region and defined a limited number of
plausible ‘growth poles’, which could provide a platform to accelerate industrialisation in the
region.
The results from these three filters were then combined through a ‘second sort’, which
enhanced the analysis by clustering minerals within a defined locality into potential ‘growth-
pole’ value chains. In line with ‘growth pole’ theory the basis for any prioritisation was
Page ii
whether the initial ‘critical mass’ of investment had been achieved. The minimum critical level
of investment is considered to be achieved when five key pre-conditions have been met,
namely:
1. A recognised global multi-national corporation (MNC) has made a significant
investment in developing a mineral deposit or a cluster of mineral deposits;
2. Such an investment commitment reflects that the regulatory environment for trade
and investment in sufficiently robust to support large-scale projects;
3. Similarly, this size of investment in developing a world-class resource confirms that
the long term global market outlook for the target commodity is equally robust;
4. It also acknowledges that any supply-side infrastructure constraints can be overcome
by the projects cash-flows and that infrastructure development itself represents an
opportunity for the lead developer, in the transport and energy sectors for example;
and,
5. Finally, the participation of a strong ‘anchor’ investor substantially strengthens the
prospects for developing upstream linkages to local suppliers and new downstream
industries as a result of the presence of and initial investment by the global mining
company.
In addition to these pre-conditions the research also considers two additional criteria to
prioritize ‘growth-pole’ potential. The first was the extent to which the value-chain could be
developed given prevailing market conditions, and the second was whether value-chain
linkages straddle national borders to assume a regional posture.
Based on these considerations the following seven (7) regional growth poles were prioritised
in order of potential:
1. Tete, Mozambique – Southern Malawi (Hydrocarbons, Ferrous Metals and
Phosphates);
2. Copperbelt, Zambia – Copperbelt, DRC (Base Metals);
3. Cabinda, Angola – Bas Congo, DRC – Soyo, Angola (Hydrocarbons and
Phosphates);
4. Rovuma Basin, Mozambique – Ruvuma and Songo-Songo Basins, Tanzania
(Hydrocarbons);
5. Lephalale, South Africa – Morepule, Botswana (Hydrocarbons);
6. Kabanga, Tanzania – Musongati, Burundi (Base Metals); and,
7. Central Zimbabwe – Central Mozambique (Hydrocarbons and Ferrous Metals).
Page iii
An initial scoping study is currently being conducted to develop a fuller picture of the Tete,
Mozambique – Southern Malawi ‘Growth Pole’, which has been expanded to include
Eastern, Zambia, in collaboration with the World Bank and the governments of Malawi,
Mozambique and Zambia.
TMSA, under its Regional Integration Research Network initiative, commissioned Chris
Callaghan to conduct the research. Chris Callaghan is an independent consultant whose
career includes stints as a Mining Sector Specialist at the Development Bank of Southern
Africa (DBSA) and a Senior Manager at MINTEK South Africa, the state-run Mining
Technology Research Institute. The TMSA lead was Graham Smith, TMSA Programme
Manager - Corridors. The study benefited particularly from guidance and inputs by Dr.
Judith Fessehaie, TMSA Industrial Development Expert and Mr. Bo Giersing, TMSA Ports
and Railway Specialist, Mr. Jurgens Van Zyl, an independent Mining and Development
Finance Specialist, currently under contact to Business Leadership South Africa (BLSA) and
Dr. Paulo Fernandes, a Logistics Specialist at Mott MacDonald/PDNA South Africa. These
individuals ‘peer reviewed’ the prioritisation methodology, which underpinned the selection of
the Growth-Poles. Other TMSA colleagues provided some early inputs into the terms of
reference for the study.
More Information
The reports can be downloaded on the TMSA website at
www.trademarksa.org/publications/mineral-resource-based-growth-pole-industrialisation
Reports include the Consolidated Growth Poles and Value-Chains Report and four (4) Sub-
Sector Minerals Reports on Hydrocarbons (Coal, Oil and Gas), Ferrous Metals (Iron and
Steel), Base Metals (Chrome, Manganese, Nickel, Vanadium, Copper, Zinc and Lead) and
Phosphates report.
Page iv
Table of abbreviations
Billion cubic metres per annum bcmpa
Billions of tonnes bt
Billions of tonnes per annum btpa
Chrome Cr
Copper Cu
Direct shipping ore DSO
Empresa Nacional de Hidrocarbonetos ENH
Iron Fe
Ferrochrome FeCr
Gross domestic product GDP
Gigajoule GJ
Growth Pole based Programme GPBP
Global Value Chain GVC
Information and communications technology ICT
Liquefied natural gas LNG
Liquefied petroleum gases LPG
Million British Thermal Units MMbtu
Manganese Mn
Millions of tonnes Mt
Millions of tonnes per annum Mtpa
Manufacturing value add MVA
Normal cubic meters per hour NCMH
Natural gas liquids NGL
Nickel Ni
Phosphorous P
Lead Pb
Sulphur S
Special economic Zone SEZ
Tonnes t, ton
Terms of reference TOR
Tonnes per annum tpa
Wet High Intensity Magnetic Separator WHIMS
Zambia-China Cooperation zone ZCCZ
Zinc Zn

Page v
Table of Definitions
LNG Liquefied natural gas (largely methane cooled to -161°C for transport in specially designed tankers)
LPG Liquefied petroleum gases (propane, butane or mixtures of the two)
NCMH Normal cubic meters per hour is a measure of flow rate. It is equal to one cubic meter under "normal" conditions,
defined as 0°C and 1 atmosphere (101.3 kPa).
NGL Natural gas liquids (largely Ethane and heavier hydrocarbons, cooled to -101°C for transport to a tetrochemical
plant or refinery
MMbtu Million British Thermal units equal to the international ISO standard of 1.055056 GJ
Page vi
Table of Contents
1 Introduction .......................................................................................................... 1 1.1 Terminology ............................................................................................................... 8 1.2 The real ability to grow an economy on a minerals base .................................... 13
1.2.1 United States ....................................................................................................... 14 1.2.2 South Africa ......................................................................................................... 15
1.3 Linkages ................................................................................................................... 17 1.3.1 Monetary and Fiscal linkages .............................................................................. 17 1.3.2 Employee consumption linkages ......................................................................... 17 1.3.3 Production linkages ............................................................................................. 18
1.4 Basis for the focus areas ....................................................................................... 22
2 Methodology ...................................................................................................... 24 2.1 Screening and clustering to define growth poles around mineral potential ..... 24 2.2 Initial screening ....................................................................................................... 24 2.3 First sort ................................................................................................................... 26 2.4 Expert group rating ................................................................................................. 27 2.5 Infrastructure component ...................................................................................... 30 2.6 Challenges ............................................................................................................... 35 2.7 Value Chains ............................................................................................................ 35
2.7.1 First step in developing value chains .................................................................. 36 2.7.2 Policy Challenge ................................................................................................. 37 2.7.3 Mineral commodity value chains ......................................................................... 38 2.7.4 The importance of developing value chains ........................................................ 39 2.7.5 Global Value Chains ........................................................................................... 41
2.8 The JICA report ....................................................................................................... 44
3 Growth Poles ...................................................................................................... 47 3.1 Growth pole 1: Tete ................................................................................................. 47
3.1.1 Tete value Chain ................................................................................................. 48 3.1.2 Government revenue from coal mining ............................................................... 49 3.1.3 Linkages .............................................................................................................. 51
3.2 Growth Pole 2: Rovuma / Mtwara .......................................................................... 53 3.2.1 Government revenue .......................................................................................... 58
3.3 Growth Pole 3: Lephalale / Southern Botswana .................................................. 58
Page vii
3.3.1 Government revenue .......................................................................................... 63 3.4 Growth Pole 4: Copperbelt ..................................................................................... 64
3.4.1 Linkages .............................................................................................................. 69 3.5 Growth pole 5: Zimbabwe steel ............................................................................ 71 3.6 Growth Pole 6: Northern Cape iron/manganese .................................................. 74 3.7 Growth pole 7: Songo-Songo Central Tanzania ................................................... 76 3.8 Growth Pole 8: Cabinda / Bas Congo DRC Oil / Phosphate ................................ 81 3.9 Growth pole 9: Kabanga / Burundi nickel growth pole ....................................... 83
4 Conclusion ......................................................................................................... 85
Appendix A Energy content .................................................................................. 92
Appendix B Iron and steel value chain ................................................................ 93
Appendix C Chrome value chain ........................................................................ 107
Appendix D Manganese value chain ................................................................. 110
Appendix E Nickel value chain ........................................................................... 113
Appendix F Vanadium value chain .................................................................... 115
Appendix G Copper Value Chain ........................................................................ 117
Appendix H Zinc Value Chain ............................................................................. 121
Appendix I Lead Value Chain ............................................................................. 124
Appendix J Phosphate Value Chain ................................................................... 125
Appendix K Hydrocarbons ................................................................................. 127
Appendix L Direct opportunities ........................................................................ 139
Page viii
List of Figures
Figure 1: Relative Australian Wage levels ............................................................................... 3 Figure 2: Terms of trade for commodities versus manufactured goods .................................. 5 Figure 3: Primary commodity Prices and their piecewise linear trends, 1900-2010 ................ 5 Figure 4: Linkages in the wood and timber sector ................................................................... 9 Figure 5: Chamber of Mines four stage beneficiation process .............................................. 10 Figure 6: Resource related Gross Value Added (Australia) ................................................... 12 Figure 7: Mining industry expenditure (ZAR ‘M), *2011 ......................................................... 17 Figure 8: Monetary and fiscal linkages .................................................................................. 19 Figure 9: Proposed gas pipeline ............................................................................................ 33 Figure 10: Broad mineral commodities value chain ............................................................... 38 Figure 11: Generic mineral commodities value chain with broad inputs ................................ 39 Figure 12: Manufacturing contribution to GPD ...................................................................... 40 Figure 13: Economy wide impact of the South African mining sector in 2012 ....................... 40 Figure 14: Interlinkage of services with manufacturing in the global value chain .................. 43 Figure 15: Colour coding for growth pole diagrams ............................................................... 47 Figure 16: Tete Value Chain .................................................................................................. 50 Figure 17: Government revenue (in $ M) due to coal mining ................................................ 51 Figure 18: Rovuma Value Chain ............................................................................................ 57 Figure 19: Lephalale/ Southern Botswana Value Chain ........................................................ 61 Figure 20: Copperbelt Value Chain ....................................................................................... 67 Figure 21: Zimbabwe steel Value Chain ................................................................................ 73 Figure 22: Potential LNG site locations ................................................................................. 78 Figure 23: Possible direct, indirect and induced employment from LNG production ............. 79 Figure 24: Songo Songo Value Chain ................................................................................... 80 Figure 25: Cabinda Value Chain ............................................................................................ 82 Figure 26: Kabanga / Burundi Growth pole ........................................................................... 84 Figure 27: Locality of growth poles ........................................................................................ 85 Figure 28: Iron and steel value chain, Stage A – Exploration and Discovery ........................ 95 Figure 29: Iron and steel value chain, Stage B – Proving discovery and development ......... 97 Figure 30: Iron and steel value chain, Stage C – Mining ....................................................... 99 Figure 31: Iron and steel value chain, Stage D – On-site concentration and extraction ...... 100 Figure 32: Iron and steel value chain, Stage E – Off-site refining ....................................... 103 Figure 33: Iron and steel value chain, Stage F1 – Downstream cast iron ........................... 104 Figure 34: Iron and steel value chain, Stage F1 – Downstream steel ................................. 105
Page ix
Figure 35: Chromite value chain – All grades ...................................................................... 108 Figure 36: Chromite value chain – Chemical Grade ............................................................ 109 Figure 37: Manganese value chain ...................................................................................... 111 Figure 38: Manganese value chain - Chemicals .................................................................. 112 Figure 39: Nickel value chain ............................................................................................... 114 Figure 40: Vanadium value chain ........................................................................................ 116 Figure 41: Copper value chain – Generalised process to cast co ....................................... 118 Figure 42: Copper value chain – simplified Konkola process .............................................. 119 Figure 43: Copper value chain – Downstream .................................................................... 120 Figure 44: Zinc value chain – Mine to Special high grade zinc ............................................ 122 Figure 45: Zinc value chain – Downstream from Special high grade zinc ........................... 123 Figure 46: Zinc value chain – Downstream from Special high grade zinc ........................... 124 Figure 47: Phosphate Value Chain ...................................................................................... 126 Figure 48: Gas Value Chain ................................................................................................ 131 Figure 49: Oil Value Chain ................................................................................................... 136 Figure 50: Coal Value Chain ................................................................................................ 137 Figure 51: Sasol processes ................................................................................................. 138
Page x
List of Tables
Table 1: Size Ratings ............................................................................................................. 25 Table 2: Status Ranking ........................................................................................................ 26 Table 3: First sort ................................................................................................................... 27 Table 4: Expert rating by likelihood of attracting new fixed investment ................................. 27 Table 5: Second sort .............................................................................................................. 28 Table 6: Deposits related to the Tete growth pole ................................................................. 47 Table 7: Deposits related to the Rovuma/ Mtwara growth pole ............................................. 54 Table 8: Potential Mozambique domestic projects ................................................................ 55 Table 9: Government revenues from shared profits .............................................................. 58 Table 10: Deposits related to the Lephalale / Southern Botswana growth pole .................... 59 Table 11: Unconstrained coal export and revenue projection for Botswana coalfields ......... 63 Table 12: Deposits related to the Copperbelt growth pole ..................................................... 64 Table 13: Deposits related to the Zimbabwe iron and steel growth pole ............................... 72 Table 14: Deposits related to the Northern Cape growth pole ............................................... 74 Table 15: Deposits related to the Songo Songo growth pole ................................................ 77 Table 16: Typical composition of Natural Gas ..................................................................... 127
Page 1 2 Growth Poles and value chains
1 INTRODUCTION
This introductory section reviews some of the topics that have led to the formulation of the
industrial growth pole project.
Over time there have been several attempts at understanding the development of diverse
industrialised economies, none of which appear to have been able to adequately explain all
development around the world. The need to understand and progress economic
diversification and industrial development in low to middle income economies is critical for
Africa, to assist the process of rapid development, to supply much needed jobs, and to
protect Africa from ongoing poverty and civil strife. A recent book by Morris, Kaplinsky and
Kaplan (2012), has taken an in-depth look at industrialisation and it proposes that the most
should be made of the commodity boom to promote industrialisation on the continent. The
thinking that is behind this book is seen to be largely in line with that of the author and it
represents a clear and concise summary of the discussion on African industrialisation.
Notwithstanding the results of the recently published work of Martinez and Mlachila (2013) in
which they showed that, broadly speaking, the quality of growth has “unambiguously”
improved in Sub Saharan Africa over the past 15 years, now being “stronger, less volatile,
accompanied by productivity improvements, more broad-based, and more export-oriented”;
Africa still has a long way to go especially in relation to the nature of its exports.
Morris and others (2012) also point out that Africa's situation with regard to industrial
potential and GDP has shown signs of real change since the turn of the century, with GDP
growth between 2000 and 2010 at 4.7%, outstripping the global growth rate which was only
2.5%. Referring to Farooki and Kaplinsky (2012), they indicate that regardless of price
volatility, they expect commodity prices to continue being robust in the future "for some
years to come".
In the long term, and notwithstanding price booms, commodities have shown a relative drop
in price relative to manufactured goods. Morris and others (2012) support this traditional
view and give a short history of its development. They also recognise the recent reversal in
the terms of trade. However, in reviewing papers written over the past couple of decades on
the Resource Curse and Dutch Disease, they come to the conclusion that the real problem
affecting commodity rich countries may be rather a "commodities specialisation in an
economy with little or no history of industrial development". In this argument the leading
thinking of Wright and Czelusta (2004) is important; they state that most of the papers
Page 2 2 Growth Poles and value chains
advocating a resource curse equate mineral exports with resource abundance. They also
indicate that resource intensity was a pervasive feature in the industrial and technological
development of the United States, and furthermore that the minerals sector remains linked
today to technological knowledge and advances.
“Resource abundance was a significant factor in shaping if not propelling the U.S. path to
world leadership in manufacturing.” Wright and Czelusta (2004)
The path the U.S. followed was one of large scale investment in exploration and
transportation built on geological knowledge, with the concomitant development of mineral
extraction, refining and manufacturing technology (Wright and Czelusta, 2004). America
industrialised from a minerals base. Regardless of how the problem is couched in theory, the
result for Africa in practical terms is similar; Africa must industrialise and must do so soon,
since it is unlikely that any other route will lead to long term, steady economic growth and, as
stated by the Commission on Growth and Development (2008), it is only economic growth
that
“…can spare people en masse from poverty and drudgery. Nothing else ever has.”
The declining trend in the commodities : manufactured goods terms of trade (the Prebisch-
Singer hypothesis) has become weaker since around 2000, as the relative prices of primary
commodities increased (Yamada and Yoon, 2013) and appears to have been arrested, and
possibly reversed, because of improvement in commodities pricing due to enhanced
demand (Morris et al 2012). Add to this the fact that in many cases the best and easiest-to-
access deposits of minerals are coming to an end, and the fact that there tends to be a long
period before new (especially large, low grade) deposits can come on stream, and the future
looks positive for demand-driven pricing to remain robust. As to the reasons for the
increasing costs of exported commodities, one must not ignore the huge cost pressure
(especially due to labour and energy costs) of the last few years on miners throughout the
world – but perhaps most clearly in southern Africa.
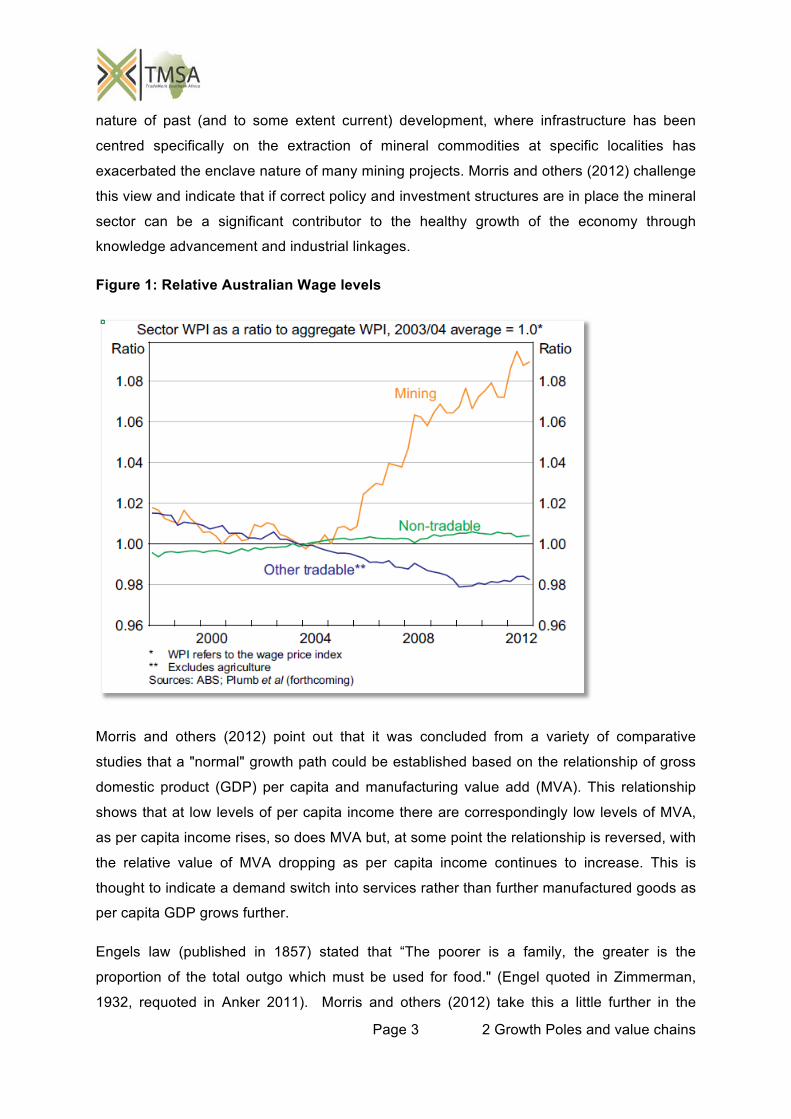
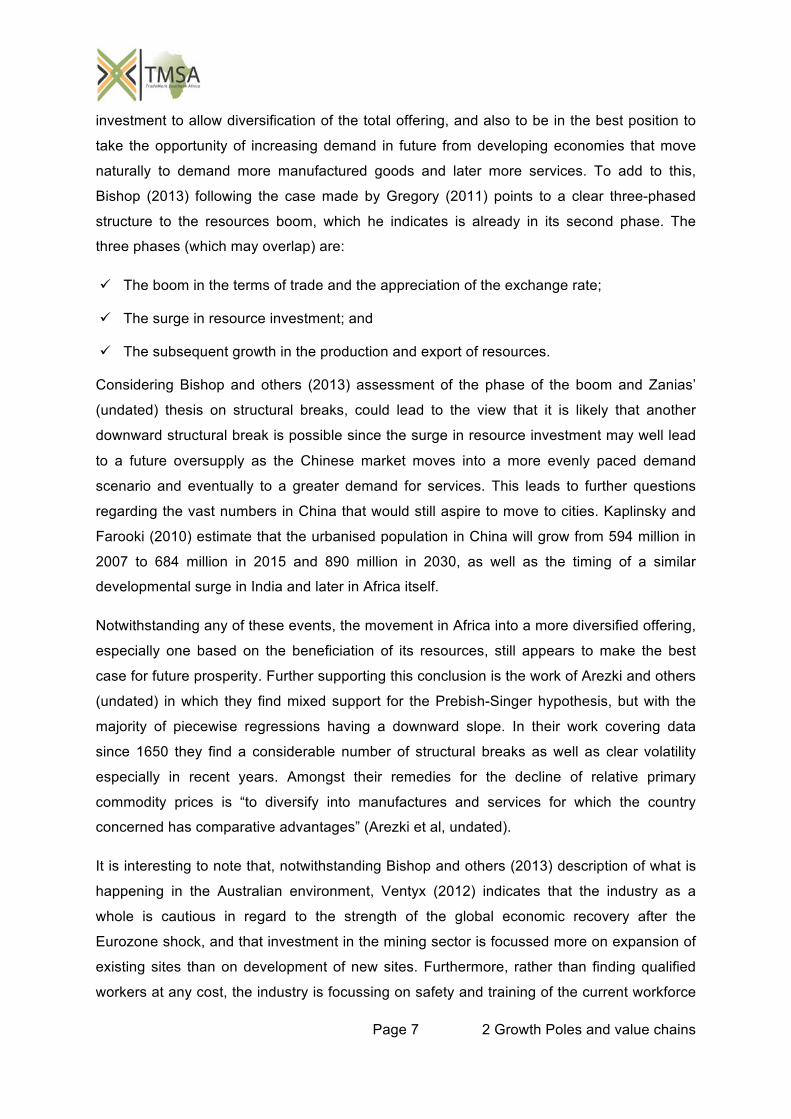
Bishop and others (2013) provide an excellent graphic summary of the wage increase in the
Australian mining sector relative to other sectors in the economy (see Figure 1). The higher
cost of mining now, relative to the 1990’s, indicates that it is unlikely that the price of
commodities will fall again to the levels seen pre 2000.
Morris and others (2012) discuss the contribution of Singer (1950) in which he hypothesised
the idea of enclave economies in which there was little scope for commodity driven linkages
in the low income, low technology, developing country in which the mining took place. The
Page 3 2 Growth Poles and value chains
nature of past (and to some extent current) development, where infrastructure has been
centred specifically on the extraction of mineral commodities at specific localities has
exacerbated the enclave nature of many mining projects. Morris and others (2012) challenge
this view and indicate that if correct policy and investment structures are in place the mineral
sector can be a significant contributor to the healthy growth of the economy through
knowledge advancement and industrial linkages.
Figure 1: Relative Australian Wage levels
Morris and others (2012) point out that it was concluded from a variety of comparative
studies that a "normal" growth path could be established based on the relationship of gross
domestic product (GDP) per capita and manufacturing value add (MVA). This relationship
shows that at low levels of per capita income there are correspondingly low levels of MVA,
as per capita income rises, so does MVA but, at some point the relationship is reversed, with
the relative value of MVA dropping as per capita income continues to increase. This is
thought to indicate a demand switch into services rather than further manufactured goods as
per capita GDP grows further.
Engels law (published in 1857) stated that “The poorer is a family, the greater is the
proportion of the total outgo which must be used for food." (Engel quoted in Zimmerman,
1932, requoted in Anker 2011). Morris and others (2012) take this a little further in the
Page 4 2 Growth Poles and value chains
explanation of the "normal" pattern of growth, indicating that as per capita income increases
consumers can add a greater amount of manufactured goods and ultimately services to their
spend. They also point out that the price elasticity of demand is an important part of the
equation, with substitutes often causing a drop in demand for primary commodities, if the
price becomes an incentive for such technological development. Furthermore, lack of skills
and technological barriers tend to slow down the progress of a nation from the production of
commodities to the production of industrialised goods. Following a similar path to other
economies that have made the transition (from commodity producer to manufactured goods
producer) in the past, may be difficult. There are a number of barriers, such as the cost of
transportation and the hurdle of trade liberalisation policies. Furthermore, the route of export
oriented industrial development becomes less and less attractive as each new nation comes
into competition, simply because the competition is too great especially when one competes
with a nation the size of China (Morris et al 2012).
In general, manufacturing and services are more labour intensive than mining and the first
stages of beneficiation (Morris and others (2012) call this "processing"). Furthermore, the
common occurrence of kleptocracy and violence indicates the urgency for resource rich
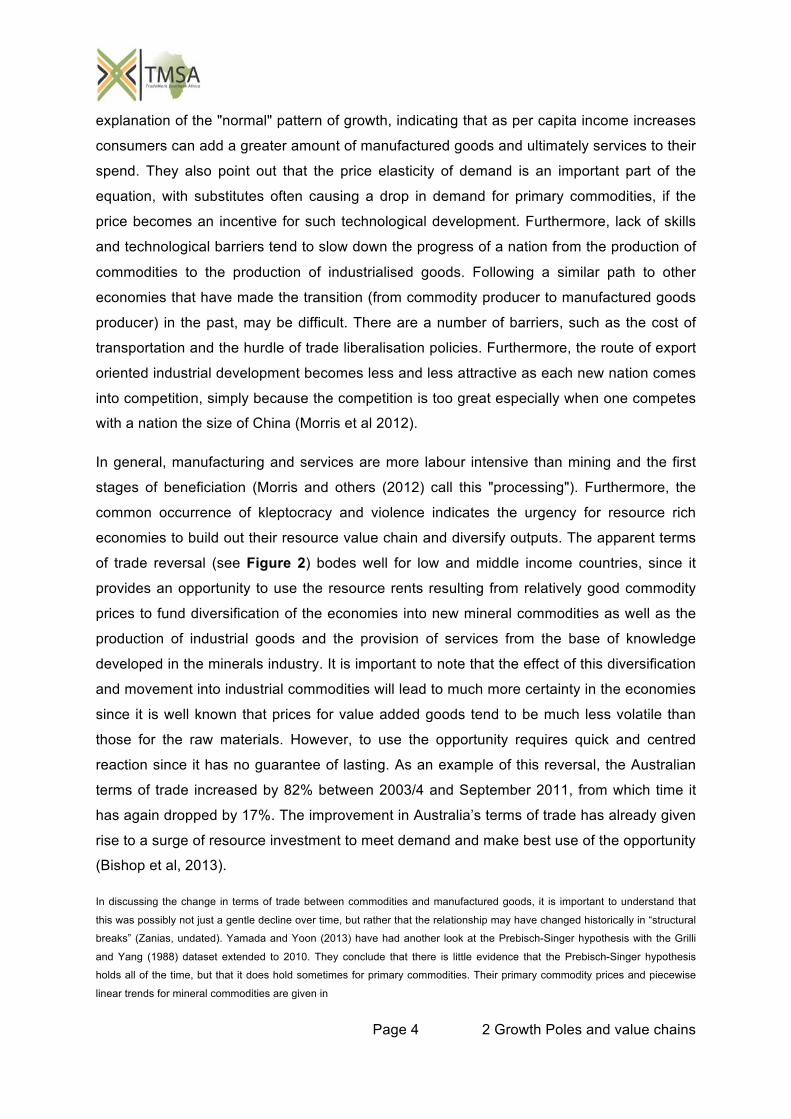
economies to build out their resource value chain and diversify outputs. The apparent terms
of trade reversal (see Figure 2) bodes well for low and middle income countries, since it
provides an opportunity to use the resource rents resulting from relatively good commodity
prices to fund diversification of the economies into new mineral commodities as well as the
production of industrial goods and the provision of services from the base of knowledge
developed in the minerals industry. It is important to note that the effect of this diversification
and movement into industrial commodities will lead to much more certainty in the economies
since it is well known that prices for value added goods tend to be much less volatile than
those for the raw materials. However, to use the opportunity requires quick and centred
reaction since it has no guarantee of lasting. As an example of this reversal, the Australian
terms of trade increased by 82% between 2003/4 and September 2011, from which time it
has again dropped by 17%. The improvement in Australia’s terms of trade has already given
rise to a surge of resource investment to meet demand and make best use of the opportunity
(Bishop et al, 2013).
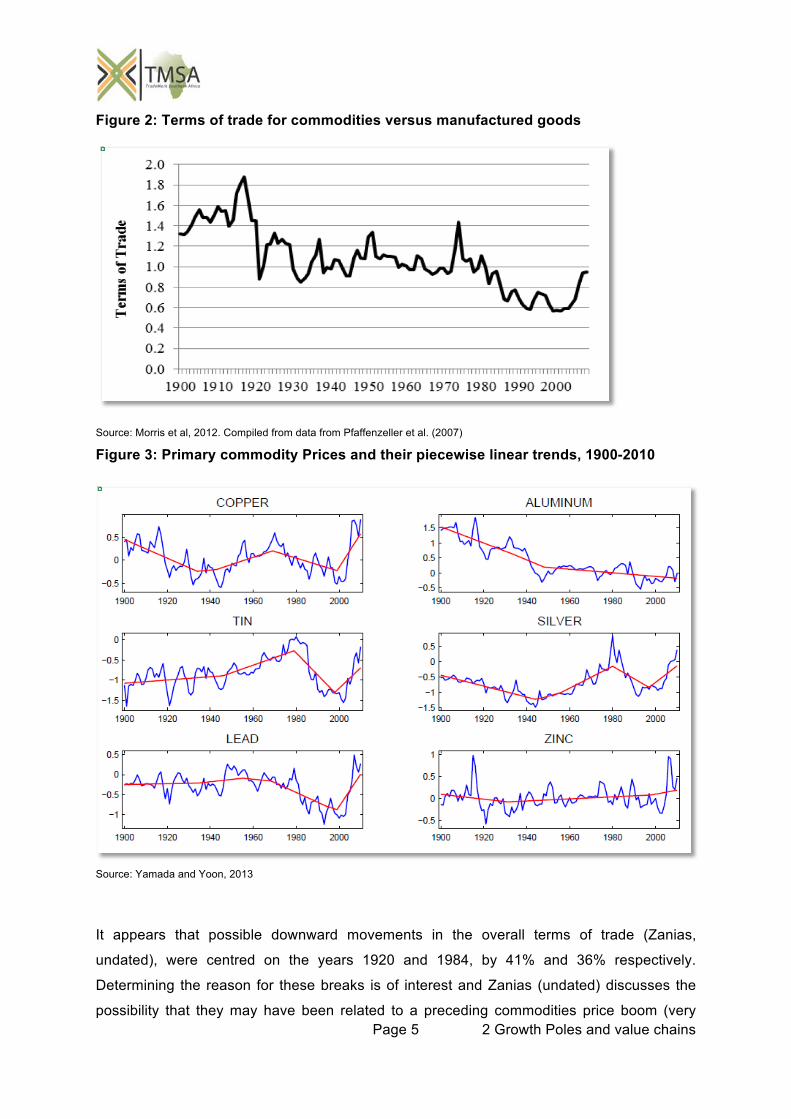
In discussing the change in terms of trade between commodities and manufactured goods, it is important to understand that
this was possibly not just a gentle decline over time, but rather that the relationship may have changed historically in “structural
breaks” (Zanias, undated). Yamada and Yoon (2013) have had another look at the Prebisch-Singer hypothesis with the Grilli
and Yang (1988) dataset extended to 2010. They conclude that there is little evidence that the Prebisch-Singer hypothesis
holds all of the time, but that it does hold sometimes for primary commodities. Their primary commodity prices and piecewise
linear trends for mineral commodities are given in
Page 5 2 Growth Poles and value chains
Figure 2: Terms of trade for commodities versus manufactured goods
Source: Morris et al, 2012. Compiled from data from Pfaffenzeller et al. (2007)
Figure 3: Primary commodity Prices and their piecewise linear trends, 1900-2010
Source: Yamada and Yoon, 2013
It appears that possible downward movements in the overall terms of trade (Zanias,
undated), were centred on the years 1920 and 1984, by 41% and 36% respectively.
Determining the reason for these breaks is of interest and Zanias (undated) discusses the
possibility that they may have been related to a preceding commodities price boom (very
Page 6 2 Growth Poles and value chains
clear in Figure 2). However the graph in Figure 2 extends into the current commodities price
boom – something Zanias did not have – and, if Zanias’ thesis is correct the questions that
then arise are:
How long will the boom last? and,
Does this imply another structural break? and if so,
Will it necessarily indicate that commodities prices will once again fall significantly
relative to manufactured goods? or,
Does the reversal in the terms of trade indicate a fundamental change due to increasing
global scarcity of commodities to support the burgeoning world population?
Regardless of the answers to the above questions the advice of Zanias (undated) remains
that developing resource intensive economies must diversify exports to reduce risk and
increase revenue. The challenge, as indicated by Morris and others (2012), is to "determine
which industrial and service sectors provide the greatest possibilities for development." It is
this challenge that is at the core of the current study.
It is perhaps pertinent to note here that the advice to diversify the economy of commodity
based countries is not universal. Tilton (2012) adds a word of caution in that some
economists may not, in his opinion, be looking at the full picture. He argues that the reason
for the long term falling terms of trade may be that costs in the production of primary
commodities have dropped. At the same time the improvements in manufactured products
produced may not be sufficiently taken into account by economists. Since a movement away
from the production of primary commodities would be counterproductive where production
costs are falling fast enough to counter the price drop, he advises that the suggestion that
countries should diversify away from such production “may very well be counterproductive,
encouraging countries to abandon what is a promising path to faster economic
development.” Tilton (2012). Contrary to this thinking, Pascal Lamy said, at the Hague on the
7th March 2013 at the “Conference on International Cooperation in 2020”, that virtually all
development and poverty reduction has included a high average rate of sustained growth,
inclusive of participation in international trade. He added that the essential ingredient for
resilient growth is “diversified productive capacity” (WTO News, 2013).
The call to diversify should not be seen as a call to diversify away from the production of
primary commodities, but rather an opportunity to use the comparative advantage to support
Page 7 2 Growth Poles and value chains
investment to allow diversification of the total offering, and also to be in the best position to
take the opportunity of increasing demand in future from developing economies that move
naturally to demand more manufactured goods and later more services. To add to this,
Bishop (2013) following the case made by Gregory (2011) points to a clear three-phased
structure to the resources boom, which he indicates is already in its second phase. The
three phases (which may overlap) are:
The boom in the terms of trade and the appreciation of the exchange rate;
The surge in resource investment; and
The subsequent growth in the production and export of resources.
Considering Bishop and others (2013) assessment of the phase of the boom and Zanias’
(undated) thesis on structural breaks, could lead to the view that it is likely that another
downward structural break is possible since the surge in resource investment may well lead
to a future oversupply as the Chinese market moves into a more evenly paced demand
scenario and eventually to a greater demand for services. This leads to further questions
regarding the vast numbers in China that would still aspire to move to cities. Kaplinsky and
Farooki (2010) estimate that the urbanised population in China will grow from 594 million in
2007 to 684 million in 2015 and 890 million in 2030, as well as the timing of a similar
developmental surge in India and later in Africa itself.
Notwithstanding any of these events, the movement in Africa into a more diversified offering,
especially one based on the beneficiation of its resources, still appears to make the best
case for future prosperity. Further supporting this conclusion is the work of Arezki and others
(undated) in which they find mixed support for the Prebish-Singer hypothesis, but with the
majority of piecewise regressions having a downward slope. In their work covering data
since 1650 they find a considerable number of structural breaks as well as clear volatility
especially in recent years. Amongst their remedies for the decline of relative primary
commodity prices is “to diversify into manufactures and services for which the country
concerned has comparative advantages” (Arezki et al, undated).
It is interesting to note that, notwithstanding Bishop and others (2013) description of what is
happening in the Australian environment, Ventyx (2012) indicates that the industry as a
whole is cautious in regard to the strength of the global economic recovery after the
Eurozone shock, and that investment in the mining sector is focussed more on expansion of
existing sites than on development of new sites. Furthermore, rather than finding qualified
workers at any cost, the industry is focussing on safety and training of the current workforce
Page 8 2 Growth Poles and value chains
thus also improving performance. At the same time industry is moving in the direction of a
greater reliance on information technology and automation to improve efficiency in the face
of declining grades and increasing cost.
1.1 Terminology
In their discussion of linkages Morris and others (2012), refer to the work of Hirschman
(1981). Hirschman considered three types of linkages: fiscal linkages, consumption linkages
and production linkages. These linkages are variously interpreted within the literature but
here they will be seen as follows:
Fiscal linkages will be seen to include royalties and licence fees on companies as well
as taxes on profits of companies and on wages and salaries to their employees,
Consumption linkages refer to the demand generated by employees, based on earned
incomes, for outputs of the commodities and other sectors,
Production linkages are inclusive of
Upstream or backwards linkages, referring to inputs to be used in the commodities
sector and,
Downstream or forwards linkages, referring to production of outputs of commodities
through various stages of value addition into semis, intermediate and finished products
for use in the industrial sector or final usage
Sidestream or horizontal linkages, referring to linkages developed directly from the core
business, or its upstream or downstream components, which develop the capability to
move into other value chains, inclusive of services, power and transport infrastructure
(rail, roads and ports)
This study will concentrate on production linkages.
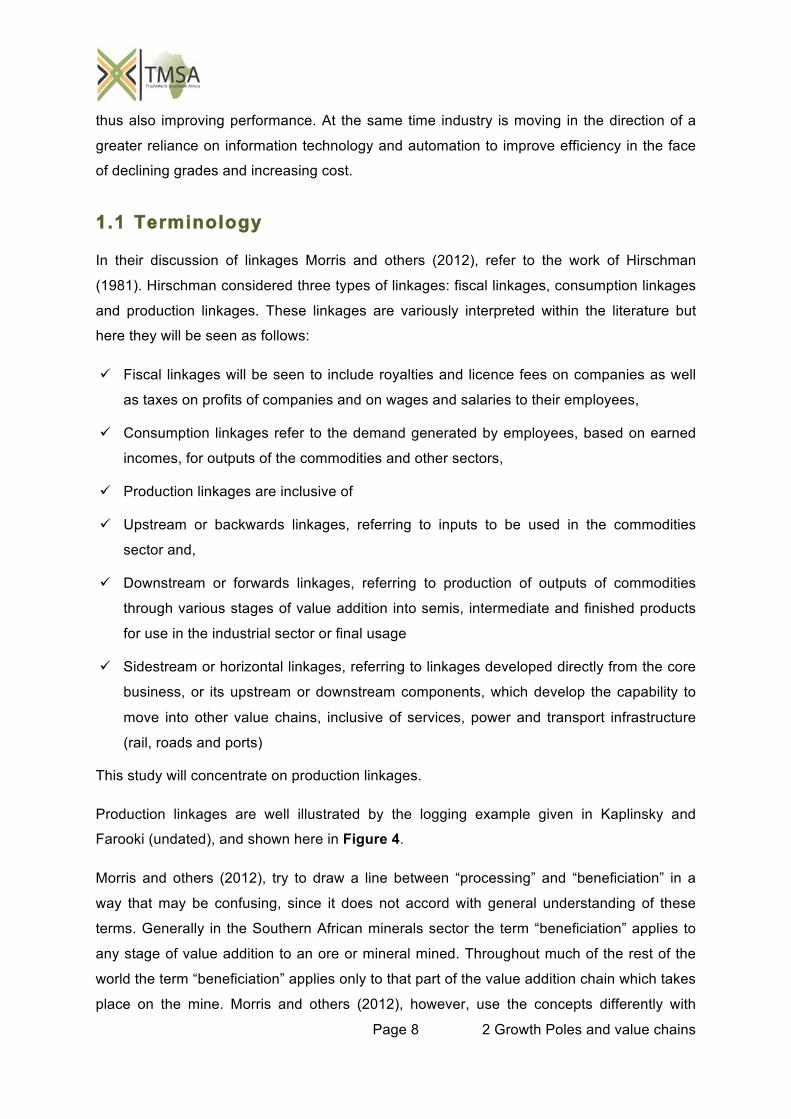
Production linkages are well illustrated by the logging example given in Kaplinsky and
Farooki (undated), and shown here in Figure 4.
Morris and others (2012), try to draw a line between “processing” and “beneficiation” in a
way that may be confusing, since it does not accord with general understanding of these
terms. Generally in the Southern African minerals sector the term “beneficiation” applies to
any stage of value addition to an ore or mineral mined. Throughout much of the rest of the
world the term “beneficiation” applies only to that part of the value addition chain which takes
place on the mine. Morris and others (2012), however, use the concepts differently with
Page 9 2 Growth Poles and value chains
“processing” being used for the first stages of value addition and “beneficiation” only being
used when the product is used to produce something new, to quote:
“.. we distinguish the processing of commodities from the beneficiation of commodities.
Processing involves a deepening of value added, as a commodity is refined or processed
prior to being passed on to user industries. For example, iron ore is processed into steel,
copper is smelted, and cotton is carded before spinning can take place. In this sense, the
‘processing’ of raw materials occurs in a technologically related industry. By contrast,
beneficiation describes a process of transformation in which the processed commodity is
converted into an entirely different product, generally in an unrelated manufacturing activity.”
To add to the possible confusion with this concept, there is far more difference between for
example the well-known ore mineral malachite (CuCO3.Cu(OH)2) and the product of copper
(Cu), than there is between say, copper cathode and copper wire, both of which are the
same material, copper.
Figure 4: Linkages in the wood and timber sector
Source: Kaplinsky and Farooki (undated)
Even though this definition is now gaining some traction in South Africa and appears to be
supported also by Ben Turok in his open discussions with industry, I would argue that it will
confuse the issue further since the exact cut-off of where “processing” ends and
“beneficiation” begins would then require definition for each mineral commodity. It falls into
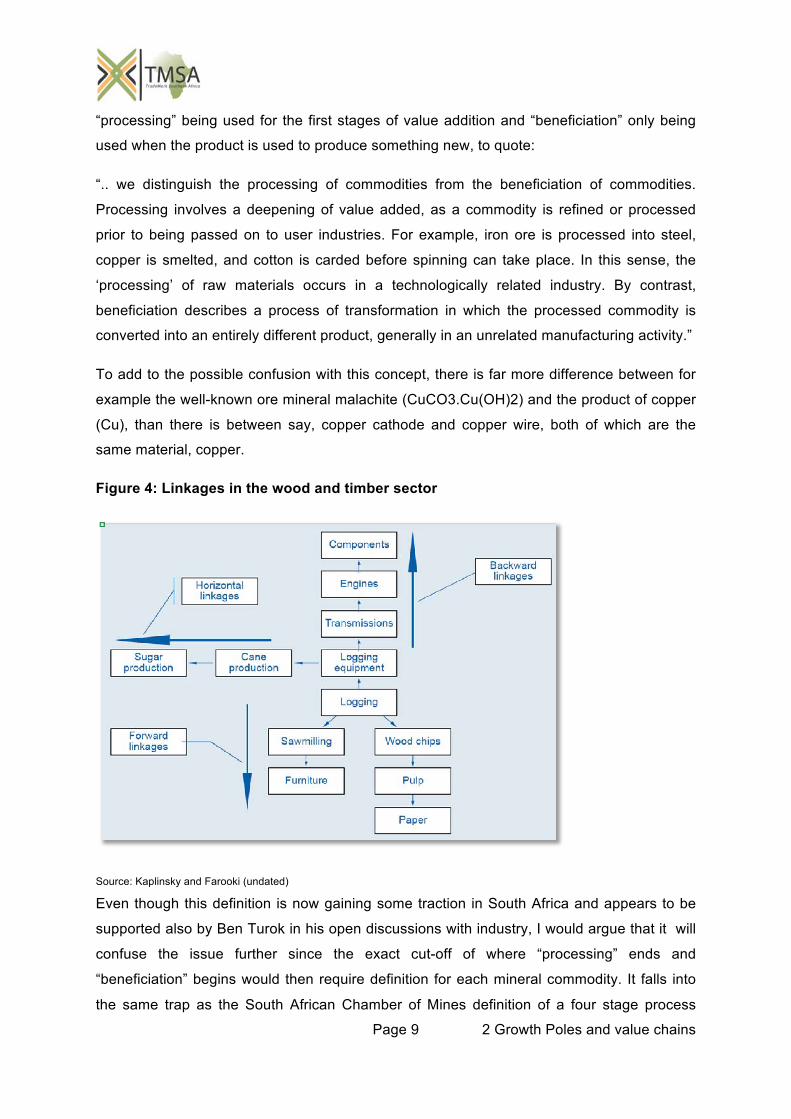
the same trap as the South African Chamber of Mines definition of a four stage process
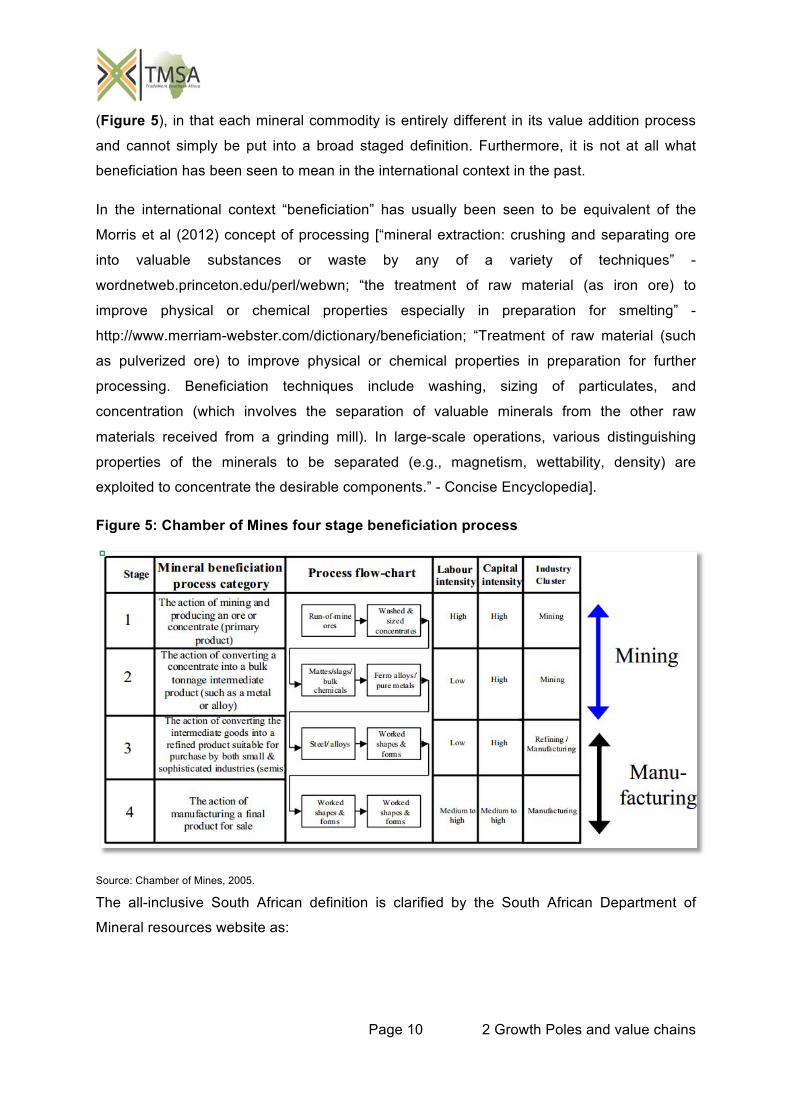
Page 10 2 Growth Poles and value chains
(Figure 5), in that each mineral commodity is entirely different in its value addition process
and cannot simply be put into a broad staged definition. Furthermore, it is not at all what
beneficiation has been seen to mean in the international context in the past.
In the international context “beneficiation” has usually been seen to be equivalent of the
Morris et al (2012) concept of processing [“mineral extraction: crushing and separating ore
into valuable substances or waste by any of a variety of techniques” -
wordnetweb.princeton.edu/perl/webwn; “the treatment of raw material (as iron ore) to
improve physical or chemical properties especially in preparation for smelting” -
http://www.merriam-webster.com/dictionary/beneficiation; “Treatment of raw material (such
as pulverized ore) to improve physical or chemical properties in preparation for further
processing. Beneficiation techniques include washing, sizing of particulates, and
concentration (which involves the separation of valuable minerals from the other raw
materials received from a grinding mill). In large-scale operations, various distinguishing
properties of the minerals to be separated (e.g., magnetism, wettability, density) are
exploited to concentrate the desirable components.” - Concise Encyclopedia].
Figure 5: Chamber of Mines four stage beneficiation process
Source: Chamber of Mines, 2005.
The all-inclusive South African definition is clarified by the South African Department of
Mineral resources website as:
Page 11 2 Growth Poles and value chains
“Beneficiation, or value-added processing, involves the transformation of a primary material
(produced by mining and extraction processes) to a more finished product, which has a
higher export sales value. Beneficiation involves a range of different activities including:
Large-scale, capital-intensive activities, such as smelting;
Sophisticated refining plants; and
Labour-intensive processes, such as craft jewellery, metal fabrication and ceramic
pottery.
Each successive level of processing permits the product to be sold at a higher price than the
previous intermediate product or original raw material and adds value at each stage.”
For the purposes of this study the following definitions will apply:
Mineral processing: that stage of adding value to the mined mineral or ore that typically
takes place at the mine site to make it saleable to manufacturers. This may vary in type of
process and the level of purity achieved and is dependent on the market.
Beneficiation: any process of recovering, extracting, concentrating, refining or further
processing of a mineral or ore into a mineral product with a higher value and / or utility. This
is inclusive of mineral processing, smelting and refining as well as value addition to the point
that an entirely new product is formed which does not owe its value primarily from the
mineral commodity, and is ready for sale on the open market.
This definition can still be considered to be variable across mineral commodities, it is
perhaps more useful than some of the narrower versions given above.
The concept of depth and breadth of linkages as discussed by Morris et al (2012) is useful.
The depth of the linkage relates to the degree of value that is added through the linkage,
whilst the breadth of the linkage refers to the range of connected activities feeding into or
from the linkage.
In the discussion by Morris and other (2012) on staples theory, they conclude that resource
extraction inevitably does lead to the development of infrastructure and, as a result, to
horizontal linkages which can benefit from the infrastructural build. They also argue that the
“Staples trap” of being caught in commodity specialisation is not inevitable and that a degree
of industrial development with forward and backward linkages usually results from resource
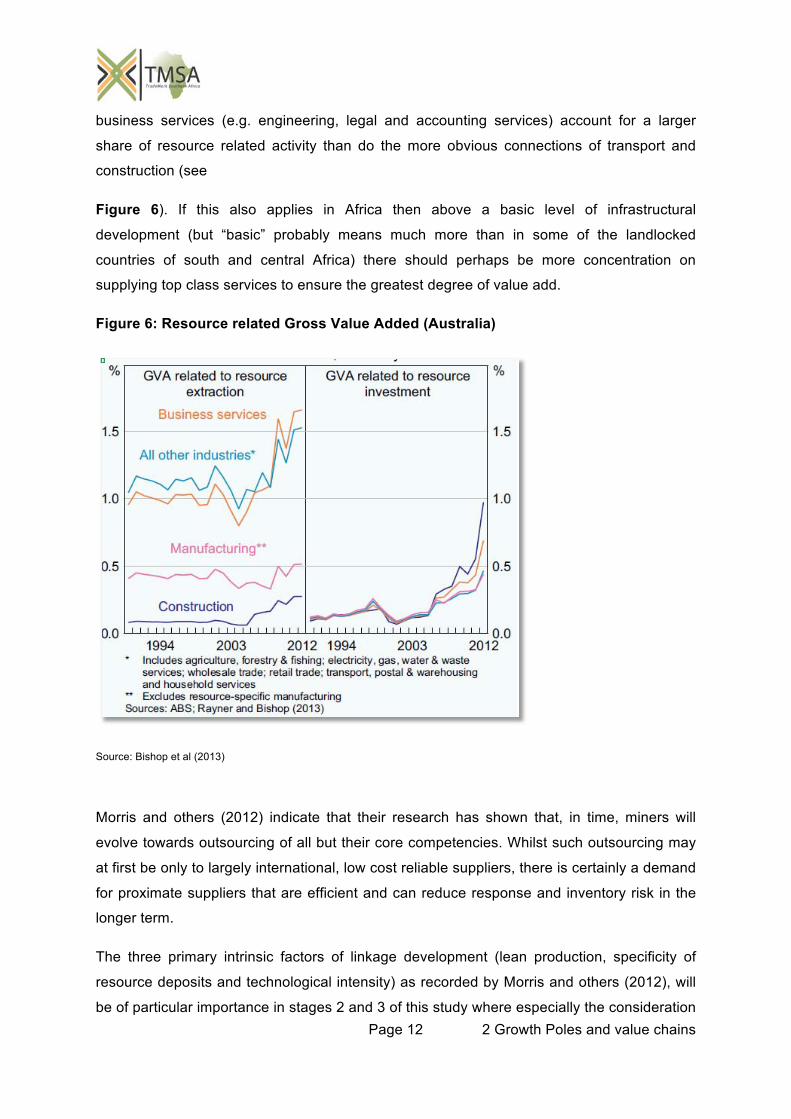
exploitation. Interesting here is the recent paper by Bishop et al (2013) which clarifies the
resource related gross value addition (GVA) in Australia. It is clear from their data that
Page 12 2 Growth Poles and value chains
business services (e.g. engineering, legal and accounting services) account for a larger
share of resource related activity than do the more obvious connections of transport and
construction (see
Figure 6). If this also applies in Africa then above a basic level of infrastructural
development (but “basic” probably means much more than in some of the landlocked
countries of south and central Africa) there should perhaps be more concentration on
supplying top class services to ensure the greatest degree of value add.
Figure 6: Resource related Gross Value Added (Australia)
Source: Bishop et al (2013)
Morris and others (2012) indicate that their research has shown that, in time, miners will
evolve towards outsourcing of all but their core competencies. Whilst such outsourcing may
at first be only to largely international, low cost reliable suppliers, there is certainly a demand
for proximate suppliers that are efficient and can reduce response and inventory risk in the
longer term.
The three primary intrinsic factors of linkage development (lean production, specificity of
resource deposits and technological intensity) as recorded by Morris and others (2012), will
be of particular importance in stages 2 and 3 of this study where especially the consideration
Page 13 2 Growth Poles and value chains
of specificity of resource will be important. The other two factors of lean production and
technological intensity are more generic to the development of linkages within the sector.
In framing the overall concept for this study it is important to see infrastructural attributes of
linkage development in their broadest sense and to be aware of the advantages that may
flow through from centred investment to not only the physical infrastructure (road, rail, ports,
pipelines, telecommunication and electricity networks) but also to the softer social
infrastructure (regulatory regime, administrative networks, educational facilities, institutional
development).
1.2 The real ability to grow an economy on a minerals base
The resource curse is both real and imaginary. It is real because, where governments do not
put the correct policy in place, or become corrupt, resource riches exported in an
unbeneficiated form from insular development leads to the negative effects of the Dutch
disease. However, it is imaginary in the sense that the effect is not due to the natural
resource wealth in itself, but rather to the attitudes that develop around the wealth and the
resultant lack of appropriate measures to ward off the negative effects which can come from
an over-reliance on the natural resource to build the economy. The problem in essence
relates to the fact that any other project will use a resource that has a raw material input cost
as well as capital and production costs. The raw material costs of an industry are supportive
of other industry. In the case of the production of natural resources this is not so and
therefore industries based on natural resources pass less direct external benefits to other
industry (Gylfason, 2001). The Dutch disease therefore does not exist where the state,
through careful and sensible policy and control measures ensures that the economic benefit
of the raw materials mined are ploughed back into the economy through the development of
backward linkages to related industry, local beneficiation of raw materials and taxation
policies which promote knowledge development and industrial growth. In discussing the
failure of most resource rich low to middle income countries to benefit significantly from
resource based development, Barbier (undated) states:
“The conditions for ensuring successful development have simply not been met. That is, in
most of today’s developing economies, frontier expansion has been symptomatic of a
pattern of economy-wide resource exploitation that generates little additional economic
rents, and what rents are generated, have not been reinvested in more productive and
Page 14 2 Growth Poles and value chains
dynamic sectors, such as resource-based industries and manufacturing, or in education,
social overhead projects and other long-term investments.”
The question may remain in the minds of readers: “But has it ever been done?”, and the
answer is simply “Yes, many times.” Most modern economies have at some point in the past
used their natural resource wealth to boost economic growth and development. Barbier
(undated) states that:
“Exploiting or converting new sources of relative abundant resources for production
purposes can be a dynamic process that causes economies to “take off.”
Two of these, The United States and South Africa will be briefly described.
1.2.1 United States
Wright and Czelusta (2004) show that successful resource based development is not
primarily a matter of geological endowment. In the late 19th and early 20th century when the
US became the world’s leading manufacturer, it was already the leading mineral economy.
US technological and industrial development was based on its resource endowment.
Large scale investments in exploration, transportation, geological and metallurgical
knowledge allowed early development of the countries mineral potential and lead to the
development of an industrial economy based on the knowledge and technological expertise
built on the mineral sector.
Where resource based economies have performed poorly, it has not been due to an
overemphasis of mineral wealth but rather due to a failure to properly develop their mineral
potential through appropriate policy (Wright and Czelusta, 2004).
Wright and Czelusta (2004) quote Benjamin Franklin as having said that there are no mines
in North America in 1790, however by 1913 the US was the dominant producer in the world
of most industrial minerals used at the time. During the period 1879-1914 the resource
intensity of the US exports increased at the same time as it was becoming the leading
manufacturing hub of the world. During this time the U.S. share of mineral production was far
in excess of its relative reserve potential. Wright and Czelusta (2002) refer to the essence of
the US success with their mineral endowment as follows:
“The American economy may have been resource abundant, but Americans were not
rentiers living passively off of their mineral royalties. Clearly the American economy made
something of its abundant resources. Nearly all major US manufactured goods were closely
Page 15 2 Growth Poles and value chains
linked to the resource economy in one way or another: petroleum products, primary copper,
meat packing and poultry, steel works and rolling mills, coal mining, vegetable oils, grain mill
products, sawmill products, and so on. The only items not conspicuously resource-oriented
were various categories of machinery. Even here, however, some types of machinery
serviced the resource economy (such as farm equipment), while virtually all were
beneficiaries in that they were made of metal. These observations by no means diminish the
country’s industrial achievement, but they confirm that American industrialization was built
upon natural resources.”
Herein also lies the blueprint for Africa today and the motivation for a project of this nature
which will attempt to find just those links that can assist the growth of an industrialised
economy based on a mineral endowment.
Referring to the 1997 paper by David and Wright, Wright and Czelusta (2004) indicate that
the rise of the US economy can be ascribed to:
An accommodating legal environment
Investment in infrastructure and public knowledge
Education in mining, minerals and metallurgy.
1.2.2 South Africa
South Africa changed in the late 19th Century from an essentially agricultural society to an
industrial society. This change took place at the same time (and as a result of) as the
discovery of diamonds and more significantly the discovery in 1886 of gold on the
Witwatersrand. Within 10 years of the discovery of gold, Johannesburg existed, 20 years
later it was already South Africa’s largest city and today it is the largest city and industrial
hub in Africa. The mining sector’s contribution to continued industrialisation of South Africa
has led to it being the most industrialised country in Africa at present.
This contribution by mining to the structural transformation of South Africa has been and can
still be significant. However, it requires constant attention to the regulatory and institutional
environment. Of particular importance is the removal of barriers (real and perceived) to the
development of new mines and especially to the expansion of a full value chain industry
based on mining in South Africa.
Mining in South Africa today is a well organised and highly regulated industry which makes a
significant contribution to national and regional development. In terms of job creation, mining
provided more than 513,211 direct jobs as well as an estimated 160,000 jobs directly linked
Page 16 2 Growth Poles and value chains
to the beneficiation of mineral commodities in 2011. This does not account for the number of
indirect jobs created. Generally indirect job development related to mining exceeds direct
employment (World Bank, 2002).
Economic growth already achieved due to mining in South Africa is best understood by
considering the size and overall vibrancy of the Gauteng region which is the largest inland
hub in the world built on the foundations of the mining industry.
The South African mining sector accounted for about 20% of private sector investment and
12.3% of total investment in 2011. Furthermore it made up some 29% of the allshare index
on the JSE (which itself has its roots in the mining sector). Since South Africa has had a
healthy growth of secondary and tertiary industry - largely based on mining - the overall
relative contribution to the GDP has contracted over the past two decades to 8.8% in 2011,
although it is close to 18% if services and associated industries are included (COM, 2012).
Total primary mineral exports accounted for 38% of South Africa’s total merchandise exports
(COM, 2012). If secondary beneficiated minerals are added then the minerals complex
accounted for about 50% of South Africa’s total merchandise exports (COM 2011).
Although much more can and should be done it is important to note that South Africa does
beneficiate a good deal of its mining output. A good example is the cement industry which
supplies more than 95% of local demand from locally mined limestone, gypsum and coal. In
the same way the steel industry which supplies about 80% of local demand from locally
mined iron, manganese, chromite, coal and coke, albeit at prices that could see
improvement. The furnaces involved in the steel making process are 95% powered by
electricity from coal fired power stations using locally mined coal. More than 30% of South
Africa’s liquid fuel requirements are produced from locally mined coal and more than 95% of
electricity is generated in coal fired power plants using locally mined coal. Furthermore, the
majority of domestic chemicals, fertilisers, waxes, polymers and plastics are fabricated using
locally mined mineral commodities and 13% of the world’s platinum catalytic converters are
produced locally (COM, 2012). In the case of gold and silver, South Africa has capacity to
produce pure gold and silver products both from local and imported concentrates. However,
although the COM estimated that, in 2010, some R200 b of value was added to South
African mineral products (COM, 2011), there is no doubt that there is still significant loss of
value by exporting mineral commodities too high up the value chain.
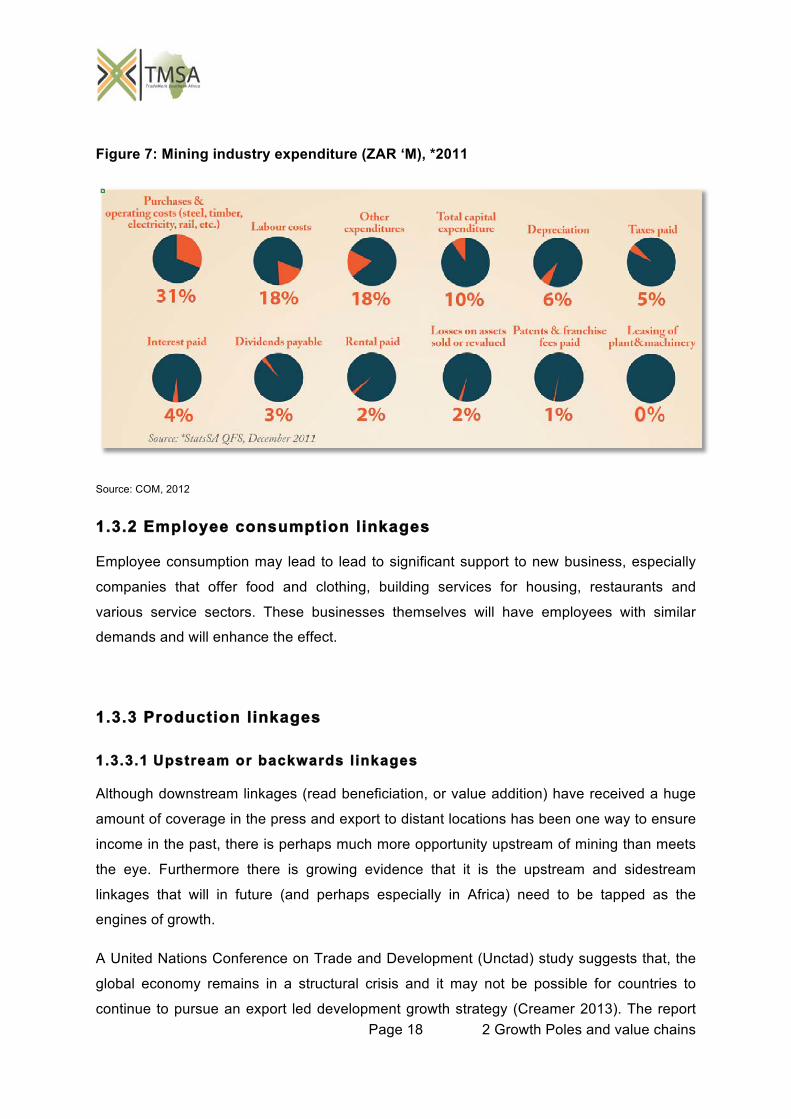
The value of mining in building an industrial society with backwards and horizontal linkages
as well as direct fiscal linkages is clarified in Figure 7.
Page 17 2 Growth Poles and value chains
1.3 Linkages
In each of the top chosen growth poles there will be a discussion of any particular linkage
opportunities that exist for the growth pole itself and which need directed attention. However
many linkages are generic to mining and these will not be generally repeated, rather they are
mentioned here as an overview of the type of linkage to consider. In the second stage of the
greater project specific project linkages should be unravelled in much more detail.
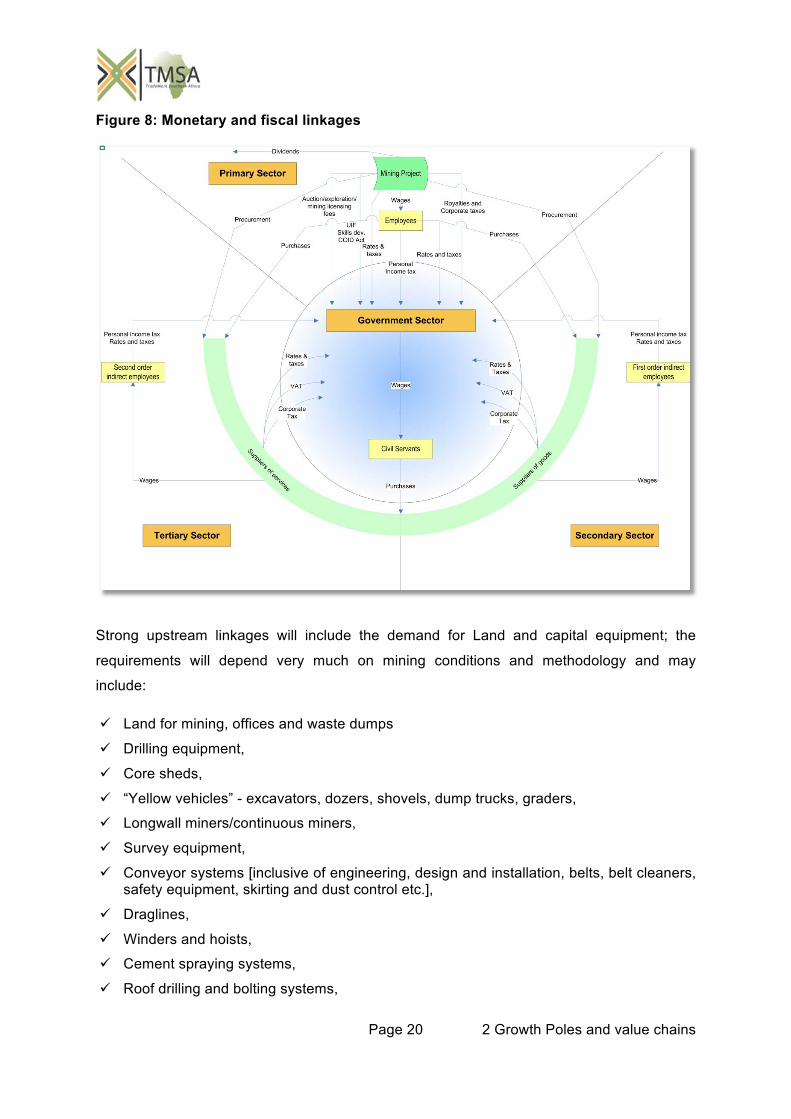
1.3.1 Monetary and Fiscal linkages
Exploration licence fees, mining licence fees, royalties, taxes on profits of companies, taxes
and on wages and salaries of mining company employees, VAT on employee purchases,
taxes on company profits and employees of linked business.
The monetary and fiscal linkages will vary somewhat from country to country dependent on the local taxation systems. An overview of possible linkages is shown in Figure 8.
Page 18 2 Growth Poles and value chains
Figure 7: Mining industry expenditure (ZAR ‘M), *2011
Source: COM, 2012
1.3.2 Employee consumption linkages
Employee consumption may lead to lead to significant support to new business, especially
companies that offer food and clothing, building services for housing, restaurants and
various service sectors. These businesses themselves will have employees with similar
demands and will enhance the effect.
1.3.3 Production linkages
1.3.3.1 Upstream or backwards linkages
Although downstream linkages (read beneficiation, or value addition) have received a huge
amount of coverage in the press and export to distant locations has been one way to ensure
income in the past, there is perhaps much more opportunity upstream of mining than meets
the eye. Furthermore there is growing evidence that it is the upstream and sidestream
linkages that will in future (and perhaps especially in Africa) need to be tapped as the
engines of growth.
A United Nations Conference on Trade and Development (Unctad) study suggests that, the
global economy remains in a structural crisis and it may not be possible for countries to
continue to pursue an export led development growth strategy (Creamer 2013). The report

Page 19 2 Growth Poles and value chains
argues that export led strategies are no longer viable. Instead a strategy, geared towards
generating a greater role for domestic and regional demand, should be pursued.
It is therefore essential to plan regional trade but especially to ensure that the upstream and
sidestream linkages related to the Tripartite’s comparative strength in mineral commodities is
captured wherever possible within the region. The increased regional wealth that will result
from a lower leakage into world markets will also increase the regional buying power and
thus improve the odds of growth led by trade within the region.
Page 20 2 Growth Poles and value chains
Figure 8: Monetary and fiscal linkages
Strong upstream linkages will include the demand for Land and capital equipment; the
requirements will depend very much on mining conditions and methodology and may
include:
Land for mining, offices and waste dumps
Drilling equipment,
Core sheds,
“Yellow vehicles” - excavators, dozers, shovels, dump trucks, graders,
Longwall miners/continuous miners,
Survey equipment,
Conveyor systems [inclusive of engineering, design and installation, belts, belt cleaners, safety equipment, skirting and dust control etc.],
Draglines,
Winders and hoists,
Cement spraying systems,
Roof drilling and bolting systems,
Page 21 2 Growth Poles and value chains
Refrigeration and ventilation systems,
Compressors,
Fans,
Explosive drilling and packing systems,
Backfill technology and equipment,
Communication systems,
Personnel transport [underground and surface],
Pulleys,
Pumps,
Battery packs and lighting systems for personnel,
Loading equipment,
Cranes,
Comminution and screening systems,
Tanks,
Piping,
Mine scheduling software,
Hydraulic valves,
Stockyard handling systems and equipment,
Tailings dam systems and equipment,
Rail siding equipment,
Railway coaches,
Laboratory analysis equipment,
Automated scanners (to monitor production quality),
Scales ,
Employee time management systems (clocking-in devices).
Mining is also an important purchaser of consumables such as:
Cables,
Cement,
Clay bricks (building),
Copper wire,
Electricity,
Explosives,
Fuel (mainly diesel),
First aid and emergency supplies and equipment,
Page 22 2 Growth Poles and value chains
Miners clothing and safety equipment supply, gloves, safety shoes, hard hats, reflective gear, earplugs, safety goggles etc.),
Oxygen,
Refractory Bricks (furnaces),
Roof supports and roof bolts,
Tyres,
Steel (various forms),
Vehicle spares,
Water.
1.3.3.2 Downstream or forwards linkages
Downstream linkages will depend mainly on the particular mineral commodities being
developed. See section 2.7 Value Chains as well the Appendices for a generic view of the
downstream linkages.
1.3.3.3 Sidestream or horizontal l inkages
Sidestream and horizontal linkages are likely to be reasonably specific for each growth pole
even at this concept level. In general these linkages will include rail, roads, ports, electrical
and water supply networks, information and communications technology (ICT) networks. A
strong banking sector and international trade sector will develop to directly serve the mining
companies; these will be available for the wider community. Hospitals and clinics may be
directly built by the mining sector or developed to serve them and these are likely to be
available to the wider community. This is also true of good schools and even possibly
technical colleges and universities, which although primarily developed to serve the families
of miners will be available for widespread use.
Besides being a major employer, the mining sector is also an important user of contracted
expertise in the services sector. Many of these services can be used across different
business types and therefore are seen as sidestream linkages. This may include services
such as:
Administrative services,
Builders,
Computer engineers, computer programmers, data typists,
Electricians and electrical engineers,
Environmental services,
Geological consultants,
Page 23 2 Growth Poles and value chains
Human resources consultants,
Insurance experts,
Laundry and repair services,
Lawyers,
Logistics systems and services,
Mechanical engineers, mechanics,
Plumbers,
Refrigeration engineers and artisans,
Security services.
1.4 Basis for the focus areas
The focus areas considered in this project relate to hydrocarbons (coal, oil and gas), ferrous
metals (iron, chrome, nickel and vanadium) and base metals (copper, lead and zinc) as well
as phosphates.
Hydrocarbons will still in the foreseeable future supply the majority of energy in the tripartite
and are known to have excellent backwards and forwards linkages if linked to industrial
development. Likely world demand for the raw materials from the east is also projected to
remain strong for many years to come from China and especially from India.
Ferrous metals make the backbone of any economy with iron being the most important metal
traded in the world today. Rapid development of the tripartite will require large quantities of
steel and the benefits of producing the steel locally are huge. Furthermore, the tripartite has
all the required raw materials for basic steel and stainless steel manufacture as well as the
manufacture of a host of special grades of stainless steel.
Base metals and in particular copper are also highly in demand in countries moving strongly
up the development curve since it is used in water and electrical installations in housing
developments. Again the demand in the east is strong, and in the case of copper this is
particularly the case in China and Japan.
Iron ore and coal in particular are high bulk materials and where these are to be exported
they will demand a considerable infrastructure build. The feedback loop of this infrastructural
development will greatly increase the demand for the chosen minerals commodities.
Phosphates may seem to be outside of the general grouping, but due to the expected rapid
growth of the African population the requirement for food and hence fertilisers in the future
will be considerable. Since the hydrocarbons can be used to develop ammonia and related

Page 24 2 Growth Poles and value chains
nitrogenous fertilisers the consideration of phosphates, in which Africa is particularly rich and
which forms an essential part of complete fertilisers becomes straightforward.
Page 25 2 Growth Poles and value chains
2 METHODOLOGY
2.1 Screening and clustering to define growth poles around mineral potential
In order to identify those deposits most likely to display economic potential, the most up to
date mineral deposit data that could be accessed was captured into a database and
subjected to an iterative screening process. This entailed searching for deposits in which
there has been some interest by companies in the literature and on the internet as well as
following up leads based on older databases that are available from various sources, prior
knowledge as well as personal communication with contacts in the field. In this process,
deposits were ranked by major commodity, deposit size and deposit status. The purpose of
the screening was to select deposits that could act as growth centres for the growth poles
and which are significant enough in themselves or together with others in the area to act as
growth poles. From these would then be chosen three projects to study at a more detailed
level in a second phase of the greater project.
2.2 Initial screening
In putting the database together there was an attempt to consider mainly those projects
where there is current private sector attention. This is not always a straightforward process,
since it is common practice to put projects “on hold”, especially in difficult economic times
such as we are currently experiencing. As a result projects in which the private sector has
lost interest or those which have not yet attracted real investment may also be included, but
certainly the majority of deposits in the database are currently producing mines or being
pursued by companies or have been actively pursued within the last five years. As a basis
for the synthesis and ranking of the mineral occurrences and deposits in the compiled
database, the following decisions were made:
Due to the size and time frame allowed for this project in certain cases areas of
mineralisation where recorded in the database rather than individual “deposits”. This is
especially true of the hydrocarbons, which are, to some extent, continuous over large
areas. However where only a few economic zones were known in such areas at this
stage the individual deposits were recorded, especially where information could be
gleaned on the project. This is also true where, for example, coal is known to be
Page 26 2 Growth Poles and value chains
preserved in localized graben structures rather than being widespread over an entire
coalfield.
Although the majority of the projects that made it onto the database are large, once on
the database projects of any size would be considered provided they had the promise of
being turned to account, as a part of a cluster of developments.
In the second stage of the growth pole study the greater project areas chosen as growth
pole possibilities should be scoured for other mineral opportunities which although
perhaps smaller or further from development will make a significant contribution to the
industrial development of the area.
The purpose of the exercise was not to generate high-risk exploration targets but to
identify prospects that are already being developed or have a good chance of being
developed within a relatively short space of time. Consequently, prospects for which
there were very little exploration information and did not hold much promise were given
a low ranking.
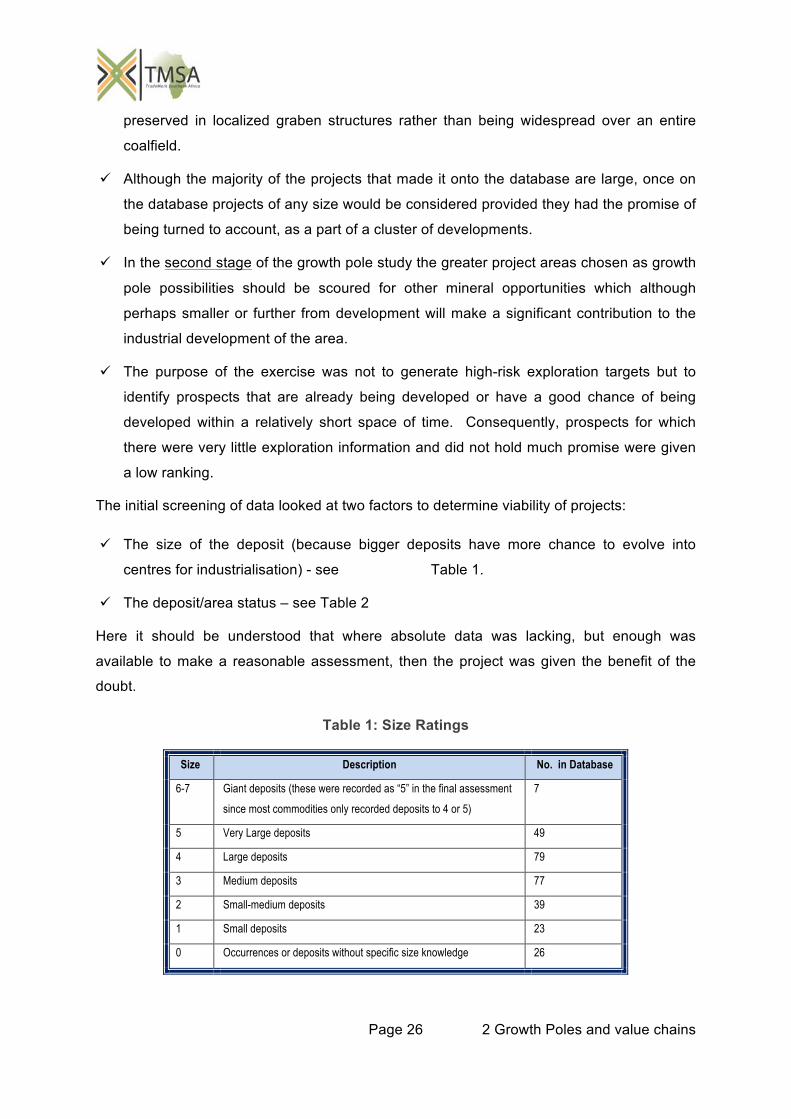
The initial screening of data looked at two factors to determine viability of projects:
The size of the deposit (because bigger deposits have more chance to evolve into
centres for industrialisation) - see Table 1.
The deposit/area status – see Table 2
Here it should be understood that where absolute data was lacking, but enough was
available to make a reasonable assessment, then the project was given the benefit of the
doubt.
Table 1: Size Ratings
Size Description No. in Database
6-7 Giant deposits (these were recorded as “5” in the final assessment
since most commodities only recorded deposits to 4 or 5)
7
5 Very Large deposits 49
4 Large deposits 79
3 Medium deposits 77
2 Small-medium deposits 39
1 Small deposits 23
0 Occurrences or deposits without specific size knowledge 26
Page 27 2 Growth Poles and value chains
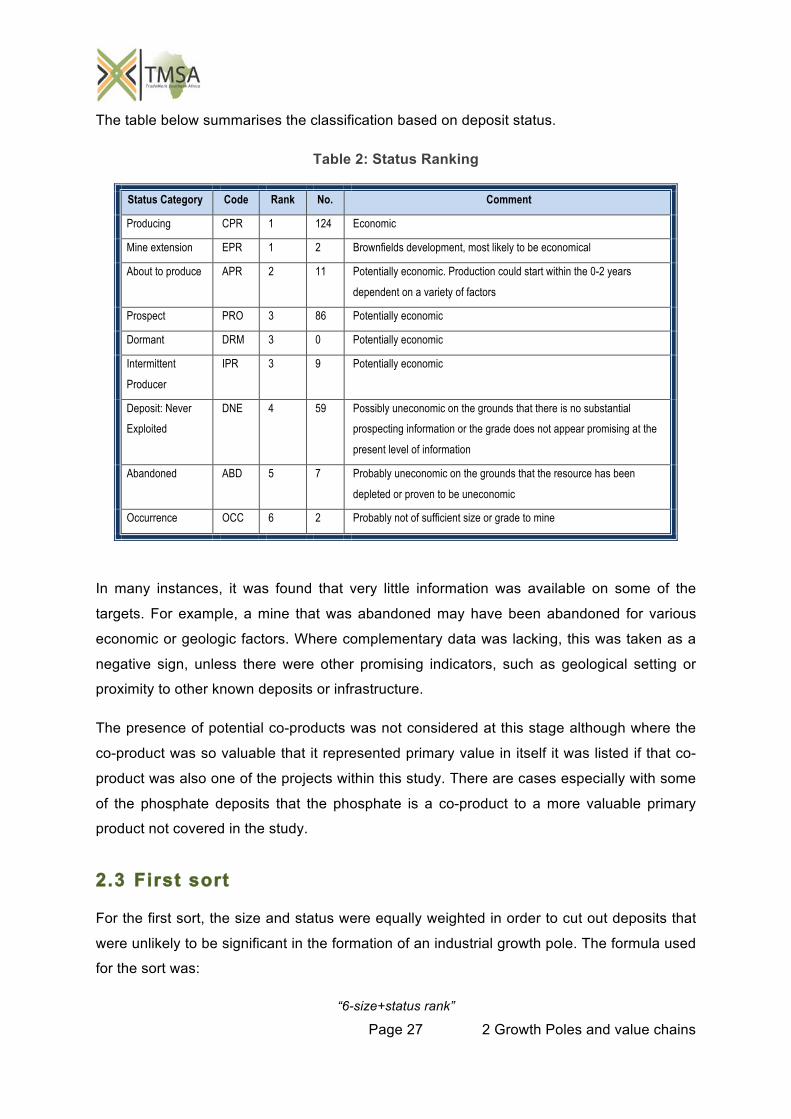
The table below summarises the classification based on deposit status.
Table 2: Status Ranking
Status Category Code Rank No. Comment
Producing CPR 1 124 Economic
Mine extension EPR 1 2 Brownfields development, most likely to be economical
About to produce APR 2 11 Potentially economic. Production could start within the 0-2 years
dependent on a variety of factors
Prospect PRO 3 86 Potentially economic
Dormant DRM 3 0 Potentially economic
Intermittent
Producer
IPR 3 9 Potentially economic
Deposit: Never
Exploited
DNE 4 59 Possibly uneconomic on the grounds that there is no substantial
prospecting information or the grade does not appear promising at the
present level of information
Abandoned ABD 5 7 Probably uneconomic on the grounds that the resource has been
depleted or proven to be uneconomic
Occurrence OCC 6 2 Probably not of sufficient size or grade to mine
In many instances, it was found that very little information was available on some of the
targets. For example, a mine that was abandoned may have been abandoned for various
economic or geologic factors. Where complementary data was lacking, this was taken as a
negative sign, unless there were other promising indicators, such as geological setting or
proximity to other known deposits or infrastructure.
The presence of potential co-products was not considered at this stage although where the
co-product was so valuable that it represented primary value in itself it was listed if that co-
product was also one of the projects within this study. There are cases especially with some
of the phosphate deposits that the phosphate is a co-product to a more valuable primary
product not covered in the study.
2.3 First sort
For the first sort, the size and status were equally weighted in order to cut out deposits that
were unlikely to be significant in the formation of an industrial growth pole. The formula used
for the sort was:
“6-size+status rank”
Page 28 2 Growth Poles and value chains
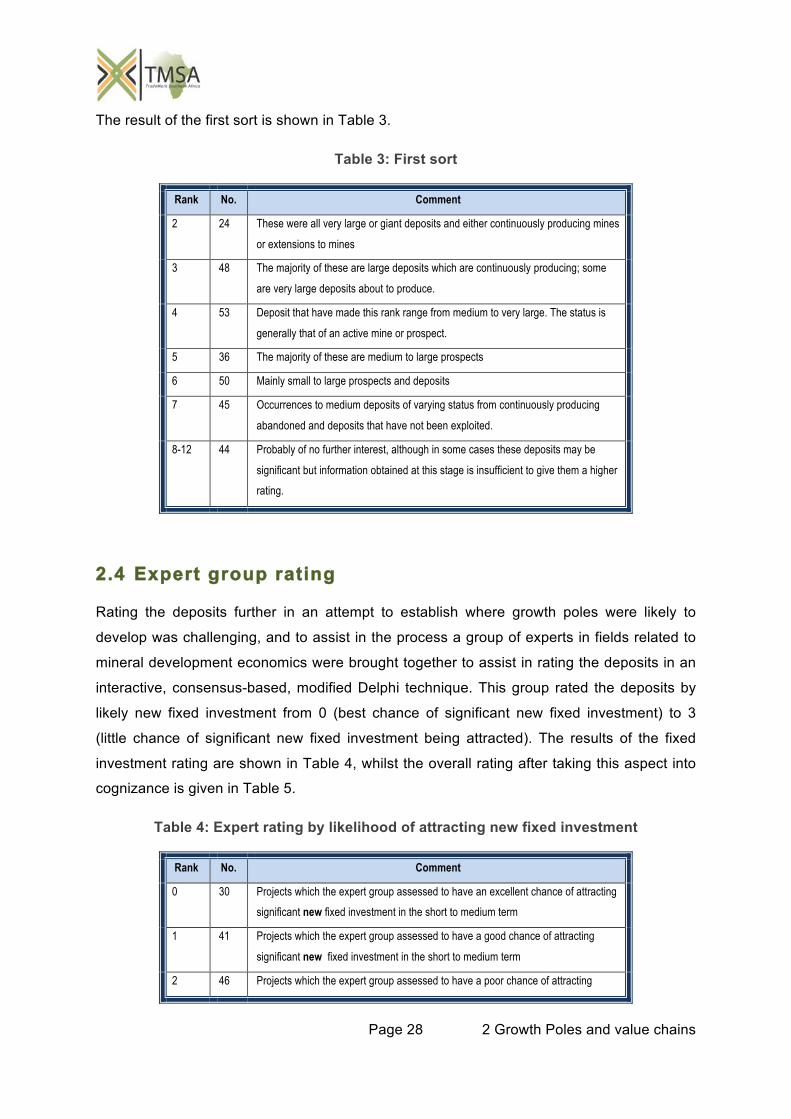
The result of the first sort is shown in Table 3.
Table 3: First sort
Rank No. Comment
2 24 These were all very large or giant deposits and either continuously producing mines
or extensions to mines
3 48 The majority of these are large deposits which are continuously producing; some
are very large deposits about to produce.
4 53 Deposit that have made this rank range from medium to very large. The status is
generally that of an active mine or prospect.
5 36 The majority of these are medium to large prospects
6 50 Mainly small to large prospects and deposits
7 45 Occurrences to medium deposits of varying status from continuously producing
abandoned and deposits that have not been exploited.
8-12 44 Probably of no further interest, although in some cases these deposits may be
significant but information obtained at this stage is insufficient to give them a higher
rating.
2.4 Expert group rating
Rating the deposits further in an attempt to establish where growth poles were likely to
develop was challenging, and to assist in the process a group of experts in fields related to
mineral development economics were brought together to assist in rating the deposits in an
interactive, consensus-based, modified Delphi technique. This group rated the deposits by
likely new fixed investment from 0 (best chance of significant new fixed investment) to 3
(little chance of significant new fixed investment being attracted). The results of the fixed
investment rating are shown in Table 4, whilst the overall rating after taking this aspect into
cognizance is given in Table 5.
Table 4: Expert rating by likelihood of attracting new fixed investment
Rank No. Comment
0 30 Projects which the expert group assessed to have an excellent chance of attracting
significant new fixed investment in the short to medium term
1 41 Projects which the expert group assessed to have a good chance of attracting
significant new fixed investment in the short to medium term
2 46 Projects which the expert group assessed to have a poor chance of attracting
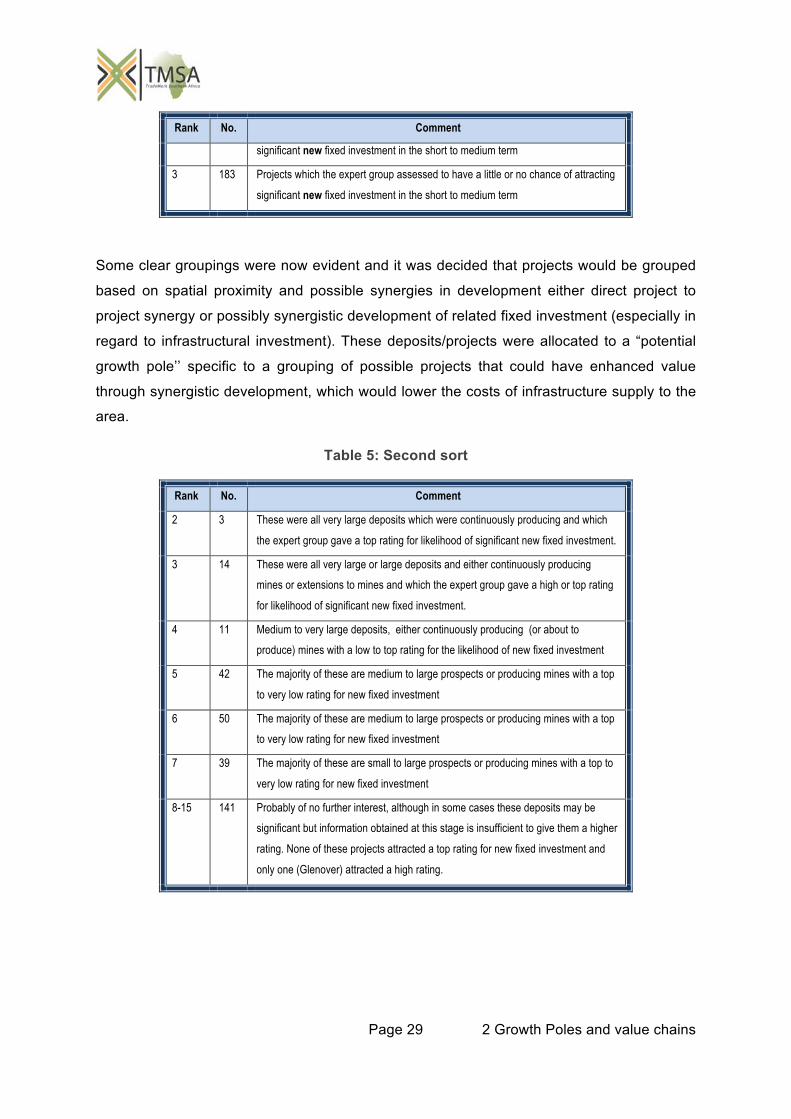
Page 29 2 Growth Poles and value chains
Rank No. Comment
significant new fixed investment in the short to medium term
3 183 Projects which the expert group assessed to have a little or no chance of attracting
significant new fixed investment in the short to medium term
Some clear groupings were now evident and it was decided that projects would be grouped
based on spatial proximity and possible synergies in development either direct project to
project synergy or possibly synergistic development of related fixed investment (especially in
regard to infrastructural investment). These deposits/projects were allocated to a “potential
growth pole’’ specific to a grouping of possible projects that could have enhanced value
through synergistic development, which would lower the costs of infrastructure supply to the
area.
Table 5: Second sort
Rank No. Comment
2 3 These were all very large deposits which were continuously producing and which
the expert group gave a top rating for likelihood of significant new fixed investment.
3 14 These were all very large or large deposits and either continuously producing
mines or extensions to mines and which the expert group gave a high or top rating
for likelihood of significant new fixed investment.
4 11 Medium to very large deposits, either continuously producing (or about to
produce) mines with a low to top rating for the likelihood of new fixed investment
5 42 The majority of these are medium to large prospects or producing mines with a top
to very low rating for new fixed investment
6 50 The majority of these are medium to large prospects or producing mines with a top
to very low rating for new fixed investment
7 39 The majority of these are small to large prospects or producing mines with a top to
very low rating for new fixed investment
8-15 141 Probably of no further interest, although in some cases these deposits may be
significant but information obtained at this stage is insufficient to give them a higher
rating. None of these projects attracted a top rating for new fixed investment and
only one (Glenover) attracted a high rating.
Page 30 2 Growth Poles and value chains
Before grouping the database was sorted by the second sort total, then by the fixed
investment likelihood, followed by deposit size, deposit status and finally deposit name so
that a set position could be recorded at this point for each project. The deposits were then
grouped by relationship to the highest ranked projects.
Top groupings based on ratings are:
1. Moatize Coal received the overall top position and the Tete coal and iron projects were
grouped with it to make up a grouping of 14 projects.
2. The Rovuma Basin Gas came up in second place overall and grouped with it were the
Mamba complex as well as the four Mtwara gas deposits for a total of 6 projects.
3. The Lephalale (Waterberg) Coalfield at position three was grouped together with cross
border deposits in Botswana as well as with a phosphate deposit and iron deposits to
the south, for a grouping of 9 projects.
4. The Kabanga nickel deposit was positioned in the fourth place and was grouped with
the Musungati project as the most likely deposit in Burundi to begin within the medium
term 4 projects (due to both having nickel and copper of note).
5. The Zimbabwe Ripple Creek and Buchwa iron deposits were ranked in positions 10
and 19 and although they occur quite far apart and also at some distance from the
Zimbabwean coal deposits, they are grouped together as a possible growth pole
including two major coal deposits nearest to Ripple Creek, for a total of 4 Projects
6. Copperbelt deposits in the Kamoto area achieved 11th place and were grouped
together with all DRC and Zambian Copperbelt deposits as well as manganese and one
coal deposit for a total of 19 projects.
7. The Morupule Coal deposit in Botswana was ranked in 16th position overall. North-
Central Botswana coal was grouped together with copper, nickel and CBM for a total of
17 projects.
8. The Boseto copper mine in northwest province in Botswana was ranked at number 21
and it was grouped with three other project to form a possibly weak pole of short term
activity but one with a promising future (4 projects)
9. Block 0 Cabinda Oilfield was ranked 25th and grouped with it is a set of very
prospective phosphate deposits in Cabinda and the DRC as well as the rest of the
oilfield for a total of 15 projects.
Page 31 2 Growth Poles and value chains
10. The Northern Cape (South Africa) iron field was placed next with the Khumani and
Sishen deposits being ranked at 26 and 27. Added to this group were further iron
deposits and the Northern Cape Manganese projects for a total group of 16 Projects.
11. The Songo Songo gas field was ranked 21 and was grouped with the Mkuranga and
Kiliwani gas for a total of 3 projects
These 11 groupings accounted for the 50 top ranked projects and a total of 119 of the
projects recorded on the database. Although it was clear that the most important possible
project groupings were contained in the top groupings given above, all groupings with a
prime deposit in the second-sort having a rating of 1-5 are listed, these include:
12. Southern Tanzania phosphate (Panda hill ranked 51) grouped with coal and iron for 9 projects.
13. South Sudan and Sudan oil (9 projects).
14. Palabora magnetite (ranked 60) together with phosphate, copper and vanadium (4 projects).
15. Ambatovy Nickel in Madagascar (ranked 61), together with iron and chromium (4 projects).
This list now covers the top 61 projects and a total of 138 of the projects included in the
database. Other projects included but not selected in the top deposits may well still be major
industrial opportunities in the future, but based on the knowledge levels at this point there is
little likelihood of these developing in the near to medium term.
2.5 Infrastructure component
A final criterion was used to assist in ranking the groups. This was the relative availability
within the near to medium term of the infrastructure that would be required for mining, and
either beneficiation, or export. The rating given was: 0 (excellent chance of sufficient
infrastructure to be in place within 5 years); 1 (good chance of sufficient infrastructure to be
in place within 5 years); 2 good chance of sufficient infrastructure to be in place within 5-10
years; 3 (little chance of sufficient infrastructure to be in place within 5-10 years). This
tended to give coastal localities a decided advantage over deep inland localities, largely
because many of the proposed railways have not yet been shown to be commercially viable,
and may (like the Mozambiquan situation) suffer from the situation that the motivation to
build the rail may only be there once mining is underway, but mining is unlikely to begin
without the rail being in place.
Page 32 2 Growth Poles and value chains
The methodology was one in which the author applied knowledge gleaned from various
sources on the internet as well as documents such as the SADC regional infrastructure
master plan (SADC, 2012) and personal knowledge gained from discussions with peers to
form a “Best Guess” approach. Foretelling the future is always a difficult process which is
guaranteed to be at least partially incorrect, but this approach has worked well in the past
and has shown a considerable degree of success. A short discussion of some of the thinking
is given below.
Where there is an urgent regional need for rail/road development, it is seen as more likely to
be accomplished in the short term. In some cases the planning of required infrastructure is
already underway or at an advanced stage of planning. Thus highest (0) or high (1) rankings
would be accorded to:
Tete for the rail to Nacala in support of the Sena rail – and the Nacala port upgrade.
Although this appears at first to be directed only at export, it is critical to the coal mining
operations to export either coking coal or preferably coke (from the point of view of
industrialising Mozambique) in order to allow for the mines to be profitable. The rest of
the coal mined should be seen as an opportunity for local industrialisation, electricity
generation and a stepping stone to a petrochemicals industry and steel and fertiliser
production. SADC (2012) gives the tonnage available for export as 10 Mtpa on the Sena
rail and 20 Mtpa on the still-to-be-built Nacala rail. It also points out that the Moatize-‐
Nacala rail is likely to be built in the near future. Vale appointed Worley Parsons’ to
project manage the Nacala rail construction. The rail could be ready within 18 months.
The Rovuma Basin, Mamba complex and Mtwara gas: Andarko is currently tying up
offtake agreements for Rovuma basin LNG. It has already completed 90% of offshore
feed work and 60% of onshore work (Sheldrick, 2013). First LNG export is scheduled for
2018 in a project set to cost between $25 and $30b by completion (arcticgas, 2013). In a
separate development a feasibility study is being undertaken for a 2 600 km ($5 b)
natural gas pipeline (see Figure 9) to link northern Mozambique discoveries southern
Mozambique and possibly northern Natal. If approved construction will begin in 2016 for
delivery in 2018. A 100 MW gas-fired power station at Ressano Garcia, which is
scheduled for commissioning in 2015 will provide local and export power. The industrial
park at Palma is already under construction with the first warehouse due for completion
in November 2013.
Waterberg/Botswana coal: SADC (2012) indicates that the line from Lephalale to
Botswana will “eventually” be built, but it is nevertheless on the short to medium term
Page 33 2 Growth Poles and value chains
listing. Transnet Freight Rail CEO, Siyabonga Gama, is on record as saying that a link
between the Waterberg coalfield and related Botswana coalfield would be built by 2020
(Creamer, M. 2013). Botswana has a tender out for a greenfield 300 MW coal-fired
power station to deliver power as soon as possible to the National grid – the deadline for
submissions is November 2013.
Copperbelt: Rail and road transport out of Zambia needs significant improvement as
does electricity availability in order to promote further industrialisation of the area based
on the mineral commodity endowment. According to SADC (2012) the additional
tonnage from Zambia will be 400 ktpa and from the DRC also 400 ktpa. The publication
also has the Chingola – Solwezi – Lumwana line on its list of links likely to be built in the
short to medium term.
Northern Cape: The R2.3 b upgrade to the rail from the manganese fields (from
Hotazel) to Port Elizabeth (Ngqura port) has been approved as a first phase of a R27 b
rail and harbour programme (Creamer, T. 2013a), the IDC is working on growing a
development corridor from the northern Cape to Saldanha and the significant solar
energy projects (e.g. the Kathu 74 MW project) in the Northern Cape will require access
growth point.
Songo Songo: New infrastructure planned includes processing plants at Mtwara
(6 Mcmpd) and at Songo Songo (4 Mcmpd), Songo Songo-Mtwara pipeline 532 km 36’
diameter with a 22 Mcmpd capacity) (Msuya, 2013)
Cabinda oil/phosphate: The Company developing the phosphates (Minbos) has
announced that it will be going ahead with the Cacata project (production by late 2015),
but also that it is divesting from the DRC deposits (even though it had recently
announced that a small project at Kanzi would be operational by early 2015). Minbos
may consider investment into port facilities. The relationship of the phosphate to the
production of nitrogenous fertilisers from oil or possibly the Soyo gas project opens the
door to complete fertiliser production dependent on Potash sources.
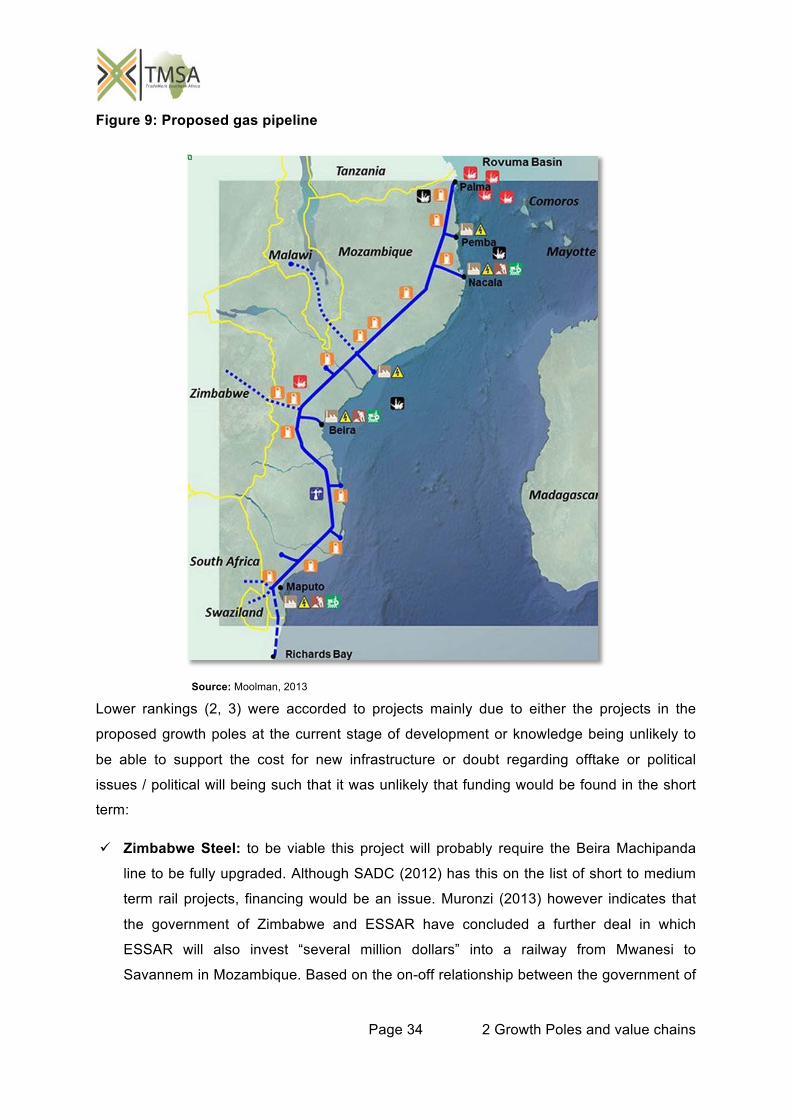
Page 34 2 Growth Poles and value chains
Figure 9: Proposed gas pipeline
Source: Moolman, 2013
Lower rankings (2, 3) were accorded to projects mainly due to either the projects in the
proposed growth poles at the current stage of development or knowledge being unlikely to
be able to support the cost for new infrastructure or doubt regarding offtake or political
issues / political will being such that it was unlikely that funding would be found in the short
term:
Zimbabwe Steel: to be viable this project will probably require the Beira Machipanda
line to be fully upgraded. Although SADC (2012) has this on the list of short to medium
term rail projects, financing would be an issue. Muronzi (2013) however indicates that
the government of Zimbabwe and ESSAR have concluded a further deal in which
ESSAR will also invest “several million dollars” into a railway from Mwanesi to
Savannem in Mozambique. Based on the on-off relationship between the government of
Page 35 2 Growth Poles and value chains
Zimbabwe and Essar over the past couple of years, it is difficult to foresee the path of
this project, however it does have huge industrial potential.
Kabanga / Musongati nickel: The Dar Es-Salam Isaka-Kigali/ Keza-Musongati railway,
which has been planned for some years is still in an early phase and a request for
expression of interest for advisory services closed in August 2013. It is considered
unlikely that the rail will be completed and operational within 5 years.
North / Central Botswana coal: The 600 MW Morepule B power station was due at the
end of 2012 but was delayed; it should be fully operational by October 2013. Botswana
issued a request for pre-qualification for a 300 MW brownfield independent power
project at Morepule A in July 2013. It is unlikely that Botswana will have sufficient offtake
of power to develop large scale power generation or cogeneration plants in the near
future. Offtake of coal to South Africa or for export from these coalfields may take more
than 10 years to reach significant proportions, since the southern coalfield is likely to be
first in line for export to South Africa.
Boseto Copper: It is unlikely that production of copper in the area could support rail,
even with new projects in the pipeline. However a Botswana-Namibia rail line could still
be seen as a possibility in the future if coal and possible iron mining opportunities are
taken into account.
Only growth poles where the top project had received a ranking of 4 or better in the second
sort were considered for the infrastructure ranking. In all of this it is essential that the reader
keeps in mind that the proposals are in regard to significant new industrial development –
not simply mine and export.
The top groups after applying this criterion are:
Top groupings and clear leaders based on all ratings are:
1. Tete coal, iron and phosphate (14 projects).
2. The Rovuma Basin, Mamba complex and Mtwara gas deposits (6 projects).
3. The Waterberg coal and cross border deposits in Botswana as well as with a phosphate
deposit and iron deposits to the south (9 projects).
4. Copperbelt deposits (19 projects).
Projects that also achieved a relatively high rating were:
1. Zimbabwe Iron and coal (4 Projects)
Page 36 2 Growth Poles and value chains
2. Northern Cape Iron and Manganese (16 Projects)
3. The Songo Songo and nearby gas fields for (3 projects).
4. Cabinda/Bas Congo oil and phosphate (15 projects).
5. The Kabanga / Musungati projects (4 projects).
2.6 Challenges
There were some significant challenges with the process. In some cases deposits or fields
are known to be large but specific data has not been found. These may then have been
accorded a low rating for size. Others through recent prospecting activity are known to be
uneconomic, but are nevertheless very large.
It is suggested that for the second stage of the greater project, further information is
gathered (where possible) for the chosen groupings and that the data is viewed especially in
regard to:
Mineral resource estimates
Economic and social impact of development
Infrastructure available or planned
Clustering potential
Sustainability
Marketability and strategic value of proposed products
2.7 Value Chains
Value chains in mining describe, often visually, the entire range of activities, inputs and
outputs required to bring a mineral commodity from the ground through various stages of
concentration and production to its end use, and even to possible discard and re-use. Ideally
connections to sidestream activities are also included.
Value chains are often tightly integrated and any change, inefficiency or breakdown in the
chain can have significant negative results throughout the value chain, in upstream,
downstream and even sidestream activities. Understanding the value chain can allow scope
for promoting the spreading of gains to low income producers through policy development as
described in Kaplinsky (undated) and Kaplinsky 2000. Certainly the lack of diversification
both upstream and downstream in value chains in Africa is a lost opportunity and one that
Page 37 2 Growth Poles and value chains
leads to an overdependence on the export of primary mineral ores and an increase in
inequality even in periods of growth as we have seen recently (Lopes, 2013).
The study of value chains has become a science in itself and various forms of value chain
can be described. Due to the scoping nature of the current exercise the level of description
will be largely that of simple market focussed value chains. Value chains can be seen from
various viewpoints (materials handling, business, society, policy, government, regulation,
rents, labour markets, etc.) and each may deliver a variation of the truth.
2.7.1 First step in developing value chains
Perhaps one of the most important points to make before beginning to look the value chains
related to this report is that the chain can be shown to continue long beyond the levels
actually given and that some aspects of the value chain take years – perhaps even decades
of planning to be able to be made best use of. For example the expertise that may be
needed (perhaps a metallurgist, geologist, chemist or skilled technologist or operator) can be
imported (usually at great cost) as a “quick fix” but this does not really add the level of value
to local society that is being sought. However, to train many engineers, scientists and
technologists is a process that really begins pre-school with the correct attitude towards
technical professions and goes on through junior and senior schooling where excellence in
teaching and learning especially in areas of science and mathematics is required – to tertiary
education where well-funded and equipped universities and technical colleges with excellent
teachers will be necessary. The process does not stop even there since excellence in the
fields of technology, science and engineering also requires expert mentoring in the
workplace in order for the young men and women coming through the education process to
learn practical on-the-job skills, and to develop the level of professionalism required for
success of the processes in which they are involved. Although this report speaks to the short
to medium term development of a growth pole it is imperative in Africa that there is urgent
attention paid to ensuring the great number of skilled personnel that will be required in the
future are trained now. Since education is a 15-20 year process it is the area of development
that should be getting immediate and intense attention of policy makers.
To clarify the size of the education problem, South Africa makes a good example of a failed
education system currently leading to huge labour and socioeconomic problems. Currently
37% of South Africans are without work, and yet economic growth is stifled because skilled
workers are not available! Some 47% of responding business leaders in the recent Grant
Thornton (2013) International Business Report pointed to the lack of skilled workers being
the key growth constraint in South Africa.
Page 38 2 Growth Poles and value chains
2.7.2 Policy Challenge
African countries find themselves in a position where they remain at the bottom of the value
chain and still need to find ways to move up according to Lionel October Director General of
the South African Department of Trade and Industry, speaking at the launch of the OECD
report titled ‘Perspectives on Global Development 2013: Industrial Policies in a Changing
World’, (Kolver, 2013). At the same conference Analisa Primi OECD senior economist said
that the role of the State in the economy was currently a topic of global conversation, and
that there are four main challenges that emerging countries want to address through
industrial policy (Kolver, 2013). It is the thesis of this author that there are more than four
challenges in the development of policy, and that the major challenges include:
1. Lack of skills (discussed above) which is also a factor in the difficulty currently being
experienced with labour demanding higher salaries but not providing greater productivity.
The skills problem is enhanced by government and business not being in agreement on
where the responsibility lies for specific levels of skills development. What needs to be
accepted is that government supplies excellent basic, secondary and tertiary education
and then business maintains first-rate programmes for skills development of staff to
enhance productivity.
2. Lack of innovation capability, and capacity to create new products and services to
compete effectively in global markets (to some extent related to 1 above)
a. To address this, developing countries must target specific technological and scientific
areas for development and attract more knowledge intensive FDI.
3. Lack of financing - although Analisa Primi indicated that development banks were
becoming more active (Kolver, 2013), this is not necessarily the case in all areas of
endeavour and certainly there is still a great need for more to be done.
4. Lack of infrastructure – this remains a major bottleneck to increasing competitiveness,
with about 60% of the world’s infrastructure located in high-income countries (Kolver,
2013).
5. Being open to hear new voices in the economy and to be careful not to let policies be
dominated only by established voices in the country’s economy (Kolver, 2013).
6. Lack of real communication between the private sector and government.
7. Resource nationalism focussing on the incorrect issues – looking at the benefit to be
attained from the resource as being from “developmental pricing” which is generally
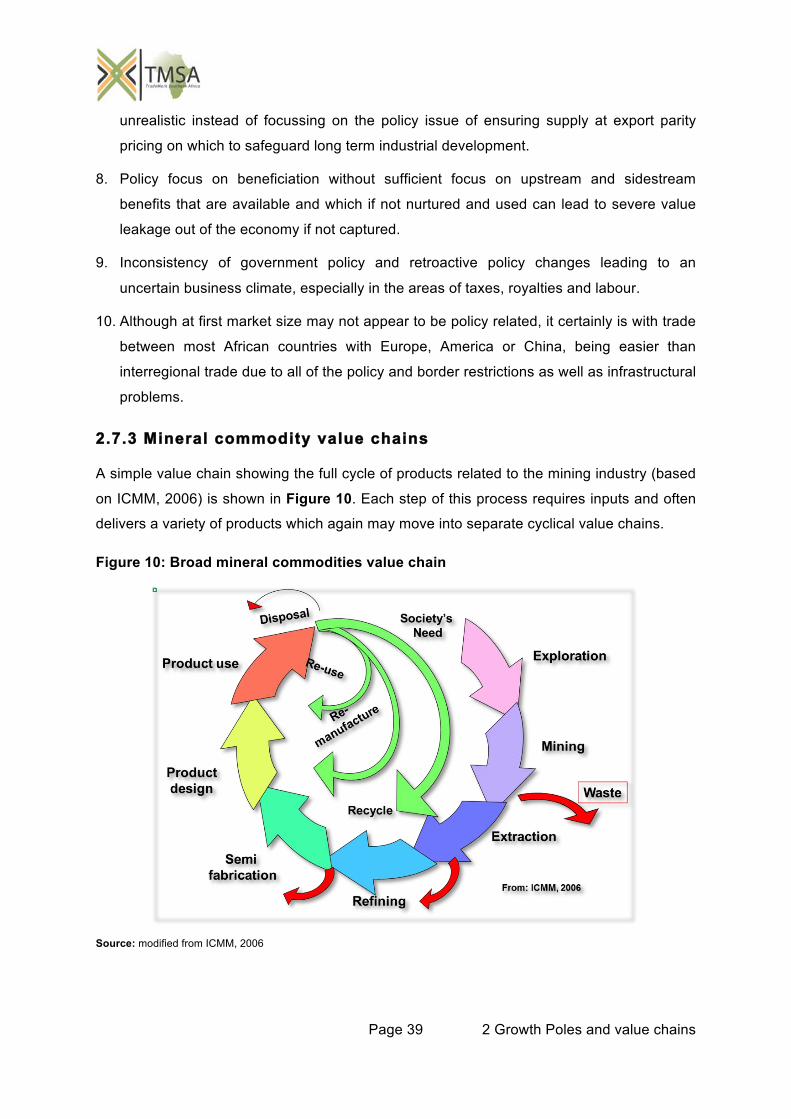
Page 39 2 Growth Poles and value chains
unrealistic instead of focussing on the policy issue of ensuring supply at export parity
pricing on which to safeguard long term industrial development.
8. Policy focus on beneficiation without sufficient focus on upstream and sidestream
benefits that are available and which if not nurtured and used can lead to severe value
leakage out of the economy if not captured.
9. Inconsistency of government policy and retroactive policy changes leading to an
uncertain business climate, especially in the areas of taxes, royalties and labour.
10. Although at first market size may not appear to be policy related, it certainly is with trade
between most African countries with Europe, America or China, being easier than
interregional trade due to all of the policy and border restrictions as well as infrastructural
problems.
2.7.3 Mineral commodity value chains
A simple value chain showing the full cycle of products related to the mining industry (based
on ICMM, 2006) is shown in Figure 10. Each step of this process requires inputs and often
delivers a variety of products which again may move into separate cyclical value chains.
Figure 10: Broad mineral commodities value chain
Source: modified from ICMM, 2006
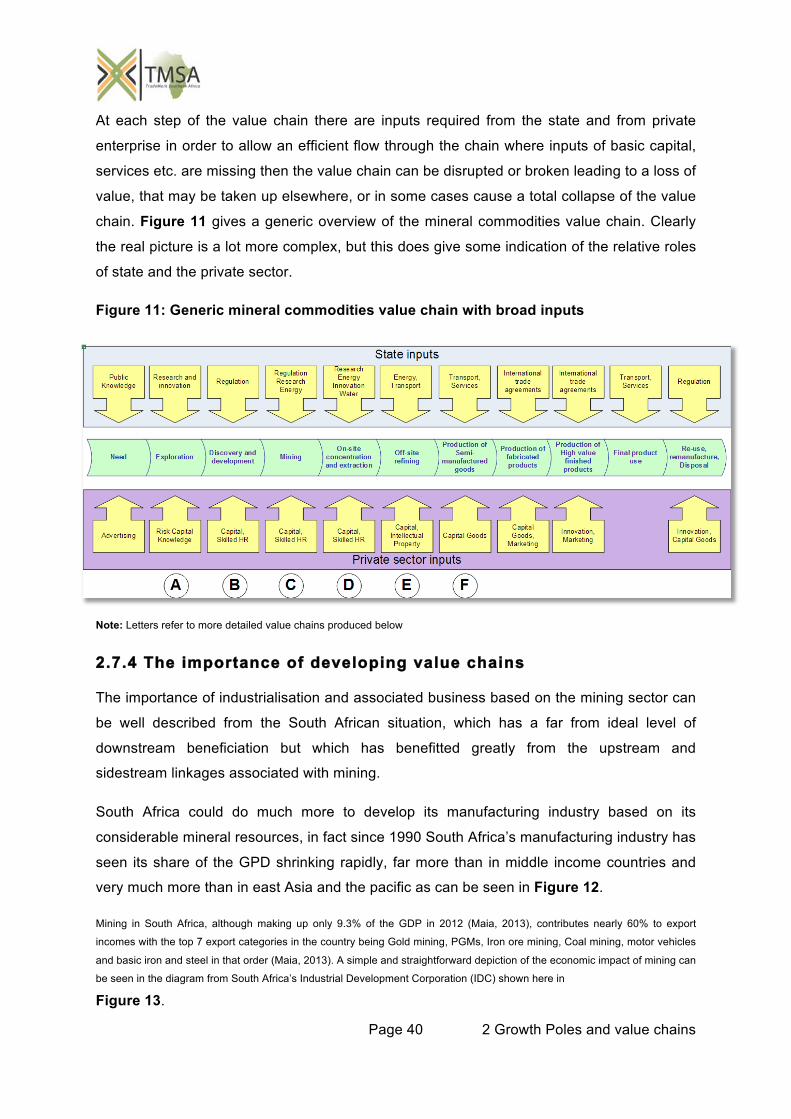
Page 40 2 Growth Poles and value chains
At each step of the value chain there are inputs required from the state and from private
enterprise in order to allow an efficient flow through the chain where inputs of basic capital,
services etc. are missing then the value chain can be disrupted or broken leading to a loss of
value, that may be taken up elsewhere, or in some cases cause a total collapse of the value
chain. Figure 11 gives a generic overview of the mineral commodities value chain. Clearly
the real picture is a lot more complex, but this does give some indication of the relative roles
of state and the private sector.
Figure 11: Generic mineral commodities value chain with broad inputs
Note: Letters refer to more detailed value chains produced below
2.7.4 The importance of developing value chains
The importance of industrialisation and associated business based on the mining sector can
be well described from the South African situation, which has a far from ideal level of
downstream beneficiation but which has benefitted greatly from the upstream and
sidestream linkages associated with mining.
South Africa could do much more to develop its manufacturing industry based on its
considerable mineral resources, in fact since 1990 South Africa’s manufacturing industry has
seen its share of the GPD shrinking rapidly, far more than in middle income countries and
very much more than in east Asia and the pacific as can be seen in Figure 12.
Mining in South Africa, although making up only 9.3% of the GDP in 2012 (Maia, 2013), contributes nearly 60% to export
incomes with the top 7 export categories in the country being Gold mining, PGMs, Iron ore mining, Coal mining, motor vehicles
and basic iron and steel in that order (Maia, 2013). A simple and straightforward depiction of the economic impact of mining can
be seen in the diagram from South Africa’s Industrial Development Corporation (IDC) shown here in
Figure 13.
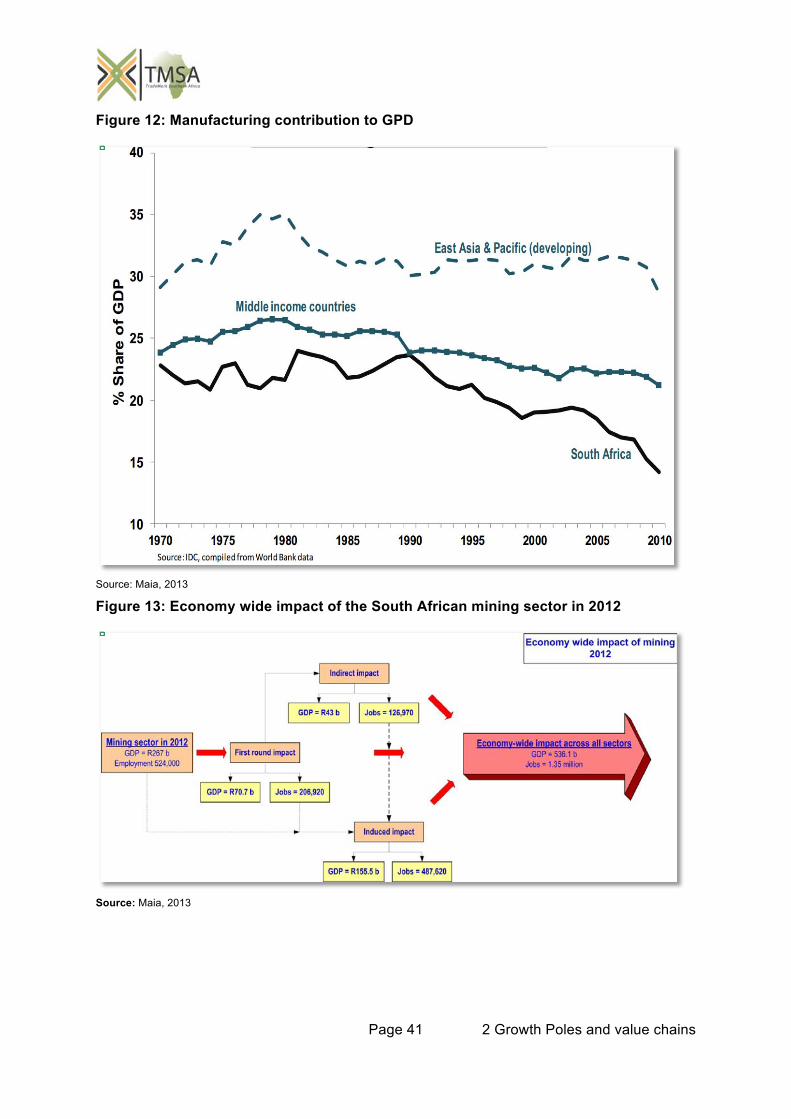
Page 41 2 Growth Poles and value chains
Figure 12: Manufacturing contribution to GPD
Source: Maia, 2013
Figure 13: Economy wide impact of the South African mining sector in 2012
Source: Maia, 2013
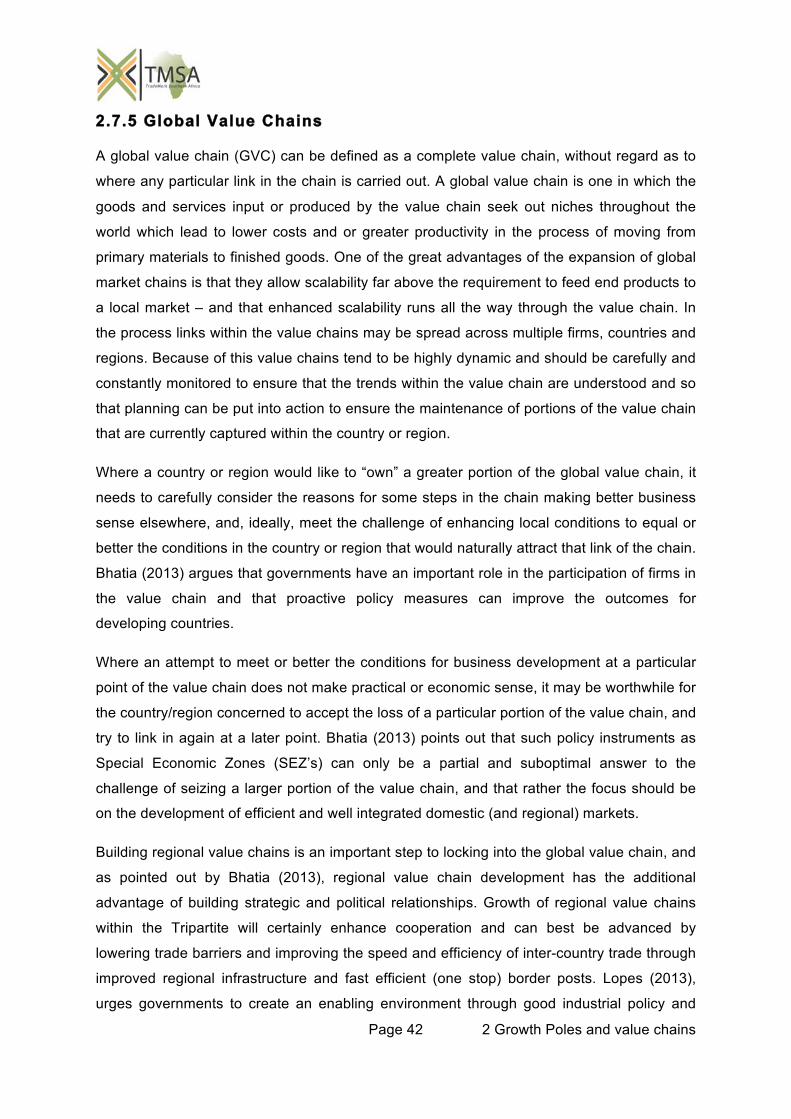
Page 42 2 Growth Poles and value chains
2.7.5 Global Value Chains
A global value chain (GVC) can be defined as a complete value chain, without regard as to
where any particular link in the chain is carried out. A global value chain is one in which the
goods and services input or produced by the value chain seek out niches throughout the
world which lead to lower costs and or greater productivity in the process of moving from
primary materials to finished goods. One of the great advantages of the expansion of global
market chains is that they allow scalability far above the requirement to feed end products to
a local market – and that enhanced scalability runs all the way through the value chain. In
the process links within the value chains may be spread across multiple firms, countries and
regions. Because of this value chains tend to be highly dynamic and should be carefully and
constantly monitored to ensure that the trends within the value chain are understood and so
that planning can be put into action to ensure the maintenance of portions of the value chain
that are currently captured within the country or region.
Where a country or region would like to “own” a greater portion of the global value chain, it
needs to carefully consider the reasons for some steps in the chain making better business
sense elsewhere, and, ideally, meet the challenge of enhancing local conditions to equal or
better the conditions in the country or region that would naturally attract that link of the chain.
Bhatia (2013) argues that governments have an important role in the participation of firms in
the value chain and that proactive policy measures can improve the outcomes for
developing countries.
Where an attempt to meet or better the conditions for business development at a particular
point of the value chain does not make practical or economic sense, it may be worthwhile for
the country/region concerned to accept the loss of a particular portion of the value chain, and
try to link in again at a later point. Bhatia (2013) points out that such policy instruments as
Special Economic Zones (SEZ’s) can only be a partial and suboptimal answer to the
challenge of seizing a larger portion of the value chain, and that rather the focus should be
on the development of efficient and well integrated domestic (and regional) markets.
Building regional value chains is an important step to locking into the global value chain, and
as pointed out by Bhatia (2013), regional value chain development has the additional
advantage of building strategic and political relationships. Growth of regional value chains
within the Tripartite will certainly enhance cooperation and can best be advanced by
lowering trade barriers and improving the speed and efficiency of inter-country trade through
improved regional infrastructure and fast efficient (one stop) border posts. Lopes (2013),
urges governments to create an enabling environment through good industrial policy and
Page 43 2 Growth Poles and value chains
especially through regulatory frameworks for tackling market failures. He provides an
example of the phosphate industry in Morrocco, which now produces a series of phosphate
based products inclusive of phosphoric acid and other products derived from it:
“The Office Chérifien des Phosphates has grown from several hundred people at its creation
and revenues of three million USD to revenues of 43.5 billion MAD (2010), and nearly 20,000
employees.”
2.7.5.1 Role of services in value chains
This section does not pretend to be anything more than a brief glimpse into the complex
area of the role of services in value chains. It has become quite clear to Letlapa that services
are to value chains what oil is to a machine. Services “lubricate” value chains and allow the
value add to happen where and when the services are available. The clear policy response
to this phenomenon in the tripartite should be to embrace it and to ensure that we can
compete favourably by ensuring enhanced education, and excellent infrastructure, and
making sure that there are minimal restrictions to hamper the free movement of trade and
services across borders within the tripartite so that the path to adding value through services
is smoothed. Bogdan (2013) makes the interesting point that:
“the focus of research is shifting from trade in goods to trade in tasks, through which value is
added along the production chain, by means of capital and labor mobilization, moving to the so-
called trade in value added”
In the context of this report it is important to understand that because of this phenomenon it
is difficult for a country to claim any type of comparative advantage when it does not have an
equal or better status in regards to the required capital and skills to ensure that, that
comparative advantage (no matter how great it appears to be) cannot be converted to a
clear competitive advantage by the application of the required capital and skills.
Referring to the work of De Backer (2013), Bogdan (2013) reproduced a diagram (see
Figure 14) which shows how service related aspects of the industrial value chain have
become more important relative to the production phase itself in recent years. Bogdan
concludes that the contribution of services to export totals is higher than that of
manufacturing in seven countries out of the ten emerging European countries analysed,
confirming results elsewhere in the literature.
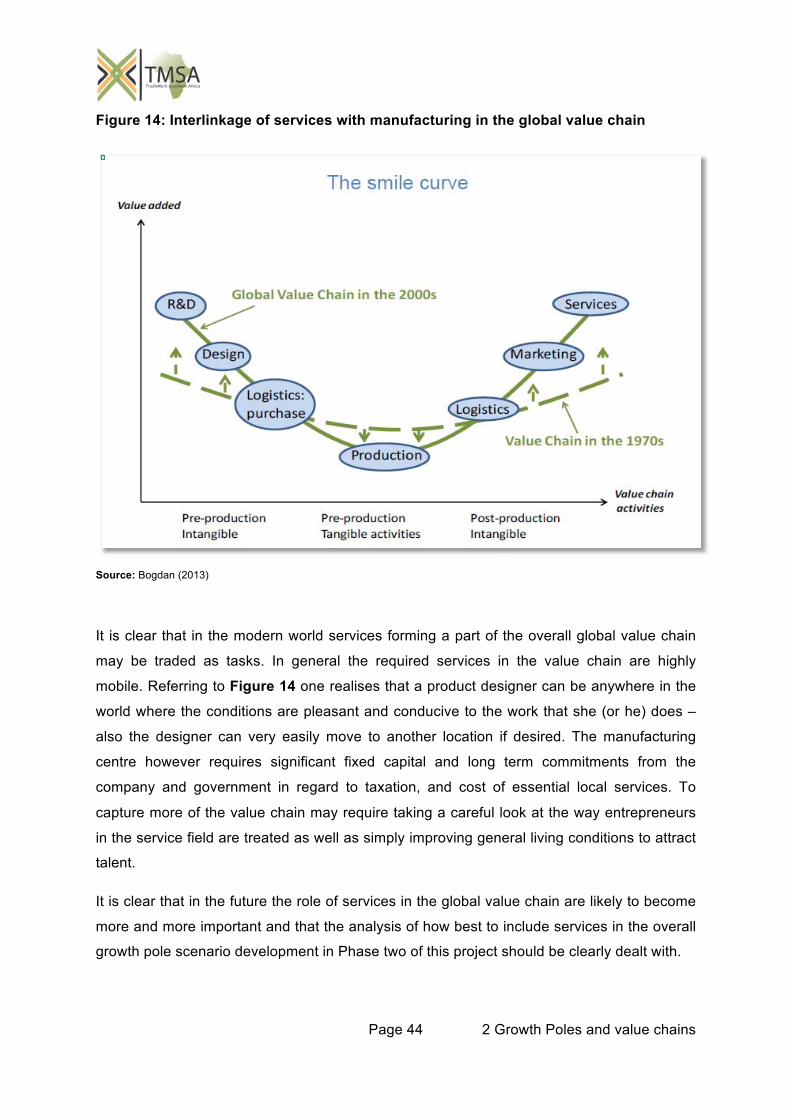
Page 44 2 Growth Poles and value chains
Figure 14: Interlinkage of services with manufacturing in the global value chain
Source: Bogdan (2013)
It is clear that in the modern world services forming a part of the overall global value chain
may be traded as tasks. In general the required services in the value chain are highly
mobile. Referring to Figure 14 one realises that a product designer can be anywhere in the
world where the conditions are pleasant and conducive to the work that she (or he) does –
also the designer can very easily move to another location if desired. The manufacturing
centre however requires significant fixed capital and long term commitments from the
company and government in regard to taxation, and cost of essential local services. To
capture more of the value chain may require taking a careful look at the way entrepreneurs
in the service field are treated as well as simply improving general living conditions to attract
talent.
It is clear that in the future the role of services in the global value chain are likely to become
more and more important and that the analysis of how best to include services in the overall
growth pole scenario development in Phase two of this project should be clearly dealt with.
Page 45 2 Growth Poles and value chains
2.8 The JICA report
The recently published JICA report is the culmination of a series of reports over four years of
studies by international specialists with the purpose to selecting likely infrastructure
development projects for future financial and technical assistance by JICA. The final study
was conducted over southern Africa by a team of 11 consultants over a period of 9 months
in a joint venture between PADECO Co., Ltd. and Nippon Koei Co.,Ltd., with the objectives
of:
Determining potential assistance required for the development of infrastructure (in the
transport, energy, and water sectors) along major economic corridors in Southern Africa,
and
Proposing financial and technical assistance to be provided by JICA for this purpose.
An interesting aspect of the Jica report is that several countries with iron ore that is less than
favourable were included as envisioned to develop iron ore mining and steel industries.
Although the team cannot be faulted in this being an ideal situation large scale steel
production in most Southern African countries would quickly lead to a situation of a steel glut
and this would most likely cause the failure of the businesses. An advantage of the growth
pole approach is that, assuming the project continues through phases 2 and 3, only one
growth pole (which may or may not include steel manufacture) will be seen as the most likely
growth pole to succeed. If this growth pole then gets the concerted efforts of development by
the tripartite countries and financiers it will soon be able to be in the position of supplying to
the entire area. Later other growth poles can get the same treatment leading to serial
development in which demand can be re-assessed at each point. This should allow much
greater certainty of success in the long run.
In the findings of the JICA study the only direct reference to mining in their “long list” reads
as follows:
“Technical assistance to meet global requirements for the mining industry to adopt clean and
efficient mining practices, e.g., use of “clean coal technology”, various mine security and
mine pollution control technologies, and smelting, refining and recycling technologies for the
metals industry available in Japan”
This is a very broad brush comment and covers many bases, but essentially is understood to
say that some Japanese technology especially in regard to “clean” mining practices may be
Page 46 2 Growth Poles and value chains
used in the region. Whilst this may be true it is unlikely to assist in meeting any of the
envisioned outcomes of the project. Perhaps more pertinent to those outcomes are the
objectives recorded for the related and downstream activities from mining where required
assistance included:
Human resource development (skills and knowledge to carry out productive activities
that lead to employment or entrepreneurship
“pre-service” training for middle-level technicians
Training to improve business and management skills
value-chain management, quality control, marketing, financial management, and
staff training.
These point to the greatest problem that Southern Africa has, in a lack of appropriate skills
and therefore talk directly to their envisioned outcome.
Can the concept of networked growth poles be integrated with the findings and
recommendations of a recent JICA study?
The two studies were conducted at entirely different levels with different primary objectives.
The Jica study was on overview of southern African investment/technical assistance
opportunities that could be met by Jica, conducted over a 9 month period with 11
consultants. In the Growth Pole study the much broader area of the Tripartite was
considered in a five man-month study concentrating on industrialisation opportunities based
on mining. Nevertheless there is a certain degree of integration that can be pointed to in the
two studies.
Both studies have clarified that education and training are critical to development; both have
seen that the best mineral based opportunities in Africa for industrial and agricultural
development are based around hydrocarbons, steel and phosphates. Both studies are clear
that it is political will that will make the difference between success and failure, both see that
regional development and cooperation is a necessary prerequisite for future developmental
success, and both see a role for government in the success of any major developmental
plans for Africa.
The current study has rated many growth poles, and as a requirement of the study has had
to attempt to choose those most likely to be successful in the medium to long term. This
should in no way be seen as negative for those that did not make the top positions, since
political will to develop will have a huge effect on what actually happens in the future.

Page 47 2 Growth Poles and value chains
However, the growth poles chosen could be seen as a starting point for JICA to begin its
rollout of technical and financial assistance and once the second round of the study is
completed there will be a shorter list to assess.
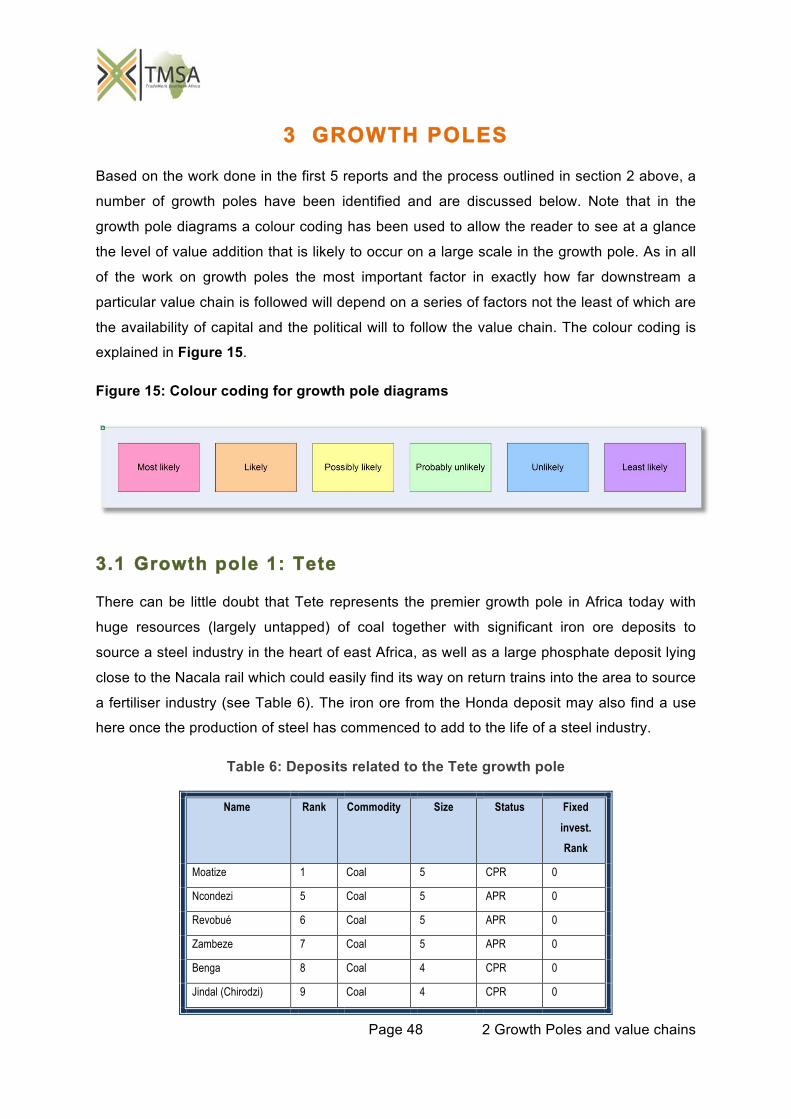
Page 48 2 Growth Poles and value chains
3 GROWTH POLES
Based on the work done in the first 5 reports and the process outlined in section 2 above, a
number of growth poles have been identified and are discussed below. Note that in the
growth pole diagrams a colour coding has been used to allow the reader to see at a glance
the level of value addition that is likely to occur on a large scale in the growth pole. As in all
of the work on growth poles the most important factor in exactly how far downstream a
particular value chain is followed will depend on a series of factors not the least of which are
the availability of capital and the political will to follow the value chain. The colour coding is
explained in Figure 15.
Figure 15: Colour coding for growth pole diagrams
3.1 Growth pole 1: Tete
There can be little doubt that Tete represents the premier growth pole in Africa today with
huge resources (largely untapped) of coal together with significant iron ore deposits to
source a steel industry in the heart of east Africa, as well as a large phosphate deposit lying
close to the Nacala rail which could easily find its way on return trains into the area to source
a fertiliser industry (see Table 6). The iron ore from the Honda deposit may also find a use
here once the production of steel has commenced to add to the life of a steel industry.
Table 6: Deposits related to the Tete growth pole
Name Rank Commodity Size Status Fixed invest. Rank
Moatize 1 Coal 5 CPR 0
Ncondezi 5 Coal 5 APR 0
Revobué 6 Coal 5 APR 0
Zambeze 7 Coal 5 APR 0
Benga 8 Coal 4 CPR 0
Jindal (Chirodzi) 9 Coal 4 CPR 0
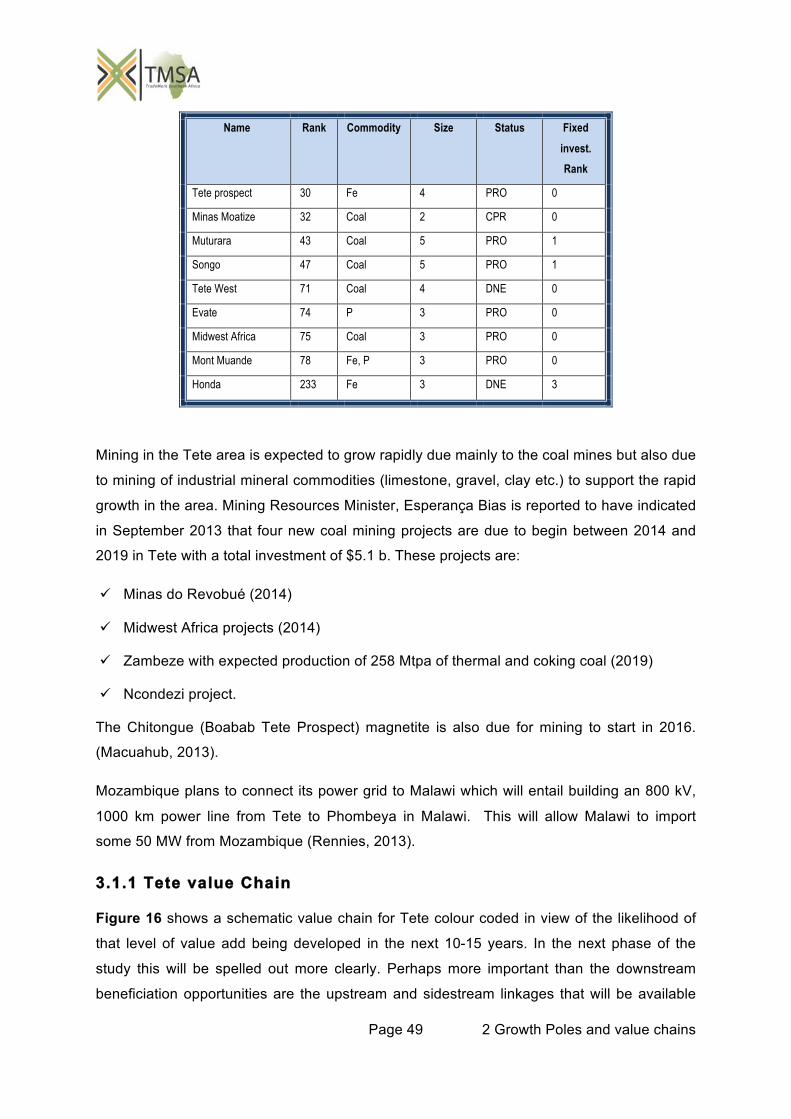
Page 49 2 Growth Poles and value chains
Name Rank Commodity Size Status Fixed invest. Rank
Tete prospect 30 Fe 4 PRO 0
Minas Moatize 32 Coal 2 CPR 0
Muturara 43 Coal 5 PRO 1
Songo 47 Coal 5 PRO 1
Tete West 71 Coal 4 DNE 0
Evate 74 P 3 PRO 0
Midwest Africa 75 Coal 3 PRO 0
Mont Muande 78 Fe, P 3 PRO 0
Honda 233 Fe 3 DNE 3
Mining in the Tete area is expected to grow rapidly due mainly to the coal mines but also due
to mining of industrial mineral commodities (limestone, gravel, clay etc.) to support the rapid
growth in the area. Mining Resources Minister, Esperança Bias is reported to have indicated
in September 2013 that four new coal mining projects are due to begin between 2014 and
2019 in Tete with a total investment of $5.1 b. These projects are:
Minas do Revobué (2014)
Midwest Africa projects (2014)
Zambeze with expected production of 258 Mtpa of thermal and coking coal (2019)
Ncondezi project.
The Chitongue (Boabab Tete Prospect) magnetite is also due for mining to start in 2016.
(Macuahub, 2013).
Mozambique plans to connect its power grid to Malawi which will entail building an 800 kV,
1000 km power line from Tete to Phombeya in Malawi. This will allow Malawi to import
some 50 MW from Mozambique (Rennies, 2013).
3.1.1 Tete value Chain
Figure 16 shows a schematic value chain for Tete colour coded in view of the likelihood of
that level of value add being developed in the next 10-15 years. In the next phase of the
study this will be spelled out more clearly. Perhaps more important than the downstream
beneficiation opportunities are the upstream and sidestream linkages that will be available
Page 50 2 Growth Poles and value chains
immediately as mining begins and which will grow rapidly as more mines start producing and
every step of downstream beneficiation will also bring a raft of possibilities.
Mining at Mont Muande will supply apatite concentrate which could be exported or used to
produce fertiliser locally. The amount of apatite produced may not be enough to make the
production of value added products viable, however if the Evate deposit is also mined then
the phosphate from the two deposits will certainly support beneficiation. It is likely that if
there is beneficiation of the coal locally then sulphur for sulphuric acid will be produced
which is an essential input into the process to produce phosphoric acid.
The Evate apatite is a flour-apatite which means that there will be a possible byproduct of
hydrofluoric acid. This is a valuable input into other processes and in the second stage of the
growth pole project a theoretical mass balance should be calculated to establish if quantities
produced at Evate (assuming the mining and production proceeds) will be significant enough
to feed into the refining industry where it is used in the alkylation of isobutene.
3.1.2 Government revenue from coal mining
Resenfeld (2012) presented a model for predicting government revenue from the coal mining
sector in Mozambique. Resenfeld looks at various constraints and risks in making
predictions of this sort and considers only two sources of government revenue (royalties at
3% and corporate tax at 32%). Four constrained scenarios and an unconstrained scenario
are considered; the resulting graphed incomes are shown in Figure 17. The scenarios are
summarised below:
Scenario 1: Baseline scenario, only the Sena line at 6 Mpta by 2013,
Scenario 2: Baseline scenario plus a 25 Mtpa Nacala line in 2015, bringing maximum
transport capacity to 31 Mtpa.
Scenario 3: Scenario 2 plus upgrade of the Sena line to 19 Mtpa in 2016, bringing
maximum transport capacity to 50 Mtpa.
Scenario 4: Scenario 3 plus a 35 Mtpa rail line by 2020 linking Tete to a port North of
Quelimane, bringing maximum transport capacity to 85 Mtpa.
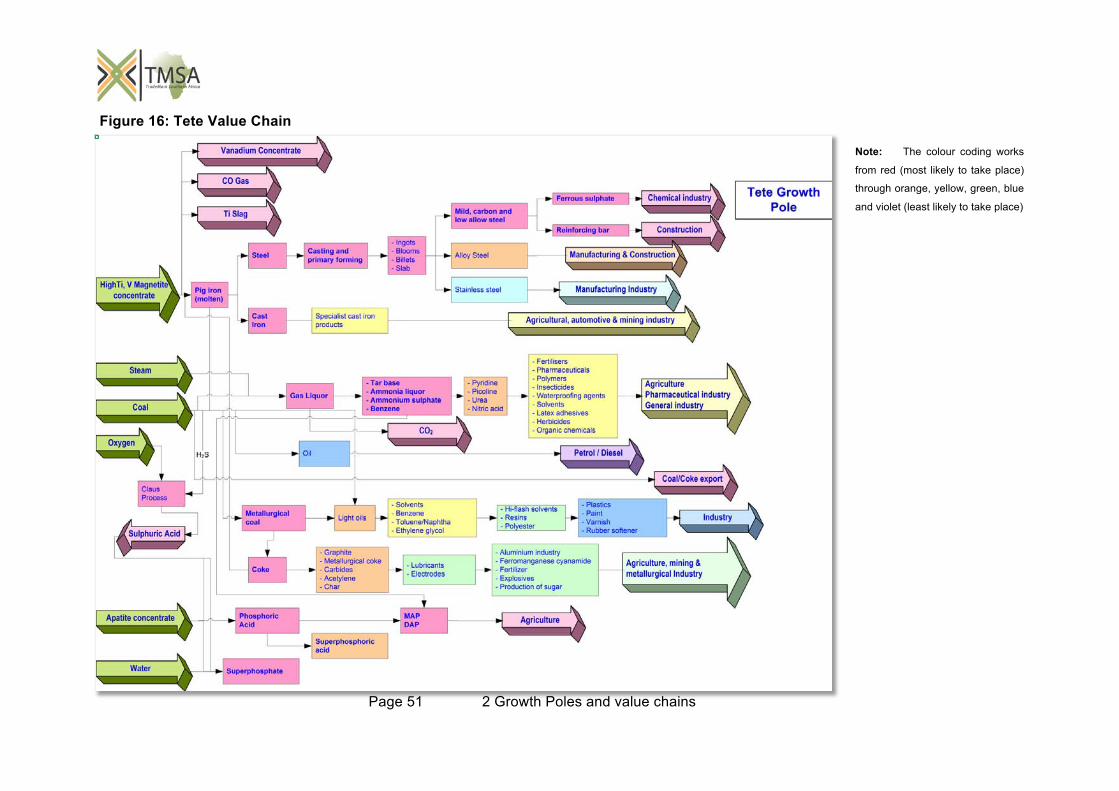
Page 51 2 Growth Poles and value chains
Figure 16: Tete Value Chain
Note: The colour coding works
from red (most likely to take place)
through orange, yellow, green, blue
and violet (least likely to take place)
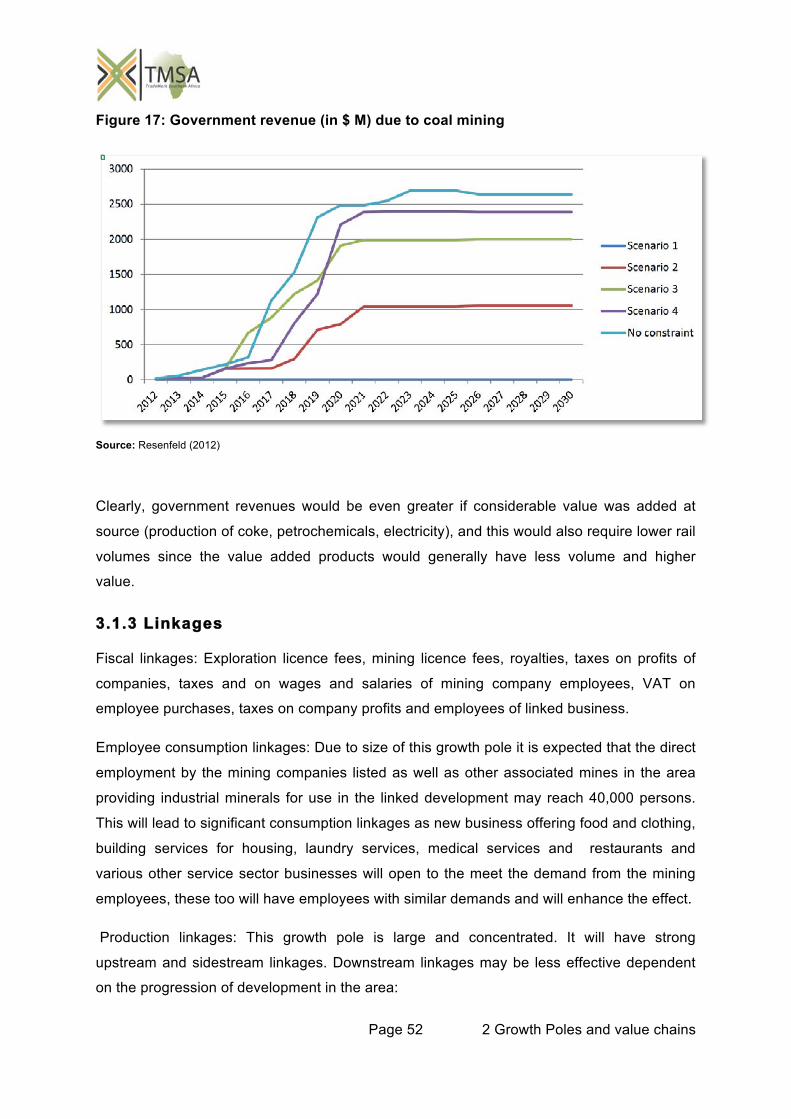
Page 52 2 Growth Poles and value chains
Figure 17: Government revenue (in $ M) due to coal mining
Source: Resenfeld (2012)
Clearly, government revenues would be even greater if considerable value was added at
source (production of coke, petrochemicals, electricity), and this would also require lower rail
volumes since the value added products would generally have less volume and higher
value.
3.1.3 Linkages
Fiscal linkages: Exploration licence fees, mining licence fees, royalties, taxes on profits of
companies, taxes and on wages and salaries of mining company employees, VAT on
employee purchases, taxes on company profits and employees of linked business.
Employee consumption linkages: Due to size of this growth pole it is expected that the direct
employment by the mining companies listed as well as other associated mines in the area
providing industrial minerals for use in the linked development may reach 40,000 persons.
This will lead to significant consumption linkages as new business offering food and clothing,
building services for housing, laundry services, medical services and restaurants and
various other service sector businesses will open to the meet the demand from the mining
employees, these too will have employees with similar demands and will enhance the effect.
Production linkages: This growth pole is large and concentrated. It will have strong
upstream and sidestream linkages. Downstream linkages may be less effective dependent
on the progression of development in the area:
Page 53 2 Growth Poles and value chains
Upstream or backwards linkages: Strong upstream linkages will include the demand
for capital equipment; the requirements will depend very much on mining conditions and
methodology (drilling equipment; core sheds; “yellow vehicles” [excavators, dozers,
shovels, dump trucks, graders]; land; cement, clay, bricks; steel sheet; longwall
miners/continuous miners; survey equipment; conveyor systems [inclusive of
engineering, design and installation, belts, belt cleaners, safety equipment, skirting and
dust control etc.]; draglines; winders and hoists; cables; copper wire; cement spraying
systems, roof drilling and bolting systems; refrigeration and ventilation systems;
compressors; fans; explosives; explosive drilling and packing systems; backfill
technology and equipment; communication systems; person transport [underground and
surface]; battery packs and lighting systems for personnel; electrical services,
mechanical services; pulleys; pumps, cabling; environmental services; logistics systems;
loading equipment; cranes; comminution and screening systems; mine scheduling
software; roof supports; hydraulic valves, coal stock handling systems and equipment;
tailings dam systems; rail siding equipment; laboratory analysis equipment; automated
scanners to monitor production quality); miners clothing and shoe supply;
Downstream or forwards linkages: see section 2.7 Value Chains and the Appendices
for the particular mineral commodities. It should also be noted that each step of the
value chain that is reached will bring its own set of linked business into the pool.
Sidestream or horizontal linkages: The Sena rail has already proved grossly
insufficient for delivery of coking coal to the coast and Vale is building a line through
Malawi to the port at Nacala. This line may allow for other goods to be transported and
will itself have a strong multiplier effect both at its endpoints as well as along the line
and especially in Malawi where there has been an agreement for Malawian business to
get some usage of the line. In Tete access to imported goods will become much easier
as rail traffic between the coast and Tete becomes more frequent making it a clear
trading hub into the region. It is likely that an important dry port will be developed here.
Power stations being developed as downstream opportunities for the low quality coal will
also see important sidestream offsets as electricity needed for the mining and
beneficiation operation will only use a portion of the electricity that will become available
and the rest will be available for other industrial development, both in Tete as well as in
the region as a whole as the energy reticulation systems are built out. Similarly as the
importance of Tete as a major mining and industrial hub grows it is likely that the airport,
access roads and information and communications technology (ICT) will be upgraded
giving benefits to a wide variety of business. Banking, legal and administrative services
Page 54 2 Growth Poles and value chains
will develop to directly serve the mining companies, these will be available for the wider
community. Since agriculture is important in the area, and since it is likely that fertiliser
production will take place downstream from the mining it is expected that Tete will
become a major trading centre in the area for fertilisers and that farmers co-ops will
thrive. Building, mechanical and other services developed or enhanced to meet the
needs of the mining sector will be available for the broader community. Many skills will
be learned in building the necessary infrastructure for the mines and these skills will
become available as building services. It is also likely that laundry, repair services and
landscaping services will thrive based largely on work for the mines. Hotels will be built
to accommodate the many technical teams that will come in during early development
and will support other business and tourist visits as well.
3.2 Growth Pole 2: Rovuma / Mtwara
The very significant deposits of gas already proven in northern Mozambique and southern
Tanzania stand in their own right as a clear opportunity for industrialisation. The supply of
natural gas in the area is likely to open the door to a variety of industrial development
through the supply of electricity, the supply of the gas itself, the production of LNG for export
and the ancillary industry and services feeding into this opportunity. Furthermore, once an
industrial presence is established in the area (as well as the supply of energy) a number of
other primary and secondary industries are likely to blossom in the area.
Note that the separation of this growth pole from the more northern gas field at Songo
Songo as well as the potential between them and deeper deposits has been somewhat
arbitrary. If the Gas fields are selected for further study in the second phase of the greater
project this separation should be reconsidered with the possibility of seeing all the gas from
Rovuma and up to Mkuranga as a single growth pole.
The domestic market for gas in Mozambique and Tanzania remains small, and is restricted
largely to Maputo, Beira and Dar es Salaam, although it is expected to grow. The 2011 gas
consumption in Mozambique was about 0.51 bcmpa in 2011 (EIA, 2013). In Tanzania the
domestic market consumed 0.8 bcmpa in 2011. The production of the gas itself will not lead
to a great number of jobs, however, dependent on the amount of downstream beneficiation
that is carried out and the ancillary industry that is likely to grow in the area, the number of
jobs provided may indeed be considerable.
It is important that development of gas based industry requires high levels of technology and
technical expertise. Compared to crude oil it also needs considerable capital investment in
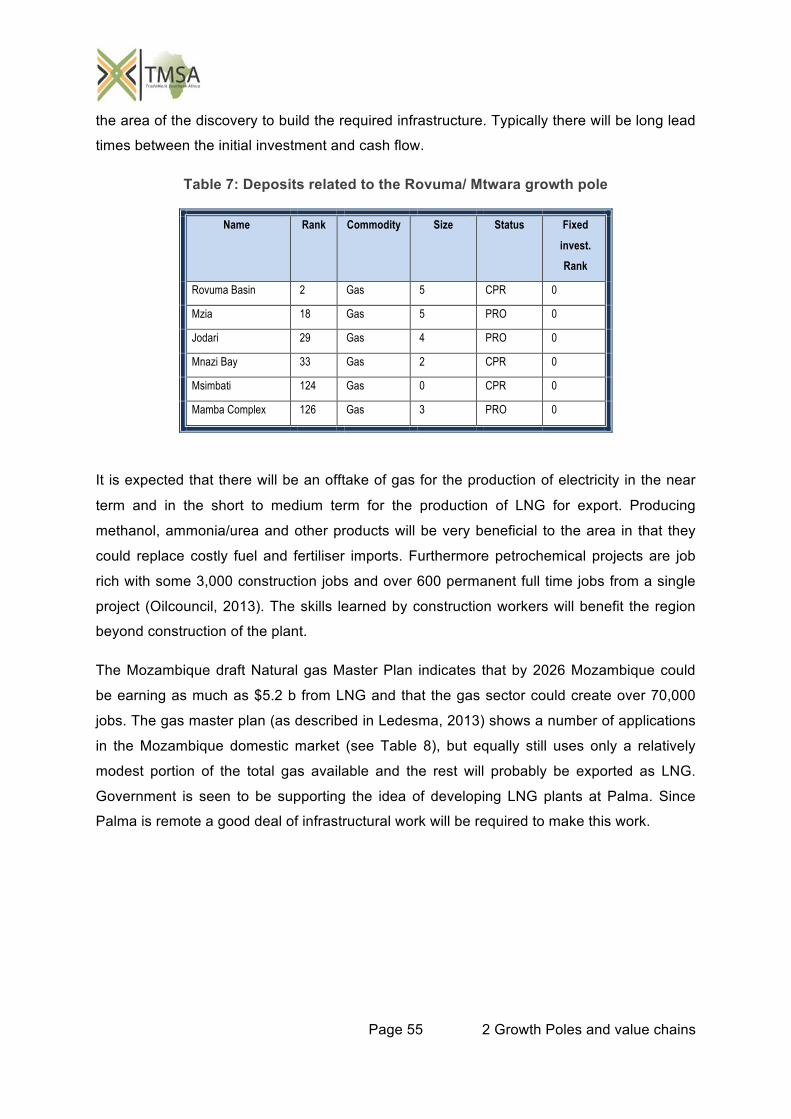
Page 55 2 Growth Poles and value chains
the area of the discovery to build the required infrastructure. Typically there will be long lead
times between the initial investment and cash flow.
Table 7: Deposits related to the Rovuma/ Mtwara growth pole
Name Rank Commodity Size Status Fixed invest. Rank
Rovuma Basin 2 Gas 5 CPR 0
Mzia 18 Gas 5 PRO 0
Jodari 29 Gas 4 PRO 0
Mnazi Bay 33 Gas 2 CPR 0
Msimbati 124 Gas 0 CPR 0
Mamba Complex 126 Gas 3 PRO 0
It is expected that there will be an offtake of gas for the production of electricity in the near
term and in the short to medium term for the production of LNG for export. Producing
methanol, ammonia/urea and other products will be very beneficial to the area in that they
could replace costly fuel and fertiliser imports. Furthermore petrochemical projects are job
rich with some 3,000 construction jobs and over 600 permanent full time jobs from a single
project (Oilcouncil, 2013). The skills learned by construction workers will benefit the region
beyond construction of the plant.
The Mozambique draft Natural gas Master Plan indicates that by 2026 Mozambique could
be earning as much as $5.2 b from LNG and that the gas sector could create over 70,000
jobs. The gas master plan (as described in Ledesma, 2013) shows a number of applications
in the Mozambique domestic market (see Table 8), but equally still uses only a relatively
modest portion of the total gas available and the rest will probably be exported as LNG.
Government is seen to be supporting the idea of developing LNG plants at Palma. Since
Palma is remote a good deal of infrastructural work will be required to make this work.
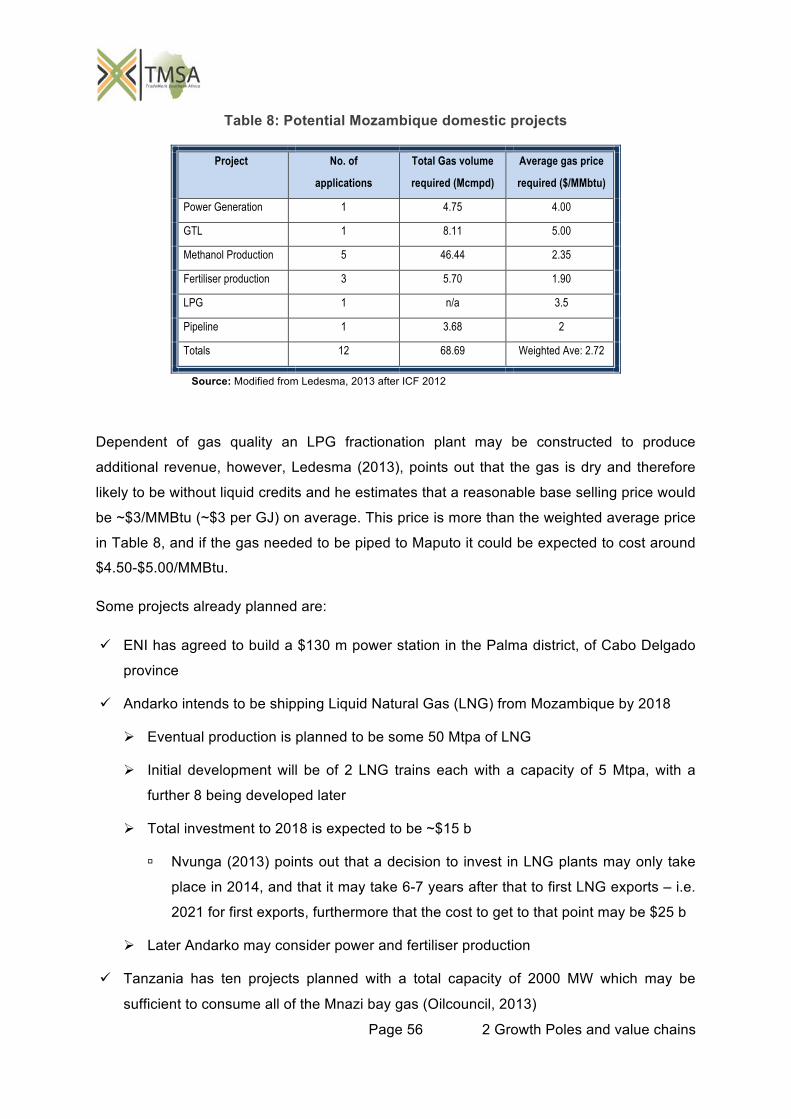
Page 56 2 Growth Poles and value chains
Table 8: Potential Mozambique domestic projects
Project No. of
applications
Total Gas volume
required (Mcmpd)
Average gas price
required ($/MMbtu)
Power Generation 1 4.75 4.00
GTL 1 8.11 5.00
Methanol Production 5 46.44 2.35
Fertiliser production 3 5.70 1.90
LPG 1 n/a 3.5
Pipeline 1 3.68 2
Totals 12 68.69 Weighted Ave: 2.72
Source: Modified from Ledesma, 2013 after ICF 2012
Dependent of gas quality an LPG fractionation plant may be constructed to produce
additional revenue, however, Ledesma (2013), points out that the gas is dry and therefore
likely to be without liquid credits and he estimates that a reasonable base selling price would
be ~$3/MMBtu (~$3 per GJ) on average. This price is more than the weighted average price
in Table 8, and if the gas needed to be piped to Maputo it could be expected to cost around
$4.50-$5.00/MMBtu.
Some projects already planned are:
ENI has agreed to build a $130 m power station in the Palma district, of Cabo Delgado
province
Andarko intends to be shipping Liquid Natural Gas (LNG) from Mozambique by 2018
Eventual production is planned to be some 50 Mtpa of LNG
Initial development will be of 2 LNG trains each with a capacity of 5 Mtpa, with a
further 8 being developed later
Total investment to 2018 is expected to be ~$15 b
Nvunga (2013) points out that a decision to invest in LNG plants may only take
place in 2014, and that it may take 6-7 years after that to first LNG exports – i.e.
2021 for first exports, furthermore that the cost to get to that point may be $25 b
Later Andarko may consider power and fertiliser production
Tanzania has ten projects planned with a total capacity of 2000 MW which may be
sufficient to consume all of the Mnazi bay gas (Oilcouncil, 2013)
Page 57 2 Growth Poles and value chains
Tanzania has made it clear that they require methanol and urea production in the
future
A 532 km long, $1.2 b, natural gas pipe from Mtwara to Dar es Salaam is expected to
transport 22 Mcmpa
A 760 km² appraisal licence was issued by the Tanzanian Government for the Ntorya
gas discovery.
By November 2013 ENH is planning to have a distribution grid in place to provide gas to
industry, hospitals and hotels as well as residential users in Maputo (Ledesma, 2013) –
whilst far from the growth pole itself, projects of this nature highlight the importance of
the source area.
The likelihood taking into account the current state of knowledge for movement down the
value chain in the Rovuma area can be seen in Figure 18.
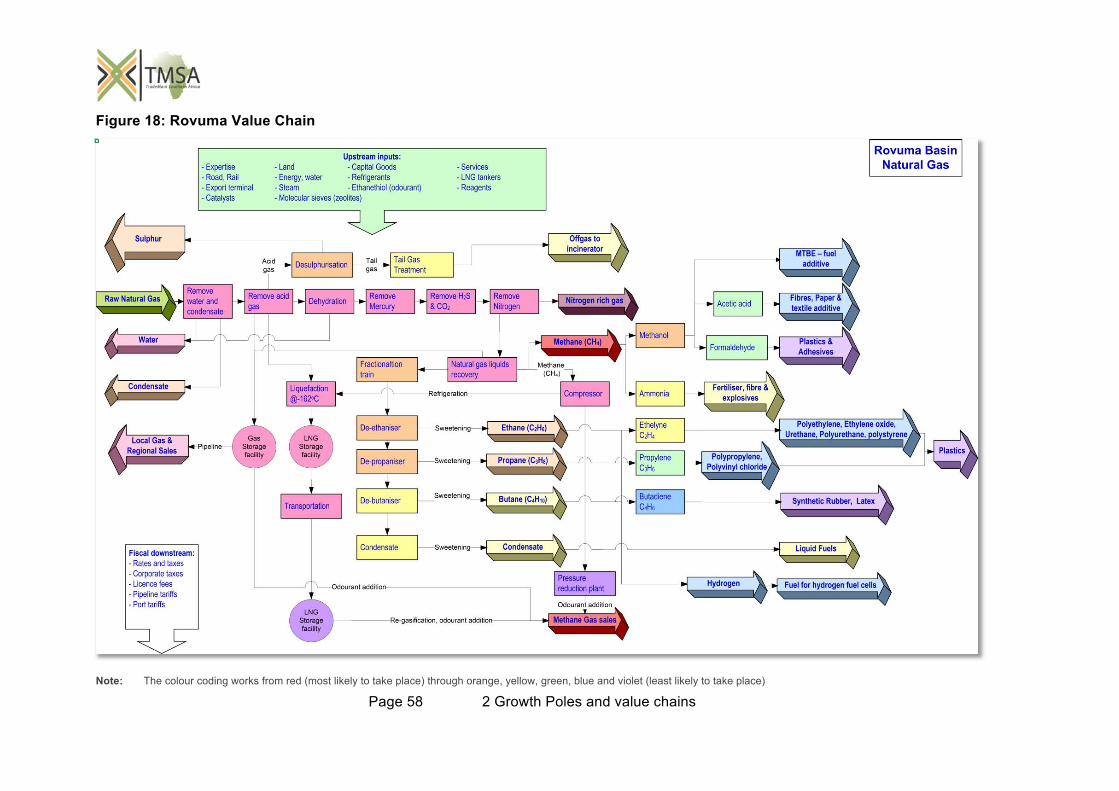
Page 58 2 Growth Poles and value chains
Figure 18: Rovuma Value Chain
Note: The colour coding works from red (most likely to take place) through orange, yellow, green, blue and violet (least likely to take place)
Page 59 2 Growth Poles and value chains
3.2.1 Government revenue
In the case of Mozambique government is due to receive a royalty of 2% of the value of gas
produced (paid first), as well as corporate tax of 24% for the first 8 years and then the
normal tax rate of 32% beyond that. Thereafter, although the government has a % share of
the gas, the company will first be allowed to recover its costs from exploration. This is
however limited by a 25% per annum depreciation of capital and a limit of cost recovery to
65% (Andarko) and 75% (ENI). The proportion of gas remaining after these deductions – so
called “profit gas” is split between the company and government dependent on an “r-factor”
were r is the ratio of overall project income to overall project expenses. Table 9 shows the
relative company and government percentage income at different r-factors.
Nvunga (2013) points out that the contracts are complex and it is uncertain what the deal will
be after the first 2 LNG plants.
Table 9: Government revenues from shared profits
r-factor Andarko Government ENI Government
r less than 1 90% 10% 85% 15%
r =1 to 2 80% 20% 75% 25%
r = 2 to 3 70% 30% 65% 35%
r = 3 to 4 50% 50% 55% 45%
r ≥ 4 40% 60% 45% 55%
Source: Nvunga (2013)
Note: r is the ratio of overall project income to overall project expenses
3.3 Growth Pole 3: Lephalale / Southern Botswana
The very large resources of coal in the Waterberg coalfield and stretching across the border
into Botswana offers an excellent opportunity not only for further generation of electricity in
order to supply the ever growing need in southern Africa, but it also opens the opportunity
for a large petrochemical/fertiliser/coal-to-liquids industrial complex. There needs to be a
mindset change about the large coal deposits that are distant from the sea to consider the
huge value add that can come about through the production of electricity and petrochemicals
and hopefully also adding further value towards finished products, rather thinking only about
how to get the coal to the coast. The higher value of the semi-finished and perhaps finished
products from the petrochemical industry can add considerably to the value of material on
Page 60 2 Growth Poles and value chains
transport routes in the future. Not only will this fundamentally change the well-being of the
area, but in doing so it will also open the door to a range of ancillary industry. The deposits
considered in this growth pole are listed in Table 10.
There is a degree of complexity which comes into the development of projects in this area
and that relates to the lack of water for development. This restricts the number and type of
project that can take place. Furthermore SASOL announced in June 2013 that it had taken
the decision not to continue with their previously planned Project Mafutha (coal to liquids) in
the Limpopo Province in South Africa. The reasons for this relate apparently to the findings
of the prefeasibility study, the global environmental risks and especially to the absence of a
commercially viable carbon capture and storage policy in South Africa.
Table 10: Deposits related to the Lephalale / Southern Botswana growth pole
Name Country Rank Commodity Size Status Fixed invest. Rank
Waterberg South Africa 3 Coal 5 CPR 0
Kweneng PL341/2008 Botswana 36 Coal 5 PRO 1
Mmamabula Botswana 40 Coal 5 PRO 1
Mmamantswe Botswana 41 Coal 5 PRO 1
Mmamabula central and south Botswana 81 Coal 4 PRO 1
Thabazimbi South Africa 114 Iron 4 CPR 3
Meletse Iron South Africa 131 Iron 4 PRO 2
Moonlight South Africa 132 Iron 4 PRO 2
Glenover South Africa 160 Phosphate 2 PRO 1
Although superficially this growth pole appears similar to Tete, there are significant
differences. While the business environment in South Africa, which houses the highest
ranked project, is more developed, government tends to have an adversarial relationship
with the mining sector rather than one of joint agreement. Furthermore, there appears to be
a degree of disagreement between South Africa and Botswana regarding the development
of the Botswana coal deposits. Thirdly the coal quality is entirely different from that at Tete,
which has a large percentage of high quality hard coking coal – the Waterberg coal is largely
poor to medium quality steam coal, although soft coking coal does exist in the area. The iron
deposits differ in that the South African deposits are haematite and magnetite whereas those
in Tete are only magnetite and South Africa already has a large steel industry which is set to

Page 61 2 Growth Poles and value chains
grow in the near future with proposed developments at Palabora. Finally the phosphate
deposit at Glenover is smaller than that at Evate and as a result less likely to be able to
support a plant to produce phosphoric acid. It is currently being pursued more as a rare
earth deposit, since the rare earths present probably have a higher value than the
phosphate.
Based on the current understanding on the government and business attitudes towards this
area the likely downstream value addition is shown in Figure 19. It can be seen from this
that although there is a good deal of potential in the area, there is little likelihood of the
industrialisation potential being developed.
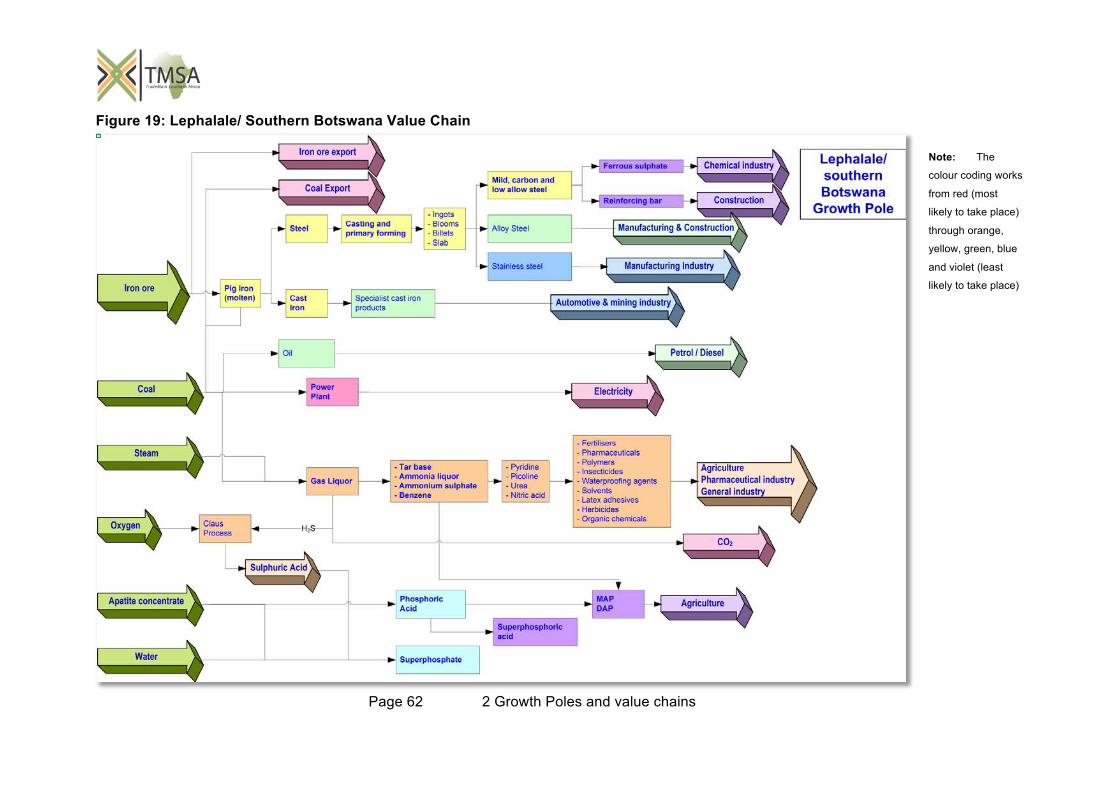
Page 62 2 Growth Poles and value chains
Figure 19: Lephalale/ Southern Botswana Value Chain
Note: The
colour coding works
from red (most
likely to take place)
through orange,
yellow, green, blue
and violet (least
likely to take place)
Page 63 2 Growth Poles and value chains
Some projects already planned are:
Medupi coal fired power plant in Lephalale will consist of six 800 MW units. Construction
activities commenced in May 2007. When complete, the power station will be the fourth
largest coal fired plant in the world, and the biggest dry-cooled plant. The planned
operational life of the station is 50 years.
Construction jobs peaked at 17,000 direct jobs
State-owned Transnet Freight Rail (TFR) plans to expand capacity on the existing rail
network out of the Waterberg coal region (Odendaal, 2013)
By year-end 2013, it plans to add 2.4 Mtpa of coal export rail capacity to bring the
total capacity to about 7 Mtpa.
By June 2014 the rail should be able to move about 13 Mtpa
Exxaro is planning to open its Thabametsi coal mine (adjacent to Grootegeluk) which
will deliver 3.8 Mtpa to an on-site independent power producer (IPP) (Odendaal, 2013)
Exxaro’s R10.2 b Grootegeluk Mine Expansion project, will supply the Medupi power
station with 14.6 Mtpa is progressing on time and within budget, and is 96% complete
(Odendaal, 2013)
Vedanta is planning a 600 MW coal-fired power station in the Waterberg District. The
power station will obtain coal from the adjacent Dalyshope Coal Mine that is still in its
feasibility development phase
Botswana and Namibia have signed a $11 b agreement for a transnational rail line to
connect Botswana with the Port of Walvis Bay which will open the way for Botswana to
export coal via Namibia (Rennies, 2013)
Transnet has earmarked R5.8 b for railway development in the Waterberg region from
the Botswana coal fields to Limpopo and to Thabazimbi; the line to Ermelo will be
upgraded. The Botswana link will be completed by 2020.
The Glenover project which is now being seen as a rare earth play published its
preliminary economic assessment (PEA) this year, which indicated a net present value
of some $783 M at a discount rate of 5%,
The Ferrum Crescent moonlight magnetite project is in bankable feasibility stage
African energy (Mmamantswe colliery) has submitted a proposal to supply 300 MW of
power from a coal-fired power station to the South African government; it has also
submitted a proposal to build a 600 MW coal-fired power station near Lephalale.
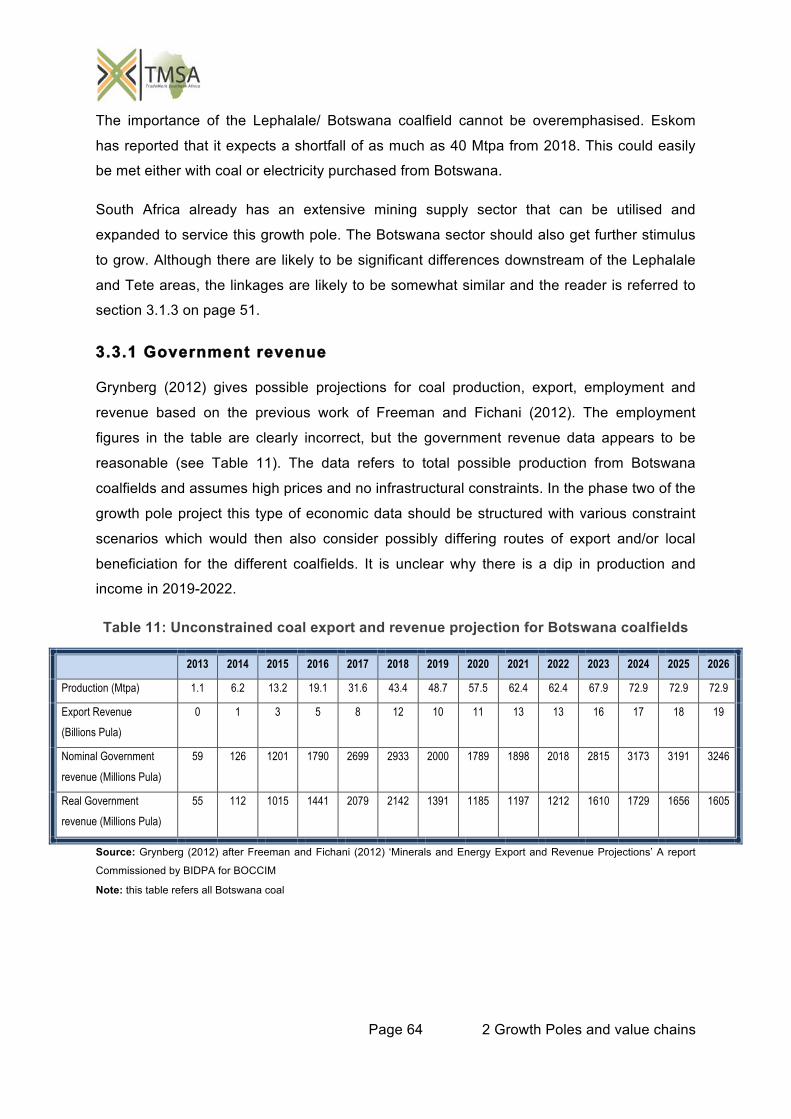
Page 64 2 Growth Poles and value chains
The importance of the Lephalale/ Botswana coalfield cannot be overemphasised. Eskom
has reported that it expects a shortfall of as much as 40 Mtpa from 2018. This could easily
be met either with coal or electricity purchased from Botswana.
South Africa already has an extensive mining supply sector that can be utilised and
expanded to service this growth pole. The Botswana sector should also get further stimulus
to grow. Although there are likely to be significant differences downstream of the Lephalale
and Tete areas, the linkages are likely to be somewhat similar and the reader is referred to
section 3.1.3 on page 51.
3.3.1 Government revenue
Grynberg (2012) gives possible projections for coal production, export, employment and
revenue based on the previous work of Freeman and Fichani (2012). The employment
figures in the table are clearly incorrect, but the government revenue data appears to be
reasonable (see Table 11). The data refers to total possible production from Botswana
coalfields and assumes high prices and no infrastructural constraints. In the phase two of the
growth pole project this type of economic data should be structured with various constraint
scenarios which would then also consider possibly differing routes of export and/or local
beneficiation for the different coalfields. It is unclear why there is a dip in production and
income in 2019-2022.
Table 11: Unconstrained coal export and revenue projection for Botswana coalfields
2013 2014 2015 2016 2017 2018 2019 2020 2021 2022 2023 2024 2025 2026
Production (Mtpa) 1.1 6.2 13.2 19.1 31.6 43.4 48.7 57.5 62.4 62.4 67.9 72.9 72.9 72.9
Export Revenue
(Billions Pula)
0 1 3 5 8 12 10 11 13 13 16 17 18 19
Nominal Government
revenue (Millions Pula)
59 126 1201 1790 2699 2933 2000 1789 1898 2018 2815 3173 3191 3246
Real Government
revenue (Millions Pula)
55 112 1015 1441 2079 2142 1391 1185 1197 1212 1610 1729 1656 1605
Source: Grynberg (2012) after Freeman and Fichani (2012) ‘Minerals and Energy Export and Revenue Projections’ A report
Commissioned by BIDPA for BOCCIM
Note: this table refers all Botswana coal
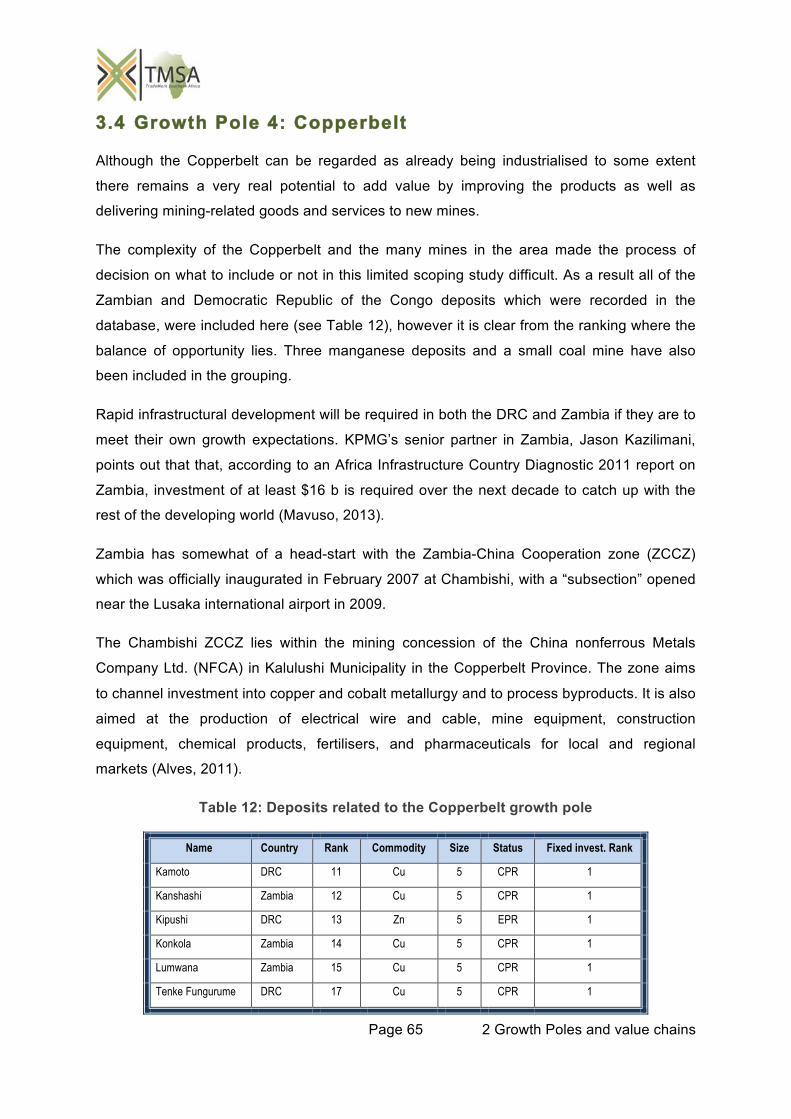
Page 65 2 Growth Poles and value chains
3.4 Growth Pole 4: Copperbelt
Although the Copperbelt can be regarded as already being industrialised to some extent
there remains a very real potential to add value by improving the products as well as
delivering mining-related goods and services to new mines.
The complexity of the Copperbelt and the many mines in the area made the process of
decision on what to include or not in this limited scoping study difficult. As a result all of the
Zambian and Democratic Republic of the Congo deposits which were recorded in the
database, were included here (see Table 12), however it is clear from the ranking where the
balance of opportunity lies. Three manganese deposits and a small coal mine have also
been included in the grouping.
Rapid infrastructural development will be required in both the DRC and Zambia if they are to
meet their own growth expectations. KPMG’s senior partner in Zambia, Jason Kazilimani,
points out that that, according to an Africa Infrastructure Country Diagnostic 2011 report on
Zambia, investment of at least $16 b is required over the next decade to catch up with the
rest of the developing world (Mavuso, 2013).
Zambia has somewhat of a head-start with the Zambia-China Cooperation zone (ZCCZ)
which was officially inaugurated in February 2007 at Chambishi, with a “subsection” opened
near the Lusaka international airport in 2009.
The Chambishi ZCCZ lies within the mining concession of the China nonferrous Metals
Company Ltd. (NFCA) in Kalulushi Municipality in the Copperbelt Province. The zone aims
to channel investment into copper and cobalt metallurgy and to process byproducts. It is also
aimed at the production of electrical wire and cable, mine equipment, construction
equipment, chemical products, fertilisers, and pharmaceuticals for local and regional
markets (Alves, 2011).
Table 12: Deposits related to the Copperbelt growth pole
Name Country Rank Commodity Size Status Fixed invest. Rank
Kamoto DRC 11 Cu 5 CPR 1
Kanshashi Zambia 12 Cu 5 CPR 1
Kipushi DRC 13 Zn 5 EPR 1
Konkola Zambia 14 Cu 5 CPR 1
Lumwana Zambia 15 Cu 5 CPR 1
Tenke Fungurume DRC 17 Cu 5 CPR 1
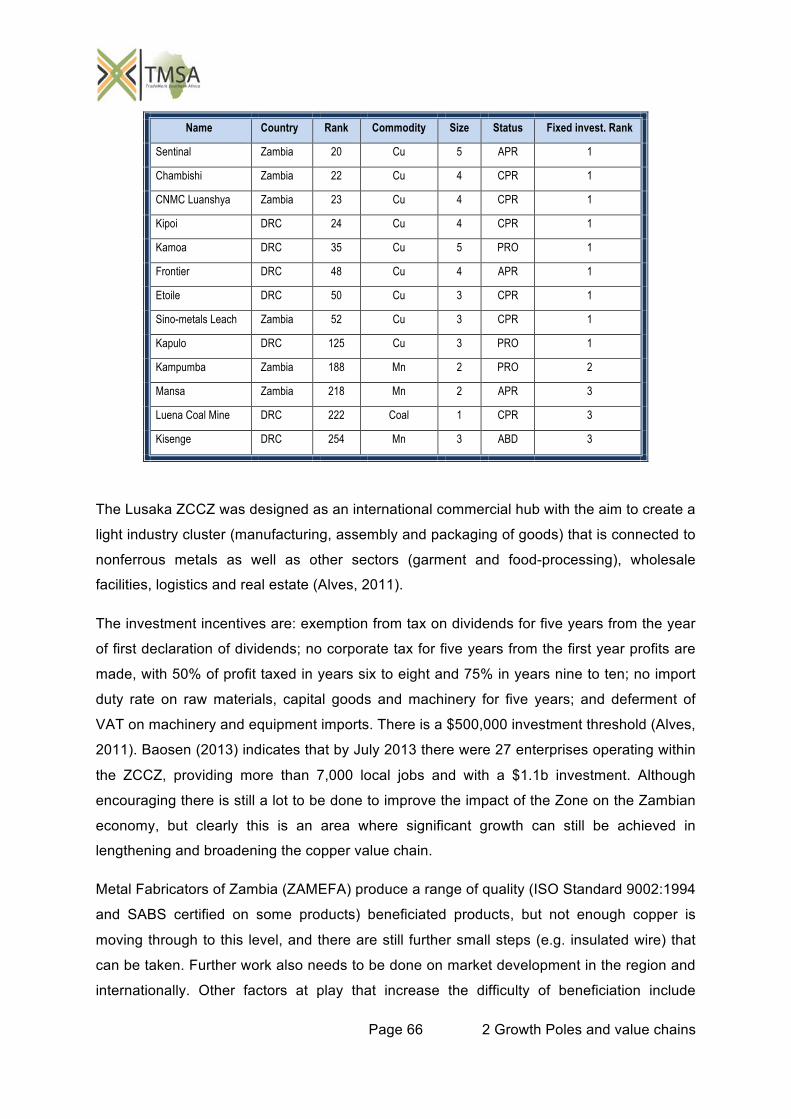
Page 66 2 Growth Poles and value chains
Name Country Rank Commodity Size Status Fixed invest. Rank
Sentinal Zambia 20 Cu 5 APR 1
Chambishi Zambia 22 Cu 4 CPR 1
CNMC Luanshya Zambia 23 Cu 4 CPR 1
Kipoi DRC 24 Cu 4 CPR 1
Kamoa DRC 35 Cu 5 PRO 1
Frontier DRC 48 Cu 4 APR 1
Etoile DRC 50 Cu 3 CPR 1
Sino-metals Leach Zambia 52 Cu 3 CPR 1
Kapulo DRC 125 Cu 3 PRO 1
Kampumba Zambia 188 Mn 2 PRO 2
Mansa Zambia 218 Mn 2 APR 3
Luena Coal Mine DRC 222 Coal 1 CPR 3
Kisenge DRC 254 Mn 3 ABD 3
The Lusaka ZCCZ was designed as an international commercial hub with the aim to create a
light industry cluster (manufacturing, assembly and packaging of goods) that is connected to
nonferrous metals as well as other sectors (garment and food-processing), wholesale
facilities, logistics and real estate (Alves, 2011).
The investment incentives are: exemption from tax on dividends for five years from the year
of first declaration of dividends; no corporate tax for five years from the first year profits are
made, with 50% of profit taxed in years six to eight and 75% in years nine to ten; no import
duty rate on raw materials, capital goods and machinery for five years; and deferment of
VAT on machinery and equipment imports. There is a $500,000 investment threshold (Alves,
2011). Baosen (2013) indicates that by July 2013 there were 27 enterprises operating within
the ZCCZ, providing more than 7,000 local jobs and with a $1.1b investment. Although
encouraging there is still a lot to be done to improve the impact of the Zone on the Zambian
economy, but clearly this is an area where significant growth can still be achieved in
lengthening and broadening the copper value chain.
Metal Fabricators of Zambia (ZAMEFA) produce a range of quality (ISO Standard 9002:1994
and SABS certified on some products) beneficiated products, but not enough copper is
moving through to this level, and there are still further small steps (e.g. insulated wire) that
can be taken. Further work also needs to be done on market development in the region and
internationally. Other factors at play that increase the difficulty of beneficiation include
Page 67 2 Growth Poles and value chains
transport and logistics difficulties and exchange rate volatility. ZAMEFA and Kavino (wire
and cable manufacture) are already producing most of the products shown in the Copperbelt
value chain (Figure 20), however only a small percentage (less than 5%) of Zambia’s
copper production is used for downstream manufacture in Zambia, whilst many
manufactured products from copper are imported (Worldbank, 2011). The way forward may
be for significant organic growth with possible new plants in the ZSSZ. A policy decision that
could be made in Zambia and the DRC (if not already in place) is to ensure all domestic
water piping is in copper pipes. Not only will this improve the safety of water but it will also
assist in local offtake of finished product.
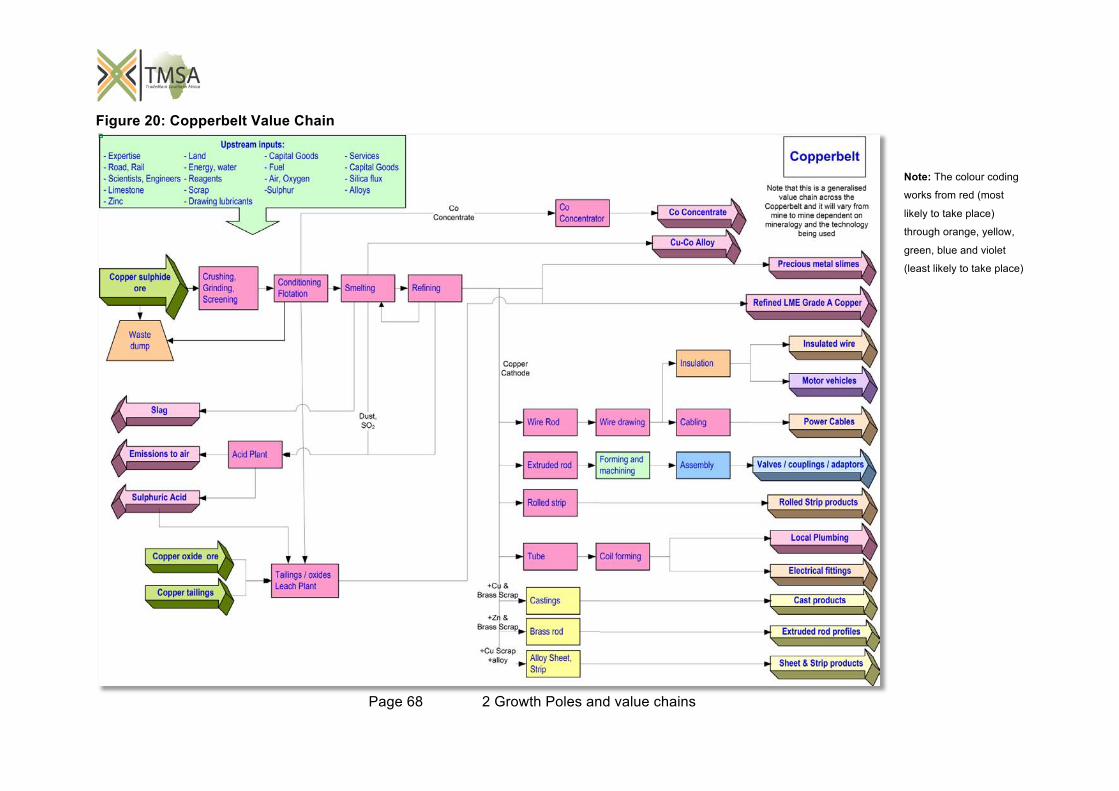
Page 68 2 Growth Poles and value chains
Figure 20: Copperbelt Value Chain
Note: The colour coding
works from red (most
likely to take place)
through orange, yellow,
green, blue and violet
(least likely to take place)
Page 69 2 Growth Poles and value chains
The quality of the copper product for wire drawing cannot be overemphasised where
manufacturers experience wire drawing problems, which lead to major downtime and
therefore cost implications they will quickly look for other sources of copper supply. It
appears the major reason for necking and breakage of drawn copper (outside of the actual
production line itself where die angle, annealing conditions, and choice of lubricant are key
issues) is inclusions in the copper. Raskin (1997) as reported by Norasethasopon and
Yoshida, (2003) shows that in a sample of 673 breaks 52% were due to inclusions. When
considering that superfine copper wires are drawn down to less than 15 microns it can be
seen that even the tiniest inclusions can have serious effects on the drawing process.
Ensuring the very highest quality products can only assist with marketing and pricing of the
product.
Projects already planned are:
Kamoto expansion to 300 ktpa copper and 30 ktpa cobalt by 2015 is underway
A new smelter is being built in Zambia which Kansanshi and Sentinel will share. It will
produce 300 ktpa of treated copper concentrate. Supply will come from Sentinel (67%),
Kansanshi (33%). The refractory lining of all the smelting units will be installed by the
Dickinson Group which plans to be on site from April-June 2014
Kanshahsi which currently employs ~3,000 people (excluding contractors), is expanding
and, by 2015, production should reach 400 ktpa, the company target is 1 Mtpa of Cu
production by 2017
ABB Ltd. will construct a $32 M new substation to facilitate reliable power to Kansanshi
The project is expected to be completed by 2014 (Zacks, 2013)
Murray & Roberts Cementation has been awarded the contract to prepare the Lubambe
mine for trackless high-speed development
Robor Pipe Systems (RPS) will supply the main pump columns for the new
Synchlonorium project at Mopani Copper Mines, in Zambia, which is scheduled for
completion in April 2014
A second acid plant is currently being built at Mopani Copper Mines (MCM) in Kitwe,
Zambia - the project is part of a three-phase smelter upgrade plan at a cost $450 M.
Work is expected to be completed before 2015. Once completed, sulphur dioxide
capture will increase from 51% to 97%. The MCM smelter upgrade project has
generated 400 local jobs (African Review, 2013)
Page 70 2 Growth Poles and value chains
The $832 M Chambishi South-East ore body, which is expected to produce 60 ktpa of
copper, is expected to be operational by 2015.
An $850 M project at Tenke, including mill upgrades, mining equipment, a new
tankhouse and new sulphuric acid plants, is aimed at increasing output of copper by
68 ktpa.
Sentinel Copper is being developed by Kalumbila Minerals, a subsidiary of First
Quantum Minerals. It is expecting delivery of two cyclone clusters for the SAG mill and
four clusters for the ball mill this year
By the end of 2014, the ramp-up of the stage 2 SX-EW plant will be complete
The Kapulo mine is expected to commission in Q1, 2014, ~$67 M of capital is already
spent
Zambian government has embarked on a major road upgrading project
Kaboko made its first sale of 2 kt of high grade manganese ore from the Mansa mine in
Zambia to the Noble Group in August 2013 under its $10 M pre-pay and offtake
agreement.
3.4.1 Linkages
Fiscal linkages: Exploration licence fees, mining licence fees, royalties, taxes on profits of
companies, taxes and on wages and salaries of mining company employees, VAT on
employee purchases, taxes on company profits and employees of linked business.
Employee consumption linkages: Due to size of this growth pole it is expected that the
direct, stable employment by the mining companies listed as well as other associated mines
in the area providing industrial minerals for use in the linked development may increase to
beyond 120,000 persons (the industry currently offers 74,000 in Zambia alone, Mulikelela,
2013) once the many current expansions are in place and new mines and associated
infrastructure are built. If more metal is taken downstream this number could see an
increase, although as pointed out by Worldbank (2011) the semis industry does not create
many jobs so increases are likely to be in 100’s rather than thousands. This will lead to a
further growth in consumption linkages as new business offering food and clothing, building
services for housing, laundry services, medical and restaurants and various service sector
businesses will open the meet the demand from the mining employees, these too will have
employees with similar demands and will enhance the effect.
Page 71 2 Growth Poles and value chains
Production linkages: This growth pole is large but is spread out over a very large area,
although some nodes do occur within this. As the development of the area continues it will
have strong upstream and sidestream linkages. Downstream linkages may be less effective
dependent on the progression of development in the area:
Upstream or backwards linkages: Strong upstream linkages will include continued
and /or growing demand for capital equipment; (drilling equipment; pumps, pipelines
“yellow vehicles” [excavators, dozers, shovels, dump trucks, graders]; land; cement,
clay, bricks; steel sheet; building services; conveyor systems [inclusive of engineering,
design and installation, belts, belt cleaners, safety equipment, skirting and dust control
etc.]; draglines; winders and hoists; cables; copper wire; cement spraying systems, roof
drilling and bolting systems; refrigeration and ventilation systems; compressors; fans;
explosives; explosive drilling and packing systems; backfill technology and equipment;
communication systems; person transport [underground and surface]; battery packs and
lighting systems for personnel; electrical services, mechanical services; pulleys; pumps,
cabling; environmental services; logistics systems; loading equipment; cranes;
comminution and screening systems; mine scheduling software; roof supports; hydraulic
valves; rail siding equipment; laboratory analysis equipment; automated scanners to
monitor production quality);
Downstream or forwards linkages: see Appendix G for the downstream scenario for
copper mines. A specific opportunity is to move a further step or two down the
value chain but especially to provide a product of a very high quality. Copper from
Zambia apparently needs further refining. A personal communication from a buyer in
South Africa indicated that when wire is drawn from copper imported from Zambia there
are a lot of breakages which led to significant downtime. As a result, this buyer is now
purchasing copper from Europe – this may well have originated in Zambia, but since
there have been no related breakage problems it is likely that it has undergone a further
refining step.
Sidestream or horizontal linkages: there are constant references to the poor state of
transport infrastructure on the copperbelt and it is clear that it is a requirement of having
a successful industry based on the mining sector that there needs to be significant
improvement to road and rail transport. Having quick efficient and cheap transport is
really the key to ensuring that the Copperbelt can become an area of major industrial
development in the heart of Africa. As the sector grows and with the building of a fourth
smelter in Zambia the requirement for electricity and excellent electrical reticulation will
also grow and needs to be provided by the state. Banking, legal and administrative
Page 72 2 Growth Poles and value chains
services will grow with the industry. Building, mechanical and other services developed
or enhanced to meet the needs of the mining sector will be available for the broader
community. A specific requirement is for tax experts who are fully conversant with
local tax laws and regulations
3.5 Growth pole 5: Zimbabwe steel
Zimbabwe Iron & Steel Company (ZISCO) was a fully integrated steel plant installed in
1936-38 with designed capacity of a 1 Mtpa of crude steel. It was operated below design
capacity and gasses were allowed to escape into the atmosphere. Oxygen was procured
externally. The plant closed down in January 2008 due to a prolonged national grid failure,
which resulted in damage to the furnaces. The Government of Zimbabwe decided to
disinvest in ZISCO and its subsidiaries and it launched an international private offer for
investment in August 2010. Essar Africa Holdings Limited was selected as the foreign
partner for reviving ZISCO, and there have been ongoing discussions and an on-off
relationship between the parties since that time. Major investment and refurbishment is
required to make the project operational and profitable once again, but all indications are
that it is quite feasible to do so and the go-ahead appears to be directly related to political
will.
Zimbabwe has a need for more electricity and steel to redevelop the economy. It has the
required ingredients and has considerable interest in regenerating the steel production of the
past. Here is an industrial node that is ready to run as soon as government can sort out the
policy inconsistencies that have so-far stymied the development. With abundant coal, iron
chromium and nickel, Zimbabwe could be a significant regional supplier and exported of
steel and stainless steel.
The iron ore deposits in Zimbabwe lie far from each other and the coal too is not that close.
However, the area produced steel in the past and there is a huge potential to do so again. In
this growth pole only some of the larger coal deposits which are relatively close to the iron
ore at Ripple creek were considered (see Table 13), although others may equally be
included if this project moves to a second phase.
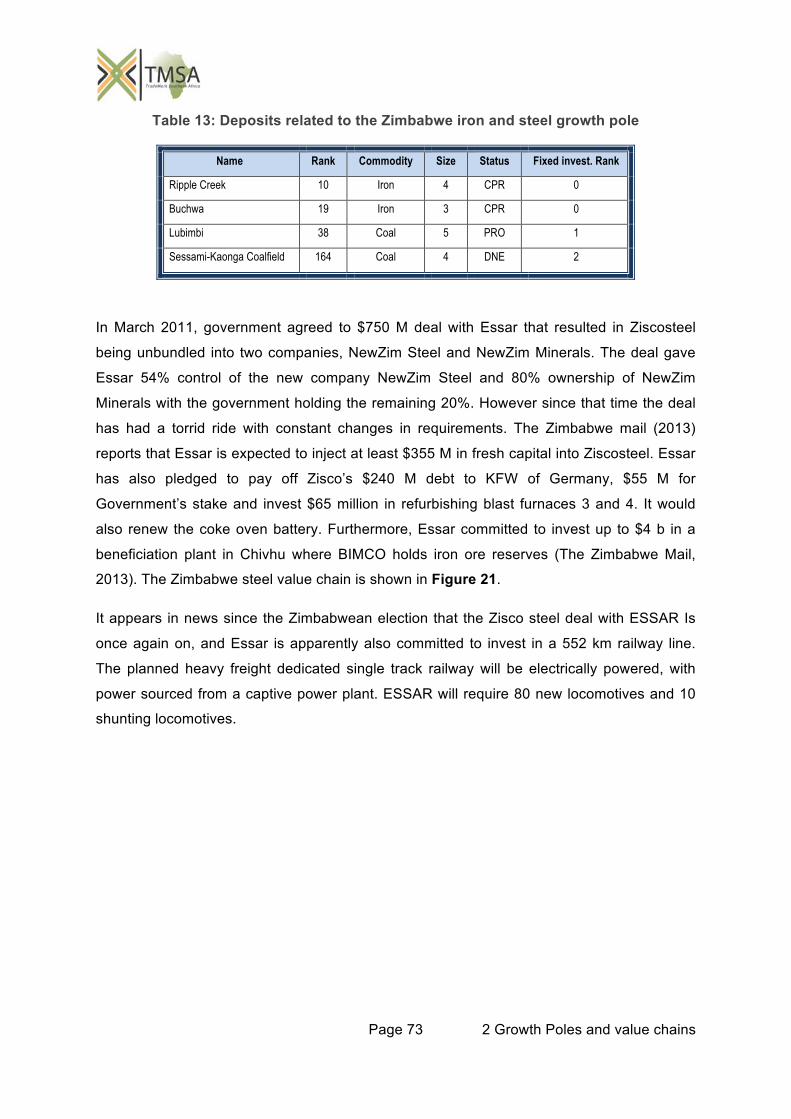
Page 73 2 Growth Poles and value chains
Table 13: Deposits related to the Zimbabwe iron and steel growth pole
Name Rank Commodity Size Status Fixed invest. Rank
Ripple Creek 10 Iron 4 CPR 0
Buchwa 19 Iron 3 CPR 0
Lubimbi 38 Coal 5 PRO 1
Sessami-Kaonga Coalfield 164 Coal 4 DNE 2
In March 2011, government agreed to $750 M deal with Essar that resulted in Ziscosteel
being unbundled into two companies, NewZim Steel and NewZim Minerals. The deal gave
Essar 54% control of the new company NewZim Steel and 80% ownership of NewZim
Minerals with the government holding the remaining 20%. However since that time the deal
has had a torrid ride with constant changes in requirements. The Zimbabwe mail (2013)
reports that Essar is expected to inject at least $355 M in fresh capital into Ziscosteel. Essar
has also pledged to pay off Zisco’s $240 M debt to KFW of Germany, $55 M for
Government’s stake and invest $65 million in refurbishing blast furnaces 3 and 4. It would
also renew the coke oven battery. Furthermore, Essar committed to invest up to $4 b in a
beneficiation plant in Chivhu where BIMCO holds iron ore reserves (The Zimbabwe Mail,
2013). The Zimbabwe steel value chain is shown in Figure 21.
It appears in news since the Zimbabwean election that the Zisco steel deal with ESSAR Is
once again on, and Essar is apparently also committed to invest in a 552 km railway line.
The planned heavy freight dedicated single track railway will be electrically powered, with
power sourced from a captive power plant. ESSAR will require 80 new locomotives and 10
shunting locomotives.
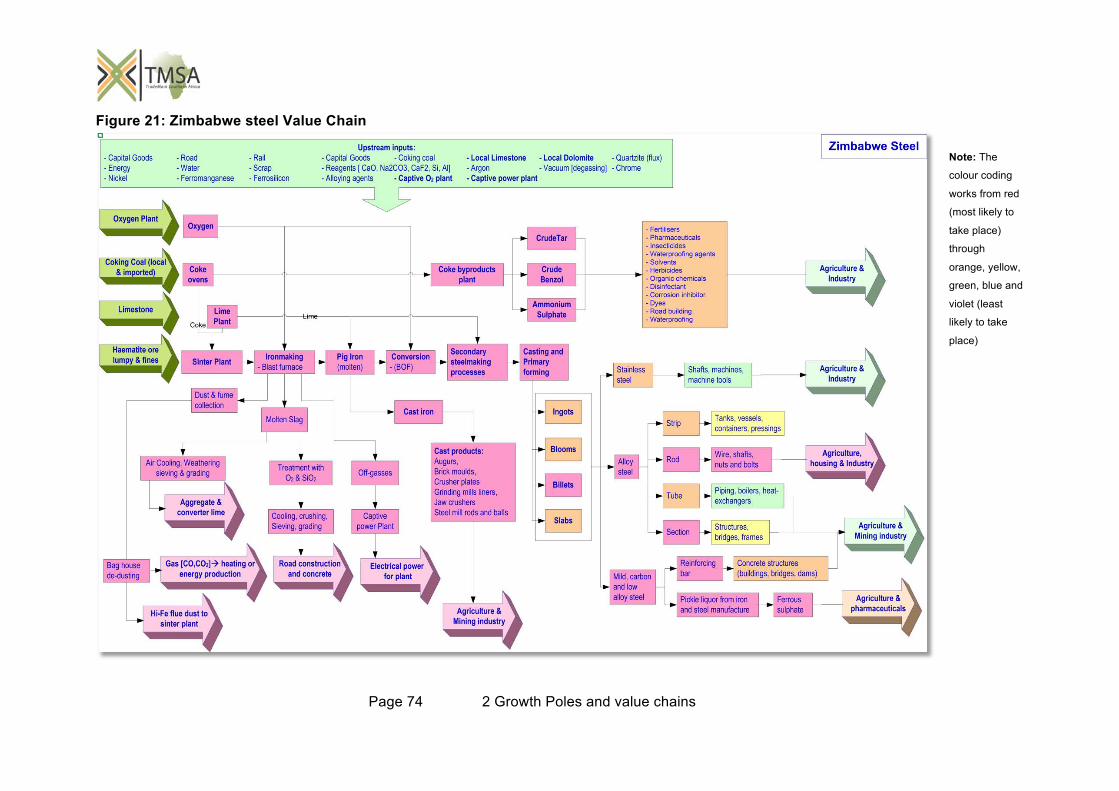
Page 74 2 Growth Poles and value chains
Figure 21: Zimbabwe steel Value Chain
Note: The
colour coding
works from red
(most likely to
take place)
through
orange, yellow,
green, blue and
violet (least
likely to take
place)
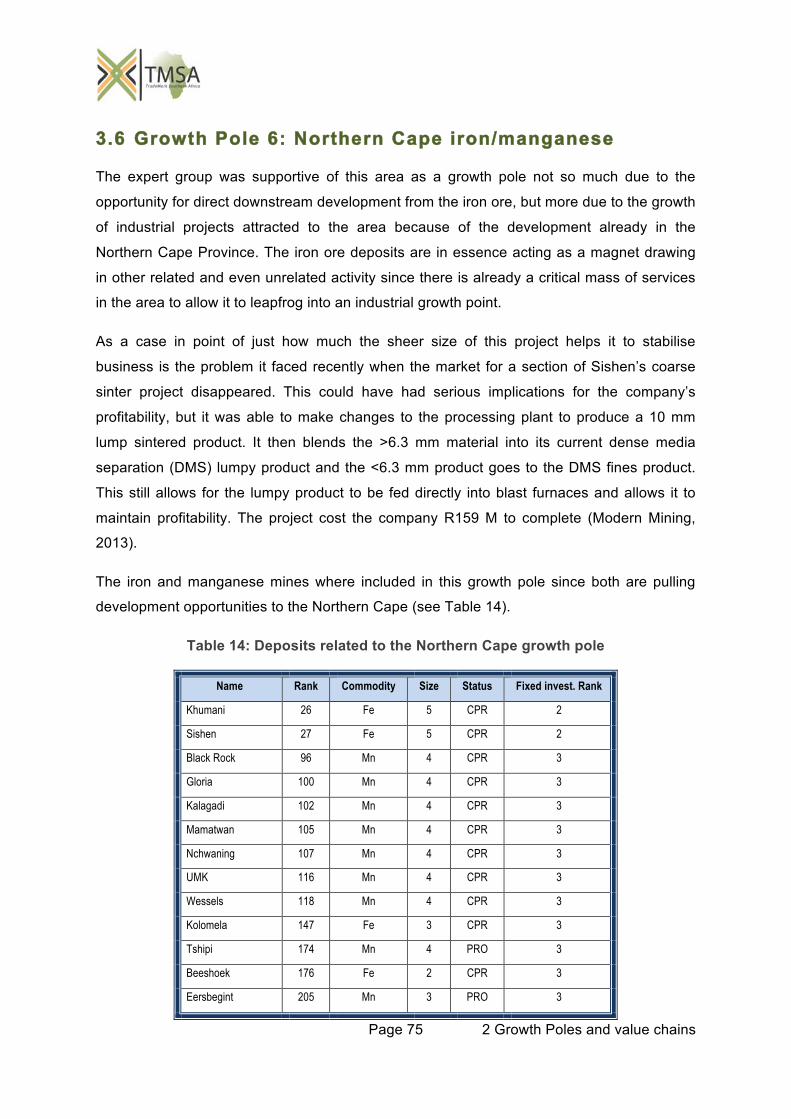
Page 75 2 Growth Poles and value chains
3.6 Growth Pole 6: Northern Cape iron/manganese
The expert group was supportive of this area as a growth pole not so much due to the
opportunity for direct downstream development from the iron ore, but more due to the growth
of industrial projects attracted to the area because of the development already in the
Northern Cape Province. The iron ore deposits are in essence acting as a magnet drawing
in other related and even unrelated activity since there is already a critical mass of services
in the area to allow it to leapfrog into an industrial growth point.
As a case in point of just how much the sheer size of this project helps it to stabilise
business is the problem it faced recently when the market for a section of Sishen’s coarse
sinter project disappeared. This could have had serious implications for the company’s
profitability, but it was able to make changes to the processing plant to produce a 10 mm
lump sintered product. It then blends the >6.3 mm material into its current dense media
separation (DMS) lumpy product and the <6.3 mm product goes to the DMS fines product.
This still allows for the lumpy product to be fed directly into blast furnaces and allows it to
maintain profitability. The project cost the company R159 M to complete (Modern Mining,
2013).
The iron and manganese mines where included in this growth pole since both are pulling
development opportunities to the Northern Cape (see Table 14).
Table 14: Deposits related to the Northern Cape growth pole
Name Rank Commodity Size Status Fixed invest. Rank
Khumani 26 Fe 5 CPR 2
Sishen 27 Fe 5 CPR 2
Black Rock 96 Mn 4 CPR 3
Gloria 100 Mn 4 CPR 3
Kalagadi 102 Mn 4 CPR 3
Mamatwan 105 Mn 4 CPR 3
Nchwaning 107 Mn 4 CPR 3
UMK 116 Mn 4 CPR 3
Wessels 118 Mn 4 CPR 3
Kolomela 147 Fe 3 CPR 3
Tshipi 174 Mn 4 PRO 3
Beeshoek 176 Fe 2 CPR 3
Eersbegint 205 Mn 3 PRO 3
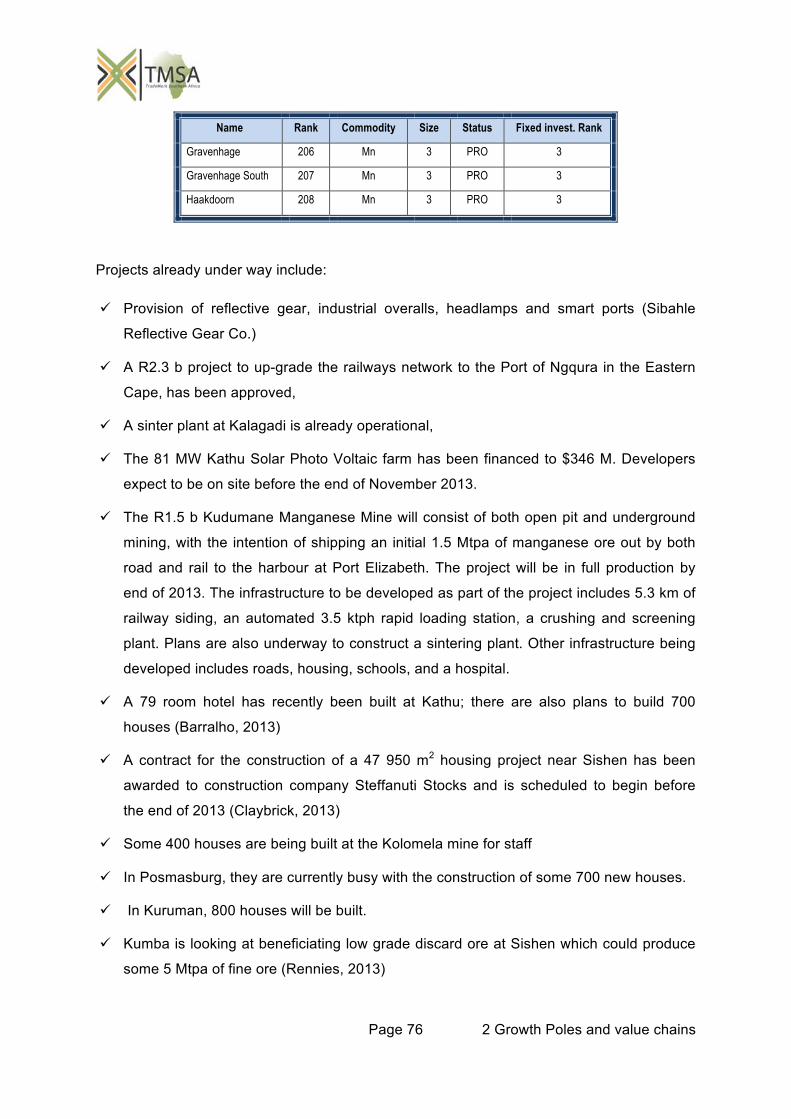
Page 76 2 Growth Poles and value chains
Name Rank Commodity Size Status Fixed invest. Rank
Gravenhage 206 Mn 3 PRO 3
Gravenhage South 207 Mn 3 PRO 3
Haakdoorn 208 Mn 3 PRO 3
Projects already under way include:
Provision of reflective gear, industrial overalls, headlamps and smart ports (Sibahle
Reflective Gear Co.)
A R2.3 b project to up-grade the railways network to the Port of Ngqura in the Eastern
Cape, has been approved,
A sinter plant at Kalagadi is already operational,
The 81 MW Kathu Solar Photo Voltaic farm has been financed to $346 M. Developers
expect to be on site before the end of November 2013.
The R1.5 b Kudumane Manganese Mine will consist of both open pit and underground
mining, with the intention of shipping an initial 1.5 Mtpa of manganese ore out by both
road and rail to the harbour at Port Elizabeth. The project will be in full production by
end of 2013. The infrastructure to be developed as part of the project includes 5.3 km of
railway siding, an automated 3.5 ktph rapid loading station, a crushing and screening
plant. Plans are also underway to construct a sintering plant. Other infrastructure being
developed includes roads, housing, schools, and a hospital.
A 79 room hotel has recently been built at Kathu; there are also plans to build 700
houses (Barralho, 2013)
A contract for the construction of a 47 950 m2 housing project near Sishen has been
awarded to construction company Steffanuti Stocks and is scheduled to begin before
the end of 2013 (Claybrick, 2013)
Some 400 houses are being built at the Kolomela mine for staff
In Posmasburg, they are currently busy with the construction of some 700 new houses.
In Kuruman, 800 houses will be built.
Kumba is looking at beneficiating low grade discard ore at Sishen which could produce
some 5 Mtpa of fine ore (Rennies, 2013)
Page 77 2 Growth Poles and value chains
Assmang has an expansion project at the Khumani mine. The mine which is a 10 Mtpa
facility will be expanded to a 16 Mtpa. Of the 6 Mt, some 4 Mt will be exported and 2Mt
will be for the domestic market (Rennies, 2013)
The Kolomela mine owned by Kumba will produce at its designed capacity of 9 Mtpa
during this year. Consideration is being given to expanding production by a further
6 Mtpa (Rennies, 2013)
Diro Resources has contracted the supply of a 200 tph dense-medium separation plant
to beneficiate iron ore at its Kathu mine.
Manganese slag is currently classified as waste in South Africa, but elsewhere in the world it
is utilised in the production of bricks and cement as well as being used for road building. The
classification is currently up for review in parliament and if approved will mean that a waste
stream becomes a valuable co-product which will also assist in the demand for inputs into
the buildings currently being planned in the area.
No value chain is shown here since it appears unlikely that there will be any further
downstream activity in the area to develop industry based directly on the mining activities,
and that the growth pole effect of the area is more due to what has already happened in the
past, and the massive size of the deposits in this area.
3.7 Growth pole 7: Songo-Songo Central Tanzania
Although the Mkuranga deposit occurs far to the north of the Songo Songo and Kiliwani
deposits, it was included with them since it is also a gas deposit and is likely to have a
similar future (see Table 15). The Songo Songo gas field has been developed to generate
electricity and is connected to the national grid.
The Songo Songo gas field, located on and around Songo Songo Island, was discovered in
1974. A plant on the island serves two onshore and three offshore natural gas wells. The
gas processing plant and pipelines were built and are owned by Songas Ltd. and the gas
plant and wells are operated on its behalf by PanAfrican Energy Tanzania Ltd, a local
subsidiary of Orca Exploration Group Inc.
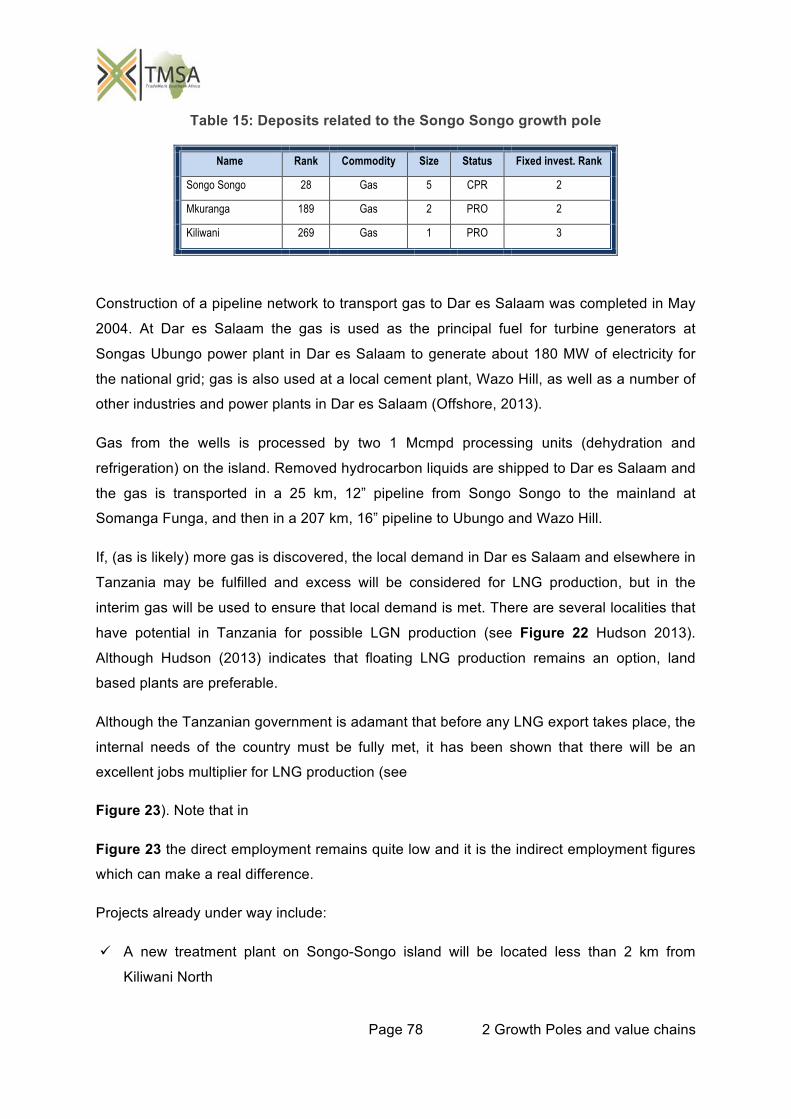
Page 78 2 Growth Poles and value chains
Table 15: Deposits related to the Songo Songo growth pole
Name Rank Commodity Size Status Fixed invest. Rank
Songo Songo 28 Gas 5 CPR 2
Mkuranga 189 Gas 2 PRO 2
Kiliwani 269 Gas 1 PRO 3
Construction of a pipeline network to transport gas to Dar es Salaam was completed in May
2004. At Dar es Salaam the gas is used as the principal fuel for turbine generators at
Songas Ubungo power plant in Dar es Salaam to generate about 180 MW of electricity for
the national grid; gas is also used at a local cement plant, Wazo Hill, as well as a number of
other industries and power plants in Dar es Salaam (Offshore, 2013).
Gas from the wells is processed by two 1 Mcmpd processing units (dehydration and
refrigeration) on the island. Removed hydrocarbon liquids are shipped to Dar es Salaam and
the gas is transported in a 25 km, 12” pipeline from Songo Songo to the mainland at
Somanga Funga, and then in a 207 km, 16” pipeline to Ubungo and Wazo Hill.
If, (as is likely) more gas is discovered, the local demand in Dar es Salaam and elsewhere in
Tanzania may be fulfilled and excess will be considered for LNG production, but in the
interim gas will be used to ensure that local demand is met. There are several localities that
have potential in Tanzania for possible LGN production (see Figure 22 Hudson 2013).
Although Hudson (2013) indicates that floating LNG production remains an option, land
based plants are preferable.
Although the Tanzanian government is adamant that before any LNG export takes place, the
internal needs of the country must be fully met, it has been shown that there will be an
excellent jobs multiplier for LNG production (see
Figure 23). Note that in
Figure 23 the direct employment remains quite low and it is the indirect employment figures
which can make a real difference.
Projects already under way include:
A new treatment plant on Songo-Songo island will be located less than 2 km from
Kiliwani North
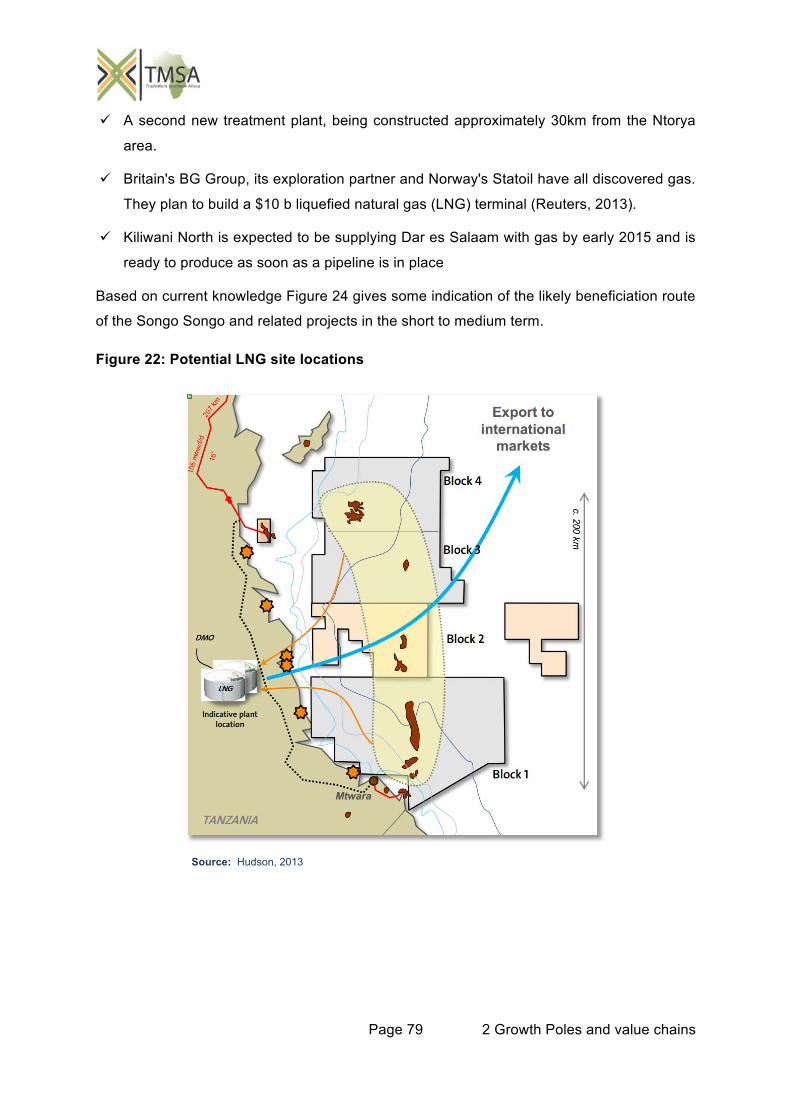
Page 79 2 Growth Poles and value chains
A second new treatment plant, being constructed approximately 30km from the Ntorya
area.
Britain's BG Group, its exploration partner and Norway's Statoil have all discovered gas.
They plan to build a $10 b liquefied natural gas (LNG) terminal (Reuters, 2013).
Kiliwani North is expected to be supplying Dar es Salaam with gas by early 2015 and is
ready to produce as soon as a pipeline is in place
Based on current knowledge Figure 24 gives some indication of the likely beneficiation route
of the Songo Songo and related projects in the short to medium term.
Figure 22: Potential LNG site locations
Source: Hudson, 2013
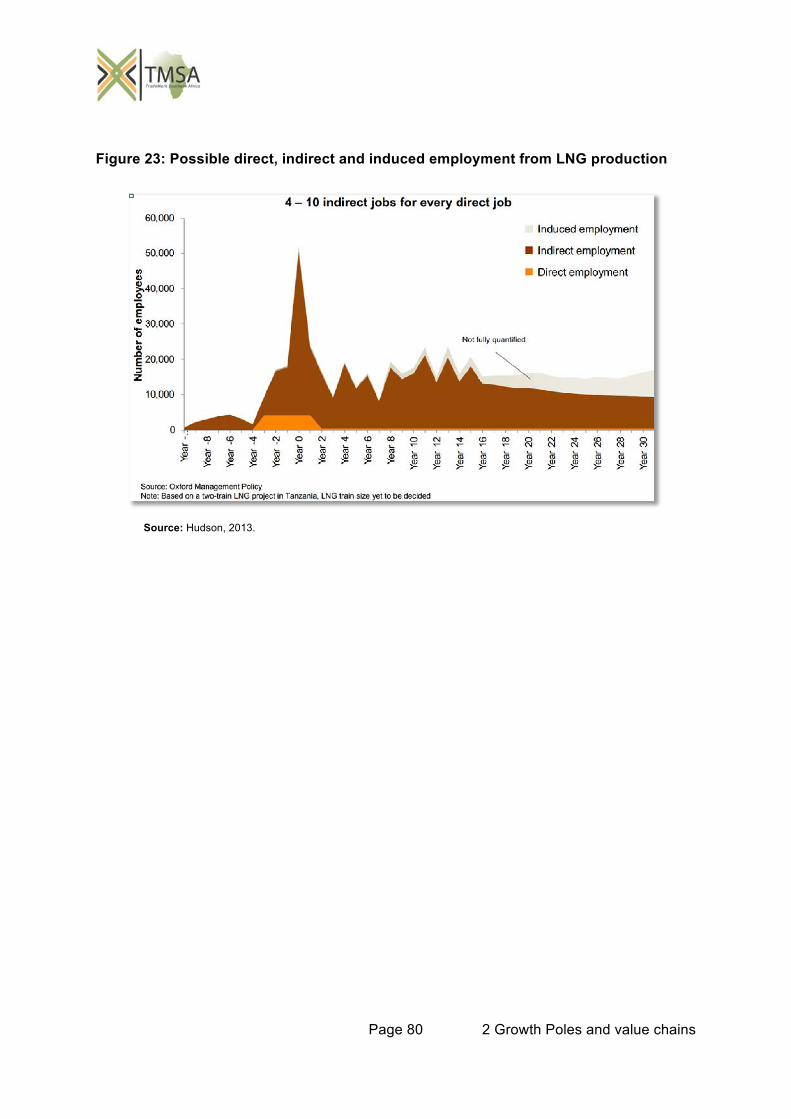
Page 80 2 Growth Poles and value chains
Figure 23: Possible direct, indirect and induced employment from LNG production
Source: Hudson, 2013.
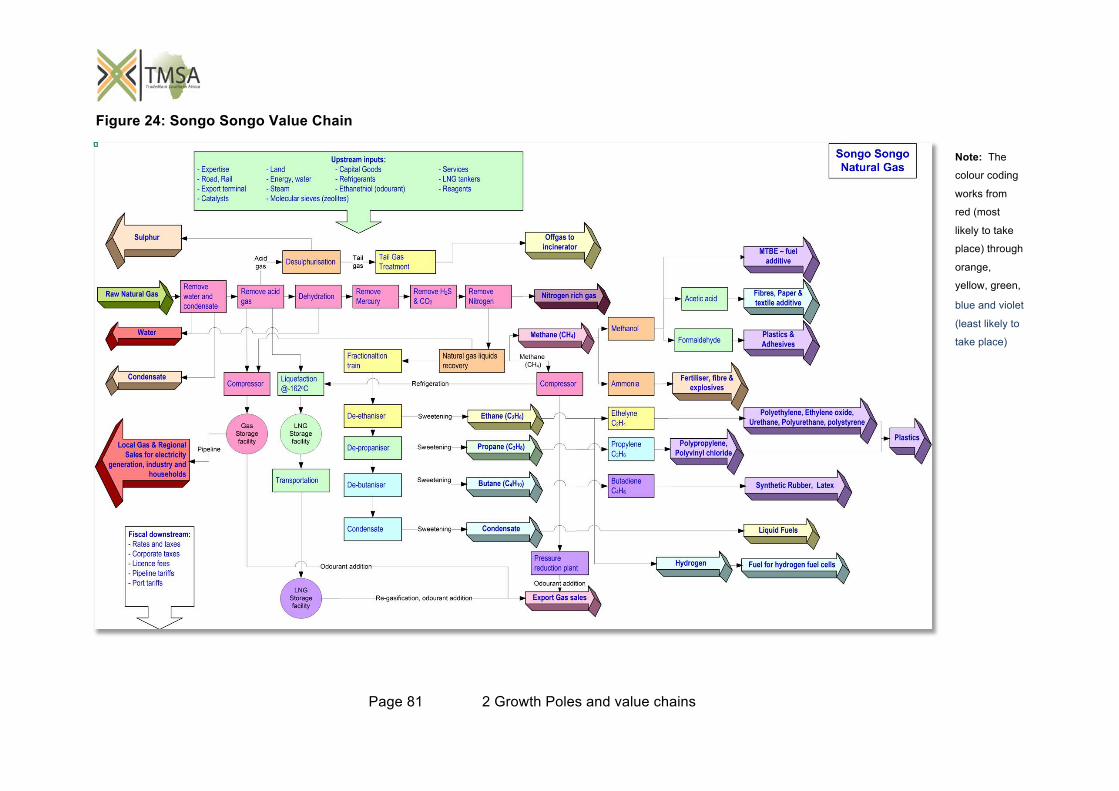
Page 81 2 Growth Poles and value chains
Figure 24: Songo Songo Value Chain
Note: The
colour coding
works from
red (most
likely to take
place) through
orange,
yellow, green,
blue and violet
(least likely to
take place)
Page 82 2 Growth Poles and value chains
3.8 Growth Pole 8: Cabinda / Bas Congo DRC Oil / Phosphate
The phosphate deposits in Cabinda and Bas Congo are large and will almost certainly be
mined within the next few years. Taking these to high value fertilisers will be dependent on
both political will as well as the provision of power and the required inputs. The production of
nitrogenous fertilisers will also be possible due to the large oil and gas deposits in the area.
The Cacata deposit is in the Nhenha river valley, some 60 km east of Cabinda City. The
Cacata area has an indicated resource of 30.4 Mt at 17.2% P2O5. Although Originally
Minbos intended to start small scale mining at Kanzi in the DRC first whilst still working on
the opening of their major minie at Cacata (then leaving most of the Kanzi deposit for later
development) they have now decided to divest from the DRC phosphate deposits and
concentrate on opening up Cacata by the end of 2015. The Cacata mine should be able to
support a large scale phosphate rock complex producing about 1.25 Mtpa over 10 years
LOM. It will be an open-pit operation with a conventional beneficiation process to produce a
35% P2O5 product (Minbos, 2012). Ideally the process can be taken further downstream to
produce phosphoric acid, and then together with the possible addition of ammonia from the
hydrocarbons industry (Soyo natural gas plant) all the way to complete fertilisers (see
Figure 25). To do this sources of sulphuric acid (or sulphur) and potassium must be found or
they must be imported.
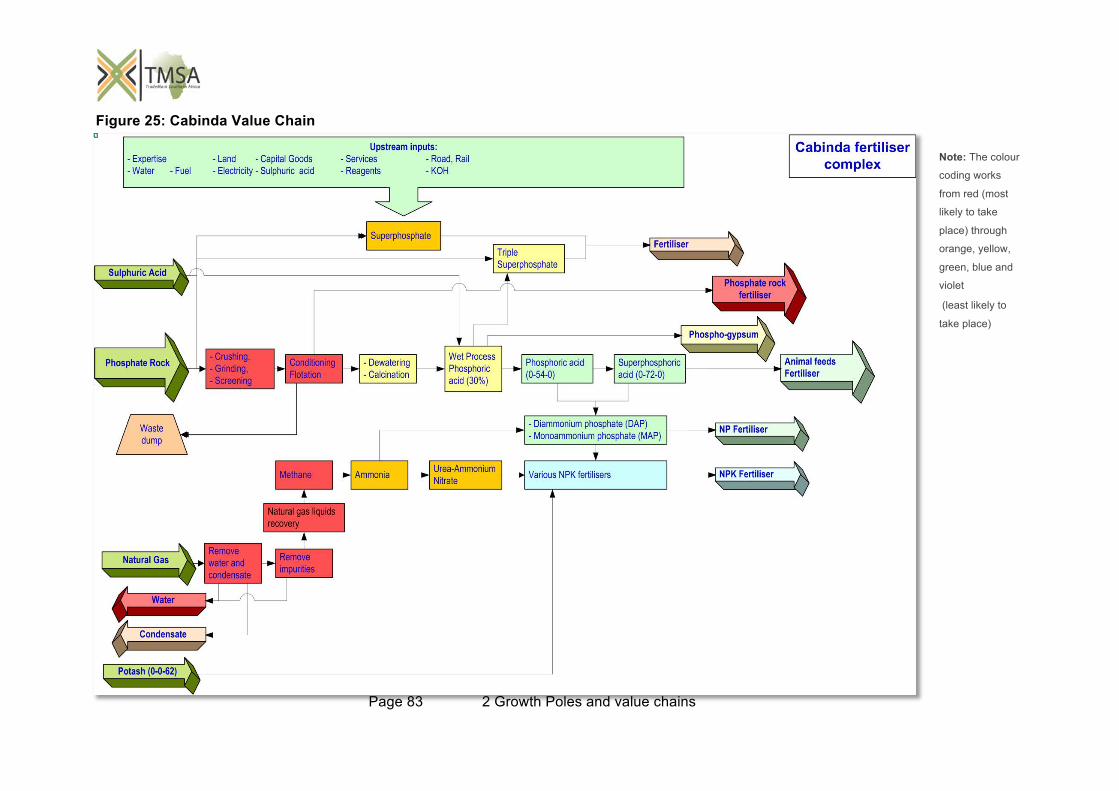
Page 83 2 Growth Poles and value chains
Figure 25: Cabinda Value Chain
Note: The colour
coding works
from red (most
likely to take
place) through
orange, yellow,
green, blue and
violet
(least likely to
take place)
Page 84 2 Growth Poles and value chains
3.9 Growth pole 9: Kabanga / Burundi nickel growth pole
The huge deposits of nickel in Burundi and Tanzania represent more than 10% of the
worlds’ nickel resource and remain untouched. A large part of the problem was that the
resources have been relatively recently discovered, they are far inland and there is a serious
power shortage in the area. The power shortage looks like it may soon be dealt with – at
least to some extent and the rail has been planned for some time. Again one thing leads to
another, and already the interest in the area for other minerals is increasing. Just recently for
example rainbow minerals announced that it hoped to start mining the Gakara rare earth
deposit in 2015.
The potential for an extensive nickel region in Tanzania and Burundi makes it imperative that
opportunities for shared infrastructure are investigated and implemented. For example, the
Kabanga concentrate is likely to be shipped to Dar es Salaam via existing road and rail
(Lindsay 2007). The project would benefit from a purpose built railway line, however, with
an expected 200 ktpa concentrate from Kabanga, would not, in itself, provide sufficient cargo
to support a railroad (Callaghan and Spicer, 2008). The development of rail from
Dar es Salaam all the way to Musongati where the other major nickel deposit in the area
exists, is still in process. The African Development bank (AfDB) closed a call for consulting
services on the railway in August 2013. The project entails the construction of two new lines
(Kigali to Isaka and Gitega and Musongati to Isaka), the rehabilitation of the existing Isaka to
Dar Es Salaam line and the acquisition of rolling stock to carry passengers, cargo and ore
traffic. The total expected cost will be $9.4 b.
In 2008 Callaghan and Spicer indicated that the earliest production from Musongati
(assuming quick resolution of the legal issues between the exploration company and
government) would be 2014-2016. In a recent report it was indicated that mining would
begin in 2014 by Burundi Mining Metallurgy Ltd. (Bloomberg, 2013). Metal Bulletin (2013)
reported that Burundi Mining Metallurgy Ltd had received a concession to start building a 75
kW hydropower plant to provide electricity for the Musongati nickel project.
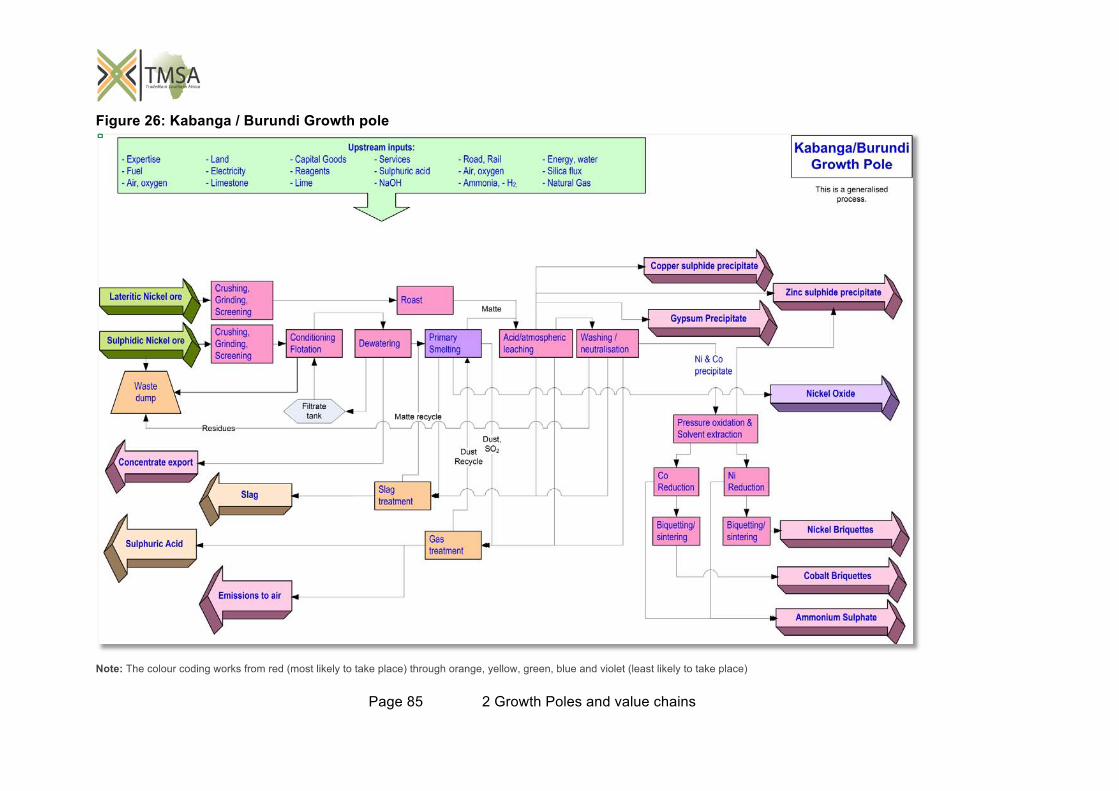
Page 85 2 Growth Poles and value chains
Figure 26: Kabanga / Burundi Growth pole
Note: The colour coding works from red (most likely to take place) through orange, yellow, green, blue and violet (least likely to take place)
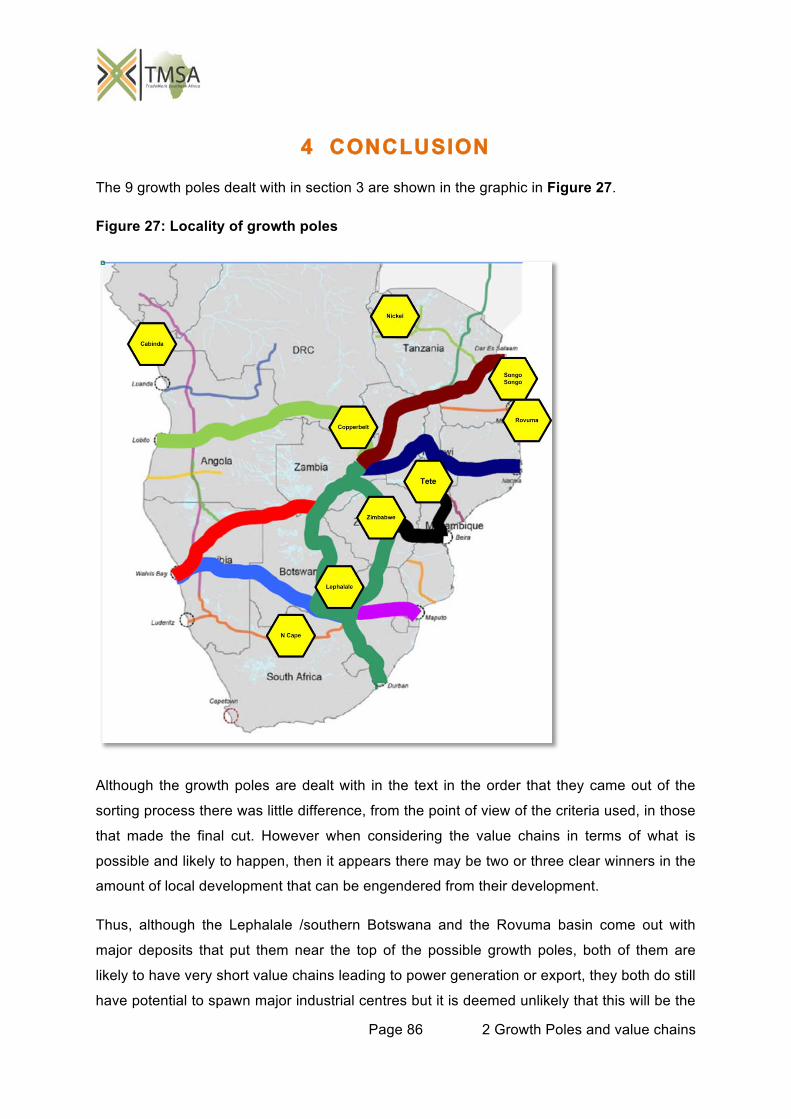
Page 86 2 Growth Poles and value chains
4 CONCLUSION
The 9 growth poles dealt with in section 3 are shown in the graphic in Figure 27.
Figure 27: Locality of growth poles
Although the growth poles are dealt with in the text in the order that they came out of the
sorting process there was little difference, from the point of view of the criteria used, in those
that made the final cut. However when considering the value chains in terms of what is
possible and likely to happen, then it appears there may be two or three clear winners in the
amount of local development that can be engendered from their development.
Thus, although the Lephalale /southern Botswana and the Rovuma basin come out with
major deposits that put them near the top of the possible growth poles, both of them are
likely to have very short value chains leading to power generation or export, they both do still
have potential to spawn major industrial centres but it is deemed unlikely that this will be the
Page 87 2 Growth Poles and value chains
case. In the case of both most of the value addition may in fact happen at some point
distant to the deposit, even if it does happen in the region. Coal from the Lephalale and
southern Botswana may be converted locally into electricity to support industry at a distance
but a large portion of it is likely to be transported to other power stations mainly in South
Africa, or exported out of the region. Gas remaining in the region from the Rovuma gas fields
will be piped to offtakers in southern Mozambique and in South Africa, where industrial
development may be supported by the availability of the gas.
Tete, the Copperbelt and the Zimbabwe iron and steel complex however all have very strong
cases for the development of significant industrial growth poles within the region in the
medium term and with political will and the availability of sufficient capital these are areas
that are considered to have the strongest cases to be taken further in the second stage of
development towards the development of a strong business case to provide the required
capital incentives to stimulate the development and ensure its success.
In the case of the northern Cape and Songo Songo, the development is already somewhat
advanced, and neither is considered here to have huge potential for on-site development
directly related to the mineral commodity, although in both cases it is considered that the
ongoing development can certainly trace its roots to the initial mineral commodity stimulus.
The Cabinda/Bas Congo growth pole is already established in regard to the hydrocarbons,
and the development of the phosphates is not yet confirmed although there are positive
signs. In the case of the Nickel at Kabanga and in Burundi, this is a very exciting area of
development but it remains to be seen if the nickel from Kabanga will be fully processed
locally (unlikely) and when the Burundi operations will actually go ahead, since there are still
several hurdles to leap before production. Both of these projects should perhaps be seen
more in the view of medium to long term growth poles.
Page 88 2 Growth Poles and value chains
References
African Review, 2013. Construction underway on second Mopani acid plant. 10 September
2013. Accessed 17 September 2013. http://www.africanreview.com/construction-a-
mining/buildings/construction-underway-for-us-160mn-mopani-acid-plant
Alves AC, 2011. The Zambia-China Cooperation Zone at a crossroads: What now? Policy
Briefing 41. China Africa project. December 2011. 4p.
Arcticgas, 2013. Anadarko estimates Mozambique LNG cost at $25 - $30 billion. 3
September 2013. http://www.arcticgas.gov/2013/anadarko-estimates-mozambique-
lng-cost-25-30-billion
Bhatia US, 2013. The globalization of supply chains: policy challenges for developing
countries. In: Global value chains in a changing world. Edited by Deborah K. Elms
and Patrick Low. Fung Global Institute (FGI), Nanyang Technological University
(NTU), and World Trade Organization (WTO), 2013. ISBN: 978-92-870-3882-1
Bloomberg, 2013. Burundi to Start Nickel Production Next Year, 35 Years After Its
Discovery. Accessed 11 September 2013. http://str8talkchronicles.com/?p=37817
Boasen Z, 2013. To build the most favourable Investment Platform in Africa. ZCCZ.
presentation
Borralho C, 2013. Iron-ore mining sprouts developments in Kathu. Accessed 17 September
2013. http://www.miningweekly.com/article/housing-developments-in-kathu-2013-07-
26
Callaghan C and Spicer D, 2008. Nickel cluster strategy. Letlapa Consulting. 244 p.
Claybrick, 2013. Clay Brick Specified for Mine Housing in the N Cape. 12 February, 2013.
http://www.claybrick.org/content/clay-brick-specified-mine-housing-n-cape
Accessed 17 September 2013.
Creamer, M. 2013. Botswana, South Africa coal line link on way – Transnet. 8 May 2013.
Mining weekly.
Creamer, T. 2013. Export-led growth strategies no longer 'viable', Unctad asserts.
Engineering news, 12 September 2013. Accessed 17 September 2013.
Page 89 2 Growth Poles and value chains
Creamer, T. 2013a. Transnet moves on plan to build heavy-haul manganese corridor to
Coega. 21 May 2013. http://www.miningweekly.com/article/transnet-moves-on-plan-
to-build-heavy-haul-manganese-corridor-to-coega-2013-05-21
EIA, 2013. Mozambique. http://www.eia.gov/countries/country-data.cfm?fips=MZ#ng
Elmquist S, 2013. Shale-gas revolution spurs wave of new U.S. steel plants: Energy.
Bloomberg. 1 January 2013. Accessed 5 September 2013.
http://www.bloomberg.com/news/2012-12-31/shale-gas-revolution-spurs-wave-of-
new-u-s-steel-plants-energy.html
Goonan TG, 2004. Flows of Selected Materials Associated with World Copper Smelting.
USGS open file report 2004-1395. 138p.
Grant Thornton, 2013. Focus on: South Africa. International business report 2013 –
Economy focus series. Accessed 10 Sept 2013.
http://www.internationalbusinessreport.com/files/ibr2013%20-
%20south%20africa%20focus_final.pdf
Hudson D, 2013. East Africa: Opportunities and Challenges for LNG in a New Frontier
Region. 16 April 2013. 17th international conference & exhibition On liquefied natural
gas (LNG 17).
JFE, 2013. JFE 21st Century foundation. Accessed 9 August 2013. http://www.jfe-21st-
cf.or.jp/chapter_2/2i_1.html
Kolver L, 2013. Emerging economies using industrial policy to target development.
Engineering News. 9 Sept 2013. Accessed 10 Sept. 2013.
Ledesma D, 2013. East Africa Gas – Potential for export. NG 74. Oxford Institute for Energy
Studies. 41p.
Lindsay C, 2007. Kabanga Nickel Project. Presented to Canada-Africa Mining Procurement
Seminar, Montreal, May 2, 2007. Kabanga Nickel Company Ltd.
Lopes C, 2013. Global Value Chains: Africa, the factory floor of the world?
http://www.uneca.org/es-blog/global-value-chains-africa-factory-floor-
world#.UiIFupIwdQS
Page 90 2 Growth Poles and value chains
Macuahub, 2013. Four more coal mining projects due to be launched in Mozambique. 5
Sept 2013. http://www.macauhub.com.mo/en/2013/09/05/four-more-coal-mining-
projects-due-to-be-launched-in-mozambique/ Accessed 10 Sept 2013.
Maia J 2013. The interface between mining and manufacturing in South Africa: The context.
Presentation. 22 August 2013. Interface between Mining and Manufacturing
conference. IDC, Sandton.
Mavuso Z, 2013. Zambia’s economy set to grow by 8.1% in the next few years. 13th
September 2013. http://www.miningweekly.com/article/zambias-economy-set-to-
grow-by-81-in-the-next-few-years-2013-09-13 Accessed 17 September 2013.
Modern Mining, 2013. Innovative upgrade to Sishen processing plant. 4 Sept. 2013.
http://www.crown.co.za/reader/modernmining/2013/August/index.php#18/z Accessed
Msuya P, 2013. Overview of Tanzania Gas Market and Role of EWURA. 13 August 2013.
http://www.naruc.org/international/Documents/NARUC%20%20Presentation%20-
Gas%20%20Market%20Overvie.pdf
Moolman S, 2013. Feasibility study under way for $5bn Mozambique gas pipeline. 20
September 2013. http://www.engineeringnews.co.za/article/feasibility-study-under-
way-for-5-billion-moz-based-gas-pipeline-2013-09-20
Mulikelela M, 2013. Zambia 74,000 jobs safe. Times of Zambia 9 July 2013.
Muronzi C, 2013. Zimbabwe: Essar Africa and Zimbabwe seal Ziscosteel deal. Zimbabwe
Independent. http://allafrica.com/stories/201309061418.html
Norasethasopon S and Yoshida K, 2003. Influence of an inclusion on multi-pass Copper
shaped-wire drawing by 2d finite element analysis. IJE Transactions B: Applications
Vol. 16, No. 3, October 2003. Pp279-292. www.DID.ir
Nvunga A, 2013. Potential revenues from Rovuma: Implications of the 2006 Contracts for
Government Income. Centro De Integridade Pública Moçambique. 12p.
Odendaal N, 2013. Waterberg opens up to Exxaro as Transnet expansion gains traction.
http://www.miningweekly.com/article/waterberg-opens-up-to-exxaro-as-transnet-
expansion-gains-traction-2013-08-22. Accessed 17 September 2013.
Page 91 2 Growth Poles and value chains
Offshore, 2013. Songo Songo Gas Development and Power-Generation Project, Tanzania.
http://www.offshore-technology.com/projects/songosongo/. Accessed 18 September
2013.
Oilcouncil, 2013. Executive interview with Bob McBean, Executive Chairman, Wentworth
Resources. http://www.oilcouncil.com/executive_interviews/bob_mcbean Accessed
17 September 2013.
Rennies, 2013. Developments in SA Aug 13. Accessed 17 September 2013.
http://www.rsagency.co.za/developments-in-sa-aug-13/
Resenfeld D, 2012. The coal mining sector in Mozambique: a simple mode of predicting
government revenue. Conference Paper nº 19. III Conferência Internacional do Iese
“Moçambique: Acumulação e Transformação em Contexto de Crise Internacional” (4
& 5 de Setembro de 2012).
http://www.iese.ac.mz/lib/publication/III_Conf2012/IESE_IIIConf_Paper19.pdf
Reuters, 2013. Tanzania wants energy firms to speed up gas production. 9th July 2013,
Accessed on 10 July 2013. Mining Weekly
Risch C, Sowards K, and Copley AK, 2013. Value Added Opportunities from Natural Gas.
Vision Shared. May 2013 45p. Accessed 5 September 2013.
http://www.visionshared.com/shale/pdf/Value%20Added%20Opportunities%20from%
20Natural%20Gas%20FINAL%205%2014%2013.pdf
Sheldrick A, 2013. Andarko expects to sign Mozambique gas agreement this year. 10
September 2013. Livemint.com
Taylor, J. 2013. Kenya-Uganda leg of larger power transmission project under way.
Engineering news.
The Zimbabwe Mail, 2013. Ziscosteel Disposal On Track. 17 September 2013.
http://www.thezimbabwemail.com/business/18110-ziscosteel-disposal-on-track.html
Worldbank, 2011. What is the potential for more copper fabrication in Zambia? 12p.
Zacks, 2013. ABB to Power Africa's Copper Mine. Zacks Equity Research | Zacks – Mon,
Aug 19, 2013. Accessed 18 September 2013. http://finance.yahoo.com/news/abb-
power-africas-copper-mine-160002210.html
Appendixes Page 92
APPENDIX A ENERGY CONTENT
The energy content of natural gas is variable dependent on the content of the gas but various references give a content of between 34.6 and
38.3 MJ per m3. This equates to about 9.6-10.6 kWh. A simple rule of thumb conversion of 10 kWh per m3 of natural gas is therefore
reasonable, although probably a slight underestimation.
Appendixes Page 93
APPENDIX B IRON AND STEEL VALUE CHAIN
Just as there are many ways to look at generic value chains so equally when one considers specific value chains. Furthermore each step from
in the simplified value chain in Figure 11 will be the core of its own chain of value growth.
More detailed value chains are given for the iron and steel industry for the steps marked A through to F in Figure 11. These still remain generic
since they speak to broader processes. Since each mineral occurrence is unique, there would also be a unique set of circumstances
surrounding the deposit and it value addition alternatives and as such a value chain for a particular operation will itself be unique, but will
remain broadly in line with the generic value chains given here. Beyond stage F the value chains become too diverse to deal with in this
overview and would require far more detailed study.
Appendix B.1 Exploration and discovery
Exploration is generally undertaken to fulfil a need. There is no sense in the cost and effort of exploration if there is unlikely to be a good
demand and a profit to be made if, and when, a commercial deposit is discovered. Before exploration can take place it is necessary to ensure
that the exploration company has the rights to explore for that mineral (or group of minerals) in the specified area (see Figure 28). Obtaining
such a licence would generally require the services of administration staff, lawyers, geologists, hydrologists and environmental scientists.
Geologists in co-operation with remote sensing specialists will advise the company on the most suitable areas to consider for the exploration
program based on current knowledge of the area and available maps and remote sensing data. In some cases reconstruction of possible
geological development of an area may present clues which are not available on maps. This may lead to the discovery of new areas of
metallogenesis. Reconstruction of this type may, for example, be based on new theories of crustal formation and movement. It is interesting
that although a certain amount of ground-proofing is required on location much of the services leading up to the development of a new project
can be delivered from remote locations.
Appendixes Page 94
Once the right to explore has been confirmed there is a variety of methodologies that can be used including remote sensing (aerial
photography, interpretation of satellite imagery, airborne ground penetrating radar), geophysics (airborne geophysical tests), mapping,
sampling, various field tests (geological, geochemical and geophysical). Much of this work will depend on the types of mineral deposit being
sought, the progress made, and the exploration budget.
Appendix B.2 Proving Discovery and Development
Once some degree of success has been had with early exploration the company may decide to give up areas that it now considers less
prospective to curtail costs and to concentrate on areas in which early indications of mineralisation have been found. Here more detailed
exploration and drilling will generally be undertaken to establish the size and grade of mineralisation present.
Where the deposit has the possibility of being of commercial size and grade, the company will generally establish a maiden resource (applying
the SAMREC of JORC code) and will announce this to shareholders. From this point it may still take several years (depending on the nature of
the deposit) to get to the point where a commercially viable reserve can be established. If the deposit is not up to the required standard, the
exploration company will generally give up the exploration rights and apply for others in an area that it still considers to be prospective.
However, if the deposit clearly meets the size and grade requirements for mining the company will begin mine planning (often in collaboration
with others). Although shown sequentially in Figure 29, the reserve estimation and initial mine planning goes hand in hand.
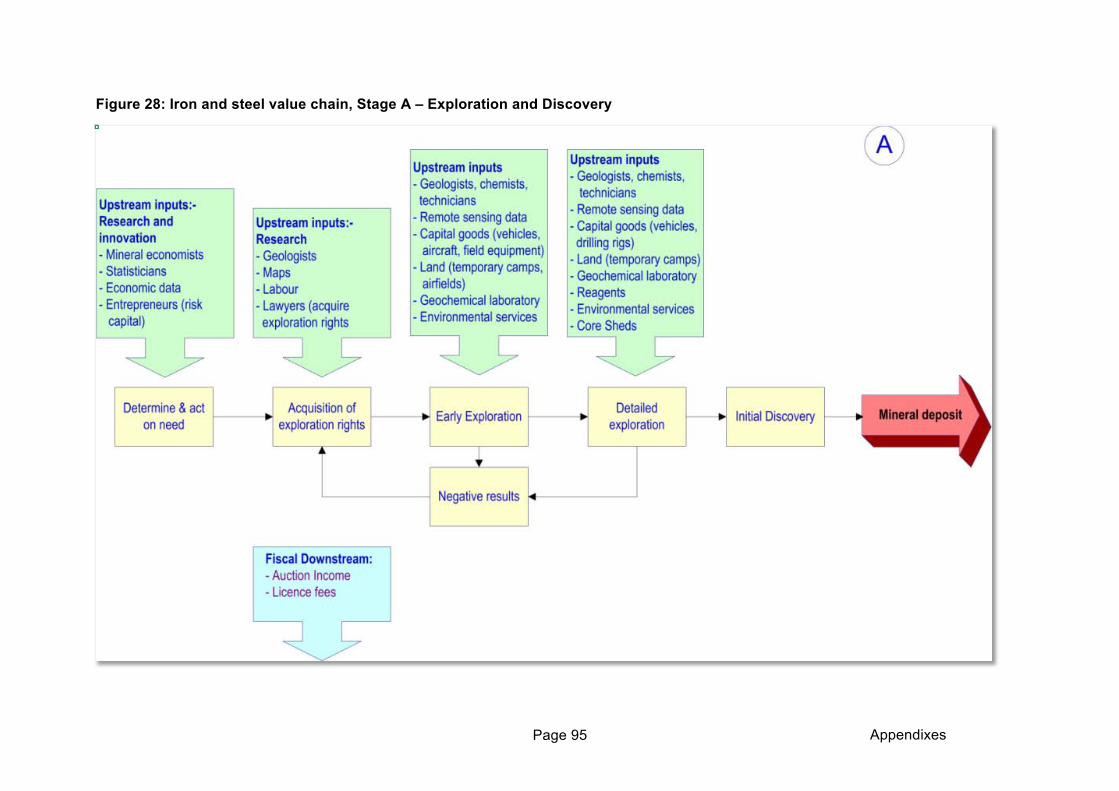
Appendixes Page 95
Figure 28: Iron and steel value chain, Stage A – Exploration and Discovery
Appendixes Page 96
Appendix B.3 Open Pit mining
Since most iron ore is produced in open pit mines, this is taken as the process for detailed analysis here.
Successful open pit mining is an exercise in planning and efficiency. It requires careful geological and geotechnical planning, a great deal of
attention to environmental and safety issues and careful scheduling of drilling, blasting, and earthmoving equipment. All equipment must be
retained in optimum working condition with regular on-site servicing and repair. Drilling, blasting and earthmoving equipment consumables and
spares must be carefully monitored and a sufficient inventory kept at all times. Constant monitoring of every aspect of the mining process with
feedback loops to ensure organised maintenance and process improvement aims to limit and reduce costs and improve the quality and quantity
of ore extracted in the safest, most efficient manner.
Each deposit will be mined by the method most suited to the size, shape and specific geological and geotechnical aspects of the deposit.
Once extracted material is generally crushed (often in-pit) before further treatment.
The sequence can be considered a cycle of events from drilling to hauling, each revolution of the cycle representing an increase in pit depth by
one bench (usually about 10 m).
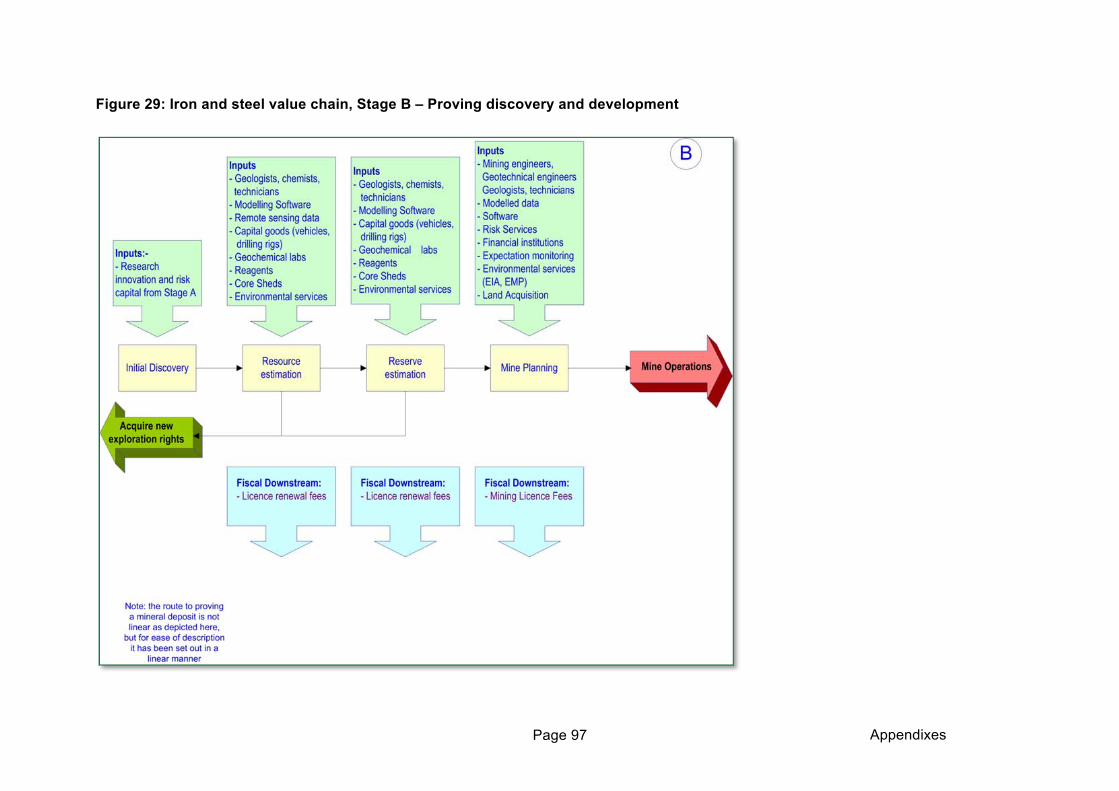
Appendixes Page 97
Figure 29: Iron and steel value chain, Stage B – Proving discovery and development
Appendixes Page 98
Appendix B.4 Concentration and extraction
When mining both the valuable mineral commodity as well as other material from the surrounding rock is collected and this must be separated
out. Furthermore, the blast rock will have a wide variety of particle sizes that cannot be easily dealt with unless it is first crushed. In the case of
magnetite deposits (see Figure 31) the valuable component tends to be fine grained and exists together with various silicates that it needs to be
separated from. Firstly it must be crushed then finely ground in a mill and followed by screening to a narrow range of particle sizes for feeding
into a set of magnetic separators which will extract the magnetic (magnetite) material from the non-magnetic (waste) material.
The resulting fine magnetite powder cannot be fed into a blast furnace as is and must first be made into pellets that can be large and heavy
enough to withstand the rigours of transport and the blast furnace process. Once suitable pellets have been produced they can be fed into a
blast furnace.
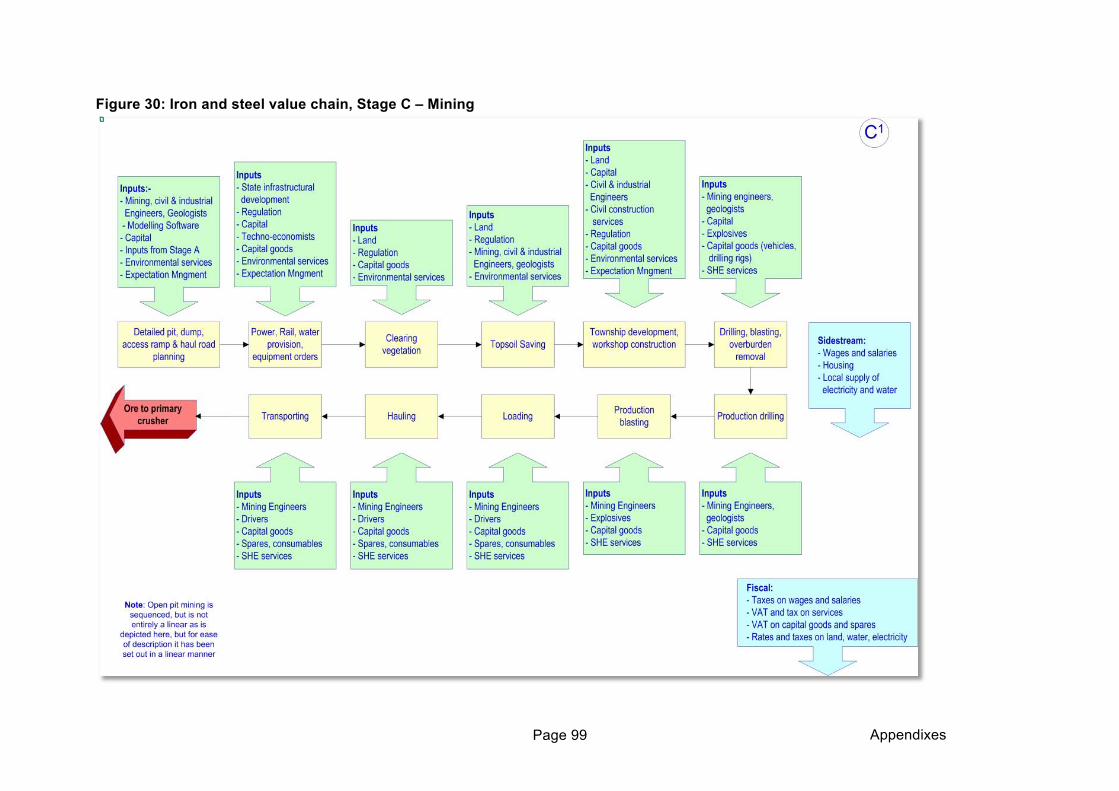
Appendixes Page 99
Figure 30: Iron and steel value chain, Stage C – Mining
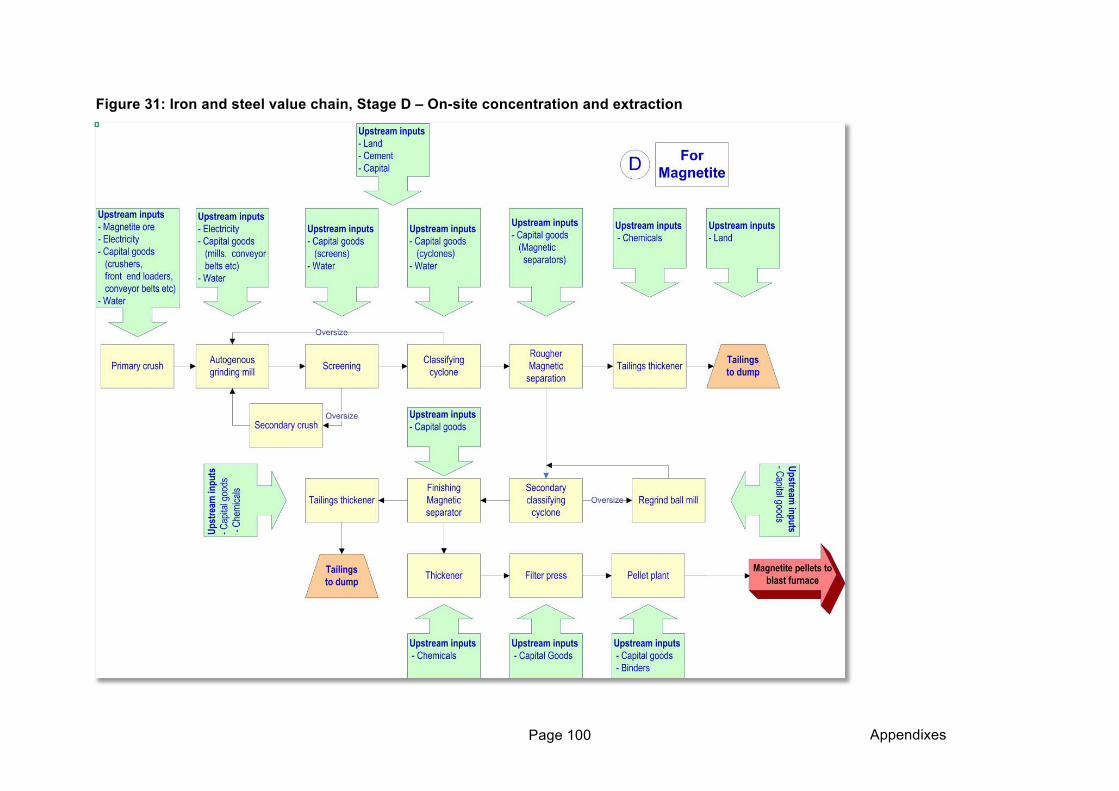
Appendixes Page 100
Figure 31: Iron and steel value chain, Stage D – On-site concentration and extraction
Appendixes Page 101
Appendix B.5 Off-site Refining
Figure 32 shows a flowchart of the integrated manufacturing process for iron and steel using the blast furnace (BF) and basic oxygen furnace
(BOF). This methodology is still the most commonly used throughout the world in terms of total production of steel. The iron-making process
involves the smelting of the iron ore (pellets in this case) by carbon reduction.
During iron-making, iron ore, coke, hot air and fluxes are fed into a blast furnace. The coke combusts providing both the heat and carbon
source for the iron smelting process. Fluxes are added to react with and remove impurities from the molten iron. The resultant slag floats to the
top of the molten iron and can be tapped separately to lead to a series of low value by-products if correctly processed.
The BF process leads to iron with a high carbon content, which leads to it being very brittle (pig iron) and unsuitable for most applications. Thus
the molten iron is fed into a BOF where it undergoes decarburization to produce molten steel. In the BOF oxygen is blown into the molten iron
and combusts the carbon and silicon.
This steel typically is still relatively impure and may now contain too much hydrogen and oxygen as well as a variety of other impurities. In the
production of high grade steel, secondary steelmaking processes such as refining under vacuum remove these gas components (vacuum
degassing).
Secondary refining is now considered standard for producing high grade steel. Secondary refining includes final desulphurisation, degassing
(oxygen, nitrogen, hydrogen, etc.), removal of inclusions, and final decarburization for ultra-low carbon steel (JFE, 2013).
Appendix B.6 Cast iron downstream
About 30% of iron is used in various forms of cast-iron to produce moulded products (Figure 33) Iron is more amenable to casting into intricate
shape than steel and less expensive.
Appendixes Page 102
Appendix B.7 Steel Downstream
Although various processes are available for the further production of steel to its multiple finished products, only certain of these will be followed
in this simplified view of the downstream steel industry. Steel is amenable, when hot, to rolling and as a result steel is usually cast and hot
rolled before further in-house processes or transport to specialised mills for producing semis.
For the continuous casting process the molten steel is cast by pouring it into a tundish (reservoir) and from there into a vertical water-cooled
copper mould. The steel is then drawn through a series of rollers that curve so that, as it solidifies, it is extruded horizontally. The cast steel is
cut to the prescribed length using automatic gas burners. The products of this process (depending on size and shape) are billets, blooms or
slabs (Figure 34).
After re-heating to the rolling temperature, billets, blooms or slabs are hot-worked to the required products. Steel shapes, bars, and wire rods
are worked on shaped-section mills, bar mills and wire-rod mills. Products may be transported to cold rolling mills or further cold worked at the
same locality after pickling to remove scale from the surface. Cold-rolled steel products may be tinned or galvanized as required to produce
various surface-treated steel sheet products. Steel pipe is produced by forming and welding steel sheets or plates, or by piercing a billet and
rolling to the final dimensions without a seam.
As these products are fed into industry the variety of semi-finished and finished products are extremely broad, and cover every aspect of
modern life.
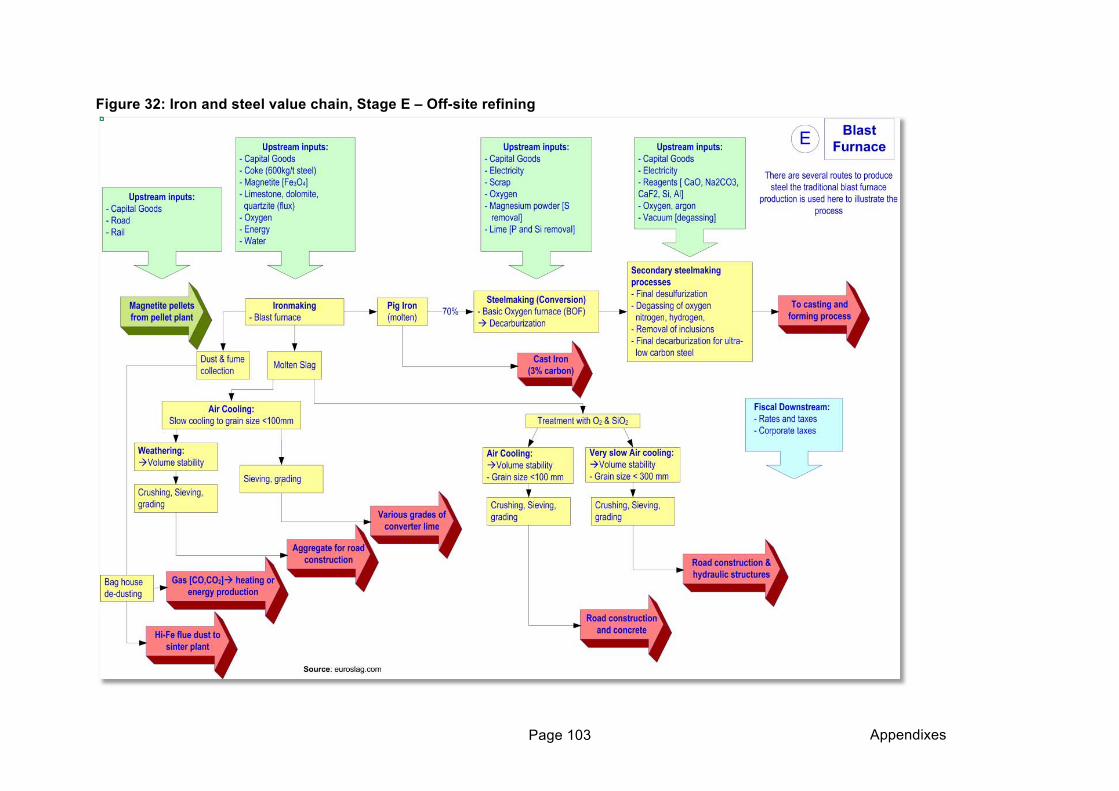
Appendixes Page 103
Figure 32: Iron and steel value chain, Stage E – Off-site refining
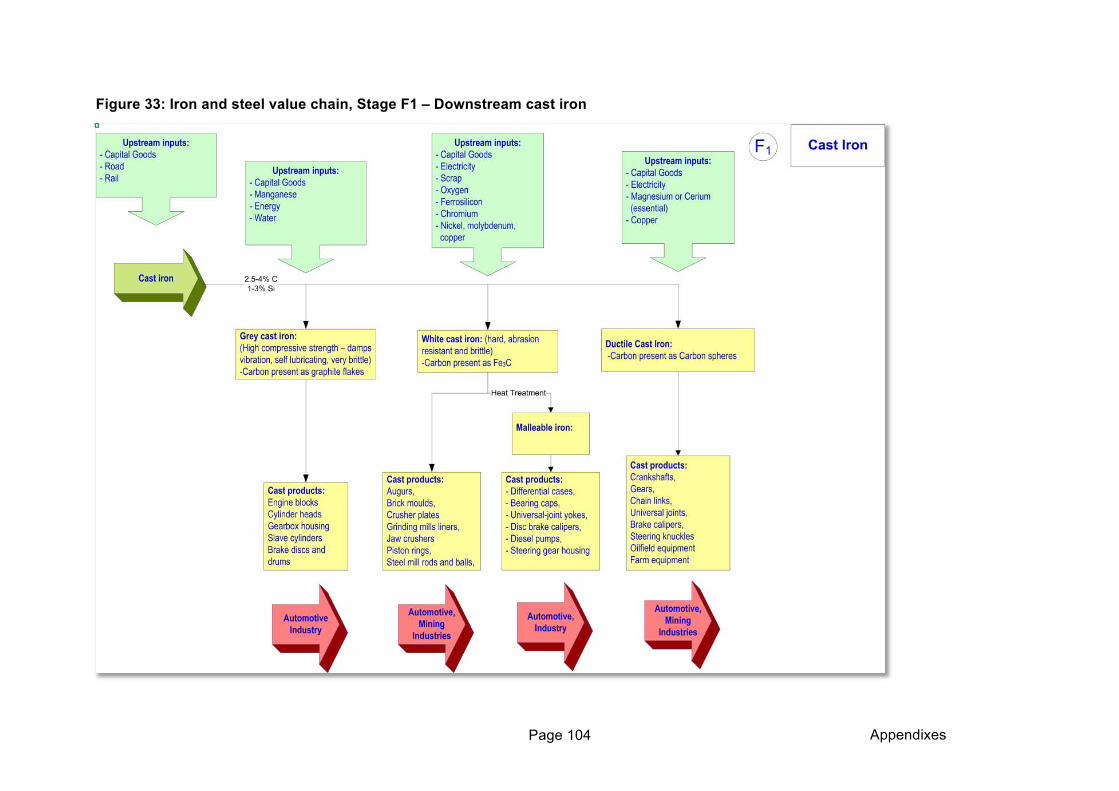
Appendixes Page 104
Figure 33: Iron and steel value chain, Stage F1 – Downstream cast iron
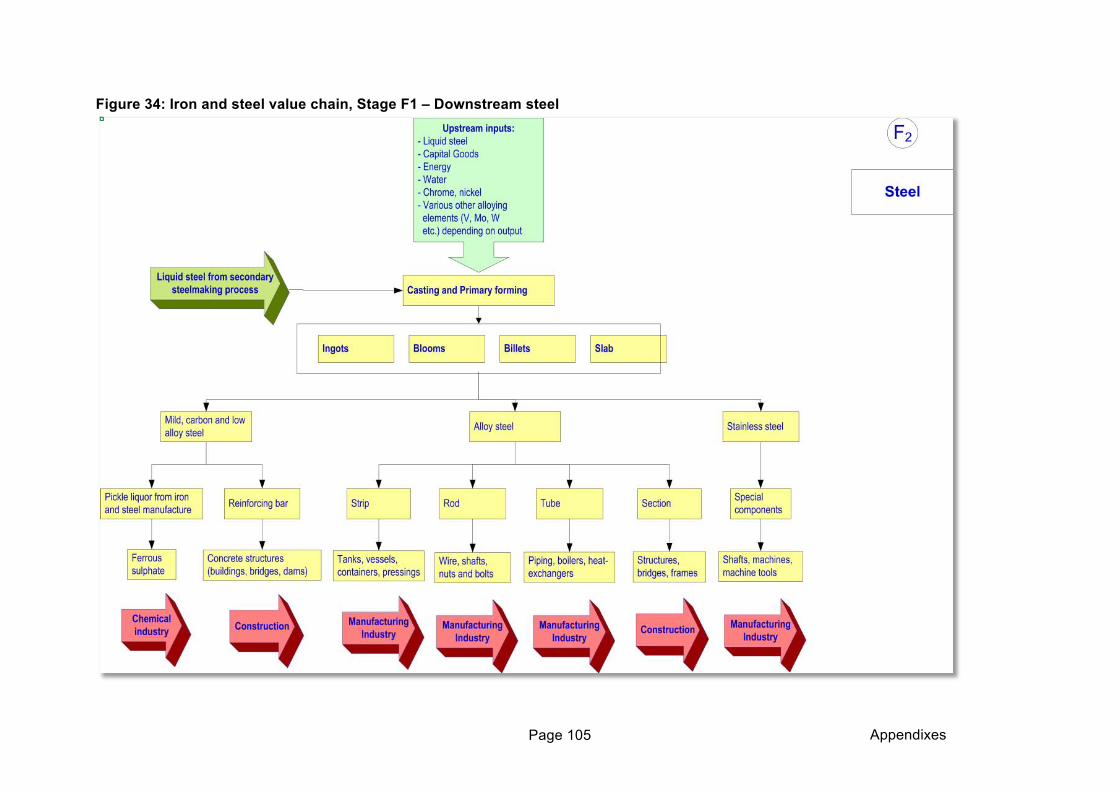
Appendixes Page 105
Figure 34: Iron and steel value chain, Stage F1 – Downstream steel
Appendixes Page 106
Appendix B.8 Steel Recycling
A large amount of steel is recycled when the finished product comes to the end of its life – scrap is an important input into all steelmaking and
in particular in the case of the rapidly expanding mini-mills, where it is the prime raw material. Steel products can remain in the system for as
little as a few months in the case of cans, to 1-20 years for small implements and household goods, around 15 years for motor vehicles, 10-30
years for large scale mining equipment and fencing, and as long as 100 years for steel used in construction and shipbuilding.
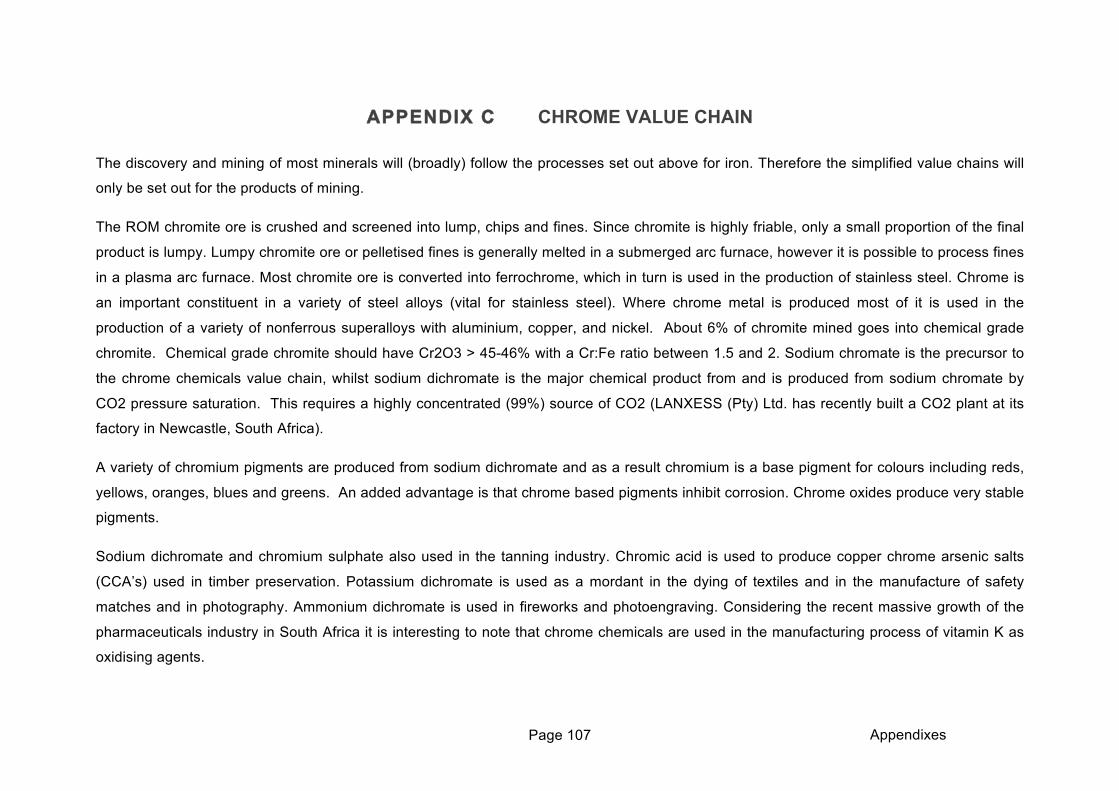
Appendixes Page 107
APPENDIX C CHROME VALUE CHAIN
The discovery and mining of most minerals will (broadly) follow the processes set out above for iron. Therefore the simplified value chains will
only be set out for the products of mining.
The ROM chromite ore is crushed and screened into lump, chips and fines. Since chromite is highly friable, only a small proportion of the final
product is lumpy. Lumpy chromite ore or pelletised fines is generally melted in a submerged arc furnace, however it is possible to process fines
in a plasma arc furnace. Most chromite ore is converted into ferrochrome, which in turn is used in the production of stainless steel. Chrome is
an important constituent in a variety of steel alloys (vital for stainless steel). Where chrome metal is produced most of it is used in the
production of a variety of nonferrous superalloys with aluminium, copper, and nickel. About 6% of chromite mined goes into chemical grade
chromite. Chemical grade chromite should have Cr2O3 > 45-46% with a Cr:Fe ratio between 1.5 and 2. Sodium chromate is the precursor to
the chrome chemicals value chain, whilst sodium dichromate is the major chemical product from and is produced from sodium chromate by
CO2 pressure saturation. This requires a highly concentrated (99%) source of CO2 (LANXESS (Pty) Ltd. has recently built a CO2 plant at its
factory in Newcastle, South Africa).
A variety of chromium pigments are produced from sodium dichromate and as a result chromium is a base pigment for colours including reds,
yellows, oranges, blues and greens. An added advantage is that chrome based pigments inhibit corrosion. Chrome oxides produce very stable
pigments.
Sodium dichromate and chromium sulphate also used in the tanning industry. Chromic acid is used to produce copper chrome arsenic salts
(CCA’s) used in timber preservation. Potassium dichromate is used as a mordant in the dying of textiles and in the manufacture of safety
matches and in photography. Ammonium dichromate is used in fireworks and photoengraving. Considering the recent massive growth of the
pharmaceuticals industry in South Africa it is interesting to note that chrome chemicals are used in the manufacturing process of vitamin K as
oxidising agents.
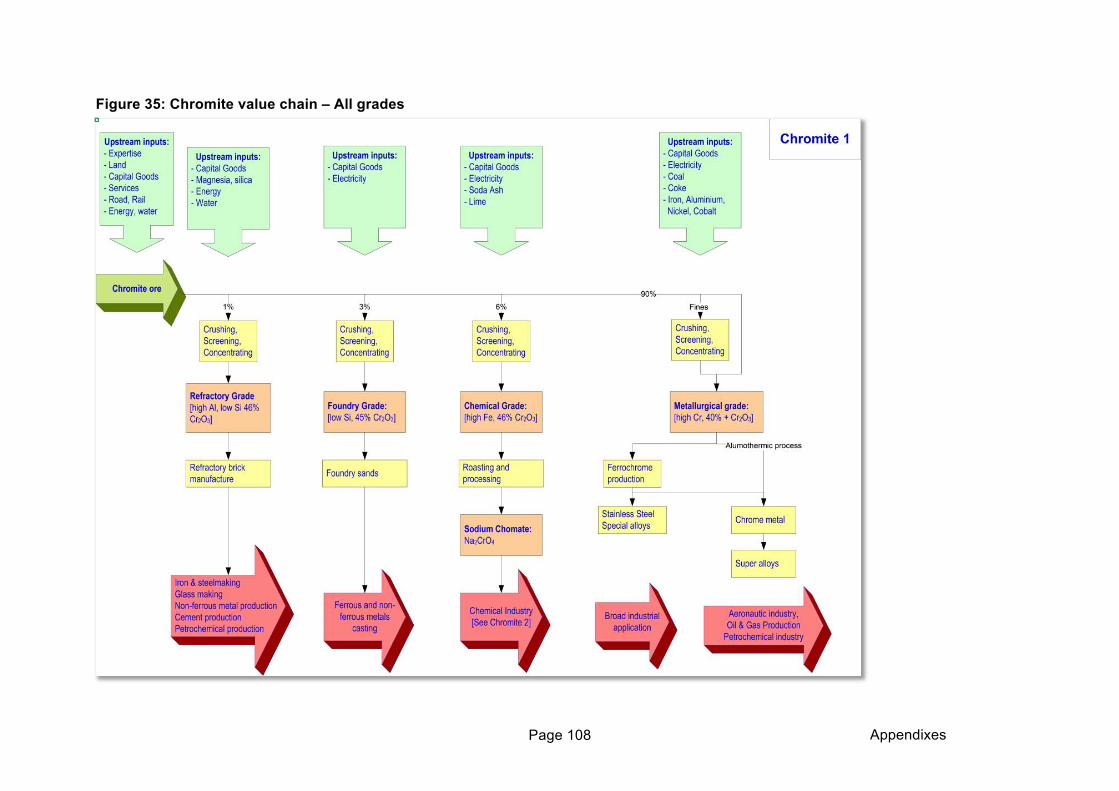
Appendixes Page 108
Figure 35: Chromite value chain – All grades
Appendixes Page 109
Figure 36: Chromite value chain – Chemical Grade
Appendixes Page 110
APPENDIX D MANGANESE VALUE CHAIN
Manganese is produced from open pit and underground mining. It is washed and screened from fine to lumpy. High carbon ferromanganese
and silicomanganese are produced in submerged arc furnaces. The production of medium and low carbon ferromanganese is accomplished by
further ladle processes (see Figure 22). The proportion of the products varies dependent on market demand and pricing. About 90-95% of
manganese (Mn) produced in the world is used in steelmaking. Steel is essentially an alloy of iron and carbon, however crude steel still
contains oxygen and sulphur from the iron ore and coal used in producing it. Manganese combines with sulphur and has a powerful de-
oxidation capacity and therefore improves the workability of the steel. There is no substitute for the desulphurization role that manganese plays
in steelmaking (IMnI, 2013). The rest of the manganese used in steels is used as an alloying element. This is discussed in detail in the second
report in this series.
Manganese metal is used in the production of some series 200 (high manganese) steels as well as in the production of non-ferrous alloys with
aluminium, copper, zinc titanium, magnesium gold silver and others. The 5-10% of manganese that is not used in steel and related alloys (see
Figure 38), finds its way into a wide diversity of industrial uses such as in the manufacture of batteries, in water purification (potassium
permanganate), acid leaching of ores, pigments, fertilizer, animal feeds, welding rods, fungicides, fuels, medicines and even fragrances and
flavours.
The four grades of manganese produced for batteries and chemical use are:
Dry cell electrolytic manganese dioxide (EMD): Must have MnO2>92%, H2O<2%, Fe<0.02%, Cu<0.0005%, Pb<0.0009%
Battery grade manganese dioxide: MnO2 content must be in the range 75-90%
Chemical grade Manganese dioxide: minimum of 35% Mn, manganese has the possibility to exist is six different oxidation states, which makes it very useful in the chemical industry
Fertiliser grade manganese dioxide: Must have 30-60% Mn
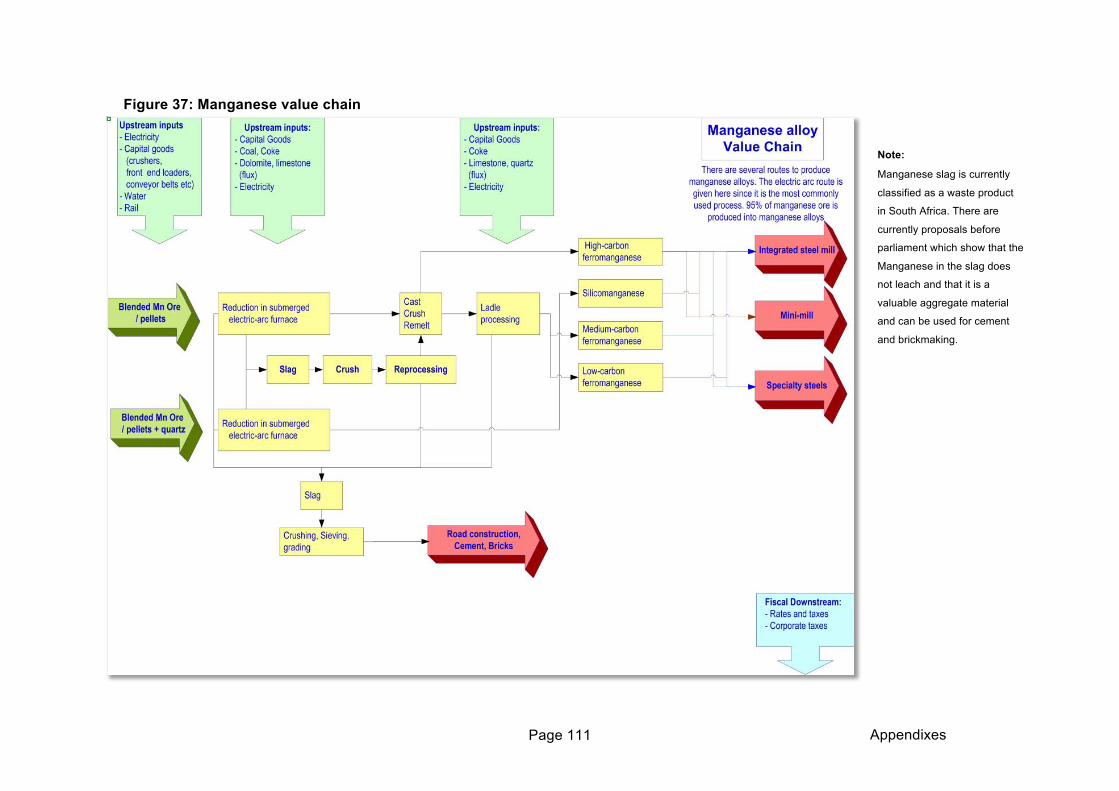
Appendixes Page 111
Figure 37: Manganese value chain
Note:
Manganese slag is currently
classified as a waste product
in South Africa. There are
currently proposals before
parliament which show that the
Manganese in the slag does
not leach and that it is a
valuable aggregate material
and can be used for cement
and brickmaking.
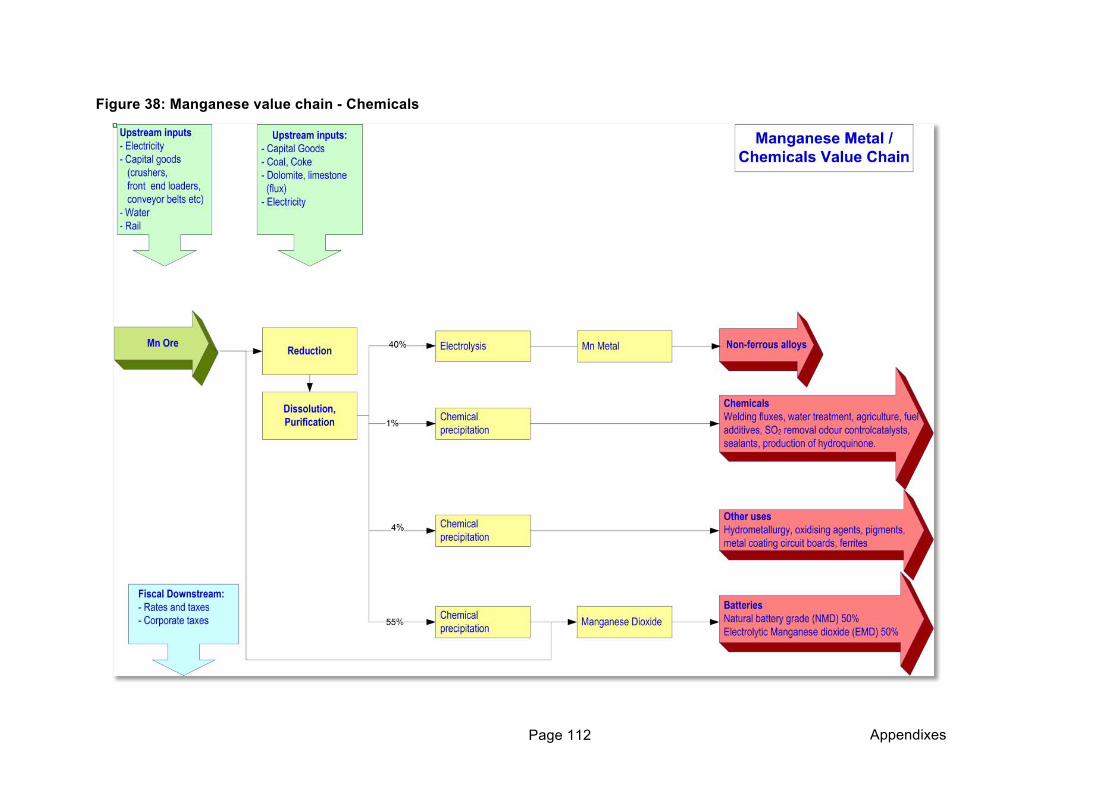
Appendixes Page 112
Figure 38: Manganese value chain - Chemicals
Appendixes Page 113
APPENDIX E NICKEL VALUE CHAIN
The mining and initial processing of nickel ore will differ markedly dependent on whether the ore is in a surficial laterite deposit or an
underground sulphide deposit. The extractive metallurgy of nickel ores is complex and as a result many process routes are utilised around the
world. Broadly there are processes for sulphide ores (Kabanga, Muremera) and oxide ores (the laterite deposits such as Musongati). Sulphide
ore processing typically entails comminution to liberate the minerals of value, upgrading of the ore by dense medium separation (DMS) and
flotation to produce a sulphide concentrate. This concentrate is then reduced by pyrometallurgical methods to produce a nickel matte followed
by leaching, or the concentrate can be directly leached.
Laterite ores require process routes which are dependent on the composition of the laterite. Pre-concentration is typically not feasible with
lateritic ores (since the nickel is substituted in the lattice of the rock-forming minerals), and the ore itself is treated pyrometallurgically for high
grade ores to produce ferronickel, or by a mixture of pyrometallurgy and hydrometallurgy (such as in the Caron process, where the ore is pre-
reduced to nickel metal and then leached in ammonia), or directly leached, such as with the atmospheric or high pressure leach processes. The
presence of PGEs in laterite deposits pose an additional challenge (Callaghan and Spicer, 2008)
Many of the primary producers only produce intermediary products as the life of the mine and / or remote location does not justify the relatively
large capital investment required for further processing. The treatment of the leach solutions produced from both sulphide and laterite nickel
ores are similar, using hydrometallurgical processes such as precipitation, solid-liquid separation and solvent extraction, to recover nickel and
cobalt as intermediary products, such as sulphides or carbonates, or as metals, using electrowinning or hydrogen reduction. Due to the
process complexity as well as the fact that final processes chosen for the deposits discussed in this project are yet to be chosen only a very
broad overview is given in Figure 39, and the reader is referred to Callaghan and Spicer (2008) for a more complete discussion.
In Figure 39 there is an option after the flotation and dewatering to export concentrate. It is understood that the current plan at Kabanga it to
process only so far before export of the concentrate for overseas refining.
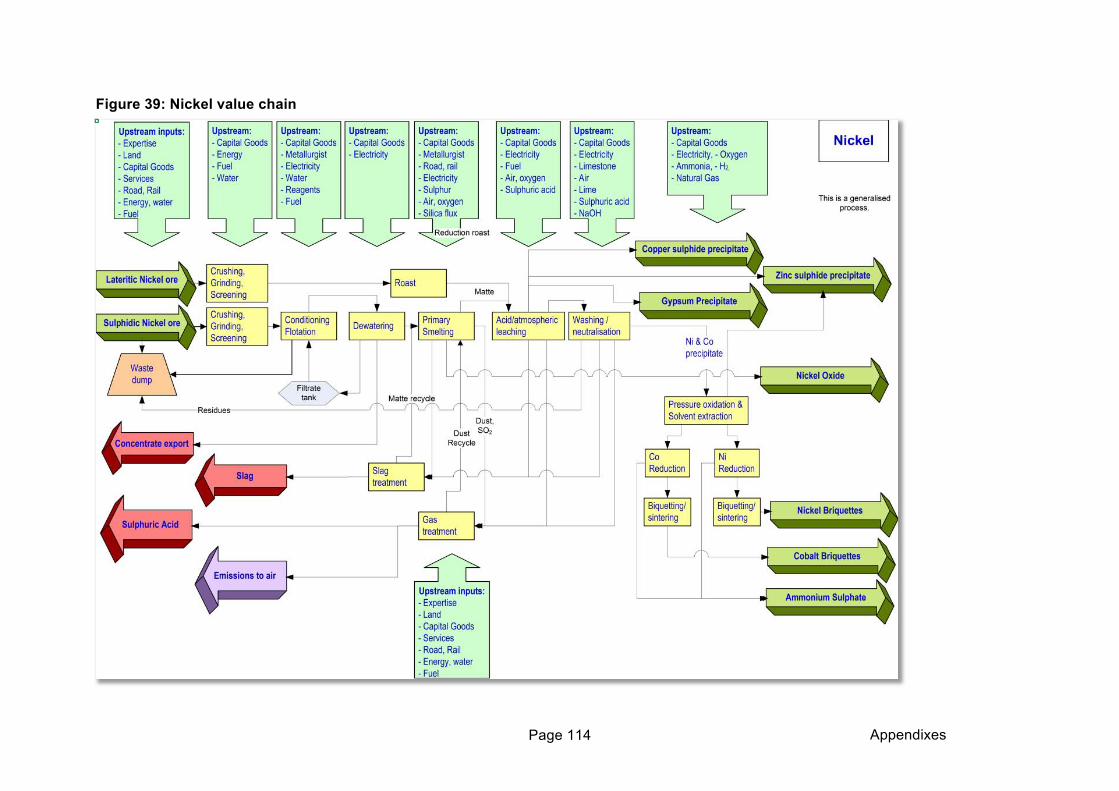
Appendixes Page 114
Figure 39: Nickel value chain
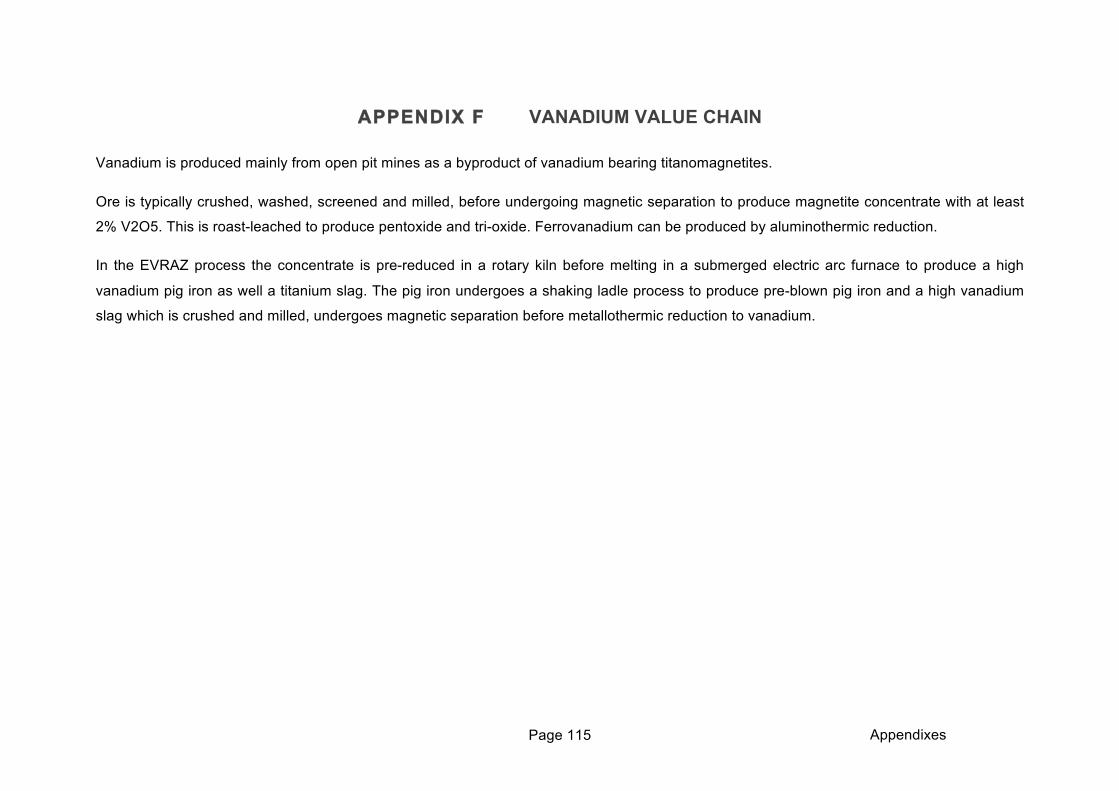
Appendixes Page 115
APPENDIX F VANADIUM VALUE CHAIN
Vanadium is produced mainly from open pit mines as a byproduct of vanadium bearing titanomagnetites.
Ore is typically crushed, washed, screened and milled, before undergoing magnetic separation to produce magnetite concentrate with at least
2% V2O5. This is roast-leached to produce pentoxide and tri-oxide. Ferrovanadium can be produced by aluminothermic reduction.
In the EVRAZ process the concentrate is pre-reduced in a rotary kiln before melting in a submerged electric arc furnace to produce a high
vanadium pig iron as well a titanium slag. The pig iron undergoes a shaking ladle process to produce pre-blown pig iron and a high vanadium
slag which is crushed and milled, undergoes magnetic separation before metallothermic reduction to vanadium.
Appendixes Page 116
Figure 40: Vanadium value chain
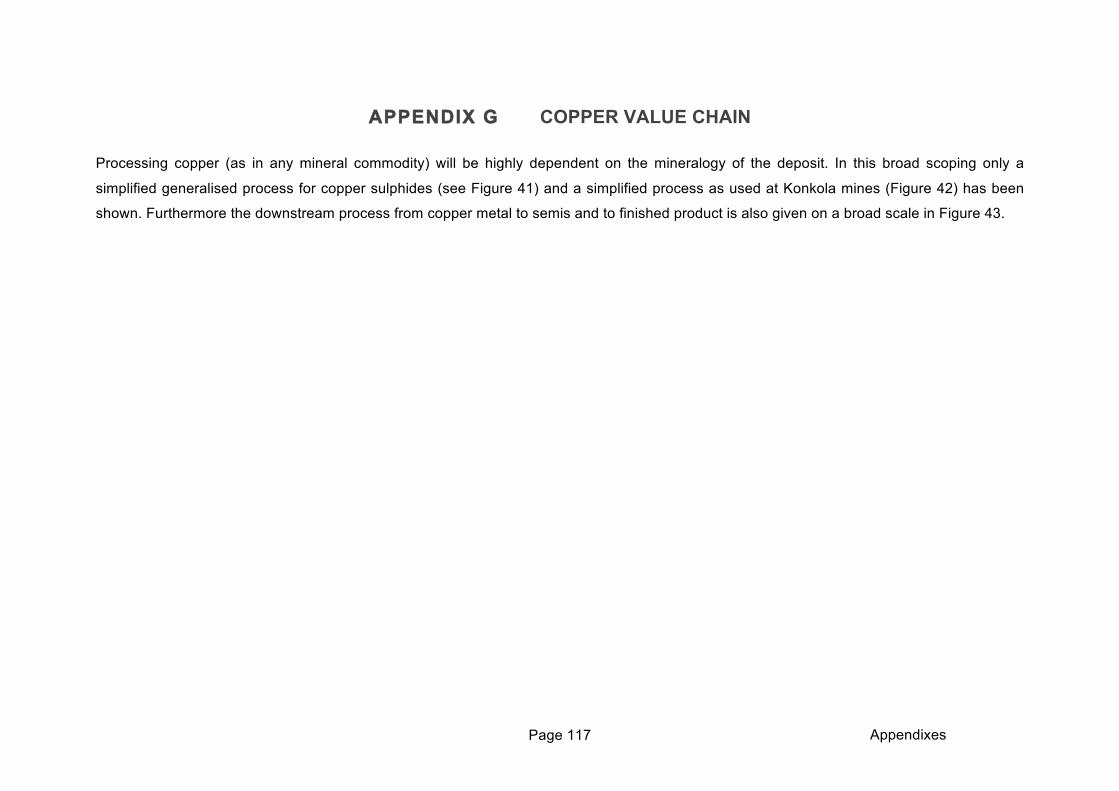
Appendixes Page 117
APPENDIX G COPPER VALUE CHAIN
Processing copper (as in any mineral commodity) will be highly dependent on the mineralogy of the deposit. In this broad scoping only a
simplified generalised process for copper sulphides (see Figure 41) and a simplified process as used at Konkola mines (Figure 42) has been
shown. Furthermore the downstream process from copper metal to semis and to finished product is also given on a broad scale in Figure 43.
Appendixes Page 118
Figure 41: Copper value chain – Generalised process to cast co
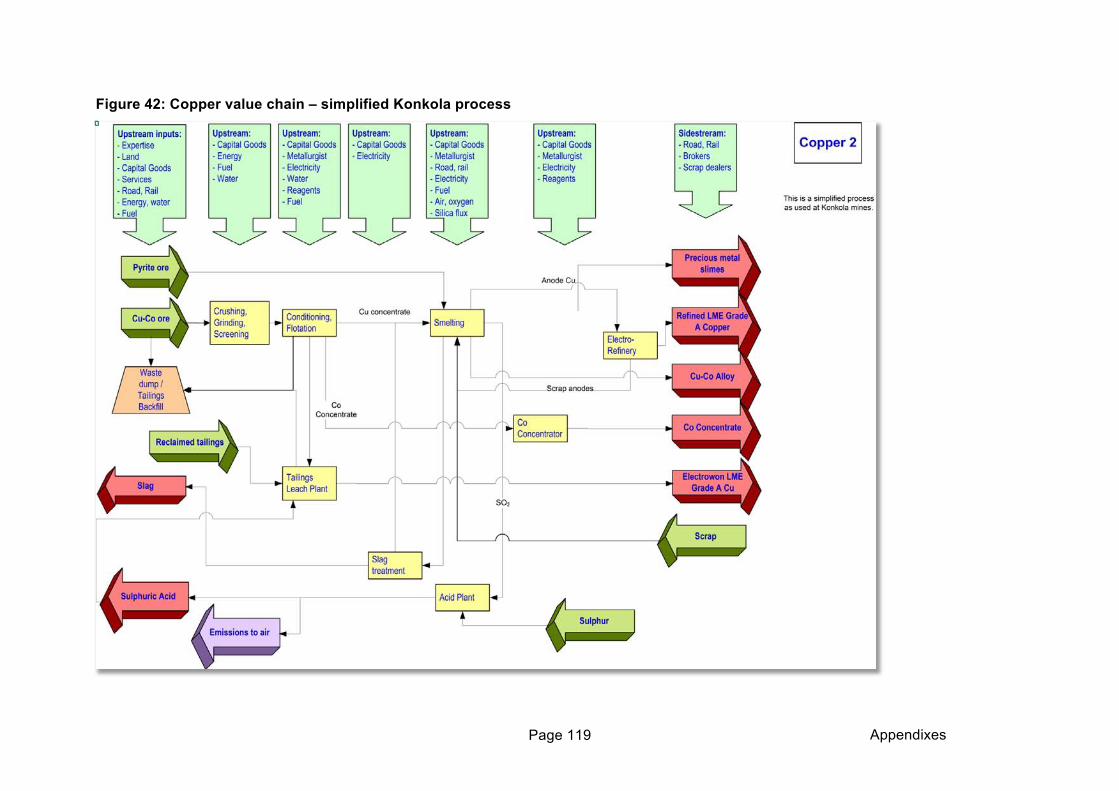
Appendixes Page 119
Figure 42: Copper value chain – simplified Konkola process
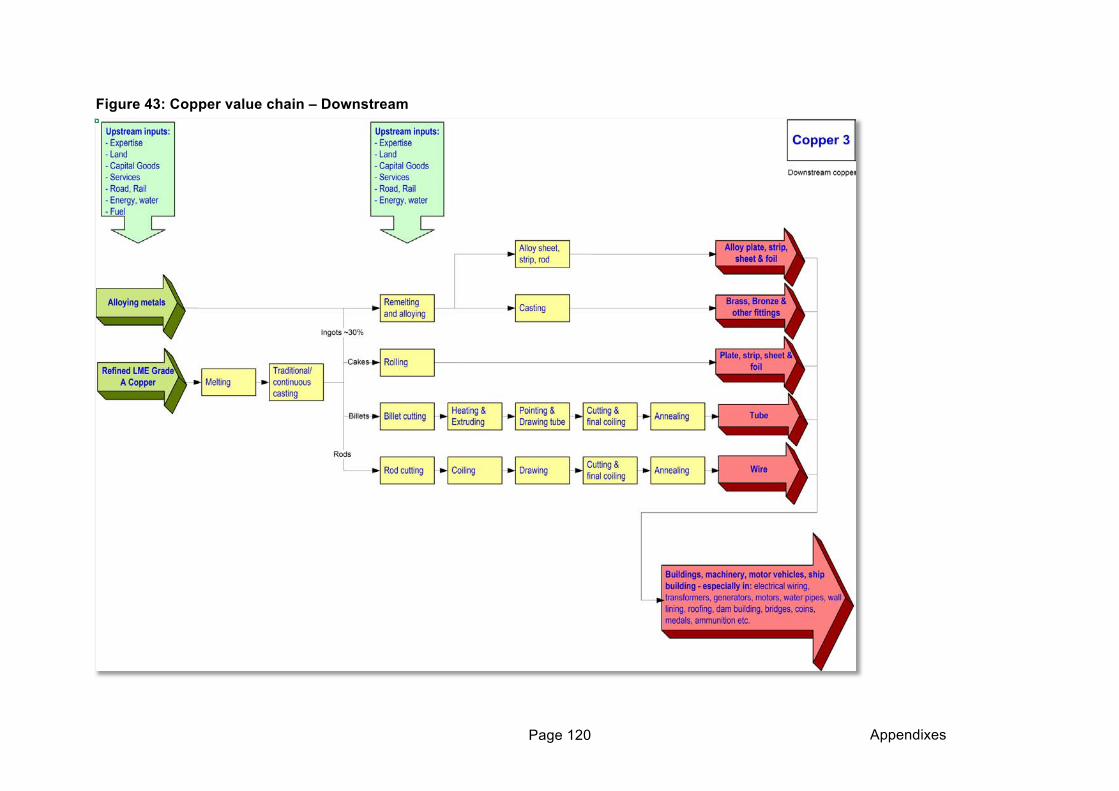
Appendixes Page 120
Figure 43: Copper value chain – Downstream
Appendixes Page 121
APPENDIX H ZINC VALUE CHAIN
The majority of zinc mines around the world are opencast mines and the most common element mined for zinc is sphalerite (ZnS). Typical
grades are 5-15% Zn, and therefore the zinc must be concentrated before the more costly part of the processing. The ore is crushed milled and
screened so that it has the correct grain size for processing and the valuable mineral contents will be exposed to the reagents in processing.
Typically zinc ore is concentrated at the mine site in a flotation process to produce a concentrate with some 55% zinc, generally including some
copper, lead and iron (see Figure 44).
Roasting the zinc concentrate at above 900ºC oxidises the sulphur to sulphur dioxide that can be captured and sent to a sulphuric acid plant.
This forms an important by-product of the process and since it is required later in the process will also lower overall costs. The zinc sulphide is
also oxidised to zinc oxide (ZnO).
More than 90% of the world’s zinc is now produced via a hydrometallurgical leaching process. During leaching of the calcine, sulphuric acid
dissolves the zinc oxide whilst iron precipitates as ferrous sulphate and the lead and silver in the calcine remain undissolved.
The leachate still contains impurities and to clean it of these, zinc powder is added to the solution. As all the elements to be removed (Iron,
lead, copper, silver and gold) lie below zinc in the electrochemical series they can be precipitated by cementation in which the zinc powder is
oxidised (by loss of electrons and taken into solution whilst the other elements are reduced to their metallic form and are precipitated. The
purified solution is now subjected to an electrolytic process. An electrical current is circulated through the electrolyte by applying a 3.3-3.5
voltage between the lead alloy anode and aluminium cathode. Zinc metal with a very high purity then deposits on the aluminium cathodes. The
zinc is stripped off, dried, melted and cast into ingots of either High Grade 99.95% or Special High Grade (SHG) 99.99% zinc.
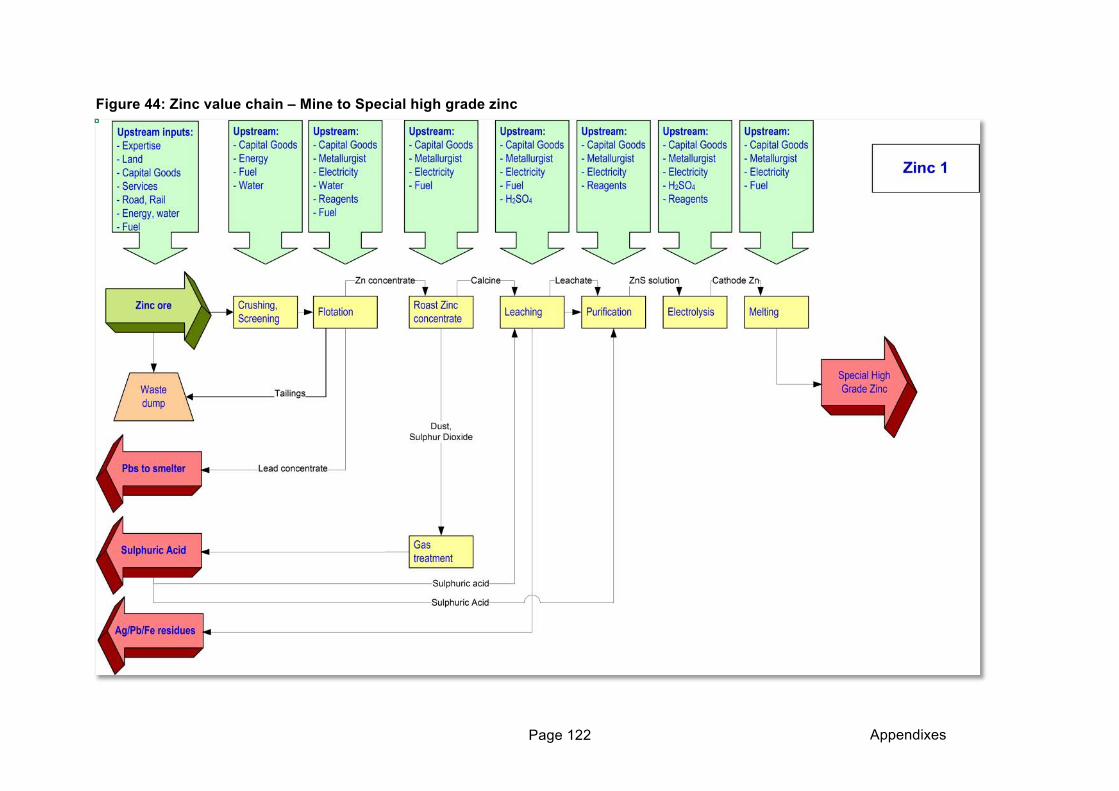
Appendixes Page 122
Figure 44: Zinc value chain – Mine to Special high grade zinc
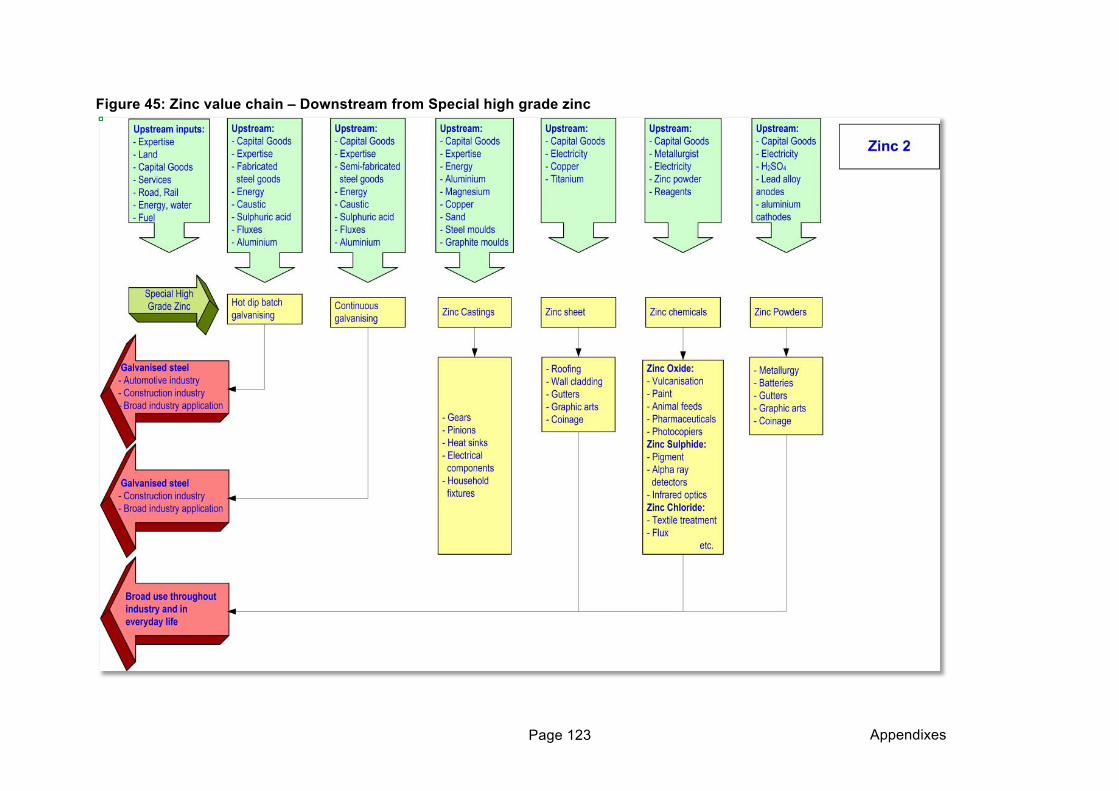
Appendixes Page 123
Figure 45: Zinc value chain – Downstream from Special high grade zinc
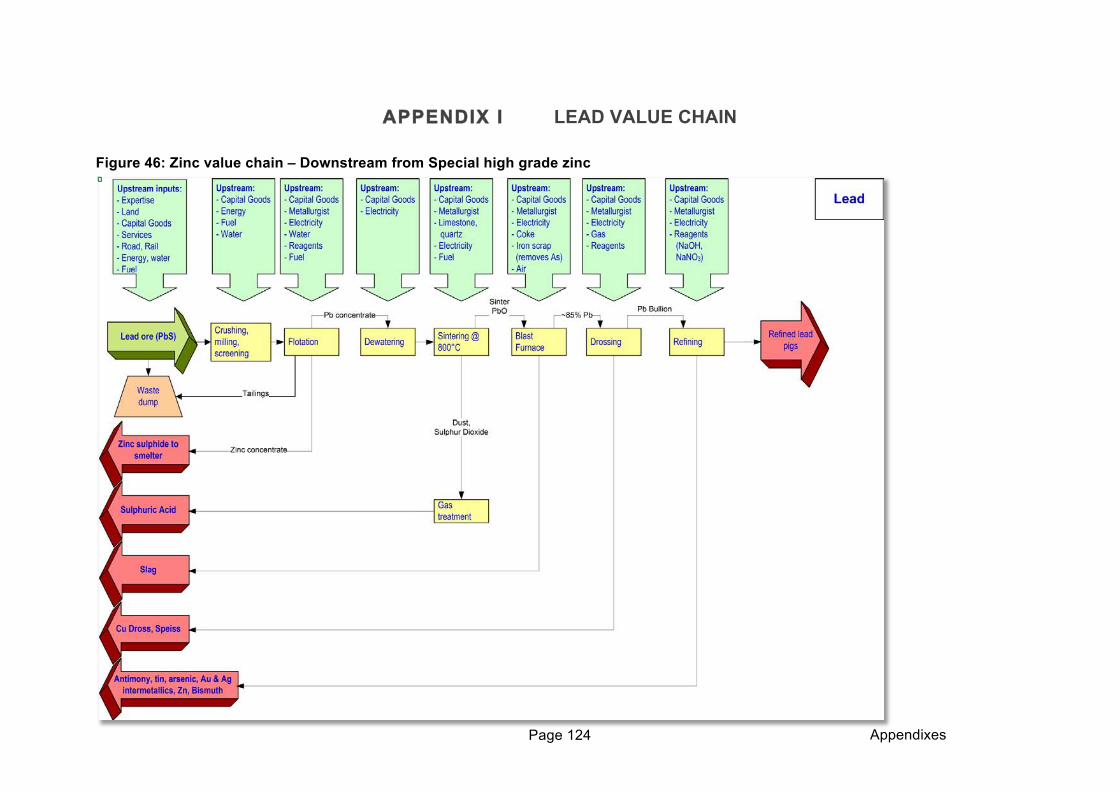
Appendixes Page 124
APPENDIX I LEAD VALUE CHAIN
Figure 46: Zinc value chain – Downstream from Special high grade zinc
Appendixes Page 125
APPENDIX J PHOSPHATE VALUE CHAIN
Phosphate rock in the Tripartite is largely in the form of intruded carbonatites. The high carbonate content is generally a disadvantage since
more acid will be used in the production of phosphoric acid and at the same time more gypsum will be produced. Although Gypsum does have
some value as a soil ameliorant in agriculture as well as for the production of plaster boards, as a cement retardant, as well as in other areas of
the construction industry, it is likely that more gypsum will be produced at a plant than can find buyers and as a result a large proportion of it
may find its way to dumps.
The phosphate rock is crushed and finely milled and screened before a froth flotation stage to separate out the apatite from quartz and other
constituents. The apatite concentrate is reacted with sulphuric acid to produce superphosphate or phosphoric acid. Phosphoric acid can also be
produced in an electric furnace with no gypsum production and with a very pure product. But this route is much more expensive and commonly
only used for food grade phosphoric acid.
Phosphoric acid or superphosphoric acid is reacted with ammonia to produce di-ammonium phosphate (DAP) or Mono-ammonium phosphate
(MAP). Finely ground Potash and Urea ammonium nitrate may be added to the MAP and DAP to produce a range of NPK fertilisers dependent
on demand.
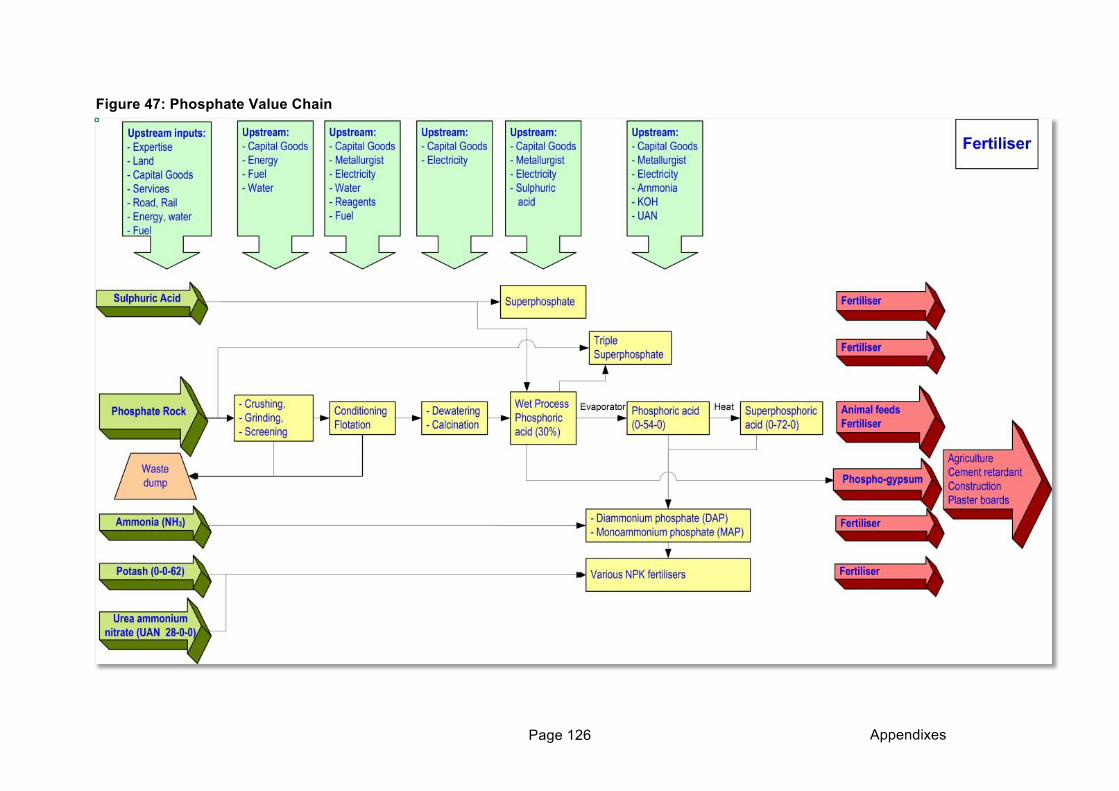
Appendixes Page 126
Figure 47: Phosphate Value Chain
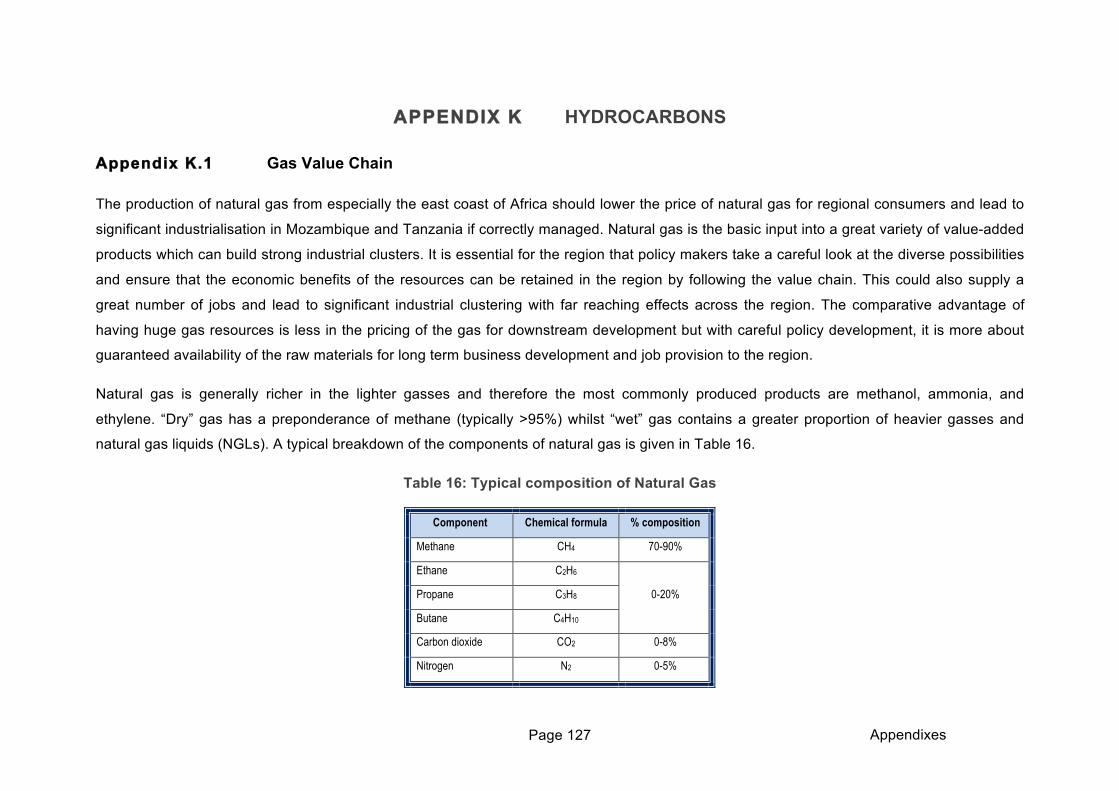
Appendixes Page 127
APPENDIX K HYDROCARBONS
Appendix K.1 Gas Value Chain
The production of natural gas from especially the east coast of Africa should lower the price of natural gas for regional consumers and lead to
significant industrialisation in Mozambique and Tanzania if correctly managed. Natural gas is the basic input into a great variety of value-added
products which can build strong industrial clusters. It is essential for the region that policy makers take a careful look at the diverse possibilities
and ensure that the economic benefits of the resources can be retained in the region by following the value chain. This could also supply a
great number of jobs and lead to significant industrial clustering with far reaching effects across the region. The comparative advantage of
having huge gas resources is less in the pricing of the gas for downstream development but with careful policy development, it is more about
guaranteed availability of the raw materials for long term business development and job provision to the region.
Natural gas is generally richer in the lighter gasses and therefore the most commonly produced products are methanol, ammonia, and
ethylene. “Dry” gas has a preponderance of methane (typically >95%) whilst “wet” gas contains a greater proportion of heavier gasses and
natural gas liquids (NGLs). A typical breakdown of the components of natural gas is given in Table 16.
Table 16: Typical composition of Natural Gas
Component Chemical formula % composition
Methane CH4 70-90%
Ethane C2H6
0-20% Propane C3H8
Butane C4H10
Carbon dioxide CO2 0-8%
Nitrogen N2 0-5%
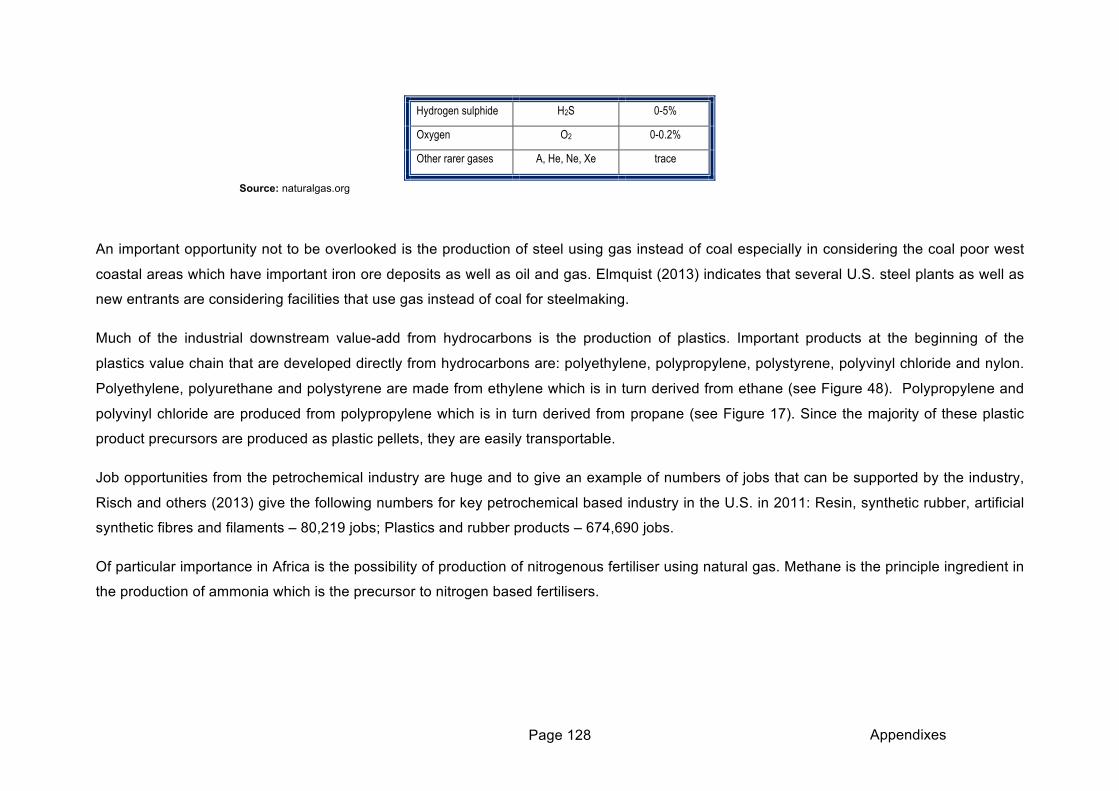
Appendixes Page 128
Hydrogen sulphide H2S 0-5%
Oxygen O2 0-0.2%
Other rarer gases A, He, Ne, Xe trace
Source: naturalgas.org
An important opportunity not to be overlooked is the production of steel using gas instead of coal especially in considering the coal poor west
coastal areas which have important iron ore deposits as well as oil and gas. Elmquist (2013) indicates that several U.S. steel plants as well as
new entrants are considering facilities that use gas instead of coal for steelmaking.
Much of the industrial downstream value-add from hydrocarbons is the production of plastics. Important products at the beginning of the
plastics value chain that are developed directly from hydrocarbons are: polyethylene, polypropylene, polystyrene, polyvinyl chloride and nylon.
Polyethylene, polyurethane and polystyrene are made from ethylene which is in turn derived from ethane (see Figure 48). Polypropylene and
polyvinyl chloride are produced from polypropylene which is in turn derived from propane (see Figure 17). Since the majority of these plastic
product precursors are produced as plastic pellets, they are easily transportable.
Job opportunities from the petrochemical industry are huge and to give an example of numbers of jobs that can be supported by the industry,
Risch and others (2013) give the following numbers for key petrochemical based industry in the U.S. in 2011: Resin, synthetic rubber, artificial
synthetic fibres and filaments – 80,219 jobs; Plastics and rubber products – 674,690 jobs.
Of particular importance in Africa is the possibility of production of nitrogenous fertiliser using natural gas. Methane is the principle ingredient in
the production of ammonia which is the precursor to nitrogen based fertilisers.
Appendixes Page 129
Appendix K.1.1 Processing
In order to gain the maximum value out of natural gas in the region it should be processed locally and a petrochemical industry should be built
out from the gas processing to provide at least the precursor materials to the final products.
Figure 48 provides a simplified overview of the gas value chain. Notice that there is a water removal step as well as a dehydration step. The
first step of water removal will probably occur at the wellhead, whilst the second dehydration step will most likely take place at the gas
processing plant and is required to remove water vapour in the gas stream. It is important to remove water as soon as possible to assist in the
protection against the formation of gas hydrates, as well as the water condensing in pipelines and reducing flow rate.
The water vapour can be removed by one or more of the processes of cooling, adsorption or absorption. Gas should be cooled to the lowest
temperature it is likely to encounter in transport before compression of piping and in this process it is likely that water present will condense.
In adsorption the water molecules are trapped as a thin film on the surfaces of collectors such as zeolites, silica gel, alumina or bauxite (cannot
be used for sour gas because of its iron content). In the absorption process the most commonly used desiccants are glycols (ethylene glycol,
diethylene glycol, triethylene glycol or tetraethylene glycol). The glycols must be in a circuit which constantly “recharges” them by stripping out
the water and recirculating into the absorption column.
“Sweetening” the gas by removal of H2S and CO2 is required both because these gases are acidic, furthermore H2S is very poisonous. The
removal of these gases may be either by adsorption of absorption and should ideally be a regenerative process with the recovery of byproduct
sulphur. Most commonly the process used is one of amine absorption. The sulphur is collected via regeneration and pure sulphur can then be
produced as a byproduct via the “Claus process” in which the hydrogen sulphide is partially oxidised in air at high temperatures (1000-1400°C).
This produces elemental sulphur as well as SO2 and some H2S remains. The SO2 and H2S is then reacted in several stages at 200-250°C
over a catalyst.
Appendixes Page 130
There are two major methods used for the extraction of natural gas liquids – the absorption method and the cryogenic expander method. In the
absorption method the gas is passed through an oil absorbent. The “rich” oil after absorbing most of the propane, butane, pentane and other
heavier hydrocarbons is heated enough to boil off the NGLs. If the “lean” oil is cooled before the absorption phase it captures some of the
ethane as well, and there is an enhanced capture of the other NGLs.
Because the lighter hydrocarbons and especially ethane is difficult to capture using the oil absorption method a cryogenic recovery
methodology is used where the gas stream is cooled to about -85°C by one of various methods but most commonly by cooling the gas and
then rapidly expanding it in an expansion turbine (“cryogenic expansion process”).
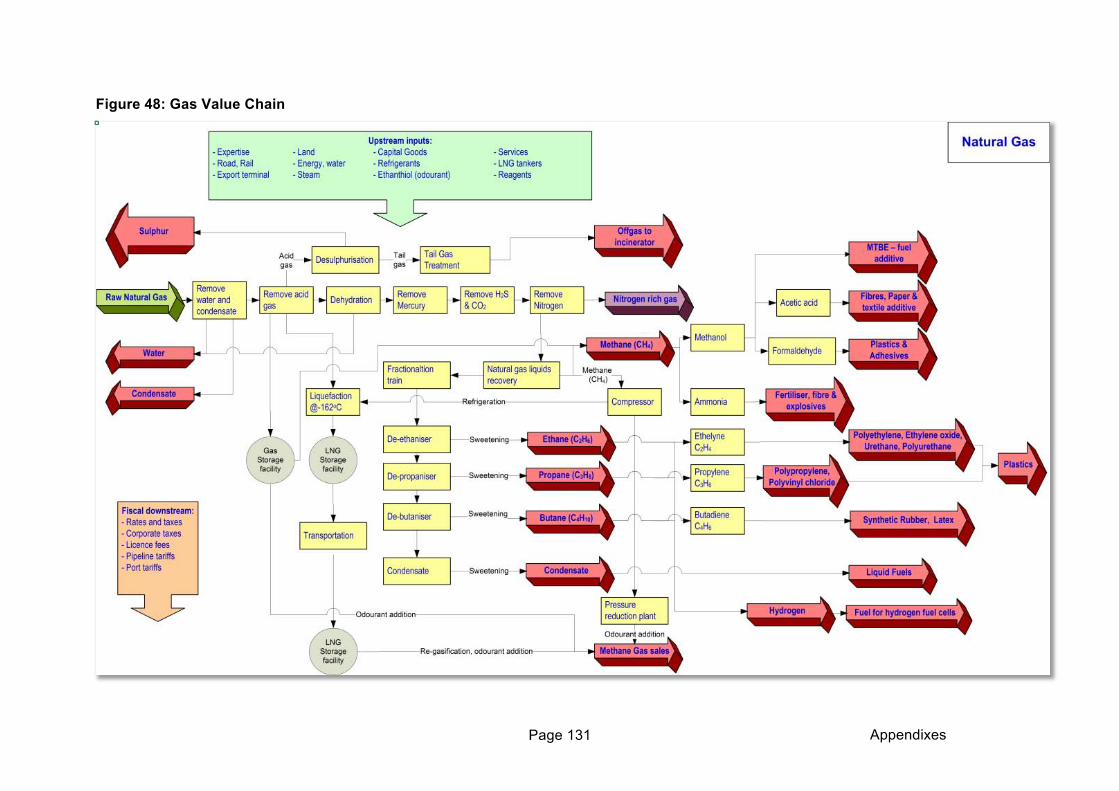
Appendixes Page 131
Figure 48: Gas Value Chain
Appendixes Page 132
Once removed from the methane the NGL’s are separated out by a fractionation process based on the boiling point of each of the gases.
Where methane is not used directly or by moved by pipeline it needs to be stored and shipped. To do this it is cooled to a liquid (liquefied
natural gas - LNG) at about -162°C. this reduces its volume by about 600 times and makes it amenable to storage and shipping. It is later
returned to the gaseous state and piped to the final user.
Appendix K.2 Oil
Although much of the value chain of oil is similar to that of gas there are a few additions to the process. Firstly oil will usually exist together with
gas which is likely to be dissolved in the oil. The first step required will then be the separation of the oil and gas (as well as much of the water
and other impurities such as sand and salt) and this is most likely to be accomplished at the well-head or nearby gathering centre. The water
will most likely be pumped back into the reservoir, whilst the oil and gas will be stored to await further processing or sale.
In general crude oil is not usable as is and needs to be refined into separate useful products in order to meet buyer’s specifications. Refineries
will generally be set up with a specific input as well as a specific range of products in mind, and as a result the range of processes at refineries
will differ somewhat. The depiction of the process in Figure 49 is a simplified generic process. Crude oil is separated into its component parts
by heating and fractional distillation (in principle the longer the carbon chain the higher the temperature required to boil the hydrocarbon).
Liquid Petroleum Gas (LPG) being the lightest fraction is the first to distil off and is collected towards the top of the distillation tower. Next would
be the basic components of petrol (gasoline), followed by medium fractions which include paraffin (kerosene), naptha and the basic
components of jet fuels and diesel, lower in the distillation tower heating oil then lubricating oils are tapped, whilst the residual (heavy) oils and
Bitumen (asphalt) remain at the bottom of the distillation tower (see Figure 49).
Appendixes Page 133
Because the demand for petrol outstrips the availability of petrol from the distillation process (only about 40%), some of the heavier fractions
are sent to a cracking unit for conversion to petrol. Naptha which is extracted from the light and middle distillate groupings is used chiefly as a
feedstock for the petrochemical industry. Similarly, dependent on market demand lighter fractions may be chemically reformed to petrol.
Heavy oils are vacuum distilled to produce a final range of light and medium products and bitumen.
Since petrol is very much in demand various hydrocarbons must be converted to produce more petrol. This is done by processes in which
longer or shorter chain hydrocarbons are converted into hydrocarbons of a suitable carbon chain length.
Appendix K.2.1 Cracking
“Gas oil”, a distillate stream heavier than diesel but lighter than heavy fuel oil, is broken down into lighter hydrocarbons (particularly petrol)
using catalysts, high temperature and/or pressure. However the process is not totally controllable and a range of hydrocarbons is produced.
Those lighter than petrol will be fed into the catalytic reforming process. Cracking is accomplished by heating the oil to enhance decomposition
into octane or by introducing a catalyst such as silica or alumina (accomplishing the cracking at a lower temperature).
Dependent on the conditions and catalysts used in the cracking process there is a good degree of control (though not absolute) that can be
exercised over the product. For example where the product is to be used as petrol it is desirable to ensure that the cracked molecules are
largely saturated hydrocarbons. Conversely if the end point is to provide inputs into the manufacturing industry (monomers and drugs) it is
important to produce unsaturated hydrocarbons.
Appendix K.2.2 Catalytic Reforming
Catalytic reforming is a process where short chain hydrocarbons (naphtha) are reformed into aromatic hydrocarbons with a high percentage of
octane. In the process hydrogen atoms are released and significant amounts of byproduct hydrogen gas is produced. Other byproducts include
small amounts of methane, ethane, propane, and butane.
Appendixes Page 134
Appendix K.2.3 Treatment
“Cracking” produces oil of various carbon chain lengths, and like crude oil, this can be separated and blended to produce oils with specific
properties. Certain oil component’s (for example heptane) handle compression poorly and ignite spontaneously under a little compression.
Octane on the other hand deals very well with compression. The higher the octane rating of petrol the more compression it can take before self-
igniting (93 octane contains 93% octane). It was discovered about a 100 years ago (during world war I) that adding tetraethyl lead to petrol and
makes it react as if it has a higher percentage of octane. However lead is toxic and has now been banned in most fuels around the world,
although some jet fuel still uses lead.
Sulphur, nitrogen and aromatics are removed (reduced) from refinery products with a process known as hydrotreating. The process exposes oil
to hydrogen in the presence of a catalyst, generally at high temperature and pressure. Hydrotreating essentially “cleans” the fuel and also
enhances the cetane number (a measure of the fuels ignition delay – the higher the cetane number the shorter the ignition delay period),
density and smoke point of diesel fuel. The improvement of diesel engines has resulted in a shift toward diesel and as a result hydrotreating
has become more important in recent years.
There is a wide range of treatments to provide for the product and environmental demands on the industry.
Coal
The coal value chain has essentially several broad routes dependent on demand and coal quality. However, that said the uses of various
grades of coal are widely varied and are growing daily. The major areas of applications include:
Coal can be used in heating applications either for domestic, industrial or power generation
Powdered bituminous coal can be used as a reductant in specially designed furnaces
Appendixes Page 135
Where the coal has specific “coking” properties it can be heated in an oxygen free environment to produce coke which is a sought after material
for the reduction of metallic oxides as well as gases which can provide inputs for the production of a variety of value added compounds.
The fourth important use of coal is to use it to produce oil, gas and petrochemicals.
Anthracite is widely used as a superior filtration medium. Important to this application are the anthracite’s hardness and durability. It is excellent
at lowering water turbidity due to its high ability to load solids. Figure 31 presents a simplified view of the coal value chain, whilst Figure 51
shows the SASOL processes as carried out in South Africa.
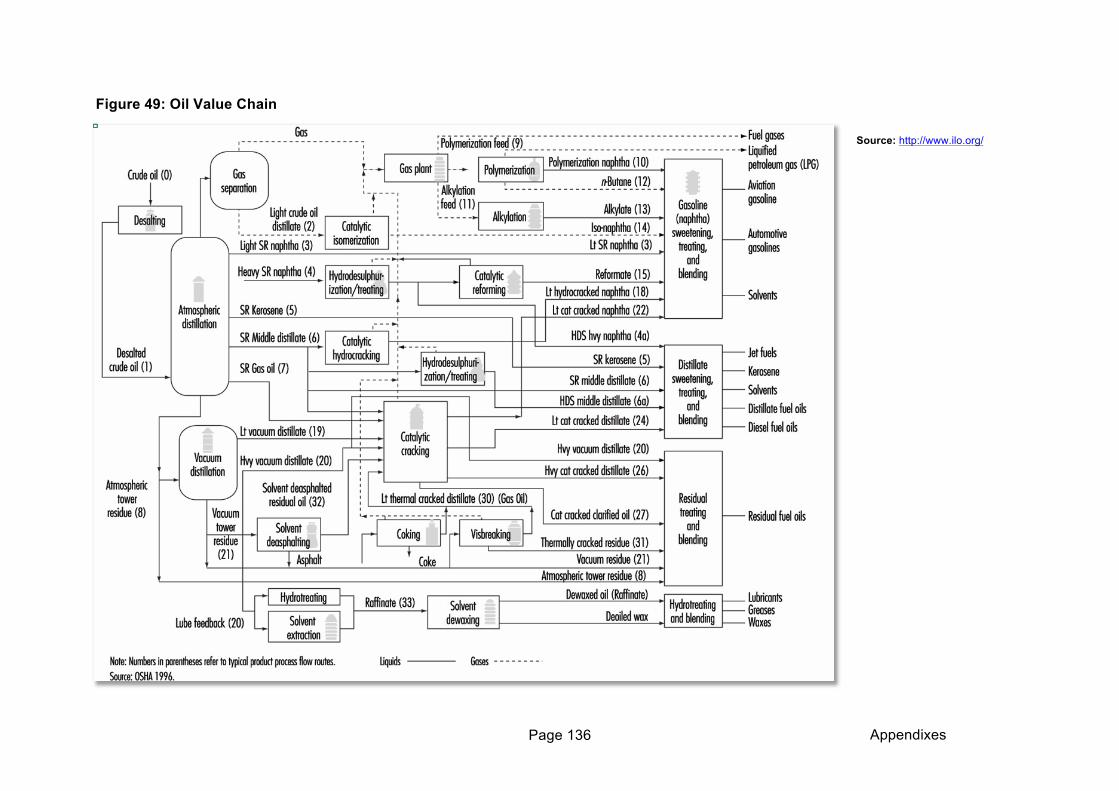
Appendixes Page 136
Figure 49: Oil Value Chain
Source: http://www.ilo.org/
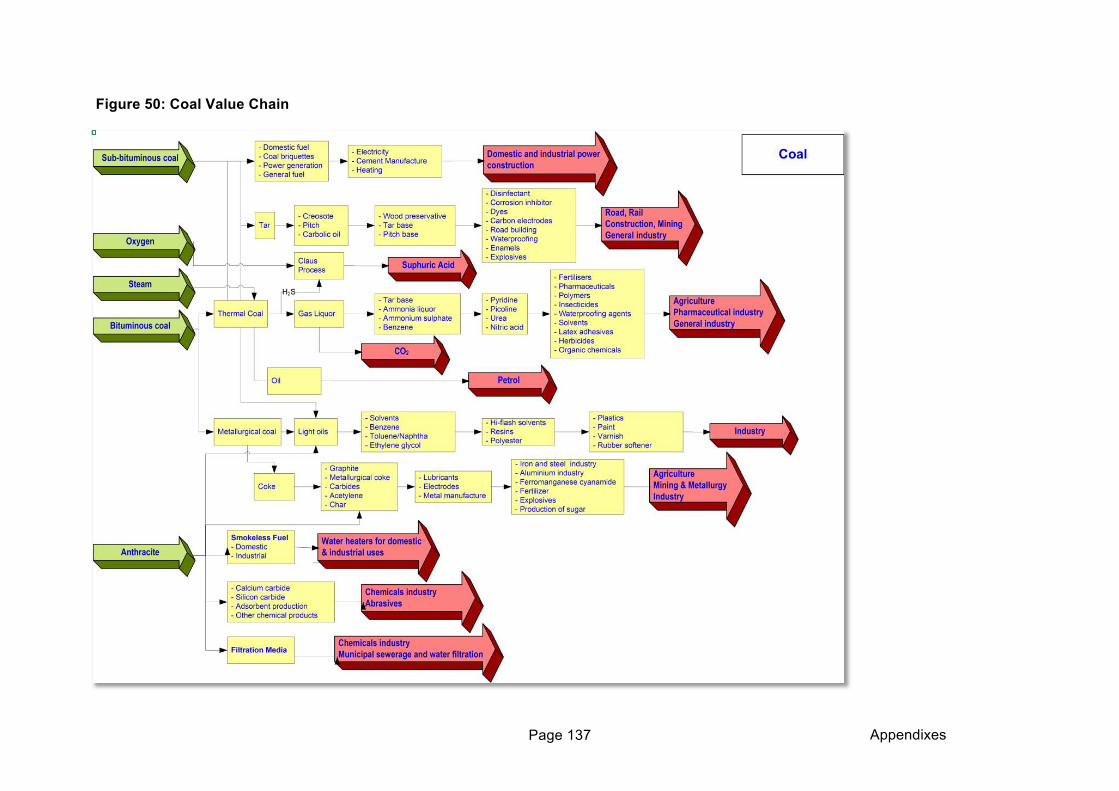
Appendixes Page 137
Figure 50: Coal Value Chain
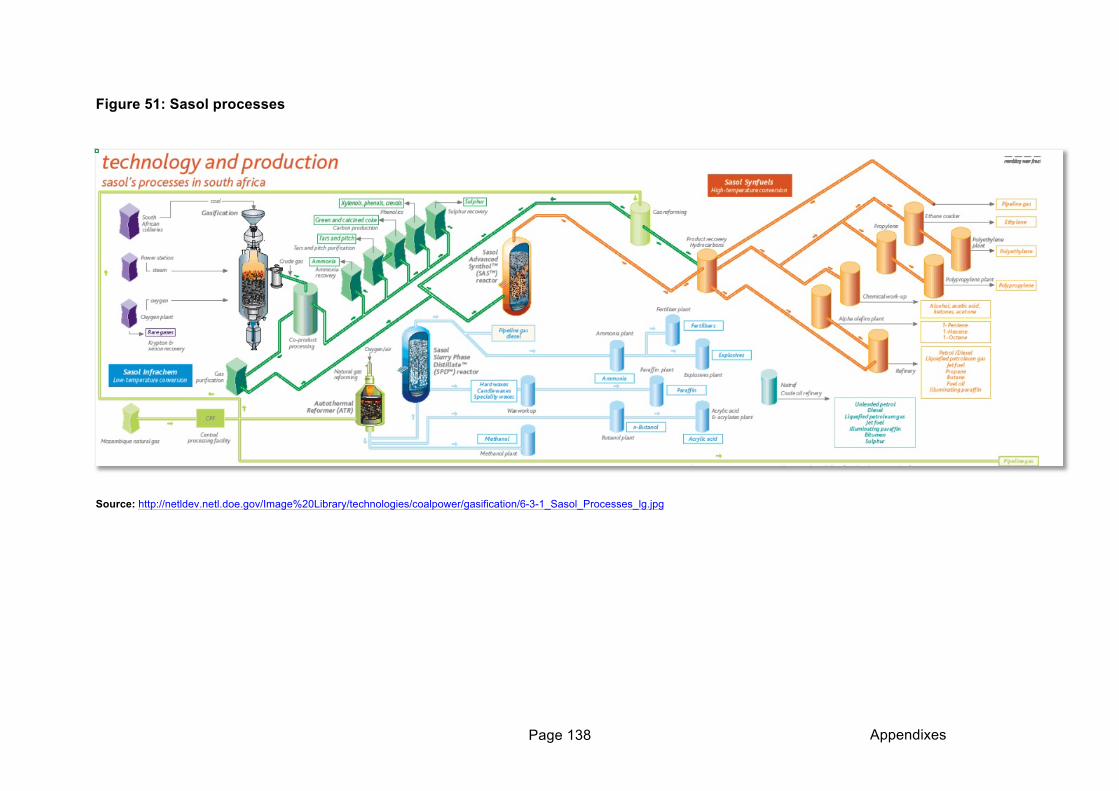
Appendixes Page 138
Figure 51: Sasol processes
Source: http://netldev.netl.doe.gov/Image%20Library/technologies/coalpower/gasification/6-3-1_Sasol_Processes_lg.jpg
Appendixes Page 139
APPENDIX L DIRECT OPPORTUNITIES
The best and fastest opportunities to be followed in order to extract backwards linkages from the projects grouped in this document into growth
poles will be to supply – and were possible manufacture as many of the consumables as possible locally or regionally. It is important to clarify
that regional procurement is important since, in raising regional wealth, markets for the direct mineral commodity based goods or other goods
from the country are enhanced.
Such opportunities include:
Provision and manufacture of reflective gear and industrial overalls,
Provision and manufacture of tyres,
Provision and manufacture of fuels (requirement: about 0.5l diesel per tonne mined)
Provision and manufacture of mining explosives (requirement: about 1-2 kg/m3 mined)
Provision and repair of headlamps, battery packs for personnel,
Provision and restocking of emergency oxygen units for personnel
Provision and restocking of first aid kits
Provision, servicing and manufacture of fire fighting equipment
Provision and manufacture of cement (backfill for underground mines contains about 2-5% cement)
Provision of timber supports for underground mines
Provision of steel (especially for chutes, piping, roof bolts and anchors) and spares (for example for conveyors)
Appendixes Page 140
Provision of drill steel and accessories for production, exploration and delineation drilling
Mining equipment suppliers: there are three important African born players in the market to the current knowledge of Letlapa. It is important
to note that traders have already developed a profile in Africa to sell various makes of mining equipment for example the reader is referred
to the Kanu website http://kanuequipment.co.za/ (dealership in the Republic of Congo). This is a rich area for development from other types
of machinery production for innovative entrepreneurs in other African countries:
For open pit mining the company Bell Equipment is an important world player, and is a home bred African company, designing and
manufacturing its mining equipment in South Africa (it imports engines); to supply excavators, dozers, shovels, dump trucks, graders,
as well as screens and crushers and other mining equipment.
Bird Machines has a similar history to Bell, having been a supplier of agricultural equipment before 1988 when it started to manufacture
mining equipment which is now its speciality. It also manufactures some low profile machines for underground mining
Fermel (Pty.) Ltd originated in South Africa which also represents its main market although it is also represented in Namibia, the DRC,
Tanzania and South America. Besides having wholly owned entities in Zambia , Zimbabwe and Botswana. It provides a range of
mining and road building machines.
In many cases local production may be out of the question at first and traders can set up franchises, but as more mines open there may be a
critical mass to start assembling and later producing locally designed goods.
The service sector can give an even greater and smoother value add to the economy if the skills are in place. These could include:
HR services and employment agencies,
Security Services,
Environmental consultants – Independent environmental consultants are usually a requirement and this opens doors for small to medium
business development,
Appendixes Page 141
Legal practices, lawyers can move into specialisation with mining and environmental law relatively quickly,
Financial and tax services,
Medical practices, doctors will be required both because of increasing numbers around mines,
Drilling subcontrators,
Building contractors, masons, bricklayers, plumbers, painters, electricians,
Rewinding of electrical motors,
Refrigeration engineers,
Toolmakers,
Servicing of all manner of mine equipment.
Regional Integration Research Network | TradeMark Southern Africa+27 12 349 7500 www.trademarksa.org/rirn | [email protected]
ABOUT TRADEMARK SOUTHERN AFRICA
Trade Mark Southern Africa (TMSA) is a UKAid supported project that works with the Common Market for Eastern and Southern Africa (COMESA), the East Africa Community (EAC) and the Southern African Development Community (SADC) Tripartite to lower the physical, political and economic barriers that isolate national economies. The purpose of the programme is to improve southern Africa’s trade performance and competitiveness for the benefit of poor men and women.
TMSA’s activities address current constraints to trade. By supporting regional collaboration through the enabling environment in the COMESA-EAC-SADC Tripartite area, TMSA is helping African countries to unleash their full potential. For more information about TMSA please visit our website at www.trademarksa.org.
Recommended


