lable at ScienceDirect
Atmospheric Environment 45 (2011) 4641e4651
Contents lists avai
Atmospheric Environment
journal homepage: www.elsevier .com/locate/atmosenv
Monitoring spatio-temporal aerosol patterns over Pakistan based on MODIS,TOMS and MISR satellite data and a HYSPLIT model
Khan Alam a,*, Salman Qureshi a,b, Thomas Blaschke a
aDepartment of Geography and Geology, University of Salzburg, Hellbrunnerstrasse 34, Salzburg 5020, AustriabDepartment of Geography, University of Karachi, University Road, Karachi 75270, Pakistan
a r t i c l e i n f o
Article history:Received 6 April 2011Received in revised form15 May 2011Accepted 20 May 2011
Keywords:AerosolsTOMSMODISMISRAERONETHYSPLITAODRemote sensingPakistan
* Corresponding author. Tel.: þ43 681 10787864.E-mail addresses: [email protected] (K. A
edu.pk (S. Qureshi), [email protected] (T.
1352-2310/$ e see front matter � 2011 Elsevier Ltd.doi:10.1016/j.atmosenv.2011.05.055
a b s t r a c t
Three different satellite-borne sensors, namely the Total Ozone Mapping Spectrometer (TOMS), theModerate Resolution Imaging Spectroradiometer (MODIS), and the Multi-angle Imaging Spectroradiometer(MISR), were used to investigate the spatial and temporal variations of aerosols over several cities inPakistan. A Hybrid Single Particle Lagrangian Integrated Trajectory (HYSPLIT) model was used for trajectoryanalysis in order to reconstruct the origins of air masses and understand the spatio-temporal variability ofaerosol concentrations. Recent MODIS aerosol data (2002e2008) and earlier TOMS data (1979e2001)revealed increasing concentrations of aerosols over Pakistan and adjacent areas. Validation of MODIS andMISR derived aerosol optical depths (AODs) with Aerosol Robotic Network (AERONET) data for 2007demonstrated that the MISR data was more accurate when close to the ocean, while the MODIS was moreaccurate over vegetated areas. The relationship between MODIS and MISR AOD data from 2002 to 2008was analyzed, revealing a strong correlation between the two datasets. An assessment of seasonal vari-ability in AOD for industrial, urban, semi-urban, rural, and semi-arid areas revealed maximum AOD valuesduring the summer over all the areas investigated. Back trajectory analyses indicated that while winter airmasses reaching Pakistan had travelled long distances, summer air masses had travelled only shortdistances. The higher aerosol concentrations during the summer are interpreted to be a result of the airmasses spending more time over land during the summer than they do during the winter. Whilemonsoonal rainfall tends to reduce aerosol concentrations by washing aerosols out of the atmosphere, thiseffect is mainly restricted to the eastern and south-eastern parts of Pakistan.
� 2011 Elsevier Ltd. All rights reserved.
1. Introduction
Atmospheric aerosols play an important part in the energybalance of the earth-atmosphere system. Changes in the atmo-spheric aerosol load, greenhouse gases, solar radiation, and landsurface properties alter the energy balance of earth’s atmosphere(Papadimas et al., 2008). Kosmopoulos et al. (2008) stated that “Inthe last two decades aerosols have been recognized as a majorfactor in determining the global climate change (IPCC, 2007), sincethey play a crucial role in the solar and thermal radiative transfer inthe atmosphere”. Aerosols have amajor effect on the solar radiationbudget, both at the surface of the earth and in the atmosphere, aswell as on the hydrological cycle and precipitation rate (Charlsonet al., 1992; Kosmopoulos et al., 2008; Lohmann and Feichter,2005; Ramanathan et al., 2001).
lam), [email protected]).
All rights reserved.
Various aerosol types have distinct effects on the sign andmagnitude of aerosol radiative forcing (Kaskaoustis et al., 2007).Black carbon aerosols have, for example, contributed considerably toglobalwarming (Jacobson, 2001;Penner et al., 2003) andappear to beresponsible for increased rainfall in the southern parts of China and,at the same time, for drought conditions in the northern parts(Menon et al., 2002; Sarkar et al., 2006). Dust particles modify thetransmission of both short-wave and long-wave radiation throughthe atmosphere through atmospheric scattering and absorptionprocesses (Otto et al., 2007) and consequently produce heating in theatmospheric column due to dust absorption (Haywood et al., 2001).Aerosols also have significant effects on non-climatic relatedprocesses e.g., human health and ecosystem services (Smart et al.,2011). Biomass burning and boreal forest fire aerosol events oftenresult in huge smoke plumes that spread thousands of kilometresfrom their sources, causing serious problems with regard to airquality and public health (Torres et al., 2002).
Aerosols concentrations vary in both time and space, influencingthe microphysics of clouds. There is a growing body of literature hasreporting the use of satellite measurements to investigate the
K. Alam et al. / Atmospheric Environment 45 (2011) 4641e46514642
indirect effects of spatial and temporal patterns of aerosols, at bothregional and global scales (Kaufman et al., 2005; Matheson et al.,2005; Nakajima et al., 2001). Satellite remote sensing is an essentialtool formonitoring the global aerosol budget and the radiative effectsthat aerosols have on climate (Penner et al., 1992; Tripathi et al.,2005). In theory, satellite remote sensing allows to the spatialdistribution and properties of aerosols to be assessed, and it also hasthe major benefit of allowing complete and synoptic mapping ofa large area in a single snapshot (Kosmopoulos et al., 2008). Satellite-based remote sensing undoubtedly provides a unique opportunity toderive regional, global, and seasonal spatial patterns for aerosol loadsand aerosol properties. The spatio-temporal processes involved canthen be indirectly described and mapped through modelling tech-niques, e.g., by using the USA’s National Oceanic and AtmosphericAdministration (NOAA) HYSPLIT model (Draxler and Rolph, 2003). Inorder to understand the effects that aerosols have on the earth’sclimate system and human health theymust be routinelymonitored,bothona global scale and on regional or local scales, inparticularly byanalyzing their spatial and temporal patterns.
Nevertheless, ground-based measurements require expensivesoftware or permanent automatic monitoring stations. In severalurban areas of Europe, theUnited States, Australia, and some regionsof Asia, the mass concentration of ambient aerosol particles isroutinely measured by ground stations. However, individualground-based observations represent point measurements and donot have coverage required to map regional or global distributionsof aerosols. One major advancement in this respect has been theintroduction of the AERONET Aerosol Robotic Network (Holbenet al., 1998), which means that satellite remote sensing of aerosolsno longer needs to be largely independent but can be tied in to thiscoordinated and harmonised ground data. Satellite remote sensinghas made tremendous progress within the last 10e15 years: recentMODIS (Chu et al., 2003; Wang and Christopher, 2003) and MISR(Liu et al., 2007) satellite data has been shown to have tremendouspotential for mapping the distribution and properties of aerosols,and for deriving indirect estimates of particulate matter. Sinceground measurements are sparse in many regions of the world,satellite data is able to serve as a surrogate measure for the moni-toring of particulate matter air quality (Gupta et al., 2008).
Aerosol concentrations, particularly in Asia, are continuallyincreasing in virtually all urbanized and industrialized regionsbecause of growing populations, rapid urbanizationwith consequentland use changes, increasing motorized traffic, and increasingindustrialization within, and adjacent to, urban areas. There are, todate, relatively few studies on aerosols in Pakistan (e.g., Alam et al.,2010; Alam et al., 2011; Dutkiewicz et al., 2009; Ghauri et al., 2001).Ranjan et al. (2007) analyzed the seasonal AOD variability over Raj-kot, in India, reporting lower values in winter and higher values insummer, the latter being due to highwind velocities producing largerquantities of wind-driven dust particles. Dey et al. (2005) investi-gated the aerosol concentrations over Kanpur, in India, and foundthat urban and industrial aerosols contributed more than 75% of theobserved AOD during the post-monsoon and winter seasons,whereas natural aerosols contributed 60% of the total AODduring thepre-monsoon and monsoon seasons. Prasad et al. (2007) examinedaerosol variations over the Indo-Gangetic plain and found that theAOD was higher in the summer season than in the winter season.Similarly, Alam et al. (2010) found higher AOD values in summer andlower values in winter for various cities in Pakistan. The correlationbetween MODIS and AERONET AOD over Kanpur during the 2004post-monsoon andwinter seasonswas almost the same asduring thepre-monsoon andmonsoon seasons (Tripathi et al., 2005), but Prasadand Singh (2007) found a moderate correlation between MODIS andAERONET AOD over Kanpur during the broader period from 2001 to2005.
This research has investigatedMODIS andMISR data for Pakistan,compared their AOD retrievals, and validated them against ground-based AERONETAODs. The regional spatio-temporal aerosol patternsfor various major cities in Pakistan have also been assessed usingMODIS and TOMS datasets with a HYSPLIT model. In addition, theseasonal variability of aerosols has been investigated in combinationwith a back trajectory analysis in an attempt to understand thespatial and temporal variability in aerosol load for the selected citiesof Pakistan.
2. Methodology
2.1. Study area
Pakistan has a wide variety of natural resources: high mountainsin the north are home to extensive forests, thewestern hilly areas arerich in mineral resources, and the eastern region, which is consid-ered the most favourable for monsoonal rainfall, and is used foragriculture. In the extreme south of the country, Karachi is a harbourcity, and the business and industrial capital of Pakistan (Fig. 1). Thetopographic variation makes Pakistan geographically unique for anystudy of spatio-temporal patterns. Altitudes within Pakistan rangefrom sea level (i.e., the Indian Ocean) to the highest peaks of thegreater Himalayan region (e.g., Mt. Godwin Austin/K2, at 8611 m).Since the dawn of independence in 1947, the country’s populationhas continued to grow, placing increasing pressure on its resources.Data for ten selected distinct cities in Pakistan (Fig. 1) have beenanalyzed and the spatio-temporal variations in aerosol concentra-tions investigated. These ten cities comprise major urban centres ofPakistan, with generally dense populations and varied distributionpatterns for residential, commercial and industrial land use areas.
2.2. Datasets and analyses
A variety of datasets and their derived properties have beenused for this research. Satellite aerosol properties from the TOMS,MISR, andMODIS sensors were used to understand and analyze thevariability of aerosols over different regions of Pakistan. Ground-based AERONET AOD data was used to validate MISR and MODISAOD products. This study has analyzed aerosol properties,including aerosol concentrations, in terms of the TOMS aerosolindex (AI): the AI dataset is archived and available at http://toms.gsfc.nasa.gov. Table 1 provides detailed information on the dataemployed. Radiances are measured by the TOMS in broad wave-length bands (313, 318, 331, 340, 360 and 380 nm) (Herman et al.,1997). The positive TOMS AI values correspond to absorbing aero-sols, while negative values correspond to non-absorbing aerosols(Torres et al., 2002). For the period from 1979 to 1992 we used dailyTOMS Nimbus-7 data, and for the period from 1997 to 2001 weused TOMS Earth Probe data. Annual means were calculated forboth datasets.
The MODIS sensors onboard NASA’s Terra (launched December1999) and Aqua (launched May 2002) satellites have 36 spectralchannels which provide an abundance of information on atmo-spheric, terrestrial, and oceanic conditions. Aerosol retrieval isdifferent over land (Kaufman et al., 1997) from over oceans (Tanréet al., 1997). Several aerosol parameters are retrieved at a 10 kmspatial resolution fromMODIS daytime data. For our investigationswe have used a MODIS Terra Level-2 daily mean data product(MOD04_L2. in HDF format) at a spatial resolution of 10 � 10 km.The estimated uncertainty of theMODIS AOD product was reportedto be �0.05 � 0.15 (AOD) over land (Chu et al., 2003) and0.03 � 0.05 (AOD) over the ocean (Remer et al., 2005). The NASAMODIS aerosol retrieval algorithm has recently been improved andthe products denoted as C005 were implemented to correct
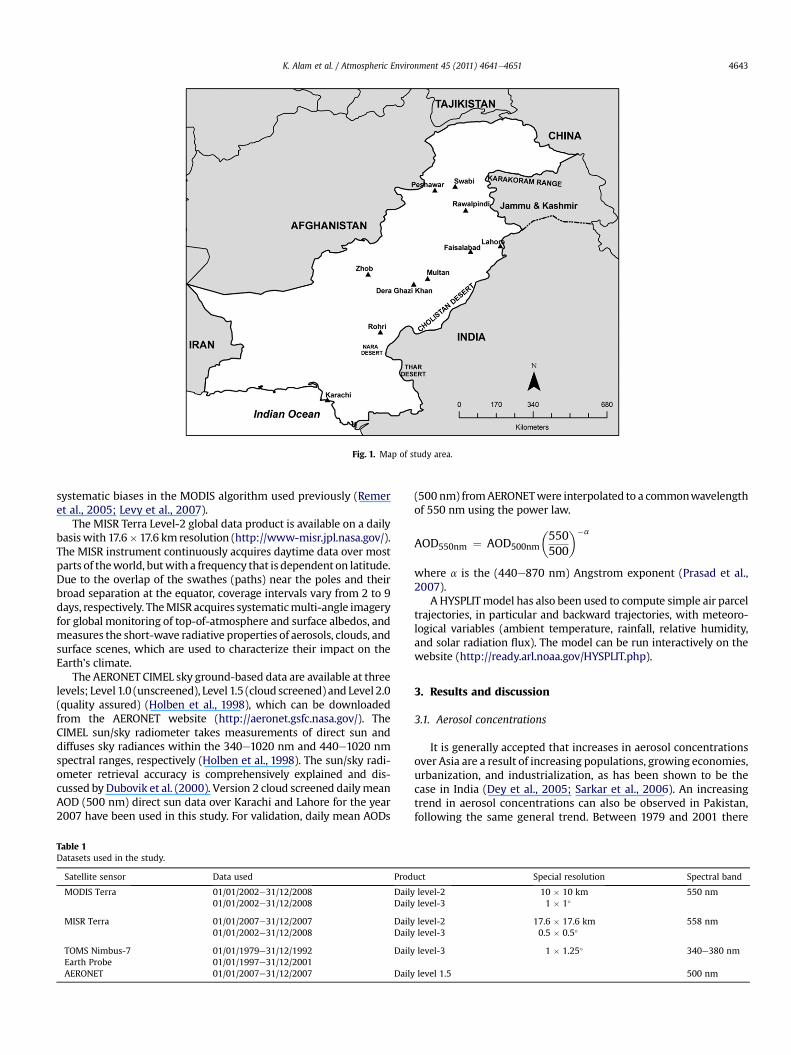
Fig. 1. Map of study area.
K. Alam et al. / Atmospheric Environment 45 (2011) 4641e4651 4643
systematic biases in the MODIS algorithm used previously (Remeret al., 2005; Levy et al., 2007).
The MISR Terra Level-2 global data product is available on a dailybasis with 17.6�17.6 km resolution (http://www-misr.jpl.nasa.gov/).The MISR instrument continuously acquires daytime data over mostparts of theworld, butwith a frequency that is dependent on latitude.Due to the overlap of the swathes (paths) near the poles and theirbroad separation at the equator, coverage intervals vary from 2 to 9days, respectively. TheMISR acquires systematicmulti-angle imageryfor global monitoring of top-of-atmosphere and surface albedos, andmeasures the short-wave radiative properties of aerosols, clouds, andsurface scenes, which are used to characterize their impact on theEarth’s climate.
The AERONET CIMEL sky ground-based data are available at threelevels; Level 1.0 (unscreened), Level 1.5 (cloud screened) and Level 2.0(quality assured) (Holben et al., 1998), which can be downloadedfrom the AERONET website (http://aeronet.gsfc.nasa.gov/). TheCIMEL sun/sky radiometer takes measurements of direct sun anddiffuses sky radiances within the 340e1020 nm and 440e1020 nmspectral ranges, respectively (Holben et al., 1998). The sun/sky radi-ometer retrieval accuracy is comprehensively explained and dis-cussed by Dubovik et al. (2000). Version 2 cloud screened dailymeanAOD (500 nm) direct sun data over Karachi and Lahore for the year2007 have been used in this study. For validation, daily mean AODs
Table 1Datasets used in the study.
Satellite sensor Data used Prod
MODIS Terra 01/01/2002e31/12/2008 Daily01/01/2002e31/12/2008 Daily
MISR Terra 01/01/2007e31/12/2007 Daily01/01/2002e31/12/2008 Daily
TOMS Nimbus-7 01/01/1979e31/12/1992 DailyEarth Probe 01/01/1997e31/12/2001AERONET 01/01/2007e31/12/2007 Daily
(500 nm) fromAERONETwere interpolated to a commonwavelengthof 550 nm using the power law.
AOD550nm ¼ AOD500nm
�550500
��a
where a is the (440e870 nm) Angstrom exponent (Prasad et al.,2007).
A HYSPLITmodel has also been used to compute simple air parceltrajectories, in particular and backward trajectories, with meteoro-logical variables (ambient temperature, rainfall, relative humidity,and solar radiation flux). The model can be run interactively on thewebsite (http://ready.arl.noaa.gov/HYSPLIT.php).
3. Results and discussion
3.1. Aerosol concentrations
It is generally accepted that increases in aerosol concentrationsover Asia are a result of increasing populations, growing economies,urbanization, and industrialization, as has been shown to be thecase in India (Dey et al., 2005; Sarkar et al., 2006). An increasingtrend in aerosol concentrations can also be observed in Pakistan,following the same general trend. Between 1979 and 2001 there
uct Special resolution Spectral band
level-2 10 � 10 km 550 nmlevel-3 1 � 1�
level-2 17.6 � 17.6 km 558 nmlevel-3 0.5 � 0.5�
level-3 1 � 1.25� 340e380 nm
level 1.5 500 nm
K. Alam et al. / Atmospheric Environment 45 (2011) 4641e46514644
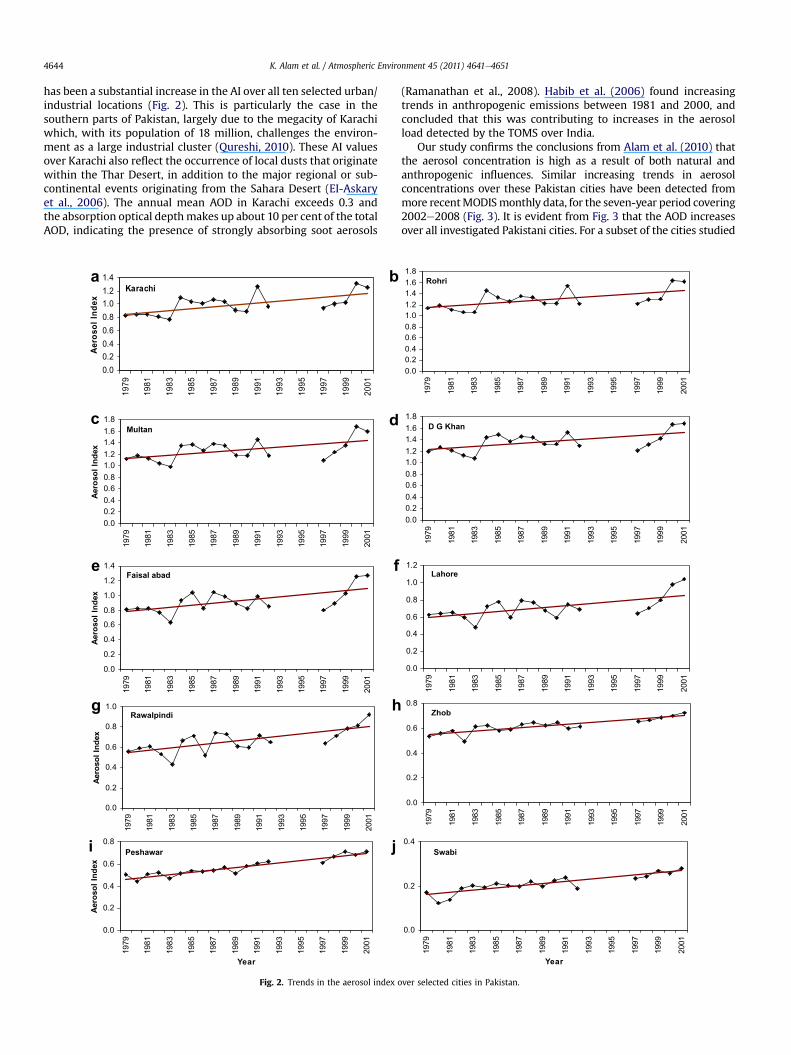
has been a substantial increase in the AI over all ten selected urban/industrial locations (Fig. 2). This is particularly the case in thesouthern parts of Pakistan, largely due to the megacity of Karachiwhich, with its population of 18 million, challenges the environ-ment as a large industrial cluster (Qureshi, 2010). These AI valuesover Karachi also reflect the occurrence of local dusts that originatewithin the Thar Desert, in addition to the major regional or sub-continental events originating from the Sahara Desert (EI-Askaryet al., 2006). The annual mean AOD in Karachi exceeds 0.3 andthe absorption optical depthmakes up about 10 per cent of the totalAOD, indicating the presence of strongly absorbing soot aerosols
Karachi
0.0 0.2 0.4 0.6 0.8 1.0 1.2 1.4
1979
1981
1983
1985
1987
1989
1991
1993
1995
1997
1999
2001
Ae
ro
so
l In
de
x
Multan
0.0 0.2 0.4 0.6 0.8 1.0 1.2 1.4 1.6 1.8
1979
1981
1983
1985
1987
1989
1991
1993
1995
1997
1999
2001
Aero
so
l In
dex
Faisal abad
0.0
0.2
0.4
0.6
0.8
1.0
1.2
1.4
1979
1981
1983
1985
1987
1989
1991
1993
1995
1997
1999
2001
Aero
so
l In
dex
Rawalpindi
0.0
0.2
0.4
0.6
0.8
1.0
1979
1981
1983
1985
1987
1989
1991
1993
1995
1997
1999
2 001
Aero
so
l In
dex
Peshawar
0.0
0.2
0.4
0.6
0.8
1979
1981
1983
1985
1987
1989
1991
1993
1995
1997
1999
2001
Year
Aero
so
l In
dex
a b
d
fe
g h
j i
c
Fig. 2. Trends in the aerosol index o
(Ramanathan et al., 2008). Habib et al. (2006) found increasingtrends in anthropogenic emissions between 1981 and 2000, andconcluded that this was contributing to increases in the aerosolload detected by the TOMS over India.
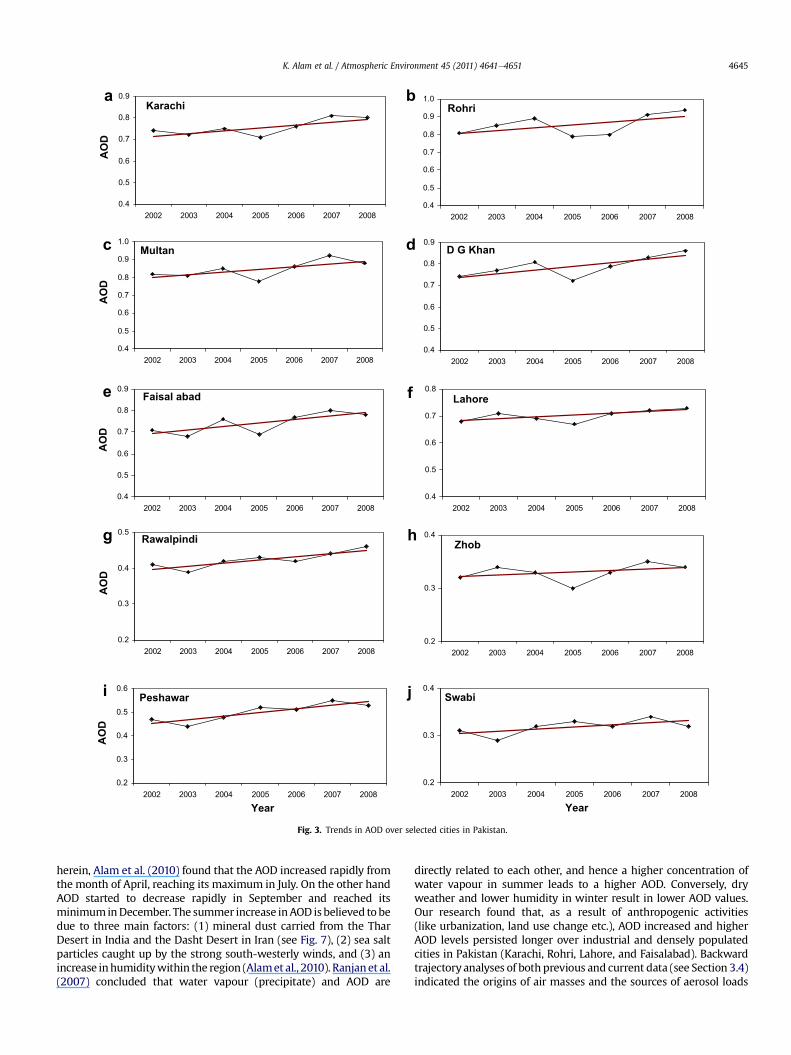
Our study confirms the conclusions from Alam et al. (2010) thatthe aerosol concentration is high as a result of both natural andanthropogenic influences. Similar increasing trends in aerosolconcentrations over these Pakistan cities have been detected frommore recentMODISmonthly data, for the seven-year period covering2002e2008 (Fig. 3). It is evident from Fig. 3 that the AOD increasesover all investigated Pakistani cities. For a subset of the cities studied
Rohri
0.0 0.2 0.4 0.6 0.8 1.0 1.2 1.4 1.6 1.8
1979
1981
1983
1985
1987
1989
1991
1993
1995
1997
1999
2001
D G Khan
0.0 0.2 0.4 0.6 0.8 1.0 1.2 1.4 1.6 1 . 8
1979
1981
1983
1985
1987
1989
1991
1993
1995
1997
1999
2001
Lahore
0.0
0.2
0.4
0.6
0.8
1.0
1 . 2
1979
1981
1983
1985
1987
1989
1991
1993
1995
1997
1999
2001
Zhob
0.0
0.2
0.4
0.6
0.8
1979
1981
1983
1985
1987
1989
1991
1993
1995
1997
1999
2001
Swabi
0.0
0.2
0.4
1979
1981
1983
1985
1987
1989
1991
1993
1995
1997
1999
2001
Year
ver selected cities in Pakistan.
Karachi
0.4
0.5
0.6
0.7
0.8
0.9
2002 2003 2004 2005 2006 2007 2008
AO
D
Rohri
0.4
0.5
0.6
0.7
0.8
0.9
1.0
2002 2003 2004 2005 2006 2007 2008
Multan
0.4
0.5
0.6
0.7
0.8
0.9
1.0
2002 2003 2004 2005 2006 2007 2008
AO
D
D G Khan
0.4
0.5
0.6
0.7
0.8
0.9
2002 2003 2004 2005 2006 2007 2008
Faisal abad
0.4
0.5
0.6
0.7
0.8
0.9
2002 2003 2004 2005 2006 2007 2008
AO
D
Lahore
0.4
0.5
0.6
0.7
0.8
2002 2003 2004 2005 2006 2007 2008
Rawalpindi
0.2
0.3
0.4
0.5
2002 2003 2004 2005 2006 2007 2008
AO
D
Zhob
0.2
0.3
0.4
2002 2003 2004 2005 2006 2007 2008
Peshawar
0.2
0.3
0.4
0.5
0.6
2002 2003 2004 2005 2006 2007 2008
Year
AO
D
Swabi
0.2
0.3
0.4
2002 2003 2004 2005 2006 2007 2008
Year
a b
d c
e
g
j
h
f
i
Fig. 3. Trends in AOD over selected cities in Pakistan.
K. Alam et al. / Atmospheric Environment 45 (2011) 4641e4651 4645
herein, Alam et al. (2010) found that the AOD increased rapidly fromthe month of April, reaching its maximum in July. On the other handAOD started to decrease rapidly in September and reached itsminimum inDecember. The summer increase inAOD isbelieved to bedue to three main factors: (1) mineral dust carried from the TharDesert in India and the Dasht Desert in Iran (see Fig. 7), (2) sea saltparticles caught up by the strong south-westerly winds, and (3) anincrease inhumiditywithin the region (Alamet al., 2010). Ranjanet al.(2007) concluded that water vapour (precipitate) and AOD are
directly related to each other, and hence a higher concentration ofwater vapour in summer leads to a higher AOD. Conversely, dryweather and lower humidity in winter result in lower AOD values.Our research found that, as a result of anthropogenic activities(like urbanization, land use change etc.), AOD increased and higherAOD levels persisted longer over industrial and densely populatedcities in Pakistan (Karachi, Rohri, Lahore, and Faisalabad). Backwardtrajectory analyses of both previous and current data (see Section 3.4)indicated the origins of air masses and the sources of aerosol loads
K. Alam et al. / Atmospheric Environment 45 (2011) 4641e46514646
arriving in Pakistan, revealing which particular aerosol loads origi-nated from adjacent regions rather than from the investigated citiesthemselves.
3.2. Intercomparison of MODIS, MISR and AERONET AOD data
An intercomparison of AOD values from different satellite sensorsis necessary if a long-term database for climatological studies is to beestablished, and also to improve the accuracy and the coverageachievable with a single sensor (Prasad and Singh, 2007). Xiao et al.(2009) recently examined MISR and MODIS AOD retrievals forSouth-East Asia froma spatial perspective and foundgood correlationbetween the retrievals from each of these sensors. Prasad and Singh(2007) carried out a validation of monthly average Level-3 MODISand MISR AODs over Khanpur for summer and winter seasonsbetween 2001 and 2004, and found thatMODIS andMISRAODswerecorrelated with R2 > 0.7 in 20.5% of all pixels in the Indo-Gangeticregion, but in only 13.9% of the pixels at worldwide average. The
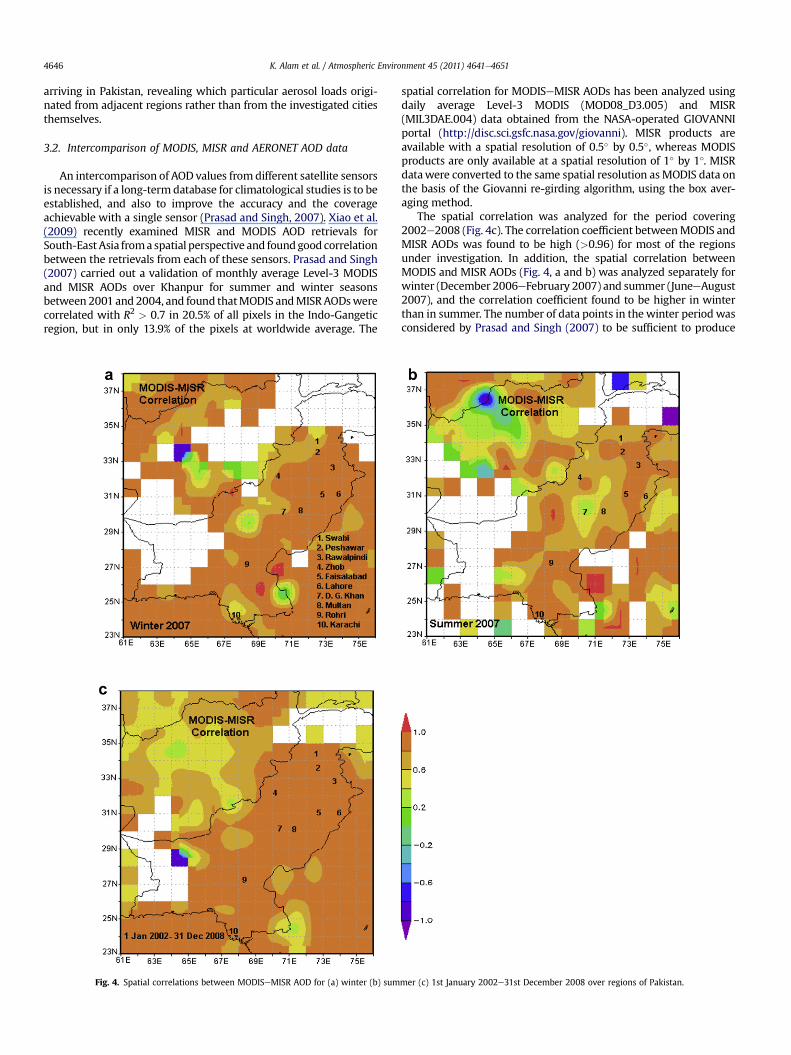
Fig. 4. Spatial correlations between MODISeMISR AOD for (a) winter (b) sum
spatial correlation for MODISeMISR AODs has been analyzed usingdaily average Level-3 MODIS (MOD08_D3.005) and MISR(MIL3DAE.004) data obtained from the NASA-operated GIOVANNIportal (http://disc.sci.gsfc.nasa.gov/giovanni). MISR products areavailable with a spatial resolution of 0.5� by 0.5�, whereas MODISproducts are only available at a spatial resolution of 1� by 1�. MISRdatawere converted to the same spatial resolution asMODIS data onthe basis of the Giovanni re-girding algorithm, using the box aver-aging method.
The spatial correlation was analyzed for the period covering2002e2008 (Fig. 4c). The correlation coefficient betweenMODIS andMISR AODs was found to be high (>0.96) for most of the regionsunder investigation. In addition, the spatial correlation betweenMODIS and MISR AODs (Fig. 4, a and b) was analyzed separately forwinter (December 2006eFebruary 2007) and summer (JuneeAugust2007), and the correlation coefficient found to be higher in winterthan in summer. The number of data points in thewinter period wasconsidered by Prasad and Singh (2007) to be sufficient to produce
mer (c) 1st January 2002e31st December 2008 over regions of Pakistan.
K. Alam et al. / Atmospheric Environment 45 (2011) 4641e4651 4647
reliable results. The correlation was high (0.9e1.0) for the winterdata from seven of the cities (Peshawar, Rawalpindi, Zhob, Faisala-bad, Lahore, Multan and Rohri), while for the three other cities orregions (Karachi, in particular, being more of a geographical regionthan a city - see Qureshi, 2010), i.e., Swabi, D.G. Khan and Karachi, thecorrelation was only moderate (between 0.6 and 0.8). The correla-tion in summer was found to be high (0.9e1.0) for five of the regions(Peshawar, Rawalpindi, Faisalabad, Rohri and Karachi), moderate(0.6e0.8) for four regions (Swabi, Zhob, Lahore and Multan), andconsiderably lower (0.2e0.4) for one of the regions (D.G. Khan). Thenegative correlation between MODIS and MISR (Fig. 4b) could beseen in the extreme North-East of Pakistan. Snow cover in the regionleads to insufficient MODIS and MISR data points in the area,consequently weaker data analyses. Similarly the negative correla-tion for MODISeMISR could also be observed over the Kharan desertin the North-Western Balochistan. The MISR AODs were not used forthe trend analysis due to insufficient data points.
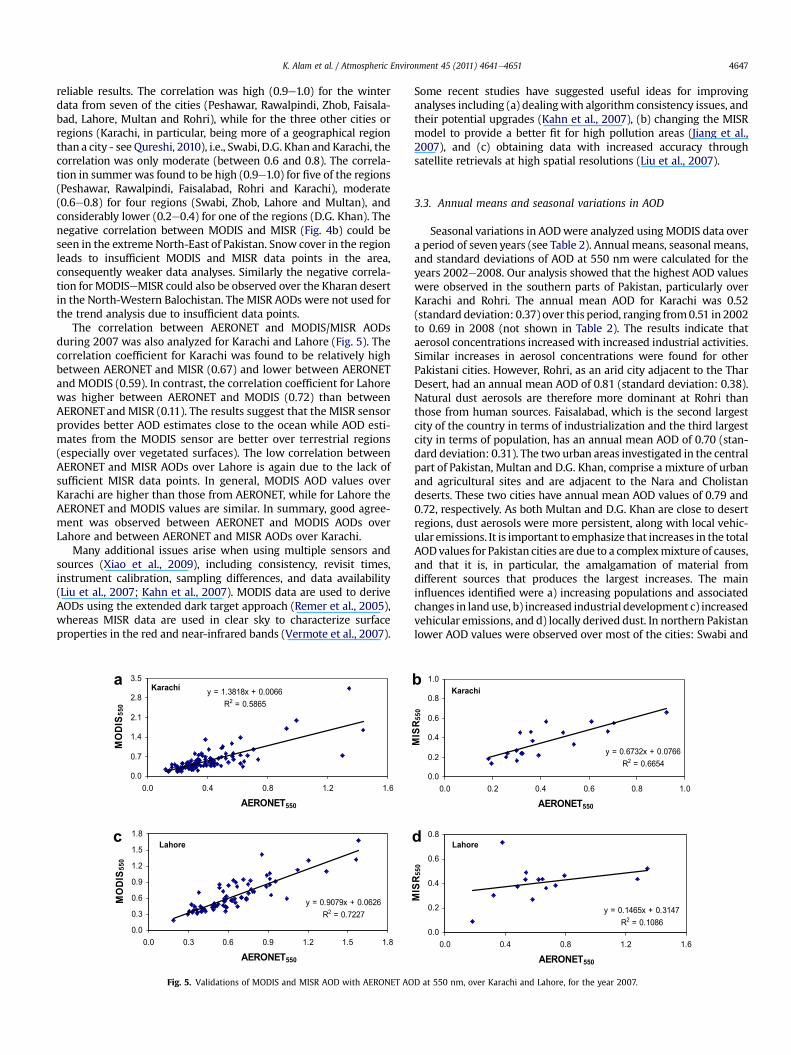
The correlation between AERONET and MODIS/MISR AODsduring 2007 was also analyzed for Karachi and Lahore (Fig. 5). Thecorrelation coefficient for Karachi was found to be relatively highbetween AERONET and MISR (0.67) and lower between AERONETand MODIS (0.59). In contrast, the correlation coefficient for Lahorewas higher between AERONET and MODIS (0.72) than betweenAERONET and MISR (0.11). The results suggest that the MISR sensorprovides better AOD estimates close to the ocean while AOD esti-mates from the MODIS sensor are better over terrestrial regions(especially over vegetated surfaces). The low correlation betweenAERONET and MISR AODs over Lahore is again due to the lack ofsufficient MISR data points. In general, MODIS AOD values overKarachi are higher than those from AERONET, while for Lahore theAERONET and MODIS values are similar. In summary, good agree-ment was observed between AERONET and MODIS AODs overLahore and between AERONET and MISR AODs over Karachi.
Many additional issues arise when using multiple sensors andsources (Xiao et al., 2009), including consistency, revisit times,instrument calibration, sampling differences, and data availability(Liu et al., 2007; Kahn et al., 2007). MODIS data are used to deriveAODs using the extended dark target approach (Remer et al., 2005),whereas MISR data are used in clear sky to characterize surfaceproperties in the red and near-infrared bands (Vermote et al., 2007).
Karachi y = 1.3818x + 0.0066 R 2 = 0.5865
0.0
0.7
1.4
2.1
2.8
3.5
0.0 0.4 0.8 1.2 1.6
AERONET 550
MO
DIS
55
0
Lahore
y = 0.9079x + 0.0626 R 2 = 0.7227
0.0
0.3
0.6
0.9
1.2
1.5
1.8
0.0 0.3 0.6 0.9 1.2 1.5 1.8
AERONET 550
MO
DIS
55
0
a
c
Fig. 5. Validations of MODIS and MISR AOD with AERONET AO
Some recent studies have suggested useful ideas for improvinganalyses including (a) dealingwith algorithm consistency issues, andtheir potential upgrades (Kahn et al., 2007), (b) changing the MISRmodel to provide a better fit for high pollution areas (Jiang et al.,2007), and (c) obtaining data with increased accuracy throughsatellite retrievals at high spatial resolutions (Liu et al., 2007).
3.3. Annual means and seasonal variations in AOD
Seasonal variations in AODwere analyzed using MODIS data overa period of seven years (see Table 2). Annual means, seasonal means,and standard deviations of AOD at 550 nm were calculated for theyears 2002e2008. Our analysis showed that the highest AOD valueswere observed in the southern parts of Pakistan, particularly overKarachi and Rohri. The annual mean AOD for Karachi was 0.52(standard deviation: 0.37) over this period, ranging from0.51 in 2002to 0.69 in 2008 (not shown in Table 2). The results indicate thataerosol concentrations increased with increased industrial activities.Similar increases in aerosol concentrations were found for otherPakistani cities. However, Rohri, as an arid city adjacent to the TharDesert, had an annual mean AOD of 0.81 (standard deviation: 0.38).Natural dust aerosols are therefore more dominant at Rohri thanthose from human sources. Faisalabad, which is the second largestcity of the country in terms of industrialization and the third largestcity in terms of population, has an annual mean AOD of 0.70 (stan-dard deviation: 0.31). The two urban areas investigated in the centralpart of Pakistan, Multan and D.G. Khan, comprise a mixture of urbanand agricultural sites and are adjacent to the Nara and Cholistandeserts. These two cities have annual mean AOD values of 0.79 and0.72, respectively. As both Multan and D.G. Khan are close to desertregions, dust aerosols were more persistent, along with local vehic-ular emissions. It is important to emphasize that increases in the totalAODvalues for Pakistan cities are due to a complexmixture of causes,and that it is, in particular, the amalgamation of material fromdifferent sources that produces the largest increases. The maininfluences identified were a) increasing populations and associatedchanges in land use, b) increased industrial development c) increasedvehicular emissions, and d) locally derived dust. In northern Pakistanlower AOD values were observed over most of the cities: Swabi and
Karachi
y = 0.6732x + 0.0766 R 2 = 0.6654
0.0
0.2
0.4
0.6
0.8
1.0
0.0 0.2 0.4 0.6 0.8 1.0
AERONET 550
MIS
R 5
50
Lahore
y = 0.1465x + 0.3147 R 2 = 0.1086
0.0
0.2
0.4
0.6
0.8
0.0 0.4 0.8 1.2 1.6
AERONET 550
MIS
R 5
50
b
d
D at 550 nm, over Karachi and Lahore, for the year 2007.
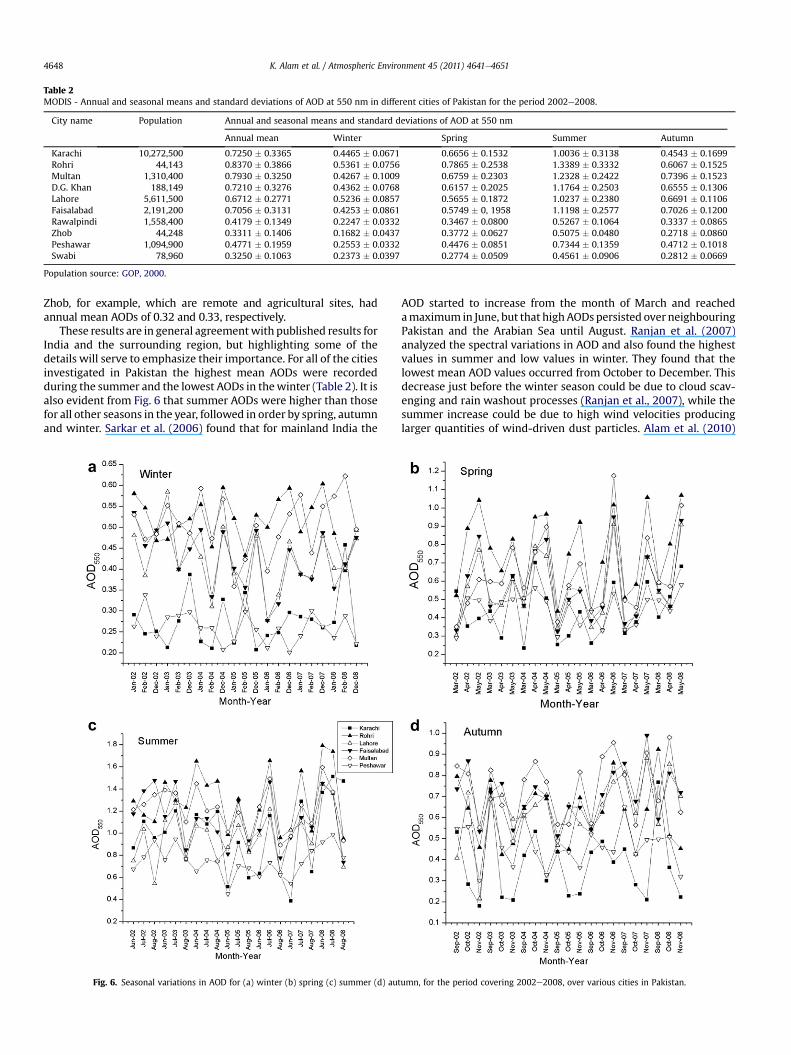
Table 2MODIS - Annual and seasonal means and standard deviations of AOD at 550 nm in different cities of Pakistan for the period 2002e2008.
City name Population Annual and seasonal means and standard deviations of AOD at 550 nm
Annual mean Winter Spring Summer Autumn
Karachi 10,272,500 0.7250 � 0.3365 0.4465 � 0.0671 0.6656 � 0.1532 1.0036 � 0.3138 0.4543 � 0.1699Rohri 44,143 0.8370 � 0.3866 0.5361 � 0.0756 0.7865 � 0.2538 1.3389 � 0.3332 0.6067 � 0.1525Multan 1,310,400 0.7930 � 0.3250 0.4267 � 0.1009 0.6759 � 0.2303 1.2328 � 0.2422 0.7396 � 0.1523D.G. Khan 188,149 0.7210 � 0.3276 0.4362 � 0.0768 0.6157 � 0.2025 1.1764 � 0.2503 0.6555 � 0.1306Lahore 5,611,500 0.6712 � 0.2771 0.5236 � 0.0857 0.5655 � 0.1872 1.0237 � 0.2380 0.6691 � 0.1106Faisalabad 2,191,200 0.7056 � 0.3131 0.4253 � 0.0861 0.5749 � 0, 1958 1.1198 � 0.2577 0.7026 � 0.1200Rawalpindi 1,558,400 0.4179 � 0.1349 0.2247 � 0.0332 0.3467 � 0.0800 0.5267 � 0.1064 0.3337 � 0.0865Zhob 44,248 0.3311 � 0.1406 0.1682 � 0.0437 0.3772 � 0.0627 0.5075 � 0.0480 0.2718 � 0.0860Peshawar 1,094,900 0.4771 � 0.1959 0.2553 � 0.0332 0.4476 � 0.0851 0.7344 � 0.1359 0.4712 � 0.1018Swabi 78,960 0.3250 � 0.1063 0.2373 � 0.0397 0.2774 � 0.0509 0.4561 � 0.0906 0.2812 � 0.0669
Population source: GOP, 2000.
K. Alam et al. / Atmospheric Environment 45 (2011) 4641e46514648
Zhob, for example, which are remote and agricultural sites, hadannual mean AODs of 0.32 and 0.33, respectively.
These results are in general agreementwith published results forIndia and the surrounding region, but highlighting some of thedetails will serve to emphasize their importance. For all of the citiesinvestigated in Pakistan the highest mean AODs were recordedduring the summer and the lowest AODs in thewinter (Table 2). It isalso evident from Fig. 6 that summer AODs were higher than thosefor all other seasons in the year, followed in order by spring, autumnand winter. Sarkar et al. (2006) found that for mainland India the
Fig. 6. Seasonal variations in AOD for (a) winter (b) spring (c) summer (d) aut
AOD started to increase from the month of March and reachedamaximum in June, but that highAODspersisted over neighbouringPakistan and the Arabian Sea until August. Ranjan et al. (2007)analyzed the spectral variations in AOD and also found the highestvalues in summer and low values in winter. They found that thelowest mean AOD values occurred from October to December. Thisdecrease just before the winter season could be due to cloud scav-enging and rain washout processes (Ranjan et al., 2007), while thesummer increase could be due to high wind velocities producinglarger quantities of wind-driven dust particles. Alam et al. (2010)
umn, for the period covering 2002e2008, over various cities in Pakistan.
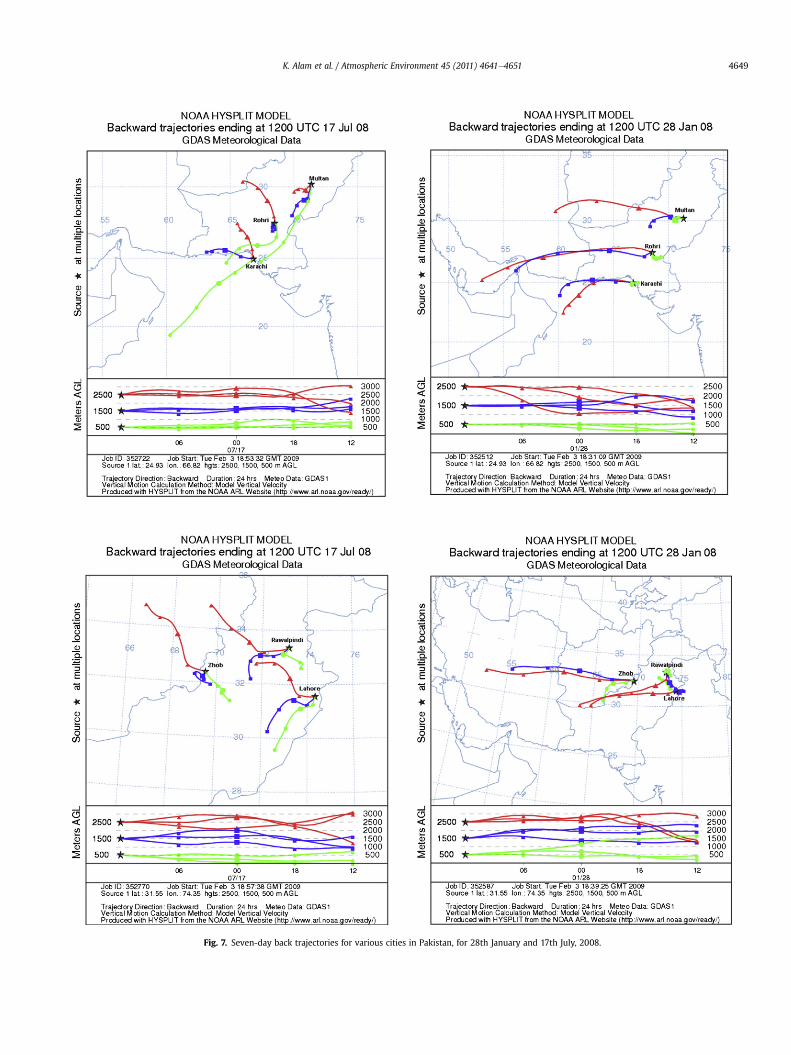
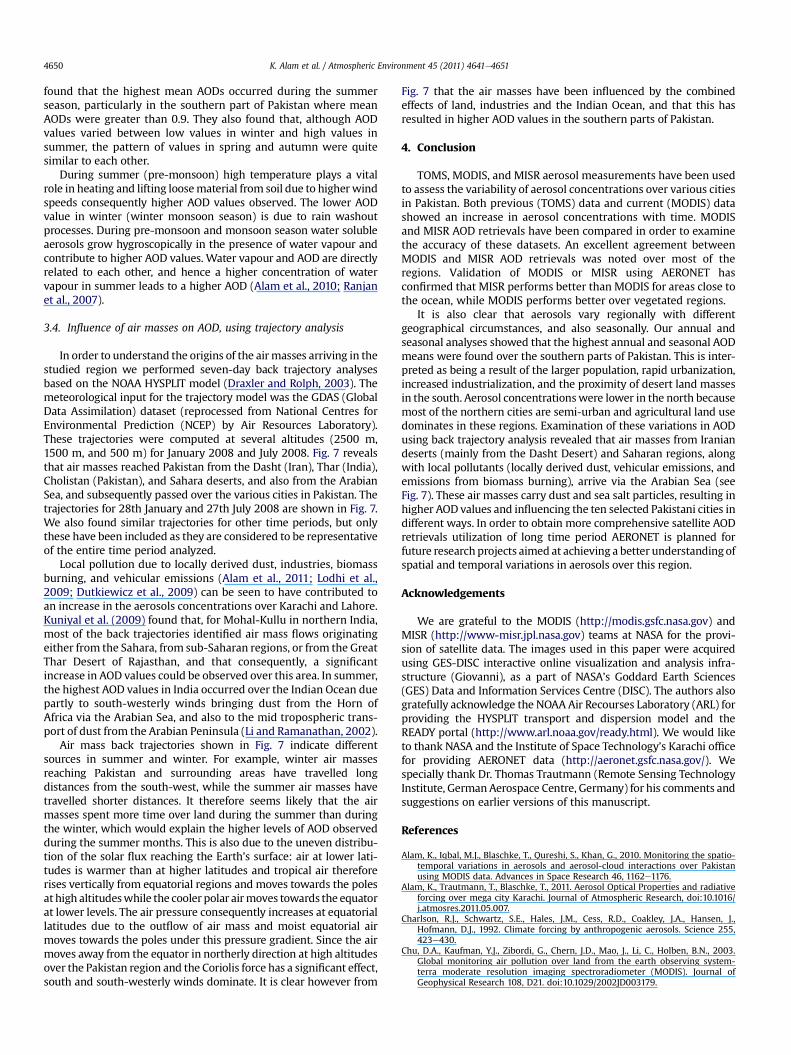
Fig. 7. Seven-day back trajectories for various cities in Pakistan, for 28th January and 17th July, 2008.
K. Alam et al. / Atmospheric Environment 45 (2011) 4641e4651 4649
K. Alam et al. / Atmospheric Environment 45 (2011) 4641e46514650
found that the highest mean AODs occurred during the summerseason, particularly in the southern part of Pakistan where meanAODs were greater than 0.9. They also found that, although AODvalues varied between low values in winter and high values insummer, the pattern of values in spring and autumn were quitesimilar to each other.
During summer (pre-monsoon) high temperature plays a vitalrole in heating and lifting loosematerial from soil due to higherwindspeeds consequently higher AOD values observed. The lower AODvalue in winter (winter monsoon season) is due to rain washoutprocesses. During pre-monsoon and monsoon season water solubleaerosols grow hygroscopically in the presence of water vapour andcontribute to higher AOD values. Water vapour and AOD are directlyrelated to each other, and hence a higher concentration of watervapour in summer leads to a higher AOD (Alam et al., 2010; Ranjanet al., 2007).
3.4. Influence of air masses on AOD, using trajectory analysis
In order to understand the origins of the airmasses arriving in thestudied region we performed seven-day back trajectory analysesbased on the NOAA HYSPLIT model (Draxler and Rolph, 2003). Themeteorological input for the trajectory model was the GDAS (GlobalData Assimilation) dataset (reprocessed from National Centres forEnvironmental Prediction (NCEP) by Air Resources Laboratory).These trajectories were computed at several altitudes (2500 m,1500 m, and 500 m) for January 2008 and July 2008. Fig. 7 revealsthat air masses reached Pakistan from the Dasht (Iran), Thar (India),Cholistan (Pakistan), and Sahara deserts, and also from the ArabianSea, and subsequently passed over the various cities in Pakistan. Thetrajectories for 28th January and 27th July 2008 are shown in Fig. 7.We also found similar trajectories for other time periods, but onlythese have been included as they are considered to be representativeof the entire time period analyzed.
Local pollution due to locally derived dust, industries, biomassburning, and vehicular emissions (Alam et al., 2011; Lodhi et al.,2009; Dutkiewicz et al., 2009) can be seen to have contributed toan increase in the aerosols concentrations over Karachi and Lahore.Kuniyal et al. (2009) found that, for Mohal-Kullu in northern India,most of the back trajectories identified air mass flows originatingeither from the Sahara, from sub-Saharan regions, or from the GreatThar Desert of Rajasthan, and that consequently, a significantincrease in AOD values could be observed over this area. In summer,the highest AOD values in India occurred over the Indian Ocean duepartly to south-westerly winds bringing dust from the Horn ofAfrica via the Arabian Sea, and also to the mid tropospheric trans-port of dust from the Arabian Peninsula (Li and Ramanathan, 2002).
Air mass back trajectories shown in Fig. 7 indicate differentsources in summer and winter. For example, winter air massesreaching Pakistan and surrounding areas have travelled longdistances from the south-west, while the summer air masses havetravelled shorter distances. It therefore seems likely that the airmasses spent more time over land during the summer than duringthe winter, which would explain the higher levels of AOD observedduring the summer months. This is also due to the uneven distribu-tion of the solar flux reaching the Earth’s surface: air at lower lati-tudes is warmer than at higher latitudes and tropical air thereforerises vertically from equatorial regions and moves towards the polesat high altitudeswhile the cooler polar airmoves towards the equatorat lower levels. The air pressure consequently increases at equatoriallatitudes due to the outflow of air mass and moist equatorial airmoves towards the poles under this pressure gradient. Since the airmoves away from the equator in northerly direction at high altitudesover the Pakistan region and the Coriolis force has a significant effect,south and south-westerly winds dominate. It is clear however from
Fig. 7 that the air masses have been influenced by the combinedeffects of land, industries and the Indian Ocean, and that this hasresulted in higher AOD values in the southern parts of Pakistan.
4. Conclusion
TOMS, MODIS, and MISR aerosol measurements have been usedto assess the variability of aerosol concentrations over various citiesin Pakistan. Both previous (TOMS) data and current (MODIS) datashowed an increase in aerosol concentrations with time. MODISand MISR AOD retrievals have been compared in order to examinethe accuracy of these datasets. An excellent agreement betweenMODIS and MISR AOD retrievals was noted over most of theregions. Validation of MODIS or MISR using AERONET hasconfirmed that MISR performs better than MODIS for areas close tothe ocean, while MODIS performs better over vegetated regions.
It is also clear that aerosols vary regionally with differentgeographical circumstances, and also seasonally. Our annual andseasonal analyses showed that the highest annual and seasonal AODmeans were found over the southern parts of Pakistan. This is inter-preted as being a result of the larger population, rapid urbanization,increased industrialization, and the proximity of desert land massesin the south. Aerosol concentrationswere lower in the north becausemost of the northern cities are semi-urban and agricultural land usedominates in these regions. Examination of these variations in AODusing back trajectory analysis revealed that air masses from Iraniandeserts (mainly from the Dasht Desert) and Saharan regions, alongwith local pollutants (locally derived dust, vehicular emissions, andemissions from biomass burning), arrive via the Arabian Sea (seeFig. 7). These air masses carry dust and sea salt particles, resulting inhigher AOD values and influencing the ten selected Pakistani cities indifferent ways. In order to obtain more comprehensive satellite AODretrievals utilization of long time period AERONET is planned forfuture research projects aimed at achieving a better understandingofspatial and temporal variations in aerosols over this region.
Acknowledgements
We are grateful to the MODIS (http://modis.gsfc.nasa.gov) andMISR (http://www-misr.jpl.nasa.gov) teams at NASA for the provi-sion of satellite data. The images used in this paper were acquiredusing GES-DISC interactive online visualization and analysis infra-structure (Giovanni), as a part of NASA’s Goddard Earth Sciences(GES) Data and Information Services Centre (DISC). The authors alsogratefully acknowledge the NOAA Air Recourses Laboratory (ARL) forproviding the HYSPLIT transport and dispersion model and theREADY portal (http://www.arl.noaa.gov/ready.html). We would liketo thank NASA and the Institute of Space Technology’s Karachi officefor providing AERONET data (http://aeronet.gsfc.nasa.gov/). Wespecially thank Dr. Thomas Trautmann (Remote Sensing TechnologyInstitute, GermanAerospace Centre, Germany) for his comments andsuggestions on earlier versions of this manuscript.
References
Alam, K., Iqbal, M.J., Blaschke, T., Qureshi, S., Khan, G., 2010. Monitoring the spatio-temporal variations in aerosols and aerosol-cloud interactions over Pakistanusing MODIS data. Advances in Space Research 46, 1162e1176.
Alam, K., Trautmann, T., Blaschke, T., 2011. Aerosol Optical Properties and radiativeforcing over mega city Karachi. Journal of Atmospheric Research, doi:10.1016/j.atmosres.2011.05.007.
Charlson, R.J., Schwartz, S.E., Hales, J.M., Cess, R.D., Coakley, J.A., Hansen, J.,Hofmann, D.J., 1992. Climate forcing by anthropogenic aerosols. Science 255,423e430.
Chu, D.A., Kaufman, Y.J., Zibordi, G., Chern, J.D., Mao, J., Li, C., Holben, B.N., 2003.Global monitoring air pollution over land from the earth observing system-terra moderate resolution imaging spectroradiometer (MODIS). Journal ofGeophysical Research 108, D21. doi:10.1029/2002JD003179.
K. Alam et al. / Atmospheric Environment 45 (2011) 4641e4651 4651
Dey, S., Tripathi, S.N., Singh, R.P., Holben, B.N., 2005. Seasonal variability of aerosolparameters over Kanpur, an urban site in Indo-Gangetic basin. Advances inSpace Research 36, 778e782.
Draxler, R.R., Rolph, G.D., 2003. HYSPLIT (HYbrid Single-Particle Lagrangian IntegratedTrajectory)Model Access via theNOAAARL READYWebsite. NOAAAir Resour. Lab.,Silver Spring, Md. Available at: http://www.arl.noaa.gov/ready/hysplit4.html.
Dubovik, O., Smirnov, A., Holben, B.N., King, M.D., Kaufman, Y.J., Eck, T.F., Slutsker, I.,2000. Accuracy assessments of aerosol optical properties retrieved from aerosolrobotic network (AERONET) sun and sky radiance measurements. Journal ofGeophysical Research 105, 9791e9806.
Dutkiewicz, V.A., Alvi, S., Ghauri, B., Choudhary, M.I., Husain, L., 2009. Black carbonaerosols in urban air in South Asia. Atmospheric Environment 43, 1737e1744.
EI-Askary, H., Gautam, R., Singh, R.P., Kafatos, M., 2006. Dust storms detection overthe Indo-Gangetic basin using multi sensor data. Advances in Space Research37, 728e733.
Ghauri, B.M., Mirza, M.I., Richter, R., Dutkiewicz, V.A., Rusheed, A., Khan, A.R.,Husain, L., 2001. Composition of aerosols and cloud water at a remote mountainsite (2.8 kms) in Pakistan. Chemosphere: Global Science Change 3, 51e63.
Government of Pakistan (GOP), 2000. Provincial Census Reports, Pakistan: Demo-graphic Survey 1998. Federal Bureau of Statistics, Statistics Division, Govern-ment of Pakistan, Islamabad.
Gupta, P., Christopher, P.A., Wang, J., Gehring, R., Lee, Y., Kumar, N., 2008. Satelliteremote sensing of particulate matter and air quality assessment over globalcities. Atmospheric Environment 40, 5880e5892.
Habib, G., Venkataraman, C., Chiapello, I., Ramachandran, S., Boucher, O., Reddy, M.S.,2006. Seasonal and interannual variability in absorbing aerosols over Indiaderived from TOMS: relationship to regional meteorology and emissions.Atmospheric Environment 40, 1909e1921.
Haywood, J.M., Francis, P.N., Glew, M.D., Taylor, J.P., 2001. Optical properties and directradiative effect of Saharan dust: a case study of two Saharan dust outbreaks usingaircraft data. Journal of Geophysical Research 106, 18417e18430.
Herman, J.R., Bhartia, P.B., Torres, O., Hsu, C., Seftor, C.J., Celarier, E., 1997. Globaldistribution of UV-absorbing aerosols from Nimbus 7/TOMS data. Journal ofGeophysical Research 102, 16911e16921.
Holben, B.N., Eck, T.F., Slutsker, I., Tanré, D., Buis, J.P., Setzer, A., Vermote, E.,Reagan, J.A., Kaufman, Y.J., Nakajima, T., Lavenu, F., Jankowiak, I., Smirnov, A.,1998. AERONET-A federated instrument network and data archive for aerosolcharacterization. Remote Sensing of Environment 66, 1e16.
Intergovernmental Panel on Climate Change (IPCC), 2007. Climate Change: ThePhysical Science Basis. Cambridge University Press, New York, pp. 131e216.
Jacobson, M.Z., 2001. Strong radiative heating due to the mixing state of blackcarbon in atmospheric aerosols. Nature 409, 695e698.
Jiang, X., Liu, Y., Yu, B., Jiang, M., 2007. Comparison of MISR aerosol optical thicknesswith AERONET measurements in Beijing metropolitan area. Remote Sensing ofEnvironment 107, 45e53.
Kahn, R.A., Garay, M.J., Nelson, D.L., Yau, K.K., Bull, M.A., Gaitley, B.J., Martonchik, J.V.,Levy, R.C., 2007. Satellite-derived aerosol optical depth over dark water fromMISR and MODIS: comparisons with AERONET and implications for climatolog-ical studies. Journal of Geophysical Research 112. doi:10.1029/2006JD008175.
Kaskaoustis, D.G., Kambezidis, H.D., Hatzianastassiou, N., Kosmopoulos, P.G.,Badarinath, V.S., 2007. Aerosol climatology: on the discrimination of aerosol typesover four AERONET sites. Atmospheric Chemistry and Physics 7, 6357e6411.
Kaufman, Y.J., Tanré, D., Remer, L.A., Vermote, E.F., Chu, A., Holben, B.N., 1997.Operational remote sensing of tropospheric aerosol over land from EOSModerate-resolution Imaging Spectroradiometer. Journal of GeophysicalResearch 102, 17051e17067.
Kaufman, Y.M., Koren, I., Remer, L.A., Rosenfield, D., Rudich, Y., 2005. The effect ofsmoke, dust, andpollution aerosol on shallowclouddevelopmentover theAtlanticOcean. Proceedings of the National Academy of Sciences 102, 11207e11212.
Kosmopoulos, P.G., Kaskaoutis, D.G., Nastos, P.T., Kambezidis, H.D., 2008. Seasonalvariation of columnar aerosol optical properties over Athens, Greece, based onMODIS data. Remote Sensing of Environment 112, 2354e2366.
Kuniyal, J.C., Thakur, A., Thakur, H.K., Sharma, S., Pant, P., Rawat, P.S., Moorthy, K.K., 2009.Aerosol optical depths at Mohal-Kullu in the northwestern Indian Himalayan highaltitude station during ICARB. Journal of Earth System Science 118, 41e48.
Levy, R.C., Remer, L.A., Mattoo, S., Vermote, E.F., Kaufman, Y.J., 2007. Second-gener-ation operational algorithm: retrieval of aerosol properties over land frominversion of moderate resolution imaging spectroradiometer spectral reflec-tance. Journal of Geophysical Research 112, D13211. doi:10.1029/2006JD007811.
Li, F., Ramanathan, V., 2002. Winter to summer monsoon variation of aerosol opticaldepth over the tropical Indian Ocean. Journal of Geophysical Research 107 (D16)1029/2001JD000949.
Liu, Y., Franklin, M., Kahn, R., Koutrakis, P., 2007. Using aerosol optical thickness topredict ground-level PM concentrations in the St. Louis area: a comparisonbetween MISR and MODIS. Remote Sensing of Environment 107, 33e44.
Lodhi, A., Ghauri, B., Khan, M.R., Rehman, S., Shafique, S., 2009. Particulate matter(PM2.5) concentration and source apportionment in Lahore. Journal of theBrazilian Chemical Society 20, 1811e1820.
Lohmann, U., Feichter, J., 2005. Global indirect aerosol effects: a review.Atmospheric Chemistry and Physics 5, 715e737.
Matheson, M.A., Coakley, J.A., Tahnk, W.R., 2005. Aerosol and cloud property rela-tionships for summertime stratiform clouds in the northern Atlantic fromadvanced very high resolution radiometer observations. Journal of GeophysicalResearch 110, D24204. doi:10.1029/2005JD006165.
Menon, S., Hansen, J., Nazarenko, L., Luo, Y., 2002. Climate effects of black carbonaerosols in China and India. Science 297, 2250e2253.
Nakajima, T., Higurashi, A., Kawamoto, K., Penner, J.E., 2001. A possible correlationbetween satellite-derived cloud and aerosol microphysical parameters. Journalof Geophysical Research Letters 28, 1171e1174.
Otto, S., de Reus, M., Trautmann, T., Thomas, A., Wendisch, M., Borrmann, S., 2007.Atmospheric radiative effects of an in situ measured Saharan dust plume andthe role of large particles. Atmospheric Chemistry and Physics 7, 4887e4903.
Papadimas, C.D., Hatzianastassiou, N., Mihaloppoulos, N., Kanakidou, M.,Katsoulis, B.D., Vardavas, I., 2008. Assessment of the MODIS collections C005and C004 aerosol optical depth products over the Mediterranean basin.Atmospheric Chemistry and Physics 9, 2987e2999.
Penner, J.E., Dickinson, R.E., O’Neill, C.A., 1992. Effects of aerosols from biomassburning on the global radiation budget. Science 256, 1432e1434.
Penner, J.E., Zhang, S.Y., Chuang, C.C., 2003. Soot and smoke may not warm climate.Journal of Geophysical Research 108, D21. doi:10.1029/2003JD003409.
Prasad, A.K., Singh, R.P., 2007. Comparison of MISR-MODIS aerosol optical depthover the Indo-Gangetic basin during the winter and summer seasons(2000e2005). Remote Sensing of Environment 107, 109e119.
Prasad, A.K., Singh, S., Chauhan, S.S., Srivastava, M.K., Singh, R.P., Singh, R., 2007.Aerosol radiative forcing over the Indo-Gangetic plains during major duststorms. Atmospheric Environment 41, 6289e6301.
Qureshi, S., 2010. The fast growing megacity Karachi as a frontier of environmentalchallenges: urbanization and contemporary urbanism issues. Journal of Geog-raphy and Regional Planning 3, 306e321.
Ramanathan, V., Crutzen, P.J., Kiehl, J.T., Rosenfeld, D., 2001. Aerosol, climate, andhydrological cycle. Science 294, 2119e2124.
Ranjan, R.R., Joshi, H.P., Iyer, K.N., 2007. Spectral variation of total column aerosoloptical depth over Rajkot: a tropical semi-arid Indian station. Aerosol and AirQuality Research 7, 33e45.
Remer, L.A., Kaufman, Y.J., Tanré, D., Mattoo, S., Chu, D.A., Martins, J.V., Li, R.R.,Ichoku, C., Levy, R.C., Kleidman, R.G., Eck, T.F., Vermote, E., Holben, B.N., 2005.The MODIS aerosol algorithm, products and validation. Journal of AtmosphericScience 62, 947e973.
Sarkar, S., Chokngamwong, R., Cervone, G., Singh, R.P., Kafatos, M., 2006. Variabilityof aerosol optical depth and aerosol forcing over India. Advances in SpaceResearch 37, 2153e2159.
Smart, J.C.R., Hicks, K., Morrissey, T., Heinemeyer, A., Sutton, M.A., Ashmore, M.,2011. Applying the ecosystem service concept to air quality management in theUK: a case study for ammonia. Environmetrics 22. doi:10.1002/env.1094 n/a.
Tanré, D., Kaufman, Y.J., Herman, M., Mattoo, S., 1997. Remote sensing of aerosolproperties over oceans using the MODIS/EOS spectral radiances. Journal ofGeophysical Research-Atmospheres 102, 16971e16986.
Torres, O., Bhartia, P.K., Herman, J.R., Sinyuk, A., Ginoux, P., Holben, B.N., 2002.A long-term record of aerosol optical depth from TOMS observations andcomparison to AERONET measurements. Journal of Atmospheric Science 59,398e413.
Tripathi, S.N., Dey, S., Chandel, A., Srivastava, S., Singh, R.P., Holben, B.N., 2005.Comparison of MODIS and AERONET derived aerosol optical depth over theGanga Basin, India. Annales Geophysicae 23, 1093e1101.
Vermote, E.F., Roger, J.C., Sinyuk, A., Saleous, N., Dubovik, O., 2007. Fusion ofMODISeMISR aerosol inversion for estimation of aerosol absorption. RemoteSensing of Environment 107, 81e89.
Wang, J., Christopher, S.A., 2003. Intercomparison between satellite-derived aerosoloptical thickness and PM2.5 mass: implications for air quality studies.Geophysical Research Letters 30. doi:10.1029/2003GL018174.
Xiao, N., Shi, T., Calder, C.A., Munroe, D.K., Berrett, C., Wolfinbarger, S., Li, D., 2009.Spatial characteristics of the difference between MISR and MODIS aerosoloptical depth retrievals over mainland Southeast Asia. Remote Sensing ofEnvironment 113, 1e9.
Recommended


