Embed Size (px)
Citation preview
ARTICLE IN PRESS
1352-2310/$ - se
doi:10.1016/j.at
�CorrespondE-mail addr
Atmospheric Environment 40 (2006) 5367–5378
www.elsevier.com/locate/atmosenv
Aerosol variability over Thessaloniki using ground based remotesensing observations and the TOMS aerosol index
M.E. Koukoulia,�, D.S. Balisa, V. Amiridisa, S. Kazadzisa, A. Baisa,S. Nickovicb, O. Torresc
aLaboratory of Atmospheric Physics, Physics Department, Aristotle University of Thessaloniki, University Campus Box 149,
GR-54124, Thessaloniki, GreecebWorld Meteorological Organization, Geneva, Switzerland
cJCET, University of Maryland Baltimore County, Baltimore, MD, USA
Received 16 December 2005; received in revised form 12 April 2006; accepted 26 April 2006
Abstract
The main aim of this work is to assess the performance of the Total Ozone Mapping Spectrometer (TOMS) on board the
Earth Probe satellite aerosol index (AI) version 8.0 retrieved from the daily measurements of the TOMS instrument as an
indicator of the presence of absorbing aerosols in the atmosphere. The analysis is carried out over the region of Northern
Greece, an area exposed to various aerosol types from different sources. The aerosol optical depth (AOD) measured by a
Brewer spectroradiometer situated in the centre of the city of Thessaloniki, at 40.61N, 22.91E, was employed as a measure
of the aerosol loading in the atmosphere during the Earth Probe overpass. Discrete aerosol episodes that affect the area,
such as biomass burning and Saharan dust events, have been isolated and studied in order to assess the effectiveness of
using the TOMS AI in this highly complex atmospheric environment. The yearly values for the AOD measured at 355 nm
range from 0.03 to 1.97 with a mean of 0.5870.32 and for the AI from �1.67 to 3.06, with a mean of 0.2270.73. This wide
range of values results from the co-existence of urban, continental, marine and dust aerosols over Thessaloniki, a fact that
makes it complicated to segregate optical effects on the observed radiation depending on different aerosol types. A total of
223 biomass burning events that affected Thessaloniki showed a correlation of 0.67 between the AOD and AI values
whereas a correlation of 0.57 was deduced for the 37 cases of Saharan dust loading. A cluster analysis on the back-
trajectories was performed in order to study the origins of the air masses over Thessaloniki, which permitted that the
optical depth and AI were analysed depending on the possible source of the aerosols. The highest AOD values coupled
with the highest AI values were seen for trajectories that transport air from the Saharan desert over Thessaloniki and those
that bring polluted air from Eastern Europe and the Balkan regions. Even though some deductions were made vis-a-vis the
origin and importance of different aerosol types over the city corroborating the usefulness of the AI in climatological or
global climate studies, auxiliary information is essential for studying in detail the effects of the atmospheric aerosol loading
over a local point of interest.
r 2006 Elsevier Ltd. All rights reserved.
Keywords: Aerosol index; Aerosol optical depth; TOMS; Saharan dust; Brewer; Spectrometer
e front matter r 2006 Elsevier Ltd. All rights reserved.
mosenv.2006.04.046
ing author. Tel.: +302310998049; fax: +302310998090.
ess: [email protected] (M.E. Koukouli).
ARTICLE IN PRESSM.E. Koukouli et al. / Atmospheric Environment 40 (2006) 5367–53785368
1. Introduction
AEROSOLS found over the Mediterranean basinresult from the superimposition of a marinecomponent (sea spray from the Mediterranean Seaitself), a mineral dust component (outbreaks ofSaharan dust and local dust suspension) and ananthropogenic component (local- and long-rangetransported pollution) (Moulin et al., 1997; Lelie-veld et al., 2002; di Sarra et al., 2003; Barnaba andGobbi, 2004). The atmosphere above Thessaloniki,located in the northern Aegean Sea region, isaffected by aerosols originating from both localand regional pollution sources, Saharan dust out-bursts, long-range transport of biomass burningparticles and maritime particles (Gerasopouloset al., 2003; Balis et al., 2003, 2004; Papayanniset al., 2005). Among these particles, sea-spray andsulphate aerosols are the most common non-absorb-ing aerosols (Torres et al., 1998), whereas carbonac-eous (smoke) particles can have both absorbing andnon-absorbing characteristics (Anderson et al., 1996;Torres et al., 1998) and mineral or dust aerosols,transported from nearby dry regions, represent theclearest possible absorbing signature (Israelevichet al., 2002). It is therefore expected that high aerosoloptical depths (AODs) might be observed during thepresence of either absorbing or non-absorbingparticles and that additional sources of informationare necessary in order to assess both the detailednature and the optical properties of this complexaerosol load. In recent years and with the ever-increasing use of satellite remote sensing measure-ments, the analysis of the remotely observed UVradiation has become a pivotal point in extractinginformation about aerosols.
The aerosol index (AI) (Torres et al., 1998) is ameasure of the reduction of the Rayleigh scatteredradiance by aerosol absorption relative to a pureRayleigh scattered radiance, studied via its wave-length dependence. As expected, different types ofaerosols leave a distinct signature in the observedspectrum; soot and mineral dust are both detectedthrough the absorption of UV light that is back-scattered from the layer underneath them (O’Brienand Mitchell, 2003). Because of this, the sensitivityof the AI to aerosols increases more or lessproportionally with the aerosol layer height, whileany aerosol below about 1000m is unlikely to bedetected (Hsu et al., 1999; de Graaf et al., 2005).Despite this limitation, good correlation betweensatellite-derived AI and ground-based AOD mea-
surements has been found in previous studies, asseen in Chiapello et al. (1999), Kubilay et al. (2005),de Graaf et al. (2005). Linear correlations with acoefficient (R) of 0.86 were found between the AIand the optical depth in cases of South Americanand African smoke (Hsu et al., 1999), an R of up to0.95 for measurements from a small industrial areasurrounded by a large rural area (Esposito et al.,2001), and an R of up to 0.834 over a desert plateauin Namibia (Esposito et al., 2001). Further to theseexperimental findings, theoretical model simulationsperformed by Hsu et al. (1999) show that, depend-ing on the height of the aerosol layer and the type ofparticles, a linear relationship is expected betweenthe AOD and the AI.
The geographical locations where observationalcampaigns were performed and discussed in theaforementioned studies exhibit a history of clearlyidentified atmospheric aerosol content, either beingclose to a discrete source of aerosol flux in theatmosphere (e.g. desert dust, oceanic sea spray,volcanic out-gassing) or being areas affected by asingle source of aerosols (e.g. biomass burningaffected regions). The main goal of this paper is toassess the use of the AI derived from satellitemeasurements over a region that is affected by avariety of aerosol types and concentrations. Wepresent the efforts undertaken to study the presenceand nature of aerosols over the city of Thessaloniki,Greece, and discuss the use of the AI combined withground based remote sensing data. In Section 2 wediscuss the various measurements utilised in thiswork, in Section 3 the data selection process andanalysis and in Section 4 we summarise thesefindings.
2. Data description
2.1. TOMS aerosol index, AI
The AI is a measure that indicates the presence ofelevated absorbing aerosols in the troposphere. Itseparates the spectral contrast at two ultraviolet(UV) wavelengths caused by absorbing aerosolsfrom that of other effects, including molecular(Rayleigh) scattering, surface reflection, gaseousabsorption and aerosol and cloud scattering (Hsuet al., 1999).
The EarthProbe/TOMS AI (Herman et al., 1997)is used in this analysis via its overpass data for thecity of Thessaloniki, Greece, for the years1997–2001. There was no noticeable drift in the
ARTICLE IN PRESSM.E. Koukouli et al. / Atmospheric Environment 40 (2006) 5367–5378 5369
overpass time which varied throughout the yearsbetween 8.3 and 10.2UTC, with a mean of9.270.50UTC. In Version 8 of the TOMS algo-rithm (Algorithm Theoretical Basis Document), theAI is calculated using the ratio of the upwellingradiance between observations at 331 and 360 nm,two spectral regions were gaseous absorption of UVlight is weak. UV absorbing aerosols include smokeproduced by biomass burning, black carbon fromurban and industrial activities, agricultural dust,mineral dust coming from arid and semi-aridregions (desert dust), volcanic aerosols and ash.Non-absorbing aerosols are primarily sulphate(H2SO4) aerosols.
2.2. BREWER aerosol optical depth, AOD
The aerosol optical depth (AOD) is spectrallyretrieved from a Brewer spectroradiometer situatedon the roof of the Department of Physics of theAristotle University of Thessaloniki at 40.631N and22.961E and 60m sea-level elevation. Kazadzis et al.(2005) used direct irradiance spectral measurementsin the range 290–365 nm and in steps of 0.5 nm toretrieve the total AOD column. In this paper wehave only considered Brewer measurements taken
-1.6
1997
Mon
thly
Mea
n A
eros
ol In
dex
1998 1999
Y
TOMS Aerofor Thessaloniki [4
-1.2
-0.8
-0.4
0
0.4
0.8
1.2
1.6
2
2.4
2.8
3.2
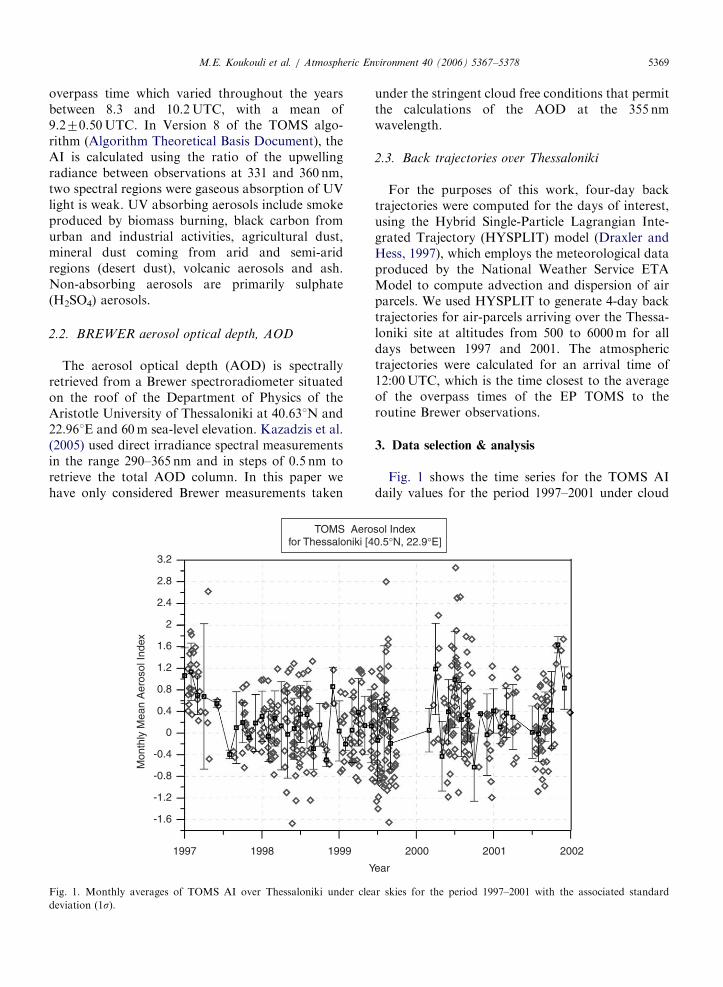
Fig. 1. Monthly averages of TOMS AI over Thessaloniki under clea
deviation (1s).
under the stringent cloud free conditions that permitthe calculations of the AOD at the 355 nmwavelength.
2.3. Back trajectories over Thessaloniki
For the purposes of this work, four-day backtrajectories were computed for the days of interest,using the Hybrid Single-Particle Lagrangian Inte-grated Trajectory (HYSPLIT) model (Draxler andHess, 1997), which employs the meteorological dataproduced by the National Weather Service ETAModel to compute advection and dispersion of airparcels. We used HYSPLIT to generate 4-day backtrajectories for air-parcels arriving over the Thessa-loniki site at altitudes from 500 to 6000m for alldays between 1997 and 2001. The atmospherictrajectories were calculated for an arrival time of12:00UTC, which is the time closest to the averageof the overpass times of the EP TOMS to theroutine Brewer observations.
3. Data selection & analysis
Fig. 1 shows the time series for the TOMS AIdaily values for the period 1997–2001 under cloud
2000
ear
sol Index0.5°N, 22.9°E]
2001 2002
r skies for the period 1997–2001 with the associated standard
ARTICLE IN PRESSM.E. Koukouli et al. / Atmospheric Environment 40 (2006) 5367–53785370
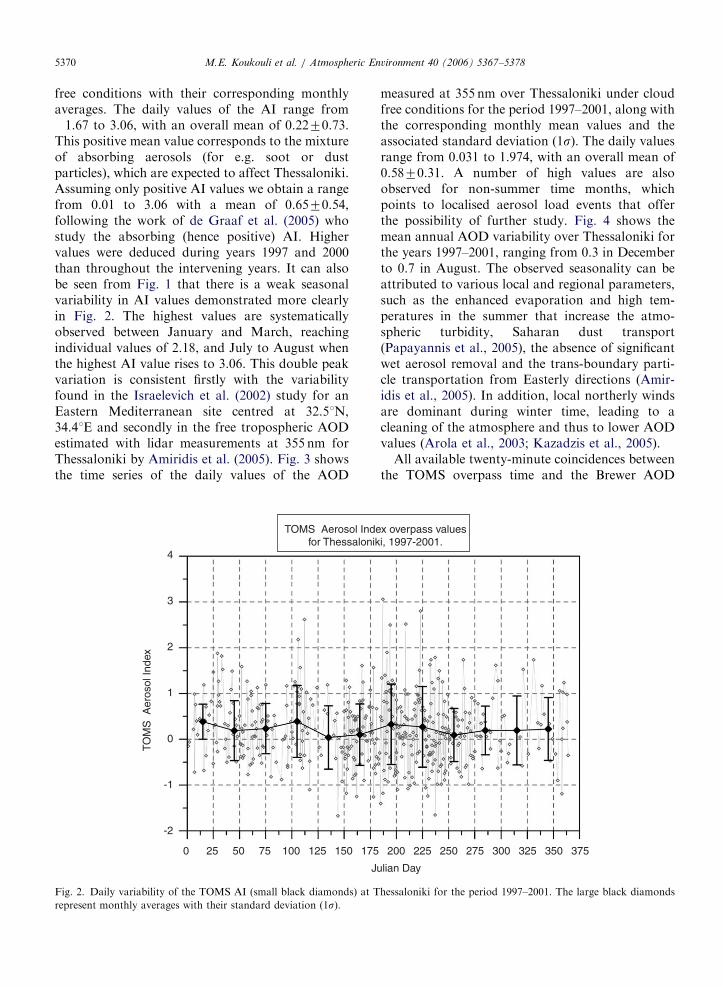
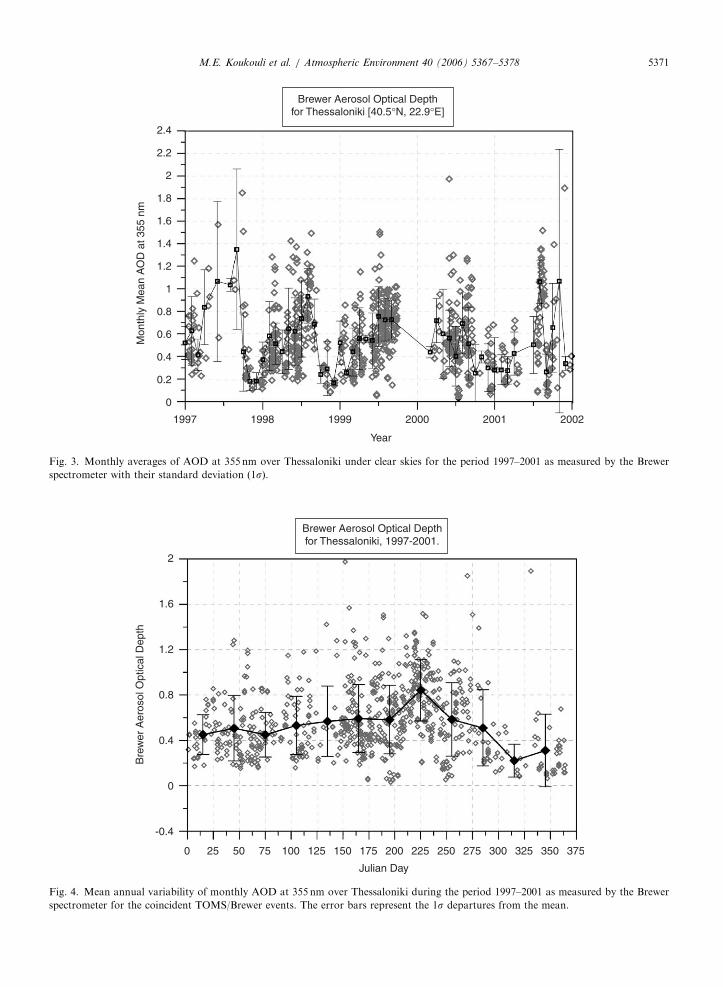
free conditions with their corresponding monthlyaverages. The daily values of the AI range from�1.67 to 3.06, with an overall mean of 0.2270.73.This positive mean value corresponds to the mixtureof absorbing aerosols (for e.g. soot or dustparticles), which are expected to affect Thessaloniki.Assuming only positive AI values we obtain a rangefrom 0.01 to 3.06 with a mean of 0.6570.54,following the work of de Graaf et al. (2005) whostudy the absorbing (hence positive) AI. Highervalues were deduced during years 1997 and 2000than throughout the intervening years. It can alsobe seen from Fig. 1 that there is a weak seasonalvariability in AI values demonstrated more clearlyin Fig. 2. The highest values are systematicallyobserved between January and March, reachingindividual values of 2.18, and July to August whenthe highest AI value rises to 3.06. This double peakvariation is consistent firstly with the variabilityfound in the Israelevich et al. (2002) study for anEastern Mediterranean site centred at 32.51N,34.41E and secondly in the free tropospheric AODestimated with lidar measurements at 355 nm forThessaloniki by Amiridis et al. (2005). Fig. 3 showsthe time series of the daily values of the AOD
-2
0 25 50 75 100 125 150 175
TOM
S A
eros
ol In
dex
J
-1
0
1
2
3
4
TOMS Aerosol Indefor Thessalonik
Fig. 2. Daily variability of the TOMS AI (small black diamonds) at T
represent monthly averages with their standard deviation (1s).
measured at 355 nm over Thessaloniki under cloudfree conditions for the period 1997–2001, along withthe corresponding monthly mean values and theassociated standard deviation (1s). The daily valuesrange from 0.031 to 1.974, with an overall mean of0.5870.31. A number of high values are alsoobserved for non-summer time months, whichpoints to localised aerosol load events that offerthe possibility of further study. Fig. 4 shows themean annual AOD variability over Thessaloniki forthe years 1997–2001, ranging from 0.3 in Decemberto 0.7 in August. The observed seasonality can beattributed to various local and regional parameters,such as the enhanced evaporation and high tem-peratures in the summer that increase the atmo-spheric turbidity, Saharan dust transport(Papayannis et al., 2005), the absence of significantwet aerosol removal and the trans-boundary parti-cle transportation from Easterly directions (Amir-idis et al., 2005). In addition, local northerly windsare dominant during winter time, leading to acleaning of the atmosphere and thus to lower AODvalues (Arola et al., 2003; Kazadzis et al., 2005).
All available twenty-minute coincidences betweenthe TOMS overpass time and the Brewer AOD
200 225 250 275 300 325 350 375
ulian Day
x overpass valuesi, 1997-2001.
hessaloniki for the period 1997–2001. The large black diamonds
ARTICLE IN PRESS
0
1997
Mon
thly
Mea
n A
OD
at 3
55 n
m
1998 1999 2000
Year
2001 2002
0.2
0.4
0.6
0.8
1
1.2
1.4
1.6
1.8
2
2.2
2.4
Brewer Aerosol Optical Depthfor Thessaloniki [40.5°N, 22.9°E]
Fig. 3. Monthly averages of AOD at 355 nm over Thessaloniki under clear skies for the period 1997–2001 as measured by the Brewer
spectrometer with their standard deviation (1s).
-0.4
0 25 50 75 100 125 150 175 200 225 250 275 300 325 350 375
Bre
wer
Aer
osol
Opt
ical
Dep
th
Julian Day
0
0.4
0.8
1.2
1.6
2
Brewer Aerosol Optical Depthfor Thessaloniki, 1997-2001.
Fig. 4. Mean annual variability of monthly AOD at 355 nm over Thessaloniki during the period 1997–2001 as measured by the Brewer
spectrometer for the coincident TOMS/Brewer events. The error bars represent the 1s departures from the mean.
M.E. Koukouli et al. / Atmospheric Environment 40 (2006) 5367–5378 5371
ARTICLE IN PRESSM.E. Koukouli et al. / Atmospheric Environment 40 (2006) 5367–53785372
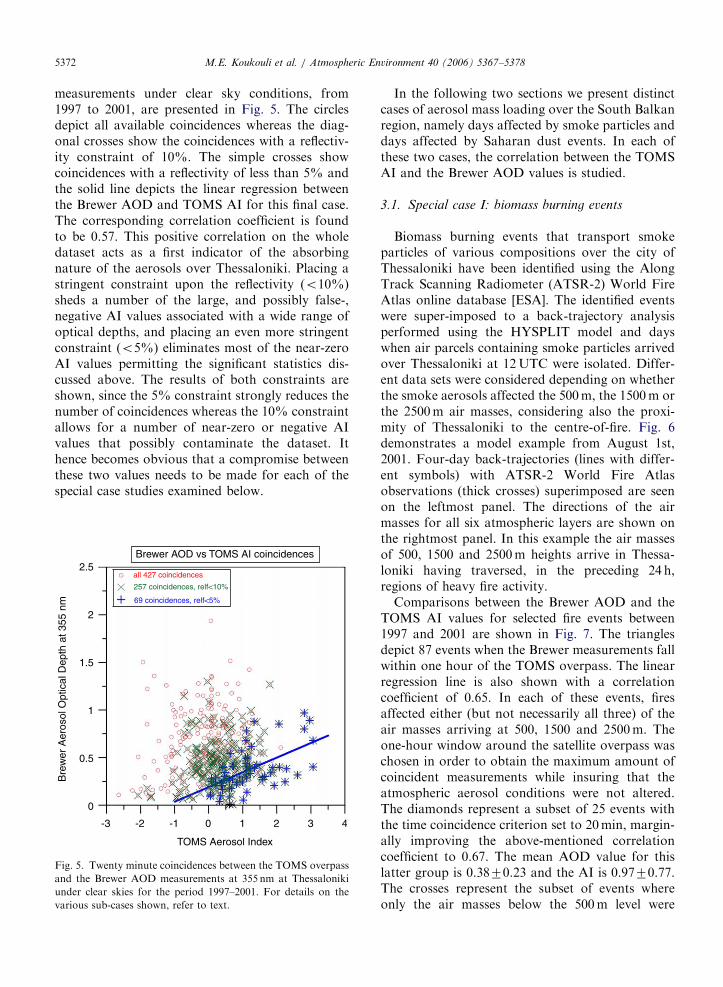
measurements under clear sky conditions, from1997 to 2001, are presented in Fig. 5. The circlesdepict all available coincidences whereas the diag-onal crosses show the coincidences with a reflectiv-ity constraint of 10%. The simple crosses showcoincidences with a reflectivity of less than 5% andthe solid line depicts the linear regression betweenthe Brewer AOD and TOMS AI for this final case.The corresponding correlation coefficient is foundto be 0.57. This positive correlation on the wholedataset acts as a first indicator of the absorbingnature of the aerosols over Thessaloniki. Placing astringent constraint upon the reflectivity (o10%)sheds a number of the large, and possibly false-,negative AI values associated with a wide range ofoptical depths, and placing an even more stringentconstraint (o5%) eliminates most of the near-zeroAI values permitting the significant statistics dis-cussed above. The results of both constraints areshown, since the 5% constraint strongly reduces thenumber of coincidences whereas the 10% constraintallows for a number of near-zero or negative AIvalues that possibly contaminate the dataset. Ithence becomes obvious that a compromise betweenthese two values needs to be made for each of thespecial case studies examined below.
-3
0
0.5
1
1.5
Bre
wer
Aer
osol
Opt
ical
Dep
th a
t 355
nm
2
2.5
-2 -1 0
TOMS Aerosol Index
1 2 3 4
all 427 coincidences
257 coincidences, relf<10%
69 coincidences, relf<5%
Brewer AOD vs TOMS AI coincidences
Fig. 5. Twenty minute coincidences between the TOMS overpass
and the Brewer AOD measurements at 355 nm at Thessaloniki
under clear skies for the period 1997–2001. For details on the
various sub-cases shown, refer to text.
In the following two sections we present distinctcases of aerosol mass loading over the South Balkanregion, namely days affected by smoke particles anddays affected by Saharan dust events. In each ofthese two cases, the correlation between the TOMSAI and the Brewer AOD values is studied.
3.1. Special case I: biomass burning events
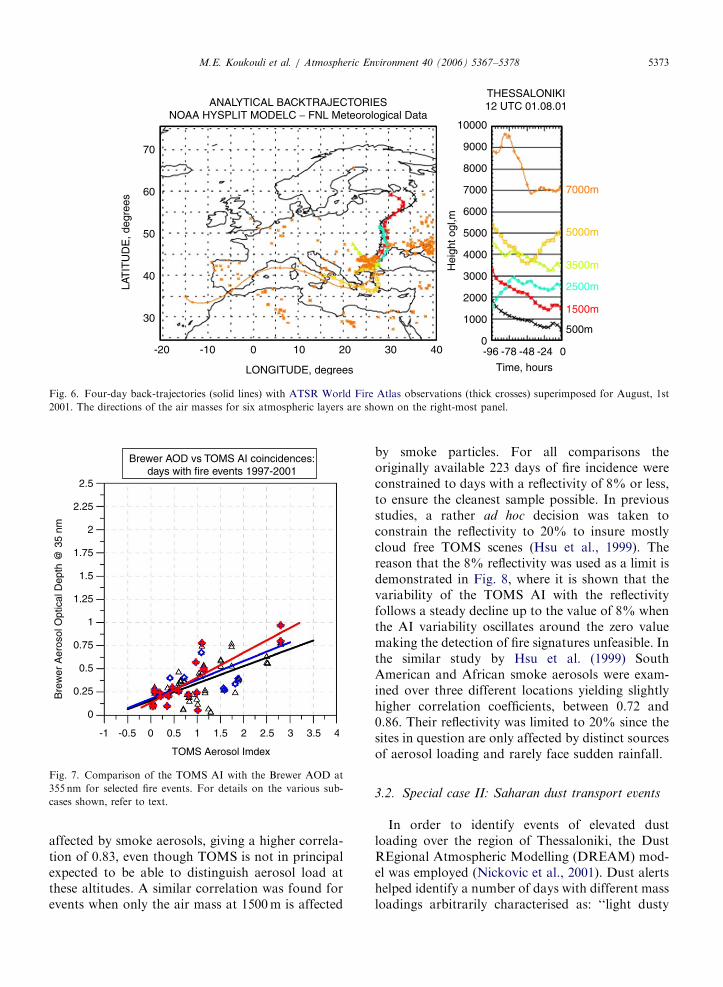
Biomass burning events that transport smokeparticles of various compositions over the city ofThessaloniki have been identified using the AlongTrack Scanning Radiometer (ATSR-2) World FireAtlas online database [ESA]. The identified eventswere super-imposed to a back-trajectory analysisperformed using the HYSPLIT model and dayswhen air parcels containing smoke particles arrivedover Thessaloniki at 12UTC were isolated. Differ-ent data sets were considered depending on whetherthe smoke aerosols affected the 500m, the 1500m orthe 2500m air masses, considering also the proxi-mity of Thessaloniki to the centre-of-fire. Fig. 6demonstrates a model example from August 1st,2001. Four-day back-trajectories (lines with differ-ent symbols) with ATSR-2 World Fire Atlasobservations (thick crosses) superimposed are seenon the leftmost panel. The directions of the airmasses for all six atmospheric layers are shown onthe rightmost panel. In this example the air massesof 500, 1500 and 2500m heights arrive in Thessa-loniki having traversed, in the preceding 24 h,regions of heavy fire activity.
Comparisons between the Brewer AOD and theTOMS AI values for selected fire events between1997 and 2001 are shown in Fig. 7. The trianglesdepict 87 events when the Brewer measurements fallwithin one hour of the TOMS overpass. The linearregression line is also shown with a correlationcoefficient of 0.65. In each of these events, firesaffected either (but not necessarily all three) of theair masses arriving at 500, 1500 and 2500m. Theone-hour window around the satellite overpass waschosen in order to obtain the maximum amount ofcoincident measurements while insuring that theatmospheric aerosol conditions were not altered.The diamonds represent a subset of 25 events withthe time coincidence criterion set to 20min, margin-ally improving the above-mentioned correlationcoefficient to 0.67. The mean AOD value for thislatter group is 0.3870.23 and the AI is 0.9770.77.The crosses represent the subset of events whereonly the air masses below the 500m level were
ARTICLE IN PRESS
-20
LAT
ITU
DE
, deg
rees
30
40
50
60
70
-10 0 10
LONGITUDE, degrees
ANALYTICAL BACKTRAJECTORIESNOAA HYSPLIT MODELC − FNL Meteorological Data
20 30 400-96 -78 -48
Time, hours
-24 0
500m
1500m
2500m
3500m
5000m
7000m
1000
2000
3000
4000
5000
Hei
ght o
gl,m
6000
7000
8000
9000
10000
THESSALONIKI12 UTC 01.08.01
Fig. 6. Four-day back-trajectories (solid lines) with ATSR World Fire Atlas observations (thick crosses) superimposed for August, 1st
2001. The directions of the air masses for six atmospheric layers are shown on the right-most panel.
0
-1 -0.5 0 0.5 1 1.5
TOMS Aerosol Imdex
2 2.5 3 3.5 4
1
0.25Bre
wer
Aer
osol
Opt
ical
Dep
th @
35
nm
0.75
0.5
2
1.25
1.75
1.5
2.25
2.5
Brewer AOD vs TOMS AI coincidences:days with fire events 1997-2001
Fig. 7. Comparison of the TOMS AI with the Brewer AOD at
355 nm for selected fire events. For details on the various sub-
cases shown, refer to text.
M.E. Koukouli et al. / Atmospheric Environment 40 (2006) 5367–5378 5373
affected by smoke aerosols, giving a higher correla-tion of 0.83, even though TOMS is not in principalexpected to be able to distinguish aerosol load atthese altitudes. A similar correlation was found forevents when only the air mass at 1500m is affected
by smoke particles. For all comparisons theoriginally available 223 days of fire incidence wereconstrained to days with a reflectivity of 8% or less,to ensure the cleanest sample possible. In previousstudies, a rather ad hoc decision was taken toconstrain the reflectivity to 20% to insure mostlycloud free TOMS scenes (Hsu et al., 1999). Thereason that the 8% reflectivity was used as a limit isdemonstrated in Fig. 8, where it is shown that thevariability of the TOMS AI with the reflectivityfollows a steady decline up to the value of 8% whenthe AI variability oscillates around the zero valuemaking the detection of fire signatures unfeasible. Inthe similar study by Hsu et al. (1999) SouthAmerican and African smoke aerosols were exam-ined over three different locations yielding slightlyhigher correlation coefficients, between 0.72 and0.86. Their reflectivity was limited to 20% since thesites in question are only affected by distinct sourcesof aerosol loading and rarely face sudden rainfall.
3.2. Special case II: Saharan dust transport events
In order to identify events of elevated dustloading over the region of Thessaloniki, the DustREgional Atmospheric Modelling (DREAM) mod-el was employed (Nickovic et al., 2001). Dust alertshelped identify a number of days with different massloadings arbitrarily characterised as: ‘‘light dusty
ARTICLE IN PRESSM.E. Koukouli et al. / Atmospheric Environment 40 (2006) 5367–53785374
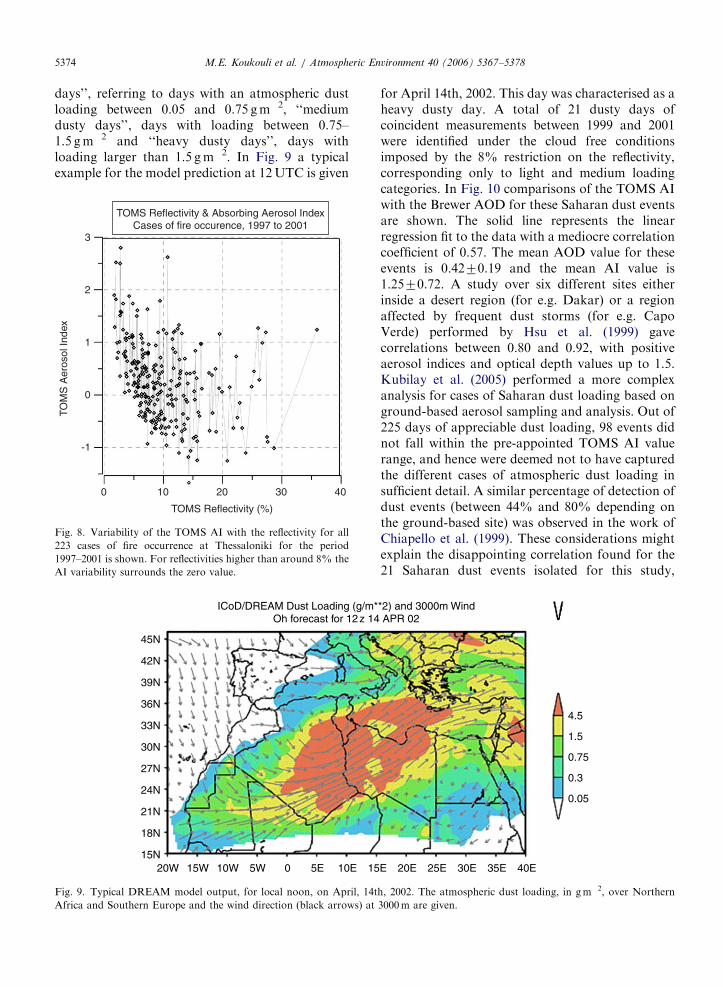
days’’, referring to days with an atmospheric dustloading between 0.05 and 0.75 gm�2, ‘‘mediumdusty days’’, days with loading between 0.75–1.5 gm�2 and ‘‘heavy dusty days’’, days withloading larger than 1.5 gm�2. In Fig. 9 a typicalexample for the model prediction at 12UTC is given
0
-1
0
1
2
3
TOMS Reflectivity & Absorbing Aerosol IndexCases of fire occurence, 1997 to 2001
10 20
TOMS Reflectivity (%)
TOM
S A
eros
ol In
dex
30 40
Fig. 8. Variability of the TOMS AI with the reflectivity for all
223 cases of fire occurrence at Thessaloniki for the period
1997–2001 is shown. For reflectivities higher than around 8% the
AI variability surrounds the zero value.
45N
ICoD/DREAM Dust Loading (g/m*Oh forecast for 12z 14
42N
39N
36N
33N
30N
27N
24N
21N
18N
15N20W 15W 10W 5W 0 5E 10E 15
Fig. 9. Typical DREAM model output, for local noon, on April, 14t
Africa and Southern Europe and the wind direction (black arrows) at
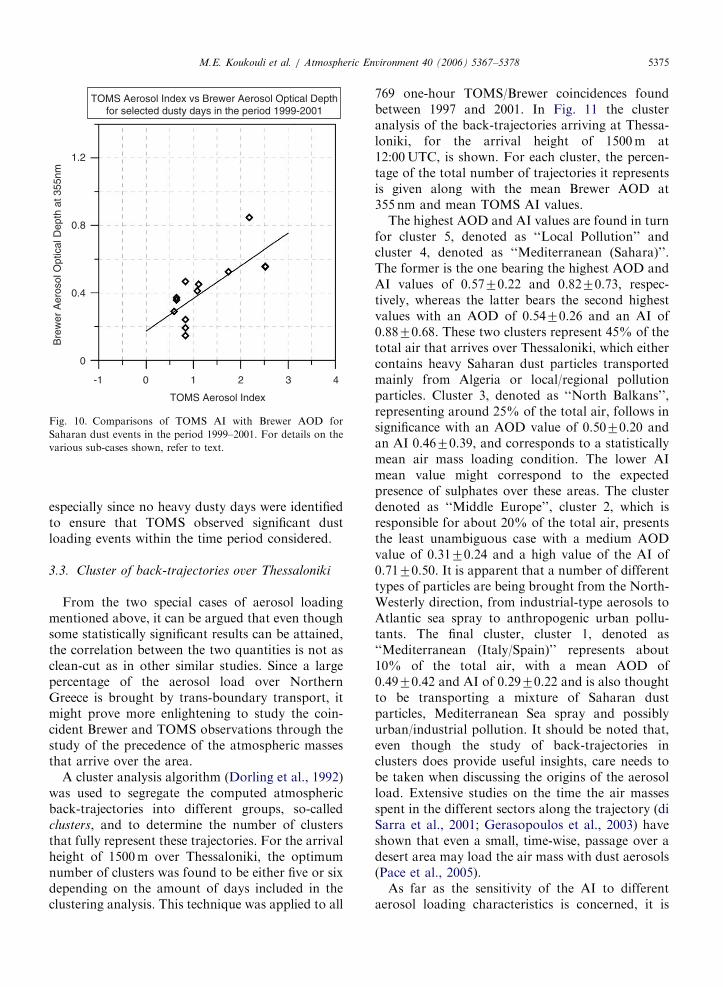
for April 14th, 2002. This day was characterised as aheavy dusty day. A total of 21 dusty days ofcoincident measurements between 1999 and 2001were identified under the cloud free conditionsimposed by the 8% restriction on the reflectivity,corresponding only to light and medium loadingcategories. In Fig. 10 comparisons of the TOMS AIwith the Brewer AOD for these Saharan dust eventsare shown. The solid line represents the linearregression fit to the data with a mediocre correlationcoefficient of 0.57. The mean AOD value for theseevents is 0.4270.19 and the mean AI value is1.2570.72. A study over six different sites eitherinside a desert region (for e.g. Dakar) or a regionaffected by frequent dust storms (for e.g. CapoVerde) performed by Hsu et al. (1999) gavecorrelations between 0.80 and 0.92, with positiveaerosol indices and optical depth values up to 1.5.Kubilay et al. (2005) performed a more complexanalysis for cases of Saharan dust loading based onground-based aerosol sampling and analysis. Out of225 days of appreciable dust loading, 98 events didnot fall within the pre-appointed TOMS AI valuerange, and hence were deemed not to have capturedthe different cases of atmospheric dust loading insufficient detail. A similar percentage of detection ofdust events (between 44% and 80% depending onthe ground-based site) was observed in the work ofChiapello et al. (1999). These considerations mightexplain the disappointing correlation found for the21 Saharan dust events isolated for this study,
*2) and 3000m Wind APR 02
4.5
1.5
0.75
0.3
0.05
E 20E 25E 30E 35E 40E
h, 2002. The atmospheric dust loading, in gm�2, over Northern
3000m are given.
ARTICLE IN PRESS
-1
0
0.4
Bre
wer
Aer
osol
Opt
ical
Dep
th a
t 355
nm
0.8
1.2
TOMS Aerosol Index vs Brewer Aerosol Optical Depthfor selected dusty days in the period 1999-2001
0 1
TOMS Aerosol Index
2 3 4
Fig. 10. Comparisons of TOMS AI with Brewer AOD for
Saharan dust events in the period 1999–2001. For details on the
various sub-cases shown, refer to text.
M.E. Koukouli et al. / Atmospheric Environment 40 (2006) 5367–5378 5375
especially since no heavy dusty days were identifiedto ensure that TOMS observed significant dustloading events within the time period considered.
3.3. Cluster of back-trajectories over Thessaloniki
From the two special cases of aerosol loadingmentioned above, it can be argued that even thoughsome statistically significant results can be attained,the correlation between the two quantities is not asclean-cut as in other similar studies. Since a largepercentage of the aerosol load over NorthernGreece is brought by trans-boundary transport, itmight prove more enlightening to study the coin-cident Brewer and TOMS observations through thestudy of the precedence of the atmospheric massesthat arrive over the area.
A cluster analysis algorithm (Dorling et al., 1992)was used to segregate the computed atmosphericback-trajectories into different groups, so-calledclusters, and to determine the number of clustersthat fully represent these trajectories. For the arrivalheight of 1500m over Thessaloniki, the optimumnumber of clusters was found to be either five or sixdepending on the amount of days included in theclustering analysis. This technique was applied to all
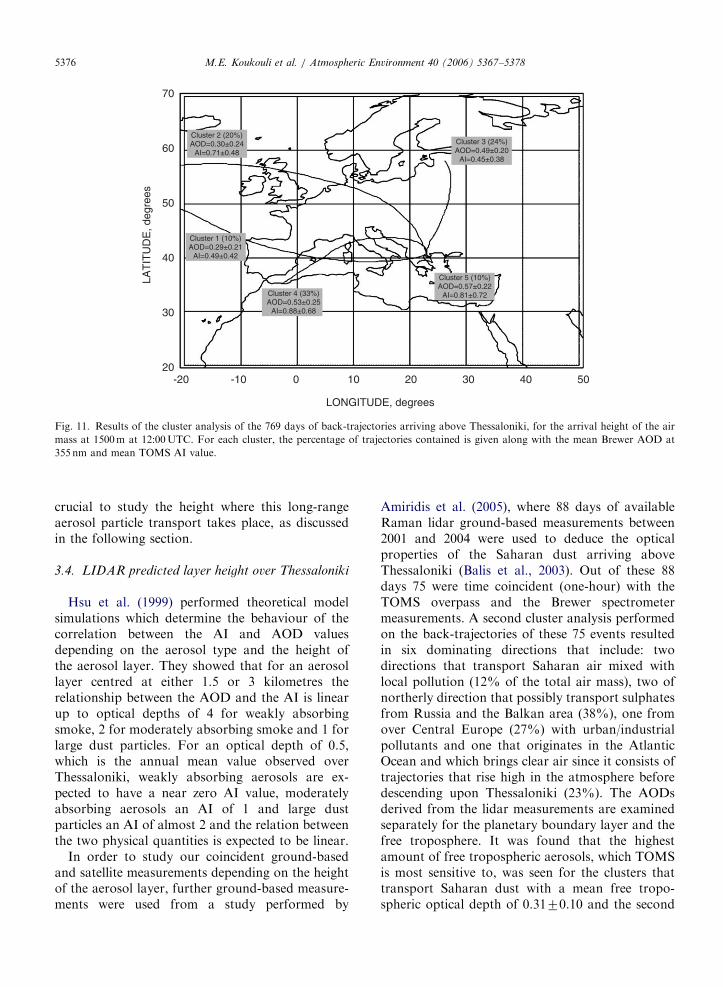
769 one-hour TOMS/Brewer coincidences foundbetween 1997 and 2001. In Fig. 11 the clusteranalysis of the back-trajectories arriving at Thessa-loniki, for the arrival height of 1500m at12:00UTC, is shown. For each cluster, the percen-tage of the total number of trajectories it representsis given along with the mean Brewer AOD at355 nm and mean TOMS AI values.
The highest AOD and AI values are found in turnfor cluster 5, denoted as ‘‘Local Pollution’’ andcluster 4, denoted as ‘‘Mediterranean (Sahara)’’.The former is the one bearing the highest AOD andAI values of 0.5770.22 and 0.8270.73, respec-tively, whereas the latter bears the second highestvalues with an AOD of 0.5470.26 and an AI of0.8870.68. These two clusters represent 45% of thetotal air that arrives over Thessaloniki, which eithercontains heavy Saharan dust particles transportedmainly from Algeria or local/regional pollutionparticles. Cluster 3, denoted as ‘‘North Balkans’’,representing around 25% of the total air, follows insignificance with an AOD value of 0.5070.20 andan AI 0.4670.39, and corresponds to a statisticallymean air mass loading condition. The lower AImean value might correspond to the expectedpresence of sulphates over these areas. The clusterdenoted as ‘‘Middle Europe’’, cluster 2, which isresponsible for about 20% of the total air, presentsthe least unambiguous case with a medium AODvalue of 0.3170.24 and a high value of the AI of0.7170.50. It is apparent that a number of differenttypes of particles are being brought from the North-Westerly direction, from industrial-type aerosols toAtlantic sea spray to anthropogenic urban pollu-tants. The final cluster, cluster 1, denoted as‘‘Mediterranean (Italy/Spain)’’ represents about10% of the total air, with a mean AOD of0.4970.42 and AI of 0.2970.22 and is also thoughtto be transporting a mixture of Saharan dustparticles, Mediterranean Sea spray and possiblyurban/industrial pollution. It should be noted that,even though the study of back-trajectories inclusters does provide useful insights, care needs tobe taken when discussing the origins of the aerosolload. Extensive studies on the time the air massesspent in the different sectors along the trajectory (diSarra et al., 2001; Gerasopoulos et al., 2003) haveshown that even a small, time-wise, passage over adesert area may load the air mass with dust aerosols(Pace et al., 2005).
As far as the sensitivity of the AI to differentaerosol loading characteristics is concerned, it is
ARTICLE IN PRESS
70
60
50
40
30
20-20 -10 0 10
LONGITUDE, degrees
LAT
ITU
DE
, deg
rees
20 30 40 50
Cluster 2 (20%)AOD=0.30±0.24
AI=0.71±0.48
Cluster 1 (10%)AOD=0.29±0.21
AI=0.49±0.42
Cluster 4 (33%)AOD=0.53±0.25
AI=0.88±0.68
Cluster 3 (24%)AOD=0.49±0.20
AI=0.45±0.38
Cluster 5 (10%)AOD=0.57±0.22
AI=0.81±0.72
Fig. 11. Results of the cluster analysis of the 769 days of back-trajectories arriving above Thessaloniki, for the arrival height of the air
mass at 1500m at 12:00UTC. For each cluster, the percentage of trajectories contained is given along with the mean Brewer AOD at
355nm and mean TOMS AI value.
M.E. Koukouli et al. / Atmospheric Environment 40 (2006) 5367–53785376
crucial to study the height where this long-rangeaerosol particle transport takes place, as discussedin the following section.
3.4. LIDAR predicted layer height over Thessaloniki
Hsu et al. (1999) performed theoretical modelsimulations which determine the behaviour of thecorrelation between the AI and AOD valuesdepending on the aerosol type and the height ofthe aerosol layer. They showed that for an aerosollayer centred at either 1.5 or 3 kilometres therelationship between the AOD and the AI is linearup to optical depths of 4 for weakly absorbingsmoke, 2 for moderately absorbing smoke and 1 forlarge dust particles. For an optical depth of 0.5,which is the annual mean value observed overThessaloniki, weakly absorbing aerosols are ex-pected to have a near zero AI value, moderatelyabsorbing aerosols an AI of 1 and large dustparticles an AI of almost 2 and the relation betweenthe two physical quantities is expected to be linear.
In order to study our coincident ground-basedand satellite measurements depending on the heightof the aerosol layer, further ground-based measure-ments were used from a study performed by
Amiridis et al. (2005), where 88 days of availableRaman lidar ground-based measurements between2001 and 2004 were used to deduce the opticalproperties of the Saharan dust arriving aboveThessaloniki (Balis et al., 2003). Out of these 88days 75 were time coincident (one-hour) with theTOMS overpass and the Brewer spectrometermeasurements. A second cluster analysis performedon the back-trajectories of these 75 events resultedin six dominating directions that include: twodirections that transport Saharan air mixed withlocal pollution (12% of the total air mass), two ofnortherly direction that possibly transport sulphatesfrom Russia and the Balkan area (38%), one fromover Central Europe (27%) with urban/industrialpollutants and one that originates in the AtlanticOcean and which brings clear air since it consists oftrajectories that rise high in the atmosphere beforedescending upon Thessaloniki (23%). The AODsderived from the lidar measurements are examinedseparately for the planetary boundary layer and thefree troposphere. It was found that the highestamount of free tropospheric aerosols, which TOMSis most sensitive to, was seen for the clusters thattransport Saharan dust with a mean free tropo-spheric optical depth of 0.3170.10 and the second
ARTICLE IN PRESSM.E. Koukouli et al. / Atmospheric Environment 40 (2006) 5367–5378 5377
highest for polluted air brought from EasternEurope and the Balkan regions with a free tropo-spheric optical depth of 0.2370.18. For these twocases the planetary boundary layer height overThessaloniki is close to 2 km. The model presentedby Hsu et al. (1999) and mentioned in the beginningof this section is hence experimentally verified; in thecase of cluster 4, the Sahara dust transport, thevalue for the total AOD is 0.5370.25 and the AI is0.8870.68 whereas in cluster 3, the Eastern Europe-Balkan cluster that transports mainly weaklyabsorbing aerosols, the AI was found to be0.4570.38 coupled with an AOD of 0.4970.20.
4. Summary and conclusions
We have analysed and compared TOMS/EarthProbe aerosol index (AI) measurements with ground-based Brewer spectrophotometer observations of theAerosol Optical Depth (AOD) at 355nm in theperiod 1997 to 2001 for the city of Thessaloniki,Greece. The AI over Thessaloniki is showing a weakseasonal variability consistent with the variabilityfound in the free tropospheric AOD at 355 nmestimated with lidar measurements at Thessalonikiby Amiridis et al. (2005). The previously reportedproperties of the AI, namely the linearity to the AODfor a given height of the aerosol, quasi-linearity tothe height of the aerosol layer for a given AOD andhigher AI values for larger particles for a given AOD(Hsu et al., 1999), have been examined. The air aboveThessaloniki in particular and Northern Greece ingeneral contains a mixture of urban, continental,marine and dust aerosols which may be either due tolocal or regional sources and transboundary or eveninter-continental transport. Hence, studying thetropospheric air quality over the city proves a usefultool to assess the scientific viability of the satellitederived AI.
With the aid of auxiliary sources of informationtwo aerosol loading categories were identified;namely, 223 biomass burning events and 37 casesof Saharan dust loading that affected Thessalonikibetween 1997 and 2001. For the biomass burningevents the mean AOD value, using a reflectivity cut-off of 8%, was 0.3870.23 and the mean AI value0.9770.77, whereas for the cases of Saharan dustparticles, the mean AOD value rose to 0.4270.19and the mean AI value to 1.2570.72. The linearitybetween AI and AOD was tentatively verified fortwo types of aerosol loading, yielding a coefficientof 0.67 in the case of biomass burning events and a
coefficient of 0.57 for Saharan dust outbursts.However it was not possible to gain further insightthrough these case studies for the lack of statisticalweight and for the lack of positive aerosol identifiersthrough the AI.
The cluster analysis utilised in conjunction withthe lidar measurements has managed to distinguishbetween the two main aerosol sources over Thessa-loniki, identifying a strong precedence of the airmasses from the Saharan region with a high freetropospheric aerosol load with a mean AOD of0.3170.10. The associated total AOD for this casewas found to be 0.5370.68 and the AI 0.8870.68.The second strongest aerosol signature in the freetroposphere was the air coming from the EasternEuropean/Balkan region, with a mean value of0.2370.18. The associated total AOD was0.4970.20 and the AI 0.4570.38. These two casesclearly identify with the model predictions of Hsu etal. (1999); for the two clusters discussed above thevalues are highly consistent with the model resultsthat predicted, for a mean AOD of 0.5, an AI of 0.5for the case of weakly absorbing particles and an AIof 1 for the case of dust aerosols.
It soon becomes obvious that for studies notpreformed in sites close to discreet sources of aerosol,either desert dust or biomass burning particles, as isthe case of Thessaloniki with its atmosphere hostinga mixture of different types of aerosol particlesthroughout the year, the simple consideration of theAI and the AOD is not sufficient to provide positiveinsight, as was also seen in the case of Kubilay et al.(2005). The role of vertical mixing also plays aconfusing part in simple AI versus AOD studies sincethe AI often maximises not over the aerosol source(for e.g. the Sahara basin or local pollution emitters)but over a downwind region with active verticalmixing, which is not the case for the AOD (Yoshiokaet al., 2005). Since the air over Thessaloniki is across-road for various types of aerosols with differentsignatures, it might require more than one source ofinformation to characterise and categorise the aero-sol load effect in detail.
Acknowledgements
M.E. Koukouli and V. Amiridis have beensupported by a Greek Ministry of EducationScience Grant under the Pythagoras ResearchEPEAEK-2 project. S. Kazadzis acknowledgesthe support of the Greek Scholarship [IKY]Foundation.
ARTICLE IN PRESSM.E. Koukouli et al. / Atmospheric Environment 40 (2006) 5367–53785378
References
Algorithm Theoretical Basis Document [ATBD], http://
toms.gsfc.nasa.gov/version8/v8toms_atbd.pdf.
Amiridis, V., Balis, D.S., Kazadzis, S., et al., 2005. Four-year
aerosol observations with a Raman lidar at Thessaloniki,
Greece, in the framework of EARLINET. Journal of
Geophysical Research 110, D21203.
Anderson, B.E., Grant, W.B., Gregory, G.L., et al., 1996. Aerosls
from biomass burning over the tropical South Atlantic region:
distributions and impacts. J. Geophys. Res. 101(D19), 24,
117–24, 138.
Arola, A., Lakkala, K., Bais, A., et al., 2003. Factors affecting
short- and long-term changes of spectral UV irradiance at two
European stations. Journal of Geophysical Research 108, D17.
Balis, D.S., Amiridis, V., Zerefos, C., et al., 2003. Raman lidar
and sunphotometric measurements of aerosol optical proper-
ties over Thessaloniki, Greece during a biomass burning
episode. Atmospheric Environment 37 (32), 4529–4538.
Balis, D.S., Amiridis, V., Nickovic, S., et al., 2004. Optical
properties of Saharan dust layers as detected by a Raman
lidar at Thessaloniki, Greece. Geophysical Research Letters
31, L13104.
Barnaba, F., Gobbi, G.P., 2004. Aerosol seasonal variability over
the Mediterranean region and relative impact of maritime,
continental and Saharan dust particles over the basin from
MODIS data in the year 2001. Atmosheric and Chemical
Physics 4, 2367–2391.
Chiapello, I., Prospero, J.M., Herman, J.R., Hsu, N.C., 1999.
Detection of mineral dust over the North Atlantic Ocean and
Africa with the Nimbus 7 TOMS. Journal of Geophysical
Research 104, D8.
Dorling, S., Davies, T., Pierce, C., 1992. Cluster analysis: a
technique for estimating the synoptic meteorological controls
on air and precipitation chemistry—method and applications.
Atmospheric Environment 26A, 2575–2581.
Draxler, R.R., Hess, G.D., 1997. Description of the HYSPLIT_4
modeling system. NOAA Tech. Memo. ERL ARL-224, 24pp.
Esposito, F., Giulia, Pavese, Carmine, Serio, 2001. A preliminary
study on the correlation between TOMS aerosol index and
ground-based measured aerosol optical depth. Atmospheric
Environment 35 (30), 5093–5098.
European Space Agency ATSR World Fire Atlas, http://
dup.esrin.esa.int/ionia/wfa/index.asp
de Graaf, M., Stammes, P., Torres, O., Koelemeijer, R.B.A.,
2005. Absorbing Aerosol Index: sensitivity analysis, applica-
tion to GOME and comparison with TOMS. Journal of
Geophysical Research 110, D1.
Gerasopoulos, E., Andreae, M.O., Zerefos, C., et al., 2003.
Climatological aspects of aerosol optical properties in North-
ern Greece. Atmospheric and Chemical Physics 3, 2025–2041.
Herman, J.R., Bhartia, P.K., Torres, O., et al., 1997. Global
distribution of UV-absorbing aerosols from Nimbus 7/TOMS
data. Journal of Geophysical Research 102, 16,911–16,921.
Hsu, N.C., Herman, J.R., Torres, O., et al., 1999. Comparisons
of the TOMS aerosol index with Sun-photometer aerosol
optical thickness: results and applications. Journal of
Geophysical Research 104, D6.
Israelevich, P.L., Levin, Z., Joseph, J.H., et al., 2002. Desert
aerosol transport in the Mediterranean region as inferred
from the TOMS aerosol index. Journal of Geophysical
Research 107, D21.
Kazadzis, S., Bais, A., Kouremeti, N., et al., 2005. Direct spectral
measurements with a Brewer spectroradiometer: absolute
calibration and aerosol optical depth retrieval. Applied Optics
44, 1681–1690.
Kubilay, N., Oguz, T., Kocak, M., Torres, O., 2005. Ground-
based assessment of Total Ozone Mapping Spectrometer
(TOMS) data for dust transport over the northeastern
Mediterranean. Global Biogeochemical Cycles 19 (1).
Lelieveld, J., Berresheim, H., Borrmann, S., et al., 2002. Global
air pollution crossroads over the Mediterranean. Science 298,
794–799.
Moulin, C., Lambert, C.E., Dulac, F., Dayan, U., 1997. Control
of atmospheric export of dust from North Africa by the
North Atlantic oscillation. Nature 387, 691–694.
Nickovic, S., Kallos, G., Papadopoulos, A., Kakaliagou, O.,
2001. A model for prediction of desert dust cycle in the
atmosphere. Journal of Geophysical Research 106 (18),
113–118, 129.
O’Brien, D.M., Mitchell, R.M., 2003. Atmospheric heating due
to carbonaceous aerosol in northern Australia–confidence
limits based on TOMS aerosol index and sun-photometer
data. Atmospheric Research 66, 1–2, 21–41.
Pace, G., di Sarra, A., Meloni, D., et al., 2005. Aerosol optical
properties at Lampedusa (Central Mediterranean)—1. Influ-
ence of transport and identification of different aerosol types.
ACPD 5, 4929–4969.
Papayannis, A., Balis, D., Amiridis, V., et al., 2005. Measure-
ments of Saharan dust aerosols over the Eastern Mediterranean
using elastic backscatter-Raman lidar, spectrophotometric
and satellite observations in the frame of the EARLINET
project. ACPD 5, 2075–2110 SRef-ID: 1680-7375/acpd/
2005-5-2075.
di Sarra, A., Di Iorio, T., Cacciani, M., et al., 2001. Saharan dust
profiles measured by lidar from Lampedusa. Journal of
Geophysical Research 106, 10,335–10,347.
di Sarra, A., Cacciani, M., DeLuisi, J., et al., 2003. Desert aerosol
in the Mediterranean. In: Bolle, H.-J. (Ed.), Mediterra-
nean Climate: Variability and Trends. Springer, Berlin,
pp. 309–315.
Torres, O., Bhartia, P.K., Herman, J.R., et al., 1998. Derivation
of aerosol properties from satellite measurements of back-
scattered ultraviolet radiation: theoretical basis. Journal of
Geophysical Research 103, 17,099–17,110.
Yoshioka, M., Mahowald, N., Dufresne, J.-L., Luo, C., 2005.
Simulation of absorbing aerosol indices for African dust.
Journal of Geophysical Research 110, D18S17.