
Myelodysplastic Syndromes in South America:
a Multi-national study of 1080 patients
Carolina B Belli, PhD1*; Ronald Feitosa Pinheiro, MD, PhD2; Yesica Bestach, MSc,
PhD1; Irene B Larripa, PhD1; Roberta Sandra da Silva Tanizawa, MD3; Graciela
Alfonso, MD4*; Jacqueline Gonzalez, MD5*; Mariana Rosenhain, MD6*; Nora Watman,
MD7; Marcela Cavalcante de Andrade Silva, MD3; Pedro Negri Aranguren, MD8;
Hernán García Rivello, MD9*; Silvia M M Magalhaes, MD2; Ximena Valladares, MD10;
María S. Undurraga, MD10; and Elvira RP Velloso, MD, PhD3
1- Laboratorio de Genética Hematológica, Instituto de Medicina Experimental (IMEX-
CONICET)/ Academia Nacional de Medicina, Buenos Aires, Argentina; 2- Federal
University of Ceara, Ceara, Brazil; 3-Hematology and Transfusion Medicine, Hospital
das Clinicas, University of Sao Paulo, Sao Paulo, Brazil; 4- Departamento de
Hematología, Hospital General de Agudos “A. J. Posadas”, El Palomar, Argentina; 5-
Hospital General de Agudos “C Durand”, Buenos Aires, Argentina; 6- Hematología,
Hospital General de Agudos “Tornú”; 7- Hematología, Hospital General de Agudos
“Ramos Mejía”; 8- Instituto Privado de Hematología y Hemoterapia, Paraná, Argentina;
9-Servicio de Patología, Hospital Italiano de Buenos Aires, Argentina; 10-
Hematolologia Clínica, Hospital del Salvador, Santiago, Chile; *On behalf of the Grupo
de Estudio de SMD, Sociedad Argentina de Hematología, Buenos Aires, Argentina
Abstract word count: 246
Text word count: 3861
Number of references: 39
Number of tables: 4 figures: 5 (1 supplementary)
Running title: Myelodysplastic Syndomes in South America
Keywords: Myelodysplastic Syndromes, South America, Argentina, Chile, Brazil,
clinical characteristics, prognosis
Corresponding Author: Carolina Belli, PhD
Laboratorio de Genética Hematológica IMEX-CONICET/ ANM
Buenos Aires, Argentina [email protected]
This article has been accepted for publication and undergone full peer review but has not beenthrough the copyediting, typesetting, pagination and proofreading process which may lead todifferences between this version and the Version of Record. Please cite this article as an‘Accepted Article’, doi: 10.1002/ajh.24097
This article is protected by copyright. All rights reserved.

2
Abstract
There are previously reported data describing differences between Asian and
European patients with Myelodysplastic Syndromes (MDS), few direct comparisons
based on cancer registration characteristics or using cohorts to validate scoring
systems. This is the first study from South-America which attempts to describe
demographic, clinical features and outcome of MDS patients.
We retrospectively analyzed 1080 patients with de novo MDS from Argentina (635),
Brazil (345), and Chile (100). Chilean patients were younger (p=0.001) with female
preponderance (p=0.071). Brazilian series showed a higher predominance of RARS
subtype regarding FAB and WHO classifications (p<0.001). Hemoglobin levels were
significantly lower in Brazilian and Chilean series (p<0.001), and Chilean series also
showed a lower platelet count (p=0.028), with no differences concerning the neutrophil
count, % BM blast, and the distribution of cytogenetic risk groups (p>0.05).
Chilean series depicted a lower overall survival (35 months vs 56 months-Argentine; 55
months-Brazil, p=0.030) which was consistent with a higher predominance of the high-
risk group according both to the IPSS and IPSS-R (p=0.046 and p<0.001). The IPSS-R
system and its variables showed a good reproducibility to predict clinical outcome for
the whole South-American population.
Epidemiological and clinical characteristics, distribution among prognostic subgroups,
the overall survival and the access to disease modifying therapies were more similar
between Argentinean and Brazilian compared to Chilean MDS series. This will need
further analysis in a larger group of patients. Descriptive and comparative studies are
necessary to establish epidemiological features useful for public health attitudes to
generate suitable therapeutic schemes.
Page 2 of 30
John Wiley & Sons
American Journal of Hematology
This article is protected by copyright. All rights reserved.

3
Introduction
One of the most challenging problems in hematology is the heterogeneous group of
clonal disorders that were formally defined as Myelodysplastic Syndromes (MDS) by
the French–American–British (FAB) Cooperative Group in 1982 [1], and subsequently
by the World Health Organization (WHO) in 2001 [2]. They are characterized by the
presence of cytopenia(s) in combination with a normo/ hypercellular bone marrow (BM)
exhibiting dysplasia and ineffective hematopoiesis in, at least, one of myeloid cell lines.
According to the prevailing dogma, MDS are clonal disorders of hematopoietic stem
cells with a substantial risk of transformation to acute myeloid leukemia (AML). Clonal
evolution is associated with increasingly ineffective hematopoiesis, progressive
impairment of cellular function and worsening peripheral blood cytopenia(s) [1-5].
MDS is highly prevalent in elderly people. Approximately, 75% of MDS patients are
older than 60 years of age at diagnosis [6-7] and the incidence rate doubles each
decade over 40 years of age. The clinical course of MDS is highly variable, ranging
from stable disease over 10 or more years to death within a few months due to
cytopenia complications or leukemic transformation. The evaluation of disease risk and
outcome of patients with MDS is one of the most critical points due to this impressive
clinical heterogeneity [4-7]. Therefore, since the development of the Bournemouth
index in 1985 [8], various scoring systems have been designed, based mainly on
laboratory characteristics at presentation, in order to define prognostic subgroups. The
International Prognostic Scoring System (IPSS) [6], the gold standard for risk
assessment, has been recently revised (IPSS-R) defining five groups of risk based on
five cytogenetic groups, new clinical cut-points for relevant cytopenias and for the
percentage of BM blasts [7].
Ethnic differences and regional influences may play a role in the pathogenesis of MDS
[9-10]. In the United States (US), Surveillance Epidemiology and End Results (SEER)
data suggest that the incidence rates of MDS were highest among whites and non-
Hispanics than in blacks; however, with only 4% of MDS cases reported from
outpatient clinics to cancer registries [11]. There are previous reported data describing
differences between Asian and European patients with MDS. Japanese patients with
refractory anemia (RA) according to FAB classification were younger with more severe
cytopenias, lower percentage of abnormal karyotypes and a more favorable prognosis
than German patients [9, 12]. Japanese patients also showed higher frequencies of
MDS- unclassified (MDS-U) with pancytopenia and refractory cytopenia with unilineage
dysplasia (RCUD) according to the WHO 2008 classification [13]. Another comparative
study from New Zealand and Australia described epidemiological characteristic based
Page 3 of 30
John Wiley & Sons
American Journal of Hematology
This article is protected by copyright. All rights reserved.

4
on cancer registration and found a higher median age at diagnosis and higher
male/female (M/F) ratio which increases with age [14]. Another source of comparative
studies might be the use of cohorts to validate scoring systems such us for the
development of the WHO based prognostic scoring system [15] or to evaluate the
impact of the degree of anemia in the outcome of MDS patients [16]. The leading
cohort from Italy showed a lower age at diagnosis, a higher frequency of RA/RCUD/5q-
and of low risk-IPSS patients than the validation cohort from Germany [16]. There are
few others direct comparisons of MDS patients from other countries and little is known
about South-American (SA) patients. There are previous reports that validate
prognostic scoring systems in Argentinean population [17-19], and attempts for
epidemiological description in Brazilian reduced series [20, Velloso et al, 2007,
personal communication], but epidemiological data in Chile are not available yet. Our
aim was to describe clinical characteristics of SA MDS population, to compare our
series with diverse ethnicity, and to evaluate prognostic factors and scoring systems.
Methods
Patients
This is a multicenter retrospective analysis of 1080 patients with de novo MDS from
Argentina (Ar-635), Brazil (Br-345), and Chile (Ch-100). From the overall Ar population,
diagnosed between September 1981 to May 2014, 312 patients belong to the MDS
Registry promoted by the Argentinean Society of Hematology where 14 institutions
from Buenos Aires, El Palomar, Pilar, Córdoba and La Plata have been uploading data
from patients diagnosed since 2007. The remaining Ar patients belong to a previous
registry from the Genetic Department of the National Academy of Medicine, including
patients from Buenos Aires, Córdoba and Paraná, and also from the Grupo
Hematológico del Sur. Brazilian patients from Fortaleza (100) and Sao Paulo (245)
have been diagnosed since November 1987 to April 2012. And, Ch MDS patients were
from Santiago, Valparaiso, Talca, Concepción, and Temuco, diagnosed between
December 1995 and October 2012 (Figure 1).
Included patients had a confirmed diagnosis of de novo MDS, based on morphologic
abnormalities in the BM, cytopenia(s), and/or the presence of cytogenetic aberrations
[21]. Patients were classified following FAB [1] and WHO criteria [3], excluding those
with BM blasts >30% and Chronic Myelomonocytic Leukemia (CMML) with white blood
cells count >12x109/L. Treatment-related MDS and those who had a history of toxic
substances were excluded from the analysis.
Statistical Analysis
Page 4 of 30
John Wiley & Sons
American Journal of Hematology
This article is protected by copyright. All rights reserved.

5
To compare differences in baseline presenting characteristic between patients, we
used Anova, Kruskall-Wallis or Mann-Whitney tests to analyze continuous data. The
chi-square or Fisher exact tests were used to analyze categorical variables. The
Kaplan-Meier method was used for the univariate estimation of survival time calculated
from the day of diagnosis. Patients undergoing hematopoietic stem cell transplantation
(HSCT) (53; 4.9%) or hypomethylating therapy (HMT) (137; 12.7%) were censored up
to receiving a disease modifying therapy. Each variable was analyzed using the log–
rank test (Mantel-Cox). The level of statistical significance was fixed at 0.05. All
analyses were performed using the SPSS software version 17.00 (SPSS, Chicago,
USA) and the GraphPad Prism version 5 (GraphPad Software Inc, La Jolla, USA).
Results
Clinical and laboratory features at diagnosis
Epidemiological characteristics, clinical and laboratory features are summarized in
Table 1. Chilean patients were younger (median age: 64 years old versus 69-Ar,
p<0.001 and versus 68-Br, p=0.003), with a female preponderance (0.8, 1.3-Ar, 1.3-Br,
p=0.071). As it is clearly depicted in figure 2, Ch series showed a higher predominance
of patients younger than 40 years old (19% versus 7%-Ar, p<0.001; versus 8%-Br,
p=0.005), whereas the distribution among the other ranges of age was similar.
Gender distribution across most age groups showed a male predominance for the
whole series (Figure 3), and also for Ar and Br series when they were analyzed
separately (Supplementary material, Figure 1S). However a lower M/F gender ratio of
0.8 was observed for patients younger than 45 years old.
The median age at diagnosis was not significantly different between men and women
in the overall SA (69 and 68 years old, respectively, p=0.374), in Br (p=0.209) or in Ch
(p=0.530) MDS population. However, men from Ar series present with a higher median
age at diagnosis (71 versus 68 years old, p=0.040).
The distribution of patients among FAB and WHO categories was different (p<0.001).
According to FAB criteria, Br series showed a higher predominance of RA with Ring
Sideroblasts (RARS) (18% versus 10%-Ar versus 1%-Ch, p<0.001), a lower
percentage of RA (50% versus 57%-Ar versus 67%-Ch, p=0.006), without statistical
differences regarding other subtypes. When low risk MDS patients were classified
according to WHO, Br series showed a higher frequency of RARS subtype (10%
versus 3%-Ar versus 1%-Ch, p<0.001), similar frequency of Refractory Cytopenia with
Multilineage Dysplasia (RCMD) with RS than Ar-series (7% versus 8%-Ar), and a lower
Page 5 of 30
John Wiley & Sons
American Journal of Hematology
This article is protected by copyright. All rights reserved.

6
frequency of RCMD (35% versus 44%-Ar versus 53%-Ch, p=0.004), while the
percentage of other subtypes were comparable.
Hemoglobin (Hb) level was significantly higher in Ar series (9.6 g/dL versus 8.8 g/dL-
Br, p<0.001, and versus 8.7 g/dL-Ch, p=0.002). As it is clearly depicted in figure 4, Ar
series showed a lower predominance of patients with Hb levels below 7g/dL (10%
versus 26%-Br versus 24%-Ch, p<0.001). No differences were observed with respect
to Hb mean levels of males and females from the whole SA series (9.2 g/dL, p=0.695)
and from each series.
Median platelet count was significantly lower in Ch series than in the Ar (p=0.014),
showing a higher frequency of patients with platelet count <50000/µL (35% versus
25%-Ar, p=0.001, and versus 25%-Br, p=0.040). No differences were observed with
respect to the percentage of BM Blast (p=0.161) and to the absolute neutrophil count
(p=0.526). However, Br patients presented a higher frequency of pancytopenic patients
than Ar patients (22% versus 15%-AR, p=0.006) which was not different from Ch series
(21%-Ch versus 22%-Br, p=0.891).
Cytogenetic results were available from 632 Ar, 309 Br and 99 Ch patients. The
frequency of abnormal karyotype was similar among the three series (p=0.258).
Regarding the most frequent cytogenetic findings, Ch series present with a higher
frequency of complex karyotypes (≥ 3 cytogenetic anomalies) than Ar (p=0.002) or Br
(p=0.004). On the other hand, Ar series showed a borderline higher frequency of
chromosome Y loss (p=0.073) and a lower frequency of isolated del(5q) than Br series
(12%-Ar versus 19%-Br, p= 0.082, with respect to the total amount of abnormal
karyotypes). The subgroups of cytogenetic abnormalities according to IPSS and IPSS-
R are summarized in table 2. There were no differences in the distribution of
cytogenetic groups of risk according to IPSS (p=0.159) and to the IPSS-R (p=0.091)
when the overall data was compared. However Ar series showed a higher frequency of
intermediate risk findings than Ch series according to the IPSS (p=0.019) and to the
IPSS-R (p=0.016).
The distribution among IPSS categories tended to be different (p=0.046) with a higher
predominance of the high risk group in Ch series (17% versus 9%-Ar, p=0.016, and
versus 9%-Br, p=0.041). IPSS-R distribution showed more evident differences
(p<0.001), and these differences were predominantly in the distribution of patients into
Very Low (p<0.001), Intermediate (p<0.001) and Very High (p=0.025) risk groups. Ch
series showed a lower predominance of Very Low risk (7% versus 15%-Br, p=0.042,
and versus 22%-Ar, p<0.001), and a higher frequency of Very High risk patients that
Page 6 of 30
John Wiley & Sons
American Journal of Hematology
This article is protected by copyright. All rights reserved.

7
was significantly different from Ar data (20% versus 10%, p=0.015). On the other hand,
Ar series showed a lower proportion of patient at the Intermediate risk category (14%
versus 23%-Br, p=0.002, and versus 27%-Ch, p=0.002) (Table 3). Similar results were
obtained when the IPSS-R distribution was analyzed in the WHO- based MDS
population. However, no statistical differences were observed with respect to the Very
High risk group distribution (p=0.107) (Table 3).
Prognosis
The follow-up for the whole SA series ranged from 1 to 266 months with a median of 21
months (Ar: range: 1-266 months; median: 21 months; Br: range: 1-171 months;
median 24 months; Ch: range 1-204 months, median: 9 months). During the follow up,
497 patients died (Ar: 290, Br: 163, Ch: 44). Concerning causes of death, Ar patients
were classified as 119 AML, 52, infection, 9 bleeding, 22 heart failure, 20 comorbidities,
15 post-HSCT, 53 unknown; Br patients: 53, 24, 3, 9, 3, 12, 59; and Ch patients: 15, 8,
4, 13, 1, 0 and 3, respectively. The incidence of death related to AML complications
tended to be higher in Ar than Br series (41% versus 33%-Br, p=0.086).
Different prognostic factors in each MDS population and in the whole SA population
were also evaluated (Table 4) at time of initiating a disease modifying therapy (HMT or
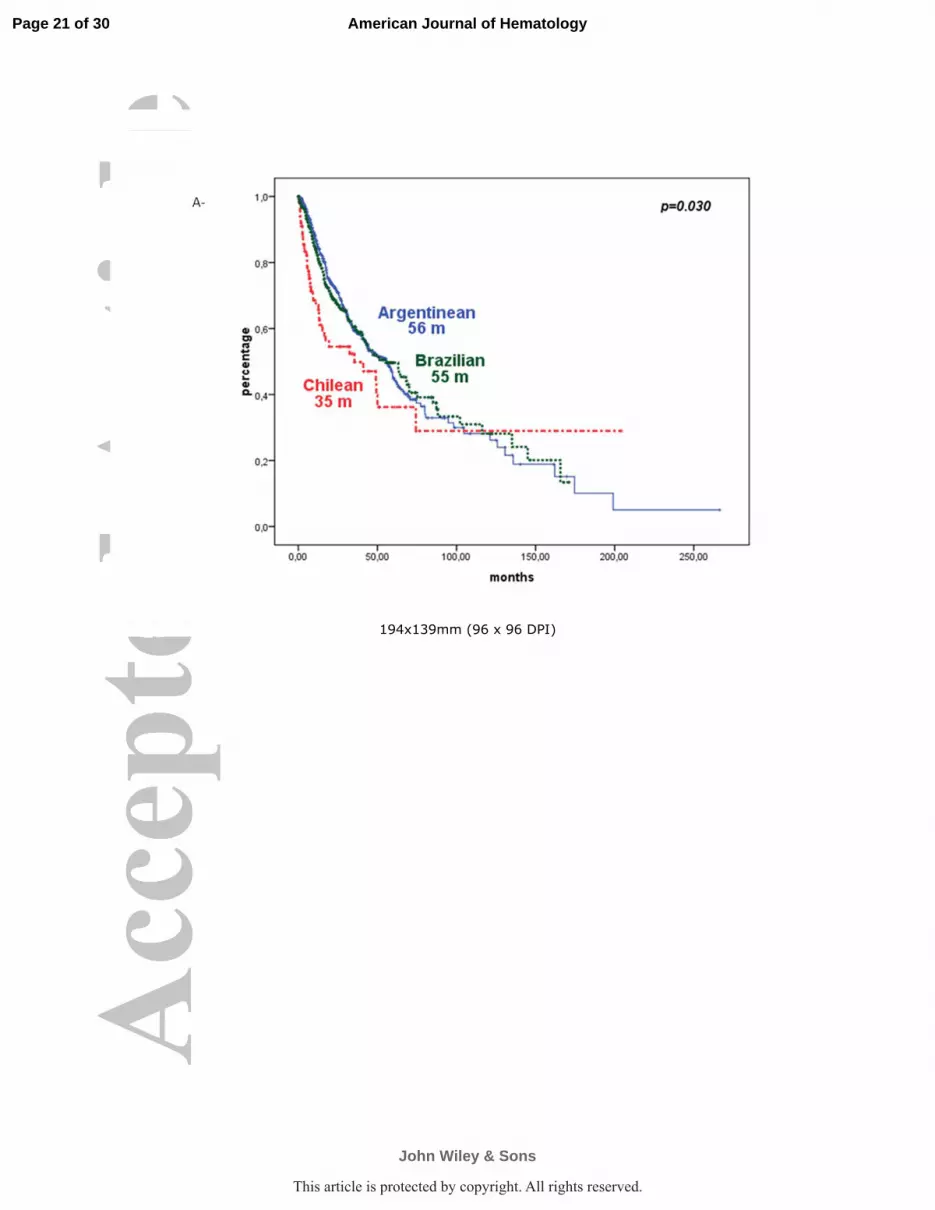
HSCT). Overall survival (OS) was lower in Ch patients, consistent with the higher
prevalence of higher risk group categories (35 months versus 56 months- Ar versus 55
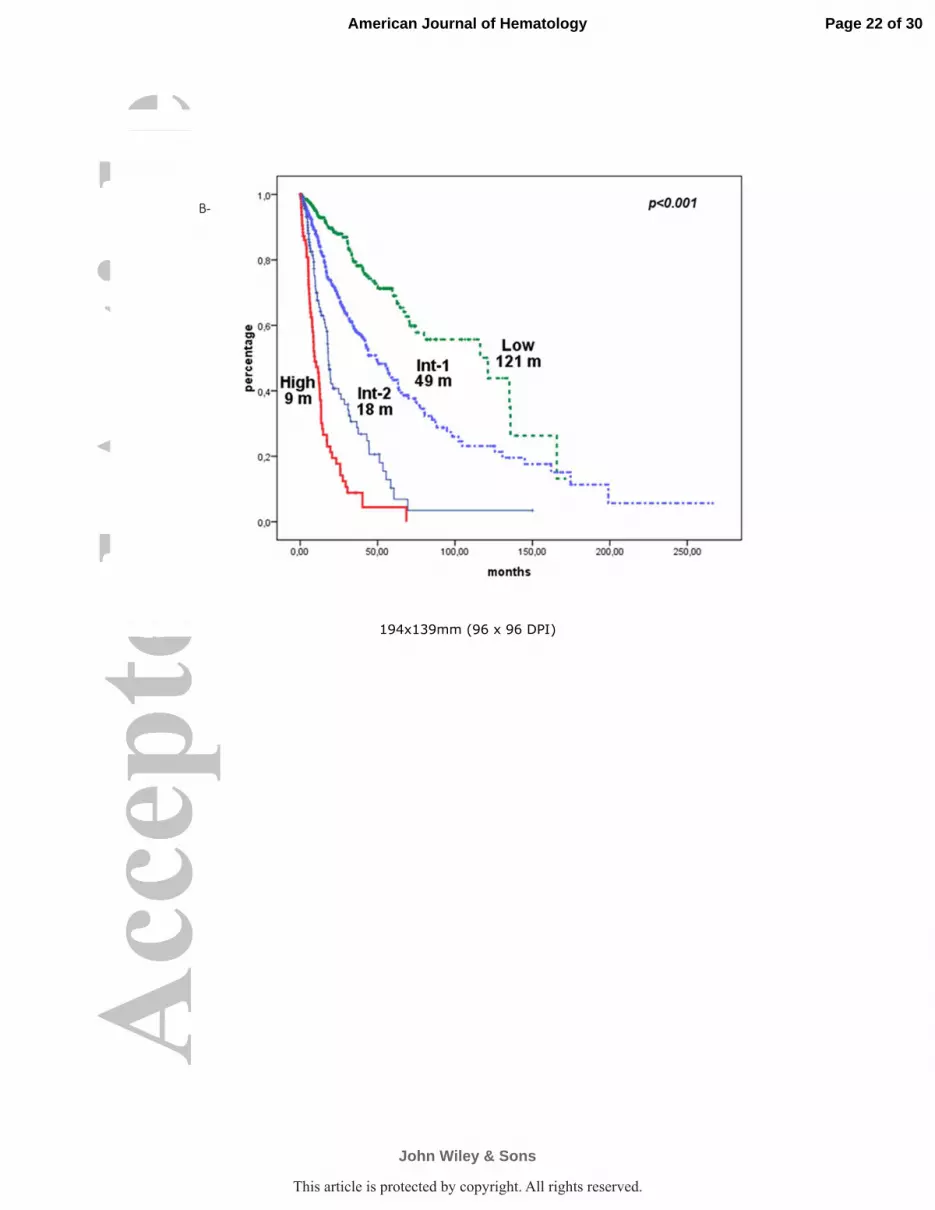
months- Br, p=0.030) (Figure 5A). Hb, BM blast, CGR, IPSS and IPSS-R were useful to
predict survival in the three series and in the overall SA MDS population (Figure 5B-D).
Neither ANC nor age was useful for Br patients. Gender, ANC, and platelets count
were not useful in Ch series.
Treatment
Concerning disease modifying therapies Ar and Br series showed similar rates of
patients that received a HSCT: 31 (4.9%) versus 22 (6.4%) (p=0.375) and not different
median time to access to the HSCT (11.2 versus 7.1 months, p=0.132). Ar series
showed a higher number of patients that received HMT: 111 (17.5%) versus 26-Br
(7.5%), p<0.001, with no differences regarding the time to initiate treatment (4.7 versus
10.7 months, p=0.092), and in terms of median survival after initiating therapy
(censored up to receive HSCT) (18.6 months-Ar versus 16.6 months-Br, p=0.987). On
the other hand, the use of iron chelation therapy was not statistically different between
Ar (17, 2.4%) and Br (15, 4.3%), p=0.188. No Ch patient received HSCT, HMT or iron
chelation therapy.
Page 7 of 30
John Wiley & Sons
American Journal of Hematology
This article is protected by copyright. All rights reserved.

8
Discussion
The incidence and clinical characteristics of patients with MDS varies by geographical
area, and this has been attributed to genetic or ethnic, occupational, lifestyle, and
environmental factors, that have not been fully elucidated [9, 22]. Socioeconomic status
may also influence the outcome of the disease [23]. Knowledge on epidemiological
characteristics of MDS is often based on statistics from selected local populations. On
the other hand, there are some growing data from cancer registries [14] or from
ongoing programs such us the SEER in US [11]. Because of the lack of large,
population-based studies, and Cancer Registries supported by each government, the
incidence of MDS in SA has not been well documented yet. This is the first study which
attempts to describe demographic, clinical features and outcome of patients with MDS
from SA comparing patients from Argentina, Brazil, and Chile.
Our results indicate that some clinical features of Ar, Br and Ch patients may be
different. The median age at diagnosis was 69 years for the whole SA series, the same
as that of the series used for the development of the IPSS [6] and no so far from the 71
years old from the combined databases used for the development of the IPSS-R [7].
However, the median age at diagnosis was lower for Ch series which might be biased
because of the restriction to access to cytogenetic studies for older people in this
country. The age at diagnosis was similar between male and females for the whole
series, however it was higher for Ar males (Figure 3). The median age at diagnosis
seems to vary in different countries, being lower in “Eastern” than in “Western”
countries: 59 years old in China [22], 60 in Japan [24], 58 in Korea [25], 56 in Thailand
[26], and 65 in Taiwan [27], 77 in US [28], 72-73 in Germany [15-16, 29], and 65-71 in
Italy [15-16, 30-31]. However, a new report using a population-based registry data
showed a median age of 76 years for Japan [32]. Another comparative study from New
Zealand and Australia describing epidemiological characteristic based on cancer
registration found a median age at diagnosis of 77-78 years old [14]. Therefore, it
seems that the median age is rising as registries are improving.
Brazil series demonstrated a higher frequency of RARS. Although RCMD without RS
and RCMD-RS entities were merged in the 2008 WHO classification [3], we
differentiated them in Table 1 to point out that more evident differences were observed
in the pure RARS subtype. RARS accounts for 1.5-12% of MDS patients and occurs
primarily in older cases with median age of 60-73 years [3, 22, 33-35] and more
frequent in male than females [3, 33] or with a similar sex ratio [34-35]. The median
age for pure RARS subtype, which accounted for 5.0% of the whole series, was 70
Page 8 of 30
John Wiley & Sons
American Journal of Hematology
This article is protected by copyright. All rights reserved.

9
years old (mean age: 67 years) with a M/F ratio of 0.8 and was detected in 2.5%,
10.4% and 1.2% of Ar, Br and Ch cases, respectively. One possible explanation to the
difference among SA series may be related to the younger mean age of Ch patients
with a higher predominance of cases younger than 40 years old (Figure 2) which
reinforces the relation between RARS incidence and older age. It also should be
emphasized that non neoplastic causes of ring sideroblasts such as alcohol, zinc
administration, copper deficiency and congenital sideroblastic anemia were all
excluded [36].
Series from Brazil and Chile showed higher predominance of hemoglobin level below 7
g/dL (Figure 4) and a higher percentage of pancytopenic patients according to the
IPSS cut-offs [6] when compared with Argentinean series. MDS is more commonly
diagnosed and managed in the outpatient setting and referral of an anemic patient to a
hematologist occurred more often after complications ensued (eg, development of
other cytopenias, infection, bleeding, or increasing transfusion requirements) [11, 37].
Brazil is a country of continental dimensions with widening of social, economic, and
ethnic differences and we evaluated two tertiary and university centers of different
regions (100 patients from the northeast and 245 from the southeast) (Figure 1). The
southeast is the richest and most crowded region of the country. High complexity
hospitals receive many immigrants from various parts of Brazil and the median time
between the onset of symptoms and the diagnosis of MDS is 6 months. The northeast
is poorer and many patients are rural workers who are constantly exposed to pesticides
and to other toxic environmental factors. Among northeastern patients, 50% were from
rural zones and half of the cases were rural workers (data not shown). Farmers without
protection devices, which are common in developing countries, are constantly exposed
to these chemicals associated with MDS etiology [22]. A previous work that evaluated
clinical characteristic of MDS from Ourense, Spain, where 70% of patients lived in rural
environments, showed a frequency of 35% of RARS patients [38], consistent with the
higher frequency of this subtype among Brazilian patients. Although not evaluated, we
can speculate that these elements may also be associated with a higher predominance
of Brazilian patients with lower hemoglobin levels and to the borderline higher
frequency of del(5q), as was previously reported [20]. On the other hand, these
patients from undeveloped regions and lower socioeconomic status may have more
difficulties to arrive to specialized hematology centers, thus presenting with more
pronounced cytopenic states, more red cell allo immunization (data not shown), and,
frequently, with pancytopenia (22%), similar to Ch patients (21%), as compared to Ar
series (15%). This data is consistent with a previous report of a multicenter
Page 9 of 30
John Wiley & Sons
American Journal of Hematology
This article is protected by copyright. All rights reserved.
10
observational cross-sectional survey of MDS Brazilian patients showing a median
hemoglobin level at presentation of 8 g/dL and iron overload in 21% of cases
[Magalhaes et al, 2011, personal communication].
Chilean MDS patients presented with a higher proportion of high risk patients, even
though to the original IPSS-R distribution (10% versus 20%) [7], with a higher
proportion of complex karyotypes and, more often, at pancytopenic states.
Consequently, those patients showed a shorter median survival than Br and Ar. Chile is
a large and narrow country with an organized National Health structure divided into
sanitary regions. Chilean MDS patients from the north and south of the country, where
the rural population prevails, are derived to the specialized hospitals at the central
zone. Bone marrow examination and cytogenetic analysis are only performed at
specialized centers and asymptomatic, stable or very old patients are almost never
referred to those centers. Since cases were collected from a reference hospital, their
diagnosis may reflect a degree of bias toward younger patients who required
aggressive treatment.
Argentina is also a large country, and although our database is based on 20
hematological services including 635 patients, the analysis was restricted to the central
geographic area. According to the latest census, this central zone accounts for the
highest concentration of population (66.3% of the total Ar population) and economic
resources. Health coverage is universal and warranted for all complexity levels under
Argentinean law and more than 64% has a medical insurance in addition to free access
to public hospitals. Health care factors, such as access to medical services and
medical expertise are more accessible in the metropolitan area and in the pampeana
zone than in other regions of Argentina [39]. Argentinean series showed a higher
proportion of patients belonging to lower-risk categories, being more evident when the
IPSS-R was applied. In spite of the observed differences regarding the distribution of
patients according to the IPSS-R and its respective cut-off values for hemoglobin and
platelet counts when compared to Chile and Brazil, Argentine series showed a similar
distribution of patients to the original IPSS-R and to other reports [7, 30]. This finding
may reflect an accumulative referral of early-MDS cases for evaluation to the
specialized Hematological Departments [37]. One could also speculate that Ar-MDS
patients may have access to medical care more easily with a prompt diagnosis leading
to prolonged survival that may play a role in the differences of outcome with Ch.
However, Ar series showed a higher frequency of AML-related deaths, showing a good
follow-up of the natural course of the disease. Argentinean MDS Registry started to
collect data in 2009 from patients diagnosed since 2007 as an attempt to resolve
Page 10 of 30
John Wiley & Sons
American Journal of Hematology
This article is protected by copyright. All rights reserved.

11
missing region’s data. However, Ar registry is not mandatory and depends on the
predisposition of the hematologists to report MDS patients’ data without government
funding and without any active case finding method.
HMT are available in Argentina since 2007 for the treatment of MDS and included in
the obligatory medical plan, in Brazil since 2009, but they are not included among
covered medication by the Health Ministry in Chile. We could evidence a higher
frequency of patients treated with HMT in Ar series. MDS is commonly managed
outside of hospitals, with most patients living for years with their cytopenia(s) looking
for different physician’s opinions, and usually at private physicians’ offices who are not
reporting data. However, once a disease modifying therapy is initiated they usually
continue at the same medical center. Those patients are more easily reported to
population-based registries that may bias the real frequency of patients treated with
HMT in Argentina. However, the median time to initiate an HMT and the median overall
survival once initiated the HMT were similar between Ar and Br series, as well as the
frequency of HSCT as a suitable therapeutic option or the use of iron chelation therapy.
The value of the present study is the inclusion of a large number of patients which
reflects a good representativeness because case series were from different clinical
institutions from each country, although some bias may be present due to patient
referral patterns to the participating institutions, especially in Ch and Br where only 3
institutions participated.
Despite some pointed differences, epidemiological and clinical characteristics,
distribution among prognostic subgroups overall survival, also median time to access to
a disease modifying therapy, such us HMT or HSCT, were similar between Ar and Br
compared to Ch MDS series. Most likely, different reporting methods and the number
of patients might play a role in geographic discrepancies. However, true regional
differences might be related to possible different lifestyles, exposure to environmental
toxic or infectious agents, genetic background, or access to medical experts’ care.
Nevertheless, the IPSS-R system and its variables showed a good reproducibility and
effectiveness to predict clinical outcome in the overall SA population with similarities
regarding the distribution of risk groups and their respectively achieved median
survivals [7].
To the best of our knowledge, this is the first study aimed at evaluating clinical
characteristics and prognostic factors in the survival of MDS patients from SA. Given
the morbidity, mortality, and costs of MDS patients to societies, the need for a greater
investment in registries should be a priority of public concern. Descriptive and
Page 11 of 30
John Wiley & Sons
American Journal of Hematology
This article is protected by copyright. All rights reserved.

12
comparative studies are necessary not only to establish epidemiological features useful
for public health strategies but also to define prognostic factors and generate suitable
therapeutic schemes.
Acknowledgements
The authors would like to thank the investigators of the Argentinean MDS´s Study
Group belonging to the Argentinean Society of Hematology for providing information
from the MDS Registry database. All authors gave significant contributions to draft the
article, critically revise the content of the manuscript and approve the final version.
Funding
This paper was supported by Argentinean grants from the Consejo Nacional de
Investigaciones Científicas y Técnicas (CONICET), the Agencia Nacional de
Promoción Científica y Tecnológica (ANPCyT) and the Instituto Nacional del Cáncer
(INC).
Conflict of interest
The authors declare that they have no conflict of interest.
References
[1] Bennett J, Catovsky D, Daniel M, et al. Proposals for the classification of the
myelodysplastic Syndromes. Br J Haematol 1982;51:189-199.
[2] Jaffe ES, Harris NL, Stein H, Vardiman JW. editors: World Health Organization
Classification of Tumours. Pathology and Genetics of tumours of Haematopoietic and
Lymphoid Tissues. IARC Press: Lyon 2001.
[3] Swerdlow SH, Campo E, Lee Harris N, J et al, editors. WHO Classification of
Tumours of Haematopoietic and Lymphoid Tissues. Vol. 2. International Agency for
Research on Cancer, Lyon 2008.
[4] Tefferi A, Vardiman JW. Myelodysplastic Syndromes. N Engl J Med 2009;361:1872-
1885.
[5] Garcia-Manero G. Myelodysplastic syndromes: 2014 update on diagnosis, risk-
stratification, and management. Am J Hematol 2014;89:97-108.
[6] Greenberg P, Cox C, LeBeau M, et al. International International Scoring System for
evaluating prognosis in myelodysplastic syndromes. Blood 1997;89:2079-2088.
[7] Greenberg PL, Tuechler H, Schanz J, et al. Revised international prognostic scoring
system for myelodysplastic syndromes. Blood 2012;120:2454-2465.
Page 12 of 30
John Wiley & Sons
American Journal of Hematology
This article is protected by copyright. All rights reserved.

13
[8] Mufti GJ, Stevens JR, Oscier DG, et al. Myelodysplastic syndromes: a scoring
system with prognostic significance. Br J Haematol 1985;59:425-433.
[9] Kuendgen A, Matsuda A, Germing U. Differences in epidemiology of MDS between
Western and Eastern countries: Ethnic differences or environmental influence? Leuk
Res 2007;31:103-104.
[10] Sridharan A, Jain R, Bachhuber MA, et al. Epidemiologic study of myelodysplastic
syndromes in a multiethnic, inner city cohort. Exp Hematol Oncol 2014;3:22.
[11] Rollison DE, Howlader N, Smith MT, et al. Epidemiology of myelodysplastic syndromes and chronic myeloproliferative disorders in the United States, 2001-2004, using data from the NAACCR and SEER programs. Blood 2008;112:45-52.
[12] Matsuda A, Germing U, Jinnai I, et al. Difference in clinical features between
Japanese and German patients with refractory anemia in myelodysplastic syndromes.
Blood 2005;106:2633-2640.
[13] Matsuda A, Germing U, Jinnai I, et al. Differences in the distribution of subtypes according to the WHO classification 2008 between Japanese and German patients with refractory anemia according to the FAB classification in myelodysplastic syndromes. Leuk Res 2010;34:974-980.
[14] Rodger EJ, Morison IM. Myelodysplastic syndrome in New Zealand and Australia.
Intern Med J 2012;42:1235-1242.
[15] Malcovati L, Germing U, Kuendgen A, et al. Time-Dependent Prognostic Scoring System for Predicting Survival and Leukemic Evolution in Myelodysplastic Syndromes. J Clin Oncol 2007;25:3503-3510.
[16] Malcovati L, Della Porta MG, Strupp C, et al. Impact of the degree of anemia on the outcome of patients with myelodysplastic syndrome and its integration into the WHO classification-based Prognostic Scoring System (WPSS). Haematologica 2011;96:1433-1440.
[17] Belli C, Acevedo S, Bengio R, et al. Detection of risk groups in myelodysplastic syndromes. A multicenter study. Haematologica 2002;87:9-16.
[18] Belli CB, Bengió R, Aranguren PN, et al. Partial and total monosomal karyotypes in myelodysplastic syndromes: comparative prognostic relevance among 421 patients. Am J Hematol 2011;86:540-545.
[19] Belli CB, Bestach Y, Giunta M, et al. Application of the revised International Prognostic Scoring System for myelodysplastic syndromes in Argentinean patients. Ann Hematol 2014; 93:705-707.
[20] Magalhaes SM, Heredia FF, Fernandes LC, et al. Beyond race-related disparities:
is myelodysplastic syndrome the same everywhere? Leuk Lymphoma 2013;54:1564-
1566.
[21] Valent P, Horny HP, Bennett JM, et al. Definitions and standards in the diagnosis and treatment of the myelodysplastic syndromes: Consensus statements and report from a working conference. Leuk Res 2007;31:727-736.
Page 13 of 30
John Wiley & Sons
American Journal of Hematology
This article is protected by copyright. All rights reserved.

14
[22] Lv L, Lin G, Gao X, et al. Case-control study of risk factors of myelodysplastic syndromes according to World Health Organization classification in a Chinese population. Am J Hematol 2011;86:163-169.
[23] Wang R, Gross CP, Halene S, Ma X. Neighborhood socioeconomic status influences the survival of elderly patients with myelodysplastic syndromes in the United States. Cancer Causes Control 2009;20:1369-1376.
[24] Oguma S, Yoshida Y, Uchino H, et al. Clinical characteristics of Japanese patients with primary myelodysplastic syndromes: a cooperative study based on 838 cases. Anemia Study Group of the Ministry of Health and Welfare. Leuk Res 1995;19:219-225.
[25] Park MJ, Kim HJ, Kim SH, et al. Is International Prognostic Scoring System (IPSS) still standard in predicting prognosis in patients with myelodysplastic syndrome? External validation of the WHO Classification-Based Prognostic Scoring System (WPSS) and comparison with IPSS. Eur J Haematol 2008;81:364-373.
[26] Intragumtornchai T, Prayoonwiwat W, Swasdikul D, et al. Myelodysplastic
syndromes in Thailand: a retrospective pathologic and clinical analysis of 117 cases.
Leuk Res 1998;22:453-460.
[27] Yang YT, Hou HA, Liu CY, et al. IPSS-R in 555 Taiwanese patients with primary MDS: Integration of monosomal karyotype can better risk-stratify the patients. Am J Hematol 2014;89:E142-149.
[28] Cogle CR, Craig BM, Rollison DE, List AF. Incidence of the myelodysplastic syndromes using a novel claims-based algorithm: high number of uncaptured cases by cancer registries. Blood 2011;117:7121-7125.
[29] Neukirchen J, Schoonen WM, Strupp C, et al. Incidence and prevalence of myelodysplastic syndromes: data from the Dusseldorf MDS-registry. Leuk Res 2011;35:1591-1596.
[30] Voso MT, Fenu S, Latagliata R, et al. Revised International Prognostic Scoring System (IPSS) predicts survival and leukemic evolution of myelodysplastic syndromes significantly better than IPSS and WHO Prognostic Scoring System: validation by the Gruppo Romano Mielodisplasie Italian Regional Database. J Clin Oncol 2013;31:2671-2677.
[31] Bernasconi P, Klersy C, Boni M, et al. Validation of the new comprehensive cytogenetic scoring system (NCCSS) on 630 consecutive de novo MDS patients from a single institution. Am J Hematol 2013;88:120-129.
[32] Chihara D, Ito H, Katanoda K, et al. Incidence of Myelodysplastic Syndrome in Japan. J Epidemiol 2014;24:469-473
[33] Malcovati L, Porta MG, Pascutto C, et al. Prognostic factors and life expectancy in myelodysplastic syndromes classified according to WHO criteria: a basis for clinical decision making. J Clin Oncol 2005;23:7594-7603.
[34] Nösslinger T, Reisner R, Koller E, et al. Myelodysplastic syndromes, from French-American-British to World Health Organization: comparison of classifications on 431 unselected patients from a single institution. Blood 2001;98:2935-2941.
Page 14 of 30
John Wiley & Sons
American Journal of Hematology
This article is protected by copyright. All rights reserved.
15
[35] Germing U, Strupp C, Kuendgen A, et al. Prospective validation of the WHO proposals for the classification of myelodysplastic syndromes. Haematologica 2006;91:1596-1604.
[36] Koc S, Harris JW. Sideroblastic anemias: variations on imprecision in diagnostic criteria, proposal for an extended classification of sideroblastic anemias. Am J Hematol 1998;57:1-6.
[37] Abel GA, Friese CR, Neville BA, et al. Referrals for suspected hematologic malignancy: a survey of primary care physicians. Am J Hematol 2012;87:634-636.
[38] Iglesias Gallego M, Sastre Moral JL, Gayoso Diz P, et al. Incidence and characteristics of myelodysplastic syndromes in Ourense (Spain) between 1994-1998. Haematologica 2003;88:1197-1199.
[39] INDEC. Instituto Nacional de Estadísticas y Censos. Censo Nacional de Población, Hogares y Viviendas 2010. Censo Del Bicentenario Resultados Definitivos. Serie B Nº 2. Talleres Gráficos Prix, Buenos Aires 2012.
Page 15 of 30
John Wiley & Sons
American Journal of Hematology
This article is protected by copyright. All rights reserved.

16
Figure Legends
Figure 1: Location of participating institutions from Argentine, Brazil and Chile.
Figure 2: Distribution of Argentinean, Brazilian and Chilean series according to the range of age
Figure 3: Distribution of MDS patients in the SA series according age and gender. ys: years
Figure 4: Distribution of Argentinean, Brazilian and Chilean patients according to hemoglobin levels.
Figure 5: Cumulative overall survival of South American patients. A- Argentinean, Brazilian and Chilean series. B- IPSS for the whole SA series of 1035 pts. C- IPSS-R for the FAB classified SA MDS population (N=956 patients). D- IPSS-R for the WHO based SA MDS population (N=810 patients)
Page 16 of 30
John Wiley & Sons
American Journal of Hematology
This article is protected by copyright. All rights reserved.

Location of participating institutions from Argentine, Brazil and Chile 184x190mm (96 x 96 DPI)
Page 17 of 30
John Wiley & Sons
American Journal of Hematology
This article is protected by copyright. All rights reserved.

Distribution of Argentinean, Brazilian and Chilean series according to the range of age 210x132mm (96 x 96 DPI)
Page 18 of 30
John Wiley & Sons
American Journal of Hematology
This article is protected by copyright. All rights reserved.

Distribution of MDS patients in the SA series according age and gender. ys: years 189x132mm (96 x 96 DPI)
Page 19 of 30
John Wiley & Sons
American Journal of Hematology
This article is protected by copyright. All rights reserved.

Distribution of Argentinean, Brazilian and Chilean patients according to hemoglobin levels 194x139mm (96 x 96 DPI)
Page 20 of 30
John Wiley & Sons
American Journal of Hematology
This article is protected by copyright. All rights reserved.
194x139mm (96 x 96 DPI)
Page 21 of 30
John Wiley & Sons
American Journal of Hematology
This article is protected by copyright. All rights reserved.
194x139mm (96 x 96 DPI)
Page 22 of 30
John Wiley & Sons
American Journal of Hematology
This article is protected by copyright. All rights reserved.

194x139mm (96 x 96 DPI)
Page 23 of 30
John Wiley & Sons
American Journal of Hematology
This article is protected by copyright. All rights reserved.

194x139mm (96 x 96 DPI)
Page 24 of 30
John Wiley & Sons
American Journal of Hematology
This article is protected by copyright. All rights reserved.

Table 1: Laboratory and clinical features at the time of diagnosis
Variable
Argentine Brazil Chile P value Total
N=635 N=345 N=100 1080
Gender
Male/Female 356/279 193/152 44/56 =0.071 593/487
rate 1.3 1.3 0.8 1.2
Age (years)
Mean ± S.D. 66 ± 15 65 ± 17 59 ± 19 =0.001 65 ± 16
Range 17-93 15-99 15-89 15-99
Median 69 68 64 69
FAB <0.001
RA 328 (51.7) 159 (46.1) 67 (67.0) =0.006 554 (51.3)
RARS 58 (9.1) 59 (17.1) 1 (1.0) <0.001 118 (10.9)
RAEB 135 (21.3) 78 (22.6) 24 (24.0) n.s. 237 (21.4)
RAEBt 54 (8.5) 24 (7.0) 8 (8.0) n.s. 86 (8.0)
CMML-MDS 60 (9.4)† 25 (7.2)† - n.s.† 85 (7.9)
WHO N=520 N=299 N=85 <0.001 N=904
5q- 24 (4.6) 9 (3.0) 4 (4.7) n.s 37 (4.1)
RCUD 57 (11.0) 40 (13.4) 11 (12.9) n.s 108 (12.0)
RARS 13 (2.5) 31 (10.4) 1 (1.2) <0.001 45 (5.0)
RCMD ‡ 230 (44.1) 105 (35.1) 45 (52.9) =0.004 380 (42.0)
RCMD-RS ‡ 42 (8.1) 21 (7.2) 0 (0.0) =0.025 63 (7.0)
RAEB-1 65 (12.5) 44 (14.7) 10 (11.8) n.s 119 (13.2)
RAEB-2 89 (17.1) 45 (15.1) 14 (16.5) n.s 148 (16.4)
MDS-U 0 (0.0) 4 (1.3) 0 (0.0) - 4 (0.4)
BM Blasts (%)
Mean ± S.D. 4.5 ± 6.3 4.4 ± 5.7 5.5 ± 7.2 =0.161
4.6±6.2
Range 0.0-30.0 0.0-29.0 0.0-29.0 0.0-30.0
Median 2.0 1.6 2.0 2.0
Hemoglobin (g/dL)
Mean ± S.D. 9.6 ± 2.1 8.8 ± 2.6 8.7 ± 2.6 <0.001 9.2 ± 2.4
Range 4.0-15.3 1.9-16.7 3.6-16.5 1.9-16.7
Median 9.6 8.6 8.5 9.2
Neutrophil count (/µL)
Mean ± S.D. 2178 ± 1572 2196 ± 1879 2100 ± 1447 =0.569 2176 ± 1703
Range 110-10200 28-10300 63-9680 28-10300
Median 1766 1604 1447 1700
Platelets count (/µL)
Mean ±
S.D.
159632 ±
127000
157382 ±
155741
148777 ±
165560
0.028 157812 ±
146819
Range 2000-912000 1500-930000 1600-800000 1500-930000
Median 127000 105000 83500 117000
† CMML-MDS subtype were excluded for the overall statistical comparison, since Ch
did not include CMML-MDS patients. ‡ RCMD without RS and RCMD-RS, merged in
the 2008 WHO classification [3], were disclosed for comparison purpose
Page 25 of 30
John Wiley & Sons
American Journal of Hematology
This article is protected by copyright. All rights reserved.

Table 2: Cytogenetic findings at the time of diagnosis
Variable
Argentine
N=632
Brazil
N=309
Chile
N=99 P value
Total
N=1040
Karyotype =0.258
Normal 367 (58.1) 186 (60.2) 66 (66.7) 619 (59.5)
Abnormal 265 (41.9) 123 (39.8) 33 (33.3) 421 (40.5)
More frequent Cytogene*c Aberra*ons‡
-Y 18 (6.8) 3 (2.4) 0 (0) =0.073 21 (5.0)
del(5q) 31 (11.7) 23 (18.7) 6 (18.2) n.s. 60 (14.3)
del(20q) 16 (6.0) 5 (4.0) 1 (3.0) n.s. 22 (5.2)
+8 34 (12.8) 11 (8.9) 3 (9.1) n.s. 48 (11.4)
del(7q)/-7 19 (7.2) 8 (6.5) 1 (3.0) n.s. 28 (6.7)
Complex (≥3 abnormalities) 47 (17.7) 21 (17.1) 14 (42.4) =0.002 82 (19.5)
IPSS Cytogenetic Groups of risk =0.159
Good 432 (68.4) 217 (70.2) 73(73.7) n.s. 722 (69.4)
Intermediate 126 (19.9) 53 (17.2) 10 (10.1) =0.053 189 (18.2)
Poor 74 (11.7) 39 (12.6) 16 (16.2) n.s. 129 (12.4)
IPSS-R Cytogenetic Groups of risk =0.091
Very Good/ Good 445 (70.4) 231 (74.8) 73 (73.7) n.s. 749 (72.0)
Intermediate 120 (19.0) 45 (14.6) 9 (9.1) =0.024 174 (16.7)
Poor 30 (4.7) 17 (5.5) 9 (9.1) n.s. 56 (5.4)
Very Poor 37 (5.9) 16 (5.2) 8 (8.1) n.s. 61 (5.9)
‡Percentage from abnormal karyotypes; n.s.: non-significant differences; IPSS:
International Prognostic Scoring System [6]; IPSS-R: IPSS revised version [7]
Page 26 of 30
John Wiley & Sons
American Journal of Hematology
This article is protected by copyright. All rights reserved.

1
Table 3: Distribution among IPSS and IPSS-R categories
Variable Argentine Brazil Chile P value Total
IPSS N=628 N=308 N=99 =0.046 N=1035
Low 217 (34.6) 90 (29.2) 30 (30.3) n.s. 337 (32.6)
Int-1 262 (41.7) 143 (46.4) 44 (44.4) n.s. 449 (43.4)
Int-2 95 (15.1) 47 (15.3) 8 (8.1) n.s. 150 (14.5)
High 54 (8.6) 28 (9.1) 17 (17.2) =0.025 99 (9.6)
IPSS-R N=558 N=301 N=97 <0.001 N=956
Very Low 122 (21.9) 46 (15.3) 7 (7.2) <0.001 175 (18.3)
Low 225 (40.3) 103 (34.2) 36 (37.1) n.s. 364 (38.1)
Intermediate 77 (13.8) 68 (22.5) 26 (26.8) <0.001 171 (17.9)
High 77 (13.8) 44 (14.6) 9 (9.3) n.s. 130 (13.6)
Very High 57 (10.2) 40 (13.3) 19 (19.6) =0.025 116 (12.1)
IPSS-R (WHO based) N=470 N=258 N=82 N=810
Very Low 103 (21.9) 35 (13.6) 6 (7.3) <0.001 144 (17.8)
Low 194 (41.1) 97 (38.7) 31 (37.8) n.s. 322 (39.8)
Intermediate 68 (14.5) 59 (22.8) 24 (29.3) <0.001 151 (18.6)
High 62 (13.1) 34 (13.2) 8 (9.8) n.s. 104 (12.8)
Very High 43 (9.1) 33 (12.8) 13 (15.9) n.s. 89 (11.0)
IPSS: International Prognostic Scoring System [6]; IPSS-R: IPSS revised version [7];
WHO: World Health Organization classification [3]; n.s.: non-significant differences.
Page 27 of 30
John Wiley & Sons
American Journal of Hematology
This article is protected by copyright. All rights reserved.
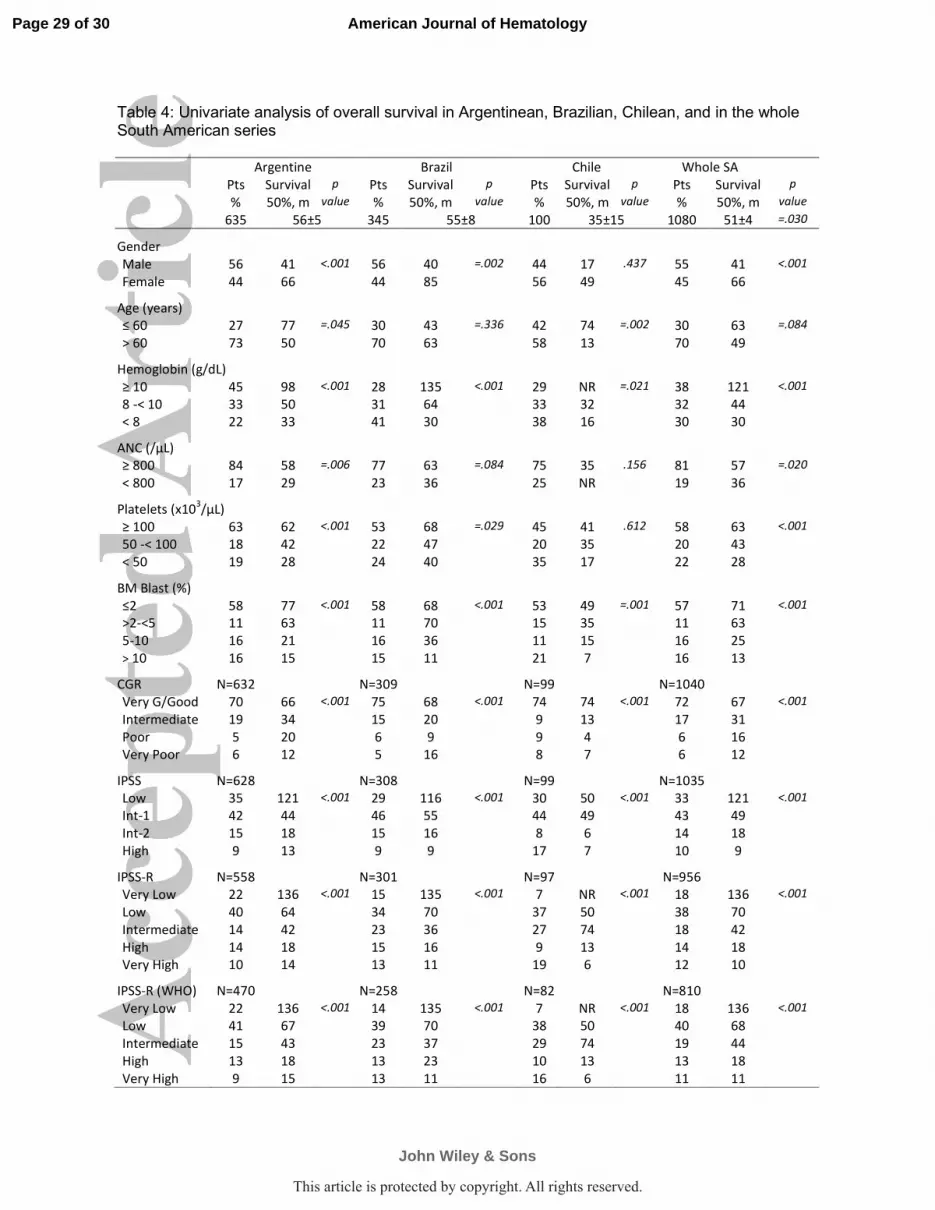
Table 4: Univariate analysis of overall survival in Argentinean, Brazilian, Chilean, and in the whole South American series Argentine Brazil Chile Whole SA
Pts Survival p Pts Survival p Pts Survival p Pts Survival p
% 50%, m value % 50%, m value % 50%, m value % 50%, m value
635 56±5 345 55±8 100 35±15 1080 51±4 =.030
Gender
Male 56 41 <.001 56 40 =.002 44 17 .437 55 41 <.001
Female 44 66 44 85 56 49 45 66
Age (years)
≤ 60 27 77 =.045 30 43 =.336 42 74 =.002 30 63 =.084
> 60 73 50 70 63 58 13 70 49
Hemoglobin (g/dL)
≥ 10 45 98 <.001 28 135 <.001 29 NR =.021 38 121 <.001
8 -< 10 33 50 31 64 33 32 32 44
< 8 22 33 41 30 38 16 30 30
ANC (/µL)
≥ 800 84 58 =.006 77 63 =.084 75 35 .156 81 57 =.020
< 800 17 29 23 36 25 NR 19 36
Platelets (x103/µL)
≥ 100 63 62 <.001 53 68 =.029 45 41 .612 58 63 <.001
50 -< 100 18 42 22 47 20 35 20 43
< 50 19 28 24 40 35 17 22 28
BM Blast (%)
≤2 58 77 <.001 58 68 <.001 53 49 =.001 57 71 <.001
>2-<5 11 63 11 70 15 35 11 63
5-10 16 21 16 36 11 15 16 25
> 10 16 15 15 11 21 7 16 13
CGR N=632 N=309 N=99 N=1040
Very G/Good 70 66 <.001 75 68 <.001 74 74 <.001 72 67 <.001
Intermediate 19 34 15 20 9 13 17 31
Poor 5 20 6 9 9 4 6 16
Very Poor 6 12 5 16 8 7 6 12
IPSS N=628 N=308 N=99 N=1035
Low 35 121 <.001 29 116 <.001 30 50 <.001 33 121 <.001
Int-1 42 44 46 55 44 49 43 49
Int-2 15 18 15 16 8 6 14 18
High 9 13 9 9 17 7 10 9
IPSS-R N=558 N=301 N=97 N=956
Very Low 22 136 <.001 15 135 <.001 7 NR <.001 18 136 <.001
Low 40 64 34 70 37 50 38 70
Intermediate 14 42 23 36 27 74 18 42
High 14 18 15 16 9 13 14 18
Very High 10 14 13 11 19 6 12 10
IPSS-R (WHO) N=470 N=258 N=82 N=810
Very Low 22 136 <.001 14 135 <.001 7 NR <.001 18 136 <.001
Low 41 67 39 70 38 50 40 68
Intermediate 15 43 23 37 29 74 19 44
High 13 18 13 23 10 13 13 18
Very High 9 15 13 11 16 6 11 11
Page 29 of 30
John Wiley & Sons
American Journal of Hematology
This article is protected by copyright. All rights reserved.

IPSS: International Prognostic Scoring System [6]; IPSS-R: IPSS revised version [7]; BM: bone
Marrow: ANC: Absolute Neutrophil Count; CGR: Cytogenetic Group of risk according to the IPSS-R
[7]; WHO: World Health Organization classification [3]; NR: not reached, Pts: patients, m: months;
N: number of patients; SA: South American series.
Page 30 of 30
John Wiley & Sons
American Journal of Hematology
This article is protected by copyright. All rights reserved.

Supplementary Figure 1
A-
B-
This article is protected by copyright. All rights reserved.
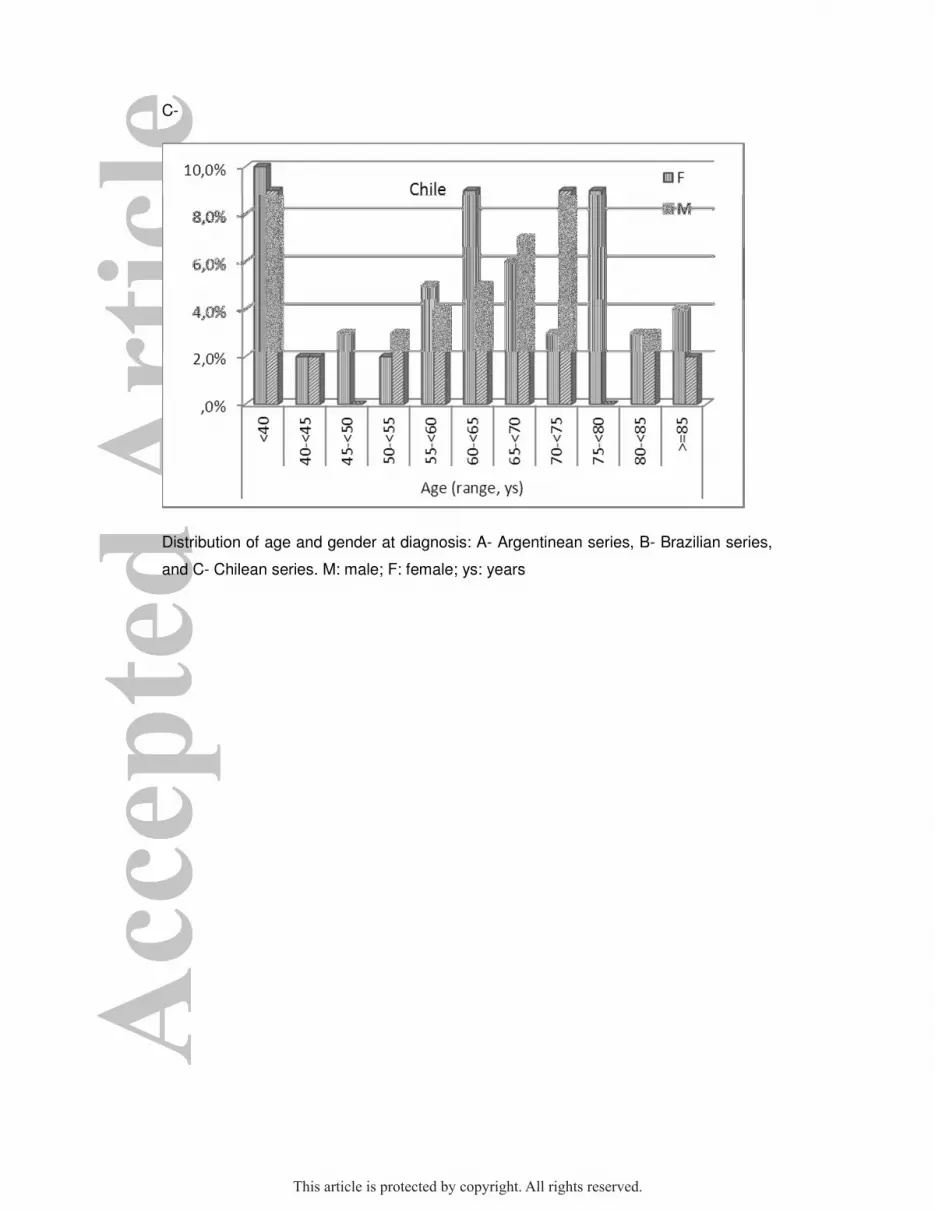
C-
Distribution of age and gender at diagnosis: A- Argentinean series, B- Brazilian series,
and C- Chilean series. M: male; F: female; ys: years
This article is protected by copyright. All rights reserved.
Recommended


