1
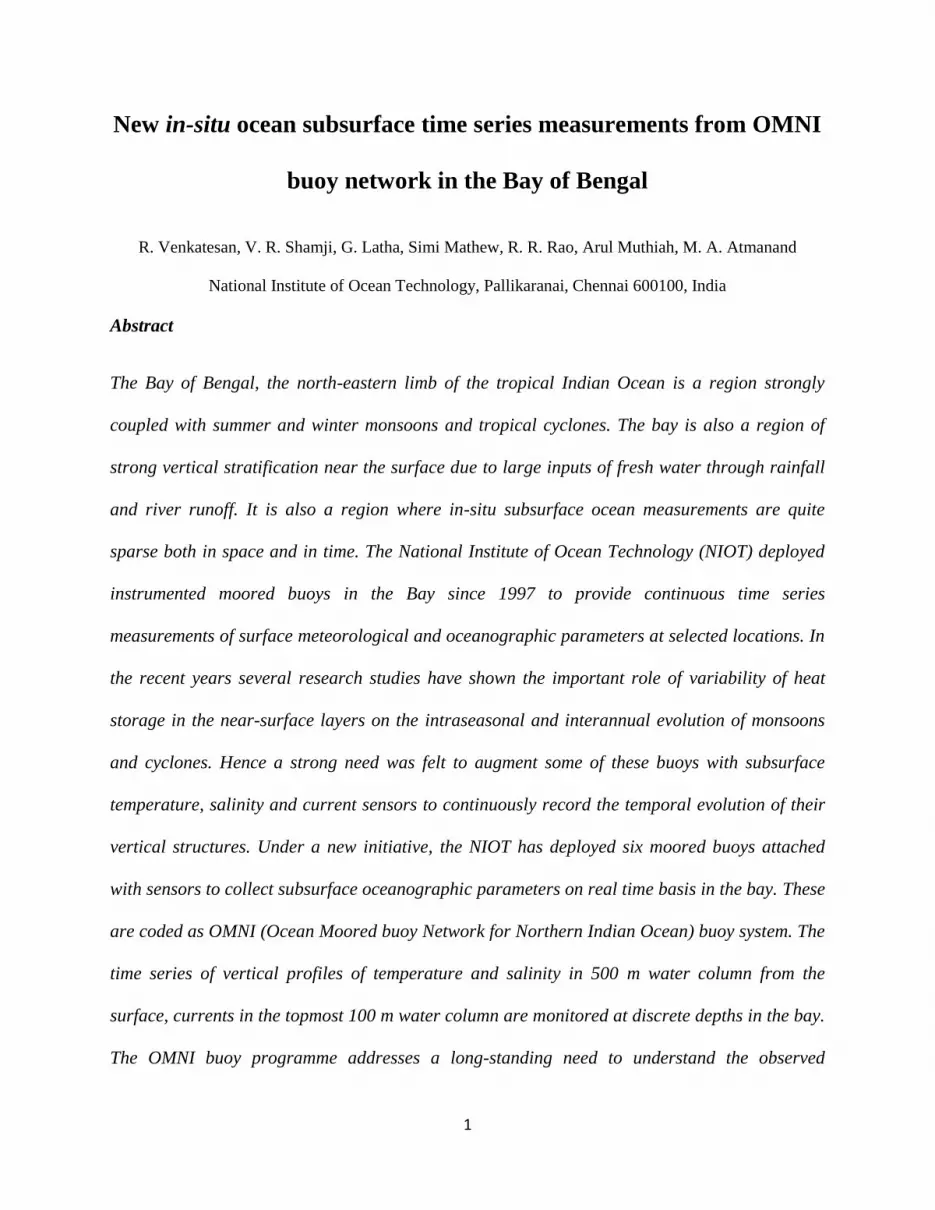
New in-situ ocean subsurface time series measurements from OMNI
buoy network in the Bay of Bengal
R. Venkatesan, V. R. Shamji, G. Latha, Simi Mathew, R. R. Rao, Arul Muthiah, M. A. Atmanand
National Institute of Ocean Technology, Pallikaranai, Chennai 600100, India
Abstract
The Bay of Bengal, the north-eastern limb of the tropical Indian Ocean is a region strongly
coupled with summer and winter monsoons and tropical cyclones. The bay is also a region of
strong vertical stratification near the surface due to large inputs of fresh water through rainfall
and river runoff. It is also a region where in-situ subsurface ocean measurements are quite
sparse both in space and in time. The National Institute of Ocean Technology (NIOT) deployed
instrumented moored buoys in the Bay since 1997 to provide continuous time series
measurements of surface meteorological and oceanographic parameters at selected locations. In
the recent years several research studies have shown the important role of variability of heat
storage in the near-surface layers on the intraseasonal and interannual evolution of monsoons
and cyclones. Hence a strong need was felt to augment some of these buoys with subsurface
temperature, salinity and current sensors to continuously record the temporal evolution of their
vertical structures. Under a new initiative, the NIOT has deployed six moored buoys attached
with sensors to collect subsurface oceanographic parameters on real time basis in the bay. These
are coded as OMNI (Ocean Moored buoy Network for Northern Indian Ocean) buoy system. The
time series of vertical profiles of temperature and salinity in 500 m water column from the
surface, currents in the topmost 100 m water column are monitored at discrete depths in the bay.
The OMNI buoy programme addresses a long-standing need to understand the observed

2
variability of upper ocean thermohaline and current structures on several time scales that has
important bearing on the evolution of seasonal monsoons and cyclones. This paper presents an
account on the evolution, status and usefulness of the new Indian OMNI buoy programme.
Keywords: OMNI buoy, subsurface time series measurements, Bay of Bengal
*For correspondence. (E-mail: [email protected])
1. Introduction
The recent advances made in observational technologies in the fields of sensors, platforms and
real time communication now provide unprecedented capability to monitor changes in our
oceans and atmosphere that present new opportunities to understand the role of the oceans on
climate change. Understanding our oceans is critical to protect people from natural disasters and
the impending challenges of changing climate. Monitoring marine environment is essential to
provide information for research and services. Influence of oceanic processes on weather and
climate has been known for decades. Our ability to forecast weather and global climate changes,
thus minimising disastrous effects of events such as cyclones, storm surges and tsunamis, remain
contingent on our capability to observe the changes in ocean in real time at spatial and temporal
scales with the required resolution and accuracy. Traditionally routine ocean measurements are
carried out by ships of opportunity - cargo, fishery and naval vessels in a random manner.
Special campaign measurements are made by research vessels to study a particular phenomenon
or process. Moored buoy observations provide continuous time series measurements at fixed
locations for forecasting and warning operations and to a variety of basic and applied research
studies. In addition certain marine meteorological parameters such as sea level pressure and

3
surface air temperature that cannot be measured directly by satellites can be monitored by these
data buoys. A number of data buoys were deployed by the NIOT at selected locations in the
eastern Arabian Sea and the Bay of Bengal which are operational since 1997 primarily to
monitor surface met-ocean parameters on real time basis.
The NIOT buoy data have been widely used both by operational and scientific communities to
understand and predict the observed variability of monsoons, cyclones and short-term climate
change through an improved approach of air-sea interaction processes. Premkumar et al.1 have
carried out preliminary analysis of the NIOT met-ocean buoy data in which they have used data
collected from one buoy in the eastern Arabian Sea and three buoys in the bay. It was observed
that the sea surface temperature (SST) dropped abruptly by almost 3oC in the eastern Arabian
Sea during the passage of a cyclone in June 1998 and the buoys in the bay showed prominent
intraseasonal oscillations. Bhat et al.2
have studied the intraseasonal variation over the bay in
SST and surface wind speed using the NIOT buoy data. Bhat et al.3 have assessed the accuracy
of the SST derived from Tropical Rainfall Measuring Mission (TRMM) Microwave Imager
(TMI) over the bay using in situ data collected from the NIOT moored buoys and research ships.
Agarwal et al.4 have validated scatterometer wind speed against the NIOT buoy wind data at
three locations in the eastern Arabian Sea and the Bay of Bengal and also compared simulated
SST with north Indian Ocean buoy data. Bhat and Narasimha5 used the NIOT moored buoy data
for studies of Indian summer monsoon experiments. They used SST from the NIOT moored
buoys to compare with optimally interpolated SST downloaded from National Oceanic and
Atmospheric Administration (NOAA) and wind speed for their summer monsoon study.
Lakshmi et al.6
have studied bimodal distribution of SST over the north Indian Ocean using the
NIOT buoy data. Vaid et al.7 have used daily SST products of NOAA to understand the

4
variability in the tropical Indian Ocean and compared with SST observed from the NIOT
moored buoy network in the north Indian Ocean.
Parekh and Sarkar8 have studied the dependence of the difference in ocean sub-skin and bulk
temperature (Tsubskin-T2.5m) on environmental parameters over the north Indian Ocean using buoy
data. Parekh et al.9 have compared surface wind speed and SST from satellite measurements
(TMI and Muiltifrequency Scanning Microwave Radiometer (MSMR)) and the numerical
weather prediction model (ERA-40) outputs with the NIOT buoy observations from both the
eastern Arabian Sea and the Bay of Bengal. Parekh et al.10
have developed empirical retrieval
algorithm for wind speed using the NIOT buoy and MSMR brightness temperature data.
Satheesan et al. 11
have studied the performance of QuikSCAT derived wind vectors using in-situ
data obtained from moored buoys over the north Indian Ocean. Ruchi Kalra et al.12
have used the
NIOT buoy data in an approach based on the radial basis function type of artificial neural
network to map remotely sensed waves in the deep and coastal oceans. Jignesh Kshatriya et al.13
have estimated wave periods using the NIOT buoy data and TOPEX/Poseidon altimeter in the
Indian Ocean. Raj Kumar et al.14
have attempted assimilation of altimeter data in the open ocean
wave model (SWAN) with the aim of enhancing the quality of prediction of significant wave
height using the NIOT buoy data. Sengupta et al.15
used the subsurface measurements from
moored the NIOT buoys during spring of 1998–2000 and suggested that the warming of the
mixed layer (~20 m deep) in the eastern Arabian Sea warm pool is a direct response to net
surface heat flux Qnet (~100 W m-2
) minus penetrative solar radiation Qpen (~45 W m-2
).
Chinthalu et al.16
have studied the response of the bay to two tropical cyclones, during 15–31
October 1999, using data collected by the NIOT moored buoy network. Jossia Joseph et al.17
have studied inertial oscillations forced by a cyclone in the bay during September 1997 using the

5
NIOT moored buoy data. Sengupta and Ravichandran18
studied strong monsoon intraseasonal
oscillations (ISO) during the summer of 1998 in the bay using the NIOT moored buoy data along
with satellite cloud data. Hareesh Kumar et al.19
have reported intraseasonal oscillations in the
meteorological and oceanographic fields of the bay during the summer monsoon season of 1999
using the NIOT buoy data. Anant Parekh et al.20
and Agarwal et al. 21
have reported sub-monthly
(10-20 days) intraseasonal variability in BoB using the NIOT buoy and TMI data. Sengupta et
al.22
have studied the premonsoon intraseasonal variability in the Arabian Sea using the NIOT
buoy and satellite data. Swain et al.23
compared the National Centre for Environment Prediction
(NCEP) based latent heat flux and sensible heat flux derived from bulk aerodynamic formulae
with that of ship and the NIOT buoy derived fluxes. All the above listed studies are based on first
of its kind surface met-ocean parameters recorded by the NIOT moored buoy network in the Bay
of Bengal and the eastern Arabian Sea. All the above listed studies clearly reveal the utility of the
surface time series data sets collected from the NIOT buoy network.
2. Deep Sea Instrumented Buoy System - OMNI
In the recent years several research studies have shown the important role of SST and heat
storage in the near-surface layer on the intraseasonal evolution of monsoons and cyclones. In the
global scenario the research studies carried out with long time series data sets collected by
moored buoys fitted with subsurface temperature, salinity, current sensors under Tropical Ocean
and Global Atmosphere (TOGA), World Ocean Circulation Experiment (WOCE) and Prediction
and Research Moored Array in the Atlantic (PIRATA) programmes in the tropical Pacific and
the Atlantic Oceans have clearly revealed the importance of upper ocean data on the evolution of
near-surface stratification, heat storage and SST, which act as an important surface boundary
condition for weather and climate prediction models. The WOCE experiment has collected data

6
globally which has helped to study the long term behaviour of the oceans for better prediction by
climate models (Gould24
).The subsurface measurements of temperature, salinity, currents made
in the equatorial Pacific Ocean under TOGA and WOCE programmes have significantly
contributed to successful prediction of El Niño/La Niña events that influence major part of the
global weather and climate patterns (McPhaden et al.25
).The PIRATA program has helped in
understanding the relative contributions of the different components of the surface heat flux and
ocean dynamics to the seasonal and interannual variations of SST in the Atlantic Ocean
(Bourlès,et al.26
).These programmes have helped to improve our knowledge and understanding
of ocean–atmosphere variability in the tropical ocean basins.
In the Indian scenario, some important field experiments were carried out in the Arabian Sea and
the Bay of Bengal during summer monsoon season. The rich data sets collected from these
experiments viz., the Summer Monsoon Experiments (ISMEX-73, MONSOON-77, MONEX-79
and MONEX-90), Arabian Sea Monsoon Experiment (ARMEX), Monsoon Trough Boundary
Layer Experiment (MONTBLEX), Bay of Bengal Monsoon Experiment (BOBMEX) and Joint
Air-Sea Monsoon Interaction Experiment (JASMINE) have provided valuable insights on the
coupling between the ocean and summer monsoon. During the Monsoon Experiment programme
the short time series measurements made from stationary ships have shown changes in the
surface meteorological forcing and the response characteristics of the ocean near-surface
thermohaline structure in the east central Arabian Sea and the northern Bay of Bengal under the
onset and progress regimes of summer monsoon (Rao et al.27
). The oceanic component of the
MONTBLEX programme mainly focused on the observed short-term variability of the near-
surface thermohaline structure in the head bay during active and break regimes of summer
monsoon and revealed that the small-scale vertical structure in the thermohaline fields was more

7
prominent during September 1990 compared to August 1990. A relationship between the genesis
of meteorological systems and increase in heat content in the near-surface layer was also
reported (Sanilkumar et al.28
). During BOBMEX the thermohaline structure as well as its time
of evolution was found to be different in the northern bay compared to that in the southern bay.
Over both the regions, the SST decreased during rain events and increased during cloud-free
conditions. Over the season as a whole, the upper-layer salinity decreased in the northern bay
and increased in the southern bay. The intraseasonal variation in SST during 1999 was found to
be of smaller amplitude than in 1998 (Bhat et al.2). The JASMINE programme mainly focused
on the coupled ocean-atmospheric system in the eastern equatorial Indian Ocean and the
southern Bay of Bengal during active and break periods of the summer monsoon (Webster et
al.29
). These studies although based on short data records have pointed out the importance of the
temporal variation of subsurface ocean conditions towards a better understanding of the summer
monsoon. The necessity to deploy buoys with subsurface measurements has been felt by the
international scientific community and accordingly a few buoys were deployed in the tropical
Indian Ocean under the aegis of Research Moored Array for African-Asian-Australian Monsoon
Analysis and Prediction (RAMA) (McPhaden et al.30, 31
).These RAMA buoys have been
providing the first of its kind data that add great value for our understanding on the coupling
between ocean and monsoons and cyclones on different time scales. From the Indian side a need
was also felt to evolve a new moored data buoy system to continuously record vertical profiles of
temperature, salinity and currents at selected locations in the bay to supplement the RAMA
programme. This new moored buoy array in the historically data-sparse north Indian Ocean
provides measurements to advance monsoon research and forecasting. It is designed specifically

8
for studying large-scale ocean–atmosphere interactions, mixed-layer dynamics, and ocean
circulation related to the monsoons on intraseasonal to interannual time scales.
Under this new initiative on the advice of a National Expert Committee for the OMNI buoy
program under Ministry of Earth Sciences the NIOT has deployed a network of six moored buoy
systems equipped with subsurface sensors to measure oceanographic parameters on real time
basis in the bay (Fig. 1). These buoys were deployed initially at two locations BD13 [86oE,
11oN] and BD14 [85
oE, 8
oN] during October 2010 and later at four locations BD08 [89
oE, 18
oN],
BD10 [88oE, 16
oN], BD11 [83
oE, 14
oN] and BD12 [94
oE, 10
oN] during May 2011 in the bay.
The OMNI buoy is designed in such a way that it measures both surface met-ocean and
subsurface oceanographic parameters with sensors fitted at specific levels. The subsurface
current sensors are also attached to the buoy to measure vertical profiles of horizontal currents in
the topmost 100 m water column. All the met-ocean parameters, their sensors, ranges,
resolutions, accuracies, sampling and transmission intervals measured at the surface and at
different subsurface levels by these buoys are listed in Table. 1.
All the meteorological and oceanographic measurements are transmitted via satellite every 3
hours in real time and are available to all interested users for operational and research
applications through Indian National Centre for Ocean Information Services (INCOIS,
Hyderabad). The choice of total number of buoy moorings is a compromise between the need to
put out a large enough arrays of buoys for a long period of time to gain fundamentally new
insights into coupled ocean–atmosphere interaction in the region, and the practical constraints of
resources in terms of funding, ship time, deployment and maintenance activities. The buoy
maintenance every six months is regularly accomplished by the NIOT team along with an inter-
comparison of the buoy subsurface conductivity and temperature data with the ship borne

9
conductivity, temperature and depth (CTD) sampling depending on the availability of ship (Fig.
2). Some of the potential applications of these buoy data sets are discussed in the following
sections.
2.1 Operational Applications
The buoy data are found to be immensely useful to monitor and predict the evolution of
monsoons and cyclonic storms over the bay. In India, the India Meteorological Department
(IMD) is the primary organization to issue weather forecasts for the Indian region and its
neighbourhood. These forecasts are made by taking into account both atmospheric measurements
and surface marine meteorological parameters from the neighbouring seas. All the marine
meteorological and ocean subsurface data also have immense applications in the areas of
exploitation of fishery resources, ship routing, offshore industry and naval operations. The data
available on surface waves and currents can be effectively used for optimum ship routing to save
time and fuel costs. Generally during rough weather conditions caused by cyclonic storms and
active monsoon conditions, the ships try to keep off from disturbed zones. This limits the
availability of ship data on sea level pressure, surface wind speed, waves, currents and SST
during crucial times. During these disturbed weather conditions these moored buoys will
continue to provide very valuable data thus greatly helping IMD for more accurate predictions of
cyclonic storms in the bay. These buoy data are available for assimilation into models in real
time by several operational forecasting agencies all over the world to issue forecasts with
significant improvements (Vilard A. et al.32
). In addition to IMD, the INCOIS, the Indian Navy
and the Coast Guard also make use of these buoy data sets to forecast ocean state conditions
routinely to meet their operational needs. During 3-7, November, 2010 a cyclone named Jal
traversed between two OMNI buoys BD13 and BD14 and hit the southeast coast of India. The

10
peak surface winds touched 16m/s. The response of the near-surface thermal structure at these
two buoy locations clearly show rapid cooling and deepening of the surface mixed layer (Fig. 3).
2.2 Research and Development Applications
The analysis of OMNI buoy data will provide valuable insights for our understanding leading to
better predictions of monsoons and cyclones in the bay. The availability of long time series of
data from these OMNI buoys at selected locations complementing both the RAMA buoys and
the ARGO profiling floats would be very valuable for our understanding of the evolution of
active-break cycles of summer and winter monsoons, and the life cycles of monsoon lows,
depressions, deep depressions, cyclones and severe cyclones, which mostly originate over the
bay. Hence advance knowledge about the heat stored in the upper layers of the bay becomes a
vital input for the understanding and predictions of weather and short-term climate. It is in this
context the information generated on the subsurface thermohaline structure helps the
meteorological and oceanographic communities to do improved predictions.
The signature of intraseasonal oscillations in the observed parameters can be better characterised
with the help of these buoy data. In addition, studies related to warm and cold pools, fresh water
pools, mixed and barrier layers can be carried out to explain their structure and variability in the
bay. The evolution of mixed layer depth, isothermal layer depth as well as barrier layer thickness
as observed by BD13 in the southern Bay of Bengal is shown in Fig. 4. These data sets collected
by buoys also provide valuable clues for understanding the genesis, intensification and
movement of meteorological disturbances in the bay. In addition, the signatures of regional
climate events such as Indian Ocean Dipole, El Niño and La Niña can be examined in the buoy
time series data sets in greater detail. In addition the subsurface data can also serve to
11
characterise the signature of propagating planetary scale waves in the ocean that have important
bearing on ocean dynamics. The current measurements at subsurface levels provide unique
information on the prevailing circulation patterns that can be used for heat and salt transport
estimates and characterising the propagating waves in the ocean. The switching over between the
active and break regimes of the monsoon is an important issue that remains unresolved for short-
term weather prediction during the summer monsoon season and these data sets would become
very useful for improved predictions. The time evolution of some standard surface
meteorological parameters such as atmospheric pressure, air temperature, wind speed, significant
wave height, relative humidity, irradiance, downwelling long wave radiation and rainfall during
June, 2011 to March, 2012 is shown in Fig. 5a. The time evolution of horizontal currents (1.2 –
100 m) and near surface thermohaline structure (5-500 m) during September, 2011 to February,
2012 period is shown in the Fig. 5b. The detailed analysis and interpretation of these data sets is
beyond the scope of the present study and shall be reported elsewhere.
2.3 Validation of Remote Sensing Data
In recent years remote sensing satellites have opened up new vistas to monitor several
parameters related to air-sea interface such as sea surface winds, waves, currents, temperature,
salinity, sea surface height anomaly, colour and sea ice at repeat intervals over the entire global
ocean. However sea truth validation assumes special importance in qualifying these remotely
sensed data. Satellite measurements have the advantage of being global in coverage when
compared to in-situ data. The increased use of satellite data did not diminish the need for in-situ
oceanographic measurements as in-situ techniques are required for measurements of variability
below the surface of the ocean. Also, satellite systems rely on complicated algorithms to convert
measurements of electromagnetic radiation into geophysically meaningful variables. To be

12
useful, satellite data must be calibrated and validated against in-situ observations in order to
detect and remove potential biases induced by orbital errors (Jeremy and Kenneth33
),
instrumental errors and atmospheric effects (e.g., water vapour, clouds, rainfall and aerosols). It
is in this context buoy network provides very valuable sea truth data to validate some of these
satellite measurements. Several research studies have been carried out to validate the remote
sensing data using the NIOT buoy data. Validation of the retrieved and corrected SST (K-SST)
from Kalpana satellite has been carried out by Shahi et al.34
using near-simultaneous
observations of the NIOT moored data buoys in the eastern Arabian Sea and the Bay of Bengal.
An inter-comparison of the OMNI buoy surface seawater temperature with the TMI SST data at
three specific locations in the Bay of Bengal is shown in Fig. 6.
2.4 Validation of Numerical Models
The performance of numerical models can be evaluated through validation process. The NIOT
buoy data are useful to validate the performance of ocean, atmospheric and coupled models.
Thompson et al.35
studied the variability in the long-term temperature and sea level over the
north Indian Ocean during the period 1958-2000 with Ocean General Circulation Model and
validated model results with field observations from tide gauges, Topex/Poseidon (T/P) satellite,
the NIOT and the WHOI moored buoys. Rao and Joshi36
used three-dimensional Princeton
Ocean Model to investigate the dynamics of the shelf flow response to the spatial and temporal
variability of the wind stress forcing along the southwest coast of India and validated their model
outputs with the NIOT buoy observations. Wave hindcast experiments in the Indian Ocean using
Mike-21 surface wave model were validated by comparing with the NIOT buoy data (Remya et
al.37
). Vethamony et al.38
conducted a numerical model study to find out improvement in wave
prediction when NCMRWF winds blended with MSMR winds in numerical model with the

13
NIOT buoy data. Parekh et al.39
carried out sensitivity experiments for momentum transfer
coefficient and provided new relationship for the north Indian Ocean using the NIOT buoy data
for the OGCM studies. The time series of subsurface data sets of temperature, salinity and
current would be extremely useful for validation of Ocean General Circulation and Coupled
Ocean-Atmosphere models and also help to improve model parameterization schemes for better
simulation of physical processes.
3 Technical Aspects of OMNI Buoy System
The moored data buoys are floating platforms which consists of buoys which are 3 m diameter,
plastic-over-foam, discuss shape, with an aluminium instrument vessel with four moon pool to
attach sensors to measure meteorological parameters. These buoys are equipped with global
positioning system, beacon light and satellite transceiver. They are powered by lithium batteries
and the optimum performance of the specific mooring design is based on the type of buoy,
location and water depth. The data buoy is equipped with a data acquisition and processing unit.
The sensors are programmed to acquire data samples for a specified duration of time and
frequency. The data buoy starts the sampling process for approximately 30 minutes before the
transmission of data in synoptic mode. The data acquisition and processing of various sensors are
carried out in parallel. The averaging of the data is done at the end of the sampling process and
the data is transmitted to the data reception facility at the NIOT every three hours via
INMARSAT satellite telemetry. These data are placed on the GTS for operational weather,
climate and ocean forecasting applications. Best of practice manual is being followed and the
data is disseminated to INCOIS after quality control.
3.1 Sensor Systems:

14
The sensors used in the buoy system were selected considering past experience on similar buoy
system for long term performance at sea. The reliability of each sensor used in the OMNI buoy
system is proven based on reliability of similar systems used in RAMA/TAO/TRITON/ ATLAS
and RAMA buoys. They have to withstand hostile weather conditions at sea and the data stability
is another important factor which is given priority while choosing the sensor. These sensors are
recommended by a National Expert Committee which comprises of experienced scientists from
the fields of oceanography and meteorology. The meteorological sensors are assembled and
integrated on the top of the buoy assembly. The meteorological sensors fixed on the sensor arm
include air temperature, relative humidity, wind speed and direction which are approximately 3
m above the MSL. New sensors like radiation and rainfall are included in the OMNI buoy
network which is also placed on the sensor arm at 2 m and 1 m respectively above the MSL. The
surface temperature and conductivity (to yield salinity) are measured from the buoy at a nominal
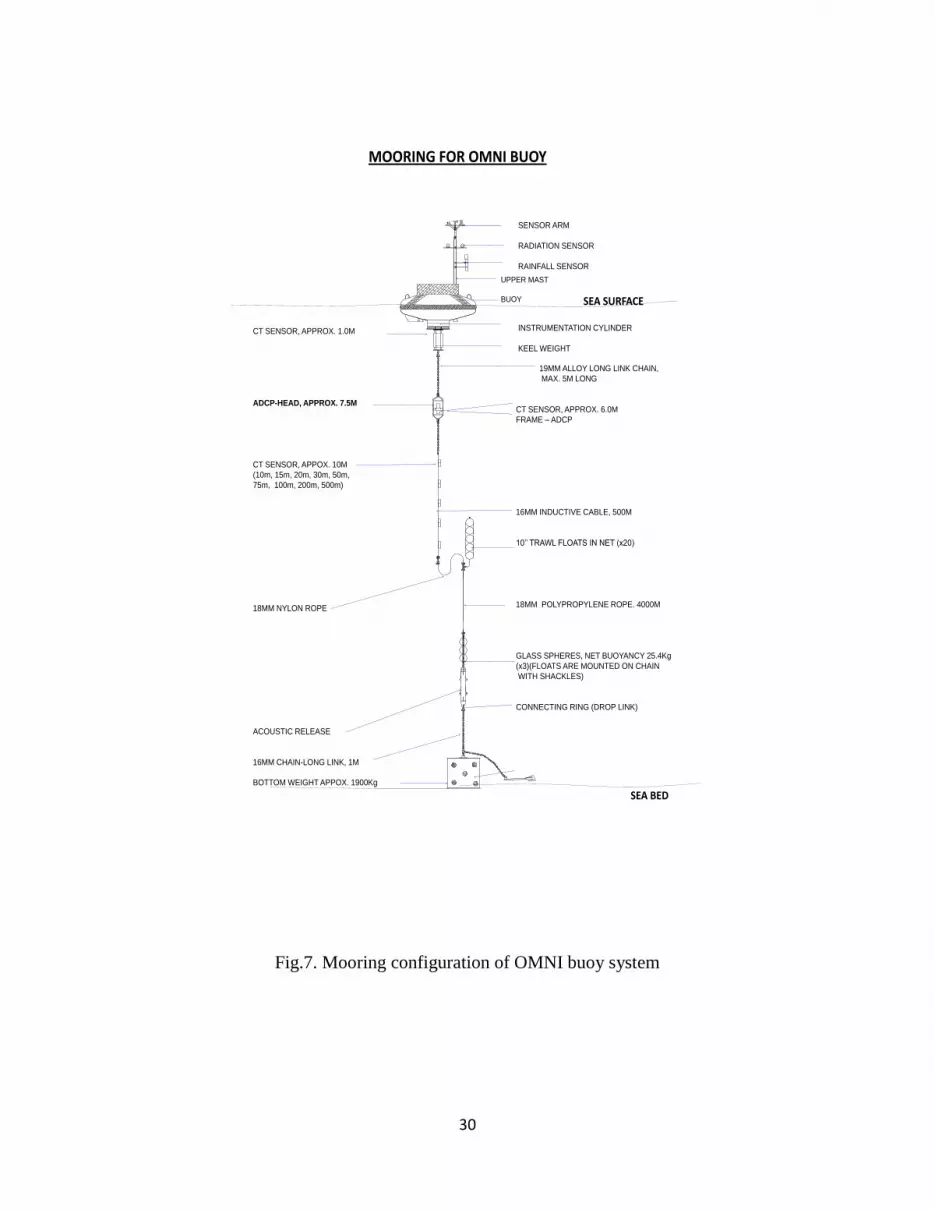
depth of 1 m. Subsurface CT sensors are assembled and mounted on the inductive cable of the
mooring system to measure temperature and conductivity at 10 different levels and Acoustic
Doppler Current Profiler to measure subsurface currents as shown in Fig. 7. The details of the
sensors used are given in the Table-1 with the accuracies and resolutions listed are based on the
manufactures supplied specifications.
3.2 Mooring systems
Specially designed mooring system with induction mooring cable, acoustic release and anchors
were used to position systems in deep sea bed. This mooring has a design lifetime of one year
and has to be serviced annually. These inverse catenary surface moorings are anchored to the
ocean floor in depths of typically 2000-4000 m. The mooring analysis was done using
ORCAFLEX software to select mooring components and designed to withstand extreme weather

15
conditions. The most important specification required for the buoy design decision is the
telemetry rate that the buoy system will support for communication to shore. The buoy systems
rely on lithium battery using compact, low-power satellite communication system. These buoy
systems have captured features during Jal cyclone in November 2010 and Thane cyclone in
December 2011 and withstood rough weather conditions and very high sea state to collect data
and transmit in real time. Maintaining these buoy systems is quite challenging due to both natural
and manmade reasons. Vandalism and piracy are on the increase in certain regions of the Bay of
Bengal and the Arabian Sea. The availability of ship time as per the planned schedule is another
challenge to maintain the buoy network for its optimum performance. The rough weather during
storms will affect the schedule of the maintenance operations for servicing the buoys.
Uninterrupted data transmission through satellite is another important issue. The challenges are
also associated with the development of new sensors, reliable power sources and technologies
that perform better in the harsh marine environment.
4. Summary and Conclusions
The last few decades have witnessed remarkable progress in our ability to observe and
understand the north Indian Ocean–monsoon coupled system. The advances are mainly due to
sustained observations (XBTs, moored buoys, current meter moorings, tide gauges and
satellites), special field campaigns (MONEX, MONTBLEX, BOBMEX, ARMEX and
JASMINE) and model studies (INDOMOD). The new knowledge acquired from the above is
leading to improve our understanding of different phenomenon and processes of the north Indian
Ocean-monsoon coupled system. In the north Bay of Bengal it is well known that freshwater
from rivers and rainfall inhibit vertical mixing near the surface. But the influence of freshwater
on surface fluxes, SST and material exchange across the surface involves several unknowns and
16
open questions. Hence the long-standing need for comprehensive and continuous measurements
on surface met-ocean parameters along with the subsurface ocean measurements is being
fulfilled with the deployment of OMNI buoy network in the bay. Even in the early stages of this
programme, the OMNI buoy network has provided valuable data for describing and
understanding variability at selected locations in the bay. These data are useful to study the
observed diurnal, intraseasonal and interannual variability in the near-surface theromohaline and
current structures in the bay. The data would also supplement RAMA buoy and ARGO profile
data in the bay. The measurements of met-ocean and near-surface ocean parameters have
immense applications in several fields. These buoy data are available for real time assimilation
into models by several operational forecasting agencies all over the world to issue forecasts with
significant improvements. The moored buoy data are useful to validate the performance of
ocean, atmospheric and coupled models and provide unlimited opportunities for research
scientists to describe and explain the variability on different time scales at selected locations in
the bay. The buoy network also provides very valuable sea truth data to validate satellite
measurements and numerical model outputs. The OMNI buoy programme forms an important
component of the Indian Ocean Observing System to address the long-standing need for all these
applications. The archived OMNI buoy data are available to research community on request
made to INCOIS.
5. Acknowledgements
We thank Ministry of Earth Sciences MoES, Govt. of India, for funding the OMNI buoy
programme and the members of the National Expert Committee for evolving this programme.
We are grateful to the Directors of NCAOR, Goa and INCOIS, Hyderabad for providing all the
facilities and logistic support. We also thank the staff of Ocean Observation Systems (OOS)

17
group, Vessel Management Cell of the NIOT and ship staff for their excellent help and support
onboard. We thank Ms Fugro Oceanor, Norway for providing the buoy systems.
6. References
1. Premkumar, K., M. Ravichandran, S. R. Kalsi, D. Sengupta, and S. Gadgil, First results
from new observational system over the Indian Seas, Curr. Sci., 1999, 78, 323–330.
2. Bhat, G. S., Gadgil, S., Hareesh Kumar, P. V., Kalsi, S. R., Madhusoodanan, P., Murty,
V. S. N., Prasada Rao, C. V. K., Ramesh Babu, V., Rao, L. V. G., Rao, R.
R., Ravichandran, M., Reddy, K. G., Sanjeeva Rao, P., Sengupta, D., Sikka, D.
R., Swain, J. and P. N. Vinayachandran, BOBMEX: the Bay of Bengal monsoon
experiment, Bull. Am. Meteorol. Soc., 2001, 82, 2217-2243. ISSN 0003-0007
3. Bhat, G. S., G. A. Vecchi, and S. Gadgil, Sea surface temperature of the Bay of Bengal
derived from TRMM Microwave Imager. J. Atmos. Oceanic Technol., 2004, 21, 1283–
1290.
4. Neeraj Agarwal, Rashmi Sharma, Sujit K Basu, Abhijit Sarkar and Vijay K Agarwal,
Evaluation of relative performance of QuikSCAT and NCEP re-analysis winds through
simulations by an OGCM. Deep Sea Res. I: Oceanographic Research Papers, 2007, 54
(8), 1311-1328.
5. Bhat, G. S., and R. Narasimha, Indian summer monsoon experiments, Curr. Sci., 2007,
93, 153-164.
18
6. Lakshmi, V., Parekh, A., Sarkar, A., Bimodal variation of SST and related physical
processes over the north Indian Ocean: Special emphasis on satellite observations, Int. J.
Remote Sens., 2009, 30 (22), 5865-5876.
7. Vaid, B. H., C. Gnanaseelan and A. Jayakumar, Intraseasonal signals in the daily high
resolution blended Reynolds sea surface temperature product over the Tropical Indian
Ocean and their validation, Int. J. Remote Sens., 2011,
DOI:10.1080/01431161.2010.489585.
8. Anant Parekh and Abhijit Sarkar, Covariation in subskin-bulk temperature difference
with environmental parameters in the north Indian Ocean. Int. J. Remote Sens., 2009, 30,
2049-2059.
9. Anant Parekh, R. Sharma, and A. Sarkar, A comparative assessment of sea wind speed
and sea surface temperature over the Indian Ocean by TMI, MSMR, and ERA-40. J.
Atmos. Ocean. Techn., 2007, 24, 1131-1142.
10. Anant Parekh, Abhijit Sarkar and M., Ravichandran. Surface winds in the Arabian Sea
from MSMR - An empirical approach, J. of Indian Society of Remote Sensing, 2005, 33,
121-126.
11. Satheesan, K., A. Sarkar, A. Parekh, M. R. Ramesh Kumar, and Y. Kuroda, Comparison
of wind data from QuikSCAT and buoys in the Indian Ocean. Int. J. Remote Sens., 2007,
28 (10), 2375 – 2382, doi:10.1080/01431160701236803.
12. Ruchi Kalra, M. C. Deo, Raj Kumar and Vijay K. Agarwal, RBF neural network for
spatial mapping of wave heights. Mar. Struct., Elsevier, 2005, 18, 289-300.

19
13. Jignesh Kshatriya, Abhijit Sarkar and Raj Kumar, Determination of ocean wave period
from altimeter data using wave-age concept. Mar. Geod., 2005, 28 (1), 71-79.
14. Raj Kumar, Suchandra A., Bhowmick, Sulagna Ray, Vihang Bhatt, Suhe Surendran, Sujit
Basu, Abhijit Sarkar and Vijay K. Agarwal, Improvement in predictability of waves over
the Indian Ocean. Nat. Hazards, 2009, 49, 275-291.
15. Sengupta, D., P. K. Ray and G. S. Bhat, Spring warming of the eastern Arabian Sea and
Bay of Bengal from buoy data. Geophys. Res. Lett., 2002, 29 (15), 1734, doi:
10.1029/2002GL015340.
16. Chinthalu, G. R., Seetaramayya, P., Ravichandran, M. and Mahajan, P. N.,The Bay of
Bengal and tropical cyclones. Curr. Sci., 2001, 81, 283–291.
17. Jossia Joseph, K., Balchand, A. N., Hareeshkumar, P. V., and Rajish, G., Inertial
oscillation forced by the September 1997 cyclone in the Bay of Bengal. Curr. Sci., 2007,
92, 790–794.
18. Sengupta, D. and Ravichandran, M., Oscillations of Bay of Bengal Sea surface
temperature during the 1998 summer monsoon. Geophys. Res. Lett., 2001, 28 (10), 2033-
2036.
19. Hareesh Kumar, P. V., Prasada Rao, C. V. K., Swain, J. and Madhusoodanan, P., Intra-
seasonal oscillations in the central Bay of Bengal during summer monsoon -99. Curr.
Sci., 2001, 80, 786-790.
20. Anant Parekh, Abhijit Sarkar, Shivani Shah and M.S. Narayanan, Low period variability
in Tropical Rainfall Measuring Mission Microwave Imager measured sea surface

20
temperature over the Bay of Bengal during summer monsoon. Curr. Sci., 2004, 87, 791-
796.
21. Neeraj Agarwal, Rashmi Sharma, Sujit Basu, Anant Parekh, Abhijit Sarkar and Vijay. K.
Agarwal, Bay of Bengal summer monsoon 10-20 day variability in sea surface
temperature using model and observations. Geophys. Res. Lett., 2007, 34, L06602,
doi:10.1029/2007GL029296.
22. Sengupta, D., S. R. Parampil, G. S. Bhat, V. S. N. Murty, V. Ramesh Babu, T.
Sudhakar, K. Premkumar, and Y. Pradhan, Warm pool thermodynamics from the Arabian
Sea Monsoon Experiment (ARMEX), J. Geophys. Res., 2008, 113, C10008,
doi:10.1029/2007JC004623.
23. Swain, D., Rahman., S. H., and Ravichandran, M., Comparison of NCEP turbulent heat
fluxes with in situ observations over the south-eastern Arabian Sea. Meteorol. and Atmos.
Phys., 2009, 104:3-4, 163-175.
24. John Gould W., WOCE and TOGA – The foundations of the global ocean observing
system. Oceanography, 2003, Vol. 16, 4, 24-30.
25. McPhaden, M. J., Busalacchi, A.J., Cheney, R., Donguy, J. R., Gage, K. S., Halpern, D.,
Ji, M., Julian, P., Meyers, G., Mitchum, G. T., Niiler, P. P., Picaut, J., Reynolds, R. W.,
Smith, N. & Takeuchi, K. The Tropical Ocean-Global Atmosphere (TOGA) Observing
System: A decade of Progress, J. Geophys. Res., 1998, 103, 14,169-14,240.
26. Bourlès, B., R. Lumpkin, M. J. McPhaden, F. Hernandez, P. Nobre, E. Campos, L. Yu, S.
Planton, A. J. Busalacchi, A. D. Moura, J. Servain and J. Trotte, The PIRATA Program:

21
History, Accomplishments, and Future Directions. Bull. Am. Meteorol. Soc., 2008, 89 (8),
doi: 10.1175/2008BAMS2462.1.
27. Rao, R. R., B. Mathew and P. V. Hareesh Kumar, A summary of results on thermohaline
variability in the upper layers of the east central Arabian Sea and Bay of Bengal during
summer monsoon experiments. Deep-Sea Res., 1993, 40, 1647-1672.
28. Sanil Kumar, K. V., N. Mohankumar, M. X. Joseph and R. R. Rao, Genesis of
meteorological disturbances and thermohaline variability of the upper layers in the head
of the Bay of Bengal during Monsoon Trough Boundary Layer Experiment
(MONTBLEX-90). Deep-Sea Res., 1994, 41, 1569-1581.
29. Webster, P. J., E. F. Bradley, C. W. Fairall, J. S. Godfrey, P. Hacker, R. A. Hopuze Jr., R.
Lukas, Y. Serra, J. M. Hummon, T. D. M. Lawrence, C. A. Russel, M. N. Ryan, K.
Sahami and P. Zuidema, The Joint Air-Sea Monsoon Interaction Experiment (JASMINE)
Pilot Study. Bull. Am. Meteorol. Soc., 2002, 83, 1603-1630.
30. McPhaden, G. Meyers, M. J., K. Ando, Y. Masumoto, V. S. N. Murty, M. Ravichandran,
F. Syamsudin, J. Vialard, W. Yu, L. Wu, RAMA: Research Moored Array for African-
Asian-Australian Monsoon Analysis and Prediction. Bull. Am. Meteorol. Soc., 2009, 90,
459-480.
31. McPhaden,M.J., Antonio J. Busalacchi,Robert Cheney,Jean-René Donguy, Kenneth S.
Gage,David Halpern,Ming Ji,Paul Julian, Gary Meyers, Gary T. Mitchum, Pearn P.
Niiler, Joel Picaut, Richard W. Reynolds, Neville Smith,and Kensuke Takeuch, The
Tropical Ocean-Global Atmosphere observing system: A decade of progress. J. Geophys.
Res., 1998, 103 (C7), 14,169-14,240.

22
32. Vilard, A., D. L. T. Anderson and M. Balmaseda, Impact of ocean observation systems
on ocean analysis and seasonal forecasts. Mon. Weather Rev., 2007, 135, 409-429.
33. Jeremy, D. DeMoss and Kenneth, P. Bowman, Changes in TRMM rainfall due to the
orbit boost estimated from Buoy Rain Gauge. J. Atmos. Oceanic Tech., 2007, 24, 1598-
1607.
34. Shahi, N.R., Neeraj Agarwal, Aloke K Mathur and Abhijit Sarkar, Atmospheric
Correction for Sea Surface Temperature Retrieval from Single Thermal Channel
Radiometer Data Onboard Kalpana Satellite. J. Earth Sys. Sci., 2012, 120 (3), 337-345.
35. Thompson, B., Gnanaseelan, C., Anant Parekh and P. S. Salvekar, North Indian Ocean
warming and sea level rise in an OGCM. J. Earth Sys. Sci., 2008, 117(2), 169-178.
36. Rao, A.D. and Madhu Joshi, Response of southwest monsoon winds on shelf circulation
off Kerala Coast, India. Cont. Shelf Res., 2012, doi:10.1016/j.csr.2011.10.015.
37. Remya, P. G., Raj Kumar, Sujit Basu and Abhijit Sarkar, Wave hindcast experiments in
the Indian Ocean using MIKE 21 SW model. J. Earth Syst. Sci., 2012, 121 (2), 385–392.
38. Vethamony, P., Sudheesh K., Rupali S. P., Babu,M.T.,Jayakumar, S.,Saran,A.K., Basu,
S. K.,Kumar, R. and A. Sarkar, Wave modelling for the north Indian Ocean using MSMR
analysed winds. Inter. J. Remote Sens., 2006, 27(18), 3767-3780.
39. Anant Parekh, C. Gnanaseelan and A. Jayakumar, Impact of improved momentum
transfer coefficients on the dynamics and thermodynamics of the north Indian Ocean. J.
Geophys. Res., 2011, 116, C01004, doi:10.1029/2010JC0006346.

23
Fig.1. The track of Jal cyclone and location map of OMNI buoy systems in the Bay of
Bengal.

24
Fig. 2.Inter-comparison between the ship CTD and the BD08, BD11 and BD13 buoy subsurface CTs taken during
September, 2011.
0
100
200
300
400
500
5 10 15 20 25 30 35
Dep
th (m
)Temperature (oC)
BD08_TEMPERATURE vs CTD
CTD
BD 08
0
100
200
300
400
500
30 31 32 33 34 35 36
Dep
th (m
)
Salinity (PSU)
BD08 SALINITY vs CTD
CTD
BD 08
0
100
200
300
400
500
600
5 10 15 20 25 30 35
Dep
th (m
)
Temperature (oC)
BD11_TEMPERATURE vs CTD
BD11
CTD
0
100
200
300
400
500
600
30 31 32 33 34 35 36D
epth
(m)
Salinity (PSU)
BD11_SALINITY vs CTD
CTD
BD11
0
100
200
300
400
500
600
5 15 25 35
Dep
th (m
)
Temperature (oC)
BD13_TEMPERATURE vs CTD
CTD
BD13
0
100
200
300
400
500
600
32 33 34 35 36
Dep
th (m
)
Salinity (PSU)
BD13_SALINITY vs CTD
CTD
BD13

25
Fig. 3. Observed surface wind speed (m/s) and subsurface temperature (oC) during 1-15 Nov,
2010 at BD13 and BD14 buoy locations

26
Fig. 4. Observed variability of near-surface density structure (a), thermal structure (b) and barrier layer
thickness (c) at BD13 buoy location. Thick line in (a) represents mixed layer depth and in (b) represents
isothermal layer depth.

27
Fig. 5a. The daily time series of the standard surface meteorological parameters at the BD08 buoy location.

28
Fig. 5b. Evolution of subsurface current vectors, salinity and temperature at BD08 location.

29
Fig.6. Comparison of satellite TMI SST data with the daily averaged OMNI buoy surface
water temperature at three locations in the Bay of Bengal.
30
MOORING FOR OMNI BUOY
19MM ALLOY LONG LINK CHAIN,
MAX. 5M LONG
CT SENSOR, APPROX. 6.0M
FRAME – ADCP
16MM INDUCTIVE CABLE, 500M
10’’ TRAWL FLOATS IN NET (x20)
18MM POLYPROPYLENE ROPE. 4000M
GLASS SPHERES, NET BUOYANCY 25.4Kg
(x3)(FLOATS ARE MOUNTED ON CHAIN
WITH SHACKLES)
CONNECTING RING (DROP LINK)
CT SENSOR, APPROX. 1.0M
ADCP-HEAD, APPROX. 7.5M
CT SENSOR, APPOX. 10M
(10m, 15m, 20m, 30m, 50m,
75m, 100m, 200m, 500m)
18MM NYLON ROPE
ACOUSTIC RELEASE
16MM CHAIN-LONG LINK, 1M
BOTTOM WEIGHT APPOX. 1900Kg
SEA SURFACE
SEA BED
SENSOR ARM
RADIATION SENSOR
RAINFALL SENSOR
INSTRUMENTATION CYLINDER
KEEL WEIGHT
UPPER MAST
BUOY
Fig.7. Mooring configuration of OMNI buoy system

31
Table.1 Sensors used in OMNI buoy system
Sl.
No. Parameter Sensor type
Make/
Model Resolution Accuracy Range
Sample
rate
Sampli
-ng
period
Data
recor-
ded
1 Wind speed Cup
Anemometer
Lambrecht/
1453 0.1 m/s ± 2% 0-35 m/s 1 Hz 10 min. 1 h
2 Wind
direction
Vane +
fluxgate
compass
Lambrecht/
1453 0.1° 1.5° - 4° 0-359° 1 Hz 10 min. 1 h
3 Air
temperature Pt/100 RTD
Rotronic/
MP 102 A
0.0015° C ± 0.3° C -30-70° C 1 Hz 1 min. 1 h
4 Relative
humidity Capacitance 0.47 ± 1% 0-100 % RH 1 Hz 1 min. 1 h
5 Air Pressure Pressure
transducer
Vaisala/
PTB 330 0.01 hPa ±0.15hPa
500-1100
hPa
1sample
per hr.
Instanta
neous 1 h
6 Rainfall Capacitance
R. M.
Young:
/50202
0.058 ± 1 mm 0-50 mm 1 Hz 1 min. 2 min.
7
Down
welling long
wave
radiation
Pyrgeometer Eppley/PIR 1.27 W/m2
5 % 0-700 W/m2 1 Hz 1 min. 1 h
8
Down
welling
Shortwave
radiation
Pyranometer Eppley/
PSP 0.488 W/m2 3%
0-2800
W/m2 1 Hz 1 min. 1 h
9 Water
temperature Thermistor
Seabird /
MicroCAT
SBE37
T: 0.0001° C 0.002° C
-5 - 35° C
1
sample
per h.
Instanta
neous.
1 h
10 Conductivity Conductivity
cell
Seabird /
MicroCAT
SBE37
C: 0.0001
mS/cm
0.003
mS/cm
0-70 mS/cm
1
sample
per h.
Instanta
neous.
1 h

32
11 Water
pressure Strain gauge
Seabird /
MicroCAT
SBE37
P: 0.002% 0.1 %
0-100 bar
1
sample
per h.
Instanta
neous.
1 h
12
Directional
wave
spectra
Accelerometer
Angular rate
sensor
Magnetometer
Kongsberg
/ Seatex
MRU 4
Pitch and roll:
<0.001°
Heave: 5cm
Pitch and
Roll: 0.05°
Heading:
1.2°
Heave: ± 50
m
Heading: ±
180°
1 Hz 17.5
min. 1 h
13
Ocean
current
profile
Accoustic
Doppler
Current
Profiler
Teledyne
RD
Instrument
150 KHz
Velocity: 0.1 cm/s dir: 0.01°
Velocity: ±
5 mm/s
dir: ± 2°
0-256 cm/s
1
sample
per h
Instanta
neous
1 h
12 Single point
Doppler
Volume
Sampler
Teledyne
RD
Instrument
150 KHz
velocity: 0.1cm/s dir: 0.01°
Velocity: 1%
dir: ± 2° 0-600 cm/s
1
sample
per h
Instanta
neous I h
Recommended


