
1
Patients and methods
Patients
The study included 519 consecutive patients admitted for gross hematuria to the urologic
outpatient clinic at Herlev Hospital between December 2013 and January 2015. The study
was approved by The Committee on Biomedical Research Ethics of the Capital Region of
Denmark (H-2-2010-045). All patients provided written informed consent prior to study entry.
Clinical procedures
All patients underwent standard urological evaluation for gross hematuria, including flexible
cystoscopy, urinary cytology, and computed tomography urography in the outpatient clinic.
Patients with bladder lesions underwent hexyl-aminolevulinate (Hexvix, Photocure, Norway)
photodynamic diagnosis-guided transurethral tumor resection and random as well as
photodynamic diagnosis-guided mucosal biopsies. Tumors were graded and staged according
to the 2004 World Health Organization [1] and 2009 TNM [2] classifications, respectively.
Collection of urine samples
Patients were requested to provide a urine sample immediately before and after flexible
cystoscopy. Urine samples (full bladder voids) were collected by the patients themselves and
processed immediately after by staff nurses using a previously described filtration device [3]
mounted with a Nuclepore track-etched polycarbonate membrane filter (pore size 8 μm;
Whatman, Maidstone, UK). Pressure was applied manually or using an automatic press with a
2-min compression time. The filter cartridge was immediately transferred to a storage
cassette, which was then mounted with a lid containing lysis/stabilization buffer (Oragene
DNA Self-Collection Kit; OG-250; DNA Genotek, Ottowa, Ontario, Canada). Cassettes were
blind-coded and stored at room temperature until being transported (within 1–2 wk) to the
Danish Cancer Society.
DNA testing
DNA from urinary cells was purified from 0.5 ml of the lysed cell sample using the Oragene
DNA purifying solution (DNA Genotek) and redissolved in 50 µl of 1× TE (10mM Tris-HCl,

2
pH 8.0, 1mM ethylenediaminetetraacetic acid). DNA from formalin-fixed paraffin-embedded
tumor samples was extracted using the QIAamp DNA FFPE Tissue Kit (Qiagen, Hilden,
Germany). Detection of TERT (C228T and C250T) and FGFR3 (p.R248C, p.S249C,
p.G370C, and p.Y373C) mutations was performed using droplet digital polymerase chain
reaction (ddPCR) with 2 µl of DNA as a template, using the QX200 system (Bio-Rad
Laboratories, Hercules, CA, USA) and hydrolysis probe-based assays as previously described
[3]. Primer and probe sequences for the TERT assays are listed in Supplementary Table 6. For
amplification of TERT, 1 × Q-solution (Qiagen) was added to the PCR mixture. Manual two-
dimensional plots were used for scoring the samples, using wild type and mutation controls
for threshold settings. Cut-off values for 6-fluorescein amidite-positive droplets were 5 for
TERT C250T and 3 for TERT (C228T) and all FGFR3 assays.
For DNA methylation analysis, the remainder of the DNA (maximum 500 ng) was treated
with bisulfite using the EZ DNA Methylation-Gold Kit (Zymo Research Corp, Orange, CA,
USA), eluted in M-Elution Buffer and stored at 80°C. Quantitative analysis of methylation
levels at the promoter CpG islands of SALL3, ONECUT2, CCNA1, BCL2, EOMES, and VIM
was performed using MethyLight assays, as previously described [3,4]. Primer and probe
sequences and PCR conditions are listed in Supplementary Table 6. Methylation levels were
calculated as percent methylated reference [5] by normalizing marker-specific reaction values
to ALUC4 values relative to the same values for CpGenomeTM Universal Methylated DNA
(Chemicon/Millipore, Billerica, MA, USA). Cut-off percent methylated reference values for
SALL3 and VIM were 0.5 and 2, respectively [3,4]. No amplification was observed for BCL2,
CCNA1, EOMES, or ONECUT2 when tested on DNA from filtered urine from 11 healthy
controls [4].
The persons who performed the DNA test were blinded for patient characteristics and pairing
of urine samples. Results of the clinical evaluation and the urine-DNA test were sent to a
third-party clinician, who held the key to match patient and sample identifications.

3
Statistical analysis
Associations of biomarkers with clinico-pathological parameters were analyzed using the
Fisher's exact test for comparison of two dichotomous variables. Receiver operating
characteristic analysis was performed using the R package pROC [6]. A Student t test was
used to compare the median number of positive biomarkers.

4
Supplementary Table 1 – Patient characteristics
Patients with urothelial carcinoma
(n = 99)
Patients with normal findings (n = 376)
Sex, n (%)Male 76 (77) 279 (74)Female 23 (23) 97 (26)
Age, yr (range) 69 (26–91) 64 (18–91)Stagea
Ta 44T1 33T2 9T3 2T4 2Carcinoma in situ 7NAb 2
GradePUNLMP 2Low grade 32High grade 65
NA = not applicable; PUNLMP = papillary urothelial neoplasm of low malignant potential.a For patients with multiple tumors, the highest stage was recorded.b PUNLMP.
1.

5
Supplementary Table 2 – Performance characteristics of urine-DNA test for the detection of urothelial bladder carcinoma
Characteristics Precystoscopy urine(n = 461)
Postcystoscopy urine(n = 444) Combined (n = 475)
Sensitivity, % (95% CI) 91.5 (83.9–96.3) 94.4 (87.4–98.2) 97.0 (91.4–99.4)
Specificity, % (95% CI) 87.5 (83.6–90.7) 81.7 (77.3–85.6) 76.9 (72.3–81.0)
Positive predictive value, % (95% CI) 65.2 (56.4–73.2) 56.4 (48.0–64.5) 52.5 (45.0–59.9)
Negative predictive value, % (95% CI) 97.6 (95.3–98.9) 98.3 (96.1–99.4) 99.0 (97.0–99.8)
CI = confidence interval.

6
Supplementary Table 3 – Cases with a false-negative urine-DNA test result
Patient ID
Pathological characteristics Precystoscopy urine Postcystoscopy urine Biopsy
Stage Grade DNA conc. (ng/µl)a Biomarkers detected DNA conc.
(ng/µl)a Biomarkers detected Biomarkers detected
5 Ta Low 2.373 None 1.790 TERT, FGFR3, BCL2 N.D.
21 Ta Low 0.067 None 0.059 CCNA1 N.D.
57 T1 High 1.533 TERT, ONECUT2, BCL2, EOMES, SALL3 0.006 None N.D.
58 Ta Low 0.323 TERT, FGFR3, ONECUT2, EOMES, SALL3, VIM 0.011 None N.D.
59 T1 High 0.018 None 0.081 ONECUT2 N.D.
84 N.D. PUNLMP 0.303 None 3.557 TERT N.D.
140 Ta Low 0.121 None 9.514 None None
156 T1 Low 1.322 None 0.230 None None
180 N.D. PUNLMP 0.078 None 5.649 None None
489 Ta High 0.148 None 3.557 TERT, ONECUT2 N.D.
conc. = concentration; N.D. = not done; PUNLMP = papillary urothelial neoplasm of low malignant potential.a Calculated as the concentration of FGFR3 alleles determined using droplet digital polymerase chain reaction.

7
Supplementary Table 4 – Performance of individual DNA biomarkers
Biomarker Sensitivity, %(95% CI)
Specificity, %(95% CI)
PPV, %(95% CI)
NPV, %(95% CI)
TERT 81.8 (72.8–88.9) 83.5 (79.4–87.1) 56.6 (27.2–47.1) 94.6 (91.6–96.8)
ONECUT2 77.8 (68.3–85.5) 93.9 (90.7–95.9) 77.0 (39.3–68.2) 94.1 (91.2–96.3)
VIM 75.8 (66.1–83.8) 95.7 (92.5–97.1) 82.4 (51.6–79.6) 93.7 (90.8–95.9)
SALL3 67.7 (57.5–76.7) 96.5 (92.9–97.3) 83.8 (44.9–78.5) 91.8 (88.6–94.3)
CCNA1 66.7 (56.5–75.8) 96.5 (94.2–98.1) 83.5 (48.6–80.4) 91.7 (88.5–94.2)
BCL2 62.6 (52.3–72.1) 97.9 (95.9–99.1) 88.6 (57.7–88.9) 90.9 (87.6–93.5)
EOMES 45.5 (35.4–55.8) 96.8 (94.2–98.1) 78.9 (40.6–77.3) 87.1 (83.4–90.1)
FGFR3 41.4 (31.6–51.8) 97.9 (95.9–99.1) 83.7 (59.9–89.6) 86.4 (82.8–89.5)CI = confidence interval; NPV = negative predictive value; PPV = positive predictive value.

8
Supplementary Table 5 – Sensitivity of DNA biomarkers according to tumor stage
BiomarkerTumor stagea
p value*Ta (n = 48) T1 (n = 31) T≥2 (n = 13) CIS (n = 7)
TERT 78.3 (63.6–89.1) 87.9 (71.8–96.6) 76.9 (46.2–95.0) 85.7 (42.1–99.6) 0.44
VIM 69.6 (54.2–82.3) 81.8 (64.5–93.0) 84.6 (54.6–98.1) 71.4 (29.0–96.3) 0.24
FGFR3 58.7 (43.2–73.0) 30.3 (15.6–48.7) 30.8 (9.1–61.4) 0 (0–41.0) 0.002
ONECUT2 58.7 (43.2–73.0) 93.9 (79.8–99.3) 92.3 (64–99.8) 100 (59.0–100.0) 0.0001
CCNA1 54.3 (39.0–69.1) 78.8 (61.1–91.0) 76.9 (46.2–95.0) 71.4 (29.0–96.3) 0.019
BCL2 54.3 (39.0–69.1) 69.7 (51.3–84.4) 69.2 (38.6–90.9) 71.4 (29.0–96.3) 0.15
SALL3 47.8 (32.9–63.1) 84.8 (68.1–94.9) 84.6 (54.6–98.1) 85.7 (42.1–99.6) 0.0001
EOMES 39.1 (25.1–54.6) 60.6 (42.1–77.1) 30.8 (9.1–61.4) 42.9 (9.9–81.6) 0.31
CIS = carcinoma in situ.a For patients with multiple tumors, the highest stage was recorded.
* p values from the two-tailed Fisher’s exact test, comparing the number of cases with Stage
Ta tumors with the number of cases with either Stage ≥T1 tumors or CIS.

9
Supplementary Table 6 – Primers and probes
ddPCRGene Forward primer 5'-3' Reverse primer 5'-3' Probe 5'-3' Amplicon
length (bp)Annealing temp. (°C) Reference
TERT C228T CGGAAAGGAAGGGGAGGG GTCCCCGGCCCAGC Mut: [6FAM]-CCC+C+T+T+CCGG-[BHQ_1]WT: [HEX]-CCCC+T+C+CGGG-[BHQ_1] 52 60°C [7]
TERT C250T TGGGAGGGCCCGGAG GACCCCGCCCCGT Mut: [6FAM]-CCC+C+T+T+CCGG-[BHQ_1]WT: [HEX]-CCCC+T+C+CCGG-[BHQ_1] 60 57°C [7]
MethyLightGene Forward primer 5'-3' Reverse primer 5'-3' Probe 5'-3' Amplicon
length (bp)Annealing temp. (°C) Reference
BCL2 TCGTATTTCGGGATTCGGTC AACTAAACGCAAACCCCGC[6FAM]-
ACGACGCCGAAAACAACCGAAATCTACA-[TAMRA]
84 62 [8]
CCNA1 TCGCGGCGAGTTTATTCG CCGACCGCGACAAACG [6FAM]-CGTTATGGCGATGCGGTTTCGG-[TAMRA] 85 62 [9]
VIM TTCGGGAGTTAGTTCGCGTT ACCGCCGAACATCCTACGA [6FAM]-TCGTCGTTTAGGTTATCGT-[MGB] 108 62 [10]
ONECUT2 AGTAGAGCGTTTATTAGCGTTAC AACGAACTAAAACCTCGCG [6FAM]-CGGTGTCGTTTCGTTAGTTTTGCG-[TAMRA] 74 62
SALL3 GTTCGCGTAGTCGTCGTC TACTCGAAAACCCCGTCA [6FAM]-ACGACGCGAAACGACCTAACG-[TAMRA] 203 60 [4]
EOMES GTTTGGCGCGTATTTTTATTC CTCGCAAAAAAAACTACCGAA [6FAM]-TACCGCCTCGCGCACTCTCC-[TAMRA] 145 58 [4]
ALUC4 GGTTAGGTATAGTGGTTTATATTTGTAATTTTAGTA
ATTAACTAAACTAATCTTAAACTCCTAACCTCA [6FAM]-CCTACCTTAACCTCCC-[MGB] 98 64 [11]
ddPCR = droplet digital polymerase chain reaction; Mut = mutation; temp. = temperature; WT = wild type.

10
Supplementary Fig. 1 – Urologic evaluation of gross hematuria.
CT = computed tomography.
11
No. of biomarkers
Mutation Promoter hypermethylation
Sensitivity, %(95% CI)
Specificity, %(95% CI)
TER
T
FG
FR
3
CC
NA
1
ON
EC
UT2
BC
L2
EO
ME
S
SALL
3
VIM
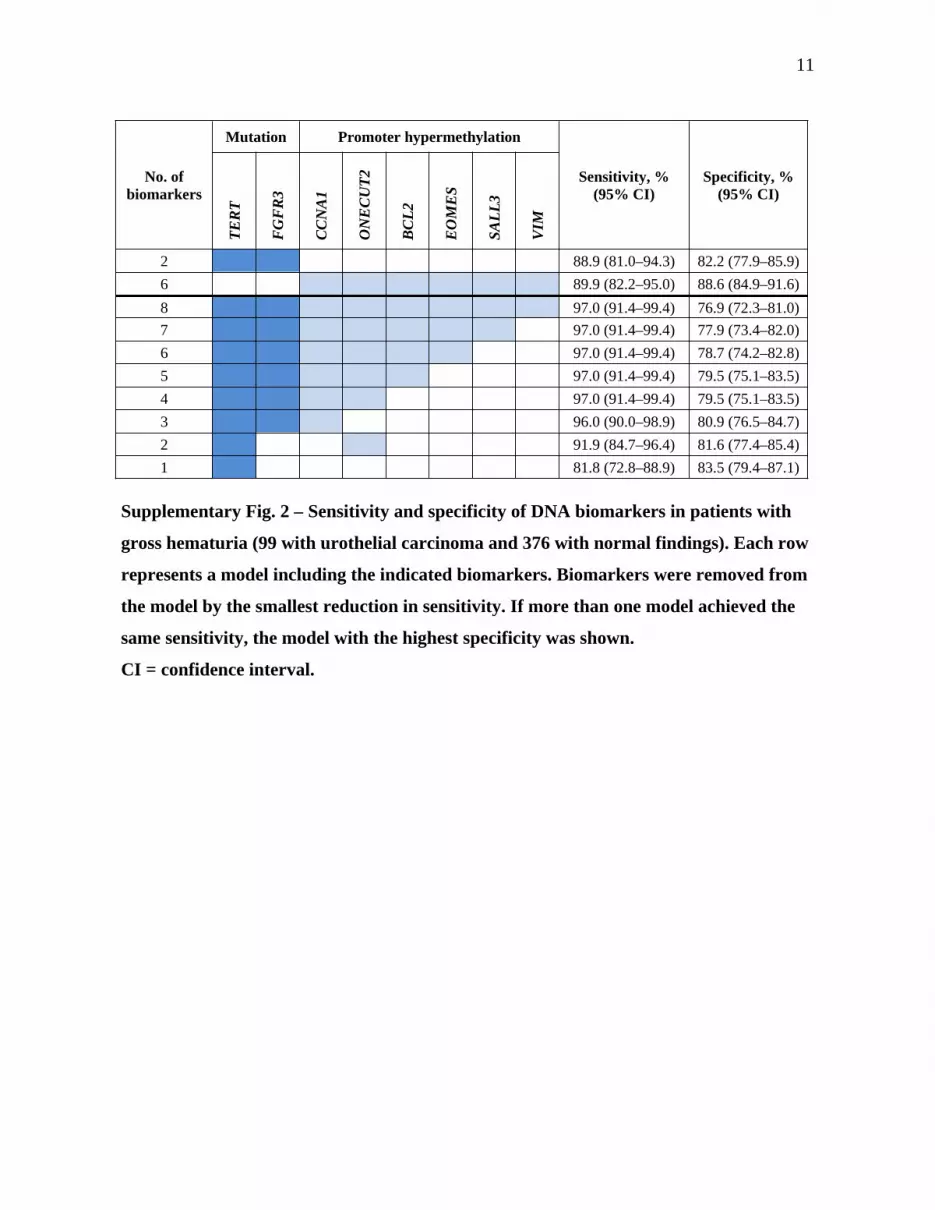
2 88.9 (81.0–94.3) 82.2 (77.9–85.9)6 89.9 (82.2–95.0) 88.6 (84.9–91.6)8 97.0 (91.4–99.4) 76.9 (72.3–81.0)7 97.0 (91.4–99.4) 77.9 (73.4–82.0)6 97.0 (91.4–99.4) 78.7 (74.2–82.8)5 97.0 (91.4–99.4) 79.5 (75.1–83.5)4 97.0 (91.4–99.4) 79.5 (75.1–83.5)3 96.0 (90.0–98.9) 80.9 (76.5–84.7)2 91.9 (84.7–96.4) 81.6 (77.4–85.4)1 81.8 (72.8–88.9) 83.5 (79.4–87.1)
Supplementary Fig. 2 – Sensitivity and specificity of DNA biomarkers in patients with
gross hematuria (99 with urothelial carcinoma and 376 with normal findings). Each row
represents a model including the indicated biomarkers. Biomarkers were removed from
the model by the smallest reduction in sensitivity. If more than one model achieved the
same sensitivity, the model with the highest specificity was shown.
CI = confidence interval.

12
Supplementary Fig. 3 – Number of positive urine-DNA biomarkers in patients with
urothelial carcinoma (n = 96) and normal findings (n = 87).

13
Supplementary References
[1] World Health Organization Classification of tumors. Pathology and genetics of tumours of the urinary system and male genital organs. Lyon: IARC Press; 2004.
[2] TNM classification of malignant tumors. Hoboken, NJ: John Wiley & Sons; 2009.
[3] Andersson E, Dahmcke CM, Steven K, Larsen LK, Guldberg P. Filtration device for on-site collection, storage, and shipment of cells from urine and its application to DNA-based detection of bladder cancer. PLoS One 2015;10:e0131889.
[4] Andersson E, Steven K, Guldberg P. Size-based enrichment of exfoliated tumor cells in urine increases the sensitivity for DNA-based detection of bladder cancer. PLoS One 2014;9:e94023.
[5] Eads CA, Danenberg KD, Kawakami K, et al. MethyLight: A high-throughput assay to measure DNA methylation. Nucleic Acids Res 2000;28:E32.
[6] Robin X, Turck N, Hainard A, et al. pROC: An open-source package for R and S+ to analyze and compare ROC curves. BMC Bioinformatics 2011;12:77.
[7] Remke M, Ramaswamy V, Peacock J, et al. TERT promoter mutations are highly recurrent in SHH subgroup medulloblastoma. Acta Neuropathol 2013;126:917–29.
[8] Widschwendter M, Siegmund KD, Muller HM, et al. Association of breast cancer DNA methylation profiles with hormone receptor status and response to tamoxifen. Cancer Res 2004;64:3807–13.
[9] Brait M, Begum S, Carvalho AL, et al. Aberrant promoter methylation of multiple genes during pathogenesis of bladder cancer. Cancer Epidemiol Biomarkers Prev 2008;17:2786–94.
[10] Costa VL, Henrique R, Danielsen SA, et al. Three epigenetic biomarkers, GDF15, TMEFF2, and VIM, accurately predict bladder cancer from DNA-based analyses of urine samples. Clin Cancer Res 2010;16:5842–51.
[11] Weisenberger DJ, Campan M, Long TI, et al. Analysis of repetitive element DNA methylation by MethyLight. Nucleic Acids Res 2005;33:6823–36.
Recommended


