Universität Konstanz
Mathematisch-Naturwissenschaftliche Sektion
Fachbereich Psychologie
Physiological parameters within three paradigms and
perceived symptoms in social phobia
Dissertation
zur Erlangung des akademischen Grades eines Doktors der Naturwissenschaften
eingereicht von
Dipl.-Psych. Elisabeth Kley
Erstgutachter: Herr Prof. Dr. T. Elbert
Zweitgutachter: Herr Prof. Dr. J. Vila Castellar
Tag der mündlichen Prüfung: 17.11.2004
Acknowledgments
This research was supported by a grant from the “Landesgraduiertenförderung Baden-Württemberg”.
My special thanks in Germany goes to…
My special thanks in Spain goes to…
…Professor Elbert for his willingness in granting me a “long-distance”-accompaniment without which this study would not have been possible. I also thank him for the numerous suggestions, advice and expert counsel and the speedy e-mail communication at all times. …Dr. Nagl for his advice concerning methods and his help with the application of statistical procedures. …Katalin Mikustyak for proof-reading and for her qualified guidance through the English jungle of grammar, spelling and punctuation. …my mother for her support everyday in every way, especially during the last phase of this project. My special thanks in the USA goes to… …Professor Lang, Dr. Bradley and their team for the kind welcome they gave me, for their expert advice and for the opportunity to learn so much about the methodology and procedure of the “anxiety protocol” during my research stay.
…Professor Vila Castellar who accompanied me through all phases of the work, for the warm reception into his team, the patience he showed especially in regard to communication and linguistic difficulties, the numerous suggestions and expert advice concerning the collection of data and his support with regard to the analysis without which it would have been impossible to complete this work. …all members of the research group for their heartfelt welcome and integration into their team, their feedback and support with the collection of the data. …Sonia Rodríguez Ruiz for her help with the recruitment of the participants- the adventurous motorcycle tour during to the screening process remains unforgettable. …José-Luis Mata Martín and Miguel Muñoz García for their support with regard to all my questions concerning software programs, their installation and trouble-shooting. …Cynthia Vico Fuillerat “la reina de la grabación” for her unbeatable talent to spontaneously record scenes of exactly 12-second duration under any circumstances at any time of the day. …Pedro Guerra Muñoz for his patience and support in every respect, from broken cables, over language-related concerns to his assistance in emotionally troubling phases of the dissertation.
…my friends who encouraged and supported me in so many ways throughout this project.
…the students of the University of Granada, who volunteered to participate and shared
information about themselves in questionnaire-based and physiological recording.
I
TABLES OF CONTENTS
Page
1. INTRODUCTION..............................................................................................................1
2. THEORY ............................................................................................................................3
2.1 Fear and anxiety as emotions ..................................................................................3
2.2 Social phobia .............................................................................................................5
2.2.1 Diagnostical features of social phobia .............................................5
2.2.2 Subtypes ...........................................................................................5 2.2.1.1 Specific versus generalized social phobia .........................6 2.2.1.2 Social phobia without versus with avoidant personality
disorder..............................................................................7 2.2.3 Epidemiology ...................................................................................8
2.2.3.1 Prevalence .........................................................................8 2.2.3.2 Incidence .........................................................................10 2.2.3.3 Age of onset ....................................................................11 2.2.3.4 Course of social phobia ...................................................11 2.2.3.5 Comorbidity ....................................................................12 2.2.3.6 Psychosocial impairment.................................................13 2.2.3.7 Risk factors......................................................................13
2.2.4 Social phobia under an evolutionary perspective...........................14
2.2.5 Social phobia under a biological perspective .................................15 2.2.5.1 Genetics ...........................................................................15 2.2.5.2 Substance induced symptom provocation .......................16 2.2.5.3 Transmitter systems.........................................................17 2.2.5.4 Autonomic nervous system .............................................20
2.3 The network model and social phobia .................................................................22
2.3.1 Characteristics of the network........................................................22 2.3.2 Neuronal structures involved in the activation of the fear network....................................................................................23 2.3.3 The activation of the fear network .................................................25
2.3.3.1 Behavioral approaches ....................................................27 2.3.3.2 Behavioral cognitive approaches.....................................28
2.4 Measurement of the three response systems .......................................................32
2.4.1 Affective report ..............................................................................32
2.4.2 Physiological responses..................................................................33 2.4.2.1 Heart rate and heart rate variability.................................34 2.4.2.2 Blood pressure.................................................................35 2.4.2.3 Pulse ................................................................................36 2.4.2.4 Respiration ......................................................................37 2.4.2.5 Electrodermal activity .....................................................38 2.4.2.6 Electromyography, startle reflex and emotional priming ............................................................................39
II
2.4.3 The defense cascade .......................................................................42 2.4.4 Physiological reactivity within the picture paradigm.....................43
2.4.5 Physiological reactivity within the imagery paradigm...................44 2.4.5.1 General characteristics ....................................................44 2.4.5.2 Physiological reaction in social phobics within the
imagery paradigm............................................................46
2.5 Hypotheses...............................................................................................................51
3. METHODS .......................................................................................................................57
3.1 Participants .............................................................................................................57
3.2 Materials ..................................................................................................................57 3.2.1 Questionnaires ................................................................................57 3.2.2 Pictures ...........................................................................................65 3.2.3 Imagery scenes ...............................................................................66 3.2.4 Acoustic stimuli..............................................................................66 3.2.5 Apparatus .......................................................................................66
3.3 Design.......................................................................................................................67 3.3.1 Defense paradigm .........................................................................67 3.3.2 Picture paradigm ...........................................................................67 3.3.3 Imagery paradigm .........................................................................68
3.4 Physiological response measurement ....................................................................71
3.5 Procedure ................................................................................................................73
3.6 Data reduction.........................................................................................................75 3.6.1 Defense paradigm .........................................................................76 3.6.2 Picture paradigm ...........................................................................77 3.6.3 Imagery paradigm .........................................................................78
3.7 Data analysis ...........................................................................................................79
4. RESULTS .........................................................................................................................83
4.1 Results concerning questionnaire-based data ......................................................83 4.1.1 Questionnaires used for the screening ..........................................83 4.1.2 Questionnaires used before physiological recording ....................85
4.2 Results concerning the defense paradigm ...........................................................88 4.2.1 Heart rate.......................................................................................88 4.2.2 Systolic blood pressure .................................................................90 4.2.3 Diastolic blood pressure................................................................91 4.2.4 Pulse amplitude.............................................................................93 4.2.5 Respiration amplitude ...................................................................94 4.2.6 Respiration rate .............................................................................96 4.2.7 Skin conductance ..........................................................................98 4.2.8 Startle reflex..................................................................................99 4.2.9 Heart rate variability ...................................................................100
III
4.3 Results concerning the picture paradigm ..........................................................101
4.3.1 Affective rating due to pictures: Self-assessment manikin ..........101 4.3.1.1 Valence rating of pictures .............................................101 4.3.1.2 Arousal rating of pictures ..............................................103 4.3.1.3 Dominance rating of pictures ........................................104
4.3.2 Results concerning physiological measurements due to pictures 106 4.3.2.1 Heart rate .......................................................................106 4.3.2.2 Systolic blood pressure..................................................107 4.3.2.3 Diastolic blood pressure ................................................109 4.3.2.4 Pulse amplitude .............................................................110 4.3.2.5 Skin conductance...........................................................111 4.3.2.6 Startle reflex ..................................................................112
4.4 Results concerning the imagery paradigm .........................................................115
4.4.1 Affective rating due to scenes: Self-assessment manikin ............116 4.4.1.1 Valence rating of scenes................................................116 4.4.1.2 Arousal rating of scenes ................................................119 4.4.1.3 Dominance rating of scenes ..........................................121
4.4.2 Results concerning physiological measurements due to scenes...123 4.4.2.1 Heart rate .......................................................................123 4.4.2.2 Systolic blood pressure..................................................127 4.4.2.3 Diastolic blood pressure ................................................131 4.4.2.4 Pulse amplitude .............................................................136 4.4.2.5 Respiration amplitude ...................................................141 4.4.2.6 Respiration rate .............................................................144 4.4.2.7 Skin conductance...........................................................148 4.4.2.8 Startle reflex ..................................................................152
5. DISCUSSION .................................................................................................................155
5.1 Discussion concerning questionnaire-based data ..............................................155 5.1.1 Questionnaires used for the screening...........................155 5.1.2 Questionnaires used before physiological recording ....155
5.2 Discussion concerning the defense paradigm.....................................................157 5.2.1 Heart rate .......................................................................157 5.2.2 Systolic blood pressure..................................................158 5.2.3 Diastolic blood pressure ................................................158 5.2.4 Pulse amplitude .............................................................159 5.2.5 Respiration amplitude ...................................................160 5.2.6 Respiration rate .............................................................160 5.2.7 Skin conductance...........................................................161 5.2.8 Startle reflex ..................................................................162 5.2.9 Heart rate variability......................................................162 5.2.10 Summary of the discussion concerning the defense
paradigm........................................................................163
IV
5.3 Discussion concerning the picture paradigm .....................................................165
5.3.1 Affective rating due to pictures ....................................................165 5.3.1.1 Valence..........................................................................165 5.3.1.2 Arousal ..........................................................................165 5.3.1.3 Dominance ....................................................................166
5.3.2 Physiological responses due to pictures .......................................167 5.3.2.1 Heart rate .......................................................................167 5.3.2.2 Systolic blood pressure..................................................167 5.3.2.3 Diastolic blood pressure ................................................168 5.3.2.4 Pulse amplitude .............................................................168 5.3.2.5 Skin conductance...........................................................169 5.3.2.6 Startle reflex ..................................................................170
5.3.3 Summary of the discussion concerning the picture paradigm......170
5.4 Discussion concerning the imagery paradigm ...................................................173
5.4.1 Affective rating due to scenes ......................................................173 5.4.1.1 Valence..........................................................................173 5.4.1.2 Arousal ..........................................................................174 5.4.1.3 Dominance ....................................................................175
5.4.2 Physiological responses due to scenes .........................................176 5.4.2.1 Heart rate .......................................................................176 5.4.2.2 Systolic blood pressure..................................................178 5.4.2.3 Diastolic blood pressure ................................................180 5.4.2.4 Pulse amplitude .............................................................182 5.4.2.5 Respiration amplitude ...................................................183 5.4.2.6 Respiration rate .............................................................184 5.4.2.7 Skin conductance...........................................................186 5.4.2.8 Startle reflex ..................................................................187
5.4.3 Summary of the discussion concerning the imagery paradigm....189
5.5 Summary of discussion.........................................................................................195
5.6 Conclusions............................................................................................................197
6. SUMMARY ....................................................................................................................199
7. ZUSAMMENFASSUNG ...............................................................................................203
LIST OF REFERENCES ...................................................................................................208
APPENDIX
V
LIST OF TABLES
Page
Table 1a................................................................................................................................. 69 Overview of trials and stimulus material presented within the picture paradigm Table 1b ................................................................................................................................ 70 Overview of trials and stimulus material presented within the imagery paradigm Table 2a................................................................................................................................. 84 Internal consistencies, means and standard deviations for questionnaires used for the screening Table 2b ................................................................................................................................ 86 Internal consistencies, means and standard deviations for questionnaires used before physiological recording Table 3................................................................................................................................... 89 Means and standard deviations of the medians of each interval within defense for heart rate Table 4a................................................................................................................................. 91 Means and standard deviations of the medians of each interval within defense for systolic blood pressure Table 4b ................................................................................................................................ 92 Means and standard deviations of the medians of each interval within defense for diastolic blood pressure Table 5................................................................................................................................... 93 Means and standard deviations of the medians of each interval within defense for pulse amplitude Table 6a................................................................................................................................. 95 Means and standard deviations of the medians of each interval within defense for respiration amplitude Table 6b ................................................................................................................................ 97 Means and standard deviations of the medians of each interval within defense for respiration rate Table 7................................................................................................................................... 98 Means and standard deviations of the medians of each interval within defense for skin conductance Table 8................................................................................................................................. 100 Means and standard deviations of the medians of each interval within defense for startle reflex
VI
Table 9................................................................................................................................. 100 Heart rate variability during defense Table 10a............................................................................................................................. 102 Means and standard deviations for the SAM-rating pertaining to the dimension of valence Table 10b ............................................................................................................................ 103 Means and standard deviations for the SAM-rating pertaining to the dimension of arousal Table 10c ............................................................................................................................. 105 Means and standard deviations for the SAM-rating pertaining to the dimension of dominance Table 11............................................................................................................................... 107 Means and standard deviations for picture valence for heart rate Table 12a............................................................................................................................. 108 Means and standard deviations for picture valence for systolic blood pressure Table 12b ............................................................................................................................ 109 Means and standard deviations for picture valence for diastolic blood pressure Table 13............................................................................................................................... 111 Means and standard deviations for picture valence for pulse amplitude Table 14............................................................................................................................... 112 Means and standard deviations for picture valence for skin conductance Table 15............................................................................................................................... 113 Means and standard deviations for picture valence for the startle reflex Table 16a............................................................................................................................. 117 Means and standard deviations for the SAM-rating pertaining to the dimension of valence Table 16b ............................................................................................................................ 120 Means and standard deviations for the SAM-rating pertaining to the dimension of arousal Table 16c ............................................................................................................................. 122 Means and standard deviations for the SAM-rating pertaining to the dimension of dominance Table 17............................................................................................................................... 126 Means and standard deviations for valence of scenes by period for heart rate Table 18............................................................................................................................... 130 Means and standard deviations for valence of scenes by period for systolic blood pressure Table 19............................................................................................................................... 135 Means and standard deviations for valence of scenes by period for diastolic blood pressure
VII
Table 20............................................................................................................................... 140 Means and standard deviations for valence of scenes by period for pulse amplitude Table 21............................................................................................................................... 143 Means and standard deviations for valence of scenes by period for respiration amplitude Table 22............................................................................................................................... 147 Means and standard deviations for valence of scenes by period for respiration rate Table 23............................................................................................................................... 151 Means and standard deviations for valence of scenes by period for skin conductance Table 24............................................................................................................................... 153 Means and standard deviations for valence of scenes by period for the startle reflex
VIII
LIST OF GRAPHICS AND FIGURES
Page Graphic 1a ............................................................................................................................ 68 Overview of the procedure of the defense and picture paradigm Graphic 1b ............................................................................................................................ 70 Overview of the procedure of the imagery paradigm Figure 1a ............................................................................................................................... 85 Means for the total scores of the questionnaires used for the screening Figure 1b ............................................................................................................................... 87 Means for the total scores of anxiety, depression and worry-related measurements Figure 1c ............................................................................................................................... 87 Means for the total scores of questionnaires related to control for imagery-related abilities Figure 2 ................................................................................................................................. 89 Heart rate during defense Figure 3a ............................................................................................................................... 90 Systolic blood pressure during defense Figure 3b ............................................................................................................................... 92 Diastolic blood pressure during defense Figure 4 ................................................................................................................................. 94 Pulse amplitude during defense Figure 5a ............................................................................................................................... 95 Respiration amplitude during defense Figure 5b ............................................................................................................................... 96 Respiration rate during defense Figure 6 ................................................................................................................................. 99 Skin conductance during defense Figure 7 ................................................................................................................................. 99 Startle reflex during defense Figure 8a ............................................................................................................................. 102 SAM valence rating of pictures by group Figure 8b ............................................................................................................................ 104 SAM arousal rating of pictures by group
IX
Figure 8c ............................................................................................................................. 105 SAM dominance rating of pictures by group Figure 9 ............................................................................................................................... 106 Heart rate during picture presentation Figure 10a ........................................................................................................................... 108 Systolic blood pressure during picture presentation Figure 10b ........................................................................................................................... 109 Diastolic blood pressure during picture presentation Figure 11 ............................................................................................................................. 110 Pulse amplitude during picture presentation Figure 12 ............................................................................................................................. 112 Skin conductance during picture presentation Figure 13 ............................................................................................................................. 113 Startle reflex during during picture presentation Figure 14a ........................................................................................................................... 118 SAM valence rating for scenes by group Figure 14b ........................................................................................................................... 118 SAM valence rating for type of scene by group Figure 14c ........................................................................................................................... 119 SAM arousal rating for scenes by group Figure 14d ........................................................................................................................... 121 SAM dominance rating for scenes by group Figure 15a ........................................................................................................................... 123 Heart rate in half-second change scores during presentation, imagery and post-interval for social phobic participants Figure 15b ........................................................................................................................... 123 Heart rate in half-second change scores during presentation, imagery and post-interval for control participants Figure 15c ........................................................................................................................... 124 Heart rate in average change scores during presentation Figure 15d ........................................................................................................................... 124 Heart rate in average change scores during imagery Figure 15e ........................................................................................................................... 124 Heart rate in average change scores during post-interval
X
Figure 15f ............................................................................................................................ 125 Heart rate in average change scores across all three periods Figure 15g ........................................................................................................................... 125 Heart rate for fear-related scenes during imagery Figure 16a ........................................................................................................................... 127 Systolic blood pressure in second change scores during presentation, imagery and post-interval for social phobic participants Figure 16b ........................................................................................................................... 127 Systolic blood pressure in second change scores during presentation, imagery and post-interval for control participants Figure 16c ........................................................................................................................... 128 Systolic blood pressure in average change scores during presentation Figure 16d ........................................................................................................................... 128 Systolic blood pressure in average change scores during imagery Figure 16e ........................................................................................................................... 128 Systolic blood pressure in average change scores during post-interval Figure 16f ............................................................................................................................ 129 Systolic blood pressure in average change scores across all three periods Figure 16g ........................................................................................................................... 131 Systolic blood pressure for fear-related scenes during imagery Figure 17a ........................................................................................................................... 131 Diastolic blood pressure in second change scores during presentation, imagery and post-interval for social phobic participants Figure 17b ........................................................................................................................... 132 Diastolic blood pressure in second change scores during presentation, imagery and post-interval for control participants Figure 17c ........................................................................................................................... 132 Diastolic blood pressure in average change scores during presentation Figure 17d ........................................................................................................................... 133 Diastolic blood pressure in average change scores during imagery Figure 17e ........................................................................................................................... 133 Diastolic blood pressure in average change scores during post-interval Figure 17f ............................................................................................................................ 133 Diastolic blood pressure in average change scores across all three periods Figure 17g ........................................................................................................................... 134 Diastolic blood pressure for fear-related scenes during imagery
XI
Figure 18a ........................................................................................................................... 136 Pulse amplitude in second change scores during presentation, imagery and post-interval for social phobic participants Figure 18b ........................................................................................................................... 137 Pulse amplitude in second change scores during presentation, imagery and post-interval for control participants Figure 18c ........................................................................................................................... 137 Pulse amplitude in average change scores during presentation Figure 18d ........................................................................................................................... 138 Pulse amplitude in average change scores during imagery Figure 18e ........................................................................................................................... 138 Pulse amplitude in average change scores during post-interval Figure 18f ............................................................................................................................ 138 Pulse amplitude in average change scores across all three periods Figure 18g ........................................................................................................................... 139 Pulse amplitude for fear-related scenes during imagery Figure 19a ........................................................................................................................... 141 Respiration amplitude in percentage average change scores during imagery Figure 19b ........................................................................................................................... 141 Respiration amplitude in percentage average change scores during post-interval Figure 19c ........................................................................................................................... 142 Respiration amplitude in percentage average change scores across two periods Figure 19d ........................................................................................................................... 142 Respiration amplitude for fear-related scenes during imagery Figure 20a ........................................................................................................................... 144 Respiration rate in percentage average change scores during imagery Figure 20b ........................................................................................................................... 145 Respiration rate in percentage average change scores during post-interval Figure 20c .......................................................................................................................... 145 Respiration rate in percentage average change scores across two periods Figure 20d ........................................................................................................................... 145 Respiration rate for fear-related scenes during imagery Figure 21a ........................................................................................................................... 148 Skin conductance in half-second change scores during presentation, imagery and post-interval for social phobic participants
XII
Figure 21b .......................................................................................................................... 148 Skin conductance in half-second change scores during presentation, imagery and post-interval for control participants Figure 21c ........................................................................................................................... 149 Skin conductance in average change scores during presentation Figure 21d ........................................................................................................................... 149 Skin conductance in average change scores during imagery Figure 21e ........................................................................................................................... 149 Skin conductance in average change scores during post-interval Figure 21f ............................................................................................................................ 150 Skin conductance in average change scores across all three periods Figure 21g ........................................................................................................................... 150 Skin conductance for fear-related scenes during imagery Figure 22a ........................................................................................................................... 152 Startle reflex during imagery Figure 22b ........................................................................................................................... 154 Startle reflex for fear-related scenes during imagery
Introduction 1
1. INTRODUCTION
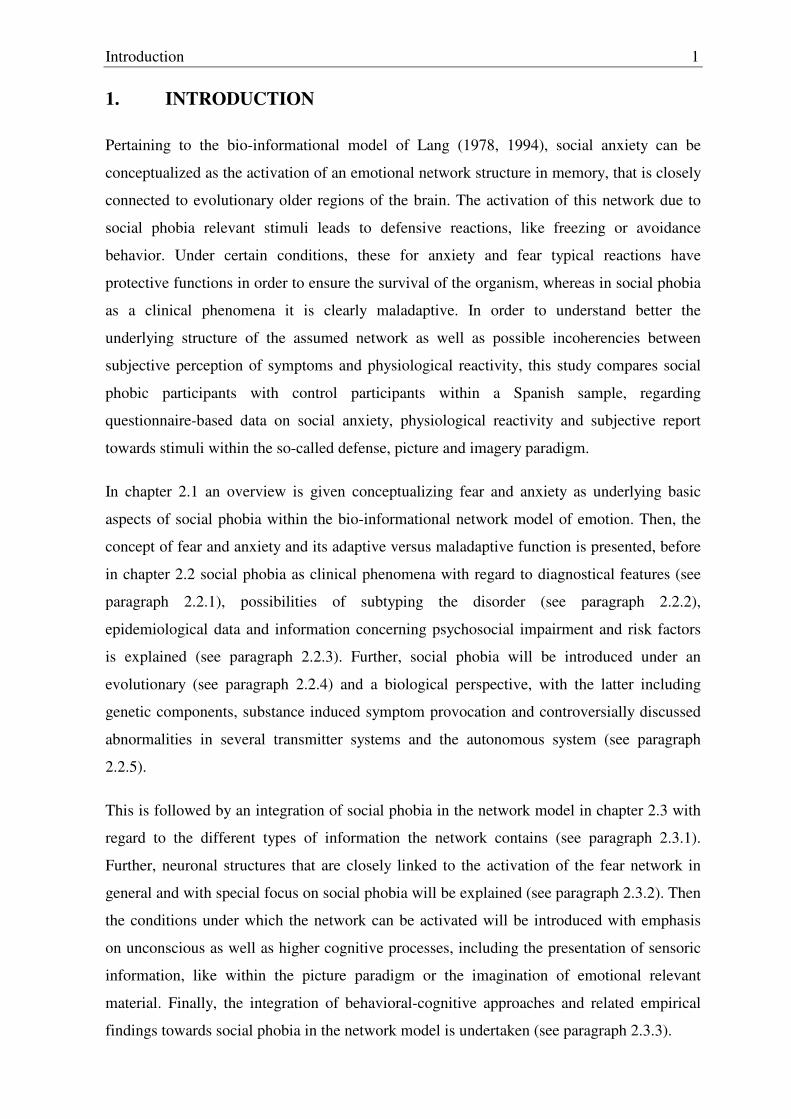
Pertaining to the bio-informational model of Lang (1978, 1994), social anxiety can be
conceptualized as the activation of an emotional network structure in memory, that is closely
connected to evolutionary older regions of the brain. The activation of this network due to
social phobia relevant stimuli leads to defensive reactions, like freezing or avoidance
behavior. Under certain conditions, these for anxiety and fear typical reactions have
protective functions in order to ensure the survival of the organism, whereas in social phobia
as a clinical phenomena it is clearly maladaptive. In order to understand better the
underlying structure of the assumed network as well as possible incoherencies between
subjective perception of symptoms and physiological reactivity, this study compares social
phobic participants with control participants within a Spanish sample, regarding
questionnaire-based data on social anxiety, physiological reactivity and subjective report
towards stimuli within the so-called defense, picture and imagery paradigm.
In chapter 2.1 an overview is given conceptualizing fear and anxiety as underlying basic
aspects of social phobia within the bio-informational network model of emotion. Then, the
concept of fear and anxiety and its adaptive versus maladaptive function is presented, before
in chapter 2.2 social phobia as clinical phenomena with regard to diagnostical features (see
paragraph 2.2.1), possibilities of subtyping the disorder (see paragraph 2.2.2),
epidemiological data and information concerning psychosocial impairment and risk factors
is explained (see paragraph 2.2.3). Further, social phobia will be introduced under an
evolutionary (see paragraph 2.2.4) and a biological perspective, with the latter including
genetic components, substance induced symptom provocation and controversially discussed
abnormalities in several transmitter systems and the autonomous system (see paragraph
2.2.5).
This is followed by an integration of social phobia in the network model in chapter 2.3 with
regard to the different types of information the network contains (see paragraph 2.3.1).
Further, neuronal structures that are closely linked to the activation of the fear network in
general and with special focus on social phobia will be explained (see paragraph 2.3.2). Then
the conditions under which the network can be activated will be introduced with emphasis
on unconscious as well as higher cognitive processes, including the presentation of sensoric
information, like within the picture paradigm or the imagination of emotional relevant
material. Finally, the integration of behavioral-cognitive approaches and related empirical
findings towards social phobia in the network model is undertaken (see paragraph 2.3.3).
Introduction 2
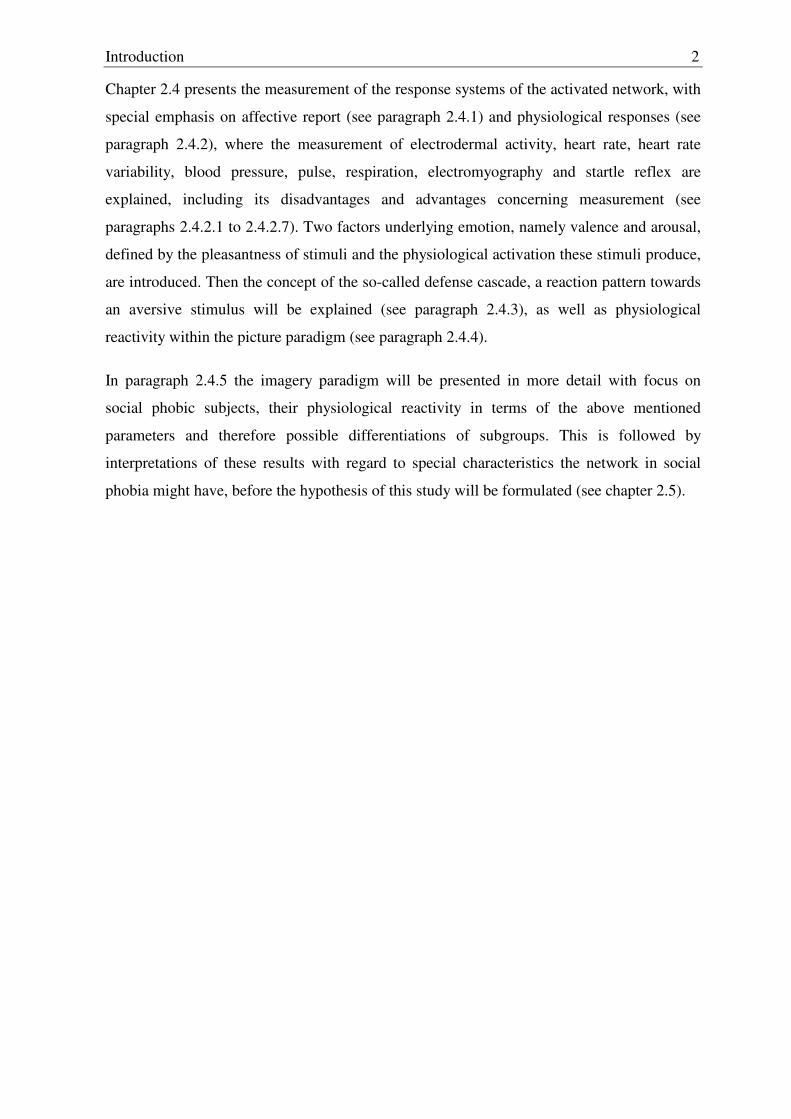
Chapter 2.4 presents the measurement of the response systems of the activated network, with
special emphasis on affective report (see paragraph 2.4.1) and physiological responses (see
paragraph 2.4.2), where the measurement of electrodermal activity, heart rate, heart rate
variability, blood pressure, pulse, respiration, electromyography and startle reflex are
explained, including its disadvantages and advantages concerning measurement (see
paragraphs 2.4.2.1 to 2.4.2.7). Two factors underlying emotion, namely valence and arousal,
defined by the pleasantness of stimuli and the physiological activation these stimuli produce,
are introduced. Then the concept of the so-called defense cascade, a reaction pattern towards
an aversive stimulus will be explained (see paragraph 2.4.3), as well as physiological
reactivity within the picture paradigm (see paragraph 2.4.4).
In paragraph 2.4.5 the imagery paradigm will be presented in more detail with focus on
social phobic subjects, their physiological reactivity in terms of the above mentioned
parameters and therefore possible differentiations of subgroups. This is followed by
interpretations of these results with regard to special characteristics the network in social
phobia might have, before the hypothesis of this study will be formulated (see chapter 2.5).
Theory 3
2. THEORY
2.1 Fear and anxiety as emotions
Emotions in the context of scientific study can be seen as a process that includes attention,
information processing, arousal, mobilization and finally action; the latter does not
necessarily occur in each context, because action might be suppressed (Davis & Lang,
2001). Lang (1995) conceptualizes emotion threefold, as they consist mainly of three
components: language, in terms of reported affect1 and expressive language, physiology and
behavior. Influenced by Fridja’s concept, he assumes that these three components are
represented in the form of memory structures in the brain, which can be characterized as an
associative network. Emotional networks differ from other knowledge structures (see
Anderson & Bower, 1974; Kintsch, 1974), in that they include connections to the primitive
cortex, the sub-cortex and the mid-brain, which form the so-called primary motivational
system that is crucial to ensure survival in terms of an evolutionary perspective. This system
has a biphasic structure and can be differentiated in an appetitive and defensive system. The
first mentioned is activated by pleasant stimuli that provoke approach-behavior, again under
an evolutionary perspective these stimuli are mainly related to sexual and nuturant behavior,
which enhance or maintain individuals or the species. The second one is activated by
unpleasant stimuli that provoke defensive behavior like fight-flight reactions or withdrawal
and these stimuli are related to any type of potential danger or harm they can produce
(Bradley & Lang, 2000; Davis & Lang, 2001; Lang, Davis & Öhman, 2000). Each system
can vary in terms of arousal, which reflects the intensity concerning metabolic and neural
activation (see also Cacioppo & Bernston, 1994). This defense versus approach behavior can
already be observed in simple organisms (Schneirla, 1959), but in human beings there exist
many forms of emotion and patterns of response can vary within subjects and between
contexts of stimulation, which are shaped by genetics and learning (Lacey, 1958; Lacey &
Lacey, 1970; Lang, Bradley & Cuthbert, 1990). So, for example, the activation of the
defense system by an actual threat can lead to an anger reaction, as well as to a flight
reaction (Lang, Bradley & Cuthbert, 1990). Therefore, human emotions are complex and
show a great variety. But their fundamental organization remains motivational and they can
1 In this context emotions should be differentiated from “feelings” and “affect”, which can be interpreted as subjective inner states, and therefore as important components of emotions, but not as emotions per se (for an overview see Lang, 1994).
Theory 4
be primarily described within a hypothetical two-dimensional space in terms of affective
valence, namely appetitive versus aversive, and arousal as intensity of activation. In this
sense, emotion can be viewed as biological phenomena that reflect evolutionary inheritance
(Bradley & Lang, 2000) and can be defined as “action dispositions” (Fridja, 1986; Bradley
& Lang, 2000).
In fear and anxiety as negative emotions, it is assumed that the defensive motivational
system is activated in order to serve as an adaptive function and to protect the organism of
potential threat, which leads to an autonomic and somatic output. This output can be further
differentiated into two types of behavior tendencies, one which is called defensive freezing,
that includes vigilance and immobility and one that is called defensive action, that includes
fight and flight reactions. In the following, differences between fear and anxiety, as well as
their differentiation in adaptive versus maladaptive phenomena will be explained: As fear
and anxiety are both characterized by tension, autonomic hyperactivity, apprehensive
expectation and vigilance, there exist several approaches to distinguish between these two
phenomena: Fear results as an emotion due to an external source of threat, whereas anxiety
is defined as tension or apprehension due to the anticipation of danger in the absence of a
recognizable external source of threat (see also APA, 1987). Epstein (1972) criticizes this
view and mentions that external stimuli are not sufficient to distinguish between fear and
anxiety. He relates fear to escape and avoidance behavior. If this behavior is blocked, fear
turns into anxiety. Therefore, anxiety is seen as unresolved fear and a state of undirected
arousal following the perception of threat. As mentioned above, fear and anxiety responses
themselves are not malfunctional, but the fact that they can be triggered in a malfunctional
context as in phobias or that there exist dysfunctionally low thresholds to activate them as in
panic disorder, leads to pathological forms of fear and anxiety (Nesse, 1987; Öhman,
Dimberg, Öst, 1985; Öhman, 1993). The difference between “normal” in the sense of
adaptive and “clinical” in the sense of maladaptive with regard to fear and anxiety, are
mainly the following. Clinical fear and anxiety are more recurrent and persistent. Their
intensity is not reasonable in terms of danger or threat and tend to paralyze individuals and
produce helplessness which in turn prevent them from coping well with the given context
and lead to impaired psychosocial or physiological functioning (Marks & Lader, 1973;
Öhman, 1993). For a differentiation between the types of anxiety disorders see DSM-IV-TR
(American Psychiatric Association, 2000).
Theory 5
In the following, social phobia and its associated symptoms in terms of a maladaptive
reaction towards social situations is presented. A differentiation into subtypes is given,
which is followed by epidemiological, social demographical and etiological information
under an evolutionary and biological perspective concerning the disorder, before social
phobia will be integrated in more detail into the concept of Lang’s (1978, 1979, 1984, 1985,
1987, 1994) fear network model.
2.2 Social phobia
2.2.1 Diagnostical features of social phobia
According to the “Diagnostical and S tatistical Manual of Mental Disorders” (DSM -IV-TR,
2000), social phobia belongs to the diagnostical category of the anxiety disorders and is
characterized by an intense and persistent fear of social and/or performance situations in
which the person is confronted with unknown people and is worried that he/she will behave
in a way that could be embarrassing or humiliating. The fear is recognized as exaggerated or
unfounded and is avoided if possible. This response may take the form of a situationally
bound or situationally predisposed panic attack. If avoidance is not possible, anxious
anticipation and intense fear and distress is experienced. The person’s every day life, her
normal routine and occupational functioning, as well as social activities and relationships are
impaired or there is a marked distress about having the phobia. The diagnosis is not
appropriate if the fear or avoidance is due to the effect of a substance or of a general medical
condition or is better accounted for by another mental disorder, as well as if it is not limited
to concern about its social impact. Associated descriptive features are hypersensitivity to
criticism, negative evaluation or rejection, as well as difficulty being assertive, low-self
esteem, or feelings of inferiority and often the manifestation of poor social skills.
Differential diagnosis with agoraphobia with and without panic attacks is not always clear,
but the main difference is that social phobics experience panic attacks only in social contexts
and their avoidance involves fear of evaluation and scrutiny (DSM-IV-TR, 2000).
2.2.2 Subtypes
The differentiation of social phobia in various subtypes is discussed controversially
(Gerlach, 2002; Heimberg, Hope, Dodge & Becker, 1990; Manuzza, Schneier, Chapman,
Liebowitz, Klein & Fyer, 1995). Wittchen and Fehm (2001) give an overview of different
possibilities for subtyping social phobia: Performance versus interactional fear, speaking
Theory 6
versus non-speaking fears, and social fears with and without deficits in social competence
are mentioned. The most common differentiation refers to circumscribed or specific social
phobia versus generalized social phobia.
2.2.2.1 Specific versus generalized social phobia
According to DSM-IV, social phobia can be specified as generalized if the fear includes
most social situations, usually both public performance situations and social interaction
situations, whereas the circumscribed or specific subtype refers to more specific social
situations, mostly to public performance or speaking, when scrutiny is inevitable.
Approximately one third of the subjects with lifetime social phobia report experiencing fear
of speaking, and two thirds report at least one additional fear (Kessler, Stein & Berglund,
1998). Further, individuals with generalized social phobia may be more likely to manifest
deficits in social skills and to have severe social and work impairment (DSM-IV-TR, 2000;
Brunnello et al., 2000; Stemberger, Turner, Beidel & Calhoun, 1995; Turner, Beidel &
Townsley, 1992). Compared to subjects with specific social phobia, patients with
generalized social phobia are younger, report an earlier age of onset, are less educated, less
likely to be employed, and less likely to be married. They show higher measures of social
anxiety, avoidance, general anxiety, and concerns about negative evaluation, as well as
depression, more additional comorbid diagnosis and a more severe impairment. There are no
differences in gender or anxiety during behavioral tests of observed social skills. (see Brown,
Heimberg & Juster, 1995; Heimberg et al., 1993; Kessler, Stang, Wittchen, Ustan, Roy-
Byrne & Walters, 1998). Although there exist only a few empirical studies (see for example
Heimberg et al., 1990; Stein, Walker & Forde, 1996), Heimberg and colleagues differentiate
between a generalized subtype, similar to the above mentioned authors, but in addition
differentiate a non-generalized from a circumscribed subtype, which shows normal
functioning in at least one broad social domain, whereas the circumscribed subtype
experiences anxiety in one or two discrete situations (Heimberg, Holt, Schneier, Spitzer &
Liebowitz, 1993). Recent studies suggest that a schema including four different domains of
situations in which social phobics may typically experience symptoms, namely, formal
speaking and interaction, informal speaking and interaction, assertive interaction, and
observation by others, can be useful for subtyping individuals with social phobia (Hofmann,
Albano, Heimberg, Tracey, Chorpita & Barlow, 1999; Hofmann & Roth, 1996; Holt,
Heimberg & Hope, 1992). Eng and colleagues (2000) criticize that attempts to determine
subgroups have relied on clinical descriptions or a priori theoretical speculation, and propose
Theory 7
therefore a model of subtyping that can be seen as a result of a cluster analysis on subscales
which represent social interactions, public speaking, observation by others, and eating or
drinking in public (Eng, Heimberg, Coles, Schneier & Liebowitz, 2000). Following
Heimberg and colleagues’ classification, they found three gro ups that can be differentiated in
terms of age, age of onset of social phobia, measures of social anxiety, general anxiety and
depressive symptomatology and named them “pervasive social anxiety”, “moderate social
interaction anxiety” and “dominant public s peaking anxiety”. Pervasive social anxiety
resembles generalized social phobia, whereas moderate social interaction anxiety resembles
specific social phobia, referring to social interaction and speaking situations. Dominant
public speaking anxiety resembles specific social phobia pertaining only to public speaking
fears. So, the latter two clusters represent a further differentiation within specific social
phobia, but in general, the results of this analysis is very similar to the differentiation
between specific versus generalized social phobia and Eng and colleagues themselves
emphasize that future research is needed to examine whether these three groups assure
clinical utility and how they are represented in a non-clinical population (Eng et al., 2000;
Heimberg, Holt, Schneier, Spitzer & Liebowitz, 1993).
2.2.2.2 Social phobia without versus with avoidant personality disorder
Further, social phobia can be differentiated in with and without comorbid avoidant
personality disorder on axis II of DSM (for details see DSM-IV-TR, 2000). There is a
continuum of increasing severity, from specific to generalized social phobia without and
with avoidant personality disorder. Avoidant personality disorder may be a more severe
variant of generalized social phobia, as the majority of the criteria for avoidant personality
disorder include a social interaction component (Hofmann & Barlow, 2002). In addition,
both diagnoses are associated with a high level of social anxiety, poor overall psychosocial
functioning, greater psychopathology, high trait anxiety and depression (see for example
Boone et al., 1999; Brown et al., 1995; Tran & Chambless, 1995). Scores on measures of
social anxiety, of interpersonal sensitivity and general symptomatology, as well as measures
of depression, are higher for subjects with generalized social phobia and avoidant personality
disorder compared to subjects with specific social phobia and avoidant personality disorder.
With one exception according to trait anxiety (see Herbert, Hope & Bellack, 1992), there are
no differences on measures of state and performance anxiety, neither on cognitive and
somatic expressions of anxiety, nor on fear of negative evaluation or observer ratings of
social skills, nor on demographic aspects, except that subjects with generalized social phobia
Theory 8
and comorbid avoidant personality disorder seem to be less likely to be married (see Brown
et al., 1995; Tran & Chambless, 1994). However, there are differences concerning the
subtypes in cognitive processing (Hofmann, Gerlach, Wender & Roth, 1997; McNeil et al.,
1995) and psychophysiological responses reported (Boone et al., 1999; Heimberg et al.,
1990; Hofmann, Newman, Ehlers & Roth, 1995; Levin et al., 1993, see also chapter 2.5), as
well as the presence of a higher percentage of traumatic conditioning experiences for the
specific subtype (Stemberger et al., 1995).
In conclusion, although quantitative differences between social phobia and avoidant
personality disorder are important (Boone et al., 1999; Tran & Chambless, 1995), there is a
high overlap between these two diagnoses (Heimberg, 1996; Schneier, Spitzer, Gibbon, Fyer
& Liebowitz, 1991), so that some authors doubt whether this form of subtyping really
differentiates these two disorders usefully (Brown et al., 1995; Herbert, Hope & Bellack,
1992; McNeil, 2001).
2.2.3 Epidemiology
2.2.3.1 Prevalence
In general, there exists a wide variety according to the lifetime prevalence and the
prevalence for a defined period within social phobia. Lifetime prevalence can be estimated
within the general population between 0.4% and 18.7% (Hwu, Yeh & Chang, 1989; Kessler,
Stein & Berglund, 1998; Lee et al., 1990; Wacker, Müllejans, Klein, Battegay, 1992;
Wittchen, Nelson & Lachner, 1998), a 6 month prevalence between 1.1% and 1.5% (Canino
et al., 1987; Robins & Regier, 1991) and a 12-month prevalence between 2.0% and 7.9%
(Kessler et al., 1994; see Lieb & Müller, 2002 for an overview; Wittchen, Pfister,
Schmidtkunz, Winter & Müller, 2000). For example in the “National Comorbidity Survey”
conducted between 1990 and 1992 in the United States where 8098 subjects from the age of
15 to 54 were interviewed by the “Composite International Diagnostic Interview”, lifetime
prevalence of 13.3% and a 12-month prevalence of 8% was found (Kessler et al., 1994). The
most recent studies according to the prevalence of social phobia including DSM-IV criteria
and using standardized interviews, were carried out in Australia, Germany and Italy.
Faravelli and colleagues reported in their study that 3.2% from a community sample of 2500
subjects being interviewed by use of the “Florence Psychiatric Interview”, which is reliable
and valid against the “Composite International Diagnostic Interview”, suffered from social
phobia during their lifetime (Faravelli et al., 2000). This could even be corrected to 4%, if
Theory 9
age as a variable was considered. They found that women with a lifetime prevalence of 4%
showed twice the lifetime rate than men with 1.9%. Also, Kessler and colleagues found a
female-to-male ratio for social phobia of 3:2 (Kessler et al., 1994), although with regard to
treatment, both sexes are represented equally or the majority of patients treated for social
phobia is male (DSM-IV-TR, 2000). Wittchen and colleagues (1999) found in their study
“Münchner Early Develop ment Stages of Psychopathology”, that from a sample of 3021
adolescents and young adults, aged 18 to 24 being interviewed from 1995 to 1999 by the
“Münchner -Composite International Diagnostic Interview”, lifetime prevalence for social
phobia came to 8.7% and 12-month prevalence to 6.2%, whereas in a further sample of the
“Bundesweiten Gesundheitssurvey” from 1997 to 1998, 12 -month prevalence came to 2.0%
for a sample of 7124 subjects from the age of 16 to 65 (Wittchen, Stein & Kessler, 1999).
Andrews and colleagues reported a lifetime prevalence of 2.7% for an Australian sample of
10600 subjects aged 18 years and older, who were interviewed as well by the “Composite -
International Diagnostic Interview” (Andrews, Hall, Teesson & Henderson, 1999). Becker
and his group reported a lifetime prevalence of 12.0% in a sample of 1538 female
adolescents who were between 18 and 25 years old using the “Diagnostisches Interview bei
psychischen Störungen-Forschungsversion” (Becker, Türke, Neumer, Soeder, Krause &
Margraf, 2000). For a prevalence rate of social phobia in the Spanish population, there seem
to be no actual data available. However, López (2001) found a lifetime prevalence of 8.9%
and a 12-month prevalence of 4.6% in a sample of 237 Spanish women.
Concerning subtypes of social phobia within community samples, specific social phobia can
be estimated between 55% and 79% of social phobia (see Kessler et al., 1998; Lieb &
Müller, 2002; Robins & Regier, 1991), and is less frequent than generalized social phobia,
whereas the generalized subtype is more frequent in clinical samples (for details see Amies,
Gelder & Shaw, 1983; Holt, Heimberg & Hope, 1992; Turner, Beidel & Larkin, 1986).
Faravelli and colleagues reported that 42.9% of their subjects suffering from social phobia
also have an additional diagnosis of avoidant personality disorder (Faravelli et al., 2000).
The comorbidity rates for generalized social phobia with avoidant personality disorder can
be estimated between 25% and 89%, and is therefore higher than for specific social phobia
with avoidant personality disorder, which can be estimated between 0% and 44% (for an
overview see Brown et al., 1995).
In sum, prevalence for social phobia can be estimated as relatively high, although there
exists a high variety according to prevalence relevant data. This variety can be explained by
Theory 10
various aspects and has to be seen in the context that epidemiological studies suffer from
heterogeneity. First, the composition of the sample can contribute to this diversity:
representative samples of the general population provide a fuller description of a disorder
and its prevalence than do clinical samples, because the last mentioned already are
influenced by the bias of self-selection. Samples with a higher proportion of younger adults
report higher prevalence rates, because onset is also early. So studies including older
subjects could correct prevalence rates and could consider an increasing number of partial
remissions. Another aspect is cultural characteristics. In Asia, for example, social phobia has
the lowest lifetime prevalence (see Hwu et al., 1989; Lee et al., 1990), which might be due to
different constructs and mental representations of this condition and what might be regarded
as shyness. In this context it is important to mention that diagnostic criteria and diagnostic
instruments should be examined whether they are cross-culturally valid (Wittchen & Fehm,
2001). Second, diagnostic criteria lead to variance: between DSM-III and DSM-IV, for
example, the coverage of qualifying situations for social phobia, the formulation of
symptoms and the impairment and exclusion criteria have changed. But also within DSM-IV
criteria, there remains the problem of a diagnostic threshold. According to distress and
impairment, there is no clear cut-off criterion when social anxiety becomes pathologic, and it
remains unclear how to distinguish social phobia from normal shyness (Brunnello et al.,
2000; Wittchen & Fehm, 2001; Heiser, Turner & Beidel, 2003). The use of different
interviews make the problem even more complex. So the frequently used “Composite
International Diagnostic Interview” puts higher thresholds for severity than other interviews
do (Brunnello et al, 2000). In addition, it is necessary to overcome the differences in
evaluation methodology over different periods of time, as well as the lack of sufficient long
term studies in order to reduce this diversity (Lieb & Müller, 2002).
2.2.3.2 Incidence
Within the general population, the Epidemiologic Catchment Area Program found a 1-year-
incidence rate of 0.5% for social phobia, defined by the DSM-IV criteria (see Neufeld,
Swartz, Bienvenu, Eaton & Cai, 1999) and also the “Münchner Follow -up Studie” found a 7 -
year incidence rate of 0.3% (see Wittchen, 1993). Younger cohorts in general show a higher
incidence rate: the “Münchner Early Development Stages of Psychopathology” showed an
incidence rate of 2.8% for 4 years for the 14 to 24 year olds, which was even higher for the
14 to 17 year olds with 3.4% compared to the 18 to 24 year olds, if groups were split
(Wittchen et al., 1999).
Theory 11
2.2.3.3 Age of onset
The period when social phobia is manifested for the first time is typically early to late
adolescence. Average age and high risk period is between 10 and 17, and the risk for
beginning symptoms after the age of 25 is less likely and rather an exception. The
generalized subtype seems to manifest earlier than the specific one (Brown et al., 1995;
Davidson, Hughes, George, Blazer, 1993; Degonda & Angst, 1993; DeWit, Ogborne,
Offord, MacDonald, 1999; Faravelli et al., 2000; Lieb & Müller, 2002; Mannuzza, et al.,
1995; Müller, 2002; Schneier, Johnson, Hornig, Liebowitz, Weissman, 1992; Stemberger,
Turner, Beidel &Calhoun, 1995). The prevalence of social phobia in younger cohorts seems
to augment, as they also show higher life-incidence rates, which was analyzed
retrospectively by Magee and colleagues on the basis of the data of the “National
Comorbidity Survey”. In this context, it should be mentioned that these results could be
influenced by memory effects in older cohorts, which again shows the necessity of
prospective longitudinal studies (Magee, Eaton, Wittchen, McGonagle & Kessler, 1996).
2.2.3.4 Course of social phobia
In retrospective studies, the clinical course of social phobia seems to be chronic (Amies et
al., 1983; Marks, 1970; Öst, 1987) and often goes untreated with a significant impairment
(Magee et al., 1996). The average duration in a clinical sample was reported between ages
10 to 21 (Lelliot, 1991; Lieb & Müller, 2002; Perugi, Simmonini, Savino, Mengali, Cassano
& Akiskal, 1990; Rapee, Sanderson & Barlow, 1988). In a community sample, it was
reported between ages 19 to 29 (Davidson et al., 1993; DeWit et al., 1999; Lieb & Müller,
2002; Kessler et al., 1998). More valid than retrospective studies, are prospective
longitudinal studies. The Zürich-Studie showed no stability in terms of a repeated fulfillment
of all diagnostic criteria over a 10-year period, where subjects were interviewed four times.
14.7% received the diagnosis two times, but in a later additional study 41% reported still
having fear or avoidance behavior (Degonda & Angst, 1993). In the “Münchner Early
Development Stages of Psychopathology“, 11% of the subjects aged 14 to 24, showed a
stable diagnosis for social phobia (Müller, 2002), and paralleling the findings of the “Zürich -
Studie”, where 36.4% of the subjects still showed symptoms of anxiety in social situations.
Higher stability was found in the study of the “Epidemiologic Catchment Area Program”,
showing that the beginning of social phobia before the age of 11 is related to a reduced
probability of remission (Davidson et al., 1993; Lieb & Müller, 2002).
Theory 12
2.2.3.5 Comorbidity
Comorbidity with other psychiatric disorders is estimated between 46% and 81% within the
general population, as well as in clinical samples (see Brown, Campbell, Lehman, Grisham
& Mancill, 2001; Magee et al., 1996; Schneier, Johnson, Hornig, Liebowitz & Weissman
1992). Comorbidity rates for other anxiety disorders, major depression and dysthymia, as
well as substance-, drug-, and nicotine abuse according to DSM-III, DSM-III-R and DSM-
IV, from the Epidemiologic Catchment Area Program, the National Comorbidity Survey, the
Zürich-, as well as the Münchner Early Development Stages of Psychopathology are the
following: Within the anxiety disorders, specific phobia has the highest comorbidity rate
with social phobia and lies between 37.6% and 59.0%, followed by agoraphobia with 8.8%
to 44.9%, posttraumatic stress disorder with 5.9% to 15.8%, generalized anxiety disorder
with 2.3% to 13.3%, obsessive compulsive disorder with 2.3% to 11.1% and panic disorder
with 4.7% to 10.9%, (see Lieb & Müller, 2002). Besides agoraphobia and specific phobia,
social phobia is the most frequent anxiety disorder (DSM-IV-TR, 2000). The Münchner
Early Development Stages of Psychopathology shows a comorbidity rate between social
phobia and major depression and/ or dysthymic disorder of 43.9%, whereas the other above
mentioned studies show a comorbidity rate between 16.6% and 25.5% for major depression
and 10.9% to 14.6% for dysthymic disorder. Alcohol abuse and dependency range between
10.9 and 19.4%, drug abuse and dependency range between 5.3% and 14.8%, and nicotine
dependency around 31.9%. Comorbidity rates with anorexia or bulimia nervosa are as well
high with up to 60% (see Godart et al., 2000). Brown and colleagues found similar rates for
a clinical sample, where 45% of the social phobics met criteria for either an anxiety or mood
disorder, 28% for an anxiety disorder alone, and 29% for a mood disorder alone. Concerning
comorbidity over a lifetime span, mood disorders range about 44% as comorbid disorder in
social phobia (Brown et al., 2001). Merikangas and Angst (1995) conclude that social phobia
normally precedes the comorbid disorder, except for specific phobia that seems to be
manifested before the onset of social phobia (see Öst, 1987; Wittchen, Lieb, Schuster &
Oldehinekl, 1999).
Theory 13
2.2.3.6 Psychosocial impairment
Wittchen and colleagues (2000) for example showed in a non-clinical case study, that
subjects with social phobia without any further comorbid disorder feel clearly impaired with
regard to their job or school education as well as their work productivity and intimate
relationships. For social phobia with comorbidity the impairment was more severe. The
study “Münchner Early Development Stages of Psychopathology” (Wittchen, Stein &
Kessler, 1999) showed high percentages of impairment within the areas of school, work,
household, leisure time, social contacts and relationships for all subjects. The generalized
subtype showed higher percentage rates due to impairment than the non-generalized subtype.
Anderson and Harvey (1988) found that over half of the social phobics in their study
reported high levels of low sociability and loneliness.
2.2.3.7 Risk factors
In epidemiological and community-based studies, women seem to have a 1.5 to 2 times
higher risk for social phobia (DSM-IV-TR, 2000; Lieb & Müller, 2002), which is lower
compared to other anxiety disorders. In many clinical samples women and men are equally
represented or the majority is male (DSM-IV-TR, 2000; Faravelli et al., 2000). Subjects with
social phobia are less likely to be married and more likely to live separated. Separation can
also lead to the outbreak of social phobia. Social status is lower compared to healthy
controls, whereas this factor must be considered as well as a possible consequence of social
phobia. Temperamental factors like behavioral inhibition and physiological aspects like a
higher heart rate frequency and higher levels of cortisol, as well as cognitive, perceptional
and attention related factors can be seen as risk or related factors to social phobia (see Lieb
& Müller, 2002). Concerning familiar risk factors there is a higher occurrence within
families, and twin studies support a genetic component as well as a high influence due to
environmental factors (see paragraph 2.2.5).
Below, an overview of social phobia under an evolutionary as well as under a biological
perspective is given, with the latter including aspects pertaining not only to genetics, but also
substance induced symptom provocation, transmitter systems and the autonomous nervous
system with possible deviations regarding social phobia being discussed.
Theory 14
2.2.4 Social phobia under an evolutionary perspective
Nesse (1998), Tooby and Cosmides (1990) argue that fear and anxiety evolve because they
are adaptive in terms of genetic fitness, referring to Darwin’s principle of the survival of the
fittest, because they help in anticipating danger and facilitating avoidance and escape.
Gilbert and colleagues combine this evolutionary perspective with social phobia. They
assume that humans like other species, compete with one another for resources and seek or
appear attractive to conspecifics, sexually or otherwise (Gilbert & McGuire, 1998; Gilbert &
Trower, 1990). According to Chance (1988), they differentiate two forms of group living in
the service of reproductive success, an agonic, or threat based mode, which is characterized
by dominance hierarchies and the hedonic, or affiliation based mode, which is characterized
by mutual dependence and reciprocal relationships. Anxiety depends on the activation of the
appraisal of stimuli as threat or loss that might endanger the position or status of an
individual within its social group. In this sense, anxiety serves as a useful function because it
helps to regulate social life while minimizing the risks of aggression or a breakdown in the
group’s activity. It also serves the function of providing the indi vidual with self-knowledge,
enhancing awareness of standards of behavior and encouraging processes of self-regulation.
It then becomes dysfunctional when anxiety is perceived in any type of social interaction. In
this context, the defense system might be activated inappropriately, which may result as a
consequence of a lack of an activation of the so-called safety-system or from the fear of
appearing unattractive to others (Crozier & Alden, 2001; Gilbert & McGuire, 1998; Gilbert
& Trower, 1990).
Öhman (1986, 1993) sees social conflicts as a consequence of the above mentioned
dominance hierarchies. He also argues that within an evolutionary perspective humans form
dominance-submissive-systems that have adaptive functions in order to promote social order
by means of facilitating the establishment of dominance-hierarchies with advantages of
being nearer to the top than the bottom. Even individuals occupying lower parts of the
hierarchy have advantages of remaining in the group, but are forced at the same time to
interact with others higher in the hierarchy. Referring to social anxiety this means that
individuals have to confront these interactions despite their anxiousness. As competing
dominance involves threat and fear, this is portrayed by corresponding facial expressions.
This means that for an angry facial expression as a conditioned stimuli the conditioning
process might be facilitated in terms of a biological preparedness. Mogg and Bradley (2002)
showed a vigilance effect for masked threat faces in socially anxious subjects. Some
Theory 15
empirical evidence also exists, that aversive conditioning processes on angry facial
expressions compared to happy or neutral facial expressions have a higher resistance to
extinction, but not a faster acquisition of the conditioned reaction, so that the concept of
preparedness referring to social phobia in this context remains to be proven (Dimberg, 1986;
Hermann, 2002; Öhman, 1986; Öhman, Dimberg & Öst; 1985).
Bond and Siddle (1996) draw several predictions from Öhman’s theory. As Öhman (1985)
points out, dominance hierarchies begin during adolescence, which could serve as an
explanation as to why the onset of social phobia is often in adolescence. In general, there
might be readiness in any individual to associate an angry facial expression with an aversive
outcome. There might however be individual differences, so social phobics could be
especially sensitive for instance. These differences should be especially noticeable in
interactions with strangers, where dominance relationships are still unknown. Due to the
need to stay within the social group, it is not always possible to avoid these situations even if
a dominance encounter is lost. So, in this case, individuals have to signal that loss and make
the best of it. This reaction is more subtle than, for example, an active avoidance behavior.
Therefore, there might be less reflexive sympathetic activation shown, as for example within
animal phobias. In addition, the need to appraise the situation and to choose from several
possible responses means that there will be a greater reliance on controlled processing (Bond
& Siddle, 1996; Shiffrin & Schneider, 1977).
2.2.5 Social phobia under a biological perspective
According to Hermann (2002) there exists relatively little knowledge according to
neurobiological correlates of social phobia compared to other anxiety disorders. She
distinguishes between two approaches, one oriented towards neurosciences, classical
conditioning, as well as neuroplastic changes and a second one oriented towards biological-
psychiatric aspects which includes genetic predispositions, abnormalities in neurotransmitter
systems and endocrinology, which the latter approach being presented below.
2.2.5.1 Genetics
According to genetic aspects, family studies show a higher frequency for social phobia, but
this does not allow any statement about heritability. If a case-control-design is used as a
method where relatives of social phobics, the so-called “cases” are compared with control
subjects, social phobia is found with a frequency three times higher in relatives than in
Theory 16
control subjects (Fyer, Mannuzza, Chapman, Liebowitz & Klein, 1993; Merikangas, Risch
& Weissman, 1994; Reich & Yates, 1988). These studies have the assumption in common
that social phobia is a homogenous clinical disorder. But it is not clear if the genetic
component varies in its significance according to different subtypes of social phobia. Stein
and colleagues (1998) found a ten times higher risk for the generalized subtype in families of
social phobics, whereas for fear of performance, and non-generalized social anxiety no
differences were found (Mannuzza et al., 1995; Stein et al., 1998). The familiar frequency
for social phobia seemed to be specific, because there were no differences in frequency
found between relatives of social phobics and controls regarding other anxiety disorders like
specific phobias and panic disorder, and the frequency of social phobia was higher in
families of social phobics compared to families of specific phobia or panic disorder (Fyer et
al., 1993).
There are no data on adoption studies available concerning social phobia (Hermann, 2002;
Margraf & Schneider, 2003). Twin studies, which included either exclusively or mainly
women as subjects, showed a concordance rate for social phobia between 24% and 47% for
monozygot and 15% for heterozygot twins (Hermann, 2002; Kendler, Neale, Kessler, Heath
& Eaves, 1992; Skre, Onstad, Torgersen, Lygren & Kringlen, 2000). As in anxiety disorders
in general, the heredity for a predisposition for social phobia can be estimated between 30%
and 50%, which means, that environmental influences are also crucial (Hettema, Neale &
Kendler, 2001; Kendler, Heath, Martin & Eaves, 1987; Reiss, Plomin & Hetherington,
1991). Studies concerning the heredity of subtypes of social phobia are missing. To date,
there are no genetic abnormalities or genes identified that could be seen in relation with
social phobia, so the genetic disposition to develop social phobia may be nonspecific
(Hofmann, 2002). However, twin studies point towards a specific genetic vulnerability
(Kendler et al., 1992), especially for the generalized subtype (Hermann, 2002).
2.2.5.2 Substance induced symptom provocation
Substance induced symptom provocation methods try to provoke anxiety reactions by
inhaling or administrating various substances, like caffeine, lactate, or carbon dioxide. If
such a response can be provoked, this can be interpreted as a hypersensitivity of central
chemoreceptors, that could be discussed as a genetic predisposition, as for example in panic
disorder (Hermann, 2002; Klein, 1993; Papp, Klein & Gorman, 1993; Perna, Bertani,
Caldirola & Bellodi, 1996; Perna, Cocchi, Bertani, Arancio & Bellodi, 1995). Compared to
controls, social phobics show a higher rate of panic attacks after inhaling a mixture of highly
Theory 17
concentrated carbon dioxide. However, the frequency of occurring attacks was lower
compared to patients with a panic disorder (Gorman et al., 1990; Papp et al., 1993). So social
phobics failed to show the specific and sensitive anxiety reaction that panic patients develop
when inhaling a 5% mixture of carbon dioxide (Caldirola, Perna, Arancio, Bertani &
Bellodi, 1997; Gorman et al., 1990; Holt & Andrews, 1989; Papp et al., 1993; Pine et al.,
2000; Rapee, Brown, Antony & Barlow, 1992). Neither hyperventilation nor infusions of
lactate led to a higher rate of panic attacks (Holt & Andrews, 1989; Liebowitz et al., 1985;
Rapee et al., 1992). Caffeine led to higher rates of panic attacks in social phobics compared
to controls. However, social phobics reported the induced feelings of anxiety as less typical
compared to the feelings of anxiety they experience in social situations (Tancer, Mailman,
Stein, Mason, Carson & Golden, 1994). The administration of pentagastrin led to panic
attacks with equal frequency in social phobics than in panic patients, but only in the context
of a social interaction task, which might have in turn influenced the results (McCann, Slate,
Geraci, Roscow-Terrill & Uhde, 1997). Taking into account the few studies that exist, it is
only partially possible to draw conclusions concerning the importance of a chemical
hypersensitivity in social phobia, which is less profound compared to panic patients, but
more pronounced compared to controls (Hermann, 2002).
2.2.5.3 Transmitter systems
According to direct measurements in transmitter systems, the concentration of transmitters
or their metabolites in the blood or the cerebrospinal liquid, the density of receptors for a
specific transmitter, the affinity and the bonding capacity of receptors that regulate the re-
uptake of a transmitter and are located at the presynaptical side, are common measurements.
As indirect methods, the measurement of a target parameter, for example the distribution of
hormones that are controlled by a specific transmitter is applied, and deviations of the
expected effect as a consequence of the stimulation by means of an agonist or antagonist,
allow conclusions pertaining to changes in the functionality of the transmitter system.
Results concerning the investigation of abnormalities in the transmitter system in social
phobics are inconsistent or not demonstrable, for one reason because the studies are hardly
comparable due to different registration of functional aspects of transmitter systems,
different measurements and heterogeneous samples (Hermann, 2002), and often they do not
control for effects of the experimenter or performance demands in the laboratory setting
(Craske, 1999). A brief overview of research due to related results to neuroendocrinology
and several transmitter systems referring to social phobia is given below.
Theory 18
Neuroendocrinology
There are no empirical studies that could support the hypothesis of a dysfunction of the
hypothalamus-hypophysis-adrenal-suprarenal-axis or the hypothalamus-hypophysis-thyroid-
axis in social phobics. There were no heightened levels of cortisol found and reaction on the
dexamethason-suppression test was normal (for details see Hermann, 2002; Potts, Davidson,
Krishnan, Doraiswamy & Ritchie, 1991; Tancer, Stein, Gelernter & Uhde, 1990; Uhde,
Tancer, Gelernter & Vittone, 1994).
GABA
There are very few clues which indicate a reduced activity of the central GABA system
(Bell, Malizia & Nutt, 1999; Coupland, Bell, Potokar, Dorkins & Nutt, 2000). There might
be a reduction of the density of peripheral benzodiazepin receptors, which might rather
reflect the distress experienced by social phobics through repeated confrontation with social,
and therefore anxiety and fear provoking situations and might be less specific for social
phobia itself (Hermann, 2002; Johnson et al., 1998; Weizman et al., 1994).
Noradrenalin
Several measurements of adrenerg functioning like the administration of adrenerg agonists,
for instance, clonidine (Craske, 1999; Hermann, 2002; Nicholas & Tancer, 1995; Tancer,
Stein & Uhde, 1993; Tancer, Stein & Uhde, 1994), the infusion of epinephrine (see Papp,
Gormann, Liebowitz, Fyer, Cohen & Klein, 1988) and the measurement of receptor activity
in peripheral tissue, which reflects the central receptor activity (Stein, Huzel & Delaney,
1993) show contradictory results and do not give clear hints of a central, noradrenergic
hyperactivity.
Serotonin
Concerning serotonin, in studies regarding density, as well as affinity of serotonerg receptors
there were no differences found between social phobics and controls (Chatterjee, Sunitha,
Velayudhan & Khanna, 1997; Stein, Delaney, Chartier, Kroft & Hazan, 1995). Hollander
and colleagues, as well as Tancer and his group, could show a normal serotonerg mediated
release of prolactin but a heightened release of cortisol, which was interpreted as a specific
hypersensitivity of postsynaptical receptors of the serotonerg system (Hollander et al., 1998;
Tancer, Mailman et al., 1994). So, although the given effectivity of pharmacological
Theory 19
treatment with selective serotonin reuptake inhibitors of social phobia, like paroxetine
(Gorman & Kent, 1999; Stein et al., 1998), fluvoxamine (vanVliet, den Boer & Westenberg,
1994), sertraline (Katzelnick et al, 1995), and fluoxetine (Black, Uhde & Tancer, 1992;
Schneier, Chin, Hollander & Liebowitz, 1992; Sternbach, 1990; vanAmeringen, Mancini &
Streiner, 1993), there remain inconsistent results regarding the functionality of the
serotonerg system (Hermann, 2002).
Dopamin
Concerning the dopaminerg system, structural abnormalities in social phobias were
postulated because of the specific effectiveness of the MAO-inhibitor Phenelzin, an
antidepressant, (Gelernter et al., 1991; Liebowitz, Campeas & Hollander, 1987; Liebowitz et
al., 1992; Versiani, Nardi, Mundim, Alves, Liebowitz & Amrein, 1992), as well as through
results by other pharmacological stimulation (Mikkelsen, Detlor & Cohen, 1981; Stein,
Heuser, Juncos & Uhde, 1990; vanVliet, denBoer, Westenberg, 1992). Slaap and colleagues
found that social phobics reacted positively towards fluvoxamine or brofaromine, a MAO-
inhibitor. Non-responders were characterized by higher heart rate and blood pressure as well
as higher scores on several psychometric scales (Slaap, vanVliet, Westenberg & denBoer,
1996). Potts and Davidson (1992), as well as Tiihonen and colleagues, who included
controls in their study found via single-photon-emission-computed-tomography, a
diminished density of receptors (Potts & Davidson, 1992; Tiihonen, Kuikka, Bergström,
Leopola, Koponen & Leinonen, 1997). Schneier and colleagues found a reduced dopamine
bonding (Schneier, Liebowitz, Abi-Dargham, Zea-Ponce, Lin & Laruelle, 2000). Johnson
and colleagues could show a lower level of the primary dopamine metabolite, homovanillin
(Johnson, Lydiard, Zealberg, Fossey & Ballanger, 1994). Diminished activity of the
dopaminerg system can be seen best of all as a biological marker and specific for social
phobia, as this could not be found in other anxiety disorders, except to some extent in
specific phobia. However, alternatively this could also be seen as a correlate of comorbid
depression, as in many studies it remains unclear if they controlled for dysthimic disorder or
subclinical depression (Hermann, 2002; Kestler, Malhotra, Finch, Adler & Breier, 2000;
Parsey et al., 2001). Recently, the activity of the dopaminerg system as a neurobiological
correlate of so called extraverted behavior that can be characterized by active search for
interpersonal contact, little shyness, and a tendency towards dominant behavior and the
seeking for new stimuli in general, is discussed (Cloninger, 1994; Depue & Collins, 1999;
Hermann, 2002).
Theory 20
2.2.5.4 Autonomic nervous system
Due to the positive effects beta-blockers have in the treatment of social phobia, the
hypothesis of an elevated reactivity of the autonomous nervous system is discussed. There
are two methods of examining this hypothesis: first, autonomic reactions are measured
during confrontation with social anxiety provoking stimuli, which does not allow a direct
conclusion about functional reactivity, because it is confounded with the effect of the anxiety
provoking stimuli. Results are inconsistent concerning public speaking tasks. Beidel and
colleagues could show that social phobics compared to controls had a higher systolic blood
pressure and an elevated heart rate, in a high but not in a low performance task (Beidel,
Turner & Dancu, 1985). Further, social phobics show an elevated heart rate and systolic
blood pressure in conversations with partners of the opposite but not of the same sex. In this
context, the authors themselves point out that public speaking, in general, is correlated with
an elevated physiological arousal, so that these results do not allow a direct conclusion about
functional reactivity (Beidel, Turner & Dancu, 1985).
The second method to examine the hypothesis of an elevated reactivity of the autonomous
nervous system is via functional measurement of the autonomous system, the dysregulation
of the sympathetic or the parasympathetic nervous system as a biological marker of social
phobia (Hermann, 2002). Results of the already above mentioned studies concerning density
of beta-adrenerg receptors, infusion of adrenalin as well as levels of adrenalin and
noradrenalin point towards a normal activity of the autonomous nervous system.
Accompanying symptoms of social phobia, like blushing and feelings of embarrassment, are
discussed as being correlated with psychophysiolgical reactivity that is characterized by a
dominance of the parasympathetic nervous system (Buss, 1980; Leary, Rejeski, Britt &
Smith, 1996; Strom & Buck, 1979). However, the assumed role of the parasympathetic
branch of the nervous system could be disproved (Drummond, 1997) and respiratory
sinusarrhythmie, as an indicator for parasympathetic activation show that embarrassing
situations are correlated with a reduced parasympathetic activity not only in social phobics,
but also in controls (Gerlach, 1998; Gerlach, Wilhelm & Roth, 2003). The few studies that
exist due to psychophysiological changes in embarrassment show rather a sympathetic
activation, which is shown in an accelerated heart rate and increased skin conductance
(Gerlach, Wilhelm & Roth, 2003). For instance, Drummond (1997) could show that blushing
is caused by a sympathetic mediated active vasodilatation, which can be reduced by the
administration of beta-blockers. However, Stein and colleagues found a normal
Theory 21
cardiovascular response in generalized social phobics in a series of autonomic function tests
(Stein, Asmundson & Chartier, 1994). Gerlach and colleagues differentiate social phobics
into those who complain about their blushing symptoms and those who do not. Both groups
blush with equal intensity, but those who are complain about this symptom show a higher
heart rate, possibly reflecting a higher arousability of this subgroup (Gerlach, Wilhelm &
Roth, 2003).
In sum, a general elevated reactivity of the autonomous nervous system in social phobia is
discussed controversially, but seems to be rather unlikely (Hermann, 2002), although
possible differences in sympathetic activation regarding subgroups of social phobia requires
further investigation. After having presented a detailed background on characteristics of
social phobia as a clinical or maladaptive phenomena and after having presented an
evolutionary and biological perspective on the disorder, the question remains how social
phobia can be explained and integrated in the theoretical perspective of Lang’s fear network
model.
Theory 22
2.3. The network model and social phobia
2.3.1 Characteristics of the network
In the following, features of the network with regard to social phobia will be explained. The
network can be defined as a unit, a so-called prototype, which consists of various subunits,
so-called propositions2.These propositions contain mainly three types of information that are
represented in memory: first, sensoric information about an external stimulus and the context
in which this stimulus emerges (Lang, 1994, 1985, 1988; Lang, Cuthbert & Bradley, 1998).
Applied to social phobia, a possible stimulus could be “to present a paper” and the context “a
group of colleagues”. A second type of information that is represented in memory relates to
the reaction towards the stimulus and the context, which are stored as procedural knowledge.
This type of information includes not only thoughts and verbal statements, but also visceral
reactions (Lang, 1994, 1985, 1988; Lang, Cuthbert & Bradley, 1998). Concerning social
phobia, this information could consist of the following contents: verbal statements could be
characterized by stuttering or incomplete sentences. Thoughts, like “this is so embarrassing”
or “ I feel inferior” could enter one’s mind. Visceral reactions can be characterized by
accelerated heart beating, trembling or sweating. A possible action would be to stop the
presentation and to leave the room. The visceral reactions do not only determine the entire
physiological activation or arousal, but they are also closely connected to motivational
circuits, that in turn regulate motor programs and concrete actions. Third, information about
the significance, that stimulus, context and reactions towards them have and which are stored
as declarative knowledge in memory (Lang, 1994, 1985, 1988; Lang, Cuthbert & Bradley,
1998). Referring again to the above mentioned example of social phobia, thoughts like
“presenting papers in front of a group is embarrassing” or “if my heart beats so fast, I
experience fear” can occur. Concerning the encoding of fear memories, one should consider
that parts of the information is not coded linguistically, especially stimulus and response
information and also that associative connections within the fear network can be formed
independently of language (Cuthbert, Lang, Strauss, Drobes, Patrick & Bradley, 2003).
Below, conditions under which the network can be activated as well as neuronal structures
that are assumed to be involved in this activation are presented, first for anxiety in general
and then followed by social phobia in specific.
2 The construct of a prepositional network originally stems from Pylyshyn (1973).
Theory 23
2.3.2 Neuronal structures involved in the activation of the fear network
Neuronal substrates of emotions and therefore of the emotional network are directly located
in the brain. Their function is to organize responses triggered by stimuli. For memory and
expression of emotions the neocortex seemed to be involved, whereas processes that are
related directly to the intensity and quality of emotions can be located in the subcortex and
the hypothalamic-limbic system, mainly in the amygdala a structure that includes various
nuclei (Öhman & Birbaumer, 1993). One of these nuclei of the amygdala, the basolateral
nucleus plays an important role, as it receives input from the thalamus, the hippocampus and
the cortex and projects to the central nucleus of the amygdala and the lateral bed nucleus of
the stria terminalis, as a part of the extended amygdala. These projections, that are described
in more detail below, trigger mainly autonomic and somatic signs of fear and anxiety, as
well as attention to significant stimuli. Davis and Lang (2001) suggest, that emotional face
recognition requires, in particular, activation of the basolateral nuclei of the amygdala. This
activation might occur without a coincident transmission of the central nucleus. Amygdala
lesions in neurological patients suggest the presence of an emotional deficit, like impairment
of emotional face recognition (Anderson & Phelps, 1998; Broks et al., 1998; Lee et al.,
1998; Young et al., 1995) and Morris and colleagues found reduced skin conductance and
low arousal ratings to unpleasant emotional pictures (Morris et al., 1991). Based on imaging
and neurological finding, (for and overview see Davis & Lang, 2001), further projections
from the basolateral nucleus of the amygdala to the dorsal and ventral striatum are assumed
to be responsible for instrumental approach or avoidance behavior, whereas projections to
the hippocampus influence memory consolidation of emotional events. Projections to the
orbital frontal cortex seem to be involved in choice behavior and eventually also in memory
of emotional events (for details see Davis & Lang, 2001). Perceived threat input or
nociceptive input, in terms of fear and fear conditioned stimuli, proceed from the sense
receptor system either via the sensory cortex to the sensory thalamus or directly to the
sensory thalamus (Lang, Cuthbert, Bradley, 1998; LeDoux, 1990), as lesions of the sensory
cortex do not block fear conditioning for instance. The sensory thalamus sends signals to the
lateral nucleus of the amygdala which in turn transmits them to the amygdala’ s central
nucleus. From there three important efferent connections can be distinguished: first, a
projection from the central amygdala to the lateral hypothalamic area, that mediates the
autonomic emotional response and leads to increases in skin conductance, blood pressure,
tachycardia, paleness and pupil dilatation. Lesions of the lateral hypothalamus block the
autonomic response in fear conditioning. Second, projections to the mid-brain central gray
Theory 24
region that mediates coping behaviors, like active defense, flight and fight, which seemed to
be triggered via the dorsal part of the central gray (White & Neuman, 1980) and behavioral
freezing, as well as social interaction, which seemed to be triggered via the ventral central
gray. Lesions of the ventral gray therefore attenuate freezing, whereas dorsal lesions enhance
it. Third, a direct projection to the nucleus reticularis pontis caudalis modulates the startle
circuit (see Lang, Cuthbert, Bradley, 1998; Davis, Walker & Lee, 1997 and paragraph
2.4.2.6). For more details concerning inputs, outputs and intra-amygdala connections see
Bradley, 2000). Further, Mc Naughton and Gray (2000) assume a so-called behavioral
activation system versus a behavioral inhibition system, with the first mediating reactivity to
motivationally relevant stimuli, including fight-flight reactions and the latter mediating
passive avoidance and approach-avoidance conflict. The amygdala circuit described by
Davis and Lang (2001) can be interpreted as the activation system mediating fear responses
and the septal-hippocampal circuit mediating the suppression of approach and the avoidance
of threat. Fowles (2000) assumes a parallel between the distinction of fear and anxiety
Barlow (1988) made and the behavioral inhibition and activation system.
Concerning social phobia, Birbaumer and colleagues could show that social phobics already
show a significant amygdala activation as a reaction to the presentation of neutral faces
(Birbaumer et al., 1998; see also Büchel & Dolan, 2000; Dolan & Morris, 2000; Rolls,
1992). This would also explain empirical data on the tendency social phobics have to
evaluate faces more negatively in general (Mansell & Clark, 1999). The activation of the
amygdala through a conditioned stimuli also influences the prefrontal cortex (Garcia,
Vouimba, Baudry & Thompson, 1999). Schneider and colleagues conclude from the results
of a functional-magnetic-resonance-imaging study that in social phobics conditioned
aversive stimuli with neutral faces as conditioned stimuli and negative odors as
unconditioned stimuli, are processed in subcortical regions, as opposed to controls which
showed a decrease in these areas during habituation and extinction (Schneider et al., 1999).
Bell and colleagues (1999) found within a positron-emissions-tomography (PET) study, that
through an anxiety provoking task, social phobics and controls showed an elevated
activation in the thalamus, the insular cortex and the anterior cinguli cortex, as well as a
diminished activation in the medial frontal cortex and the visual associative cortex. In
addition, social phobics showed an elevated activation of the dorsolateral prefrontal cortex,
which is often seen in the context of emotion regulatory processes (Hermann, 2002). Tillfors
and colleagues (2001) conclude that anxiety-provoking tasks might lead to a stronger
subcortical activation in social phobics (Tillfors et al., 2001). Their subjects, social phobics
Theory 25
versus controls, had to confront a private versus public speaking task. The results of the PET
showed a more elevated activation of the amygdala and a reduced activation of cortical
areas, like the orbifrontal and insular cortices, the temporal cortex and parietal and secondary
visual cortices during the public speaking task for social phobics compared to controls. In
addition, controls showed an increased blood flow in perirhinal and retrospinal cortices. The
authors concluded that the increased subcortical activity in social phobics and the increased
cortical activity in controls may represent the activation of a phylogenetically older danger-
recognition system in social phobics (Tillfors et al., 2001). Davidson (1992, 2000) concludes
on the basis of studies on lesions and electrophysiological data, that the activation of the left
prefrontal cortex can be seen as a neuronal substrate of approach behavior, whereas the
activation of the right prefrontal cortex can be seen as a substrate of avoidance, behavioral
inhibition and a general negative affect. Social phobics indeed reacted towards a public
speaking task during anticipation and preparation phases, with a more elevated right versus
left sided brain activation in the frontal and anterior-temporal regions in the
electroencephalogram, (Davidson, Marshall, Tomarken & Henriques, 2000). It remains
unclear if there exists a relation between this frontal right-left asymmetry and the activation
of subcortical structures, like the amygdala. But the activation of the postulated avoidance
behavior system could also explain findings on elevated vigilance and selective attention in
social phobics (Heinrichs & Hofmann, 2001; Hermann, 2002). In general, these studies must
be criticized in terms of lacking comparable conditions, so it remains unclear if there exists a
stimulus specific, that means reduced to social stimuli, or a general sensitizing of neuronal
anxiety networks, and if this higher excitability can be seen as a consequence of aversive
learning experience (Hermann, 2002).
Below, characteristics of stimuli and conditions, like experimental paradigms, that can lead
to the activation of the fear network as well as an integration of behavioral-cognitive
approaches due to social phobia and the activation of fear networks in social phobia are
presented.
2.3.3 The activation of the fear network
Anxiety and fear as emotions are activated when the whole network, and therefore, the
neural circuits described above are activated by primary reinforcement. In general, it is
sufficient to activate a certain number of propositions and the whole network will be
activated according to the principle of Hebb’s (1949) cell assembly. The probability of
activation is higher, if more units are activated and the resulting arousal depends on the
Theory 26
associative strength of the network in general and the associative strength to subcortical units
in the brain (Davis & Lang, 2001; Lang, Cuthbert & Bradley, 1998). Although vicarious
stimuli, like language representation and cognitive appraisal processes can serve as stimuli
that can trigger the activation of the network, the process of activation does not necessarily
depend on language and consciousness, as rapidity of emotional reactivity and sometimes
their irrational quality show (Davis & Lang, 2001; Lang, Cuthbert & Bradley, 1998; Lang,
Davis & Öhman, 2000; Öhman & Mineka, 2001). Morris and colleagues could show that
after a successful conditioning process even a subliminal presentation of conditioned stimuli,
for example, angry faces, could induce an activation of the amygdala, although the
processing of the stimuli is clearly unconscious (Morris, Öhman & Dolan, 1998). This can
serve as an explanation why anxiety patients often experience feelings of anxiety and fear
without necessarily perceiving the triggering stimuli and might be relevant for social
phobics, as they are confronted with many aversive stimuli simultaneously, because social
situations are complex, for example nonverbal behavior, facial expression etc. Öhman and
Mineka (2001) explain this by a model that assumes an underlying fear module concerning
the activation of networks that are related to anxiety and fear, emphasizing that the activation
of this module is selective concerning the input, automatic in terms of initiating the activity
and encapsulated in terms of maintaining the activity. This means that once the module is
activated, it runs with few possibilities to interfere or stop it. In addition, it is relatively
impenetrable to cognitive control once it is activated, so that the authors assume, that it
mediates an emotional level of fear learning that is relatively independent and dissociable
from cognitive learning of stimulus relationships (Öhman and Mineka, 2001).
However, as neural circuits also have reciprocal connections, not only to subcortical and
primitive cortex, but also to the cerebral cortex, the circuit can modulate ongoing cognitive
processing and in this way, stimuli that are highly processed, like memories or associations,
can become activating input (Bradley & Lang, 2000; Davis & Lang, 2001; Lang, Davis &
Öhman, 2000). As the neuronal circuits underlying the fear network are plastic, which means
they learn (Bradley & Lang, 2000), new and also complex stimuli can activate the network
through associations with primary reinforcers. This explains why even the presentation of
sensoric information, like pictures, film clips, sounds or alternatively the imagination of
previously presented text passages or pictures can lead to an activation of the network
(Bradley, 2000). Within the so-called picture paradigm subjects view a set of slides that
contain several semantic categories (IAPS; Lang, Bradley & Cuthbert, 1999), which are
supposed to evoke different types of emotions, that coincide with the proposed biphasic
Theory 27
organization of emotion. Within the imagery paradigm, subjects have to mentally generate
an emotionally evocative event based on a text cue, for example a narrative script or a
perceptual cue, such as a film clip or a picture (for more details see paragraphs 2.4.3 and
2.4.4).
In sum, this principle of associations through learned stimuli and their meaning can serve as
triggers which activate the fear network, allowing the integration of theoretical models and
empirical findings concerning behavioral-cognitive aspects within social phobia. This might
be useful to understand what the conditions are under which these associations are formed
and maintained. In this context with regard to Lang’s (1994) model, aspects of behavioral
approaches would typically refer to characteristics of stimuli components and their
associations in the network through conditioning processes, whereas cognitive approaches
would emphasize, in addition, meaning components, including their associations to response
components.
2.3.3.1 Behavioral approaches
The first behavioral concepts referring to social phobia emphasized conditioning processes
due to more or less traumatic stimulus-response-associations that refer to social contexts, for
example being teased (Öst & Hugdahl, 1981; for an overview see Stangier & Fydrich, 2002).
Based on Pavlov’s (1927) theory, Salter (1949) describes social a nxiety as a consequence of
imbalanced activation- and inhibition processes, that impair the spontaneous expression of
feelings and needs. The two-factor-theory of Mowrer (1947, 1960) describes the etiology of
phobias as a classical conditioning process, where neutral stimuli are associated with an
unpleasant event that is associated with a state of fear and anxiety. Operant conditioning
processes lead to the reinforcement of this anxiety through the avoidance of stimuli. Also
Wolpe (1958) understood social anxiety as a consequence of conditioning processes, that
should be treated by reciprocal inhibition through practicing alternative behavior. His
approach led to the development of the so-called self-assertiveness training. Criticism
towards this treatment approach and the integration of aspects of the social learning theory,
led to the view, that social anxiety could also be seen as a consequence of a deficit according
to social competency and a lack of effective models, as well as a lack of reinforcement of
self-assertive behavior. Therefore, training of competencies became the focus in treating
social anxiety (Trower, Bryant & Argyle, 1978). Criticism of the social deficit approach was
based on findings that competency deficits are not characteristic for all persons suffering
from social phobia, but rather for persons diagnosed with avoidant-personality disorder
Theory 28
(Stangier & Fydrich, 2002). Further, social phobics are often better characterized by the
suppression of rather than by an actual lack of social skills (Rapee, 1995).
More recent studies regarding the recall of conditioning experiences do not allow a clear
conclusion concerning the role associative mechanisms have in the development and
maintenance of social phobia (Hermann, 2002). Neither do they explain why aversive
learning experiences are preceded by social anxiety in some patients (Hofmann, Ehlers &
Roth, 1995), nor why not all social phobics report traumatic experiences, or those who report
these experiences did not develop social phobia (Menzies & Clarke, 1993, 1995; Davey,
1989; White & Davey, 1989). It can be assumed due to the results of Townsley (1992), that
traumatic conditioning experiences are more typical for specific social phobia, whereas
generalized social phobia is not associated consistently with unique learning experiences
(Hermann, 2002). Classical behavioral approaches that emphasize primarily the role of
temporal contingency between a conditioned stimulus and an unconditioned one, can not
explain on the one hand, why certain stimuli seem to be more readily associated and learned
than others, which is better explained by the so-called preparedness theories under an
evolutionary perspective (see paragraph 2.2.4 and also for example Öhman & Dimberg,
1978, Hermann, 2002). On the other hand, they do not explain, what influences cognitive
processes have on these conditioning processes and why anxiety reactions are so variable in
terms of intensity and occurrence. Therefore, the role cognitive aspects, interpreted mainly
as the meaning component in Lang’s model (1994), have in the acquisition and maintenance
of social phobia, will be presented in the following paragraph.
2.3.3.2 Behavioral cognitive approaches
Behavioral cognitive approaches emphasize the role of cognitive components and processes
of attribution and appraisal within anxiety. Barlow (2002) emphasizes the importance of
false alarms in this context, that means that anxiety and fear is experienced due to a
misinterpretation of social situations, that are perceived as more threatening in terms of
being judged or evaluated by others in a negative way than they are. Social phobia, seen as a
result of dysfunctional cognitive schemata and incorrect information processing, often
develops through negative experiences in early adolescence, when social skills are not yet
fully developed and the social behavior repertoire is overtaxed (see Beck, Emery &
Greenberg, 1985). Even if social skills are developed appropriately later, dysfunctional
schemata can be maintained that characteristically refer to the overestimation of the
evaluation by others (Marks & Gelder, 1966; Marks, 1969) and the view that others are
Theory 29
always very critical in their evaluation or the incompetence of the self, resulting in the
perception of being exposed to uncontrollable internal and external dangers. This leads to a
lack of self-confidence and a selective, excessive self-focused attention, incorrect memory
processes and misattributions (see for instance, Panayiotou & Vrana, 1998) of physical
symptoms, as well as safety behavior, which in turn confirm the negative schemata in terms
of self-fulfilling prophecies (Beck & Emery, 1985; Stangier & Fydrich, 2002). In the
following passage, several cognitive models that are crucial for the understanding of
processes occurring in social phobia are presented in more detail.
The model of Clark and Wells (1995)
Clark und Wells (1995) assume that social phobics develop assumptions about themselves
and their social world as a consequence of the interaction of previous experiences and innate
behavioral predispositions (for further details see also the diatheses-stress model of Juster,
Brown & Heimberg, 1996). Therefore, social situations make them belief that they are in
danger of behaving in an unacceptable fashion that will have disastrous consequences, which
in turn may lead to loss of status, worth or rejection. They tend to interpret ambiguous social
situations in a negative fashion and to catastrophize in response to unambiguous, mildly
negative social events (Amir, Foa & Coles, 1998; Beck, Emery & Greenberg, 1985; Clark &
Wells, 1995; Dodge, Hope, Heimberg & Becker, 1988; Stopa & Clark, 1993; Stopa & Clark,
2000). This processing style is clearly maladaptive, and has to be seen in the light of a
reduced processing of external sources and stimuli (Mansell & Clark, 1999). First, this
process is triggered by a shift in attention towards themselves, second, reinforced by the
misinterpretation of somatic and behavioral symptoms, like blushing or trembling, which
also interfere with the ability to process social cues in a more appropriate way (see for
instance Roth, Antony & Swinson, 2001; Johansson & Öst, 1982; Wells & Papageorgiou,
2001). The use of so-called safety-behavior, for example rehearsing a speech in great detail
and speaking very quickly, can be problematic for two reasons. It prevents social phobics
from experiencing an unambiguous disconfirmation of their beliefs about the feared behavior
or its consequences; and it can make the feared behavior more likely in some instances
(Salkovskis, 1991; Wells, Clark, Salkovskis, Ludgate, Hackmann & Gelder, 1995; for more
details see also Adlen & Beiling, 1998; Clark & Wells, 1995; Curtis & Miller, 1986; Lundh
& Öst, 1996; Rachman, Grüter-Andrew & Shafran, 2000; Rapee & Lim, 1992; Stopa &
Clark, 1993; Velajaca & Rapee, 1998). Third, this processing style is maintained by a
maladaptive bias in recalling social situations (Clark & Wells, 1995; for more details and
Theory 30
empirical evidence towards the model see Arntz, Rauner & van den Hout, 1994; Bruch,
Heimberger, Berger & Collins, 1989; Bruch & Heimberg, 1994; Clark & Ehlers, 2002; Clark
& McManus, 2002; Hirsch, Clark, Mathews & Williams, 2003; Hope & Heimberg, 1988;
Mansell, Clark & Ehlers, 2003; Mellings & Alden, 2000; Musa, Lépine, Clark, Mansell &
Ehlers, 2003; Saboonchi, Lundh & Ost, 1999; Spurr & Stopa, 2003) and in recalling
negative self-related information compared to external information, often from an observer
perspective (Coles, Turk, Heimberg & Fresco, 2001), impaired recall for details of a social
situations, as well as the avoidance of similar social situations (Daly, Vangelisti &
Lawrence, 1989; Hope, Heimberg & Klein, 1990; Kimble & Zehr, 1982; Mellings & Alden,
2000; Rachman, Grüter-Andrew & Shafran, 2000; Wells, Clark & Ahmad, 1998).
The model of Rapee and Heimberg (1997)
Rapee and Heimberg (1997) propose a model very similar to the model of Clark and Wells
(1995) and include aspects of Strauman’s (1989) conclusions that social phobics have the
greatest discrepancy between their actual and ought-self/ other-self states and that these self-
discrepancies are likely to induce emotional discomfort. They also emphasize anxiety as a
consequence of expected failure in self-presentation and therefore, the importance of self-
focused attention and the activation of mental representations of the self, which is influenced
by pre-existing memory cues, somatic, cognitive and behavioral symptoms and the
expectancy of being evaluated negatively and rejected by others. In contrast, Rapee and
Heimberg (1997) put more emphasis on the assumed standards of potential observers and the
input that comes from the actual social situation, namely, social feedback in the form of
verbal and non-verbal signals from the audience, which interacts with the mental
representation. This process leads to a comparison of the mental representation of the self
and the performance, as seen by the audience, with an appraisal of the standard the audience
is expected to have (Schlenker & Leary, 1982; Wallace & Alden, 1991). Concerning the
appraisal of likelihood and consequences of negative evaluation, there is a tendency to
assume that negative evaluation is likely in any social situation, which is reflected partly in a
negative response bias (see Leary, Kowalski & Campbell, 1988; Winton, Clark & Edelmann,
1995) and partly in consistently higher scores on questionnaires of fear of negative
evaluation in social phobics (see Heimberg, Hope, Rapee & Bruch, 1988). A few studies
demonstrate that high socially anxious individuals report a greater expectancy for negative
occurrences, and greater cost regarding these occurrences for themselves than do low
anxious (see for example Foa, Franklin, Perry & Herbert, 1996; Poulton & Andrews, 1994).
Theory 31
But this prediction depends also on the audience’s characteristics as well as on situational
factors. For example, greater anxiety may be experienced in formal situations and opposite
sex interactions (Dodge, Heimberg, Nyman & Brien, 1987; Turner, Beidel, Dancu & Keys,
1986). Also, size and perceived importance of the audience and the perception of the
positive attributes of interaction partners are influential factors with respect to the
performance standard the individual predicts that the audience holds for him or her (Latane,
1981; Mahone, Bruch & Heimberg, 1993).
The model of Schlenker and Leary (1982)
Similarly, Leary and colleagues emphasize in their self-presentation approach the
importance of a perceived mismatch between one’s own standards, needs of
acknowledgement, or inadequate social skills and the impression that social phobics want to
make on others (Leary & Kowalski, 1995; Schlenker & Leary, 1982). Social anxiety occurs
when two conditions concur, namely, the person is motivated to make a particular
impression on other people, but doubts simultaneously that he or she will be able to make the
desired impression successfully (DePaulo, Epstein & LeMay, 1990; Maddux, Norton &
Leary, 1988; Mahone, Bruch & Heimberg, 1993). The concerns of social phobics about
other’s impressions may vary: concerns may refer to being excessively preoccupied with
obtaining social approval from others, which may reflect a very high motivation to make a
particular impression or they can refer to negative evaluations of oneself due to the doubts of
being able to make that impression.
In sum, behavioral-cognitive approaches towards social phobia can be integrated in the fear
network model in so far as assumptions that are made in these approaches can be related to
the propositions of the network and their associations. The question remains, how this
activation can be measured in the different response systems.
Theory 32
2.4. Measurement of the three response systems
As the three response systems, language, physiology and behavior do not have a common
metric and as they vary in reliability due to differences in their sensitivity to the context and
stimulus modality, due to differences in their vulnerability to independent shaping and due to
differences in their characteristics of temporal integration, there are only low correlations
among these three systems and therefore, emotion, and also fear and anxiety, can not be
defined by a single subsystem measure (Bradley & Lang, 2000; Lang, 1968; Mandler,
Mandler, Kremer & Sholiton, 1961). So it is important to take into account all three
components of emotion. In human research, aspects of overt behavior, like expressive
language or vocalization measures, as well as performance measures, for example reaction
time, and facial expression can be measured. (Bradley, 2000). Physiological measurement
includes peripherphysiological parameters like heart rate, skin conductance and
electromyographical activity, cortical measurements, such as electroencephalogram and
magnetencephalogram, as well as neuroimaging techniques, like functional magnetic
resonance imaging and positron-emissions-tomography. As this study deals exclusively with
peripherphysiological parameters concerning physiological measurements, for other types of
measurement see, for example, Bradley, Greenwald & Hamm, 1993b; Bradley & Lang,
2000; Cacioppo, Tassinary & Berntson, 2000; Crites & Cacioppo, 1996; Cuthbert et al.,
1999; Paloma et al., 1997). Subjective report of affective experience refer to verbal
descriptions, ratings of emotions or reports of physiological responses (Bradley, 2000). In
the following, affective report and peripherphysiological responses are presented.
2.4.1 Affective report
Bradley and Lang (2000) could show that the affective report on the dimensions of valence
and arousal due to picture stimuli can be presented as a boomerang-shaped distribution
within a two-dimensional affective space defined by mean ratings of pleasure and arousal. It
seems that the degree of arousal is uncorrelated with the pleasantness of pictures as pleasant
pictures range continuously along the arousal dimension. However, the degree of arousal
seems to be associated with the unpleasantness of pictures, as there are fewer highly
unpleasant pictures located within low arousal. Pictures that are neutral in valence do not
achieve the high levels associated with pictures pleasant or unpleasant in valence. A third
dimension, which accounts for the least variance in affective judgment, namely dominance,
reflects the subject’s feeling of control, where judgments of high dominance are assoc iated
Theory 33
with having maximum control in the situation, with unpleasant material lower in control than
pleasant and neutral (Bradley & Lang, 1994).3 Differences concerning these patterns,
especially the correlation between pleasantness and arousal, are observed in men and
women, as well as over lifespan and in patients with ablation of right amygdala (for details
see Bradley & Lang, 2000). Vila and colleagues could show that the above mentioned
characteristics due to valence and arousal for these pictures could be replicated in a Spanish
sample and that values of the Spanish and US-American sample were highly correlated, even
given that the Spanish sample rated the pictures as more arousing and less dominant (for
details see Moltó et al., 1999; Vila et al., 2001).
Affective report to text or auditory stimuli during imagery can be assessed similarly, and
several studies show similar patterns of valence and arousal due to scripts that are also found
in pictures (see for example Cuthbert, Lang, Strauss, Drobes, Patrick & Bradley, 2003).
Concerning the imagery paradigm, neither a standardized stimuli set in use exists nor a priori
norms of valence and arousal.
2.4.2 Physiological responses
Physiological reactivity can be assessed either on the basis of an a priori grouping of stimuli,
for pictures see, for example, the norms of the IAPS, the International Affective Picture
System (IAPS-Lang, Bradley & Cuthbert, 1999) or by self-report of pleasure and arousal by
subjects during the psychophysiological assessment (Bradley & Lang, 2000). In the
following, electrodermal activity, heart rate, blood pressure, respiration, electromyography
and startle reflex are presented referring to their underlying neuronal connections and the
disadvantages and advantages of their measurement. As most of these parameters are closely
linked to the autonomous nervous system, Bernston and colleague’s theory of autonomic
control should be mentioned, which assumes that physiological measures are dually
innervated end organs (Bernston, Cacioppo & Quigley, 1991). For example heart rate or skin
conductance may differ in function and weighting of activation in the sympathetic and
parasympathetic system. The two systems can be independently active, reciprocally
controlled or coactive (Bernston, Cacioppo & Quigley, 1991; Bernston et al., 1994; Quigley
and Bernston 1990).
3 In this context it should be mentioned, that control can be seen as a universal need pertaining to a reduction of uncertainty and a maximization of certainty for the individual (see DeCharms, 1968; White, 1959). There exist numerous further constructs of control (Skinner, 1996), developed in following Rotter’s (1966) concept of the locus of control, that differentiates between internal and external control, which is often interpreted as equivalent to perceiving a feeling of control versus a feeling of being out of control.
Theory 34
2.4.2.1 Heart rate and heart rate variability
The electrocardiogram, abbreviated in the following as ECG, is the printed record of the
electrocardiography, the measurement of electrical activity of the heart. Electrical activity is
related to three types of tissue: the sinoatrial node or pacemaker cells, where initial impulse
begins and which triggers the contraction of the entire heart. These impulses pass through
the atria to the atrioventricular node, and lead the atrial muscle to depolarize, which
represents in the ECG the P wave. Second, through contraction of the atria a depolarization
interval begins, where blood is being passed in the ventricle. Then the impulse is passed
through the bundle of His and into the Purkinje network, which results in depolarization of
the ventricles and blood being pushed through lungs and body. This depolarization is
represented by the so-called QRS wave. Third, repolarization of the ventricles is represented
by the T wave in the ECG. The two commonly used measures of cardiac activity are heart
rate, defined as number of beats per time period and measured in the amount of R
components, usually per minute and interbeat interval, the inverse function of heart rate,
defined as time measured between R waves (Stern et al., 2001; Vila, 2000). An additional
parameter, whose functional significance will be explained below, is the so-called heart rate
variability, measured for example in the square rooted successive difference mean of heart
period (see Thayer & Siegle, 2002; vanSteenis, Martens & Tulen, 2002).
The heart is innervated by the sympathetic and parasympathetic nervous system. In general,
the parasympathetic system reduces, whereas the sympathetic system increases heart rate
activity, the force of contraction and affects pumping functions (Stern et al., 2001; for details
see Brownley, Hurwitz & Schneiderman, 2000). Central pathways, that are involved in heart
rate activity and circulation in general and therefore also in the below described blood
pressure and pulse, are the spinal cord, hindbrain, and within it the ventrolateral medulla,
and the forebrain, especially the hypothalamus and the cerebral cortex. The cerebral cortex
plays an important role in the integration of information, like sensory input, perception and
emotion, that influences blood pressure and heart rate responses. The amygdala is important
in terms of linking stimuli to appropriate emotional responses and is involved, together with
the hypothalamus and the periaqueductal gray in the regulation of cardiorespiratory
components of the defense and vigilance reactions (Brownley, Hurwitz & Schneiderman,
2000). Thayer and Siegle (2002) assume a so-called central autonomic network whose
output is directly linked to heart rate variability. This network includes prefrontal and limbic
structures, which are reciprocally interconnected and are mediated through sympathetical
Theory 35
and parasympathetical neurons that in turn innervate the heart via the vagus nerve (for
further details see Thayer & Siegle, 2002). This network is assumed to be under tonic
inhibitory control triggered by the neurontransmitter GABA.
One disadvantage of measuring heart rate is that the task of the heart is homeostatic and
metabolic. So, posture, respiration and physical differences, like body weight or fitness, do
influence the ECG measure and can attribute to obscure affective covariation in cardiac
response (Bradley, 2000; Graham, 1979; Lacey & Lacey, 1970). This makes it important to
identify task variables like somatic requirements, for example. On the other hand, heart rate
measure provides interesting information due to emotional processes, as there exist a
positive correlation between ratings of pleasantness of stimuli and heart rate changes
(Bradley, 2000). Heart rate as index of an emotional state is more ambiguous, because heart
rate changes due to motor preparation and is therefore less strongly related to valence. In
addition, heart rate change varies with the type of mental processing. Acceleration can be
observed during recalling memory for example, whereas deceleration is typical for an
orienting reaction towards an external stimulus (Bradley & Lang, 2000). Concerning heart
rate variability, an interruption of the above mentioned inhibitory control leads to a decrease
in heart rate variability, which can be associated with hypervigilance, the activation of the
defensive behavioral system and a reduced emotional regulation. Therefore, heart rate
variability is not only correlated with stress reactions and depressive symptomatology but
also with anxiety (Thayer & Siegle, 2002).
2.4.2.2 Blood pressure
Blood pressure is defined as the pressure that is on the vascular walls during cardiac activity.
Maximal blood pressure, which is also called systolic blood pressure, occurs, when the
ventricle of the heart contracts. In terms of the ECG it begins with the QRS wave and
includes the T wave until its flattening. This period is followed by a relaxation of the
ventricle, in which blood pressure is at a minimum, also called diastolic blood pressure.
Again in terms of the ECG, this period begins from the flattening of the T wave, including
the P wave until the beginning of the QRS wave. So blood pressure depends on two main
factors, namely the force of the contraction of the heart and the resistance of the vascular
walls. The most widely used indirect measure of blood pressure is the sphygmomanometer.
The Volume Clamp Photopletysmography is a special technique often used within
psychophysiological research (Birbaumer & Schmidt, 1991; Brownley, Hurwitz &
Schneiderman, 2000; Vila, 2000).
Theory 36
Blood pressure as component of the cardiovascular system, has similar neuronal pathways
like the heart rate (for details see Brownley, Hurwitz & Schneiderman, 2000). Similar to
heart rate measure, blood pressure measurement is affected by many factors, like food or
fluid intake, consuming substances such as caffeine, alcohol, nicotine, medications, as well
as temperature, time of day, movements, posture, setting and emotional state (Shapiro et al.,
1996). Concerning the latter, blood pressure seems to be higher during angry or anxious
emotional states compared to positive emotional states (James, Yee, Harshfield & Pickering,
1988; Schwartz, Weinberger & Singer, 1981). Task requirements within an experimental
setting as well as the setting itself can influence blood pressure (Herd, 1984; Siegel,
Blumenthal & Divine, 1990). In addition there are individual characteristics like body
weight, age, gender etc. that might contribute to further variance in blood pressure measures
(Shapiro et al., 1996). In addition, indirect measurement techniques are susceptible to errors
(Brownley, Hurwitz & Schneiderman, 2000).
2.4.2.3 Pulse
The increase of blood pressure during the ventricle contraction continues as a pressure pulse
wave, also called pulse, through the whole arterial vessel system, transmitted from cell to
cell of the vascular walls. The more inflexible the vascular walls are, the faster the wave is
transmitted, so the higher the speed, the steeper the pulse wave. Common measures are the
pulse frequency, which is defined by heart frequency and depends on age, training,
alterations in psychological states and physical movement as well as exercise. Further
measures are the rhythm of the pulse, which are mainly influenced by age and the so-called
respiratory arrhythmia, with higher pulse frequencies during inhalation and lower pulse
frequencies during exhalation, the amplitude and the steepness of the pulse wave. The
amplitude depends on the quantity of the beat volume and the quantity of blood that flows
out during the diastole. The steepness depends on how fast alterations in pressure are. With
constant heart frequency a high pulse is correlated with steeper and faster alterations in
pressure and a low pulse with flater and slower alterations in pressure. Usually, in
psychophysiological research, amplitude is measured, similar to blood pressure, by a
photopletysmograph attached to the subject’s finger (Birbaumer & Schmidt, 1991; see also
Vila, 2000). Here lies also one of the disadvantages the measurement of the pulse has as
well: a low blood circulation leads to errors and failings in recording the pulse. In addition,
like in heart rate and blood pressure, pulse is susceptible to many factors. However, an
Theory 37
advantage of this measurement is that a good quality recording provides a measure from
which heart rate can be estimated if the ECG is not recorded properly for some reason.
2.4.2.4 Respiration
Respiratory activity reflects, unlike other peripherphysiological parameters, voluntary and
involuntary processes, as breath holding for example demonstrates (Agostoni, 1963; Harver
& Lorig, 2000). Depth and rate of breathing influence heart rate and heart rate control,
although no consistent value has been attributed to voluntary control of breathing in
psychophysiological research (Grossman, 1983; Grossman, Karemaker & Wieling, 1991).
However, respiration in general underlies the functioning of systems, that are commonly
investigated within psychophysiological research. Respiration provides oxygen, that for
instance binds with radioactive isotopes to localize mental activity, it serves to predict
metabolically excessive heart rate response (Turner, Carroll & Courtney, 1983), and
energizes muscles to enable the study of responses (Brener, 1987). One of its disadvantages
in physiological recording is, that it is a relatively slow moving response, which requires
sufficient recording intervals to allow a sensible interpretation of recording. However,
respiratory activity is mostly recorded in order to control for the effects respiration has on
the investigation of cardiovascular and electrodermal response in terms of produced “noise”
(Grossman, 1983).
The breathing pattern is regulated by reflexes which are controlled by the brainstem in order
to determine the depth of breathing, duration of the phases of the breathing cycle, which
consists of inspiratory and expiratory time and the lung volume at which inspiration begins
(for details see Harver & Lorig, 2000). Depth of breathing and duration of the breathing
phase can be measured by the chest wall movement provoked by a strain gauge, whereas the
other parameters are normally measured by so-called flow meters and pressure transducers.
Variations in patterns of breathing have to be brought in context with emotional state,
psychopathology and fear responses (Harver & Lorig 2000). Dudley and colleagues
conceptualized the biological significance of ventilatory responses to emotional stimuli and
proposed a model that includes a continuum of response styles (Dudley, Martin & Holmes,
1994; Dudley, Martin, Masuda, Ripley & Holmes, 1969). These response styles range from
action-oriented to non-action-oriented, by changes in respiratory parameters to suggestions
of relaxation, depression, anger, anxiety etc., whereas in this model hyperventilation serves
to prepare the individual to act and hypoventilation serves to conserve energy in non-action
patterns, like in sadness or deep relaxation. Boiten and colleagues state that the most long-
Theory 38
standing interest in respiration within psychology relates to the study of emotion and
affective processes (Boiten, 1998; Boiten et al., 1994) .
2.4.2.5 Electrodermal activity
Alterations in electrodermal activity occur due to changes in the level of sweating activity,
measured typically on the palms of the hand of eccrine sweat glands that might be more
responsive to emotional stimuli than to thermic stimuli (Dawson, Schell & Filion, 2000).
Electrodermal activity includes basal or tonic activity and is labeled as level, versus the
response to a stimulus, which is called phasic and is labeled as response. Measuring skin
resistance or conductance is based on Ohm’s law, which states that skin resistance is equal to
the voltage applied between two electrodes placed on the skin surface divided by the current
being passed through the skin. If the current is held constant, voltage between electrodes can
be measured, which will vary directly with skin resistance. If the voltage is held constant,
current flow can be measured, which will vary directly with the reciprocal of skin resistance,
namely, skin conductance (Dawson, Schell & Filion, 2000). Electrodermal activity reflects
the activation of the sympathetic system, as most parts of the sweat glands are innervated by
the sympathetic nervous system and its action is cholinerg triggered in contrast to most
fibers of the sympathetic system, which are adrenerg triggered, and that in addition, some
adrenerg fibers also exist in close proximity (Bradley, 2000; Dawson, Schell & Filion, 2000;
Shields et al., 1987). Concerning palm sweat, it might also reflect parasympathetic
activation, because these glands are controlled by the hypothalamus, which is involved in
parasympathetic control (Guyton & Hall, 1996).
Electrodermal activity as a relatively slow-moving response system is one of the
disadvantages this measurement has, as the latency of the elicited skin conductance response
is about one to three seconds. In addition, skin conductance responses are not specific to a
single event or situation which requires the control of experimental conditions, to make sure
that only a single process is varied that influences electrodermal activity at a given time
(Dawson, Schell & Filion, 2000). The advantage of measuring electrodermal activity lies in
that it provides a direct representation of sympathetic activity, and its occurrence is quite
discriminable, as with a single presentation of a stimulus it can be determined whether a skin
conductance response had occurred or not. In addition, the electrodermal system should be
most responsive compared to other parameters in terms of reaction towards a stimulus that
elicit anxiety, but in which no active avoidance can be made.
Theory 39
There are three neuronal main pathways assumed for electrodermal activity. The first
involves influences from the hypothalamus and limbic system (Sequeira & Roy, 1993).
Second, cortical and basal ganglion control electrodermal activity, which involves premotor
cortex and frontal cortex. Third, the reticular formation in the brain stem seems to be
involved in electrodermal activity. Concerning affective processes the pathway via the
amygdala seems to be the most important one (Dawson, Schell & Filion, 2000; for more
details see for instance Tranel & Damasio, 1994).
Skin conductance increases in terms of a linear relationship with increasing arousal,
independently from valence, and is higher in pleasant and unpleasant stimuli, because they
also elicit more arousal compared to neutral stimuli (see for example Cook, Hawk, Davis &
Stevenson, 1991; Fiorito & Simons, 1994; Lang et al., 1993; Manning & Melchiori, 1974;
Miller et al., 1987; vanOyen Witvliet & Vrana, 1995; Winton, Putnam & Krauss, 1984). In
sum, skin conductance measure reflects sympathetic nervous system reactivity and
sensitivity to the novelty of the stimulus and the task with a rapid decrease in skin
conductance due to repeated presentation (Bradley, Lang & Cuthbert, 1993c). Concerning
novelty, skin conductance response might reflect arousal due to a kind of orienting response,
rather than to emotional arousal (Bradley, Kolchakian, Cuthbert & Lang, 1997; see also
paragraph 2.4.4).
2.4.2.6 Electromyography, startle reflex and emotional priming
Patterns of bodily reaction to stimulation can also be measured in muscle activity. The
electromyography, in the following abbreviated as EMG, examines the way in which tension
develops within a muscle, the firing rates of particular motor units in relation to the
recruitment of others, and activity which is too small to be observed in movement. So, the
EMG records electrical potentials originating in muscles over time (Tassinary & Cacioppo,
2000; Vila, 2000). Covert skeletomotor activity, which is not available to observation, can be
measured by EMG, that differentiates within and between emotional cognitive processes
(see Cacioppo et al., 1993; Friedlund & Izard, 1983; Tassinary & Cacioppo, 1992), as well
as between normal and clinical populations (Hazlett, Mc Leod & Hoehn-Saric, 1994; Orr &
Putnam, 1993). In the following, the measurement of the rapid eye closure as a component
of the startle reflex in the context of the so-called emotional priming will be explained: one
important aspect of the activation of the motivational sub-systems, is the so-called priming
effect. This means, once the motivational subsystem, appetitive or aversive is activated and
linked to the corresponding subsystem, stimuli and action programs are primed which results
Theory 40
in a higher probability that these representations will be accessed. Stimuli and action
programs linked to the nonengaged subsystem have a reduced probability and strength of
activation (Bradley, 2000; Lang, 1994; Lang, Bradley & Cuthbert, 1997). This priming is
most fundamental on the level of unconditioned reflexes like the startle response, for
example. The startle response can be seen as a defensive reflex that has a protective function,
like the eyeblink, which helps to avoid organ injury and acts as a behavioral interruption.
Rapid eye closure is the most reliable component in the startle reflex and does not interfere
with ongoing foreground tasks.
In humans, eyeblinks potentiate in the context of unpleasant and diminuate in the context of
pleasant stimuli, compared to neutral stimuli and seem to increase with greater arousal
(Bradley, 2000; Bradley, Cuthbert & Lang, 1996; Lang, 1995; Lang, et al., 1990; Lang,
Bradley & Cuthbert, 1998; Schupp, Cuthbert, Bradley, Lang & Birbaumer, 1993; Vrana,
Spence & Lang, 1988). For gender differences see Lang and colleagues (Lang, Greenwald,
Bradley & Hamm, 1993). The emotional modulation of the startle reflex does not depend on
the novelty of stimuli. Although a diminuation of blinks can be observed over several blocks
of trials, in which stimuli are presented, the affective potentiation and inhibition effect
remains (Bradley, Cuthbert & Lang, 1993; Bradley, Gianaros & Lang, 1995; Bradley &
Lang, 2000). The startle reflex seems not secondary to modality-driven attentional processes,
as the same pattern of modulation effect can be observed, whether participants ignore or
attend to the startle probe (Bradley & Lang, 2000; see also Davis & Lang, 2001; Lang,
Bradley & Cuthbert, 1998). Neither it is determined by general arousal or probe modality
(Lang, Bradley & Cuthbert, 1990). The startle can also be used to determine the temporal
course due to emotional processing in picture perception. Picture valence reliably affect
magnitude of the startle as early as 500 milliseconds after picture perception and is
maintained throughout a six-second interval, regardless of whether subjects ignore or attend
the startle probe (Bradley, 1993a; Bradley, 2000).
One advantage of the measurement of the startle response is that it is not under voluntary
control like self-report and behavioral avoidance tests. In addition, this reflex has a non-zero
baseline and allows therefore to separate effects of a treatment on the hypothetical state of
interest. So the startle reflex is a reaction to a probe event that is primed when a specific
state, for example anxiety or fear, is present but it can also be elicited without that specific
state or through other states. A further advantage is, that the startle reflex can be elicited by a
stimulus that can be controlled by the experimenter, so that different levels of responses can
Theory 41
be manipulated. As the startle reflex has a short latency, it is possible to determine its
neuronal pathway that mediates the reflex, which can be a clue for investigating the neural
pathway involved in fear or anxiety. Animal research led to the assumption that the acoustic
startle pathway consists of three synapses onto cochlear root neurons, neurons in the nucleus
reticularis pontis caudalis, and motoneurons in the facial motor nucleus or spinal cord (Lang,
Davis, Öhman, 2000). Bower and colleagues found that epilepsy patients with anterior
temporal resections, including the amygdala, showed a significant relationship between a
reduced base startle magnitude and the extent of the amygdala loss. There might be a double
dissociation in affective modulation of the startle, which in humans may depend on both
laterality and type of task (Bower et al., 1997). Funayama (in press) showed, that epilepsy
patients, with resection of the right temporal lobe failed to show increased startle when
viewing highly unpleasant, arousing pictures, but showed startle potentiation when exposed
to a light-shock paradigm, whereas patients with a resection of the temporal lobe showed the
opposite pattern. Again, the amygdala seems to be an important neuronal structure
influencing the startle reflex.
In sum, the magnitude of the startle reflex is sensitive to differences of valence as an
important aspect of emotion, during picture perception as well as during imagery (for details
see paragraph 2.4.4 and 2.4.5). Therefore, the assessment of the startle probe reveals
information that serves in clinical assessment, diagnoses and also treatment outcome
(Bradley & Vrana, 1993).
Taken together the most important aspects of the measurement of the response systems,
results of factor analysis due to physiological reactions, behavior and self-report reveal two
factors hypothesized above as defining emotion: valence and arousal. One factor, valence,
shows high loadings for pleasantness ratings in self-report, heart rate change and startle
reflex. The other factor, namely arousal, loads highly on high ratings of arousal in self-report
and skin conductance (Bradley & Lang, 2000; see also Bradley, Codispoti, Cuthbert & Lang,
2001; Bradley, Codispoti, Sabatinelli & Lang, 2001; Greenwald, Bradley, Cuthbert & Lang,
1998; Greenwald, Cook & Lang, 1989). For gender differences towards this response see,
for example, Bradley and colleagues (Bradley, Codispoti, Sabatinelli & Lang, 2001). It
should be considered, that these correlations are found in a controlled and constraint context,
as an experimental setting, as the picture or imagery paradigm can provide. In the following,
a correlation is explained, that can be found between heart rate, skin conductance and startle
Theory 42
reflex due to an aversive stimulus, mostly an unpleasant loud tone. This correlation between
these parameters is also called defense-cascade (Bradley & Lang, 2000).
2.4.3 The defense cascade
An aversive stimulus, usually an intense auditory stimulus but also other types of aversive
stimuli, can elicit the so-called defense cascade, which can be divided into three periods that
are characterized by increasing arousal (Lang, Bradley & Cuthbert, 1997; Lang, Davis &
Öhman, 2000; see also Blanchard & Blanchard, 1989; Fanselow & Lester, 1988; Fanselow,
DeCola, De Oca & Landeira-Fernandez, 1995). First, in the pre-encounter period, the
individual is confronted with a stimulus, whereas in the post-encounter, the defensive system
is already activated, which results in a freezing reaction. In the circa-strike period that is
characterized by overt action, corresponding action is shown, like fight or flight. These
periods are also reported from neurophysiological studies on fear and anxiety emphasizing
the role of the amygdala (see paragraph 2.3.2 and also LeDoux, 1988, 2000), especially the
role that the bed nucleus of the stria terminalis plays in anxiety as a more generalized and
sustained fear response in contrast to cue-specific fear (Lang, Davis & Öhman, 2000).
Skin conductance, as a sympathetically driven parameter, increases linearly in amplitude and
frequency with increasing arousal across the three periods. Heart rate, in this case primarily
parasympathetically driven, shows already a deceleration in the pre-encounter period, which
decreases with increasing arousal over the post-encounter period, also called “bradycardia”,
and changes into acceleration, primarily sympathetically driven, with beginning circa-strike
period, which is a classical defense response (Cook & Turpin, 1997). Vila and colleagues
differentiated this basic pattern further and found a primary accelerative and decelerative
component, which mainly reflect parasympathetical inhibition followed by an activation
controlled by the vagus, which reflects an attentional component of the reaction towards the
defense eliciting stimuli (Vila et al., 2003). This is followed by a second accelerative and
decelerative component, that reflect reciprocal sympathetic activation and parasympathetic
inhibition. The authors interpret this as an action component towards the defense eliciting
stimulus (Vila et al., 2003). Startle reflex shows a slight inhibition in the pre-encounter
period and changes towards potentiation in the middle of the post-encounter and increases
further in the circa-strike period (Bradley & Lang, 2000; Davis & Lang, 2001; Lang, Bradley
& Cuthbert, 1998; Lang, Bradley & Cuthbert, 1997). Interestingly, the reflex potentiation
response can be seen in both normal and phobic subjects, whereas heart rate measure that is
typical of attentive orienting is missing in phobics, who are processing highly fearful
Theory 43
material. Instead, they show an acceleration and therefore the sympathetic system already
dominates, as phobics might be further along within the defense cascade (see for example
Cook & Turpin, 1997; Hamm, Cuthbert, Globisch & Vaitl 1997; Klorman & Ryan, 1980;
Klorman, Weissbert & Wiessenfeld, 1977; Sabatinelli, Bradley, Cuthbert & Lang, 1996).
Using an intense auditory stimulus, the defense paradigm can be used to control for possible
differences in anxiety and control participants due to physiological baseline reactivity and
due to their reaction towards the defense eliciting stimulus, which has relatively simple
characteristics compared to stimuli used within the below presented picture and imagery
paradigm, that differ in valence and arousal.
2.4.4 Physiological reactivity within the picture paradigm
Within the picture paradigm, participants usually view a selected set of slides or digital
pictures of the IAPS, a collection of standardized photographic materials (Lang, Bradley &
Cuthbert, 1999). As already explained in paragraph 2.4.1 pictures can be differentiated due
normative ratings regarding affective report on the dimensions of valence, arousal and
dominance. In terms of physiological reactivity as reaction toward the presentation of picture
stimuli, skin conductance increases in terms of a linear relationship with increasing arousal
of pictures, independently from valence, and is higher in pleasant and unpleasant stimuli
compared to neutral (see for example Winton et al., 1984; Manning & Melchiori, 1974; Lang
et al., 1993). Also, anticipating picture stimuli elicited greater skin conductance in pleasant
and unpleasant pictures compared to neutral ones (Sabatinelli et al., 1996). As skin
conductance decreases in repeated presentation of pleasant pictures, this might reflect the
arousal due to a kind of orienting response (Bradley, Lang & Cuthbert, 1993; Bradley,
Kolchakian, Cuthbert & Lang, 1997). Heart rate shows a triphasic pattern (Bradley, 2000;
see also Lang & Hnatiow, 1962), which is characterized by deceleration, acceleration and
again deceleration. For unpleasant pictures the greatest initial deceleration can be found (see
for example Winton, Putnam & Krauss, 1984). Pleasant pictures show the highest peak
acceleration, whereas in unpleasant pictures, the acceleration peak is often missed but
instead sustained deceleration across picture interval can be observed (Bradley, Greenwald
& Hamm, 1993). This suggests, that the difference found in peak acceleration is not due to
differential initial deceleration between pleasant and unpleasant pictures (Bradley, 2000).
With regard to electromyography, corrugator activity is highest for unpleasant pictures,
modest for neutral and lowest for pleasant, whereas zygomatic activity is high for pleasant
pictures but also for increasing unpleasantness (Bradley & Lang, 2000). Startle reflex is
Theory 44
sensitive to differences of valence, with largest blink responses for unpleasant pictures and
smallest for pleasant pictures (Bradley, 2000).
As the main emphasis of this study lies in the comparison of the subjective report of social
phobic symptoms and the response in different physiological parameters provoked by the
imagination of scenes, in the following the imagery paradigm as well as empirical findings
due to healthy participants, anxiety patients and social phobics are presented.
2.4.5 Physiological reactivity within the imagery paradigm
2.4.5.1 General characteristics
Images of action and emotion prompt activation in the appropriate efferent system and
therefore activate perceptual-motor memories, that include metabolic mobilization, which
can be seen as preparation for active avoidance, although avoidance may not actually occur
(Lang, 1979, 1994; Cuthbert, Vrana & Bradley, 1991). Individual differences in imagery
ability may contribute to physiological reactivity within imagery, as good imagers show
significantly greater physiological activity, which varies with content of imagery scripts,
whereas poor imagers are less responsive (Miller et al., 1987). Important parameters are also
the nature of the information the image-cue contains, whether the imagined responses are
active or passive and whether the imagined event has been experienced or is fictional
(Bradley, 2000; see also paragraph 2.3.3).
A higher reactivity according heart rate, but also skin conductance, electromyographical
measures and respiratory measures are obtained, when images containing action as opposed
to passive scenes (Jones & Johnson, 1978; Jones & Johnson, 1980). More appropriate skin
conductance and heart rate changes occur when subjects imagine events they have
personally experienced compared to events that are not personally relevant (Miller et al.,
1987), suggesting that motivational and physiological activation is more successful when an
existing associative network can be activated (Bradley, 2000).
Whereas in picture perception initial heart rate deceleration is found, in imagery initial heart
rate acceleration is found. Heart rate increases more during text-prompted fearful images
compared to neutral ones (Bauer & Craighead, 1979; Cook, Melamed, Cuthbert, McNeil &
Lang, 1988; Grayson, 1982; Lang, Levin, Miller & Kozak, 1983), and during unpleasant
compared to pleasant ones (Fiorito & Simons, 1994; vanOyen Witvliet & Vrana, 1995).
Theory 45
Heart rate acceleration during imagery varies most consistently with stimulus arousal, and
increases with increasing arousal (Cook et al., 1991; Fiorito & Simons, 1994; vanOyen
Witvliet & Vrana, 1995).
Schwartz (1971) tried to separate cardiac concomitants of imagery from heart rate variance
due to processing text. So, subjects learned first text passages and the following imagery task
included memorizing these texts. The author found a greater heart rate acceleration towards
highly arousing stimuli compared to neutral ones. Similar results could be found for learning
and memorizing words and events (May & Johnson, 1973; Vrana, Cuthbert & Lang, 1986).
May (1977) found that actively imaging a fearful sentence produced more heart rate
acceleration than either thinking the sentence or only listening to the sentence or seeing a
picture stimulus containing the same material described in the sentence. Lang (1987)
interpreted heart rate acceleration during imagery as efferent leakage that reflects, like in an
actual situation, the activation of response information.
Consistent with Lacey (1967), heart rate pattern in imagery and also in picture presentation
shows, that deceleration is associated with sensory intake and perception, whereas
acceleration is associated with mentation. But, the interpretation that heart rate acceleration
in imagery reflects sensory rejection has been refined. Cardiac activity reflects the activation
of somatic activity associated with action in an image (Lang, 1979). One prediction of this
could be that imaging pleasant and unpleasant events involves more activity than neutral
events, and that therefore, greater heart rate acceleration during this type is predicted
(Bradley, 2000).
Vrana and Lang (1990) could show that healthy subjects show an accelerated heart rate and
larger startle probes for recalling fear-related contents compared to neutral contents or a
relaxation condition. The higher the startle response was, the higher fearfulness was rated by
subjects (see also Cook et al., 1991; Vrana, Constantine & Westmann, 1992). Startle probes
were larger when subjects received the instruction to vividly imagine the contents versus
silently articulate the sentence or to ignore them and relax. Highly arousing unpleasant
images prompt more potentiation than low arousing unpleasant images (Bradley, Cuthbert &
Lang, 1996; Witvliet & Vrana, 1995). Physical danger scenes prompt more potentiation than
scenes that do not involve clear threat (Cuthbert, Strauss, Drobes, Patrick, Bradley & Lang,
1999). Potentiation for unpleasant and inhibition for pleasant images, like in the picture
paradigm, could be found by Cook and colleagues (Cook et al., 1991). However, other
authors found an augmentation of the startle potentiation in both pleasant and unpleasant
Theory 46
images (Witvliet & Vrana, 1995), especially, when highly arousing or personally relevant
scenes were used (Bradley, Gianaros & Lang, 1995). In addition, studies show that
physiological reactions are more accentuated to differentiate between neutral and fearful
images when the image includes response information and not only stimulus information
(Bradley, 2000; Carroll, Marziller & Merian, 1982; Miller et al., 1987).
2.4.5.2 Physiological reaction in social phobics within the imagery paradigm
Lang and colleagues found different response patterns in social phobics compared to snake
phobics, both of which had received training based on reinforcement of verbal report of
somatic response content in imagery. Social phobics did not show the observed heart rate
acceleration and verbal reports of higher fear shown by snake phobics, when imaging
snakes, whereas the groups did not differ in their responses towards the imagery of a speech
performance where they showed increased physical arousal. A control-training based on the
reinforcement of stimulus information failed to produce this effect, which again points
towards the importance of response information within the imagery paradigm (Lang, Levin,
Miller & Kozak, 1983). The importance of the relevant response stored in memory could
also be demonstrated by Cuthbert and Melamed (1993): social phobics and panic patients
were trained to focus on stimulus aspects of the imagery script, for example to focus on
colors or sounds, versus response aspects, for example to focus on heart beating. Both
groups report more vividness of the scripts, but with emphasis on these two different aspects.
In a second step, for half of the subjects of each group an imagery script was presented that
consisted of stimulus and response aspects and for the other half of the subjects an imagery
script with only stimuli aspects was presented. Again, response trained subjects within the
condition that contained the script that consisted of stimulus and response showed the
greatest reaction.
As phobic participants avoid nearly all type of relevant information that might lead to the
activation of the fear network and therefore to the experience of fear and anxiety, networks
that are related to phobias are very stable (Cuthbert & Melamed, 1993). Therefore, the
conditions under which the network is activated are important. In this context, social phobia
can be seen as a challenge because there exist empirical data that the probability for the
activation of the fear network within social phobia seemed to be more difficult. So social
phobics show differences in their reaction towards their personal imaged fear scenes
compared to participants with other anxiety disorders: Grayson (1982) found that speech
phobics showed a defensive response measured by skin conductance and heart rate only
Theory 47
towards phobic imagery contents, but not to neutral ones. Neither did subjects show the
expected orienting response towards neutral imagery contents.
Cook and colleagues compared social, specific and panic patients within an imagery task
where subjects were first listening and then imagining scenes. They found activation of
autonomic responses during fear imagery compared to neutral imagery with particular
intensive activation to phobia related contents. In addition, they found a robust autonomic
response for specific fear but to a lesser extent for social phobia and even less pronounced
for panic patients (Cook et al., 1988). In a similar experiment, McNeil and colleagues
compared social-speech, dental and multiple phobics. Heart rate responses were largest for
subjects with multiple phobias. For dental phobics, heart rate reactivity was positively
correlated with reports of imagery vividness and concordant with reports of affective
distress. These relationships were not observed for social phobics. In addition, if subjects
independently of their initial diagnosis were split into a fearful versus anxious group by
questionnaire, subjects in the fearful group showed physiological arousal and concordant
verbal report, which points towards an active avoidance of the specific object of fear.
However, anxious subjects showed the smallest response, reported more fear and showed
more pathology in terms of anxiety and social distress (McNeil, Vrana, Melamed, Cuthbert
& Lang, 1993).
In a further study, Cuthbert and colleagues compared social phobics, simple phobics, panic
patients with agoraphobia and PTSD patients with normal controls within an imagery
paradigm, where subject had to recall previously learned imagery sentences, six neutral and
six fear-related scenes, whereas the fear-related scenes consist of two danger, two social and
two personal fear scenes (Cuthbert et al., 2003). Results replicated findings of the above
mentioned study of Cook and colleagues (1988). Social and specific phobics were more
responsive than PTSD and panic patients and reported less anxiety and mood symptoms and
were less frequently comorbidly depressed. Social phobics, controls and specific phobics
showed a similar reactivity towards fear imagery as a hint towards a generally normal
functioning defense motive system with appropriate arousal for fear cues (Cuthbert et al.,
2003). In general, subjects were more responsive to fear than to neutral cues. Within heart
rate there was an increase for fear sentences and a decrease for neutral sentences. Skin
conductance did not differ for diagnosis, nor for individual fears, except for social phobics
who showed higher skin conductance levels for social fear imagery. Concerning startle
reflex, potentiation was larger for fear than for neutral sentences. In addition, for social
Theory 48
phobic and control participants, startle potentiation was found. However, if specific phobics
were excluded from the social phobic group, potentiation was found no longer for social
phobics. Startle potentiation seems to depend on diagnosis and negative affect, as a more
pronounced potentiation was found for focal phobics compared to other anxiety disorders
and also for patients with no anxiety disorder (Cook et al., 1988; Cuthbert et al., 2003;
McNeil et al., 1993). Concerning affective report, personal fear scenes were rated more
unpleasant than danger or social sentences, except again for social phobics, who rated them
as more unpleasant. Personal scenes were rated as most arousing and within social fear
scenes, social phobics rated them as most arousing. There were no differences in vividness-
report, or further moderator variables like gender and medication (Cuthbert et al., 2003).
These results can neither be explained by effects due to systematical differences in the
imagery-ability, nor due to differences concerning the perceived distress during imaging a
typical fear-provoking image. Similar results can be observed within a vivo-confrontation,
where participants had to give a speech (Lang et al., 1983; Nesse et al., 1985): Beidel and
colleagues measured physiological, behavioral and cognitive aspects of social phobia within
different tasks that include two interaction situations and one impromptu speech.
Physiological activity occurred in most social situations in socially anxious subjects and to
some extent in non-socially anxious subjects. Latency of habituation could differentiate the
two groups, as social phobics failed to habituate during social encounters. In addition,
socially anxious subjects have more negative cognitions and fewer positive ones (Beidel,
Turner & Dancu, 1985). If high and low trait socially anxious individuals were compared
within a stressful speech task, they do not show differences in autonomic reactivity,
habituation and recovery, neither in heart rate, electrodermal and respiratory measures nor in
vagal activation. Nevertheless, high-trait socially anxious report greater anxiety. Results
were interpreted in favor of the importance cognitive factors have on the subjectively
perceived anxiety (Mauss, Wilhelm & Gross, 2003).
According to Lang (1985, 1988), who proposed a distribution of diagnoses in a continuum
which is based on autonomic reactivity, these data can be interpreted as follows: social
phobics compared to subjects with other anxiety disorders, have fear networks which are
rather characterized by vigilance and worries that they might be evaluated and which are not
activated in each social situation (see also Thayer, Freedman & Borkovec, 1996). Within this
context, the considerations of Bond and Siddle (1996) mentioned in paragraph 2.2.4 can be
integrated, that social phobics have to appraise relative complex situations, choose from
Theory 49
possible response means that are more subtle than active avoidance behavior, as they depend
on their social group. Therefore, they might have a greater reliance on controlled processing,
which might interfere with the activation of the fear network. So differences in memory
organization across different anxiety disorders can be seen as a continuum from high to low
associative strength. Social phobics might have more stimulus and meaning representations,
but the lower overall associative strength leads to practical consequences, namely that
emotional language is less likely to activate emotional expression. This is also important in
the context of treatment, as those participants who respond physiologically in emotional
imagery have a better therapeutical outcome than those who do not (Lang, 1985; see also
Bryant, Sullivan, Strauss, Cuthbert & Lang, 1997; Lang, 1970). This might be explained in
this way that the activation of the fear network is the first necessary step towards a
modification of the network which in turn is inevitable with regard to a successful treatment
outcome (Foa & Kozak, 1991).
However, some authors developed criteria on the basis of empirical studies which can
further differentiate social phobia, as not all of the so-obtained subtypes of social phobia
show the above described pattern of reduced or even lack of physiological activation during
imagery or confrontation in vivo with one of the fear provoking stimuli: Levin and
colleagues found that subjects with specific social phobia showed higher heart rate reaction
compared to subjects with generalized social phobia, who in turn estimated their subjective
anxiety as higher (Levin et al., 1993). Hofmann and colleagues (1995) examined subjects
with social phobia with versus without the additional diagnosis of avoidant personality
disorder (Hofmann, Newman, Ehlers & Roth, 1995). Therefore, subjects with social phobia
but without avoidant personality disorder show a significantly higher heart rate during
confrontation with a phobic situation compared to a non-anxious control group and a group
of social phobics with comorbid avoidant personality disorder. The last-mentioned report
more subjective anxiety and marked cognitions according to anxiety (see also Heimberg et
al., 1990; Levin et al, 1993; Boone et al., 1999). Other studies suggest that the feeling of
embarrassment and shame is associated with heart rate deceleration due to an increase in
parasympathetic arousal (Buck & Parke, 1972; Buck, Parke & Buck, 1970), which in turn
may summate with fearful sympathetic activation that leads to high subjective distress and
low autonomic arousal (McNeil et al., 1993). Again it is referred to McNeil and colleagues,
who showed that once anxiety patients, and therefore also social phobics were split into a
fearful versus an anxious group, fearful although not anxious subjects show the
physiological arousal which can be associated with an activation of the network. This points
Theory 50
towards the usefulness of differentiating subgroups within social phobia, not only due to
diagnostic relevant symptoms, but also due to their physical response towards fear evoking
situations (McNeil et al., 1993).
In investigating physiological responses towards social anxiety evoking and non-evoking
situations as well as subjectively perceived anxiety, this study undertakes an effort to
contribute to a better understanding, not only of possible correlations in a Spanish sample
but also of the above discussed patterns of activation versus non-activation in social phobic
participants in general.
Theory 51
2.5 Hypotheses
Taken together, social phobia can be conceptualized as a fear network structure that is stored
in memory and has close connections to evolutionary older regions of the brain like the
primitive cortex, subcortex and the midbrain, with special significance of the amygdala.
These neuronal structures represent the fundamental organization of emotion and therefore
also of fear and anxiety and can be put into a motivational perspective, as the activation of
these structures leads to the activation of the defensive system with corresponding freezing
or avoidance behavior (see chapter 2.1). Such a defensive reaction can be protective and
useful under an evolutionary perspective, as it enhances the probability of survival, taking
into account, that human beings depend on social groups and therefore on social hierarchies
that regulate social life (see paragraph 2.2.4). In social phobia the activation of the defensive
system triggered by the activation of the fear network is clearly maladaptive, and
epidemiological data, as well as information on, for example, psychosocial impairment show
that social phobia is a mental disorder (see chapter 2.2) which should be taken seriously. In
this context the first hypothesis regarding subjectively perceived symptomatology due to
social anxiety, depressive symptoms and worry can be formulated:
Hypothesis 1
a) Social phobic participants show higher social anxiety, trait and state anxiety as
well as a higher anxiety sensitivity compared to control participants.
b) Social phobic participants show higher severity of depressive symptomatology as
well as worries and preoccupations.
Under a biological perspective, referring to twin studies and case-control-designed studies,
there seemed to be a genetic vulnerability for social phobia. However, there are no consistent
abnormalities found in social phobics concerning neuroendocrinology, several transmitter
systems and the autonomous nervous system (see chapter 2.2.5). Therefore environmental
influences and learning processes play an important role in the occurrence of social phobia.
This again shows the importance the concept of the fear network in social phobia has, as it
allows to integrate behavioral-cognitive approaches that explain these learning and
conditioning processes (see chapter 2.3.3), and can therefore be interpreted mainly as
stimulus and meaning components of the network. As the fear network can be activated also
through sensoric information and imagination of emotionally relevant material, the picture
Theory 52
and imagery paradigm are useful controlled experimental settings to measure affective report
and physiological parameters due to fear eliciting stimuli. In this context it is important that
only conditions or stimuli that fit the propositions of the fear network can lead to an
activation. However, networks in social phobia might be characterized by general
apprehension and vigilance which are both associated with poorer autonomic regulation,
possibly reflected in a lower heart rate variability. In addition, aversive stimuli that are not
necessarily related to social phobic contents might lead to the activation of the fear network
as well, measurable in a higher physiological activation including an increase in
sympathetical activity. So concerning the defense paradigm the following hypothesis can be
derived:
Hypothesis 2
a) Social phobic participants show an elevated physiological defense response
concerning heart rate, blood pressure, pulse, respiration, skin conductance and
startle reflex compared to control participants.
b) Social phobic participants show a reduced heart rate variability during a rest
period prior to the defense trial compared to control participants.
Within the picture paradigm, where complex pleasant, neutral and unpleasant stimuli are
presented, which again are not related to social contents, unpleasant pictures as aversive
stimuli might lead to an activation of the fear network in social phobia, which should
correspond to affective report and higher physiological activation. However, it remains open
if pleasant and neutral pictures lead to a similar pattern. In the background of an already
activated fear network at least highly arousing pictures might lead to a higher physiological
activation.
Hypothesis 3
a) Social phobic participants are expected to judge unpleasant pictures as more
unpleasant, more arousing and report feelings of less dominance compared to
control participants.
Theory 53
b) Social phobic participants show an elevated physiological response concerning heart
rate, blood pressure, pulse, skin conductance and startle reflex4 due to unpleasant
pictures compared to control participants.
Research question 1
a) Do social phobic participants differ from control participants in their affective report
due to pleasant and neutral pictures?
b) Do social phobic participants differ from control participants in their
physiological response concerning heart rate, blood pressure, pulse, skin
conductance and startle reflex4 due to pleasant and neutral pictures?
Within the imagery paradigm, participants imagine standardized and personalized pleasant,
neutral and fear-related scenes, with the latter including scenes typically feared by social
phobics but also general fear scenes. Fear-related scenes should lead to the activation of the
fear network, where it is assumed, that the networks related to social fears have more
elaborated stimulus, meaning and response propositions and deeper associative connections
than networks relating to general feared situations, which do usually not occur repeatedly in
a similar way. The activation of the network should correspond to affective report and higher
physiological activation. However, it remains open if pleasant and neutral scenes lead to a
similar pattern.
Hypothesis 4
Social phobic participants are expected to judge fear-related scenes as more unpleasant,
more arousing and report feelings of less dominance compared to control participants.
Research question 2
Do social phobic participants differ from control participants in their affective report due
to pleasant and neutral scenes?
4 Respiration was excluded. For an explanation see paragraph 2.4.
Theory 54
Hypothesis 5
Social phobic participants show an elevated physiological response concerning heart rate,
blood pressure, pulse, respiration, skin conductance and startle reflex due to fear-related
scenes during the imagery period compared to control participants.
With regard to hypothesis 5 it remains also open if this pattern is more pronounced within
personalized scenes compared to standardized ones.
Research question 3
a) Do social phobic participants show a more pronounced elevated physiological
response concerning heart rate, blood pressure, pulse, respiration, skin
conductance and startle reflex due to personalized versus standardized fear- related
scenes during the imagery period?
b) Do control participants show a more pronounced elevated physiological
response concerning heart rate, blood pressure, pulse, respiration, skin
conductance and startle reflex due to personalized versus standardized fear- related
scenes during the imagery period?
In favor of a more pronounced response is the fact, that personalized scenes should match
propositions of the network more accurately and therefore enhance the probability of
network activation. On the other hand, at least concerning social phobic participants,
standardized scenes describe social situations in a way that they should contain sufficient
features that match the network proposition that they can serve as well as an activating
stimulus.
With regard to hypothesis 5 it also remains an open question if there exist extreme cases of
social phobic participants where pleasant and neutral stimuli within the imagery paradigm
are presented and nevertheless a heightened arousal is observed during the imagery period,
which would indicate that the already activated fear structure influences further processing
in terms of the priming-hypothesis (see paragraph 2.4.2).
Theory 55
Research question 4
Are there social phobic participants who show an elevated physiological response
concerning heart rate, blood pressure, pulse, respiration, skin conductance and startle
reflex due to pleasant or neutral scenes during the imagery period?
With regard to the presentation and the post-interval period, it remains open if social phobic
participants differ from control participants in their physiological responses due to fear-
related scenes. Therefore the following open questions are formulated:
Research question 5
Do social phobic participants differ from control participants due to their physiological
response concerning heart rate, blood pressure, pulse and skin conductance5 due to fear-
related scenes during the presentation period?
Research question 6
Do social phobic participants differ from control participants due to their physiological
response concerning, heart rate, blood pressure, pulse, respiration and skin conductance6
due to fear-related scenes during the post-interval period?
In favor of possible group differences during the presentation period is the fact that fear
networks generally can be activated very quickly, even by unconscious stimulus presentation
(see paragraph 2.3.3). But as this has not been found as a typical reaction pattern in social
phobia and in addition, as their fear networks tend to include relatively complex stimulus
and meaning associations, as social situations are per definition rather complex, it can be
assumed that sufficient time is required to achieve appropriate processing of stimulus
material. Therefore it is also assumed that no group differences are found due to
physiological responses during the presentation period.
As within interactional tasks there exist two opposed patterns concerning habituation, with
one saying that social phobics failed to show habituation and the other saying that at least
between high and low social phobics there are no differences found due to habituation (see
paragraph 2.4.5.2). In addition, as the imagery paradigm is an in sensu and not an in vivo
confrontation with fear eliciting stimulus material, it remains open whether there can be
group differences assumed due to physiological responses concerning the post-interval
period.
Theory 56
As also mentioned above with regard to pleasant and neutral scenes it remains open if group
differences would be found with regard to physiological activation. Therefore, the following
research questions are formulated:
Research question 7
a) Do social phobic participants differ from control participants in their
physiological response concerning heart rate, blood pressure, pulse and skin
conductance5 due to pleasant and neutral scenes in the presentation period?
b) Do social phobic participants differ from control participants in their
physiological response concerning heart rate, blood pressure, pulse, respiration,
skin conductance and startle reflex due to pleasant and neutral scenes in the
imagery period?
c) Do social phobic participants differ from control participants in their
physiological response concerning heart rate, blood pressure, pulse, respiration
and skin conductance6 due to pleasant and neutral scenes in the post-interval?
5 Respiration and startle reflex are excluded. For an explanation see paragraph 2.4. 6 Startle reflex is excluded. For an explanation see paragraph 2.4.
Methods
57
3. METHODS
3.1 Participants
Data were collected at the University of Granada, Spain. The participants were 43
undergraduate and graduate students; of these, 20 females and 23 males of the “Facultad de
Psicologia”, the “Facultad de Ciencias de la Educación” and the “Escuela Universitaria de
Ciencias de la Salud” who received course credit. The participants’ age range was between
18 and 32 [M = 21.47, SD = 3.00]. Due to the results of the screening procedure described
below, 23 participants were assigned to a social anxiety group (12 women) versus 20
participants to a control group (8 women). All subjects, with one exception from Greece,
were of Spanish nationality. Also with one exception, all subjects report being unmarried
and not having children. Subjects denied alcohol-, nicotine- and other types of substance or
medication abuse. Participants did not receive actual treatment in terms of medication or
psychotherapy due to psychological or mental health problems, nor did they report
physiological, especially neurological problems or related treatment that might have
influenced data collection.
3.2 Materials
3.2.1 Questionnaires
Screening for social phobia
In a preceding screening, the following questionnaires in a Spanish version were
administered, to ensure the selection of participants highest and lowest in scores due to
social anxiety: first, the Social phobia inventory, abbreviated as SPIN (see Appendix A-1) by
Connor and colleagues (Connor et al., 2000). This scale consists of 17 items, that can be split
into three subscales associated with social phobia and measuring fear, with items 1, 3, 5, 10,
14 and 15, avoidance, with items 4, 6, 8, 9, 11, 12 and 16 and physiological arousal with
items 2, 7, 13, 17. Subjects had to rate to what extent they felt bothered by symptoms during
the prior week on a Likert-scale from 0 (= “not at all”) to 4 (= “extremely”). So subjects can
range between 0-68 concerning scores, whereas a score of 19 can be seen as a cut-off
criterion for identifying social phobic symptoms with a 79 % efficiency. For the Spanish
translation of the scale see González and colleagues (González, Sáiz & Bousoño, 1999).
Methods
58
Second, the Social phobia scale, abbreviated as SPS and third, the Social interaction anxiety
scale, abbreviated as SIAS (see Appendix A-2 and A-3) by Mattick and Clark (1998), for the
Spanish translation of the questionnaires see Bados-López (2001). The SPS measures fears
of being scrutinized during routine activities, whereas the SIAS assess fears in terms of
cognitive, affective and behavioral reactions concerning general social interactions. Both
questionnaires consist of 20 items that range on a Likert-scale from 1 (= “not at all
characteristic or true for me”) to 4 (= “extremely characteristic or true for me”). For the
SIAS item 8 and 10 must be converted. For the SPS possible scores that can be obtained
range from 0-80 and can differentiate correctly between subjects with the above-described
social phobic symptoms and healthy subjects in 73% of the cases referring to a mean of 24
plus one standard deviation. The SIAS has a range from 0-76 concerning scores that can be
obtained and can differentiate correctly between subjects with the above described
symptoms in 82 % of the cases with a mean of 34 plus one standard deviation. Fourth, the
Self-statement during public speaking scale, abbreviated as SSPS (see Appendix A-4) by
Hofmann and DiBartolo (2000) was used. This scale assesses fearful thoughts that typically
arise during public speaking and consists of two subscales, positive self-statement, which
contains items 1, 3, 5, 6 and 9 versus negative self-statements, which contains items 2, 4, 7,
8, and 10. Each item range on a Likert-scale from 1 (= “I do not agree at all”) to 5 (= “I do
agree extremely”). Each subscale range from 0 -25. For the Spanish translation of the
questionnaire see (Bados, 2002). Internal consistency and reliability for all four
questionnaires can be interpreted as good to excellent (for details see Orsillo, 2001),
although it must be mentioned that for neither scale there exist validation studies in Spanish
samples.
Anxiety disorder interview schedule for DSM-IV
The Anxiety disorder interview schedule for DSM-IV, abbreviated as ADIS-IV by Barlow
and colleagues (Brown, DiNardo & Barlow, 1994) is a semi-structured interview, which
allows the assessment of all diagnostic criteria that are relevant to the different types of
anxiety disorders as well as a range of other DSM-IV disorders. The interview provides in
addition a severity rating of all present disorders (see also Antony, 2001). This interview was
translated into Spanish by García-Sancho (2002). As in the present study only the
information referring to social phobia was needed, the corresponding chapter was adapted
and named as “ADIS -Fobia social” (see Appendix A -5) and further details on psychometric
properties are not presented here (for details see DiNardo, Brown, Lawton & Barlow, 1995).
Methods
59
The chapter was used as a possibility to double-check results obtained by the screening on
social anxiety towards the absence versus presence of social anxiety symptoms in controls
and social anxiety participants for this study.
Sociodemographic information
Participants had to fill out a questionnaire, named “Información General” (see Appendix A -
6) that asked for sociodemographic information, like age, gender, education, profession but
also for general problems in the past year, alcohol-, nicotine- and other substance abuse, as
well as for medication, physiological or psychological problems. Parts of this questionnaire
were developed by the group of Vila at the “Departamento de Personalidad, Evaluación y
Tratamiento Psicológico”, University of Granada and parts of the questions were used from
the ADIS. The purpose was mainly to characterize the sample and to control for variables
that could influence research results.
To assess social anxiety, general anxiety, depressive symptoms as well as preoccupations
and worries, the following measures in Spanish versions were used:
Social phobia and anxiety inventory
The Social phobia and anxiety inventory, abbreviated as SPAI (see Appendix A-7) by
Turner and colleagues (Turner, Beidel, Dancu & Stanley, 1989; Turner, Beidel & Dancu,
1996), measures somatic, cognitive and behavioral aspects of social phobia across a variety
of settings. The 45 items can be split into two subscales, one measuring social phobia and
the other agoraphobia related symptoms, with the latter serving as a suppressor variable to
control for symptoms of social phobia that are best conceptualized as part of agoraphobia.
The subscale measuring social phobia contains items 1 to 32, whereas the subscale
measuring agoraphobia related symptoms contains items 33 to 45. So a difference score
obtained by subtracting the agoraphobia subscale from the social phobia subscale may
represent a purer measure of social phobia. Subjects rate each item for frequency on a
Likert-scale from 0 (= “never”) to 6 (= “always”). For the Spanish version see Echeburúa
(1995). Concerning psychometric properties, the social phobia subscale has a Cronbach’s
alpha ranging from .94 to .96 and .85 to .86 for the agoraphobia subscale (Osman et al.,
1996; Turner, Beidel, Dancu & Stanley, 1989). Test-retest reliability was .86 (Turner et al.,
1989). Pertaining to validity, the difference score is significantly correlated with other self-
report measures of social anxiety and the correlation coefficient range from .41 to .77 (for
details see Beidel, Turner & Cooley, 1993; Cox et al., 1998; Herbert, Bellack & Hope, 1991;
Methods
60
Osman et al., 1995, 1996; Ries et al., 1998). In a discriminant function analysis with clinical
and student samples, the SPAI correctly classified 74% to 77% of the socially phobic
participants (Beidel, Turner, Stanley & Dancu, 1989; Turner et al., 1989; for details see
Orsillo, 2001). Psychometric properties were also examined in a Spanish sample of
adolescents. As their age ranges from 14 to 17 years, correlations are not presented here (for
more details, see Olivares, García-López, Hildago, Turner & Beidel, 1999; García-Lopez,
Olivares, Hidalgo, Beidel & Turner, 2001). Baños and colleagues found an internal
consistency of .97 in a Spanish community sample and .94 in a Spanish sample of social
phobics (Baños, Gallardo, Medina, Jorquera, Botella, Quero & Periñám, in preparation).
Social interaction self-statement test
The Social interaction self-statement test, abbreviated SISST (see Appendix A-8) by Glass
and colleagues (Glass, Merluzzi, Biever & Larsen, 1982), measures positive and negative
thoughts associated with social anxiety before, during or after a social interaction. For a
Spanish translation see Caballo (1993a) and Comeche, Díaz y Vallejo (1995). Each subscale
consists of 15 items. The subscale measuring positive thoughts consists of items 2, 4, 6, 9,
10, 12-14, 17, 18, 24, 25 27, 28 and 30, whereas the subscale measuring negative thoughts
consists of items 1, 3, 5, 7, 8, 11, 15, 16, 19-23, 26 and 29. Each item is rated with regard to
its frequency on a Likert-scale from 1 (= “hardly”) to 5 (= “very often”). Concerning
psychometric properties, Cronbach’s alpha for the po sitive thought subscale ranged from .85
to .89 and for the negative thought subscale Cronbach's alpha was .91 (Osman, Markway &
Osman, 1992; Zweig & Brown, 1985). Split-half reliability was .73 for the positive thought
subscale and .86 for the negative thought subscale (Glass et al., 1982). Test-retest reliability
ranged from .73 to .89 for the positive thought subscale and from .72 to .76 for the negative
thought subscale (Zweig & Brown, 1985). Convergent validity ranged from .71 to .77 for the
positive thought subscale and measures of social skills and up to .74 for the negative thought
subscale and measures of social anxiety (Glass et al., 1982; for details see Orsillo, 2001). In
a sample of Spanish students, Caballo (1993b) found a correlation of .62 between the
negative thought subscale with the Social avoidance and distress scale of Watson and Friend
(1969) and a correlation of -.69 between the negative thought subscale with the anxiety
subscale of the Multidimensional scale of social expression (Caballo, 1987), both
measurements of social anxiety. Further, Caballo and Buela (1989) found no differences
between high and low socially skilled students, but could show, that low skilled participants
had significantly higher scores on the negative thought subscale.
Methods
61
Anxiety sensitivity index
The Anxiety sensitivity index, abbreviated ASI (see Appendix A-9), by Reiss and colleagues
(Reiss, Peterson, Gursky & McNally, 1986), measures the subject’s sensitivity towards
anxiety provoking stimuli in general and also focuses on symptoms of panic. This has to be
distinguished from trait anxiety, where subjects tend to respond fearfully towards stressors in
general (McNally, 1990). Each of the 16 items is rated on a Likert-scale due to the
participant’s agreement from 0 ( = “very little”) to 4 (= “very much”). A translation of the
instrument can be found in Botella and colleagues (Botella, Baños & Periñá, 2003). The
questionnaire was adapted by the group of Vila at the “Departamento de Personalidad,
Evaluación y Tratamiento Psicológico”, University of Granada. Pertaining to psychometric
properties, the ASI shows a good to excellent internal consistency with Cronbach’s alpha
ranging between .82 and .91 (Peterson & Reiss, 1993). Also test-retest-reliability of .75 and
a construct validity of .71 towards the Fear Survey Schedule (Geer, 1965; Reiss et al., 1986)
can be estimated as good. Sandin and colleagues found high internal consistency with a
Cronbach’s alpha of .91 for anxiety patients, including social phobics and .80 for normal
controls within a Spanish sample (Sandin, Chorot & McNally, 1996; see also Gallardo,
2002). Evidence for construct and concurrent validity could be found. Anxiety patients in
general and especially panic patients showed higher scores on the ASI compared to controls.
Low correlations between the ASI and measures of trait anxiety demonstrated that the ASI
predicts and therefore differentiates better between panic and other anxiety disorders
(Sandin, Chorot & McNally, 1996).
State trait anxiety inventory
The State trait anxiety inventory, form Y, abbreviated STAI (see Appendix A-10 and A-11),
by Spielberger and colleagues (Spielberger, Gorsuch, Lushene, Vagg & Jacobs, 1983),
assesses state and trait levels of anxiety and consists of two subscales, namely state-anxiety
(STAI-S) and trait-anxiety (STAI-T), each consisting of 20 items. Items on the state-anxiety
subscale are rated on a Likert-scale from 0 (= “not at all”) to 3 (= “very much so”) and items
on the trait-anxiety subscale as well from 0 (= “almo st never”) to 3 (= “almost always”). For
the subscale measuring state anxiety, the items 1, 2, 5, 10, 11, 15, 16, 19 and 20 have to be
converted and for the subscale measuring trait anxiety the items 1, 6, 7, 10, 13, 16, 19. For a
Spanish translation see FAES. Both subscales have good to excellent consistencies that
range between .86 and .95. Test-retest reliability was found between .71 and .86 (for details
see Orsillo, 2001). The trait-anxiety subscale shows significant correlations with other trait
Methods
62
measures of anxiety, for instance the Beck anxiety inventory trait scale with a correlation of
.42, and general negative affect (Beck, Brown, Epstein & Steer, 1988; Bieling, Antony &
Swinson, 1998; Creamer, Foran & Bell, 1995; Spielberger et al., 1983). Discriminant
validity of the STAI is in so far problematic as it does not discriminate well from measures
of depression with correlations up to .72 (Bieling et al., 1998). There exist studies on
psychometric properties in Spanish clinical as well as non-clinical samples who show
internal consistencies also between .82 and .92 and test-retest reliability between .70 and .80
( for details see Bermúdez, 1978a, 1987b; Iglesias 1982; Sandín, 1981; Urraca, 1981; see
also Orsillo, 2000).
Penn state worry questionnaire
The Penn state worry questionnaire, abbreviated as PSWQ (see Appendix A-12) by Meyer
and colleagues (Meyer, Miller, Metzger & Borkovec, 1990) measures the intensity and
excessiveness of worry. Each of the 16 items is rated on a Likert-scale from 1 (= “not
characteristic at all for me”) to 5 (= “very characteristic for me”). Items 1, 3, 8, 10 and 11
have to be converted. For a Spanish translation see Echeburúa (1996) and Comeche and
colleagues (Comeche, García & Pareja, 1995). Concerning psychometric properties,
Cronbach’s alpha ranges from .86 to .93 and has a good test -retest reliability, ranging from
.74 to .93 (Molina & Borkovec, 1994). The construct validity with several other scales range
up to .74 (for an overview see Orsillo, 2001). The Spanish version of the PSWQ has not
been validated so far. Buela-Casal and Sierra (2001) emphasize the necessity of studies
concerning psychometric properties in further samples. The purpose of the use of this
questionnaire was to control for worries and preoccupations as concomitants of social
phobia.
Beck depression inventory
The Beck depression inventory, abbreviated as BDI (see Appendix A-13) by Beck and
colleagues (Beck, Kovacs & Weissman, 1979) measures the severity of depressive
symptoms on 21 items. Participants rate 19 items, with each item consisting of 4 different
statements due to ascending levels of severity of a given symptom on a Likert-scale from 0
(= absence of a symptom) to 3 (= intense level of a symptom). The last two items indicate an
increase or decrease in these behaviors. Total scores allow a classification due to four
different levels of severity. For cut-off criteria see Beck and colleagues (Beck, Kovacs &
Weissman, 1979). For a Spanish translation of the BDI see Vázquez and Sánz (1997).
Methods
63
Concerning psychometric properties, Beck and colleagues reported Cronbach’s alpha with
.89 and a concurrent validity of .41 (Beck, Kovacs & Weissman, 1979)7. The Spanish
version of the BDI has been validated in clinical and non-clinical samples. Cronbach’s alpha
was found between .83 and .90 and test-retest analysis result in a correlation between .62 and
.72. Convergent validity was found between .68 and .89. Divergent validity was
characterized by low correlations to various measures concerning trait anxiety, that ranged
between .11 and .45 (Ibañez, Peñate & González, 1997; Sánz & Vázquez, 1998; Vázquez &
Sánz, 1997, 1999). The purpose of the use of this questionnaire was to control for comorbid
depressive symptomatology in social phobia.
Questionnaire upon mental imagery
The Questionnaire upon mental imagery, abbreviated as QMI (see Appendix A-14) by
Sheehan (1967a) measures the ability to imagine objects or experiences, referring to 35
items, with each being rated by participants on a Likert-scale from 1 (= “perfect ly clear and
as vivid as the actual experience“) to 7 (= “no image present at all; you are only ‘thinking’ of
the object“). The questionnaire was translated into Spanish by the group of Vila at the
“Departamento de Personalidad, Evaluación y Tratamiento Ps icológico”, University of
Granada. Concerning psychometric properties, Juhasz (1972) found a Cronbach’s alpha
between .95 and .99 within an University sample. Sheehan (1967b) reported a test-retest
reliability of .78 (for an overview see also White, Sheehan & Ashton, 1977). The
questionnaire was used for the first time in a Spanish sample, so information does not exist
on psychometric characteristics in a Spanish sample. The purpose for the use of this
questionnaire was to control for effects that could result rather due to differences in imagery-
ability and not in activation of the fear network.
Personal constructed scenes
Participants had to fill out a questionnaire, named “Personal constructed scenes” (see
Appendix A-15), which was originally developed by the group of Lang at the “ Center for
the study of emotion and attention”, at the University of Florida. This questionnaire was
adapted and translated into Spanish by the group of Vila at the “Departamento de
Personalidad, Evaluación y Tratamiento Psicológico”, University of Granada. Participants
had to describe six situations based on a personal experience, with two scenes referring to
7 Meanwhile, there exist several and more currently adapted versions of the BDI (see Beck, Steer & Brown, 1996). As the Spanish translation though refers to the in 1979 published version by Beck and colleagues, information given on psychometric properties refers to that version (Beck, Kovacs & Weissman, 1979).
Methods
64
pleasant, physically arousing scenes, two referring to neutral, relaxing scenes and two
referring to a situation concerning fear. Social anxiety subjects had to describe situations
related to social anxiety, whereas control subjects described situations, where they had once
experienced fear or anxiety in their life. Each scene first had to be described in their own
words as detailed and tangible as possible. Then, an additional rating concerning the
presence of several bodily sensations, given as a list in the described questionnaire, like “my
heart races” or “my whole body shakes”, had to be made. These six scenes were used to
construct the below described six personalized imagery-scenes, individually for each
participant.
Pre-imagery questionnaire
In order to control for possible effects due to familiarity and frequency with which the
standardized scenes are imagined, participants were given a questionnaire, named “Pre -
imagery” (see appendix A-16), that was developed by Lang’s group at the “ Center for the
study of emotion and attention”, at the University of Florida. This questionnaire was adapted
and translated into Spanish by the group of Vila at the “Departamento de Personalidad,
Evaluación y Tratamiento Psicológico”, University of Granada. After presenting two
standard examples, translated from the English original version, participants had to rate
seven scenes which contained one demo-example and the above mentioned standardized
scenes. Each item had to be rated on the dimension familiarity, in terms of a Likert-scale
from 1 (= “no such previous experience“) to 9 (= “exactly describes a previous experience“)
and on the dimension concerning the frequency with which each scene is usually imagined,
in terms of a Likert scale from 1 (= “never thought about it”) to 9 (= “have often vividly
imagined it“).
Self-assessment manikin
The Self-assessment manikin, abbreviated SAM (see Appendix A-17) by Bradley and Lang
(1994) is based on a non-verbal pictorial method and measures affective report on three
dimensions, namely valence, arousal and dominance due to different stimuli. Each
dimension is represented by graphical figures on a continuous scale. Valence is represented
on the beginning of the scale by an unhappy looking figure and at the end of the scale by a
smiling figure. Analogous arousal is represented at the beginning of the scale by an excited
and agitated figure with wide-open eyes and at the end of the scale by a relaxed and sleepy
figure. Dominance is represented at the beginning of the scale by a little figure, which
Methods
65
represents participant’s feelings of control at a minimum due to the situation. At the end of
the scale, dominance is represented by a tall figure, which represents a maximum of
participant’s feelings of control due to the situation or due to the stimulus. For each stimulus
within the picture as well as within the imagery paradigm participants rate on each
dimension the figure that represents best their inner state elicited by this stimulus. Each scale
consists of five figures and between each figure there is some space left, so that participants
give their ratings on an equivalent of a 9-point Likert-scale. Items concerning the arousal
subscale have to be converted. In this study the paper-pencil version of the SAM was used.
Post-imagery questionnaire
To enable participants to rate the imagined scenes on the three dimensions of the SAM, the
so-called “Post -imagery questionnaire” (see Appendix A -18) was presented. This
questionnaire contains one demo-example and the 12 imagery scenes.
3.2.2 Pictures
For the picture paradigm 30 pictures were selected from the International Affective Picture
System, a collection of standardized photographic materials (Center for the Study of
Emotion and Attention, 1999; Lang, Bradley & Cuthbert, 1999). Pictures were chosen based
on previously collected normative ratings on the three dimensions of valence, arousal and
dominance. These ratings were originally obtained in a study by Lang and colleagues (Lang,
Bradley & Cuthbert, 1999) and have been replicated within a Spanish sample by Molto, Vila
and colleagues (Moltó et al., 1999; Vila et al., 2001). The aim of the present study was to
select three groups of pictures with reference made to the results obtained by the Spanish
sample: one group of pictures, that was rated as maximally pleasant and highly arousing, one
that was rated as maximally unpleasant and arousing, as well as one group of pictures that
was rated as neutral and with little or no arousal. The category pleasant pictures contained
two content categories: erotic couples, and adventure/sports, for each content category there
were five pictures. The category neutral contained mainly household objects, overall ten
pictures, and the category unpleasant included the following two content categories:
human/animal threat and physical injury/disgust, each containing five pictures. In total, 30
pictures as slides were presented into the participant’s room onto a 1,50 x 1,50 -meter screen
approximately 1,5 meters away from the participant.
Methods
66
3.2.3 Imagery-scenes
For the imagery paradigm 12 scenes were presented, each belonging to one of the three
categories of valence: pleasant, neutral or fear-related, where pleasant and fear-related
scenes were characterized by descriptions of high physiological arousal and neutral scenes
by descriptions of low arousal, analogue to the above described groups of pictures. Each
valence category contained two standardized and two personalized scenes, with the latter
formulated by each participant in the above mentioned questionnaire “Personal constructed
scenes”. The two standardized pleasant scenes consisted of a description of a winning
situation and a sportive situation, whereas both standardized neutral scenes contained
relaxation scenes and the two standardized fear-related scenes consisted of a description of a
danger and a social situation (see appendix A-18). Standardized fear-related and neutral
scenes were translated and adapted from scenes presented in the study by Cuthbert and
colleagues (Cuthbert et al., 2003). Scenes consisted of approximately two to three sentences,
containing approximately 25 to 35 words for each scene, including the three types of
information, that are assumed in the fear network model: a short description of the situation,
thoughts, feelings and the physiological perception the person has due to the situation. All
sentences were recorded by a female Spanish native speaker who was instructed to use
minimal prosody.
3.2.4 Acoustic stimuli
The acoustic defense stimulus was a burst of white noise - a mixture of frequencies between
0 and 20.000 Hz - with an intensity of 100 Decibel (dB), with instantaneous rise time and
with a duration of 500 milliseconds (ms). Startle probes, presented within the picture and
imagery paradigm, consisted of the same acoustic stimulus -100 dB and instantaneous rise
time- but with a duration of 50 ms. Soft tones of 960 Hz, presented in the imagery paradigm,
were characterized by an uniform intensity of 68 dB and a duration of 500 ms.
3.2.5 Apparatus
For the timing, the acquisition of physiological data and the presentation of stimuli, the VPM
software (Version 11, Cook, 2000) was used. This software controlled an Advantech card,
model PCL 812 PG, with a 12 bits analog-digital converter and digital input-output
functions, running on a PC-Pentium computer. The programmable voltage range was set at
+/- 2.5 Volts.
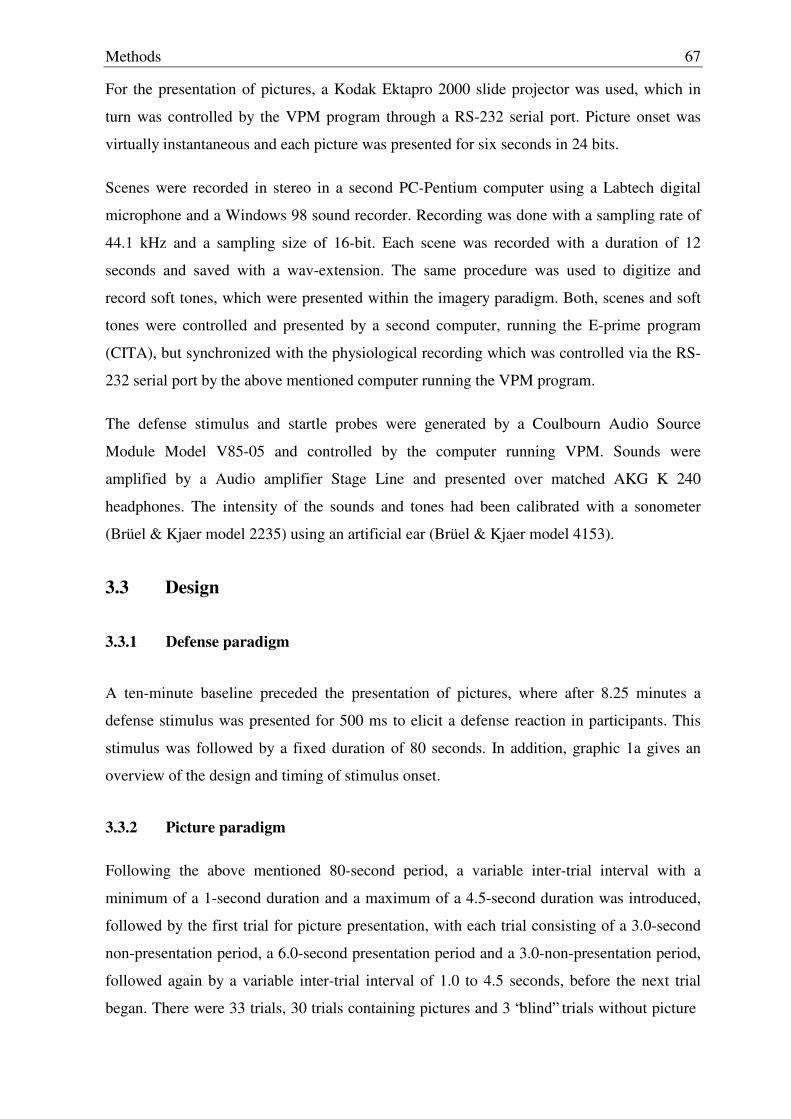
Methods
67
For the presentation of pictures, a Kodak Ektapro 2000 slide projector was used, which in
turn was controlled by the VPM program through a RS-232 serial port. Picture onset was
virtually instantaneous and each picture was presented for six seconds in 24 bits.
Scenes were recorded in stereo in a second PC-Pentium computer using a Labtech digital
microphone and a Windows 98 sound recorder. Recording was done with a sampling rate of
44.1 kHz and a sampling size of 16-bit. Each scene was recorded with a duration of 12
seconds and saved with a wav-extension. The same procedure was used to digitize and
record soft tones, which were presented within the imagery paradigm. Both, scenes and soft
tones were controlled and presented by a second computer, running the E-prime program
(CITA), but synchronized with the physiological recording which was controlled via the RS-
232 serial port by the above mentioned computer running the VPM program.
The defense stimulus and startle probes were generated by a Coulbourn Audio Source
Module Model V85-05 and controlled by the computer running VPM. Sounds were
amplified by a Audio amplifier Stage Line and presented over matched AKG K 240
headphones. The intensity of the sounds and tones had been calibrated with a sonometer
(Brüel & Kjaer model 2235) using an artificial ear (Brüel & Kjaer model 4153).
3.3 Design
3.3.1 Defense paradigm
A ten-minute baseline preceded the presentation of pictures, where after 8.25 minutes a
defense stimulus was presented for 500 ms to elicit a defense reaction in participants. This
stimulus was followed by a fixed duration of 80 seconds. In addition, graphic 1a gives an
overview of the design and timing of stimulus onset.
3.3.2 Picture paradigm
Following the above mentioned 80-second period, a variable inter-trial interval with a
minimum of a 1-second duration and a maximum of a 4.5-second duration was introduced,
followed by the first trial for picture presentation, with each trial consisting of a 3.0-second
non-presentation period, a 6.0-second presentation period and a 3.0-non-presentation period,
followed again by a variable inter-trial interval of 1.0 to 4.5 seconds, before the next trial
began. There were 33 trials, 30 trials containing pictures and 3 “blind” trials without picture
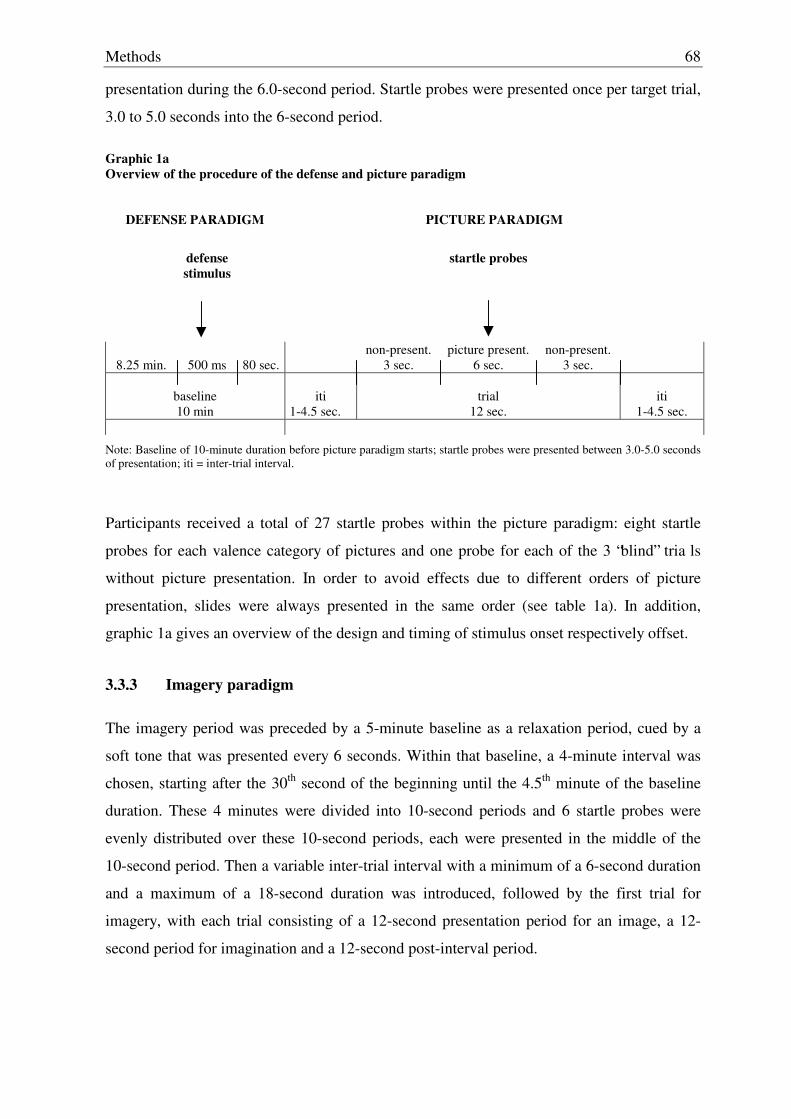
Methods
68
presentation during the 6.0-second period. Startle probes were presented once per target trial,
3.0 to 5.0 seconds into the 6-second period.
Graphic 1a Overview of the procedure of the defense and picture paradigm
DEFENSE PARADIGM
PICTURE PARADIGM
defense stimulus
startle probes
8.25 min.
500 ms
80 sec.
non-present. 3 sec.
picture present. 6 sec.
non-present. 3 sec.
baseline 10 min
iti
1-4.5 sec.
trial
12 sec.
iti
1-4.5 sec.
Note: Baseline of 10-minute duration before picture paradigm starts; startle probes were presented between 3.0-5.0 seconds of presentation; iti = inter-trial interval.
Participants received a total of 27 startle probes within the picture paradigm: eight startle
probes for each valence category of pictures and one probe for each of the 3 “blind” tria ls
without picture presentation. In order to avoid effects due to different orders of picture
presentation, slides were always presented in the same order (see table 1a). In addition,
graphic 1a gives an overview of the design and timing of stimulus onset respectively offset.
3.3.3 Imagery paradigm
The imagery period was preceded by a 5-minute baseline as a relaxation period, cued by a
soft tone that was presented every 6 seconds. Within that baseline, a 4-minute interval was
chosen, starting after the 30th second of the beginning until the 4.5th minute of the baseline
duration. These 4 minutes were divided into 10-second periods and 6 startle probes were
evenly distributed over these 10-second periods, each were presented in the middle of the
10-second period. Then a variable inter-trial interval with a minimum of a 6-second duration
and a maximum of a 18-second duration was introduced, followed by the first trial for
imagery, with each trial consisting of a 12-second presentation period for an image, a 12-
second period for imagination and a 12-second post-interval period.
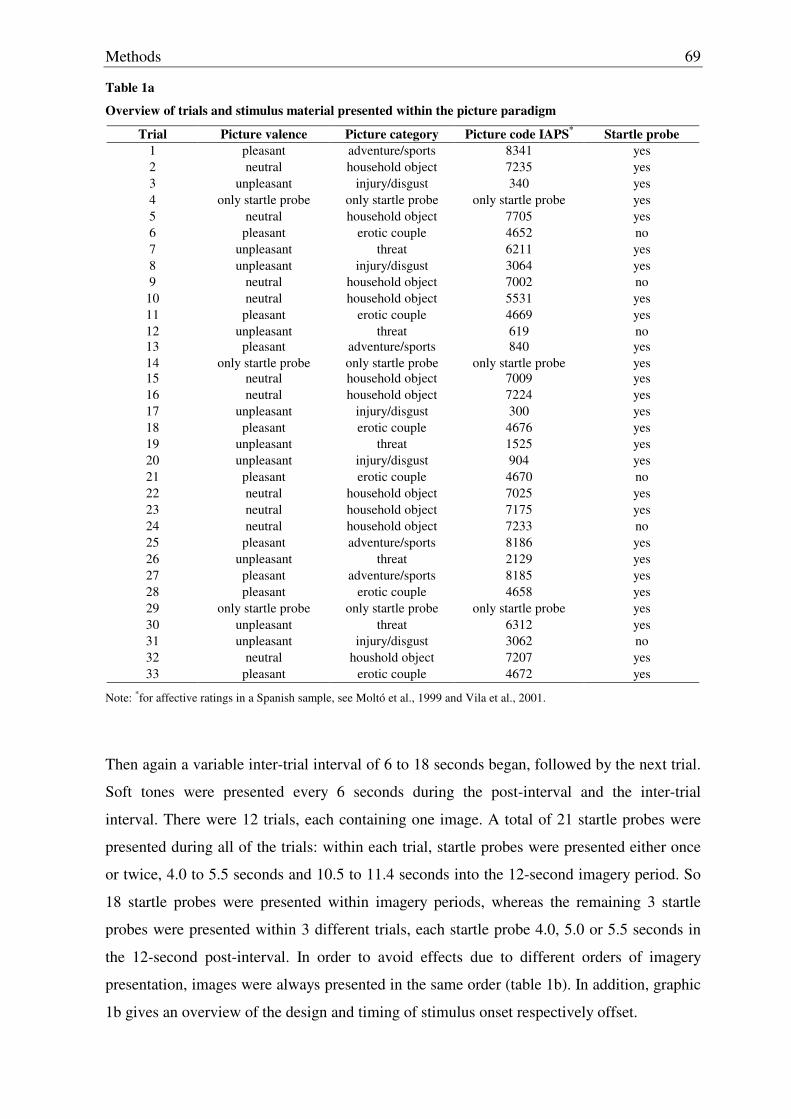
Methods
69
Table 1a
Overview of trials and stimulus material presented within the picture paradigm
Trial Picture valence Picture category Picture code IAPS* Startle probe 1 pleasant adventure/sports 8341 yes 2 neutral household object 7235 yes 3 unpleasant injury/disgust 340 yes 4 only startle probe only startle probe only startle probe yes 5 neutral household object 7705 yes 6 pleasant erotic couple 4652 no 7 unpleasant threat 6211 yes 8 unpleasant injury/disgust 3064 yes 9 neutral household object 7002 no
10 neutral household object 5531 yes 11 pleasant erotic couple 4669 yes 12 unpleasant threat 619 no 13 pleasant adventure/sports 840 yes 14 only startle probe only startle probe only startle probe yes 15 neutral household object 7009 yes 16 neutral household object 7224 yes 17 unpleasant injury/disgust 300 yes 18 pleasant erotic couple 4676 yes 19 unpleasant threat 1525 yes 20 unpleasant injury/disgust 904 yes 21 pleasant erotic couple 4670 no 22 neutral household object 7025 yes 23 neutral household object 7175 yes 24 neutral household object 7233 no 25 pleasant adventure/sports 8186 yes 26 unpleasant threat 2129 yes 27 pleasant adventure/sports 8185 yes 28 pleasant erotic couple 4658 yes 29 only startle probe only startle probe only startle probe yes 30 unpleasant threat 6312 yes 31 unpleasant injury/disgust 3062 no 32 neutral houshold object 7207 yes 33 pleasant erotic couple 4672 yes
Note: *for affective ratings in a Spanish sample, see Moltó et al., 1999 and Vila et al., 2001.
Then again a variable inter-trial interval of 6 to 18 seconds began, followed by the next trial.
Soft tones were presented every 6 seconds during the post-interval and the inter-trial
interval. There were 12 trials, each containing one image. A total of 21 startle probes were
presented during all of the trials: within each trial, startle probes were presented either once
or twice, 4.0 to 5.5 seconds and 10.5 to 11.4 seconds into the 12-second imagery period. So
18 startle probes were presented within imagery periods, whereas the remaining 3 startle
probes were presented within 3 different trials, each startle probe 4.0, 5.0 or 5.5 seconds in
the 12-second post-interval. In order to avoid effects due to different orders of imagery
presentation, images were always presented in the same order (table 1b). In addition, graphic
1b gives an overview of the design and timing of stimulus onset respectively offset.
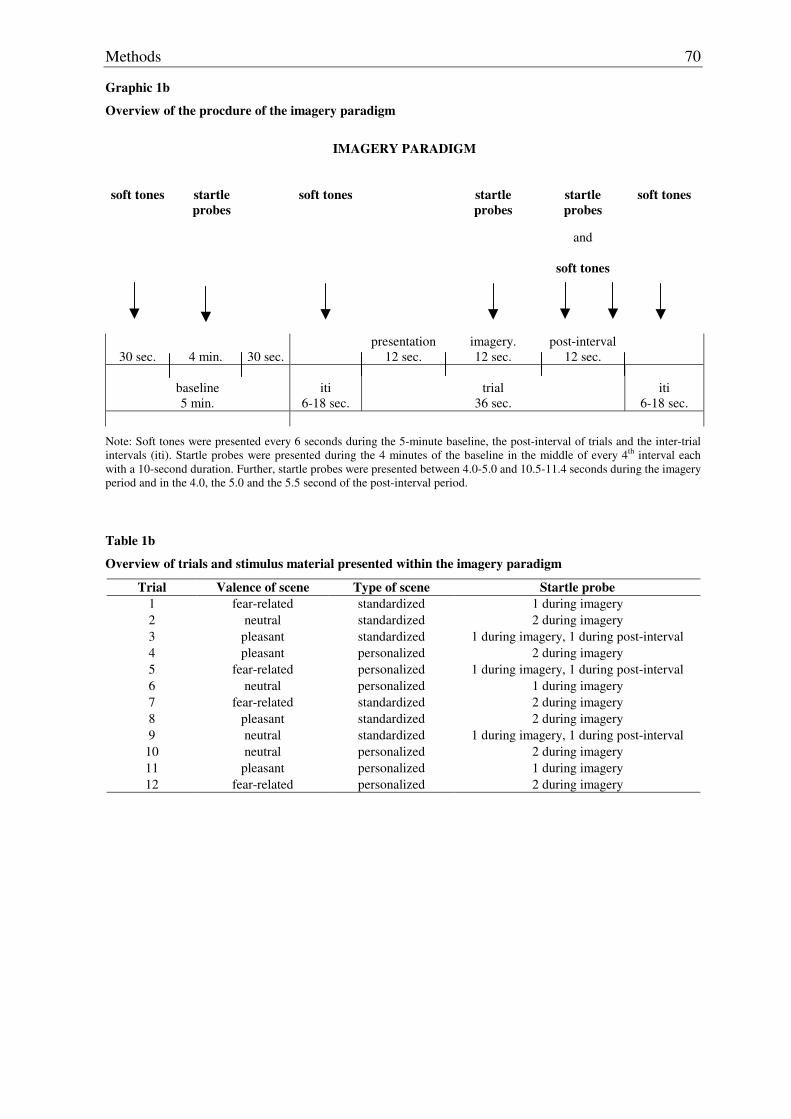
Methods
70
Graphic 1b
Overview of the procdure of the imagery paradigm
IMAGERY PARADIGM
soft tones
startle probes
soft tones
startle probes
startle probes
and
soft tones
soft tones
30 sec.
4 min.
30 sec.
presentation 12 sec.
imagery. 12 sec.
post-interval 12 sec.
baseline 5 min.
iti
6-18 sec.
trial
36 sec.
iti
6-18 sec.
Note: Soft tones were presented every 6 seconds during the 5-minute baseline, the post-interval of trials and the inter-trial intervals (iti). Startle probes were presented during the 4 minutes of the baseline in the middle of every 4th interval each with a 10-second duration. Further, startle probes were presented between 4.0-5.0 and 10.5-11.4 seconds during the imagery period and in the 4.0, the 5.0 and the 5.5 second of the post-interval period.
Table 1b
Overview of trials and stimulus material presented within the imagery paradigm
Trial Valence of scene Type of scene Startle probe 1 fear-related standardized 1 during imagery 2 neutral standardized 2 during imagery 3 pleasant standardized 1 during imagery, 1 during post-interval 4 pleasant personalized 2 during imagery 5 fear-related personalized 1 during imagery, 1 during post-interval 6 neutral personalized 1 during imagery 7 fear-related standardized 2 during imagery 8 pleasant standardized 2 during imagery 9 neutral standardized 1 during imagery, 1 during post-interval
10 neutral personalized 2 during imagery 11 pleasant personalized 1 during imagery 12 fear-related personalized 2 during imagery
Methods
71
3.4 Physiological response measurement
As already mentioned above, data acquisition was accomplished by using VPM and each
physiological signal ranging between -2.5 to 2.5 Volts could be converted into a digital
number with a possible range between 0 and 4095.
Depending on the characteristics of each physiological parameter, sampling rates were
chosen differently: EMG and respiration were sampled at 20 Hz, skin conductance and blood
pressure at 50 Hz and pulse at 100 Hz. EMG responses towards the defense and startle
stimuli were sampled at 1000 Hz, 500 ms prior to the onset of each stimulus probe and for
one second following the defense probe onset, respectively for 550 ms following startle
probe onset. Heart rate also had a sampling rate of 1000 samples per second but referring
only to the R wave and not the continuous sampling of the ECG.
Depending on each paradigm, physiological parameters were recorded of variable duration:
within the defense paradigm signals were recorded 15 seconds before the presentation of the
defense stimulus and for a duration of 80 seconds including the 0.5-second presentation of
the defense stimulus. Within the picture paradigm, physiological signals were recorded
during each trial, 3 seconds before picture onset, 6 seconds before presentation and 3
seconds after picture presentation (see graphic 1a). Within the imagery paradigm,
physiological signals were recorded during a 4-minute baseline, followed by a period of 30
seconds without recording. Then, within each imagery trial, signals were recorded during 36
seconds, including 12 seconds of presentation of the scene, 12 seconds of imagination and
12 seconds of post-interval (see graphic 1b). Respiration was only recorded within the
defense and imagery paradigm, because the relatively short period preceding picture onset
and also picture presentation do not allow a meaningful interpretation of respiratory related
parameters.
Concerning the assessment of electrodermal activity, a small current was passed through
electrodes that were placed on the hypothenar eminence of the left palmar surface using
Sensormedics standard electrodes (Sensormedics, Yorba Linda, CA) filled with K-Y Jelly
Gel. According to Lykken and Venables (1971) who argue that skin conductance seems to
be more linearly related to the number of active sweat glands and their rate of secretion, skin
conductance was chosen for the physiological measurement of this study. The signal was
acquired with a Coulbourn isolated skin conductance coupler model V71-23, in DC coupling
and calibrated prior to each session to adjust activity in the range from 0-50 Microsiemens.
Methods
72
The electrocardiogram was recorded from derivation I, from the left and right forearm, and
only if the QRS wave was too small, the signal was recorded from derivation II, left leg and
the right forearm, using large Sensormedics electrodes (Sensormedics, Yorba Linda, CA)
filled with electrolyte paste (Sigma Gel Parker ref. 15-6-). The signal was acquired with a
Coulbourn isolated ECG amplifier model V75-11 with a sensitivity range between 0.5 and
10 Volts per Millivolts (V/mV) including a notch filter of 50 Hz. The signal was then filtered
using a Coulbourn high performance bandpass filter model V75-48 within a range of 2.0 to
30 Hz. Each time a cardiac R-wave was detected, a Schmitt trigger sent a signal to the digital
input converter of the PCL 812 card of the computer. Interbeat intervals were recorded by
the VPM-EVENT program with a resolution of 1.000 Hz, that means with the precision of a
millisecond.
The eye blink, an important component of the startle response was measured by
Sensormedics miniature electrodes filled with electrode gel (Sigma Gel Parker ref. 15-60)
placed over the left orbicularis oculi muscle region, beneath the lower eyelid as
recommended by Fridlund and Cacioppo (1986), recording EMG activity using a Coulbourn
isolated bioamplifier with bandpass filter model V74-04. The raw EMG signal was amplified
by a range between 500 and 1000 Microvolts. Frequencies below 90 Hz and above 1000 Hz
were filtered. The raw signal was rectified and integrated using a Coulbourn multi-function
integrator model V76-23, with an actual time constant of 100 ms.
Blood pressure was measured by a Finapress Ohmeda 2300 (BOC Health Care), using a
finger cuff applied to the middle phalanx of the middle finger. Blood pressure is determined
by fluctuations in cuff pressure. With rising blood pressure, the arterial wall expands and
finger volume increases. A transducer placed in the cuff measures the volume difference and
cuff pressure is heightened at once until the original arterial size and blood volume are re-
established. The fluctuation in cuff pressure follows intra-arterial pressure and therefore
arterial blood pressure is measured continuously as a function of the external pressure
applied through the cuff (Brownley, Hurwitz & Schneiderman, 2000). The signal was
recorded by the VPM program with a sensitivity range between 0-500 Millimeter Mercurio
(mm) and amplified by 100 Millimeter Mercurio per Volt (mmHg).
Pulse was measured by a photoelectric sensor cuff of a transducer CI infrared LED and
Phototransistor. The signal was recorded by a Coulbourn pulse monitor optical densitometer
model V71-40 with a constant sensitivity and filtered between 0.5 Hz and 10 Hz.
Methods
73
Respiration was measured using a strain gage transducer, attached around the participant’s
chest. When the subject inhales, the chest expands and the resulting increase in the cord’s
tension is transformed into an increase in voltage. Analogue to this, when the subject
exhales, the chest relaxes and results into a decrease in voltage. Amplitude reflects the
difference between maximal inhalation and maximal exhalation, whereas respiratory is
defined as the amount of respirations per minute. The signal was amplified at a range
between 50 and 100 Microvolts, using an auto-balance control with a direct current coupling
(DC) resistive. Amplitude and respiration rate were used as parameters for further analysis.
3.5 Procedure
First, a screening was carried out at the “Facultad de Psicologia”, t he “Facultad de Ciencias
de la Educación” and the “Escuela Universitaria de Ciencias de la Salud” of the University
of Granada and with the approval of the particular lecturer, 575 students voluntarily filled
out the above described instruments, namely the SPIN, the SIAS, the SPS and the SSPS
during the last 20 minutes of class. Questionnaires were presented in four different orders.
For this study, participants scoring highest and lowest on questionnaire measurements were
selected by the following criteria: first, participant’s scoring higher than 25 in the SPIN, at
least 12 in the SIAS and at least 18 in the SPS were assigned to the group of social phobic
participants. These subjects ranged in the SSPS concerning the negative self-statement scale
between 1 and 19 and in the positive self-statement scale between 8 and 21. Control
participants had to score 14 or lower in the SPIN, 15 or lower in the SIAS and the SPS. They
ranged in the SSPS concerning the negative self-statement scale between 0 and 3 and in the
positive self-statement scale between 14 and 24. Except in the SPIN and in the SPS
participants of the two groups overlapped slightly due to their scoring, which could not be
avoided given the fact, that the above-described profile deduced from four different
questionnaires had to be fulfilled per participant and be matched by gender.
Subjects were recruited by phone-call, briefly informed that the study would be on social
behavior and that the procedure would include two single sessions, one questionnaire-based
assessment and one on psychophysiological assessment. If participants agreed they were
given an appointment for the first session at the “Departamento de Personalidad, Evaluación
y Tratamiento Psicológico”.
In the first session with an approximate duration of 30 to 45 minutes, the participant was
informed about the procedure and signed a consent form (see Appendix A-19). Then the
Methods
74
ADIS was administered. In all, seven participants were then excluded, because they showed
inconsistent results in the ADIS compared to their screening profile, that could neither be
interpreted unambiguously as social anxiety nor as control condition. Then the participant
filled out the questionnaire Personal constructed scenes. The questionnaire on
sociodemographic information, the SPAI, the SISST, the ASI, the STAI trait scale, the
PSWQ, the BDI and the QMI were given to the subject to fill out at home. The appointment
for the second session that includes psychophysiological recording was made approximately
one week after the assessment session. Between the first and the second session, the voice
recording of personalized scenes was made.
Before starting psychophysiological recording in the second session with a duration of
approximately two hours, the participant was asked to return the filled out questionnaires
and further to fill out the STAI state scale and the Pre-imagery questionnaire. Then the
participant sat in a reclined chair in a small, dimly lit room and was familiarized with the
protocol. After sensors had been attached, the subject received instructions with regard to the
combined defense and picture protocol. The participant was instructed to relax, keep his eyes
open and to carefully attend to the picture stimuli, that would be presented after a relaxation
period. It was explained that brief noises heard over headphones could simply be ignored.
Then data collection began. Within the above relaxation period the acoustic defense stimulus
was given and the recording of the defense reaction occurred before the first picture was
presented. After the last picture had been presented, the experimenter entered the room and
asked the participant to give a rating due to the intensity and aversivity of the defense
stimulus, each on a scale from 0 (= not intensive at all”, respectively “not aversive at all”) to
100 (= “maximal intensive”, respectively “maximal aversive”). Then the experimenter gave
instructions for the imagery protocol, where the participant had to relax, when hearing tones,
to breathe slowly and to silently repeat the word “one”, which was intended to reduce and
stabilize physiological activity. Furthermore the regulated breathing should provide the
context of a specific task and therefore impose some constraints on processing images during
relaxation periods. Next, the participant was instructed to carefully attend the description of
the imagery-scene. As soon as the description ended the participant should vividly imagine
him/herself actively being involved in the specific scene that had been presented, imagining
it actively until hearing the next tone, at which he/she should again silently repeat the word
“one” and relax. Again, it was explained that brief noises heard over headphones could
simply be ignored. Following these instructions, a demonstration program was run,
presenting one neutral imagery-scene which served as “control scene”. The experimenter
Methods
75
reviewed with the participant the imagery task regarding the demonstration and then, data
collection began.
Following the completion of the imagery protocol, sensors were removed and participants
were asked to make ratings of the 13 imagery scenes, including the neutral image of
demonstration on the three dimensions of the Self-assessment manikin. For this purpose, the
Post-imagery questionnaire was presented at the same time, in order to use the 13 printed
imagery scenes as reminders of the imagined scene. After completing the rating due to the
images, the participant was presented the 30 pictures again on the screen and were asked to
give a rating on the Self-assessment manikin. The participant was subsequently debriefed,
given credit and thanked. In all, an additional 8 subjects had to be excluded from the study;
three did not show up for the second appointment, one participant had to be excluded due to
health related problems and four participants were excluded due to technical problems
concerning the equipment, as the physiological responses were not recorded appropriately.
In addition, depending on each paradigm and physiological parameter data of subjects had to
be excluded from the analysis due to equipment failures or noise during recording of data:
within the defense and the picture paradigm, data of two subjects were excluded for systolic
and diastolic blood pressure, data of three subjects were excluded for pulse, data of six
subjects were excluded for skin conductance and data of one subject were excluded for the
startle reflex. Within the imagery paradigm, data of eight subjects had to be excluded for
pulse and data of five individuals repectively for systolic and diastolic blood pressure,
respiration amplitude, respiration rate and the startle reflex. For skin conductance, data of
five subjects had to be excluded.
3.6 Data reduction
For heart rate, the VPM-EVENT program together with programs based on VPM and
developed by the group of Vila at the “Departamento de Personalidad, Evaluación y
Tratamiento Psicológico”, University of Granada, were used to reduce heart rate in beats per
minute, in half-second bins. For all other parameters, the VPM-ANLOG program together
with programs based on VPM and developed by the group of Vila at the “Departamento de
Personalidad, Evaluación y Tratamiento Psicológico”, University of Granada, were used to
reduce data. The eye blink data were reduced off-line using a program that scored the onset
of the startle response to its maximum amplitude in Microvolts within a period between 20
Methods
76
ms and 120 ms after probe onset using the integrated EMG signal. Trials with clear artifacts
were rejected, while trials with no responses were scored as zero magnitude blinks.
Absolute scores that were obtained by recording data within skin conductance, heart rate,
EMG and blood pressure were relativized with a baseline measurement in order to obtain
change scores. Therefore, the principal procedure to obtain change scores remains the same
with regard to the mentioned parameters and within the several paradigms, although the
amount of change scores obtained differ due to the duration of recording time within each
paradigm and also due to the different number of data points obtained per second, with two
data points per second for skin conductance, heart rate and EMG and one data point per
second for pulse amplitude and blood pressure, with which data were reduced.
As pulse and respiration are assessed via transducers and due to their variable pressure and
the variable amplification, they cannot be calibrated. Therefore no absolute but only relative
scores can be obtained. So pulse and respiration scores reflect the percentage of change,
relative to a baseline. They were calculated by subtracting the mean score calculated from a
preceding baseline from each score that had to be relativized, followed by a division through
the preceding mean score and multiplied by 100. So a percentage change score of zero
would indicate no change compared to the baseline measurement, whereas a percentage
score of 200 for example would indicate a score three times higher relative to the baseline
score.
3.6.1 Defense paradigm
Responses in heart rate, skin conductance, blood pressure and EMG towards the defense
stimulus were determined by calculating for each parameter a mean score for the activity
occurring within the 15-second baseline and subtracting this mean score from activity
occurring each second during the next 80 seconds including the defense stimulus. Analogue
to this for pulse, percentage change scores were calculated, using the mean score within the
15-second baseline to relativize each of the scores occurring within the following 80
seconds. Then, the first 76 seconds of the 80-second period were divided into 10 intervals of
different duration: Two intervals, each consisting of a 3-second duration, followed by two
intervals each consisting of a 5-second duration. They were followed by three intervals each
of a 7-second duration and three intervals each of a 13-second duration. Within each interval
a median was calculated, resulting in a median in the 2nd, the 5th, the 9th, the 14th, the 20th ,
the 27th, the 34th, the 44th, the 57th and the 70th second within the 76-second period. So,
Methods
77
depending on the duration of each interval a different amount of change scores and
percentage change scores for pulse respectively, entered into the calculation of the medians.
These intervals were chosen to adjust the characteristics of the heart rate response towards
the defense stimulus, which is characterized by a short acceleration, usually with a duration
between 3 and 6 seconds, followed by a deceleration, usually with a duration between 5 and
10 seconds. Then, a second acceleration occurs, usually with a duration between 30 and 40
seconds, followed by a final deceleration which usually lasts the last 20 seconds of the 80-
second interval (Fernández, 1987; Fernández & Vila, 1989a; Fernández & Vila, 1989b). So,
the second acceleration and deceleration are usually slower. In order to ensure comparable
conditions, the same time intervals were also applied for skin conductance, pulse, blood
pressure and EMG. For respiration, a mean score for the activity occurring within the 15-
second baseline was calculated and used to obtain percentage change scores within the
following 45 seconds. This period was divided into three intervals, each of 15-second
duration. For each of these three intervals means were calculated and the percentage change
score from the baseline was calculated. This procedure was chosen, because respiration is
typically a slow-move response. The startle reflex towards the defense stimulus includes
only one magnitude-score that reflects activity from the onset of the defense response to its
maximum amplitude in Microvolts within a period between 20 ms and 120 ms within the
first half-second of probe onset.
From the 5-minute baseline preceding the defense stimulus, the following cardiac parameters
were obtained in order to assess cardiac variability: Mean weighted average heart rate, mean
heart period, the square rooted successive difference mean for heart rate and the square
rooted successive difference mean of heart period, with the latter one as the index most
frequently used to estimate heart rate variability in the period (Thayer & Siegel, 2002).
3.6.2 Picture paradigm
Responses in skin conductance, heart rate, EMG and blood pressure towards picture
presentation were determined by calculating a mean score for the activity occurring within
the 2.5-second period8 prior to picture presentation and subtracting this mean score from
activity occurring each half-second following the 6-second onset of picture. For pulse the
same procedure was applied with one exception; that the mean score prior to picture
8 The first half second of the 3-second period preceding picture presentation was not included to make sure that data would be reduced correctly without initial errors, as these parameters were reduced with half-second change scores.
Methods
78
presentation was calculated including a 2-second period prior to picture presentation9 and
that this mean was subtracted from activity occurring each second following picture onset.
This was followed by the calculation of percentage change scores. For all the above
mentioned parameters, change scores and percentage change scores respectively were
averaged separately for each valence category. Respiration was not assessed within the
picture paradigm due to the short time intervals per trial.
With regard to the startle data obtained within the picture paradigm, the mean of the
magnitude for the three startle probes presented during the inter-trial intervals was calculated
and subtracted from each magnitude value obtained during the 6-second picture presentation
to centralize scores. These values were then divided by the average standard deviation
during picture presentation to reduce the heterogeneity of variances and transformed into t-
scores (see Bortz, 1993). From these t-scores means were calculated by valence of pictures,
namely pleasant, neutral and unpleasant.
3.6.3 Imagery paradigm
Responses in skin conductance, heart rate, EMG and blood pressure towards the imagery
scenes were determined by calculating a mean score for the activity occurring within the first
second of image presentation and subtracting this mean score from activity occurring each
half-second following 10 seconds of image presentation, the first 10 seconds of imagery and
the first 10 seconds of the post-interval. For pulse the same procedure was applied with the
one exception, that the mean score was subtracted from activity occurring each second
following presentation, the first 10 seconds of imagery and the first 10 seconds of the post-
interval. For these so obtained change scores and the percentage change scores for pulse
respectively, average change scores were calculated separately for the presentation, imagery
and post-interval period, by valence, namely pleasant, neutral and fear-related, by type of
scene, namely standardized versus personalized and by trial, namely two per type and
valence of scenes.
For respiration, the mean of the baseline was calculated by the activity within the 12-second
period of image presentation including 12 data points. This mean activity was subtracted
from each second following the 12-second imagery period and the 12-second post-interval
9 The first second of the 3-second period preceding picture presentation was not included to make sure that data would be reduced correctly without initial errors, as pulse was reduced with one second change scores.
Methods
79
period. Then for the imagery and the post-interval period separately, percentage change
scores were averaged by valence, type of scene and trial.
With regard to the startle data the mean of the magnitude for the three startle probes
presented during the post-interval period was calculated and subtracted from each magnitude
value of the imagery period to centralize scores (see Bortz, 1993). These values were then
divided by the average standard deviation during the imagery period to reduce the
heterogeneity of variances and were transformed into t-scores (see Bortz, 1993). From these
t-scores referring only to the imagery period, means were calculated by valence, type of
scene and trial.
In order to be able to control for a possible elevated physiological response in social phobic
participants during the imagery period, the averaged mean within each subject and for each
of the three levels of valence within each physiological parameter was checked. If they
differed one standard deviation or more from the mean for all social phobic participants, this
was interpreted as an elevated physiological response within the concerning physiological
parameter10.
3.7 Data analysis
Statistical analyses were calculated with modules of the “Statistical package for the social
sciences” (SPSS ). It can be assumed that data pertaining to physiological parameters as
well as to questionnaires are interval scaled. Due to small sample sizes, the validity of the
central limit theorem, normal distribution of means cannot be assumed. Therefore, the pre-
conditions to conduct analyses of variances and t-tests were examined within each paradigm
and for each physiological parameter as well as for the employed questionnaires, including
the Self-assessment manikin rating. To examine the assumption of the normal distribution of
means, Saphiro-Wilk tests were performed (see Bortz, 1993). To examine the assumption
concerning the homogeneity of variances when analyses of variances were employed, both
the Box test as well as the Levene test were employed, which differ from each other in so far
that the Box test examines homogeneity of both covariances and variances and therefore the
whole matrix of possible variances in terms of a multivariate procedure, whereas the Levene
test examines exclusively homogeneity of variances on the level of single comparisons (see
Diehl & Staufenbiel, 2001). Accordingly, if the Box test was not significant, no further
10 A comparable procedure with regard to grouping can be found however for questionnaire-based measures in Schwebel and Suls, 1999 or Davis, 1988.
Methods
80
Levene tests were employed. If there were less than two covariance matrices with non-
singular squares the Box test could not be employed, so only the Levene test was used. For
all three types of tests the hypothesis of normal distribution and homogeneity of variances
respectively must be rejected if the p-value equals or is smaller than 0.05. Concerning
normal distribution, analyses of variances and t-tests were employed anyway, because they
are considered as robust concerning the violation of the assumption regarding normal
distribution. In the case of employing t-tests, a significant Levene test and therefore assumed
non-homogeneous variances were corrected by using the Welch t-test. In the case of
analyses of variances, this correction is not possible. Although analyses of variances were
employed anyway, because they are considered as robust concerning the violation of the
assumptions regarding homogeneity of variances (see Bortz, 1993). However, this procedure
ensures that those means and variances for which the above mentioned assumptions cannot
be made can be identified, differentiated from those means and variances for which the
above assumptions can be made and therefore considered appropriately in the discussion of
the results.
Descriptive parameters like means and standard deviations were calculated for each scale of
the questionnaires, including the SAM-rating and each physiological parameter. To estimate
internal consistency concerning questionnaire-based variables, an analysis of reliability for
each scale was completed. Group differences were tested by t-tests for independent samples
with the independent variable group and each of the corresponding questionnaire subscales
as the dependent variable except for the SAM-rating.
For the defense paradigm, separate analyses of variance (ANOVA) with repeated
measurement including the above mentioned medians were conducted for each physiological
parameter to control for possible group differences in each parameter. So, between-subject
factor was group and within-subject factor medians, whereas gender was used as a covariate.
The covariate was included to ensure that effects relevant for the hypotheses and research
questions would not include an implicit gender effect. For heart rate variability also, analyses
of variance (ANOVA) were conducted to test for possible group differences in each
parameter, with group as between-subject factor and gender as covariate.
For the picture paradigm, separate analyses of variance (ANOVA) with repeated
measurement were conducted for each physiological parameter11, and for each subscale of
11 except for respiration, see paragraph 2.4.
Methods
81
the SAM-rating respectively to test for possible group differences in each physiological
parameter and the subscales of the SAM-rating, depending on the a priori valence of
pictures. Again the between-subject factor was group and the a priori valence of pictures the
within-subject factor. Here, average change scores were used for the analyses. In addition,
gender was included as a covariate.
Within the imagery paradigm again separate analyses of variance (ANOVA) with repeated
measurement were conducted for each physiological parameter and for each of the three
subscales of the SAM-rating respectively, to test for possible group differences in each
parameter and the subscales of the SAM-rating depending on the a priori valence of scenes.
In addition to the a priori valence, again as average change scores, type of scene and trial
were included as within-subject factor. With regard to the physiological parameters, period
was included as within-subject factor, containing presentation, imagery and post-interval
period for the analysis of heart rate, blood pressure and skin conductance. For the analysis of
respiration, only imagery and post-interval were included as levels of period. As the analysis
of startle data refer only to the imagery period, here period could not be included as within-
subject factor. Again, gender was included as covariate for the physiological parameters as
well as for the SAM-rating. In order to identify those social phobic participants with a
possibly elevated physiological response due to pleasant or neutral scenes during the
imagery period, the following criterion was used: The number of social phobic participants
was determined whose means regarding each of these two levels of valence within each
physiological parameter differed one standard deviation or more from the corresponding
mean of the social phobic participant’s group.
For all analyses that involved repeated measures with more than two levels, the multivariate
test statistic, namely Mauchly’s test of Sphericity, was employed to assess potential
sphericity issues (Vasey & Thayer, 1987). Therefore, the assumptions for univariate
comparisons were tested. If this result was significant, degrees of freedom were corrected by
Greenhouse-Geisser epsilon correction.
In the defense paradigm, each ANOVA was followed by linear, quadratic and cubic trend
tests, which were calculated - except for respiration, where only linear and quadratic tests
were calculated - in order to delineate patterns of group differences in the corresponding
particular physiological parameter depending on the ten levels of intervals. Pairwise single
comparisons for each interval were conducted to test for possible tendencies concerning
group differences.
Methods
82
In the picture and imagery paradigm, each ANOVA was followed by pairwise single
comparisons concerning interactional effects that were relevant for the hypotheses and
research questions. In addition, within the imagery paradigm, linear and quadratic trend tests
were calculated on the levels of period if this was relevant for hypotheses and research
questions.
In this context it should be mentioned that within a conservative perspective, effects of linear
and quadratic trends or pairwise single comparisons are not interpreted if results of the
analyses of variance are not significant. However, for this study, results which are relevant
for the hypotheses and research questions are documented anyway, in order to demonstrate
possible trends. With regard to results within the defense paradigm, the corresponding
hypothesis do not specify in which of the intervals assumed group differences should be
found. Therefore, to be strictly correct, the number of tests concerning single comparisons
should be corrected by the adjustment of the alpha-level by Bonferoni. However, this
correction was not applied in order to maintain at least the trend towards differences. For
post-hoc single comparisons concerning not hypotheses-relevant or research questions-
relevant results, the number of tests were corrected by the adjustment of the alpha-level by
Bonferoni.
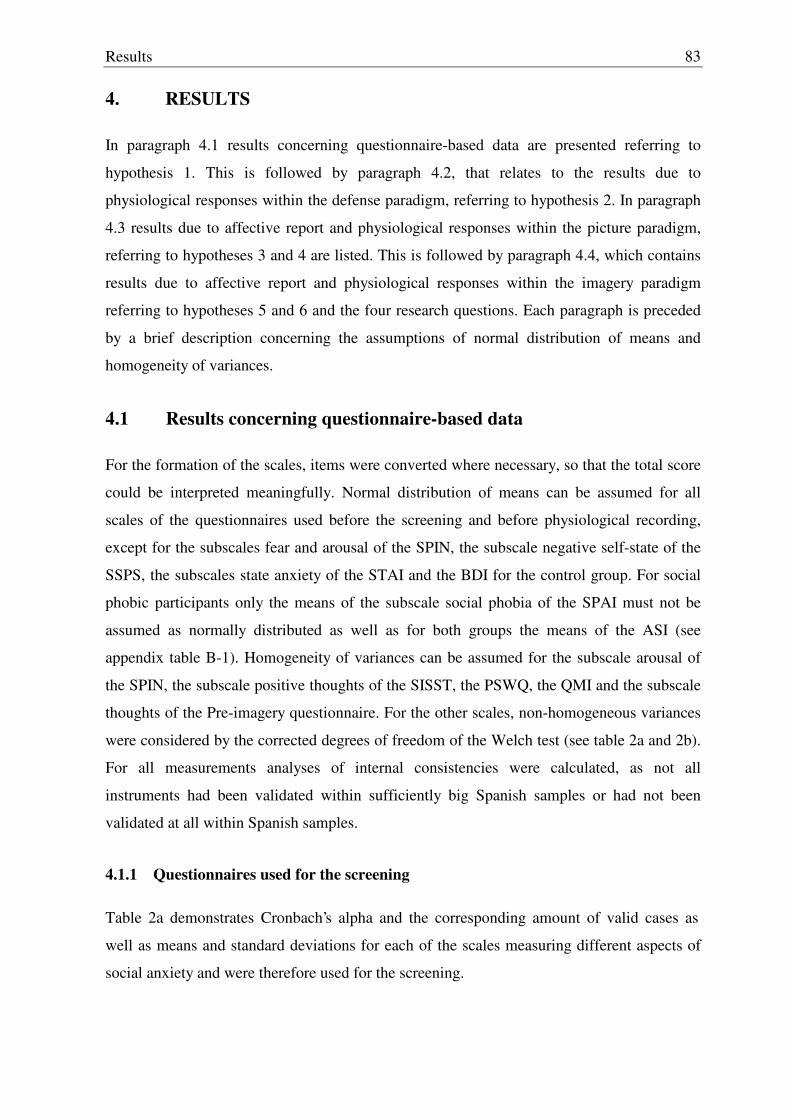
Results
83
4. RESULTS
In paragraph 4.1 results concerning questionnaire-based data are presented referring to
hypothesis 1. This is followed by paragraph 4.2, that relates to the results due to
physiological responses within the defense paradigm, referring to hypothesis 2. In paragraph
4.3 results due to affective report and physiological responses within the picture paradigm,
referring to hypotheses 3 and 4 are listed. This is followed by paragraph 4.4, which contains
results due to affective report and physiological responses within the imagery paradigm
referring to hypotheses 5 and 6 and the four research questions. Each paragraph is preceded
by a brief description concerning the assumptions of normal distribution of means and
homogeneity of variances.
4.1 Results concerning questionnaire-based data
For the formation of the scales, items were converted where necessary, so that the total score
could be interpreted meaningfully. Normal distribution of means can be assumed for all
scales of the questionnaires used before the screening and before physiological recording,
except for the subscales fear and arousal of the SPIN, the subscale negative self-state of the
SSPS, the subscales state anxiety of the STAI and the BDI for the control group. For social
phobic participants only the means of the subscale social phobia of the SPAI must not be
assumed as normally distributed as well as for both groups the means of the ASI (see
appendix table B-1). Homogeneity of variances can be assumed for the subscale arousal of
the SPIN, the subscale positive thoughts of the SISST, the PSWQ, the QMI and the subscale
thoughts of the Pre-imagery questionnaire. For the other scales, non-homogeneous variances
were considered by the corrected degrees of freedom of the Welch test (see table 2a and 2b).
For all measurements analyses of internal consistencies were calculated, as not all
instruments had been validated within sufficiently big Spanish samples or had not been
validated at all within Spanish samples.
4.1.1 Questionnaires used for the screening
Table 2a demonstrates Cronbach’s alpha and the corresponding amount of valid cases as
well as means and standard deviations for each of the scales measuring different aspects of
social anxiety and were therefore used for the screening.
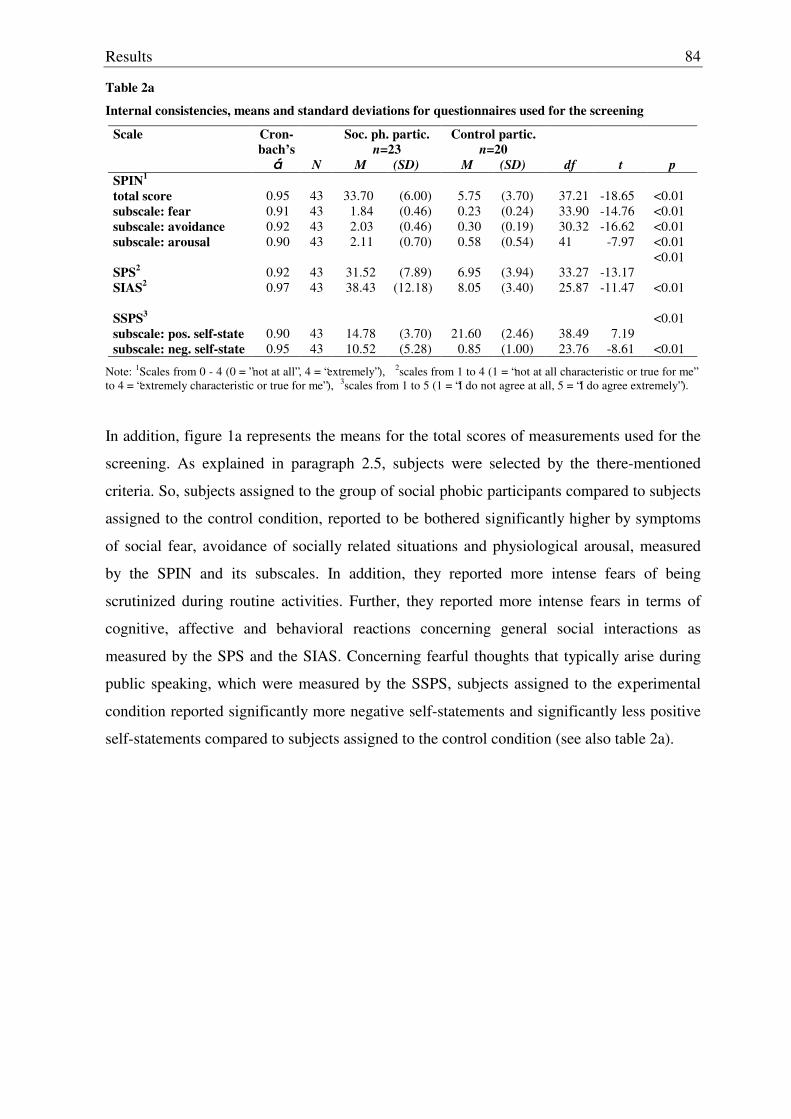
Results
84
Table 2a
Internal consistencies, means and standard deviations for questionnaires used for the screening
Scale Cron-bach’s
á
N
Soc. ph. partic. n=23
M (SD)
Control partic. n=20
M (SD)
df
t
p SPIN1 total score
0.95
43
33.70
(6.00)
5.75
(3.70)
37.21
-18.65
<0.01
subscale: fear 0.91 43 1.84 (0.46) 0.23 (0.24) 33.90 -14.76 <0.01 subscale: avoidance 0.92 43 2.03 (0.46) 0.30 (0.19) 30.32 -16.62 <0.01 subscale: arousal 0.90 43 2.11 (0.70) 0.58 (0.54) 41 -7.97 <0.01 SPS2
0.92
43
31.52
(7.89)
6.95
(3.94)
33.27
-13.17
<0.01
SIAS2
0.97 43 38.43 (12.18) 8.05 (3.40) 25.87 -11.47 <0.01
SSPS3
subscale: pos. self-state
0.90
43
14.78
(3.70)
21.60
(2.46)
38.49
7.19 <0.01
subscale: neg. self-state 0.95 43 10.52 (5.28) 0.85 (1.00) 23.76 -8.61 <0.01
Note: 1Scales from 0 - 4 (0 = ”not at all”, 4 = “extremely”), 2scales from 1 to 4 (1 = “not at all characteristic or true for me” to 4 = “extremely characteristic or true for me”), 3scales from 1 to 5 (1 = “I do not agree at all, 5 = “I do agree extremely”).
In addition, figure 1a represents the means for the total scores of measurements used for the
screening. As explained in paragraph 2.5, subjects were selected by the there-mentioned
criteria. So, subjects assigned to the group of social phobic participants compared to subjects
assigned to the control condition, reported to be bothered significantly higher by symptoms
of social fear, avoidance of socially related situations and physiological arousal, measured
by the SPIN and its subscales. In addition, they reported more intense fears of being
scrutinized during routine activities. Further, they reported more intense fears in terms of
cognitive, affective and behavioral reactions concerning general social interactions as
measured by the SPS and the SIAS. Concerning fearful thoughts that typically arise during
public speaking, which were measured by the SSPS, subjects assigned to the experimental
condition reported significantly more negative self-statements and significantly less positive
self-statements compared to subjects assigned to the control condition (see also table 2a).
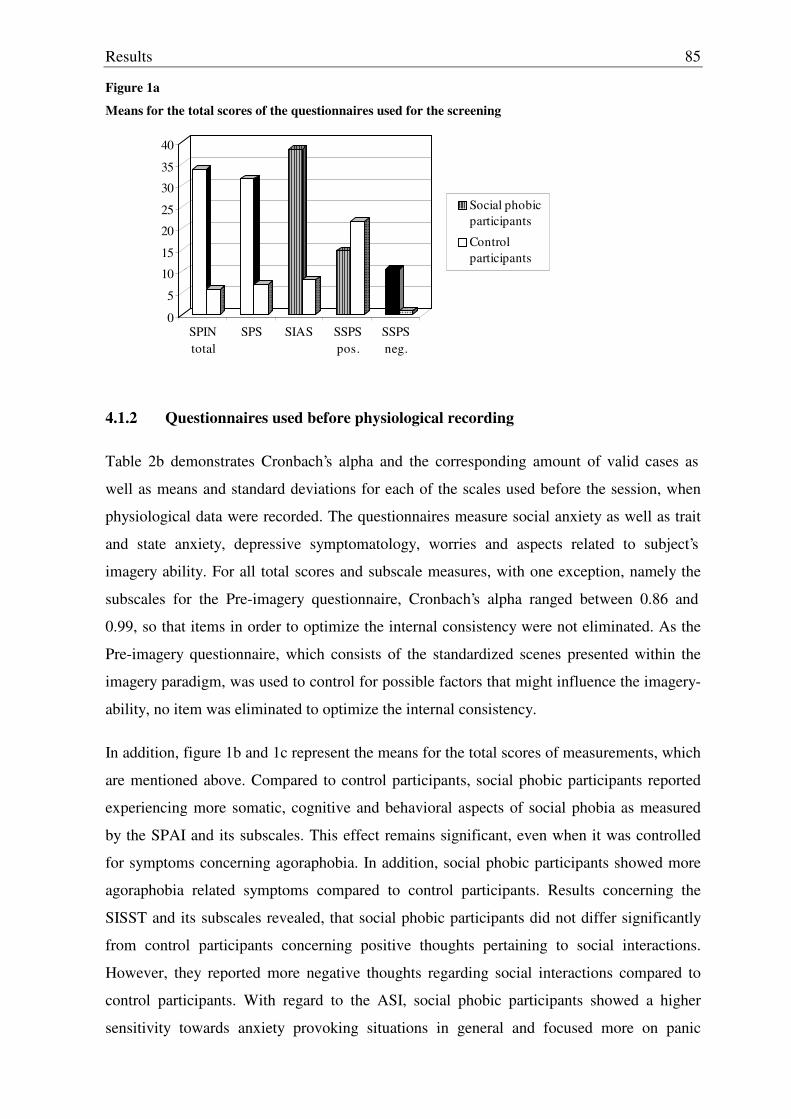
Results
85
Figure 1a
Means for the total scores of the questionnaires used for the screening
0
5
10
15
20
25
30
35
40
SPINtotal
SPS SIAS SSPSpos.
SSPSneg.
Social phobicparticipants
Control participants
4.1.2 Questionnaires used before physiological recording
Table 2b demonstrates Cronbach’s alpha and the corresponding amount of valid cases as
well as means and standard deviations for each of the scales used before the session, when
physiological data were recorded. The questionnaires measure social anxiety as well as trait
and state anxiety, depressive symptomatology, worries and aspects related to subject’s
imagery ability. For all total scores and subscale measures, with one exception, namely the
subscales for the Pre-imagery questionnaire, Cronbach’s alpha ranged between 0.86 and
0.99, so that items in order to optimize the internal consistency were not eliminated. As the
Pre-imagery questionnaire, which consists of the standardized scenes presented within the
imagery paradigm, was used to control for possible factors that might influence the imagery-
ability, no item was eliminated to optimize the internal consistency.
In addition, figure 1b and 1c represent the means for the total scores of measurements, which
are mentioned above. Compared to control participants, social phobic participants reported
experiencing more somatic, cognitive and behavioral aspects of social phobia as measured
by the SPAI and its subscales. This effect remains significant, even when it was controlled
for symptoms concerning agoraphobia. In addition, social phobic participants showed more
agoraphobia related symptoms compared to control participants. Results concerning the
SISST and its subscales revealed, that social phobic participants did not differ significantly
from control participants concerning positive thoughts pertaining to social interactions.
However, they reported more negative thoughts regarding social interactions compared to
control participants. With regard to the ASI, social phobic participants showed a higher
sensitivity towards anxiety provoking situations in general and focused more on panic
Results
86
related symptoms compared to control participants. Social phobic participants showed also a
higher state and trait anxiety, as measured by the subscales of the STAI.
Table 2b
Internal consistencies, means and standard deviations for questionnaires used before physiological recording
Scale Cron-bach’s
á
N
Soc. ph. partic. n=23
M (SD)
Control partic. n=20
M (SD)
df
t
p SPAI1
differential score
0.99 40
71.29
(28.67)
8.29
(7.95)
25.83
-10.10
<0.01
subscale: soc. phobia 0.99 40 86.47 (33.20) 13.49 (9.33) 25.91 -10.07 <0.01 subscale: agoraphobia 0.86 38 15.17 (11.34) 5.20 (4.25) 28.81 -3.91 <0.01
SISST2
subscale: pos. thoughts
0.90
41
47.91
(7.75)
51.56
(12.50)
39
1.15
n.s. subscale: neg. thoughts 0.95 43 42.26 (10.99) 23.70 (4.37) -29.59 -7.45 <0.01 ASI3
0.90
42
1.70
(1.43)
0.75
(0.91)
37.81
-2.62
<0.01
STAI
subscale: state anxiety4a
0.90
39
17.42
(7.10)
10.40
(3.97)
27.92
-3.78
<0.01 subscale: trait anxiety4b 0.95 42 26.05 (9.59) 8.35 (4.52) 36.31 -7.76 <0.01 PSWQ5
0.95
43
57.65
(9.10)
39.75
(9.12)
41
-6.43
<0.01
BDI6 0.88 41 9.35 (6.90) 2.35 (2.28) 27.36 -4.59 <0.01 QMI7 0.93 43 87.17 (26.82) 84.15 (18.91) 39.42 -0.43 n.s. PRE-IMAGERY subscale: experience8a
0.66
43
72.43
(8.90)
66.40
(14.45)
30.92
-1.62
n.s. subscale: thoughts8b 0.61 43 69.87 (9.22) 63.75 (13.47) 32.91 -1.71 0.10
Note: 1Scales from 0 to 6 (0 = “never”, 6 = “always”), 2scales from 1 to 5 (1 = “hardly”, 5 = “very often”), 3scale from 0 to 4 (0 = “very little”, 4 = “very much”), 4ascale from 0 to 3 (0 = “not at all”, 3 = “very much so”), 4bscale from 0 to 3 (0 = “almost never”, 3 = “almost always”), 5scale from 1 to 5 (1 = “not characteristic at all for me”, 5 = “very characteristic for me”), 6scale from 0 to 3 (0 = absence of symptom, 3 = intense level of symptom), 7scale from 1 to 7 (1 = “perfectly clear and as vivid as the actual experience”, 7 = “no image present at all, you are only ‘thinking’ of the object”), 8ascale from 1 to 9 (1 = “no such previous experience”, 9 = “exactly describes a previou s experience”), 8bscale from 1 to 9 (1 = “never thought about it”, 9 = “have often vividly imagined it”).
Apart from anxiety and social phobic related aspects, social phobic participants also reported
having more intensive and excessive worries and more severe depressive symptoms, as
measured by the PSWQ and the BDI respectively. With regard to the general ability to
imagine objects or experiences, as measured by the QMI, social phobic participants did not
differ from control participants. Neither did they differ with regard to prior experiences
concerning the contents of the standardized scenes presented during imagery as measured by
the Pre-imagery questionnaire. However, social phobic participants reported having thought
more frequently in the past about contents of the standardized scenes (see table 2b).
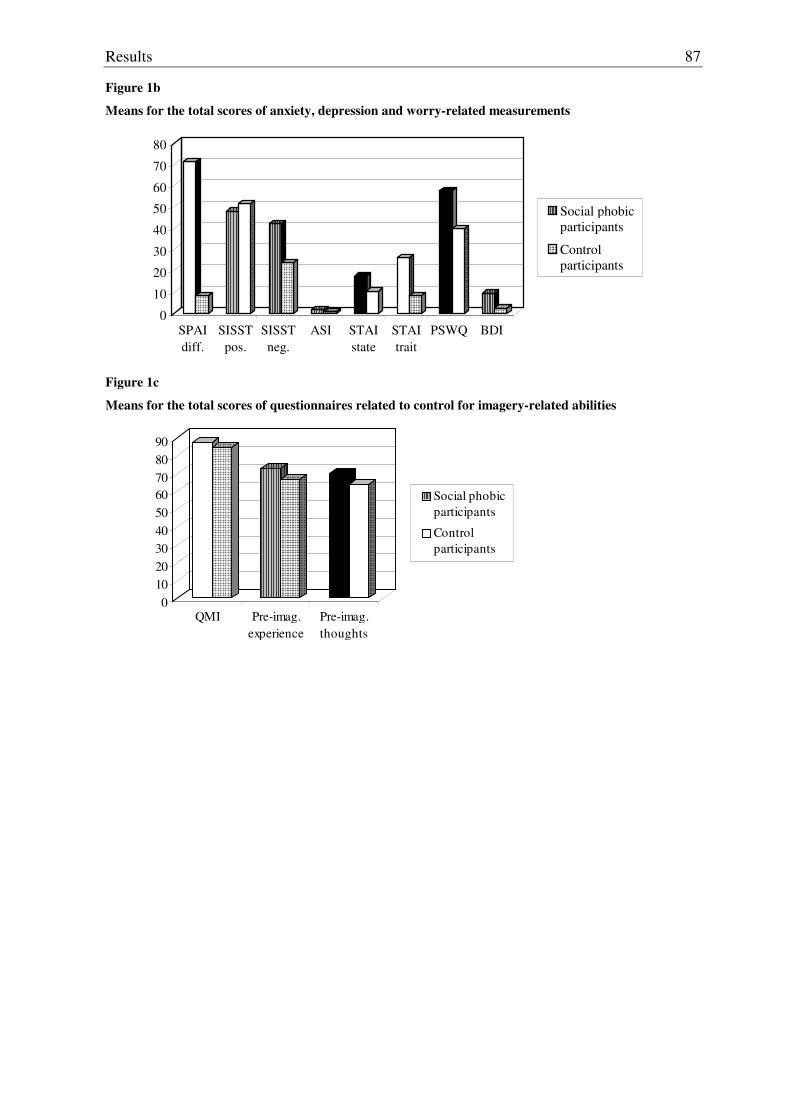
Results
87
Figure 1b
Means for the total scores of anxiety, depression and worry-related measurements
0
10
20
30
40
50
60
70
80
SPAIdiff.
SISSTpos.
SISSTneg.
ASI STAIstate
STAItrait
PSWQ BDI
Social phobicparticipants
Control participants
Figure 1c
Means for the total scores of questionnaires related to control for imagery-related abilities
0102030405060708090
QMI Pre-imag.experience
Pre-imag.thoughts
Social phobicparticipants
Control participants
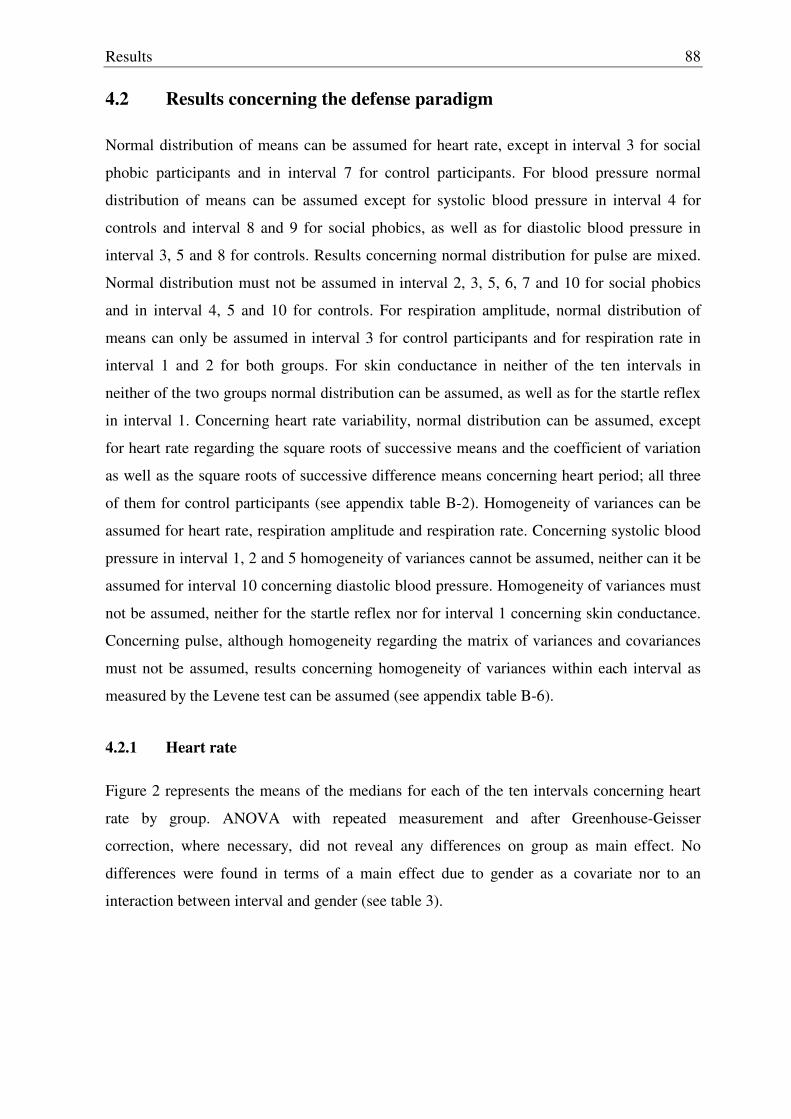
Results
88
4.2 Results concerning the defense paradigm
Normal distribution of means can be assumed for heart rate, except in interval 3 for social
phobic participants and in interval 7 for control participants. For blood pressure normal
distribution of means can be assumed except for systolic blood pressure in interval 4 for
controls and interval 8 and 9 for social phobics, as well as for diastolic blood pressure in
interval 3, 5 and 8 for controls. Results concerning normal distribution for pulse are mixed.
Normal distribution must not be assumed in interval 2, 3, 5, 6, 7 and 10 for social phobics
and in interval 4, 5 and 10 for controls. For respiration amplitude, normal distribution of
means can only be assumed in interval 3 for control participants and for respiration rate in
interval 1 and 2 for both groups. For skin conductance in neither of the ten intervals in
neither of the two groups normal distribution can be assumed, as well as for the startle reflex
in interval 1. Concerning heart rate variability, normal distribution can be assumed, except
for heart rate regarding the square roots of successive means and the coefficient of variation
as well as the square roots of successive difference means concerning heart period; all three
of them for control participants (see appendix table B-2). Homogeneity of variances can be
assumed for heart rate, respiration amplitude and respiration rate. Concerning systolic blood
pressure in interval 1, 2 and 5 homogeneity of variances cannot be assumed, neither can it be
assumed for interval 10 concerning diastolic blood pressure. Homogeneity of variances must
not be assumed, neither for the startle reflex nor for interval 1 concerning skin conductance.
Concerning pulse, although homogeneity regarding the matrix of variances and covariances
must not be assumed, results concerning homogeneity of variances within each interval as
measured by the Levene test can be assumed (see appendix table B-6).
4.2.1 Heart rate
Figure 2 represents the means of the medians for each of the ten intervals concerning heart
rate by group. ANOVA with repeated measurement and after Greenhouse-Geisser
correction, where necessary, did not reveal any differences on group as main effect. No
differences were found in terms of a main effect due to gender as a covariate nor to an
interaction between interval and gender (see table 3).
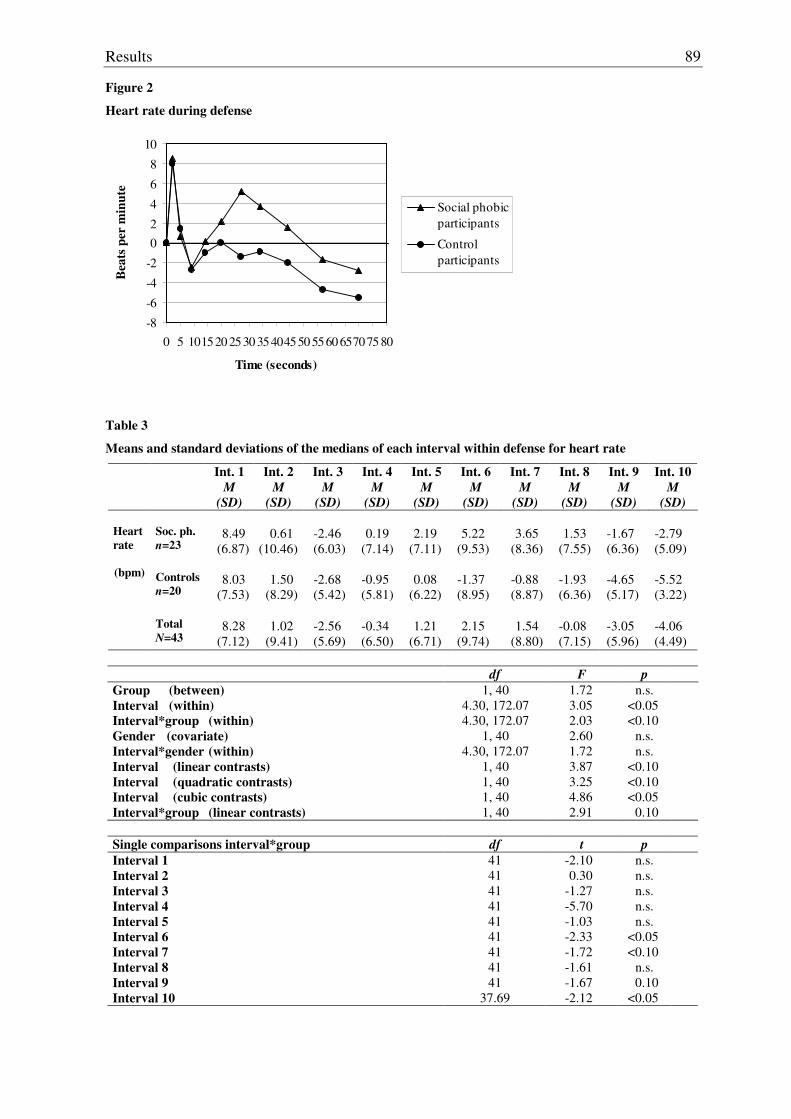
Results
89
Figure 2
Heart rate during defense
-8
-6
-4
-2
02
4
6
8
10
0 5 101520 2530 35404550 5560 657075 80
Time (seconds)
Bea
ts p
er m
inut
e
Social phobicparticipants
Control participants
Table 3
Means and standard deviations of the medians of each interval within defense for heart rate
Int. 1 M
(SD)
Int. 2 M
(SD)
Int. 3 M
(SD)
Int. 4 M
(SD)
Int. 5 M
(SD)
Int. 6 M
(SD)
Int. 7 M
(SD)
Int. 8 M
(SD)
Int. 9 M
(SD)
Int. 10 M
(SD) Soc. ph. n=23
8.49
(6.87)
0.61
(10.46)
-2.46 (6.03)
0.19
(7.14)
2.19
(7.11)
5.22
(9.53)
3.65
(8.36)
1.53
(7.55)
-1.67 (6.36)
-2.79 (5.09)
Controls
n=20
8.03
(7.53)
1.50
(8.29)
-2.68 (5.42)
-0.95 (5.81)
0.08
(6.22)
-1.37 (8.95)
-0.88 (8.87)
-1.93 (6.36)
-4.65 (5.17)
-5.52 (3.22)
Heart rate (bpm)
Total
N=43
8.28
(7.12)
1.02
(9.41)
-2.56 (5.69)
-0.34 (6.50)
1.21
(6.71)
2.15
(9.74)
1.54
(8.80)
-0.08 (7.15)
-3.05 (5.96)
-4.06 (4.49)
df F p
Group (between) Interval (within) Interval*group (within) Gender (covariate) Interval*gender (within) Interval (linear contrasts) Interval (quadratic contrasts) Interval (cubic contrasts) Interval*group (linear contrasts)
1, 40 4.30, 172.07 4.30, 172.07
1, 40 4.30, 172.07
1, 40 1, 40 1, 40 1, 40
1.72 3.05 2.03 2.60 1.72 3.87 3.25 4.86 2.91
n.s. <0.05 <0.10
n.s. n.s.
<0.10 <0.10 <0.05
0.10
Single comparisons interval*group df t p Interval 1 Interval 2 Interval 3 Interval 4 Interval 5 Interval 6 Interval 7 Interval 8 Interval 9 Interval 10
41 41 41 41 41 41 41 41 41
37.69
-2.10 0.30
-1.27 -5.70 -1.03 -2.33 -1.72 -1.61 -1.67 -2.12
n.s. n.s. n.s. n.s. n.s.
<0.05 <0.10
n.s. 0.10
<0.05
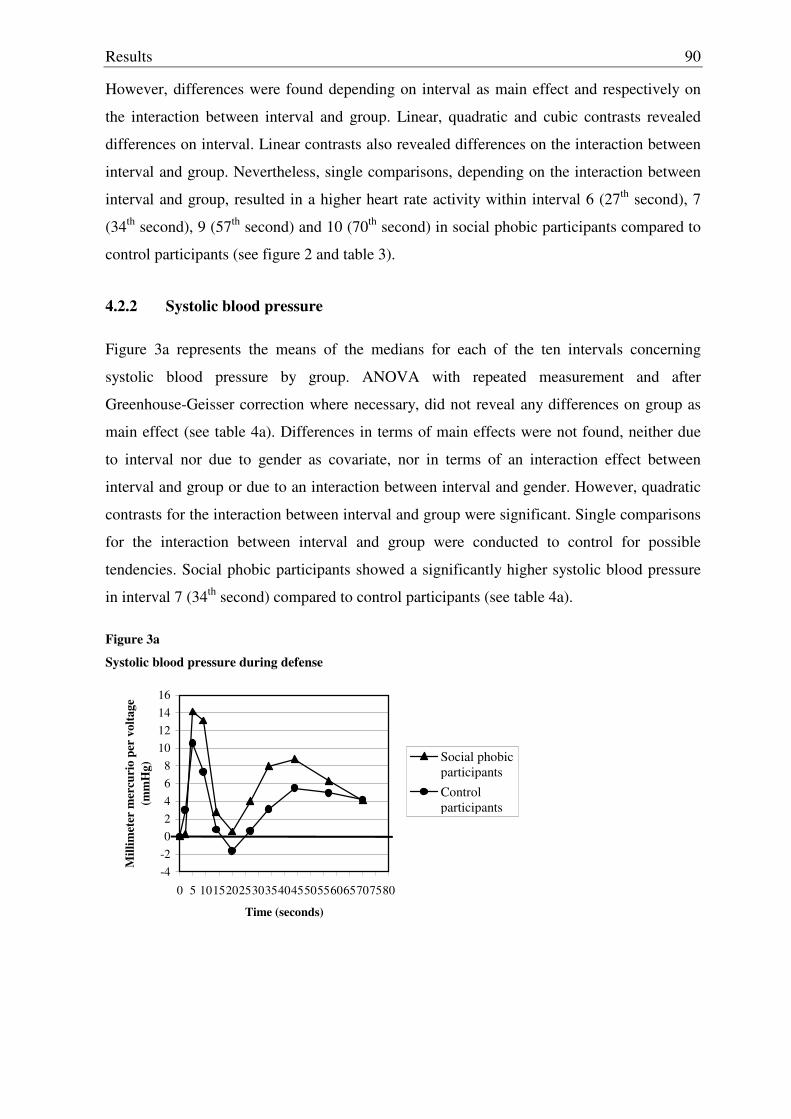
Results
90
However, differences were found depending on interval as main effect and respectively on
the interaction between interval and group. Linear, quadratic and cubic contrasts revealed
differences on interval. Linear contrasts also revealed differences on the interaction between
interval and group. Nevertheless, single comparisons, depending on the interaction between
interval and group, resulted in a higher heart rate activity within interval 6 (27th second), 7
(34th second), 9 (57th second) and 10 (70th second) in social phobic participants compared to
control participants (see figure 2 and table 3).
4.2.2 Systolic blood pressure
Figure 3a represents the means of the medians for each of the ten intervals concerning
systolic blood pressure by group. ANOVA with repeated measurement and after
Greenhouse-Geisser correction where necessary, did not reveal any differences on group as
main effect (see table 4a). Differences in terms of main effects were not found, neither due
to interval nor due to gender as covariate, nor in terms of an interaction effect between
interval and group or due to an interaction between interval and gender. However, quadratic
contrasts for the interaction between interval and group were significant. Single comparisons
for the interaction between interval and group were conducted to control for possible
tendencies. Social phobic participants showed a significantly higher systolic blood pressure
in interval 7 (34th second) compared to control participants (see table 4a).
Figure 3a
Systolic blood pressure during defense
-4-202468
10121416
0 5 101520253035404550556065707580
Time (seconds)
Mill
imet
er m
ercu
rio
per
volta
ge
(mm
Hg)
Social phobicparticipantsControl participants
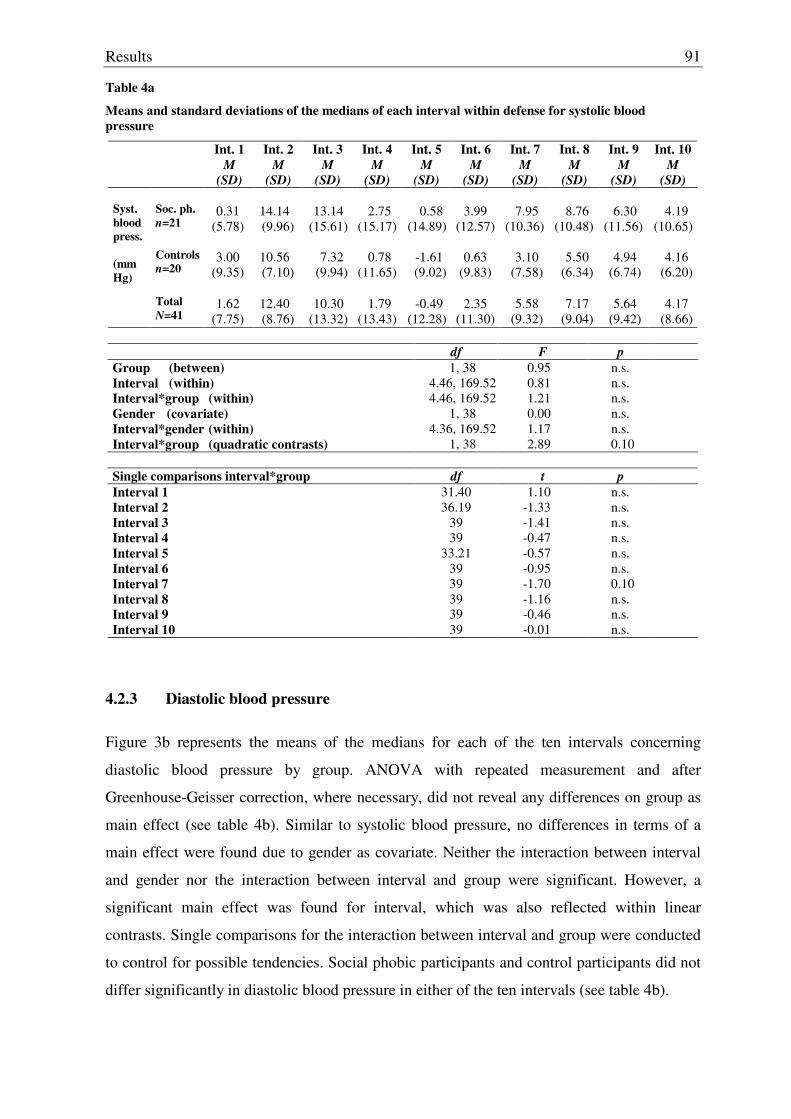
Results
91
Table 4a
Means and standard deviations of the medians of each interval within defense for systolic blood pressure
Int. 1 M
(SD)
Int. 2 M
(SD)
Int. 3 M
(SD)
Int. 4 M
(SD)
Int. 5 M
(SD)
Int. 6 M
(SD)
Int. 7 M
(SD)
Int. 8 M
(SD)
Int. 9 M
(SD)
Int. 10 M
(SD) Soc. ph. n=21
0.31
(5.78)
14.14 (9.96)
13.14
(15.61)
2.75
(15.17)
0.58
(14.89)
3.99
(12.57)
7.95
(10.36)
8.76
(10.48)
6.30
(11.56)
4.19
(10.65) Controls
n=20
3.00
(9.35)
10.56 (7.10)
7.32
(9.94)
0.78
(11.65)
-1.61 (9.02)
0.63
(9.83)
3.10
(7.58)
5.50
(6.34)
4.94
(6.74)
4.16
(6.20)
Syst. blood press. (mmHg)
Total
N=41
1.62
(7.75)
12.40 (8.76)
10.30
(13.32)
1.79
(13.43)
-0.49
(12.28)
2.35
(11.30)
5.58
(9.32)
7.17
(9.04)
5.64
(9.42)
4.17
(8.66)
df F p Group (between) Interval (within) Interval*group (within) Gender (covariate) Interval*gender (within) Interval*group (quadratic contrasts)
1, 38 4.46, 169.52 4.46, 169.52
1, 38 4.36, 169.52
1, 38
0.95 0.81 1.21 0.00 1.17 2.89
n.s. n.s. n.s. n.s. n.s. 0.10
Single comparisons interval*group df t p Interval 1 Interval 2 Interval 3 Interval 4 Interval 5 Interval 6 Interval 7 Interval 8 Interval 9 Interval 10
31.40 36.19
39 39
33.21 39 39 39 39 39
1.10 -1.33 -1.41 -0.47 -0.57 -0.95 -1.70 -1.16 -0.46 -0.01
n.s. n.s. n.s. n.s. n.s. n.s. 0.10 n.s. n.s. n.s.
4.2.3 Diastolic blood pressure
Figure 3b represents the means of the medians for each of the ten intervals concerning
diastolic blood pressure by group. ANOVA with repeated measurement and after
Greenhouse-Geisser correction, where necessary, did not reveal any differences on group as
main effect (see table 4b). Similar to systolic blood pressure, no differences in terms of a
main effect were found due to gender as covariate. Neither the interaction between interval
and gender nor the interaction between interval and group were significant. However, a
significant main effect was found for interval, which was also reflected within linear
contrasts. Single comparisons for the interaction between interval and group were conducted
to control for possible tendencies. Social phobic participants and control participants did not
differ significantly in diastolic blood pressure in either of the ten intervals (see table 4b).
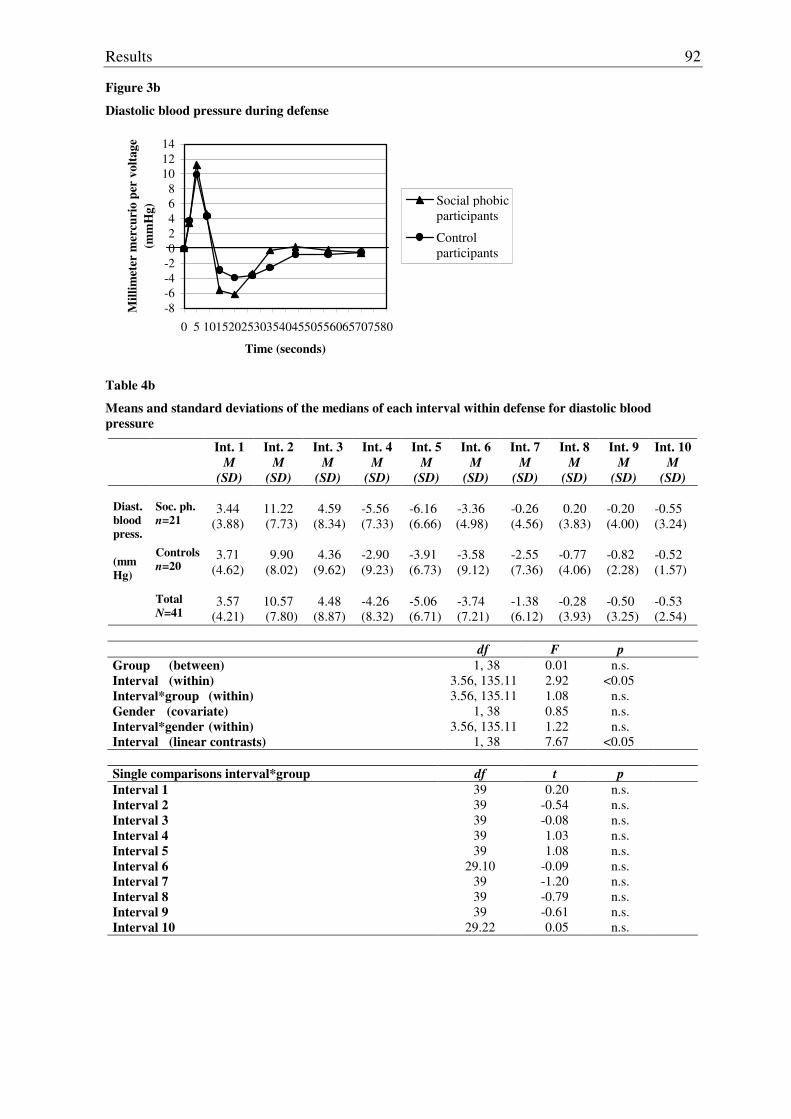
Results
92
Figure 3b
Diastolic blood pressure during defense
-8-6-4-202468
101214
0 5 101520253035404550556065707580
Time (seconds)
Mill
imet
er m
ercu
rio
per
volta
ge
(mm
Hg)
Social phobicparticipants
Control participants
Table 4b
Means and standard deviations of the medians of each interval within defense for diastolic blood pressure
Int. 1 M
(SD)
Int. 2 M
(SD)
Int. 3 M
(SD)
Int. 4 M
(SD)
Int. 5 M
(SD)
Int. 6 M
(SD)
Int. 7 M
(SD)
Int. 8 M
(SD)
Int. 9 M
(SD)
Int. 10 M
(SD) Soc. ph. n=21
3.44
(3.88)
11.22 (7.73)
4.59
(8.34)
-5.56 (7.33)
-6.16 (6.66)
-3.36 (4.98)
-0.26 (4.56)
0.20
(3.83)
-0.20 (4.00)
-0.55 (3.24)
Controls
n=20
3.71
(4.62)
9.90
(8.02)
4.36
(9.62)
-2.90 (9.23)
-3.91 (6.73)
-3.58 (9.12)
-2.55 (7.36)
-0.77 (4.06)
-0.82 (2.28)
-0.52 (1.57)
Diast. blood press. (mmHg)
Total
N=41
3.57
(4.21)
10.57 (7.80)
4.48
(8.87)
-4.26 (8.32)
-5.06 (6.71)
-3.74 (7.21)
-1.38 (6.12)
-0.28 (3.93)
-0.50 (3.25)
-0.53 (2.54)
df F p
Group (between) Interval (within) Interval*group (within) Gender (covariate) Interval*gender (within) Interval (linear contrasts)
1, 38 3.56, 135.11 3.56, 135.11
1, 38 3.56, 135.11
1, 38
0.01 2.92 1.08 0.85 1.22 7.67
n.s. <0.05
n.s. n.s. n.s.
<0.05
Single comparisons interval*group df t p Interval 1 Interval 2 Interval 3 Interval 4 Interval 5 Interval 6 Interval 7 Interval 8 Interval 9 Interval 10
39 39 39 39 39
29.10 39 39 39
29.22
0.20 -0.54 -0.08 1.03 1.08
-0.09 -1.20 -0.79 -0.61 0.05
n.s. n.s. n.s. n.s. n.s. n.s. n.s. n.s. n.s. n.s.
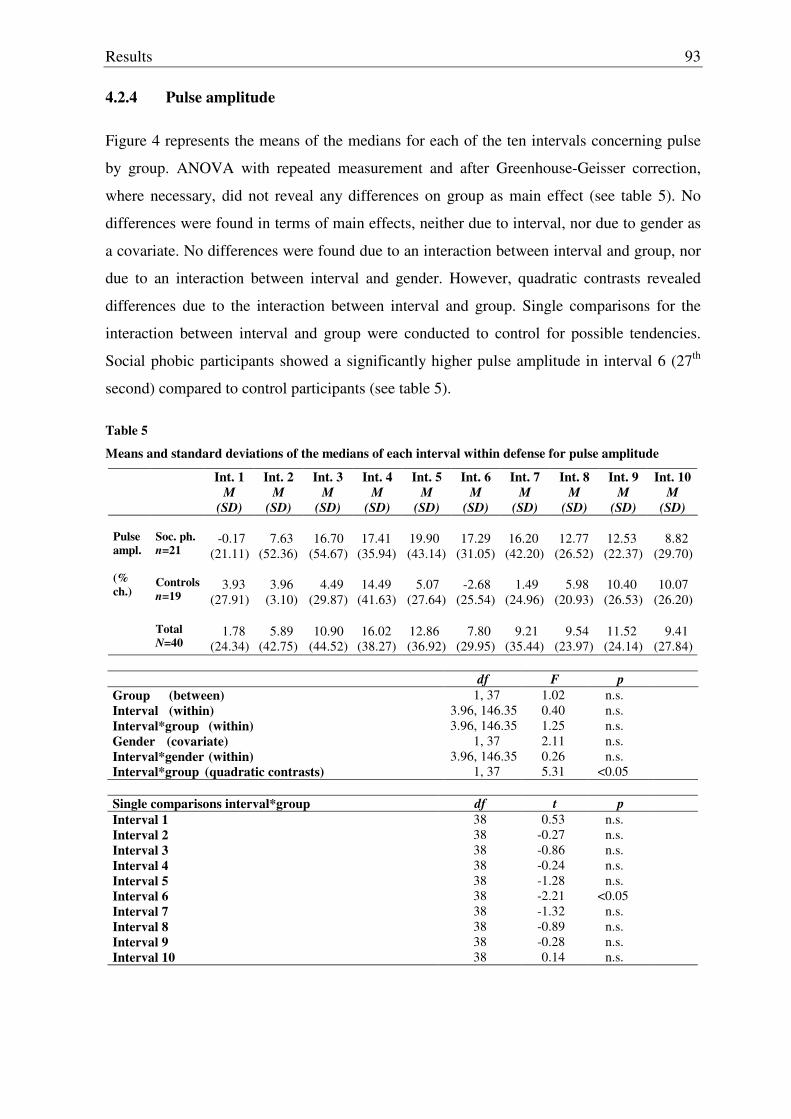
Results
93
4.2.4 Pulse amplitude
Figure 4 represents the means of the medians for each of the ten intervals concerning pulse
by group. ANOVA with repeated measurement and after Greenhouse-Geisser correction,
where necessary, did not reveal any differences on group as main effect (see table 5). No
differences were found in terms of main effects, neither due to interval, nor due to gender as
a covariate. No differences were found due to an interaction between interval and group, nor
due to an interaction between interval and gender. However, quadratic contrasts revealed
differences due to the interaction between interval and group. Single comparisons for the
interaction between interval and group were conducted to control for possible tendencies.
Social phobic participants showed a significantly higher pulse amplitude in interval 6 (27th
second) compared to control participants (see table 5).
Table 5
Means and standard deviations of the medians of each interval within defense for pulse amplitude
Int. 1 M
(SD)
Int. 2 M
(SD)
Int. 3 M
(SD)
Int. 4 M
(SD)
Int. 5 M
(SD)
Int. 6 M
(SD)
Int. 7 M
(SD)
Int. 8 M
(SD)
Int. 9 M
(SD)
Int. 10 M
(SD) Soc. ph. n=21
-0.17
(21.11)
7.63
(52.36)
16.70
(54.67)
17.41
(35.94)
19.90 (43.14)
17.29
(31.05)
16.20
(42.20)
12.77
(26.52)
12.53 (22.37)
8.82
(29.70) Controls
n=19
3.93
(27.91)
3.96
(3.10)
4.49
(29.87)
14.49
(41.63)
5.07
(27.64)
-2.68
(25.54)
1.49
(24.96)
5.98
(20.93)
10.40 (26.53)
10.07
(26.20)
Pulse ampl. (% ch.)
Total
N=40
1.78
(24.34)
5.89
(42.75)
10.90
(44.52)
16.02
(38.27)
12.86 (36.92)
7.80
(29.95)
9.21
(35.44)
9.54
(23.97)
11.52 (24.14)
9.41
(27.84)
df F p Group (between) Interval (within) Interval*group (within) Gender (covariate) Interval*gender (within) Interval*group (quadratic contrasts)
1, 37 3.96, 146.35 3.96, 146.35
1, 37 3.96, 146.35
1, 37
1.02 0.40 1.25 2.11 0.26 5.31
n.s. n.s. n.s. n.s. n.s.
<0.05
Single comparisons interval*group df t p Interval 1 Interval 2 Interval 3 Interval 4 Interval 5 Interval 6 Interval 7 Interval 8 Interval 9 Interval 10
38 38 38 38 38 38 38 38 38 38
0.53 -0.27 -0.86 -0.24 -1.28 -2.21 -1.32 -0.89 -0.28 0.14
n.s. n.s. n.s. n.s. n.s.
<0.05 n.s. n.s. n.s. n.s.
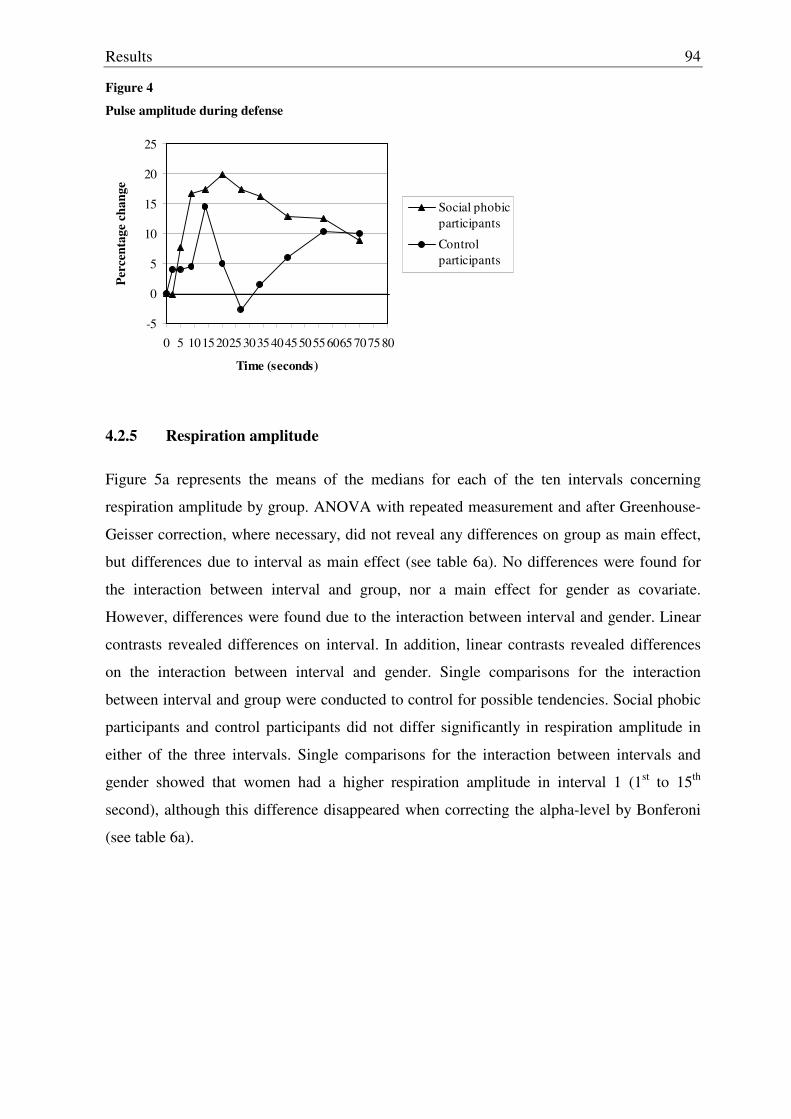
Results
94
Figure 4
Pulse amplitude during defense
-5
0
5
10
15
20
25
0 5 101520253035404550556065707580
Time (seconds)
Perc
enta
ge c
hang
e
Social phobicparticipants
Control participants
4.2.5 Respiration amplitude
Figure 5a represents the means of the medians for each of the ten intervals concerning
respiration amplitude by group. ANOVA with repeated measurement and after Greenhouse-
Geisser correction, where necessary, did not reveal any differences on group as main effect,
but differences due to interval as main effect (see table 6a). No differences were found for
the interaction between interval and group, nor a main effect for gender as covariate.
However, differences were found due to the interaction between interval and gender. Linear
contrasts revealed differences on interval. In addition, linear contrasts revealed differences
on the interaction between interval and gender. Single comparisons for the interaction
between interval and group were conducted to control for possible tendencies. Social phobic
participants and control participants did not differ significantly in respiration amplitude in
either of the three intervals. Single comparisons for the interaction between intervals and
gender showed that women had a higher respiration amplitude in interval 1 (1st to 15th
second), although this difference disappeared when correcting the alpha-level by Bonferoni
(see table 6a).
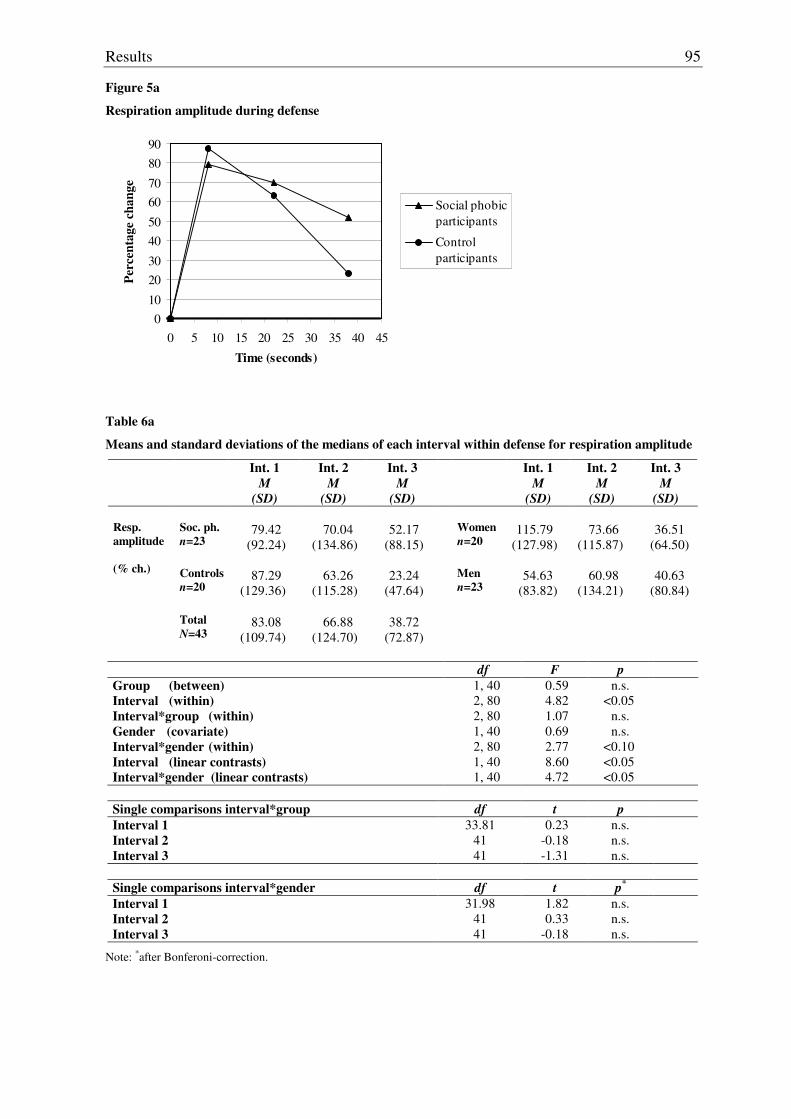
Results
95
Figure 5a
Respiration amplitude during defense
010
2030
4050
6070
8090
0 5 10 15 20 25 30 35 40 45
Time (seconds)
Perc
enta
ge c
hang
e
Social phobicparticipants
Control participants
Table 6a
Means and standard deviations of the medians of each interval within defense for respiration amplitude
Int. 1 M
(SD)
Int. 2 M
(SD)
Int. 3 M
(SD)
Int. 1 M
(SD)
Int. 2 M
(SD)
Int. 3 M
(SD) Soc. ph. n=23
79.42
(92.24)
70.04
(134.86)
52.17
(88.15)
Women n=20
115.79
(127.98)
73.66
(115.87)
36.51
(64.50)
Resp. amplitude (% ch.)
Controls
n=20
87.29
(129.36)
63.26
(115.28)
23.24
(47.64)
Men n=23
54.63
(83.82)
60.98
(134.21)
40.63
(80.84)
Total
N=43
83.08
(109.74)
66.88
(124.70)
38.72
(72.87)
df F p
Group (between) Interval (within) Interval*group (within) Gender (covariate) Interval*gender (within) Interval (linear contrasts) Interval*gender (linear contrasts)
1, 40 2, 80 2, 80 1, 40 2, 80 1, 40 1, 40
0.59 4.82 1.07 0.69 2.77 8.60 4.72
n.s. <0.05
n.s. n.s.
<0.10 <0.05 <0.05
Single comparisons interval*group df t p Interval 1 Interval 2 Interval 3
33.81 41 41
0.23 -0.18 -1.31
n.s. n.s. n.s.
Single comparisons interval*gender df t p* Interval 1 Interval 2 Interval 3
31.98 41 41
1.82 0.33
-0.18
n.s. n.s. n.s.
Note: *after Bonferoni-correction.
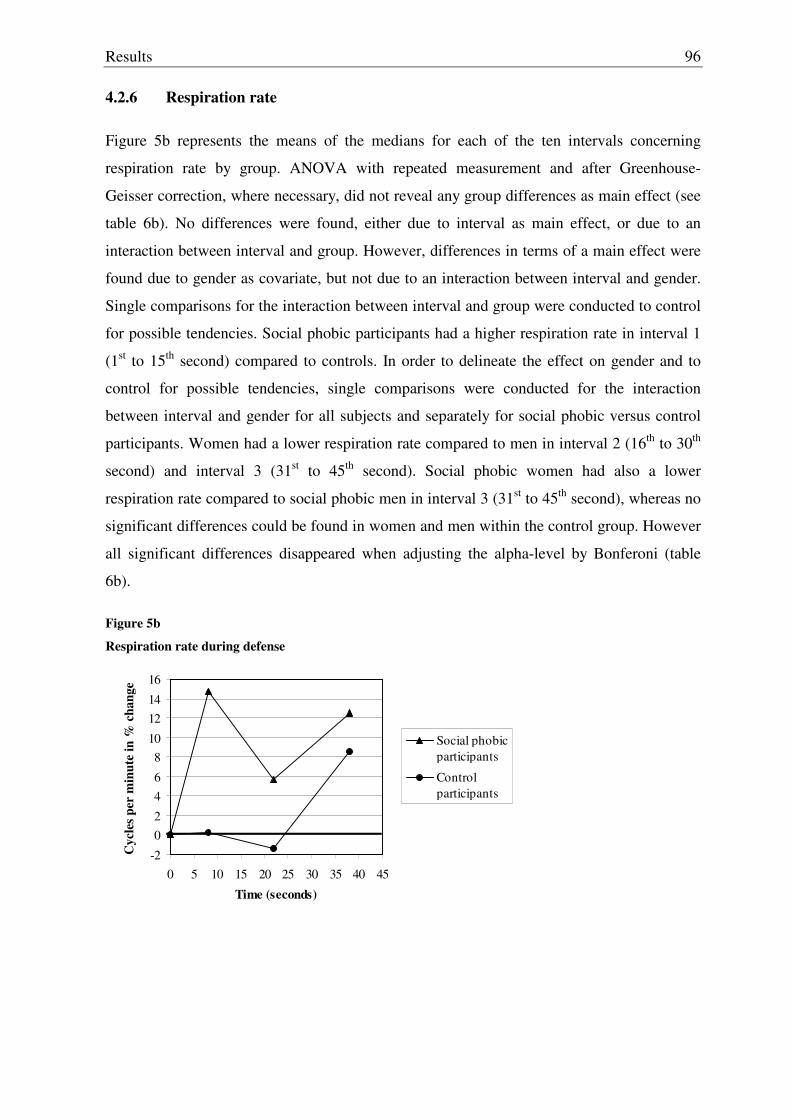
Results
96
4.2.6 Respiration rate
Figure 5b represents the means of the medians for each of the ten intervals concerning
respiration rate by group. ANOVA with repeated measurement and after Greenhouse-
Geisser correction, where necessary, did not reveal any group differences as main effect (see
table 6b). No differences were found, either due to interval as main effect, or due to an
interaction between interval and group. However, differences in terms of a main effect were
found due to gender as covariate, but not due to an interaction between interval and gender.
Single comparisons for the interaction between interval and group were conducted to control
for possible tendencies. Social phobic participants had a higher respiration rate in interval 1
(1st to 15th second) compared to controls. In order to delineate the effect on gender and to
control for possible tendencies, single comparisons were conducted for the interaction
between interval and gender for all subjects and separately for social phobic versus control
participants. Women had a lower respiration rate compared to men in interval 2 (16th to 30th
second) and interval 3 (31st to 45th second). Social phobic women had also a lower
respiration rate compared to social phobic men in interval 3 (31st to 45th second), whereas no
significant differences could be found in women and men within the control group. However
all significant differences disappeared when adjusting the alpha-level by Bonferoni (table
6b).
Figure 5b
Respiration rate during defense
-2
02
46
810
1214
16
0 5 10 15 20 25 30 35 40 45
Time (seconds)
Cyc
les p
er m
inut
e in
% c
hang
e
Social phobicparticipants
Control participants
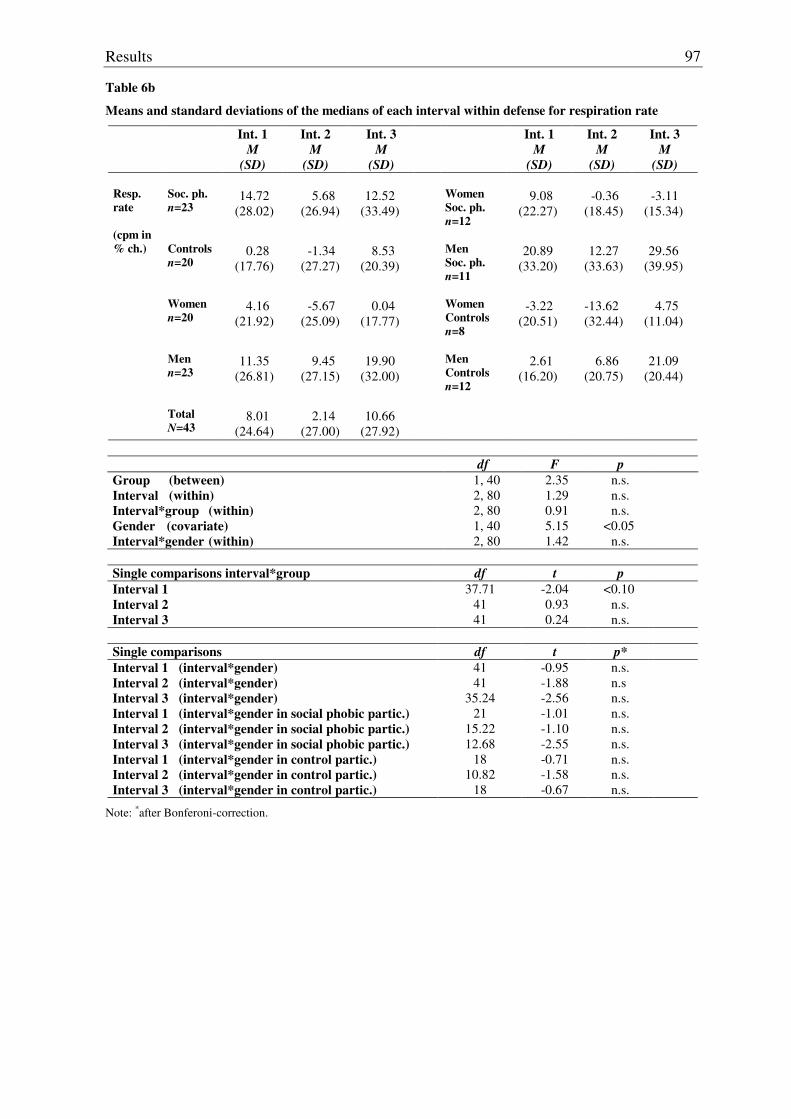
Results
97
Table 6b
Means and standard deviations of the medians of each interval within defense for respiration rate
Int. 1 M
(SD)
Int. 2 M
(SD)
Int. 3 M
(SD)
Int. 1 M
(SD)
Int. 2 M
(SD)
Int. 3 M
(SD) Soc. ph. n=23
14.72
(28.02)
5.68
(26.94)
12.52
(33.49)
Women Soc. ph. n=12
9.08
(22.27)
-0.36
(18.45)
-3.11
(15.34)
Resp. rate (cpm in % ch.)
Controls
n=20
0.28
(17.76)
-1.34
(27.27)
8.53
(20.39)
Men Soc. ph. n=11
20.89
(33.20)
12.27
(33.63)
29.56
(39.95)
Women n=20
4.16
(21.92)
-5.67
(25.09)
0.04
(17.77)
Women Controls n=8
-3.22
(20.51)
-13.62 (32.44)
4.75
(11.04)
Men n=23
11.35
(26.81)
9.45
(27.15)
19.90
(32.00)
Men Controls n=12
2.61
(16.20)
6.86
(20.75)
21.09
(20.44)
Total
N=43
8.01
(24.64)
2.14
(27.00)
10.66
(27.92)
df F p
Group (between) Interval (within) Interval*group (within) Gender (covariate) Interval*gender (within)
1, 40 2, 80 2, 80 1, 40 2, 80
2.35 1.29 0.91 5.15 1.42
n.s. n.s. n.s.
<0.05 n.s.
Single comparisons interval*group df t p Interval 1 Interval 2 Interval 3
37.71 41 41
-2.04 0.93 0.24
<0.10 n.s. n.s.
Single comparisons df t p* Interval 1 (interval*gender) Interval 2 (interval*gender) Interval 3 (interval*gender) Interval 1 (interval*gender in social phobic partic.) Interval 2 (interval*gender in social phobic partic.) Interval 3 (interval*gender in social phobic partic.) Interval 1 (interval*gender in control partic.) Interval 2 (interval*gender in control partic.) Interval 3 (interval*gender in control partic.)
41 41
35.24 21
15.22 12.68
18 10.82
18
-0.95 -1.88 -2.56 -1.01 -1.10 -2.55 -0.71 -1.58 -0.67
n.s. n.s n.s. n.s. n.s. n.s. n.s. n.s. n.s.
Note: *after Bonferoni-correction.
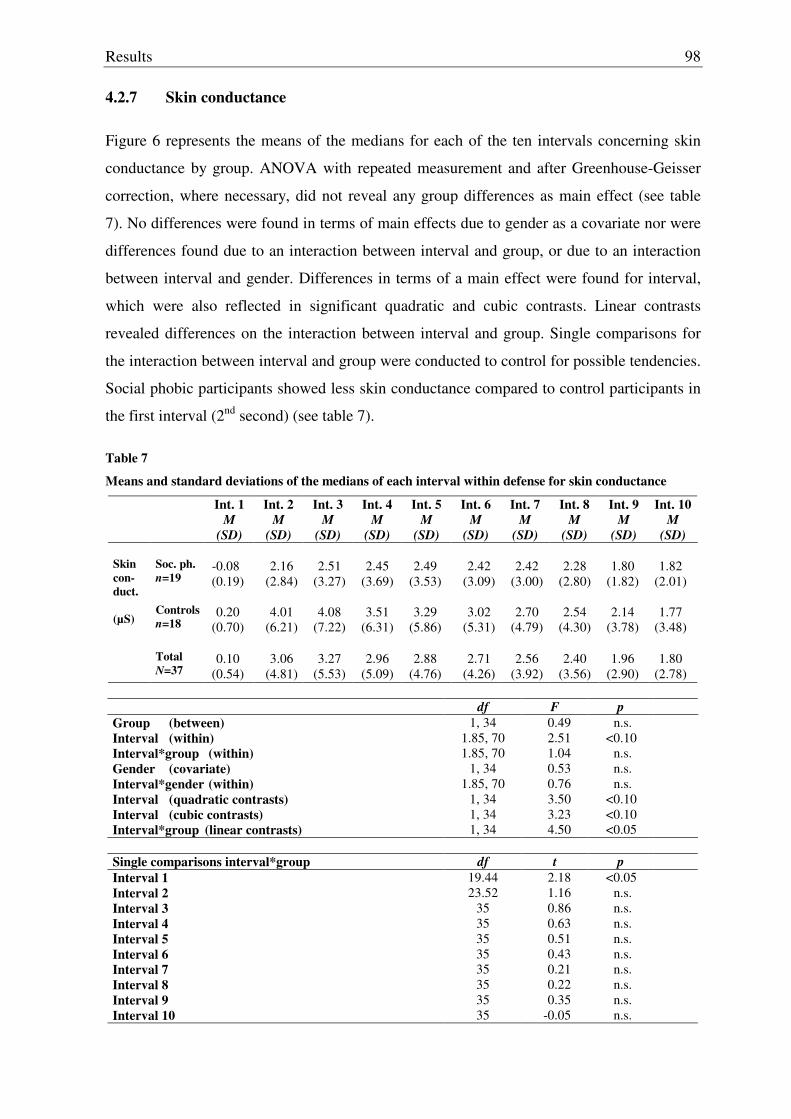
Results
98
4.2.7 Skin conductance
Figure 6 represents the means of the medians for each of the ten intervals concerning skin
conductance by group. ANOVA with repeated measurement and after Greenhouse-Geisser
correction, where necessary, did not reveal any group differences as main effect (see table
7). No differences were found in terms of main effects due to gender as a covariate nor were
differences found due to an interaction between interval and group, or due to an interaction
between interval and gender. Differences in terms of a main effect were found for interval,
which were also reflected in significant quadratic and cubic contrasts. Linear contrasts
revealed differences on the interaction between interval and group. Single comparisons for
the interaction between interval and group were conducted to control for possible tendencies.
Social phobic participants showed less skin conductance compared to control participants in
the first interval (2nd second) (see table 7).
Table 7
Means and standard deviations of the medians of each interval within defense for skin conductance
Int. 1 M
(SD)
Int. 2 M
(SD)
Int. 3 M
(SD)
Int. 4 M
(SD)
Int. 5 M
(SD)
Int. 6 M
(SD)
Int. 7 M
(SD)
Int. 8 M
(SD)
Int. 9 M
(SD)
Int. 10 M
(SD) Soc. ph. n=19
-0.08 (0.19)
2.16
(2.84)
2.51
(3.27)
2.45
(3.69)
2.49
(3.53)
2.42
(3.09)
2.42
(3.00)
2.28
(2.80)
1.80
(1.82)
1.82
(2.01)
Skin con-duct. (µS)
Controls
n=18
0.20
(0.70)
4.01
(6.21)
4.08
(7.22)
3.51
(6.31)
3.29
(5.86)
3.02
(5.31)
2.70
(4.79)
2.54
(4.30)
2.14
(3.78)
1.77
(3.48)
Total
N=37
0.10
(0.54)
3.06
(4.81)
3.27
(5.53)
2.96
(5.09)
2.88
(4.76)
2.71
(4.26)
2.56
(3.92)
2.40
(3.56)
1.96
(2.90)
1.80
(2.78)
df F p Group (between) Interval (within) Interval*group (within) Gender (covariate) Interval*gender (within) Interval (quadratic contrasts) Interval (cubic contrasts) Interval*group (linear contrasts)
1, 34 1.85, 70 1.85, 70
1, 34 1.85, 70
1, 34 1, 34 1, 34
0.49 2.51 1.04 0.53 0.76 3.50 3.23 4.50
n.s. <0.10
n.s. n.s. n.s.
<0.10 <0.10 <0.05
Single comparisons interval*group df t p Interval 1 Interval 2 Interval 3 Interval 4 Interval 5 Interval 6 Interval 7 Interval 8 Interval 9 Interval 10
19.44 23.52
35 35 35 35 35 35 35 35
2.18 1.16 0.86 0.63 0.51 0.43 0.21 0.22 0.35
-0.05
<0.05 n.s. n.s. n.s. n.s. n.s. n.s. n.s. n.s. n.s.
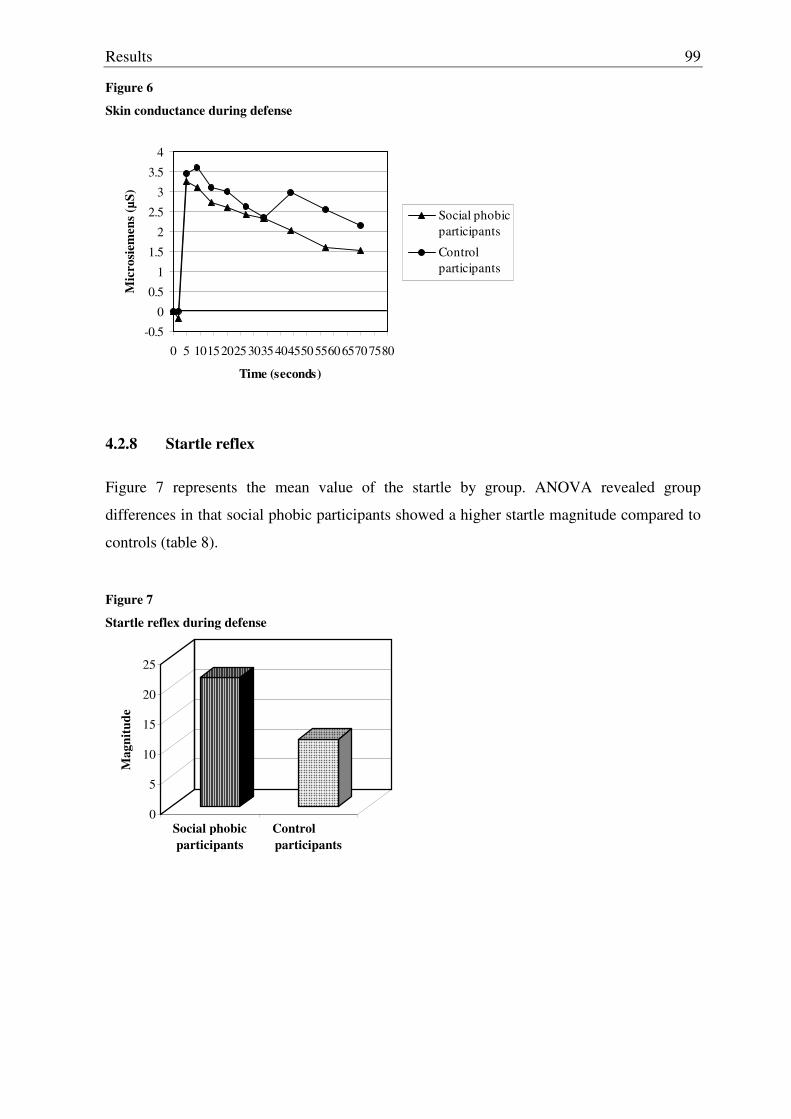
Results
99
Figure 6
Skin conductance during defense
-0.5
0
0.5
1
1.5
2
2.5
3
3.5
4
0 5 101520253035404550556065707580
Time (seconds)
Mic
rosi
emen
s (µS
)
Social phobicparticipants
Control participants
4.2.8 Startle reflex
Figure 7 represents the mean value of the startle by group. ANOVA revealed group
differences in that social phobic participants showed a higher startle magnitude compared to
controls (table 8).
Figure 7
Startle reflex during defense
0
5
10
15
20
25
Mag
nitu
de
Social phobicparticipants
Control participants
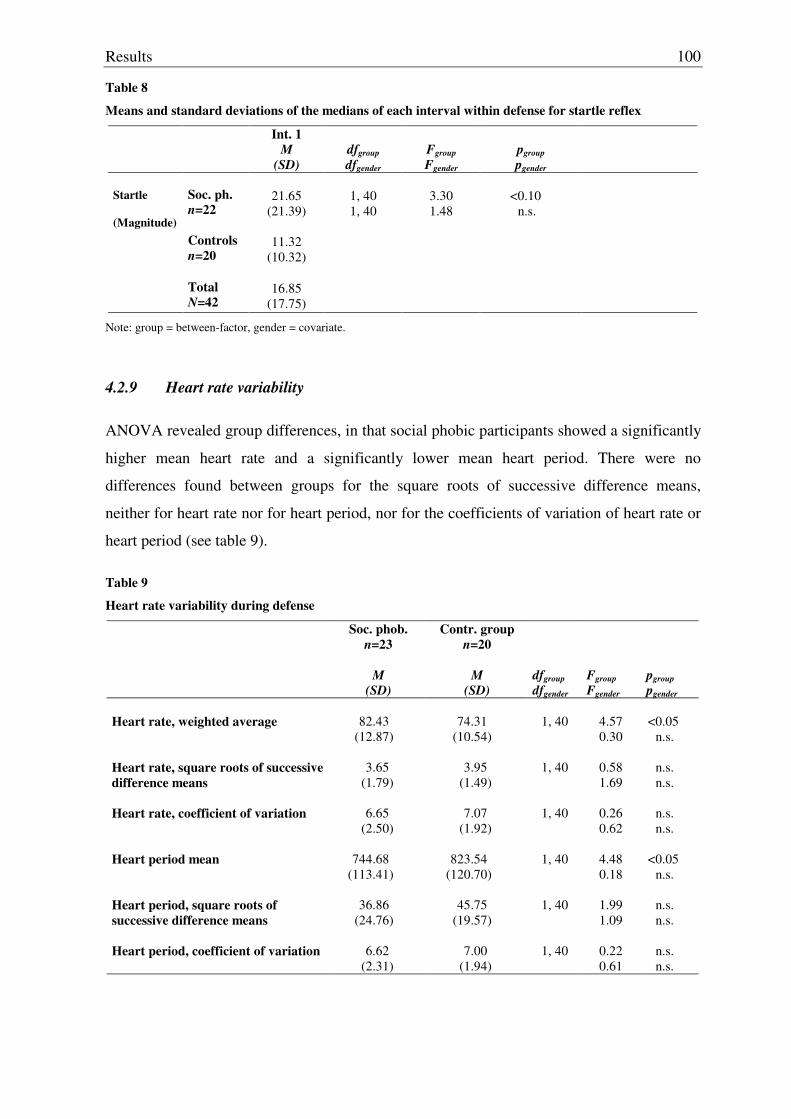
Results
100
Table 8
Means and standard deviations of the medians of each interval within defense for startle reflex
Int. 1 M
(SD)
dfgroup dfgender
Fgroup Fgender
pgroup pgender
Soc. ph. n=22
21.65
(21.39)
1, 40 1, 40
3.30 1.48
<0.10
n.s.
Startle (Magnitude)
Controls
n=20
11.32
(10.32)
Total
N=42
16.85
(17.75)
Note: group = between-factor, gender = covariate.
4.2.9 Heart rate variability
ANOVA revealed group differences, in that social phobic participants showed a significantly
higher mean heart rate and a significantly lower mean heart period. There were no
differences found between groups for the square roots of successive difference means,
neither for heart rate nor for heart period, nor for the coefficients of variation of heart rate or
heart period (see table 9).
Table 9
Heart rate variability during defense
Soc. phob. n=23
M
(SD)
Contr. group n=20
M
(SD)
dfgroup dfgender
Fgroup Fgender
pgroup pgender
Heart rate, weighted average
82.43
(12.87)
74.31
(10.54)
1, 40
4.57 0.30
<0.05
n.s. Heart rate, square roots of successive difference means
3.65
(1.79)
3.95
(1.49)
1, 40
0.58 1.69
n.s. n.s.
Heart rate, coefficient of variation
6.65
(2.50)
7.07
(1.92)
1, 40
0.26 0.62
n.s. n.s.
Heart period mean
744.68
(113.41)
823.54
(120.70)
1, 40
4.48 0.18
<0.05
n.s. Heart period, square roots of successive difference means
36.86
(24.76)
45.75
(19.57)
1, 40
1.99 1.09
n.s. n.s.
Heart period, coefficient of variation
6.62
(2.31)
7.00
(1.94)
1, 40
0.22 0.61
n.s. n.s.
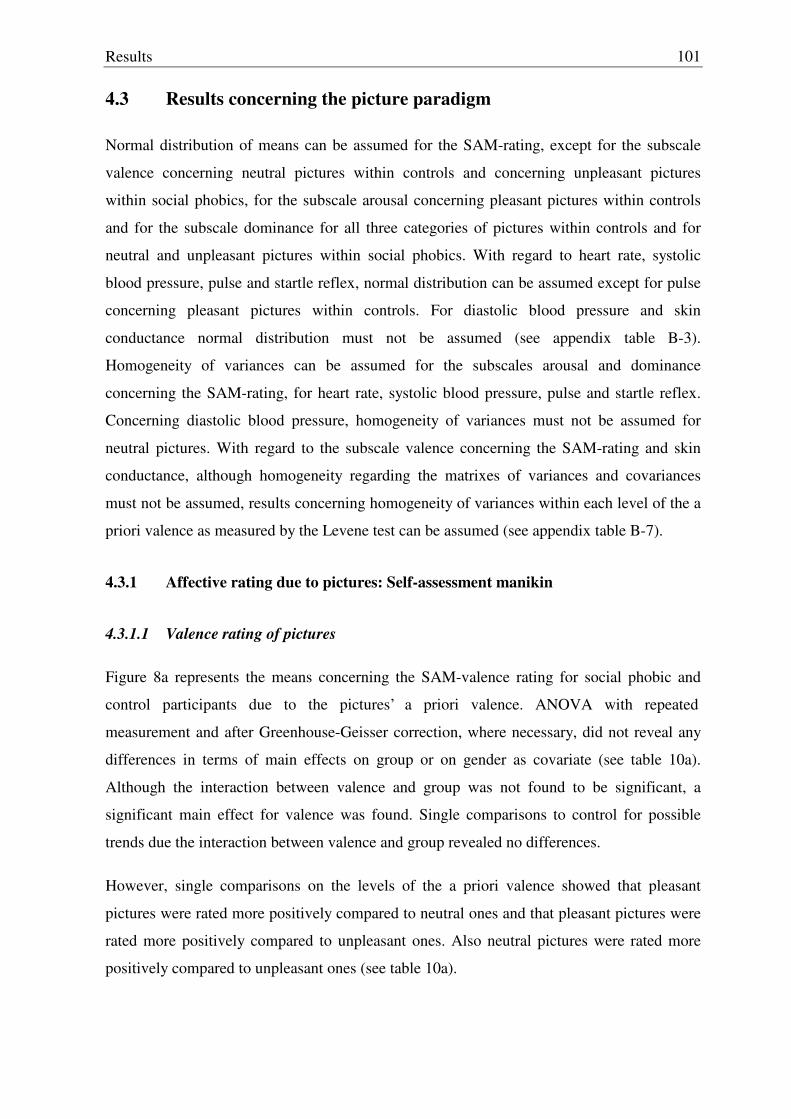
Results
101
4.3 Results concerning the picture paradigm
Normal distribution of means can be assumed for the SAM-rating, except for the subscale
valence concerning neutral pictures within controls and concerning unpleasant pictures
within social phobics, for the subscale arousal concerning pleasant pictures within controls
and for the subscale dominance for all three categories of pictures within controls and for
neutral and unpleasant pictures within social phobics. With regard to heart rate, systolic
blood pressure, pulse and startle reflex, normal distribution can be assumed except for pulse
concerning pleasant pictures within controls. For diastolic blood pressure and skin
conductance normal distribution must not be assumed (see appendix table B-3).
Homogeneity of variances can be assumed for the subscales arousal and dominance
concerning the SAM-rating, for heart rate, systolic blood pressure, pulse and startle reflex.
Concerning diastolic blood pressure, homogeneity of variances must not be assumed for
neutral pictures. With regard to the subscale valence concerning the SAM-rating and skin
conductance, although homogeneity regarding the matrixes of variances and covariances
must not be assumed, results concerning homogeneity of variances within each level of the a
priori valence as measured by the Levene test can be assumed (see appendix table B-7).
4.3.1 Affective rating due to pictures: Self-assessment manikin
4.3.1.1 Valence rating of pictures
Figure 8a represents the means concerning the SAM-valence rating for social phobic and
control participants due to the pictures’ a priori valence. ANOVA with repeated
measurement and after Greenhouse-Geisser correction, where necessary, did not reveal any
differences in terms of main effects on group or on gender as covariate (see table 10a).
Although the interaction between valence and group was not found to be significant, a
significant main effect for valence was found. Single comparisons to control for possible
trends due the interaction between valence and group revealed no differences.
However, single comparisons on the levels of the a priori valence showed that pleasant
pictures were rated more positively compared to neutral ones and that pleasant pictures were
rated more positively compared to unpleasant ones. Also neutral pictures were rated more
positively compared to unpleasant ones (see table 10a).
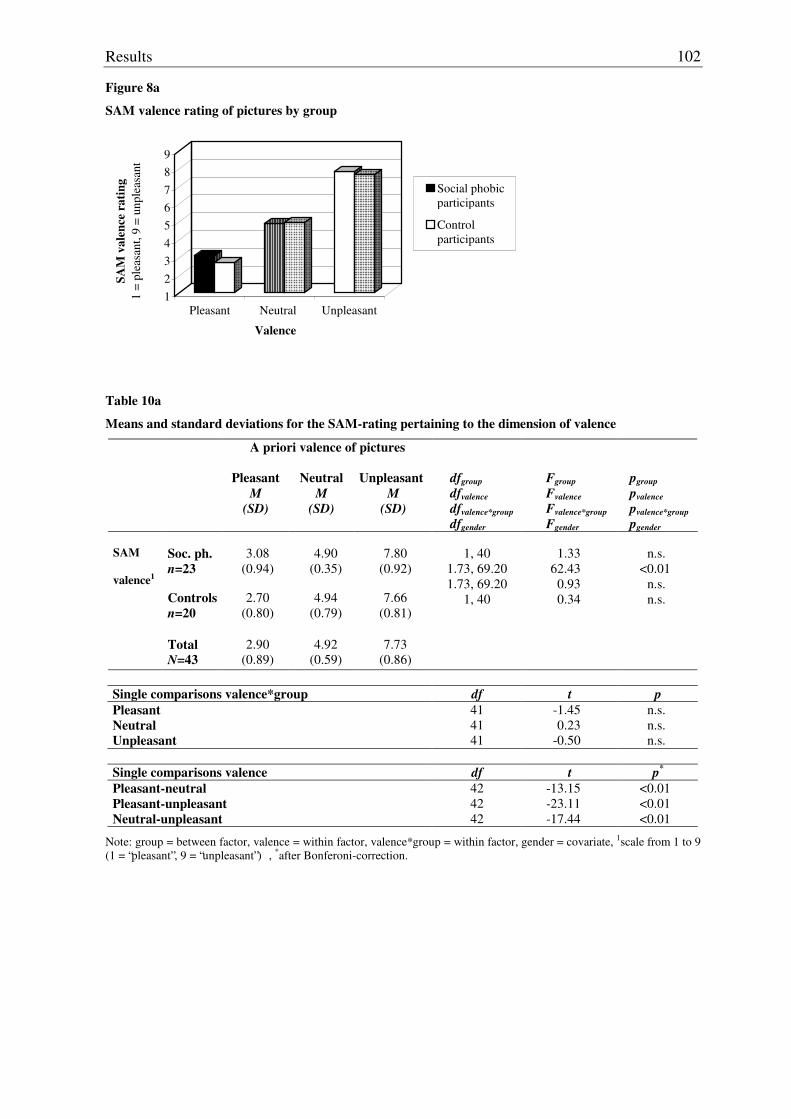
Results
102
Figure 8a
SAM valence rating of pictures by group
123456789
SAM
val
ence
rat
ing
1 =
plea
sant
, 9 =
unp
leas
ant
Pleasant Neutral Unpleasant
Valence
Social phobicparticipants
Control participants
Table 10a
Means and standard deviations for the SAM-rating pertaining to the dimension of valence
A priori valence of pictures
Pleasant
M (SD)
Neutral
M (SD)
Unpleasant
M (SD)
dfgroup dfvalence dfvalence*group dfgender
Fgroup Fvalence Fvalence*group Fgender
pgroup pvalence pvalence*group pgender
Soc. ph. n=23
3.08
(0.94)
4.90
(0.35)
7.80
(0.92)
SAM valence1
Controls
n=20
2.70
(0.80)
4.94
(0.79)
7.66
(0.81)
Total
N=43
2.90
(0.89)
4.92
(0.59)
7.73
(0.86)
1, 40
1.73, 69.20 1.73, 69.20
1, 40
1.33
62.43 0.93 0.34
n.s.
<0.01 n.s. n.s.
Single comparisons valence*group df t p Pleasant Neutral Unpleasant
41 41 41
-1.45 0.23
-0.50
n.s. n.s. n.s.
Single comparisons valence df t p*
Pleasant-neutral Pleasant-unpleasant Neutral-unpleasant
42 42 42
-13.15 -23.11 -17.44
<0.01
<0.01
<0.01
Note: group = between factor, valence = within factor, valence*group = within factor, gender = covariate, 1scale from 1 to 9 (1 = “pleasant”, 9 = “unpleasant”) , *after Bonferoni-correction.
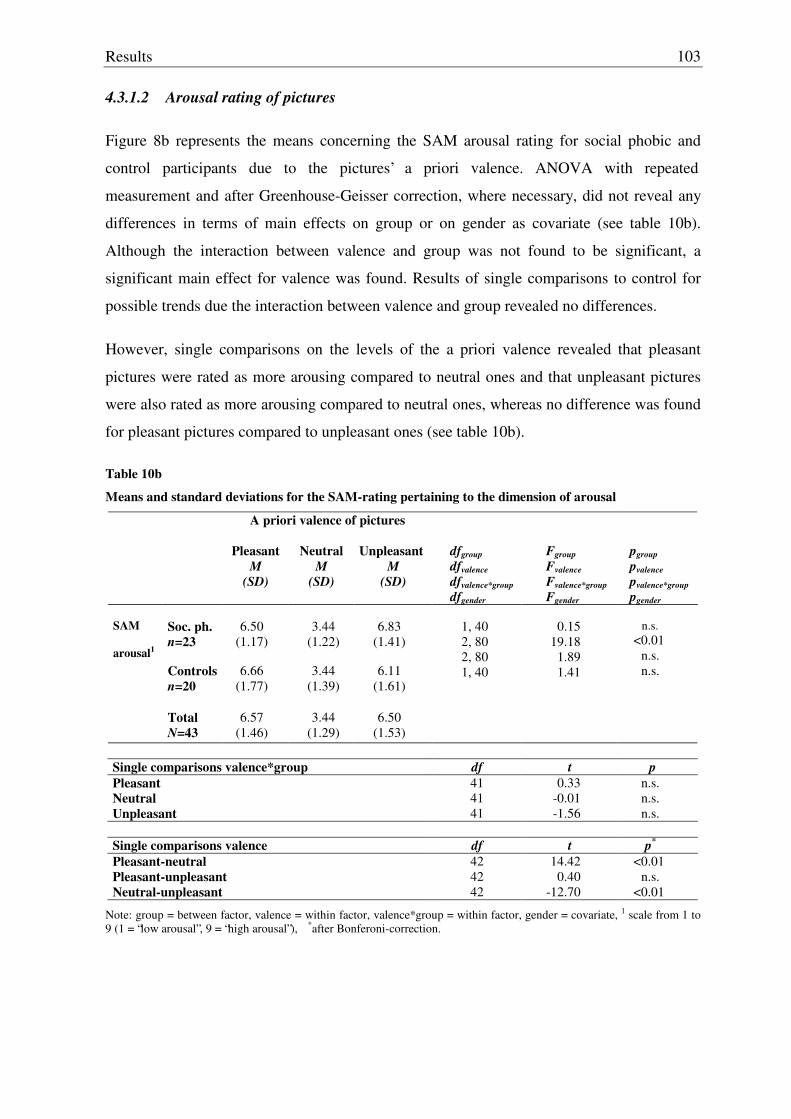
Results
103
4.3.1.2 Arousal rating of pictures
Figure 8b represents the means concerning the SAM arousal rating for social phobic and
control participants due to the pictures’ a priori valence. ANOVA with repeated
measurement and after Greenhouse-Geisser correction, where necessary, did not reveal any
differences in terms of main effects on group or on gender as covariate (see table 10b).
Although the interaction between valence and group was not found to be significant, a
significant main effect for valence was found. Results of single comparisons to control for
possible trends due the interaction between valence and group revealed no differences.
However, single comparisons on the levels of the a priori valence revealed that pleasant
pictures were rated as more arousing compared to neutral ones and that unpleasant pictures
were also rated as more arousing compared to neutral ones, whereas no difference was found
for pleasant pictures compared to unpleasant ones (see table 10b).
Table 10b
Means and standard deviations for the SAM-rating pertaining to the dimension of arousal
A priori valence of pictures
Pleasant
M (SD)
Neutral
M (SD)
Unpleasant
M (SD)
dfgroup dfvalence dfvalence*group dfgender
Fgroup Fvalence Fvalence*group Fgender
pgroup pvalence pvalence*group pgender
Soc. ph. n=23
6.50
(1.17)
3.44
(1.22)
6.83
(1.41)
SAM arousal1
Controls
n=20
6.66
(1.77)
3.44
(1.39)
6.11
(1.61)
Total
N=43
6.57
(1.46)
3.44
(1.29)
6.50
(1.53)
1, 40 2, 80 2, 80 1, 40
0.15
19.18 1.89 1.41
n.s.
<0.01 n.s. n.s.
Single comparisons valence*group df t p Pleasant Neutral Unpleasant
41 41 41
0.33 -0.01 -1.56
n.s. n.s. n.s.
Single comparisons valence df t p*
Pleasant-neutral Pleasant-unpleasant Neutral-unpleasant
42 42 42
14.42 0.40
-12.70
<0.01 n.s.
<0.01
Note: group = between factor, valence = within factor, valence*group = within factor, gender = covariate, 1 scale from 1 to 9 (1 = “low arousal”, 9 = “high arousal”), *after Bonferoni-correction.
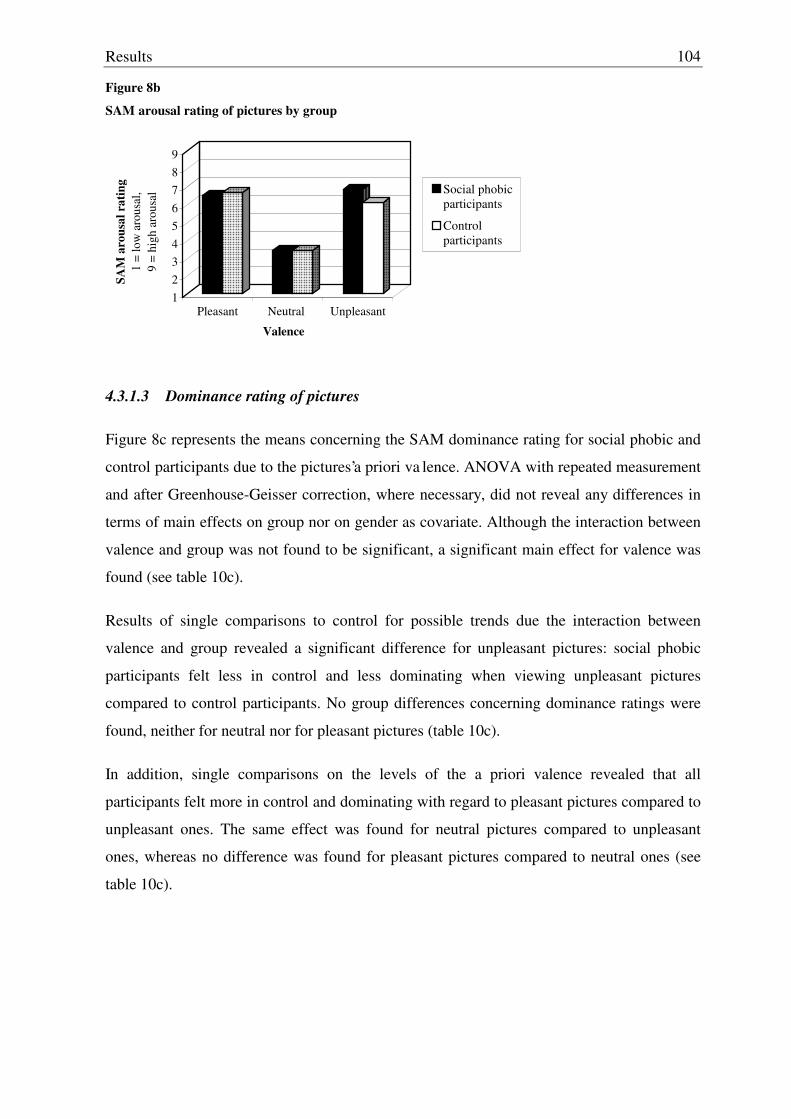
Results
104
Figure 8b
SAM arousal rating of pictures by group
123456789
SAM
aro
usal
rat
ing
1 =
low
aro
usal
, 9
= hi
gh a
rous
al
Pleasant Neutral Unpleasant
Valence
Social phobicparticipants
Control participants
4.3.1.3 Dominance rating of pictures
Figure 8c represents the means concerning the SAM dominance rating for social phobic and
control participants due to the pictures’a priori va lence. ANOVA with repeated measurement
and after Greenhouse-Geisser correction, where necessary, did not reveal any differences in
terms of main effects on group nor on gender as covariate. Although the interaction between
valence and group was not found to be significant, a significant main effect for valence was
found (see table 10c).
Results of single comparisons to control for possible trends due the interaction between
valence and group revealed a significant difference for unpleasant pictures: social phobic
participants felt less in control and less dominating when viewing unpleasant pictures
compared to control participants. No group differences concerning dominance ratings were
found, neither for neutral nor for pleasant pictures (table 10c).
In addition, single comparisons on the levels of the a priori valence revealed that all
participants felt more in control and dominating with regard to pleasant pictures compared to
unpleasant ones. The same effect was found for neutral pictures compared to unpleasant
ones, whereas no difference was found for pleasant pictures compared to neutral ones (see
table 10c).
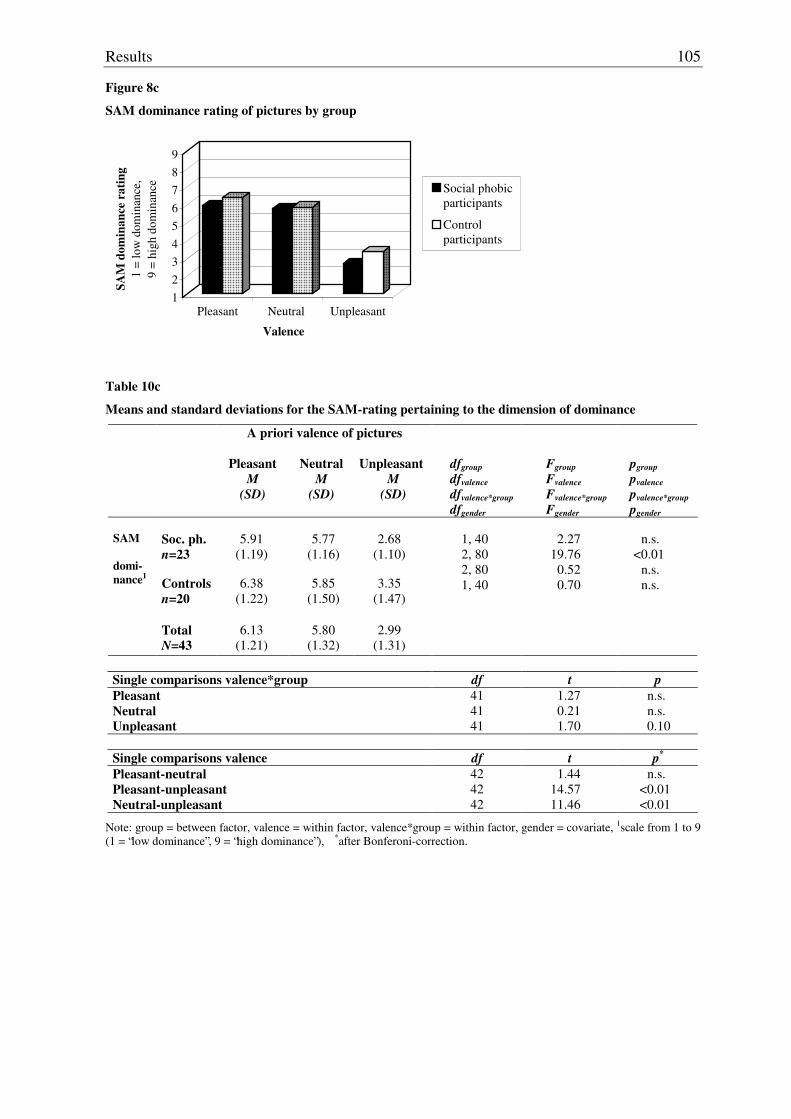
Results
105
Figure 8c
SAM dominance rating of pictures by group
123456789
SAM
dom
inan
ce r
atin
g1
= lo
w d
omin
ance
, 9
= hi
gh d
omin
ance
Pleasant Neutral Unpleasant
Valence
Social phobicparticipants
Control participants
Table 10c
Means and standard deviations for the SAM-rating pertaining to the dimension of dominance
A priori valence of pictures
Pleasant
M (SD)
Neutral
M (SD)
Unpleasant
M (SD)
dfgroup dfvalence dfvalence*group
dfgender
Fgroup Fvalence Fvalence*group Fgender
pgroup pvalence pvalence*group pgender
Soc. ph. n=23
5.91
(1.19)
5.77
(1.16)
2.68
(1.10)
SAM domi-nance1
Controls
n=20
6.38
(1.22)
5.85
(1.50)
3.35
(1.47)
Total
N=43
6.13
(1.21)
5.80
(1.32)
2.99
(1.31)
1, 40 2, 80 2, 80 1, 40
2.27
19.76 0.52 0.70
n.s.
<0.01 n.s. n.s.
Single comparisons valence*group df t p Pleasant Neutral Unpleasant
41 41 41
1.27 0.21 1.70
n.s. n.s. 0.10
Single comparisons valence df t p*
Pleasant-neutral Pleasant-unpleasant Neutral-unpleasant
42 42 42
1.44 14.57 11.46
n.s. <0.01 <0.01
Note: group = between factor, valence = within factor, valence*group = within factor, gender = covariate, 1scale from 1 to 9 (1 = “low dominance”, 9 = “high dominance”), *after Bonferoni-correction.
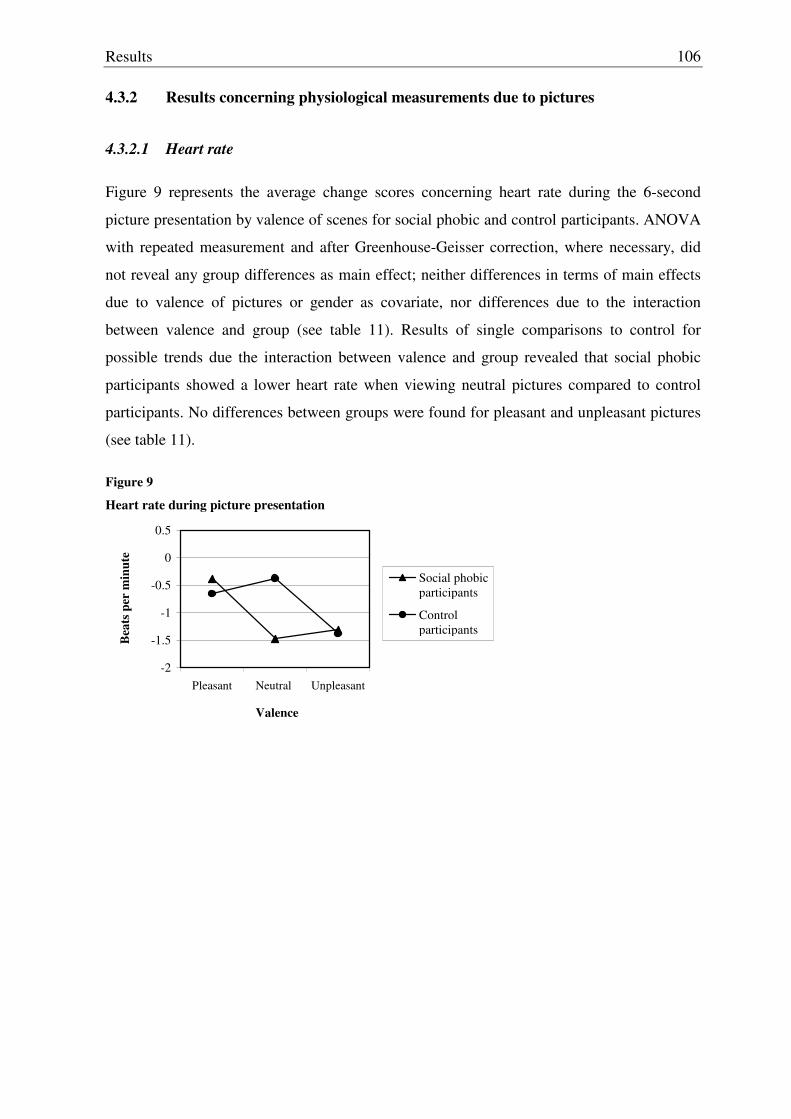
Results
106
4.3.2 Results concerning physiological measurements due to pictures
4.3.2.1 Heart rate
Figure 9 represents the average change scores concerning heart rate during the 6-second
picture presentation by valence of scenes for social phobic and control participants. ANOVA
with repeated measurement and after Greenhouse-Geisser correction, where necessary, did
not reveal any group differences as main effect; neither differences in terms of main effects
due to valence of pictures or gender as covariate, nor differences due to the interaction
between valence and group (see table 11). Results of single comparisons to control for
possible trends due the interaction between valence and group revealed that social phobic
participants showed a lower heart rate when viewing neutral pictures compared to control
participants. No differences between groups were found for pleasant and unpleasant pictures
(see table 11).
Figure 9
Heart rate during picture presentation
-2
-1.5
-1
-0.5
0
0.5
Pleasant Neutral Unpleasant
Valence
Bea
ts p
er m
inut
e
Social phobicparticipants
Control participants
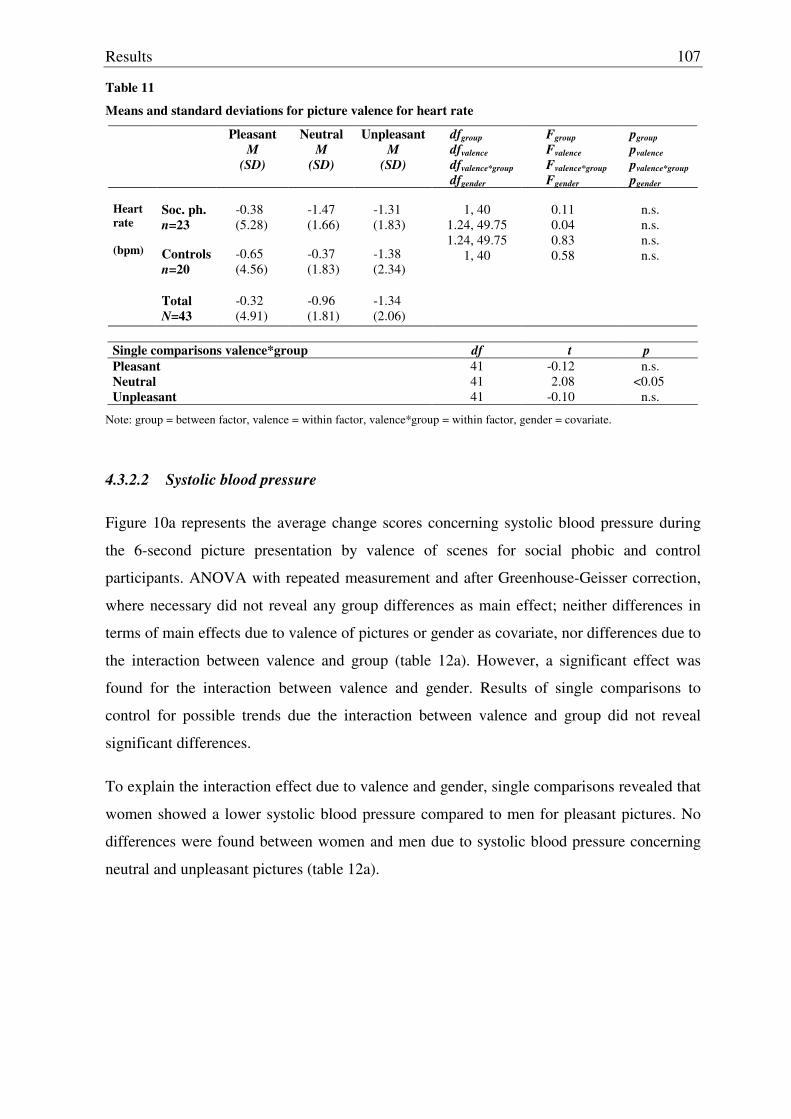
Results
107
Table 11
Means and standard deviations for picture valence for heart rate
Pleasant M
(SD)
Neutral M
(SD)
Unpleasant M
(SD)
dfgroup dfvalence dfvalence*group dfgender
Fgroup Fvalence Fvalence*group Fgender
pgroup pvalence pvalence*group pgender
Soc. ph. n=23
-0.38 (5.28)
-1.47 (1.66)
-1.31 (1.83)
Heart rate (bpm)
Controls
n=20
-0.65 (4.56)
-0.37 (1.83)
-1.38 (2.34)
Total
N=43
-0.32 (4.91)
-0.96 (1.81)
-1.34 (2.06)
1, 40
1.24, 49.75 1.24, 49.75
1, 40
0.11 0.04 0.83 0.58
n.s. n.s. n.s. n.s.
Single comparisons valence*group df t p Pleasant Neutral Unpleasant
41 41 41
-0.12 2.08
-0.10
n.s. <0.05
n.s.
Note: group = between factor, valence = within factor, valence*group = within factor, gender = covariate.
4.3.2.2 Systolic blood pressure
Figure 10a represents the average change scores concerning systolic blood pressure during
the 6-second picture presentation by valence of scenes for social phobic and control
participants. ANOVA with repeated measurement and after Greenhouse-Geisser correction,
where necessary did not reveal any group differences as main effect; neither differences in
terms of main effects due to valence of pictures or gender as covariate, nor differences due to
the interaction between valence and group (table 12a). However, a significant effect was
found for the interaction between valence and gender. Results of single comparisons to
control for possible trends due the interaction between valence and group did not reveal
significant differences.
To explain the interaction effect due to valence and gender, single comparisons revealed that
women showed a lower systolic blood pressure compared to men for pleasant pictures. No
differences were found between women and men due to systolic blood pressure concerning
neutral and unpleasant pictures (table 12a).
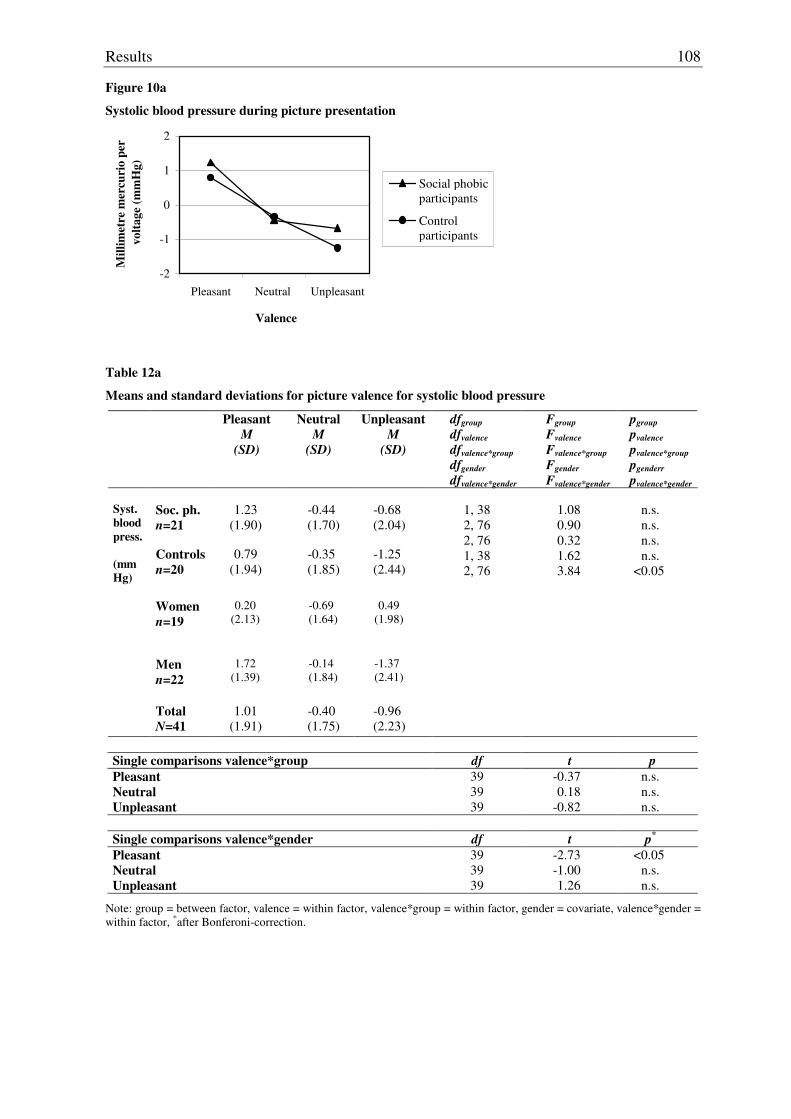
Results
108
Figure 10a
Systolic blood pressure during picture presentation
-2
-1
0
1
2
Pleasant Neutral Unpleasant
Valence
Mill
imet
re m
ercu
rio
per
vol
tage
(mm
Hg)
Social phobicparticipants
Control participants
Table 12a
Means and standard deviations for picture valence for systolic blood pressure
Pleasant M
(SD)
Neutral M
(SD)
Unpleasant M
(SD)
dfgroup dfvalence dfvalence*group dfgender dfvalence*gender
Fgroup Fvalence Fvalence*group Fgender Fvalence*gender
pgroup pvalence pvalence*group pgenderr pvalence*gender
Soc. ph. n=21
1.23
(1.90)
-0.44 (1.70)
-0.68 (2.04)
Syst. blood press. (mmHg)
Controls
n=20
0.79
(1.94)
-0.35 (1.85)
-1.25 (2.44)
Women
n=19
0.20
(2.13)
-0.69 (1.64)
0.49
(1.98)
Men n=22
1.72
(1.39)
-0.14 (1.84)
-1.37 (2.41)
Total
N=41
1.01
(1.91)
-0.40 (1.75)
-0.96 (2.23)
1, 38 2, 76 2, 76 1, 38 2, 76
1.08 0.90 0.32 1.62 3.84
n.s. n.s. n.s. n.s.
<0.05
Single comparisons valence*group df t p Pleasant Neutral Unpleasant
39 39 39
-0.37 0.18
-0.82
n.s. n.s. n.s.
Single comparisons valence*gender df t p*
Pleasant Neutral Unpleasant
39 39 39
-2.73 -1.00 1.26
<0.05 n.s. n.s.
Note: group = between factor, valence = within factor, valence*group = within factor, gender = covariate, valence*gender = within factor, *after Bonferoni-correction.
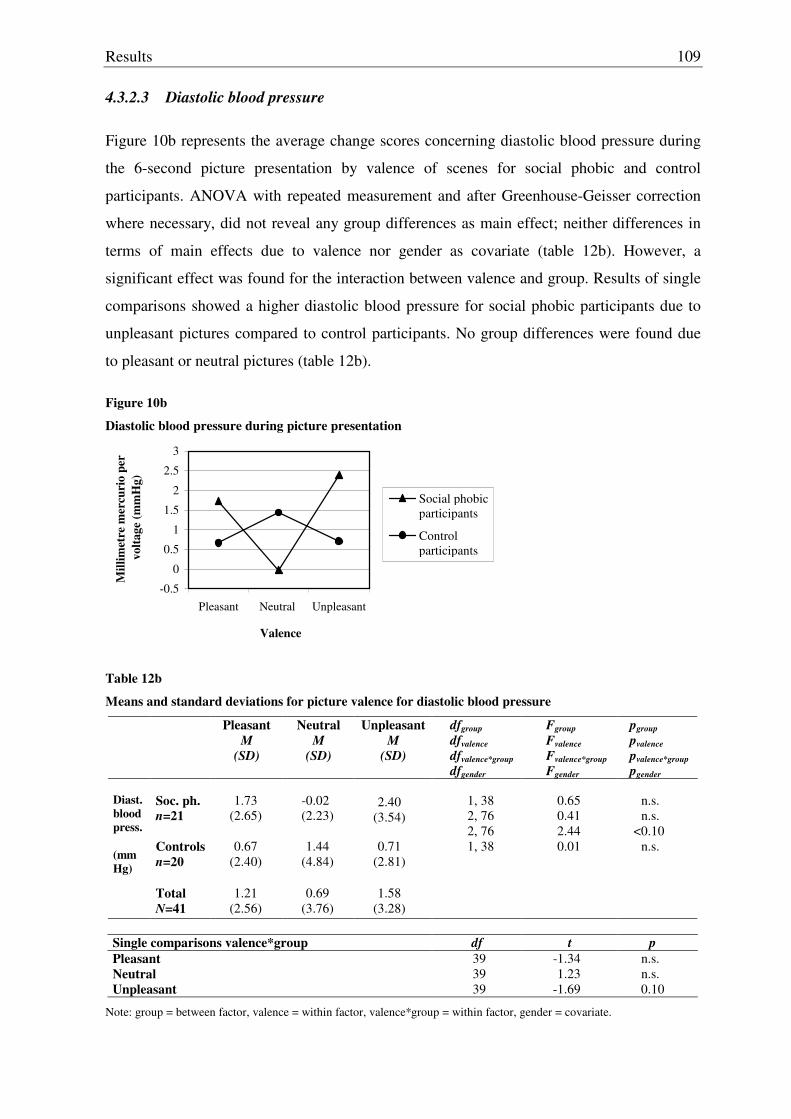
Results
109
4.3.2.3 Diastolic blood pressure
Figure 10b represents the average change scores concerning diastolic blood pressure during
the 6-second picture presentation by valence of scenes for social phobic and control
participants. ANOVA with repeated measurement and after Greenhouse-Geisser correction
where necessary, did not reveal any group differences as main effect; neither differences in
terms of main effects due to valence nor gender as covariate (table 12b). However, a
significant effect was found for the interaction between valence and group. Results of single
comparisons showed a higher diastolic blood pressure for social phobic participants due to
unpleasant pictures compared to control participants. No group differences were found due
to pleasant or neutral pictures (table 12b).
Figure 10b
Diastolic blood pressure during picture presentation
-0.5
0
0.5
1
1.5
2
2.5
3
Pleasant Neutral Unpleasant
Valence
Mill
imet
re m
ercu
rio
per
vol
tage
(mm
Hg)
Social phobicparticipants
Control participants
Table 12b
Means and standard deviations for picture valence for diastolic blood pressure
Pleasant M
(SD)
Neutral M
(SD)
Unpleasant M
(SD)
dfgroup dfvalence dfvalence*group dfgender
Fgroup Fvalence Fvalence*group Fgender
pgroup pvalence pvalence*group pgender
Soc. ph. n=21
1.73
(2.65)
-0.02 (2.23)
2.40
(3.54) Controls
n=20
0.67
(2.40)
1.44
(4.84)
0.71
(2.81)
Diast. blood press. (mmHg)
Total
N=41
1.21
(2.56)
0.69
(3.76)
1.58
(3.28)
1, 38 2, 76 2, 76 1, 38
0.65 0.41 2.44 0.01
n.s. n.s.
<0.10 n.s.
Single comparisons valence*group df t p Pleasant Neutral Unpleasant
39 39 39
-1.34 1.23
-1.69
n.s. n.s. 0.10
Note: group = between factor, valence = within factor, valence*group = within factor, gender = covariate.
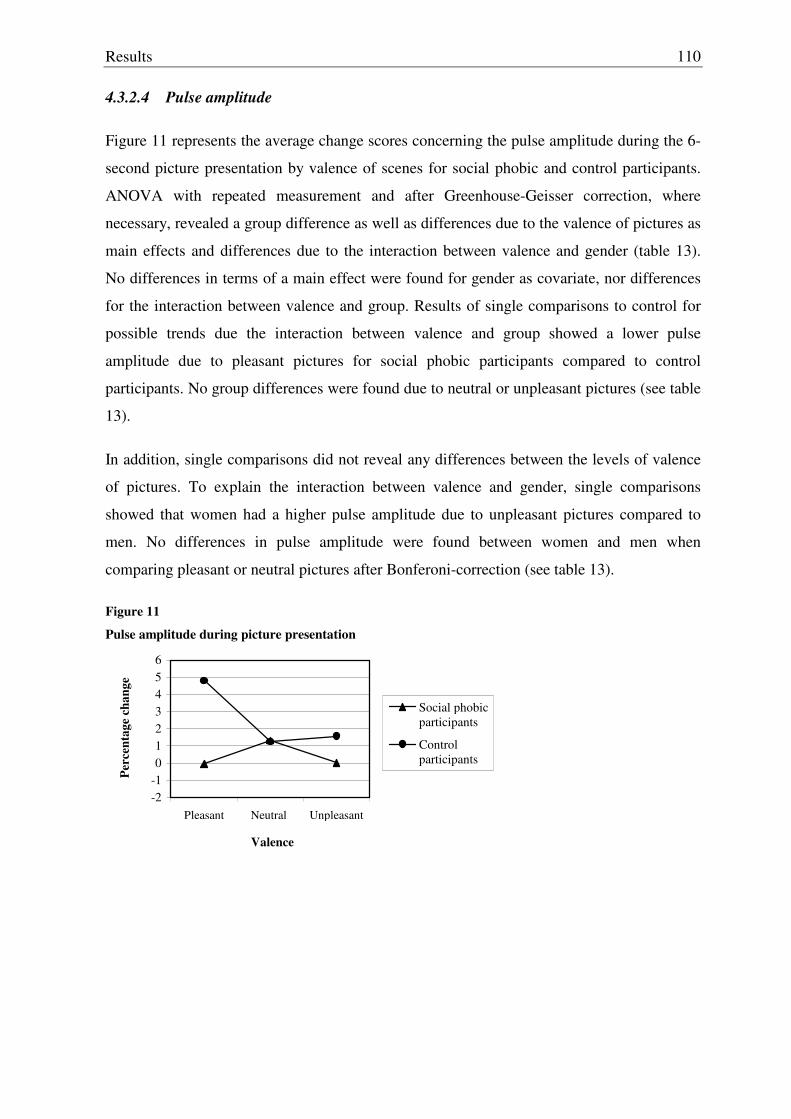
Results
110
4.3.2.4 Pulse amplitude
Figure 11 represents the average change scores concerning the pulse amplitude during the 6-
second picture presentation by valence of scenes for social phobic and control participants.
ANOVA with repeated measurement and after Greenhouse-Geisser correction, where
necessary, revealed a group difference as well as differences due to the valence of pictures as
main effects and differences due to the interaction between valence and gender (table 13).
No differences in terms of a main effect were found for gender as covariate, nor differences
for the interaction between valence and group. Results of single comparisons to control for
possible trends due the interaction between valence and group showed a lower pulse
amplitude due to pleasant pictures for social phobic participants compared to control
participants. No group differences were found due to neutral or unpleasant pictures (see table
13).
In addition, single comparisons did not reveal any differences between the levels of valence
of pictures. To explain the interaction between valence and gender, single comparisons
showed that women had a higher pulse amplitude due to unpleasant pictures compared to
men. No differences in pulse amplitude were found between women and men when
comparing pleasant or neutral pictures after Bonferoni-correction (see table 13).
Figure 11
Pulse amplitude during picture presentation
-2-10123456
Pleasant Neutral Unpleasant
Valence
Perc
enta
ge c
hang
e
Social phobicparticipants
Control participants
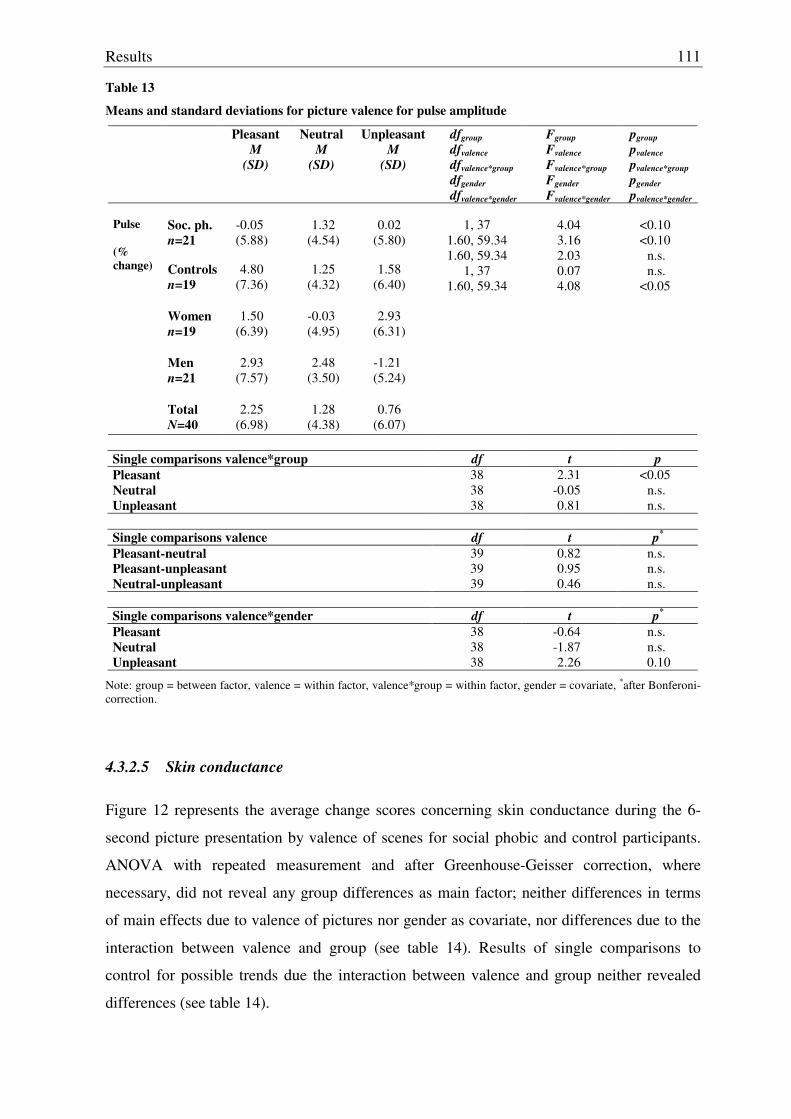
Results
111
Table 13
Means and standard deviations for picture valence for pulse amplitude
Pleasant M
(SD)
Neutral M
(SD)
Unpleasant M
(SD)
dfgroup dfvalence dfvalence*group dfgender dfvalence*gender
Fgroup Fvalence Fvalence*group Fgender Fvalence*gender
pgroup pvalence pvalence*group pgender
pvalence*gender Soc. ph. n=21
-0.05 (5.88)
1.32
(4.54)
0.02
(5.80)
Pulse (% change)
Controls
n=19
4.80
(7.36)
1.25
(4.32)
1.58
(6.40)
Women n=19
1.50
(6.39)
-0.03 (4.95)
2.93
(6.31)
Men n=21
2.93
(7.57)
2.48
(3.50)
-1.21 (5.24)
Total
N=40
2.25
(6.98)
1.28
(4.38)
0.76
(6.07)
1, 37
1.60, 59.34 1.60, 59.34
1, 37 1.60, 59.34
4.04 3.16 2.03 0.07 4.08
<0.10 <0.10
n.s. n.s.
<0.05
Single comparisons valence*group df t p Pleasant Neutral Unpleasant
38 38 38
2.31 -0.05 0.81
<0.05 n.s. n.s.
Single comparisons valence df t p*
Pleasant-neutral Pleasant-unpleasant Neutral-unpleasant
39 39 39
0.82 0.95 0.46
n.s. n.s. n.s.
Single comparisons valence*gender df t p*
Pleasant Neutral Unpleasant
38 38 38
-0.64 -1.87 2.26
n.s. n.s. 0.10
Note: group = between factor, valence = within factor, valence*group = within factor, gender = covariate, *after Bonferoni-correction.
4.3.2.5 Skin conductance
Figure 12 represents the average change scores concerning skin conductance during the 6-
second picture presentation by valence of scenes for social phobic and control participants.
ANOVA with repeated measurement and after Greenhouse-Geisser correction, where
necessary, did not reveal any group differences as main factor; neither differences in terms
of main effects due to valence of pictures nor gender as covariate, nor differences due to the
interaction between valence and group (see table 14). Results of single comparisons to
control for possible trends due the interaction between valence and group neither revealed
differences (see table 14).
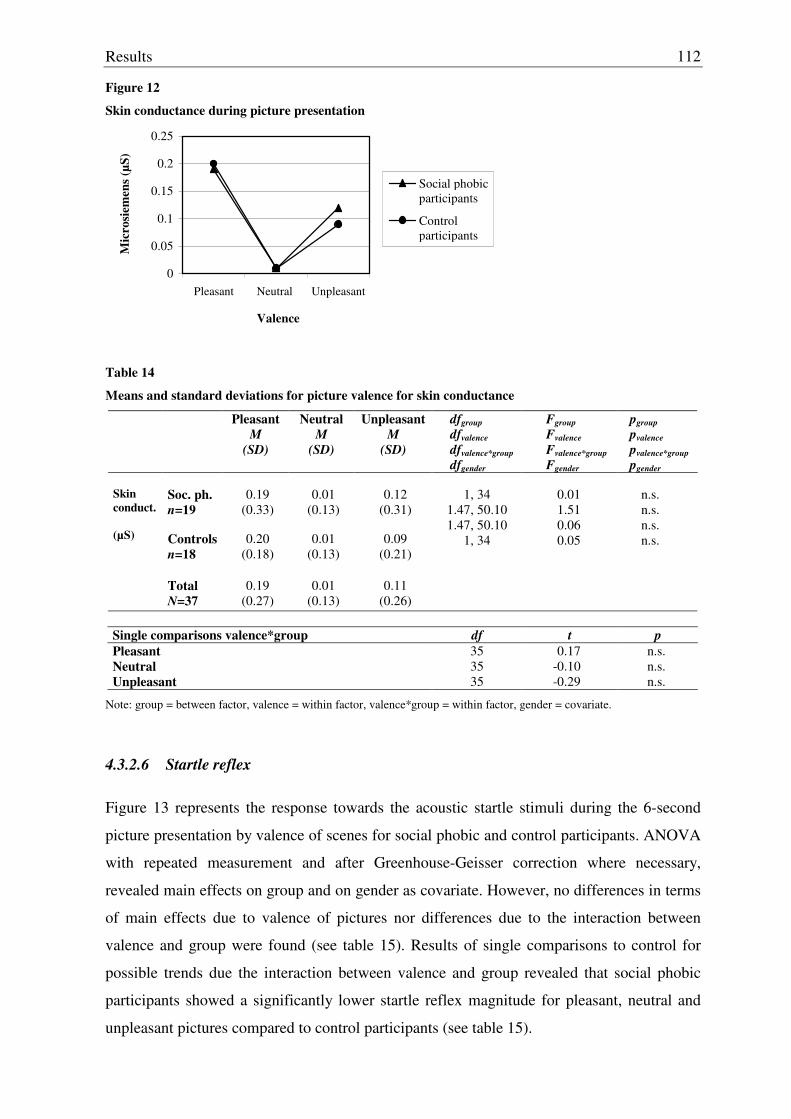
Results
112
Figure 12
Skin conductance during picture presentation
0
0.05
0.1
0.15
0.2
0.25
Pleasant Neutral Unpleasant
Valence
Mic
rosi
emen
s (µS
)
Social phobicparticipants
Control participants
Table 14
Means and standard deviations for picture valence for skin conductance
Pleasant M
(SD)
Neutral M
(SD)
Unpleasant M
(SD)
dfgroup dfvalence dfvalence*group dfgender
Fgroup Fvalence Fvalence*group Fgender
pgroup pvalence pvalence*group pgender
Soc. ph. n=19
0.19
(0.33)
0.01
(0.13)
0.12
(0.31)
Skin conduct. (µS)
Controls
n=18
0.20
(0.18)
0.01
(0.13)
0.09
(0.21)
Total
N=37
0.19
(0.27)
0.01
(0.13)
0.11
(0.26)
1, 34
1.47, 50.10 1.47, 50.10
1, 34
0.01 1.51 0.06 0.05
n.s. n.s. n.s. n.s.
Single comparisons valence*group df t p Pleasant Neutral Unpleasant
35 35 35
0.17 -0.10 -0.29
n.s. n.s. n.s.
Note: group = between factor, valence = within factor, valence*group = within factor, gender = covariate.
4.3.2.6 Startle reflex
Figure 13 represents the response towards the acoustic startle stimuli during the 6-second
picture presentation by valence of scenes for social phobic and control participants. ANOVA
with repeated measurement and after Greenhouse-Geisser correction where necessary,
revealed main effects on group and on gender as covariate. However, no differences in terms
of main effects due to valence of pictures nor differences due to the interaction between
valence and group were found (see table 15). Results of single comparisons to control for
possible trends due the interaction between valence and group revealed that social phobic
participants showed a significantly lower startle reflex magnitude for pleasant, neutral and
unpleasant pictures compared to control participants (see table 15).
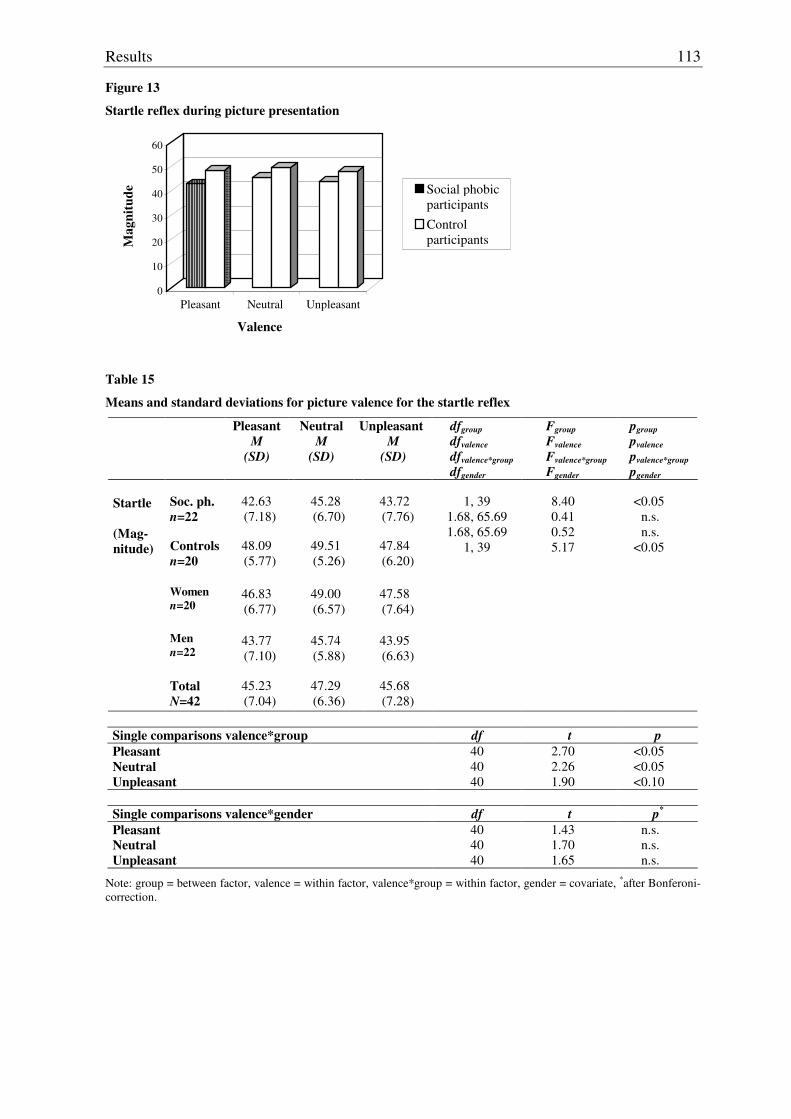
Results
113
Figure 13
Startle reflex during picture presentation
0
10
20
30
40
50
60
Mag
nitu
de
Pleasant Neutral Unpleasant
Valence
Social phobicparticipantsControl participants
Table 15
Means and standard deviations for picture valence for the startle reflex
Pleasant M
(SD)
Neutral M
(SD)
Unpleasant M
(SD)
dfgroup dfvalence dfvalence*group dfgender
Fgroup Fvalence Fvalence*group Fgender
pgroup pvalence pvalence*group pgender
Soc. ph. n=22
42.63 (7.18)
45.28 (6.70)
43.72 (7.76)
Startle (Mag- nitude)
Controls
n=20
48.09 (5.77)
49.51 (5.26)
47.84 (6.20)
Women n=20
46.83 (6.77)
49.00 (6.57)
47.58 (7.64)
Men n=22
43.77 (7.10)
45.74 (5.88)
43.95 (6.63)
Total
N=42
45.23 (7.04)
47.29 (6.36)
45.68 (7.28)
1, 39
1.68, 65.69 1.68, 65.69
1, 39
8.40 0.41 0.52 5.17
<0.05
n.s. n.s.
<0.05
Single comparisons valence*group df t p Pleasant Neutral Unpleasant
40 40 40
2.70 2.26 1.90
<0.05 <0.05 <0.10
Single comparisons valence*gender df t p*
Pleasant Neutral Unpleasant
40 40 40
1.43 1.70 1.65
n.s. n.s. n.s.
Note: group = between factor, valence = within factor, valence*group = within factor, gender = covariate, *after Bonferoni-correction.
Results
114
In addition, single comparisons to explain the effect on gender revealed that women showed
a higher startle reflex magnitude for neutral and a tendency towards a higher startle reflex
magnitude for unpleasant pictures compared to men. However these effects disappeared
when adjusting the alpha-level by Bonferoni. No differences were found between women
and men concerning pleasant pictures (see table 15).
Results
115
4.4 Results concerning the imagery paradigm
Normal distribution of means concerning the subscales of the SAM-rating must not be
assumed except for the subscale of valence concerning neutral personalized scenes within
both groups, fear-related personalized scenes within the group of social phobic participants.
For the subscale of arousal concerning neutral standardized and personalized scenes for
controls and fear-related personalized scenes also for control and for the subscale dominance
concerning pleasant personalized scenes in both groups and pleasant standardized scenes in
controls, neutral standardized and fear-related personalized in controls normal distribution
must also not be assumed. For heart rate, normal distribution of means can be assumed,
except for pleasant standardized scenes in the post-interval for controls. For systolic blood
pressure, normal distribution of means can be assumed except for pleasant personalized
scenes and fear-related standardized scenes during the presentation period, for neutral
standardized and fear-related standardized scenes during the imagery period and fear-related
standardized scenes during the post-interval within the group of social phobics, neither it can
be assumed for fear-related personalized scenes during the post-interval within both groups.
For diastolic blood pressure normal distribution of means can be assumed except for pleasant
personalized scenes during presentation within the group of social phobics, for fear-related
personalized scenes during presentation within the group of controls, for neutral
standardized and personalized scenes during imagery within the group of controls and for
fear-related personalized scenes during post-interval within the group of controls. For pulse,
normal distribution must not be assumed except for the means concerning pleasant
standardized and fear-related standardized scenes during presentation, pleasant and neutral
standardized and personalized scenes during imagery, pleasant personalized and neutral
personalized scenes during the post-interval, all within the group of controls. For respiration
amplitude, normal distribution must not be assumed except for pleasant personalized and
fear-related personalized scenes during imagery within the group of social phobics, pleasant
personalized, neutral personalized and fear-related standardized scenes during the post-
interval within the group of controls. For respiration rate, results are mixed. Normal
distribution can be assumed for pleasant standardized, pleasant personalized and neutral
standardized scenes during imagery within the group of social phobics, for neutral
personalized scenes during imagery within both groups, for fear-related personalized scenes
during imagery within the group of controls and for neutral standardized, fear-related
standardized and personalized scenes during post-interval within the group of social phobics.
For skin conductance, normal distribution of means must not be assumed. For startle reflex,
Results
116
normal distribution can be assumed except for neutral personalized scenes during imagery
within the group of controls (see appendix table B-4).
Homogeneity of variances can be assumed for the subscales valence and dominance of the
SAM-rating and the startle reflex. For the subscale arousal of the SAM-rating, homogeneity
of variances must not be assumed for neutral standardized scenes. For heart rate
homogeneity of variances must not be assumed for pleasant personalized scenes during
imagery. Concerning systolic blood pressure and skin conductance, although homogeneity
regarding the matrices of variances and covariances must not be assumed, results concerning
homogeneity of variances within each level of the a priori valence of scenes, type of scene
and period as measured by the Levene test can be assumed. For diastolic blood pressure,
homogeneity of variances must not be assumed for pleasant personalized scenes during
imagery. Concerning pulse, homogeneity of variances must not be assumed for pleasant
standardized scenes during imagery. For respiration amplitude, homogeneity of variances
must not be assumed for pleasant standardized scenes during imagery nor for pleasant
personalized scenes during post-interval. For respiration rate, homogeneity of variances must
not be assumed for neutral standardized and personalized scenes during imagery (see
appendix table B-8).
4.4.1 Affective rating due to scenes: Self-assessment manikin
4.4.1.1 Valence rating of scenes
Figure 14a and 14b represent the means concerning the SAM-valence rating for social
phobic and control participants due to scenes respectively due to the type of scene by their a
priori valence. ANOVA with repeated measurement and after Greenhouse-Geisser
correction where necessary, did not reveal any differences in terms of main effects on group
nor on type of scene. However, differences in terms of main effects were found for the a
priori valence of scenes as well as for gender as a covariate. Also, differences were found
due to the interaction between valence and group and the interaction between valence, type
of scene and group as well as for the interaction between valence and gender. Results of
single comparisons due to the interaction between valence and group revealed that social
phobic participants compared to control participants rated neutral scenes as less pleasant,
whereas no differences were found between groups concerning pleasant and fear-related
scenes (see figure 14a and table 16a). Concerning single comparisons due to the interaction
between valence, type of scene and group, social phobic participants rated neutral
personalized scenes as less pleasant compared to control participants. They also rated fear-
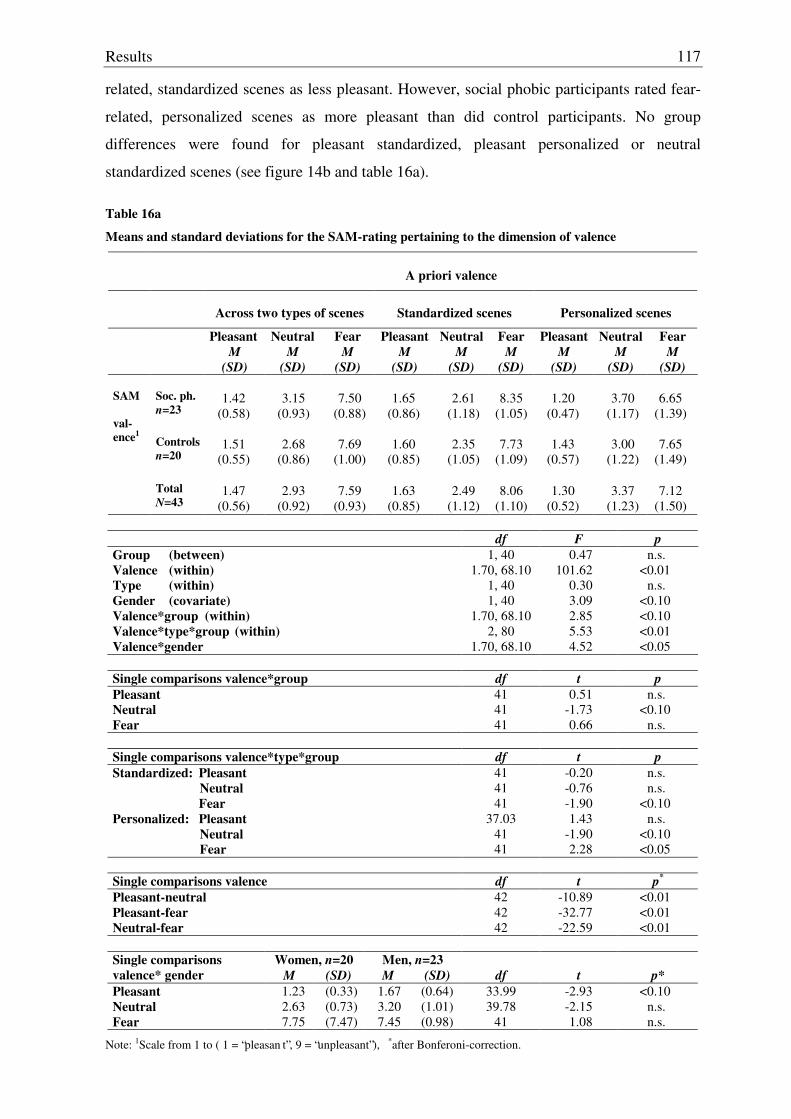
Results
117
related, standardized scenes as less pleasant. However, social phobic participants rated fear-
related, personalized scenes as more pleasant than did control participants. No group
differences were found for pleasant standardized, pleasant personalized or neutral
standardized scenes (see figure 14b and table 16a).
Table 16a
Means and standard deviations for the SAM-rating pertaining to the dimension of valence
A priori valence
Across two types of scenes
Standardized scenes
Personalized scenes
Pleasant M
(SD)
Neutral M
(SD)
Fear M
(SD)
Pleasant M
(SD)
Neutral M
(SD)
Fear M
(SD)
Pleasant M
(SD)
Neutral M
(SD)
Fear M
(SD) Soc. ph. n=23
1.42
(0.58)
3.15
(0.93)
7.50
(0.88)
1.65
(0.86)
2.61
(1.18)
8.35
(1.05)
1.20
(0.47)
3.70
(1.17)
6.65
(1.39) Controls
n=20
1.51
(0.55)
2.68
(0.86)
7.69
(1.00)
1.60
(0.85)
2.35
(1.05)
7.73
(1.09)
1.43
(0.57)
3.00
(1.22)
7.65
(1.49)
SAM val-ence1
Total
N=43
1.47
(0.56)
2.93
(0.92)
7.59
(0.93)
1.63
(0.85)
2.49
(1.12)
8.06
(1.10)
1.30
(0.52)
3.37
(1.23)
7.12
(1.50)
df F p Group (between) Valence (within) Type (within) Gender (covariate) Valence*group (within) Valence*type*group (within) Valence*gender
1, 40 1.70, 68.10
1, 40 1, 40
1.70, 68.10 2, 80
1.70, 68.10
0.47 101.62
0.30 3.09 2.85 5.53 4.52
n.s. <0.01
n.s. <0.10 <0.10 <0.01 <0.05
Single comparisons valence*group df t p Pleasant Neutral Fear
41 41 41
0.51 -1.73 0.66
n.s. <0.10
n.s.
Single comparisons valence*type*group df t p Standardized: Pleasant Neutral Fear Personalized: Pleasant Neutral Fear
41 41 41
37.03 41 41
-0.20 -0.76 -1.90 1.43
-1.90 2.28
n.s. n.s.
<0.10 n.s.
<0.10 <0.05
Single comparisons valence df t p*
Pleasant-neutral Pleasant-fear Neutral-fear
42 42 42
-10.89 -32.77 -22.59
<0.01 <0.01 <0.01
Women, n=20 Men, n=23 Single comparisons
valence* gender M (SD) M (SD) df t p* Pleasant 1.23 (0.33) 1.67 (0.64) 33.99 -2.93 <0.10 Neutral 2.63 (0.73) 3.20 (1.01) 39.78 -2.15 n.s. Fear 7.75 (7.47) 7.45 (0.98) 41 1.08 n.s.
Note: 1Scale from 1 to ( 1 = “pleasan t”, 9 = “unpleasant”), *after Bonferoni-correction.
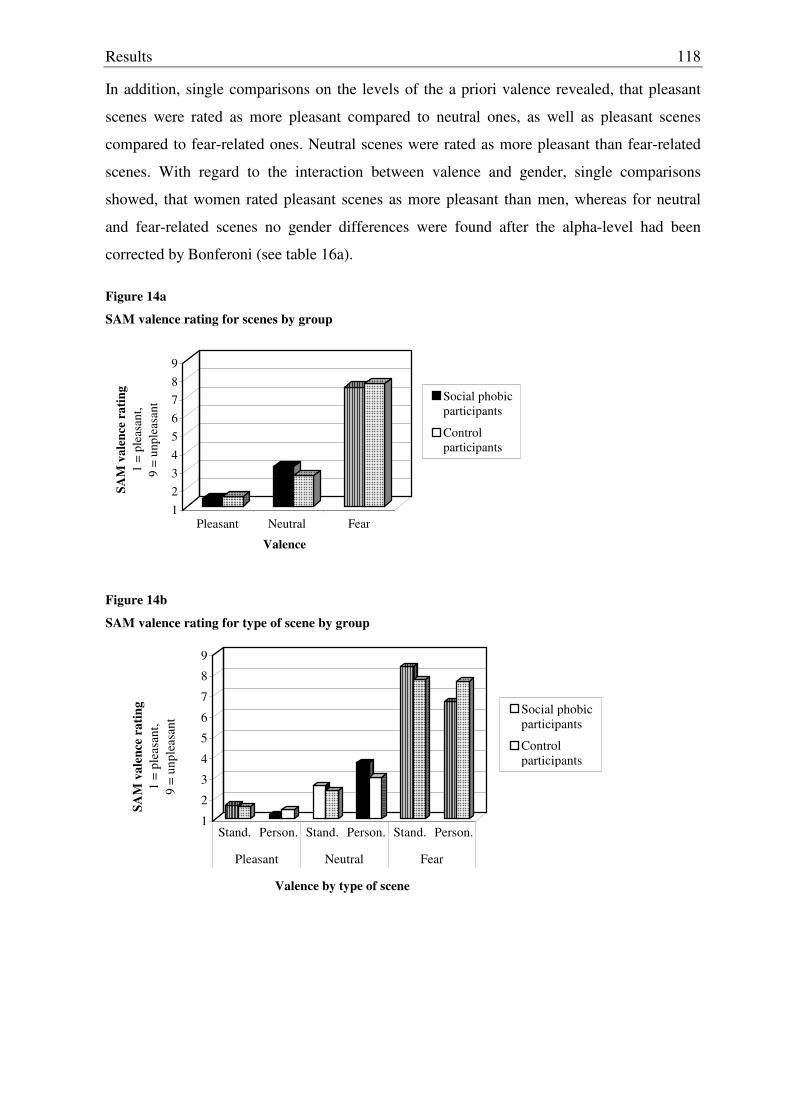
Results
118
In addition, single comparisons on the levels of the a priori valence revealed, that pleasant
scenes were rated as more pleasant compared to neutral ones, as well as pleasant scenes
compared to fear-related ones. Neutral scenes were rated as more pleasant than fear-related
scenes. With regard to the interaction between valence and gender, single comparisons
showed, that women rated pleasant scenes as more pleasant than men, whereas for neutral
and fear-related scenes no gender differences were found after the alpha-level had been
corrected by Bonferoni (see table 16a).
Figure 14a
SAM valence rating for scenes by group
123456789
SAM
val
ence
rat
ing
1 =
plea
sant
,9
= un
plea
sant
Pleasant Neutral Fear
Valence
Social phobicparticipants
Control participants
Figure 14b
SAM valence rating for type of scene by group
1
2
3
4
5
6
7
8
9
SAM
val
ence
rat
ing
1 =
plea
sant
, 9
= un
plea
sant
Stand. Person. Stand. Person. Stand. Person.
Pleasant Neutral Fear
Valence by type of scene
Social phobicparticipants
Control participants
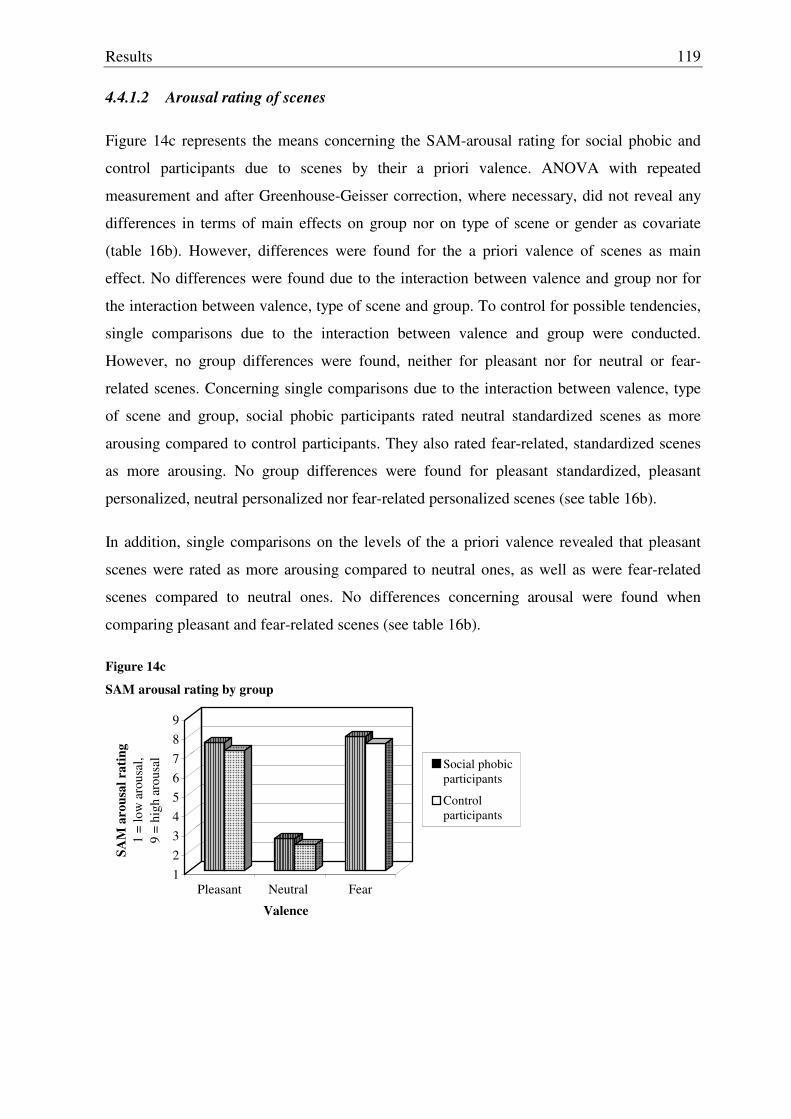
Results
119
4.4.1.2 Arousal rating of scenes
Figure 14c represents the means concerning the SAM-arousal rating for social phobic and
control participants due to scenes by their a priori valence. ANOVA with repeated
measurement and after Greenhouse-Geisser correction, where necessary, did not reveal any
differences in terms of main effects on group nor on type of scene or gender as covariate
(table 16b). However, differences were found for the a priori valence of scenes as main
effect. No differences were found due to the interaction between valence and group nor for
the interaction between valence, type of scene and group. To control for possible tendencies,
single comparisons due to the interaction between valence and group were conducted.
However, no group differences were found, neither for pleasant nor for neutral or fear-
related scenes. Concerning single comparisons due to the interaction between valence, type
of scene and group, social phobic participants rated neutral standardized scenes as more
arousing compared to control participants. They also rated fear-related, standardized scenes
as more arousing. No group differences were found for pleasant standardized, pleasant
personalized, neutral personalized nor fear-related personalized scenes (see table 16b).
In addition, single comparisons on the levels of the a priori valence revealed that pleasant
scenes were rated as more arousing compared to neutral ones, as well as were fear-related
scenes compared to neutral ones. No differences concerning arousal were found when
comparing pleasant and fear-related scenes (see table 16b).
Figure 14c
SAM arousal rating by group
123456789
SAM
aro
usal
rat
ing
1 =
low
aro
usal
, 9
= hi
gh a
rous
al
Pleasant Neutral Fear
Valence
Social phobicparticipants
Control participants
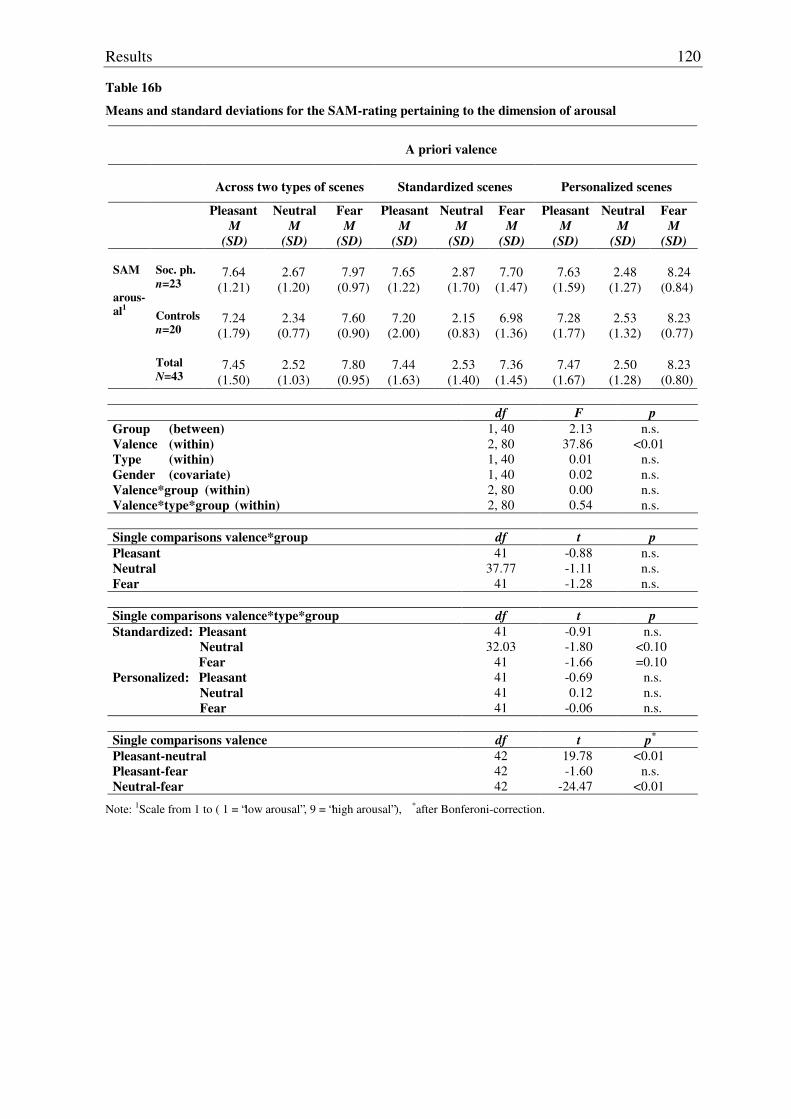
Results
120
Table 16b
Means and standard deviations for the SAM-rating pertaining to the dimension of arousal
A priori valence
Across two types of scenes
Standardized scenes
Personalized scenes
Pleasant M
(SD)
Neutral M
(SD)
Fear M
(SD)
Pleasant M
(SD)
Neutral M
(SD)
Fear M
(SD)
Pleasant M
(SD)
Neutral M
(SD)
Fear M
(SD) Soc. ph. n=23
7.64
(1.21)
2.67
(1.20)
7.97
(0.97)
7.65
(1.22)
2.87
(1.70)
7.70
(1.47)
7.63
(1.59)
2.48
(1.27)
8.24
(0.84) Controls
n=20
7.24
(1.79)
2.34
(0.77)
7.60
(0.90)
7.20
(2.00)
2.15
(0.83)
6.98
(1.36)
7.28
(1.77)
2.53
(1.32)
8.23
(0.77)
SAM arous-al1
Total
N=43
7.45
(1.50)
2.52
(1.03)
7.80
(0.95)
7.44
(1.63)
2.53
(1.40)
7.36
(1.45)
7.47
(1.67)
2.50
(1.28)
8.23
(0.80)
df F p Group (between) Valence (within) Type (within) Gender (covariate) Valence*group (within) Valence*type*group (within)
1, 40 2, 80 1, 40 1, 40 2, 80 2, 80
2.13 37.86
0.01 0.02 0.00 0.54
n.s. <0.01
n.s. n.s. n.s. n.s.
Single comparisons valence*group df t p Pleasant Neutral Fear
41 37.77
41
-0.88 -1.11 -1.28
n.s. n.s. n.s.
Single comparisons valence*type*group df t p Standardized: Pleasant Neutral Fear Personalized: Pleasant Neutral Fear
41 32.03
41 41 41 41
-0.91 -1.80 -1.66 -0.69 0.12
-0.06
n.s. <0.10 =0.10
n.s. n.s. n.s.
Single comparisons valence df t p*
Pleasant-neutral Pleasant-fear Neutral-fear
42 42 42
19.78 -1.60
-24.47
<0.01 n.s.
<0.01
Note: 1Scale from 1 to ( 1 = “low arousal”, 9 = “high arousal”), *after Bonferoni-correction.
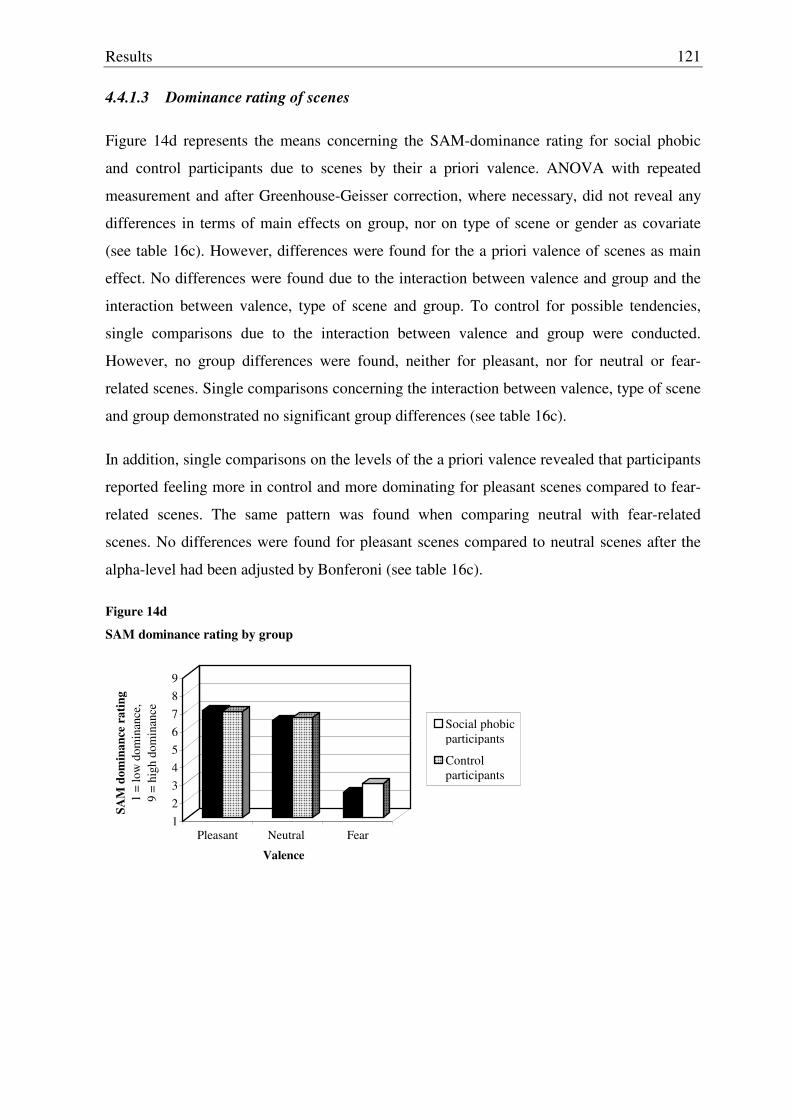
Results
121
4.4.1.3 Dominance rating of scenes
Figure 14d represents the means concerning the SAM-dominance rating for social phobic
and control participants due to scenes by their a priori valence. ANOVA with repeated
measurement and after Greenhouse-Geisser correction, where necessary, did not reveal any
differences in terms of main effects on group, nor on type of scene or gender as covariate
(see table 16c). However, differences were found for the a priori valence of scenes as main
effect. No differences were found due to the interaction between valence and group and the
interaction between valence, type of scene and group. To control for possible tendencies,
single comparisons due to the interaction between valence and group were conducted.
However, no group differences were found, neither for pleasant, nor for neutral or fear-
related scenes. Single comparisons concerning the interaction between valence, type of scene
and group demonstrated no significant group differences (see table 16c).
In addition, single comparisons on the levels of the a priori valence revealed that participants
reported feeling more in control and more dominating for pleasant scenes compared to fear-
related scenes. The same pattern was found when comparing neutral with fear-related
scenes. No differences were found for pleasant scenes compared to neutral scenes after the
alpha-level had been adjusted by Bonferoni (see table 16c).
Figure 14d
SAM dominance rating by group
123456789
SAM
dom
inan
ce r
atin
g1
= lo
w d
omin
ance
,9
= hi
gh d
omin
ance
Pleasant Neutral Fear
Valence
Social phobicparticipants
Control participants
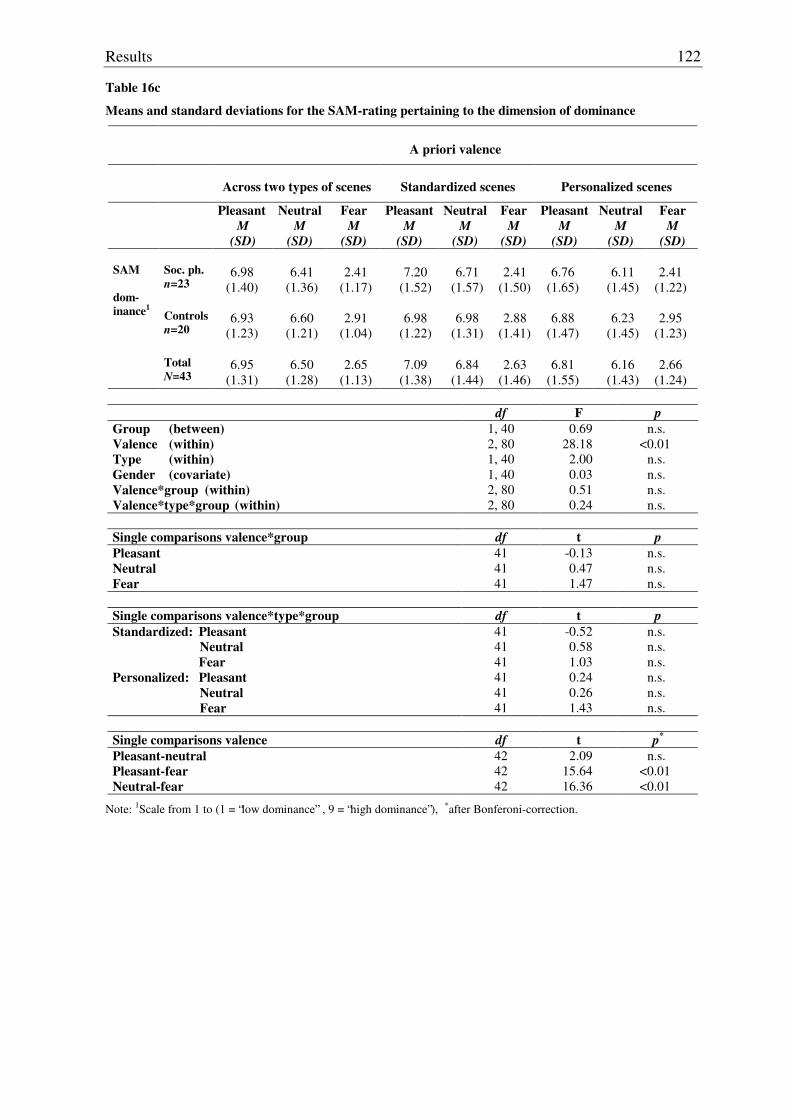
Results
122
Table 16c
Means and standard deviations for the SAM-rating pertaining to the dimension of dominance
A priori valence
Across two types of scenes
Standardized scenes
Personalized scenes
Pleasant M
(SD)
Neutral M
(SD)
Fear M
(SD)
Pleasant M
(SD)
Neutral M
(SD)
Fear M
(SD)
Pleasant M
(SD)
Neutral M
(SD)
Fear M
(SD) Soc. ph. n=23
6.98
(1.40)
6.41
(1.36)
2.41
(1.17)
7.20
(1.52)
6.71
(1.57)
2.41
(1.50)
6.76
(1.65)
6.11
(1.45)
2.41
(1.22) Controls
n=20
6.93
(1.23)
6.60
(1.21)
2.91
(1.04)
6.98
(1.22)
6.98
(1.31)
2.88
(1.41)
6.88
(1.47)
6.23
(1.45)
2.95
(1.23)
SAM dom- inance1
Total
N=43
6.95
(1.31)
6.50
(1.28)
2.65
(1.13)
7.09
(1.38)
6.84
(1.44)
2.63
(1.46)
6.81
(1.55)
6.16
(1.43)
2.66
(1.24)
df F p Group (between) Valence (within) Type (within) Gender (covariate) Valence*group (within) Valence*type*group (within)
1, 40 2, 80 1, 40 1, 40 2, 80 2, 80
0.69 28.18
2.00 0.03 0.51 0.24
n.s. <0.01
n.s. n.s. n.s. n.s.
Single comparisons valence*group df t p Pleasant Neutral Fear
41 41 41
-0.13 0.47 1.47
n.s. n.s. n.s.
Single comparisons valence*type*group df t p Standardized: Pleasant Neutral Fear Personalized: Pleasant Neutral Fear
41 41 41 41 41 41
-0.52 0.58 1.03 0.24 0.26 1.43
n.s. n.s. n.s. n.s. n.s. n.s.
Single comparisons valence df t p*
Pleasant-neutral Pleasant-fear Neutral-fear
42 42 42
2.09 15.64 16.36
n.s. <0.01 <0.01
Note: 1Scale from 1 to (1 = “low dominance” , 9 = “high dominance”), *after Bonferoni-correction.
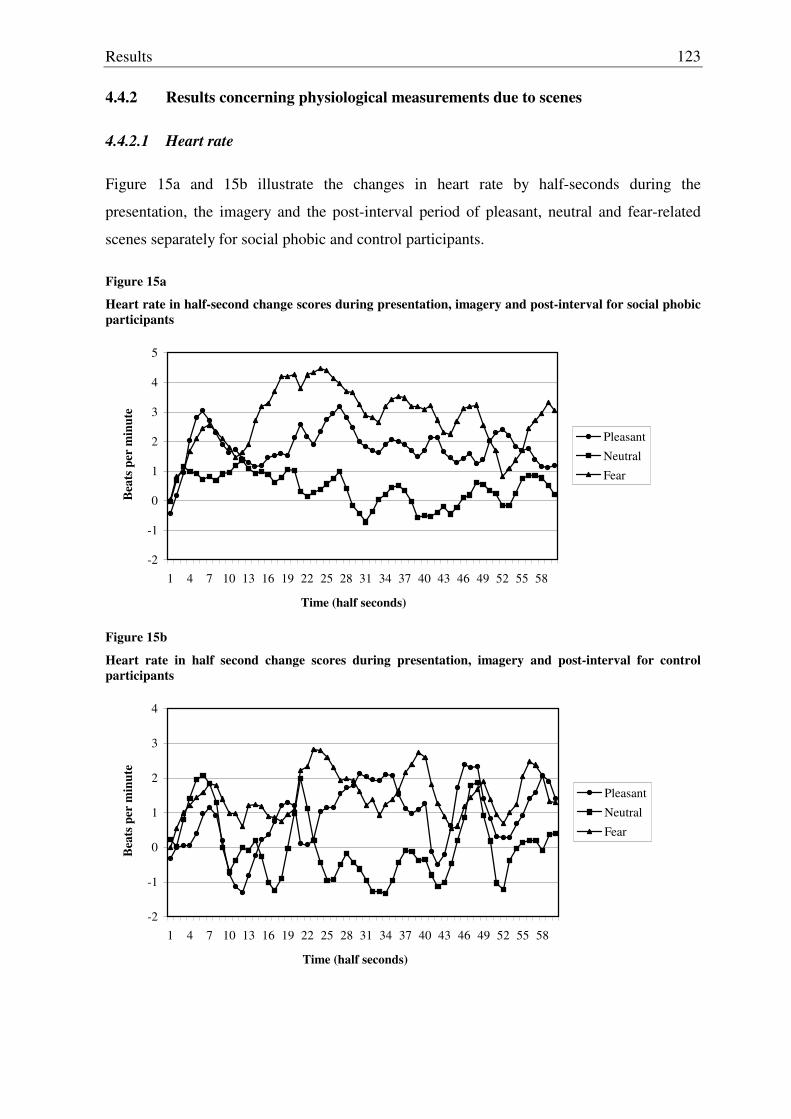
Results
123
4.4.2 Results concerning physiological measurements due to scenes
4.4.2.1 Heart rate
Figure 15a and 15b illustrate the changes in heart rate by half-seconds during the
presentation, the imagery and the post-interval period of pleasant, neutral and fear-related
scenes separately for social phobic and control participants.
Figure 15a
Heart rate in half-second change scores during presentation, imagery and post-interval for social phobic participants
-2
-1
0
1
2
3
4
5
1 4 7 10 13 16 19 22 25 28 31 34 37 40 43 46 49 52 55 58
Time (half seconds)
Bea
ts p
er m
inut
e
Pleasant
Neutral
Fear
Figure 15b
Heart rate in half second change scores during presentation, imagery and post-interval for control participants
-2
-1
0
1
2
3
4
1 4 7 10 13 16 19 22 25 28 31 34 37 40 43 46 49 52 55 58
Time (half seconds)
Bea
ts p
er m
inut
e
Pleasant
Neutral
Fear
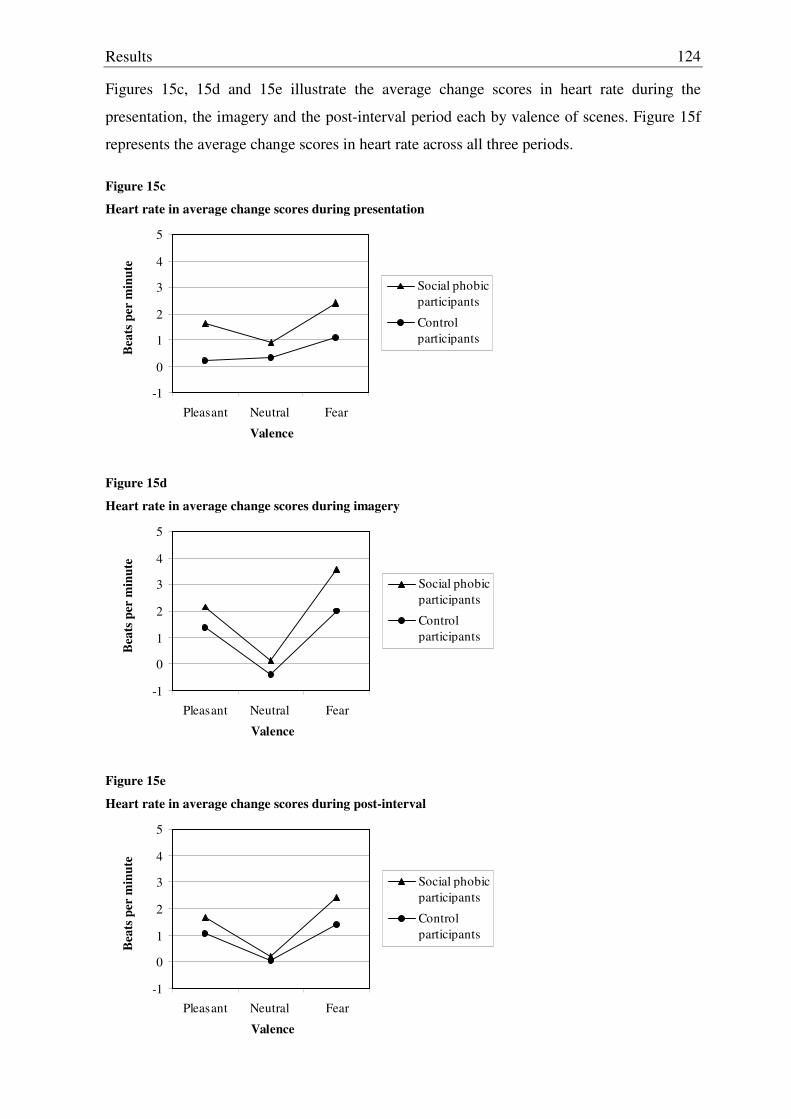
Results
124
Figures 15c, 15d and 15e illustrate the average change scores in heart rate during the
presentation, the imagery and the post-interval period each by valence of scenes. Figure 15f
represents the average change scores in heart rate across all three periods.
Figure 15c
Heart rate in average change scores during presentation
-1
0
1
2
3
4
5
Pleasant Neutral Fear
Valence
Bea
ts p
er m
inut
e
Social phobicparticipants
Control participants
Figure 15d
Heart rate in average change scores during imagery
-1
0
1
2
3
4
5
Pleasant Neutral Fear
Valence
Bea
ts p
er m
inut
e
Social phobicparticipants
Control participants
Figure 15e
Heart rate in average change scores during post-interval
-1
0
1
2
3
4
5
Pleasant Neutral Fear
Valence
Bea
ts p
er m
inut
e
Social phobicparticipants
Control participants
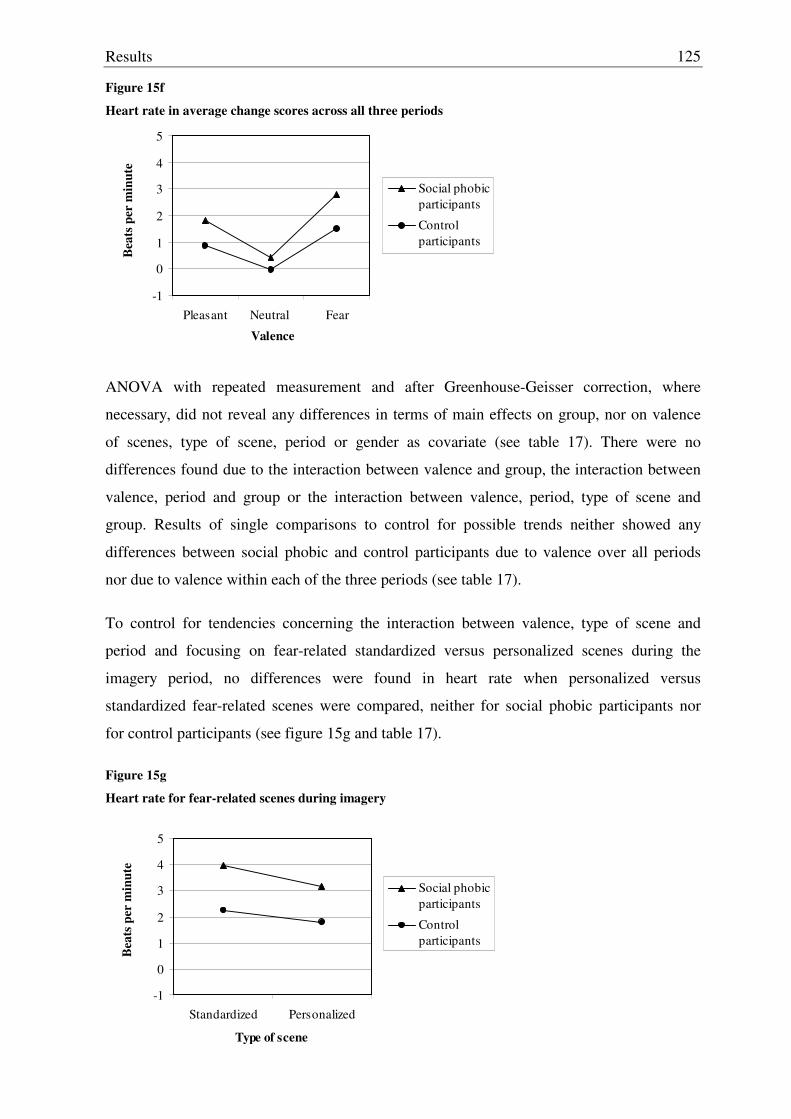
Results
125
Figure 15f
Heart rate in average change scores across all three periods
-1
0
1
2
3
4
5
Pleasant Neutral Fear
Valence
Bea
ts p
er m
inut
e
Social phobicparticipants
Control participants
ANOVA with repeated measurement and after Greenhouse-Geisser correction, where
necessary, did not reveal any differences in terms of main effects on group, nor on valence
of scenes, type of scene, period or gender as covariate (see table 17). There were no
differences found due to the interaction between valence and group, the interaction between
valence, period and group or the interaction between valence, period, type of scene and
group. Results of single comparisons to control for possible trends neither showed any
differences between social phobic and control participants due to valence over all periods
nor due to valence within each of the three periods (see table 17).
To control for tendencies concerning the interaction between valence, type of scene and
period and focusing on fear-related standardized versus personalized scenes during the
imagery period, no differences were found in heart rate when personalized versus
standardized fear-related scenes were compared, neither for social phobic participants nor
for control participants (see figure 15g and table 17).
Figure 15g
Heart rate for fear-related scenes during imagery
-1
0
1
2
3
4
5
Standardized Personalized
Type of scene
Bea
ts p
er m
inut
e
Social phobicparticipants
Control participants
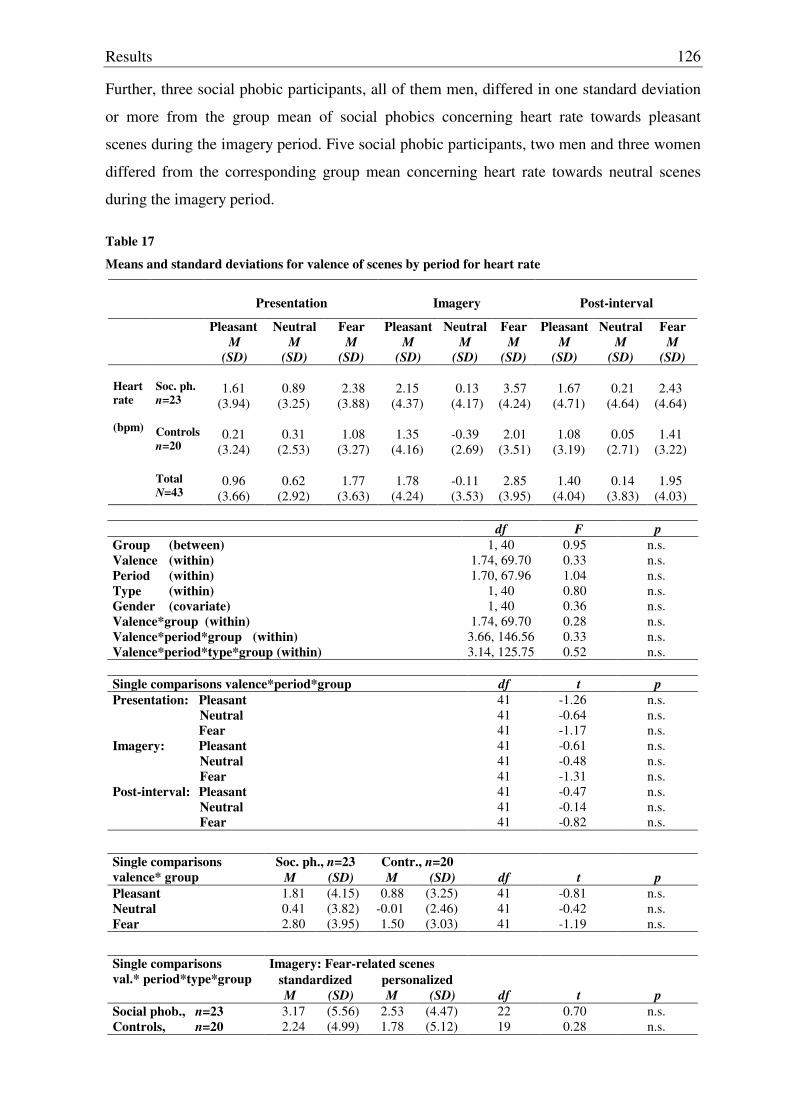
Results
126
Further, three social phobic participants, all of them men, differed in one standard deviation
or more from the group mean of social phobics concerning heart rate towards pleasant
scenes during the imagery period. Five social phobic participants, two men and three women
differed from the corresponding group mean concerning heart rate towards neutral scenes
during the imagery period.
Table 17
Means and standard deviations for valence of scenes by period for heart rate
Presentation
Imagery
Post-interval
Pleasant M
(SD)
Neutral M
(SD)
Fear M
(SD)
Pleasant M
(SD)
Neutral M
(SD)
Fear M
(SD)
Pleasant M
(SD)
Neutral M
(SD)
Fear M
(SD) Soc. ph. n=23
1.61
(3.94)
0.89
(3.25)
2.38
(3.88)
2.15
(4.37)
0.13
(4.17)
3.57
(4.24)
1.67
(4.71)
0.21
(4.64)
2.43
(4.64) Controls
n=20
0.21
(3.24)
0.31
(2.53)
1.08
(3.27)
1.35
(4.16)
-0.39 (2.69)
2.01
(3.51)
1.08
(3.19)
0.05
(2.71)
1.41
(3.22)
Heart rate (bpm)
Total
N=43
0.96
(3.66)
0.62
(2.92)
1.77
(3.63)
1.78
(4.24)
-0.11 (3.53)
2.85
(3.95)
1.40
(4.04)
0.14
(3.83)
1.95
(4.03)
df F p Group (between) Valence (within) Period (within) Type (within) Gender (covariate) Valence*group (within) Valence*period*group (within) Valence*period*type*group (within)
1, 40 1.74, 69.70 1.70, 67.96
1, 40 1, 40
1.74, 69.70 3.66, 146.56 3.14, 125.75
0.95 0.33 1.04 0.80 0.36 0.28 0.33 0.52
n.s. n.s. n.s. n.s. n.s. n.s. n.s. n.s.
Single comparisons valence*period*group df t p Presentation: Pleasant Neutral Fear Imagery: Pleasant Neutral Fear Post-interval: Pleasant Neutral Fear
41 41 41 41 41 41 41 41 41
-1.26 -0.64 -1.17 -0.61 -0.48 -1.31 -0.47 -0.14 -0.82
n.s. n.s. n.s. n.s. n.s. n.s. n.s. n.s. n.s.
Soc. ph., n=23 Contr., n=20 Single comparisons valence* group M (SD) M (SD) df t p Pleasant 1.81 (4.15) 0.88 (3.25) 41 -0.81 n.s. Neutral 0.41 (3.82) -0.01 (2.46) 41 -0.42 n.s. Fear 2.80 (3.95) 1.50 (3.03) 41 -1.19 n.s.
Imagery: Fear-related scenes standardized personalized
Single comparisons val.* period*type*group
M (SD) M (SD) df t p Social phob., n=23 3.17 (5.56) 2.53 (4.47) 22 0.70 n.s. Controls, n=20 2.24 (4.99) 1.78 (5.12) 19 0.28 n.s.
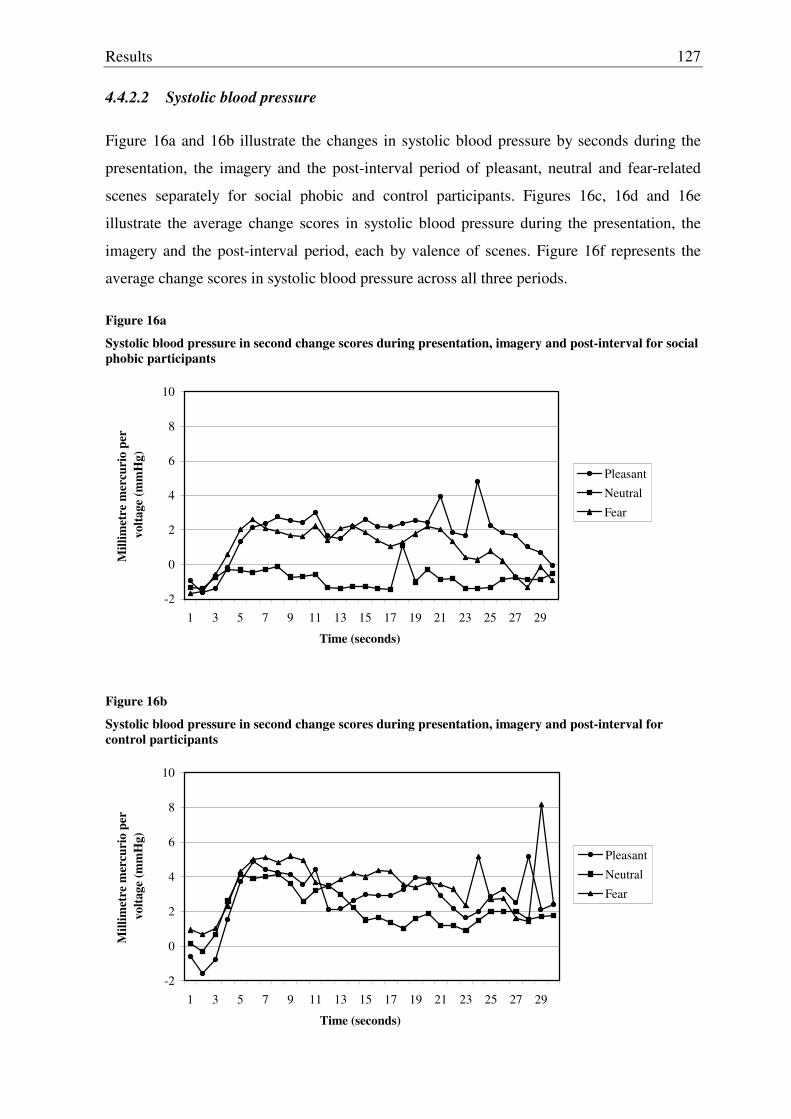
Results
127
4.4.2.2 Systolic blood pressure
Figure 16a and 16b illustrate the changes in systolic blood pressure by seconds during the
presentation, the imagery and the post-interval period of pleasant, neutral and fear-related
scenes separately for social phobic and control participants. Figures 16c, 16d and 16e
illustrate the average change scores in systolic blood pressure during the presentation, the
imagery and the post-interval period, each by valence of scenes. Figure 16f represents the
average change scores in systolic blood pressure across all three periods.
Figure 16a
Systolic blood pressure in second change scores during presentation, imagery and post-interval for social phobic participants
-2
0
2
4
6
8
10
1 3 5 7 9 11 13 15 17 19 21 23 25 27 29
Time (seconds)
Mill
imet
re m
ercu
rio
per
vol
tage
(mm
Hg)
Pleasant
Neutral
Fear
Figure 16b
Systolic blood pressure in second change scores during presentation, imagery and post-interval for control participants
-2
0
2
4
6
8
10
1 3 5 7 9 11 13 15 17 19 21 23 25 27 29
Time (seconds)
Mill
imet
re m
ercu
rio
per
vol
tage
(mm
Hg)
Pleasant
Neutral
Fear
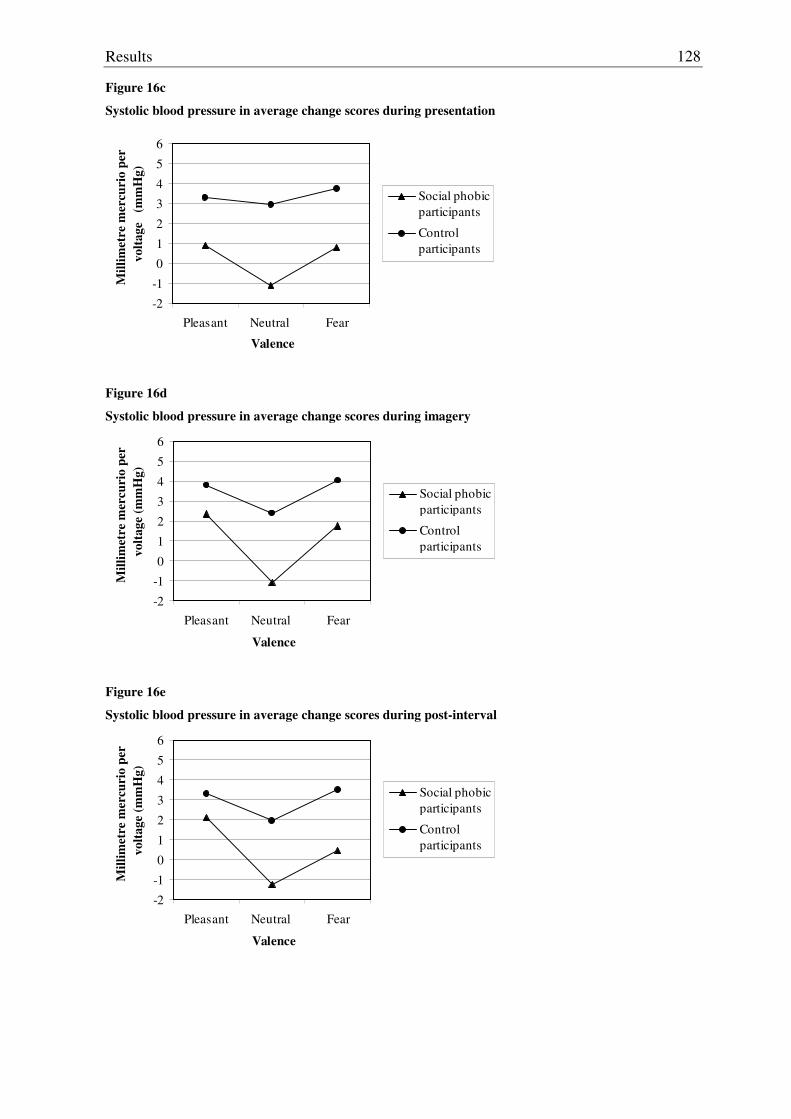
Results
128
Figure 16c
Systolic blood pressure in average change scores during presentation
-2
-1
0
1
2
3
4
5
6
Pleasant Neutral Fear
Valence
Mill
imet
re m
ercu
rio
per
vol
tage
(m
mH
g)
Social phobicparticipants
Control participants
Figure 16d
Systolic blood pressure in average change scores during imagery
-2
-1
0
1
2
3
4
5
6
Pleasant Neutral Fear
Valence
Mill
imet
re m
ercu
rio
per
vol
tage
(mm
Hg)
Social phobicparticipants
Control participants
Figure 16e
Systolic blood pressure in average change scores during post-interval
-2
-1
0
1
2
3
4
5
6
Pleasant Neutral Fear
Valence
Mill
imet
re m
ercu
rio
per
vol
tage
(mm
Hg)
Social phobicparticipants
Control participants
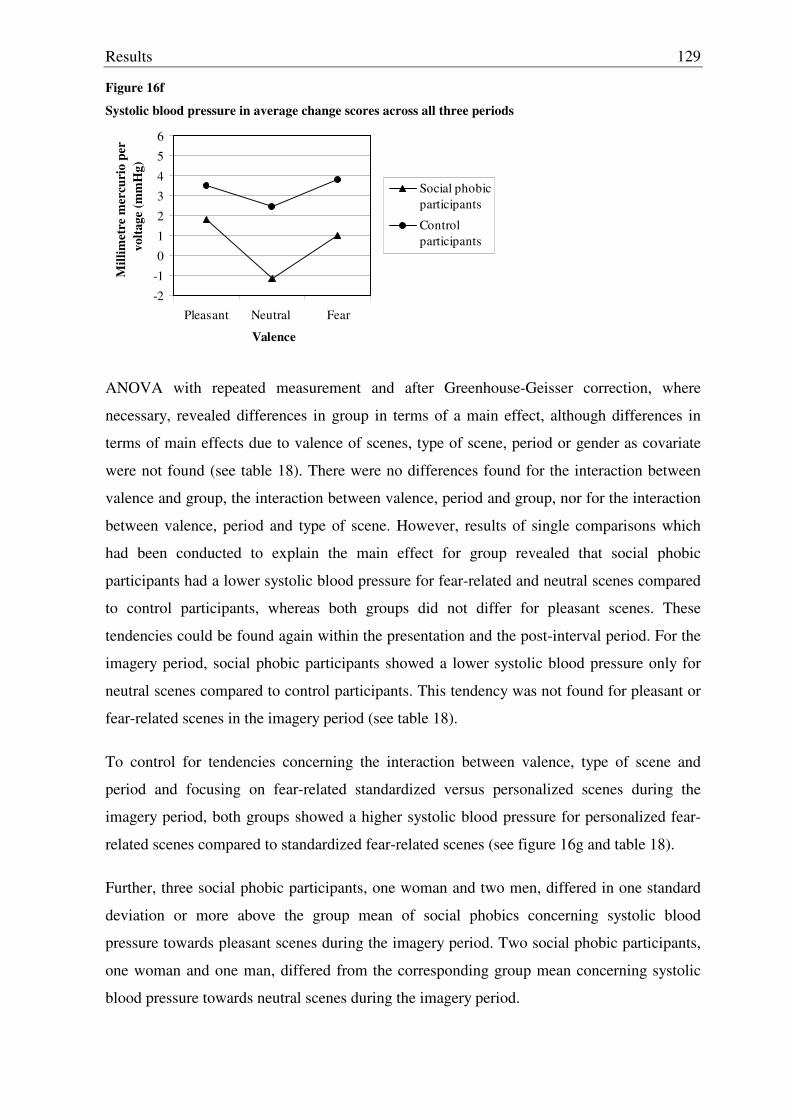
Results
129
Figure 16f
Systolic blood pressure in average change scores across all three periods
-2
-1
0
1
2
3
4
5
6
Pleasant Neutral Fear
Valence
Mill
imet
re m
ercu
rio
per
vol
tage
(mm
Hg)
Social phobicparticipants
Control participants
ANOVA with repeated measurement and after Greenhouse-Geisser correction, where
necessary, revealed differences in group in terms of a main effect, although differences in
terms of main effects due to valence of scenes, type of scene, period or gender as covariate
were not found (see table 18). There were no differences found for the interaction between
valence and group, the interaction between valence, period and group, nor for the interaction
between valence, period and type of scene. However, results of single comparisons which
had been conducted to explain the main effect for group revealed that social phobic
participants had a lower systolic blood pressure for fear-related and neutral scenes compared
to control participants, whereas both groups did not differ for pleasant scenes. These
tendencies could be found again within the presentation and the post-interval period. For the
imagery period, social phobic participants showed a lower systolic blood pressure only for
neutral scenes compared to control participants. This tendency was not found for pleasant or
fear-related scenes in the imagery period (see table 18).
To control for tendencies concerning the interaction between valence, type of scene and
period and focusing on fear-related standardized versus personalized scenes during the
imagery period, both groups showed a higher systolic blood pressure for personalized fear-
related scenes compared to standardized fear-related scenes (see figure 16g and table 18).
Further, three social phobic participants, one woman and two men, differed in one standard
deviation or more above the group mean of social phobics concerning systolic blood
pressure towards pleasant scenes during the imagery period. Two social phobic participants,
one woman and one man, differed from the corresponding group mean concerning systolic
blood pressure towards neutral scenes during the imagery period.

Results
130
Table 18
Means and standard deviations for valence of scenes by period for systolic blood pressure
Presentation
Imagery
Post-interval
Pleasant M
(SD)
Neutral M
(SD)
Fear M
(SD)
Pleasant M
(SD)
Neutral M
(SD)
Fear M
(SD)
Pleasant M
(SD)
Neutral M
(SD)
Fear M
(SD) Soc. ph. n=22
0.92
(5.50)
-1.10 (4.14)
0.82
(5.03)
2.34
(5.14)
-1.09 (3.91)
1.76 (4.54)
2.08
(5.44)
-1.24 (3.79)
0.43
(5.04) Controls
n=20
3.31
(4.99)
2.94
(4.71)
3.76
(5.93)
3.80
(5.39)
2.39
(4.55)
4.05 (4.65)
3.32
(4.54)
1.95
(4.48)
3.52
(5.26)
Syst. blood press. (mmHg)
Total
N=42
2.06
(5.34)
0.82
(4.82)
2.22
(5.61)
3.04
(5.24)
0.57
(4.53)
2.85 (4.68)
2.67
(5.01)
0.28
(4.39)
1.90
(5.32)
df F p Group (between) Valence (within) Period (within) Type (within) Gender (covariate) Valence*group (within) Valence*period*group (within) Valence*period*type*group (within)
1, 39 2, 78
1.56, 60.83 1, 39 1, 39 2, 78
3.35, 130.70 3.07, 119.88
5.68 0.26 0.55 0.11 0.11 0.92 0.34 1.62
<0.05 n.s. n.s. n.s. n.s. n.s. n.s. n.s.
Single comparisons valence*period*group df t p Presentation: Pleasant Neutral Fear Imagery: Pleasant Neutral Fear Post-interval: Pleasant Neutral Fear
40 40 40 40 40 40 40 40 40
1.47 2.96 1.74 0.90 2.66 1.62 0.80 2.50 1.94
n.s. <0.01 <0.10
n.s. <0.05
n.s. n.s.
<0.05 <0.10
Soc. ph., n=22 Contr., n=20 Single comparisons valence* group M (SD) M (SD) df t p Pleasant 1.78 (4.92) 3.48 (4.52) 40 1.16 n.s. Neutral -1.14 (3.59) 2.43 (4.28) 40 2.94 <0.05 Fear 1.00 (4.59) 3.78 (4.81) 40 1.92 <0.10
Imagery: Fear-related scenes standardized personalized
Single comparisons val.* period*type*group
M (SD) M (SD) df t p Social phob., n=22 0.51 (5.47) 3.01 (5.45) 21 -1.93 <0.10 Controls, n=20 3.05 (6.66) 5.05 (6.61) 19 -0.95 n.s.
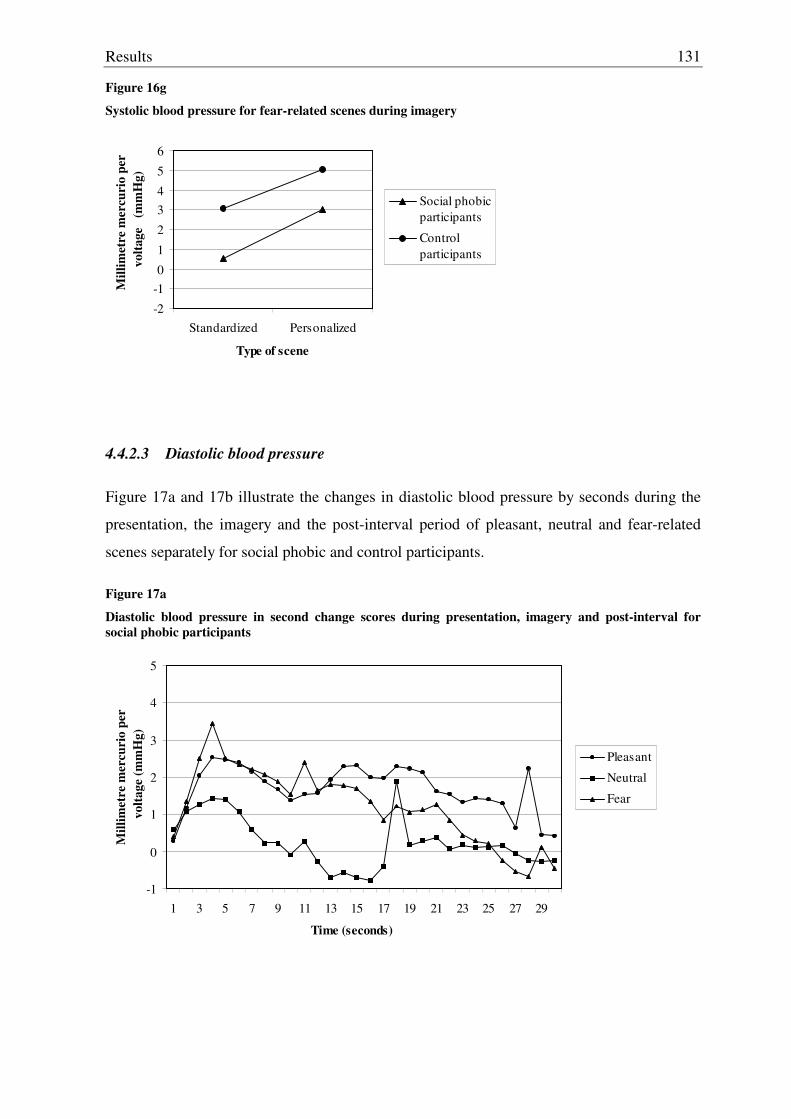
Results
131
Figure 16g
Systolic blood pressure for fear-related scenes during imagery
-2
-10
1
2
34
5
6
Standardized Personalized
Type of scene
Mill
imet
re m
ercu
rio
per
vol
tage
(m
mH
g)
Social phobicparticipants
Control participants
4.4.2.3 Diastolic blood pressure
Figure 17a and 17b illustrate the changes in diastolic blood pressure by seconds during the
presentation, the imagery and the post-interval period of pleasant, neutral and fear-related
scenes separately for social phobic and control participants.
Figure 17a
Diastolic blood pressure in second change scores during presentation, imagery and post-interval for social phobic participants
-1
0
1
2
3
4
5
1 3 5 7 9 11 13 15 17 19 21 23 25 27 29
Time (seconds)
Mill
imet
re m
ercu
rio
per
vol
tage
(mm
Hg)
Pleasant
Neutral
Fear
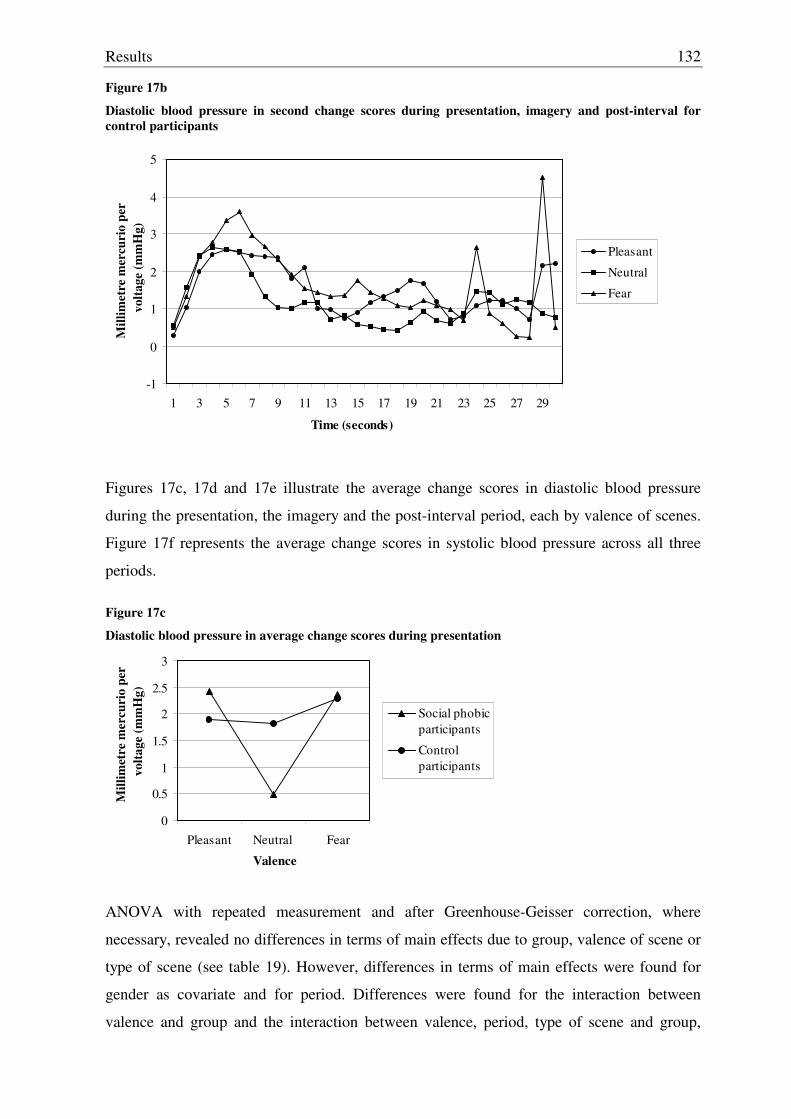
Results
132
Figure 17b
Diastolic blood pressure in second change scores during presentation, imagery and post-interval for control participants
-1
0
1
2
3
4
5
1 3 5 7 9 11 13 15 17 19 21 23 25 27 29
Time (seconds)
Mill
imet
re m
ercu
rio
per
vol
tage
(mm
Hg)
Pleasant
Neutral
Fear
Figures 17c, 17d and 17e illustrate the average change scores in diastolic blood pressure
during the presentation, the imagery and the post-interval period, each by valence of scenes.
Figure 17f represents the average change scores in systolic blood pressure across all three
periods.
Figure 17c
Diastolic blood pressure in average change scores during presentation
0
0.5
1
1.5
2
2.5
3
Pleasant Neutral Fear
Valence
Mill
imet
re m
ercu
rio
per
vol
tage
(mm
Hg)
Social phobicparticipants
Control participants
ANOVA with repeated measurement and after Greenhouse-Geisser correction, where
necessary, revealed no differences in terms of main effects due to group, valence of scene or
type of scene (see table 19). However, differences in terms of main effects were found for
gender as covariate and for period. Differences were found for the interaction between
valence and group and the interaction between valence, period, type of scene and group,
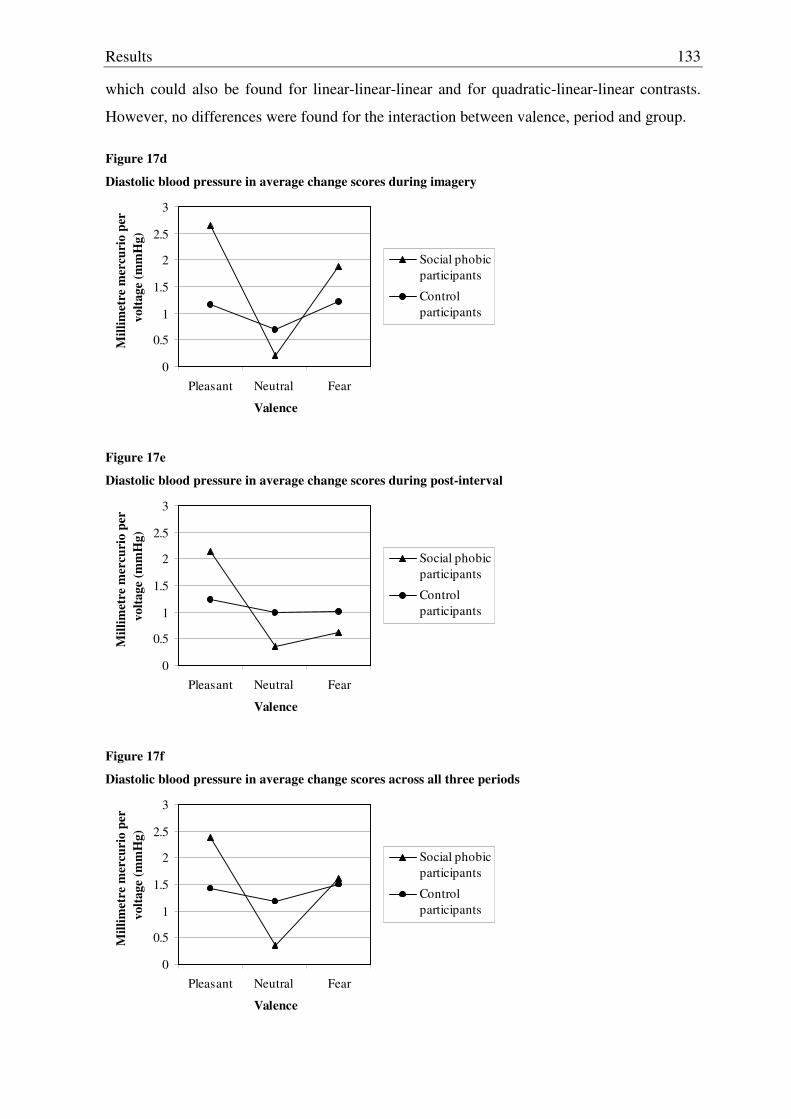
Results
133
which could also be found for linear-linear-linear and for quadratic-linear-linear contrasts.
However, no differences were found for the interaction between valence, period and group.
Figure 17d
Diastolic blood pressure in average change scores during imagery
0
0.5
1
1.5
2
2.5
3
Pleasant Neutral Fear
Valence
Mill
imet
re m
ercu
rio
per
vol
tage
(mm
Hg)
Social phobicparticipants
Control participants
Figure 17e
Diastolic blood pressure in average change scores during post-interval
0
0.5
1
1.5
2
2.5
3
Pleasant Neutral Fear
Valence
Mill
imet
re m
ercu
rio
per
vol
tage
(mm
Hg)
Social phobicparticipants
Control participants
Figure 17f
Diastolic blood pressure in average change scores across all three periods
0
0.5
1
1.5
2
2.5
3
Pleasant Neutral Fear
Valence
Mill
imet
re m
ercu
rio
per
vol
tage
(mm
Hg)
Social phobicparticipants
Control participants
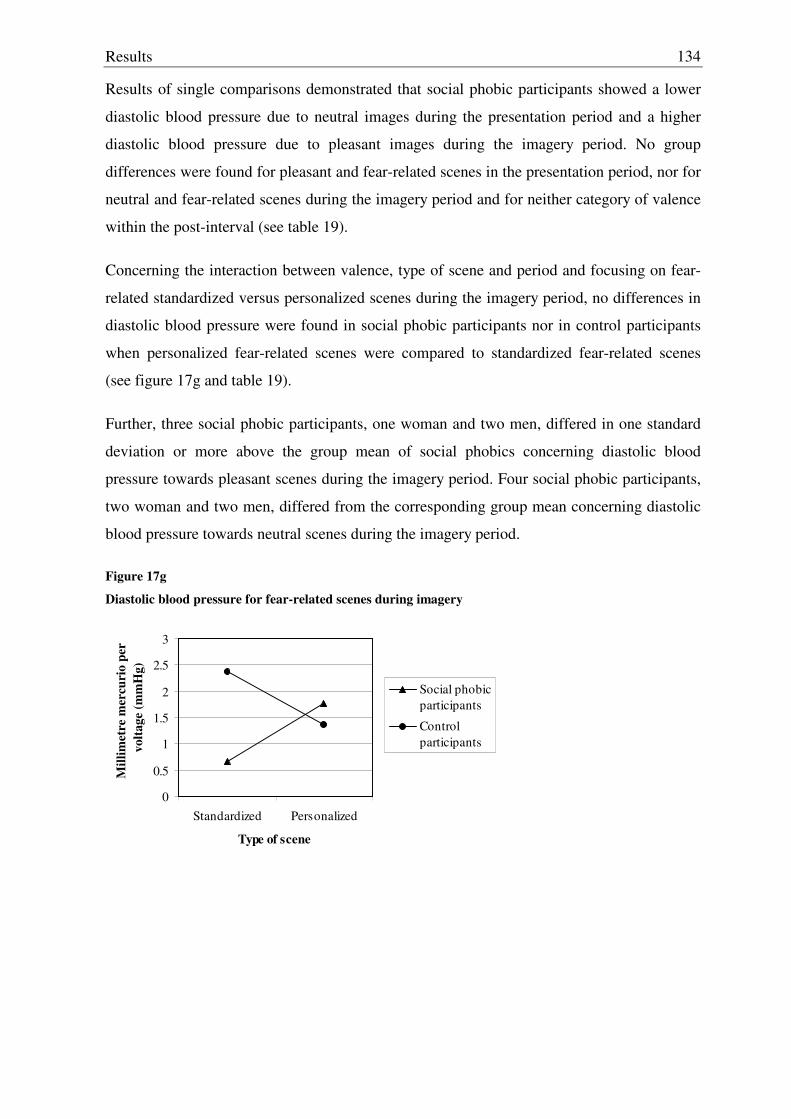
Results
134
Results of single comparisons demonstrated that social phobic participants showed a lower
diastolic blood pressure due to neutral images during the presentation period and a higher
diastolic blood pressure due to pleasant images during the imagery period. No group
differences were found for pleasant and fear-related scenes in the presentation period, nor for
neutral and fear-related scenes during the imagery period and for neither category of valence
within the post-interval (see table 19).
Concerning the interaction between valence, type of scene and period and focusing on fear-
related standardized versus personalized scenes during the imagery period, no differences in
diastolic blood pressure were found in social phobic participants nor in control participants
when personalized fear-related scenes were compared to standardized fear-related scenes
(see figure 17g and table 19).
Further, three social phobic participants, one woman and two men, differed in one standard
deviation or more above the group mean of social phobics concerning diastolic blood
pressure towards pleasant scenes during the imagery period. Four social phobic participants,
two woman and two men, differed from the corresponding group mean concerning diastolic
blood pressure towards neutral scenes during the imagery period.
Figure 17g
Diastolic blood pressure for fear-related scenes during imagery
0
0.5
1
1.5
2
2.5
3
Standardized Personalized
Type of scene
Mill
imet
re m
ercu
rio
per
vol
tage
(mm
Hg)
Social phobicparticipants
Control participants
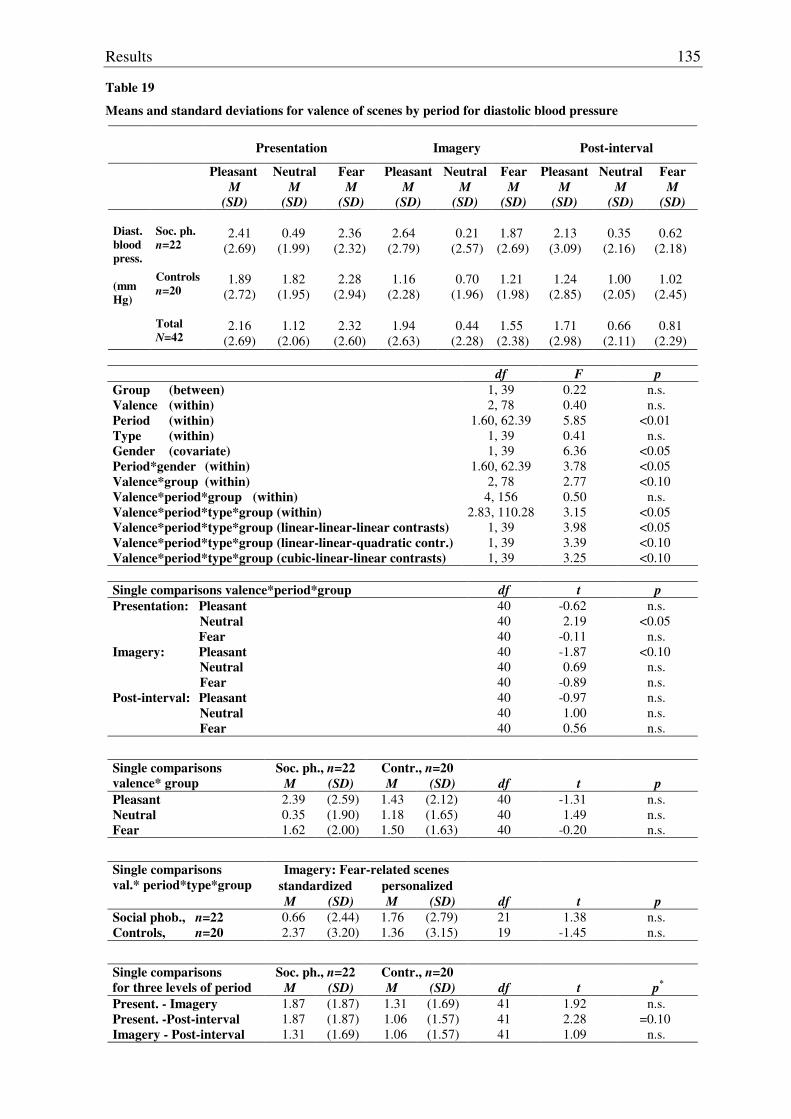
Results
135
Table 19
Means and standard deviations for valence of scenes by period for diastolic blood pressure
Presentation
Imagery
Post-interval
Pleasant M
(SD)
Neutral M
(SD)
Fear M
(SD)
Pleasant M
(SD)
Neutral M
(SD)
Fear M
(SD)
Pleasant M
(SD)
Neutral M
(SD)
Fear M
(SD) Soc. ph. n=22
2.41
(2.69)
0.49
(1.99)
2.36
(2.32)
2.64
(2.79)
0.21
(2.57)
1.87 (2.69)
2.13
(3.09)
0.35
(2.16)
0.62
(2.18) Controls
n=20
1.89
(2.72)
1.82
(1.95)
2.28
(2.94)
1.16
(2.28)
0.70
(1.96)
1.21 (1.98)
1.24
(2.85)
1.00
(2.05)
1.02
(2.45)
Diast. blood press. (mmHg)
Total
N=42
2.16
(2.69)
1.12
(2.06)
2.32
(2.60)
1.94
(2.63)
0.44
(2.28)
1.55 (2.38)
1.71
(2.98)
0.66
(2.11)
0.81
(2.29)
df F p Group (between) Valence (within) Period (within) Type (within) Gender (covariate) Period*gender (within) Valence*group (within) Valence*period*group (within) Valence*period*type*group (within) Valence*period*type*group (linear-linear-linear contrasts) Valence*period*type*group (linear-linear-quadratic contr.) Valence*period*type*group (cubic-linear-linear contrasts)
1, 39 2, 78
1.60, 62.39 1, 39 1, 39
1.60, 62.39 2, 78
4, 156 2.83, 110.28
1, 39 1, 39 1, 39
0.22 0.40 5.85 0.41 6.36 3.78 2.77 0.50 3.15 3.98 3.39 3.25
n.s. n.s.
<0.01 n.s.
<0.05 <0.05 <0.10
n.s. <0.05 <0.05 <0.10 <0.10
Single comparisons valence*period*group df t p Presentation: Pleasant Neutral Fear Imagery: Pleasant Neutral Fear Post-interval: Pleasant Neutral Fear
40 40 40 40 40 40 40 40 40
-0.62 2.19
-0.11 -1.87 0.69
-0.89 -0.97 1.00 0.56
n.s. <0.05
n.s. <0.10
n.s. n.s. n.s. n.s. n.s.
Soc. ph., n=22 Contr., n=20 Single comparisons valence* group M (SD) M (SD) df t p Pleasant 2.39 (2.59) 1.43 (2.12) 40 -1.31 n.s. Neutral 0.35 (1.90) 1.18 (1.65) 40 1.49 n.s. Fear 1.62 (2.00) 1.50 (1.63) 40 -0.20 n.s.
Imagery: Fear-related scenes standardized personalized
Single comparisons val.* period*type*group
M (SD) M (SD) df t p Social phob., n=22 0.66 (2.44) 1.76 (2.79) 21 1.38 n.s. Controls, n=20 2.37 (3.20) 1.36 (3.15) 19 -1.45 n.s.
Soc. ph., n=22 Contr., n=20 Single comparisons for three levels of period M (SD) M (SD) df t p*
Present. - Imagery 1.87 (1.87) 1.31 (1.69) 41 1.92 n.s. Present. -Post-interval 1.87 (1.87) 1.06 (1.57) 41 2.28 =0.10 Imagery - Post-interval 1.31 (1.69) 1.06 (1.57) 41 1.09 n.s.
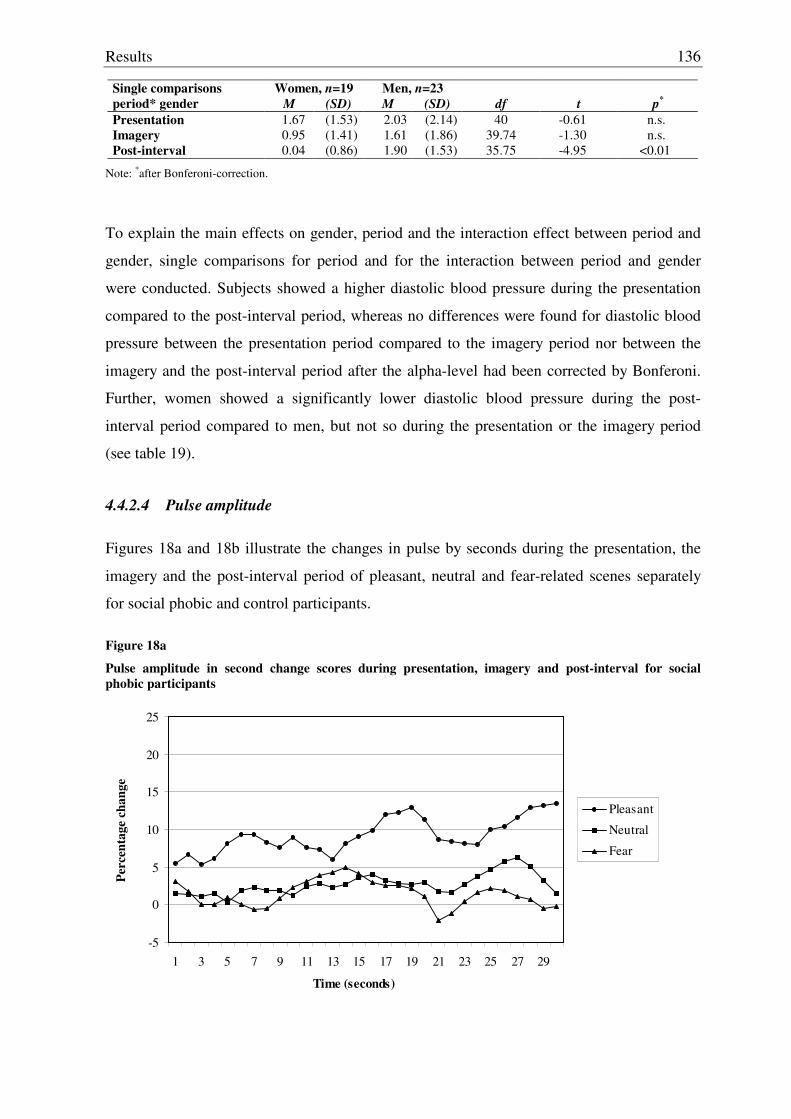
Results
136
Women, n=19 Men, n=23 Single comparisons period* gender M (SD) M (SD) df t p*
Presentation 1.67 (1.53) 2.03 (2.14) 40 -0.61 n.s. Imagery 0.95 (1.41) 1.61 (1.86) 39.74 -1.30 n.s. Post-interval 0.04 (0.86) 1.90 (1.53) 35.75 -4.95 <0.01
Note: *after Bonferoni-correction.
To explain the main effects on gender, period and the interaction effect between period and
gender, single comparisons for period and for the interaction between period and gender
were conducted. Subjects showed a higher diastolic blood pressure during the presentation
compared to the post-interval period, whereas no differences were found for diastolic blood
pressure between the presentation period compared to the imagery period nor between the
imagery and the post-interval period after the alpha-level had been corrected by Bonferoni.
Further, women showed a significantly lower diastolic blood pressure during the post-
interval period compared to men, but not so during the presentation or the imagery period
(see table 19).
4.4.2.4 Pulse amplitude
Figures 18a and 18b illustrate the changes in pulse by seconds during the presentation, the
imagery and the post-interval period of pleasant, neutral and fear-related scenes separately
for social phobic and control participants.
Figure 18a
Pulse amplitude in second change scores during presentation, imagery and post-interval for social phobic participants
-5
0
5
10
15
20
25
1 3 5 7 9 11 13 15 17 19 21 23 25 27 29
Time (seconds)
Perc
enta
ge c
hang
e
Pleasant
Neutral
Fear
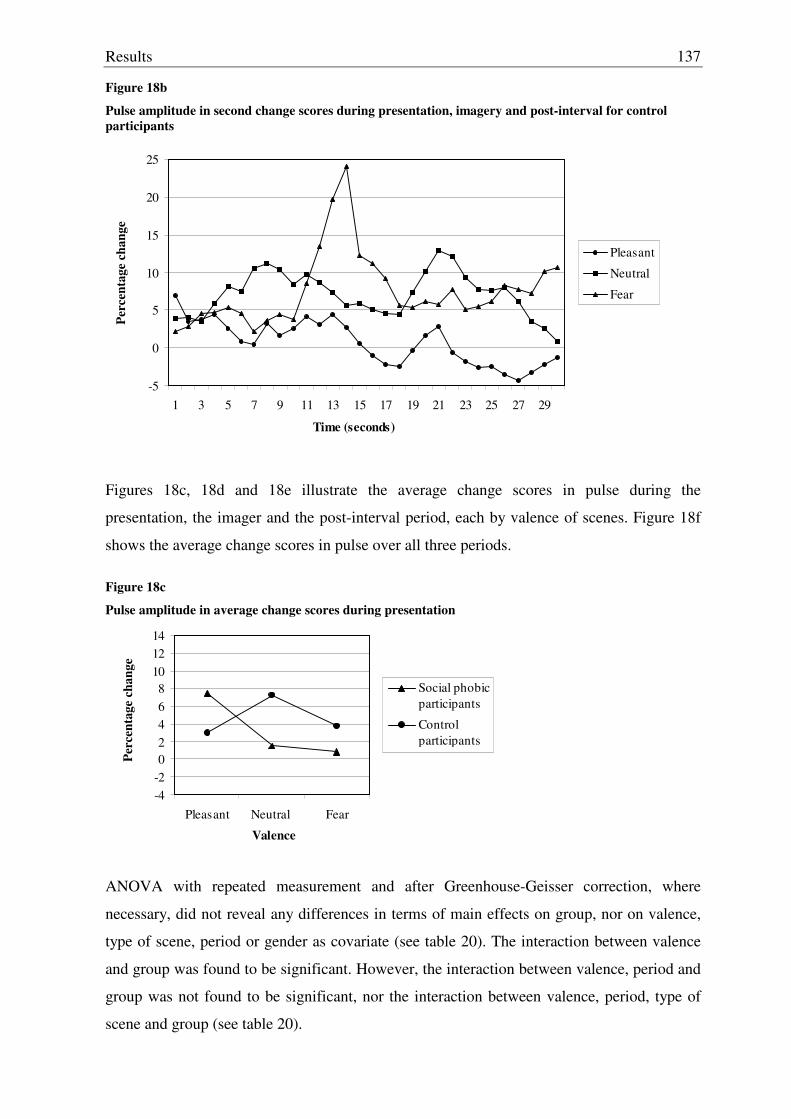
Results
137
Figure 18b
Pulse amplitude in second change scores during presentation, imagery and post-interval for control participants
-5
0
5
10
15
20
25
1 3 5 7 9 11 13 15 17 19 21 23 25 27 29
Time (seconds)
Perc
enta
ge c
hang
e
Pleasant
Neutral
Fear
Figures 18c, 18d and 18e illustrate the average change scores in pulse during the
presentation, the imager and the post-interval period, each by valence of scenes. Figure 18f
shows the average change scores in pulse over all three periods.
Figure 18c
Pulse amplitude in average change scores during presentation
-4-202468
101214
Pleasant Neutral Fear
Valence
Perc
enta
ge c
hang
e
Social phobicparticipants
Control participants
ANOVA with repeated measurement and after Greenhouse-Geisser correction, where
necessary, did not reveal any differences in terms of main effects on group, nor on valence,
type of scene, period or gender as covariate (see table 20). The interaction between valence
and group was found to be significant. However, the interaction between valence, period and
group was not found to be significant, nor the interaction between valence, period, type of
scene and group (see table 20).
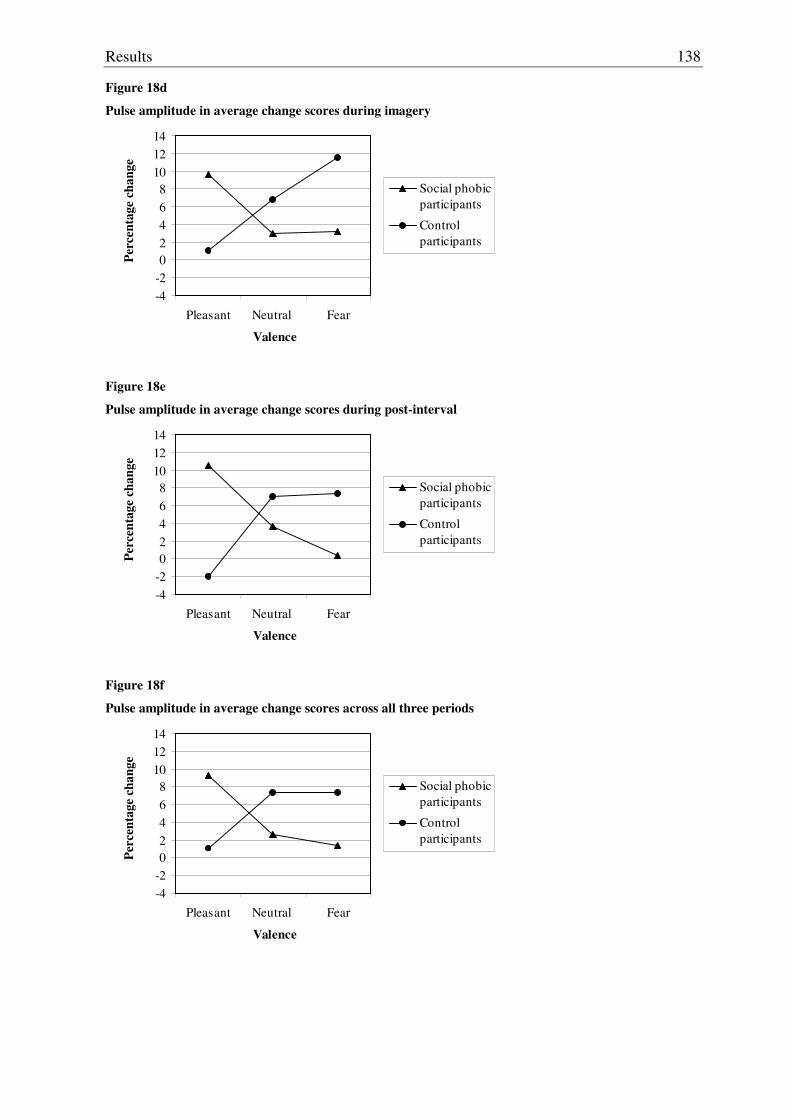
Results
138
Figure 18d
Pulse amplitude in average change scores during imagery
-4-202468
101214
Pleasant Neutral Fear
Valence
Perc
enta
ge c
hang
e
Social phobicparticipants
Control participants
Figure 18e
Pulse amplitude in average change scores during post-interval
-4-202468
101214
Pleasant Neutral Fear
Valence
Perc
enta
ge c
hang
e
Social phobicparticipants
Control participants
Figure 18f
Pulse amplitude in average change scores across all three periods
-4-202468
101214
Pleasant Neutral Fear
Valence
Perc
enta
ge c
hang
e
Social phobicparticipants
Control participants
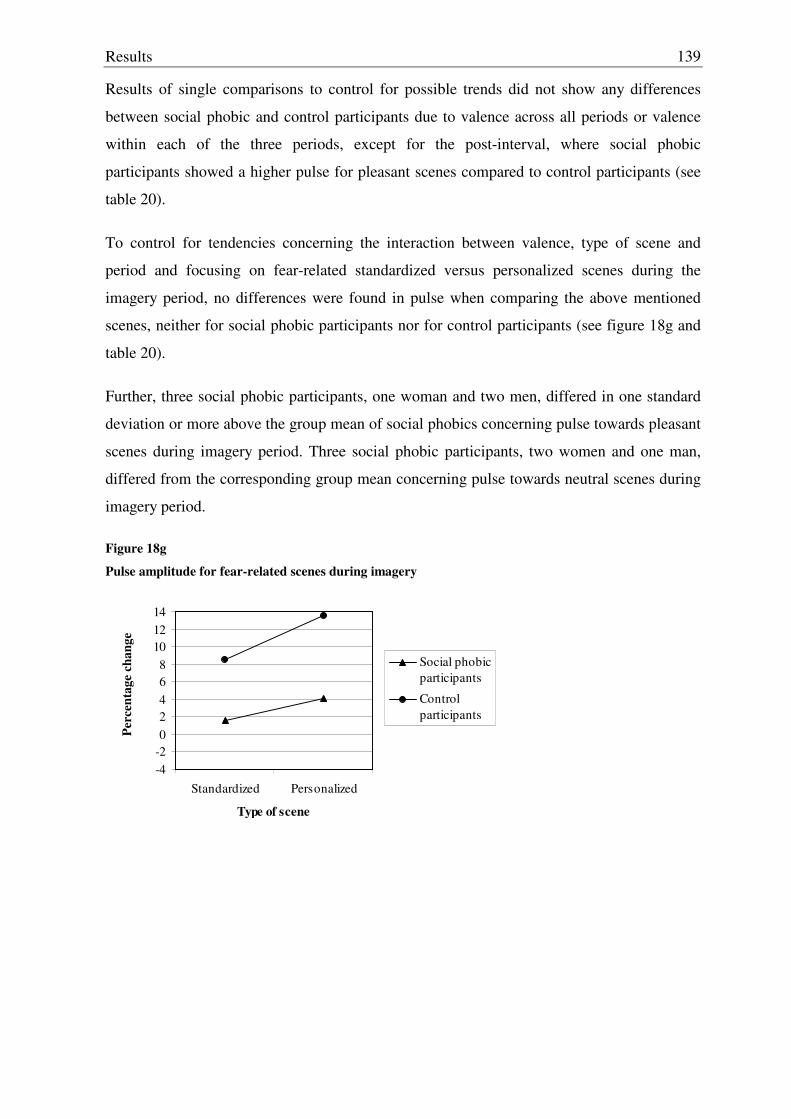
Results
139
Results of single comparisons to control for possible trends did not show any differences
between social phobic and control participants due to valence across all periods or valence
within each of the three periods, except for the post-interval, where social phobic
participants showed a higher pulse for pleasant scenes compared to control participants (see
table 20).
To control for tendencies concerning the interaction between valence, type of scene and
period and focusing on fear-related standardized versus personalized scenes during the
imagery period, no differences were found in pulse when comparing the above mentioned
scenes, neither for social phobic participants nor for control participants (see figure 18g and
table 20).
Further, three social phobic participants, one woman and two men, differed in one standard
deviation or more above the group mean of social phobics concerning pulse towards pleasant
scenes during imagery period. Three social phobic participants, two women and one man,
differed from the corresponding group mean concerning pulse towards neutral scenes during
imagery period.
Figure 18g
Pulse amplitude for fear-related scenes during imagery
-4-202468
101214
Standardized Personalized
Type of scene
Perc
enta
ge c
hang
e
Social phobicparticipants
Control participants

Results
140
Table 20
Means and standard deviations for valence of scenes by period for pulse amplitude
Presentation
Imagery
Post-interval
Pleasant M
(SD)
Neutral M
(SD)
Fear M
(SD)
Pleasant M
(SD)
Neutral M
(SD)
Fear M
(SD)
Pleasant M
(SD)
Neutral M
(SD)
Fear M
(SD) Soc. ph. n=18
7.53
(18.36)
1.51
(12.33)
0.79
(13.95)
9.65
(20.20)
2.97
(12.16)
3.17
(14.24)
10.47
(17.25)
3.64
(10.47)
0.42
(13.79) Controls
n=17
2.95
(16.63)
7.28
(17.03)
3.77
(15.64)
1.03
(20.16)
6.84
(17.48)
11.49
(13.34)
-1.93
(17.74)
7.01
(16.40)
7.37
(18.96)
Pulse (% chan-ge)
Total
N=35
5.31
(17.44)
4.31
(14.87)
2.24
(14.65)
5.45
(20.36)
4.85
(14.89)
7.21
(19.38)
4.45
(18.34)
5.28
(13.57)
3.79
(16.63)
df F p Group (between) Valence (within) Period (within) Type (within) Gender (covariate) Valence*group (within) Valence*period*group (within) Valence*period*type*group (within)
1, 32 2, 32 2, 64 1, 32 1, 32 2, 64
3.17, 101.50 3.60, 115.18
0.03 0.64 0.07 0.12 0.00 2.64 1.54 0.29
n.s. n.s. n.s. n.s. n.s.
<0.10 n.s. n.s.
Single comparisons valence*period*group df t p Presentation: Pleasant Neutral Fear Imagery: Pleasant Neutral Fear Post-interval: Pleasant Neutral Fear
33 33 33 33 33
26.65 33 33 33
-0.77 1.20 0.59
-1.27 0.84 1.31
-2.00 0.83 1.25
n.s. n.s. n.s. n.s. n.s. n.s.
<0.10 n.s. n.s.
Soc. ph., n=18 Contr., n=17 Single comparisons valence* group M (SD) M (SD) df t p Pleasant 9.27 (17.37) 1.01 (16.00) 33 -1.46 n.s. Neutral 2.66 (10.51) 7.32 (15.59) 27.86 1.03 n.s. Fear 1.37 (12.80) 7.37 (16.25) 33 1.22 n.s.
Imagery: Fear-related scenes standardized personalized
Single comparisons val.* period*type*group
M (SD) M (SD) df t p Social phob., n=18 1.57 (14.71) 4.06 (19.28) 17 -0.53 n.s. Controls, n=17 8.56 (30.98) 13.58 (35.15) 16 -0.42 n.s.
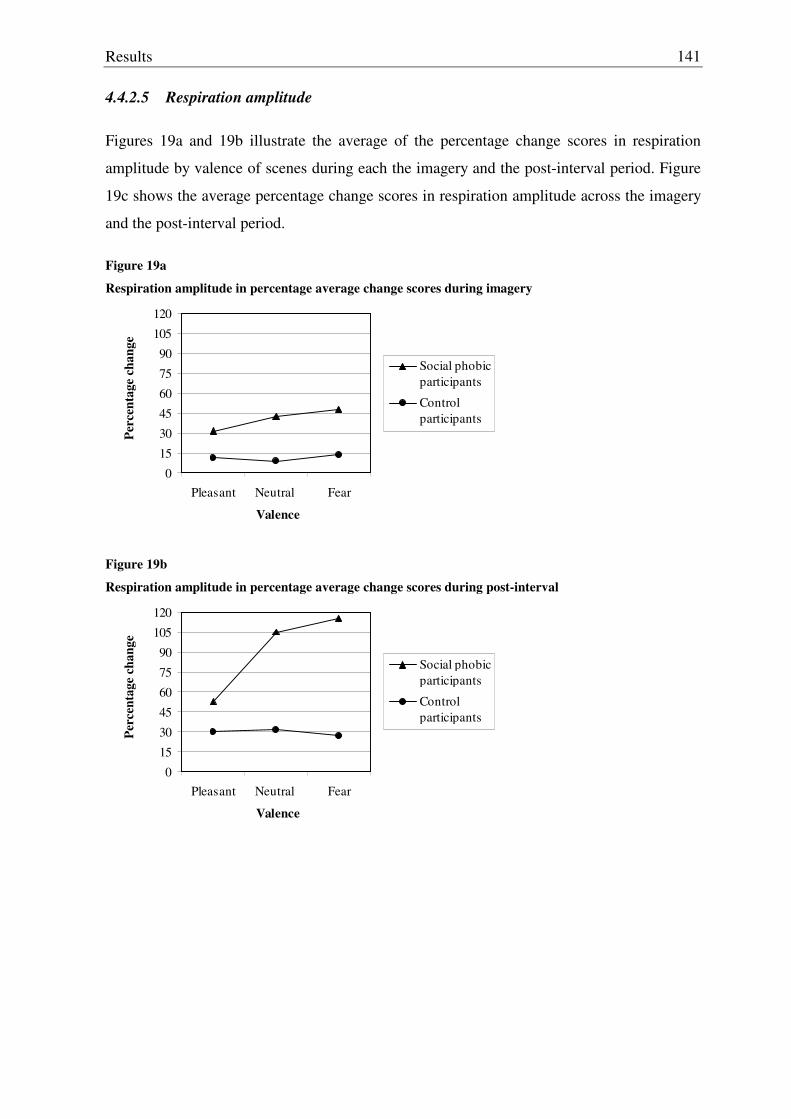
Results
141
4.4.2.5 Respiration amplitude
Figures 19a and 19b illustrate the average of the percentage change scores in respiration
amplitude by valence of scenes during each the imagery and the post-interval period. Figure
19c shows the average percentage change scores in respiration amplitude across the imagery
and the post-interval period.
Figure 19a
Respiration amplitude in percentage average change scores during imagery
0
15
30
45
60
75
90
105
120
Pleasant Neutral Fear
Valence
Perc
enta
ge c
hang
e
Social phobicparticipants
Control participants
Figure 19b
Respiration amplitude in percentage average change scores during post-interval
0
15
30
45
60
75
90
105
120
Pleasant Neutral Fear
Valence
Perc
enta
ge c
hang
e
Social phobicparticipants
Control participants
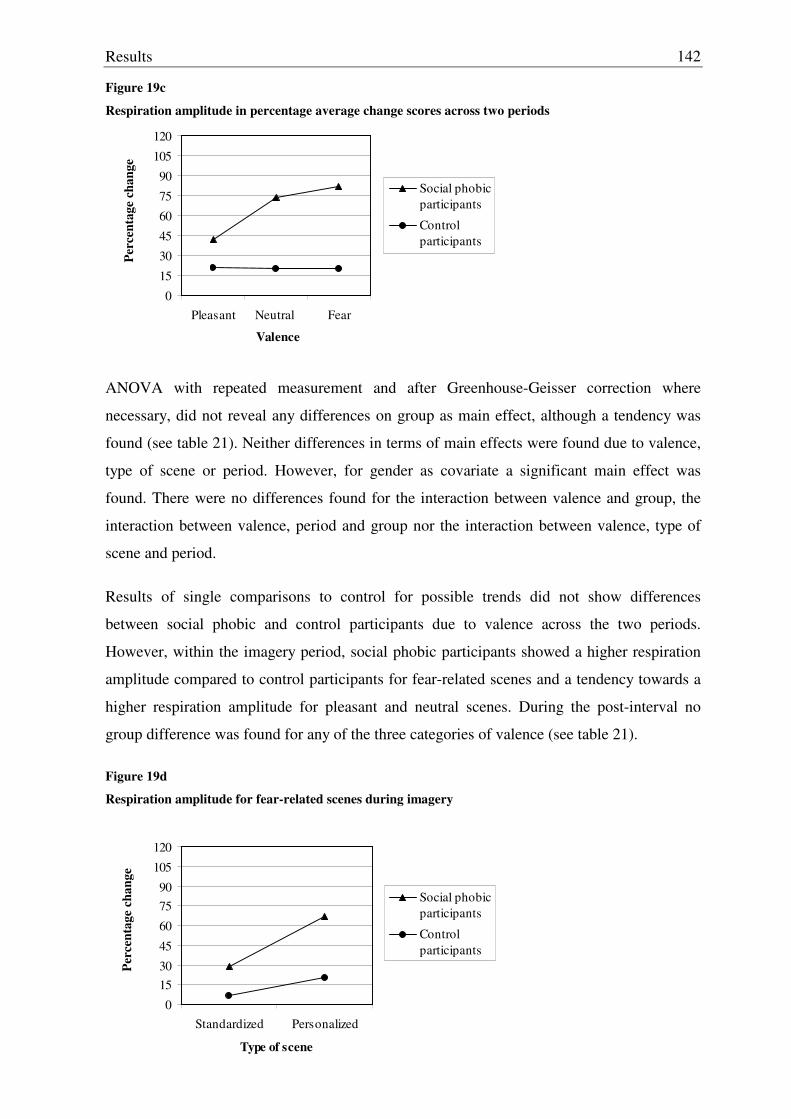
Results
142
Figure 19c
Respiration amplitude in percentage average change scores across two periods
0
15
30
45
60
75
90
105
120
Pleasant Neutral Fear
Valence
Perc
enta
ge c
hang
e
Social phobicparticipants
Control participants
ANOVA with repeated measurement and after Greenhouse-Geisser correction where
necessary, did not reveal any differences on group as main effect, although a tendency was
found (see table 21). Neither differences in terms of main effects were found due to valence,
type of scene or period. However, for gender as covariate a significant main effect was
found. There were no differences found for the interaction between valence and group, the
interaction between valence, period and group nor the interaction between valence, type of
scene and period.
Results of single comparisons to control for possible trends did not show differences
between social phobic and control participants due to valence across the two periods.
However, within the imagery period, social phobic participants showed a higher respiration
amplitude compared to control participants for fear-related scenes and a tendency towards a
higher respiration amplitude for pleasant and neutral scenes. During the post-interval no
group difference was found for any of the three categories of valence (see table 21).
Figure 19d Respiration amplitude for fear-related scenes during imagery
0
1530
45
60
7590
105
120
Standardized Personalized
Type of scene
Perc
enta
ge c
hang
e
Social phobicparticipants
Control participants
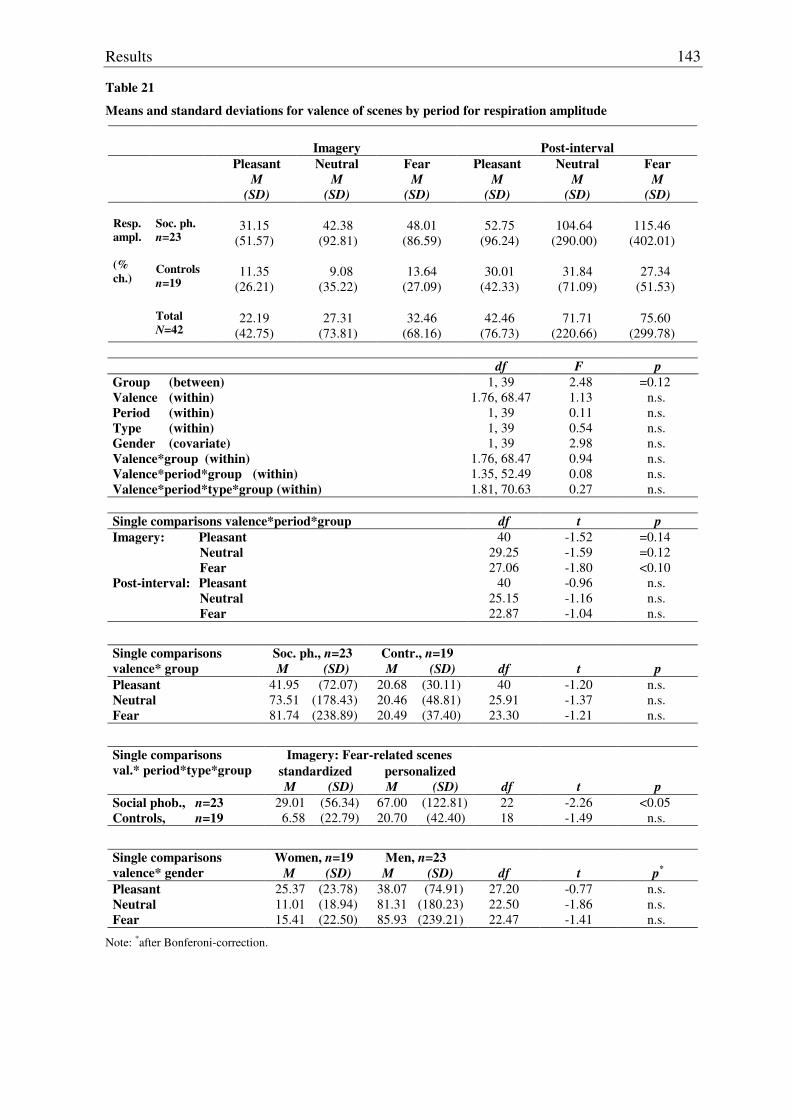
Results
143
Table 21
Means and standard deviations for valence of scenes by period for respiration amplitude
Imagery
Post-interval
Pleasant M
(SD)
Neutral M
(SD)
Fear M
(SD)
Pleasant M
(SD)
Neutral M
(SD)
Fear M
(SD) Soc. ph. n=23
31.15
(51.57)
42.38
(92.81)
48.01
(86.59)
52.75
(96.24)
104.64
(290.00)
115.46
(402.01) Controls
n=19
11.35
(26.21)
9.08
(35.22)
13.64
(27.09)
30.01
(42.33)
31.84
(71.09)
27.34
(51.53)
Resp. ampl. (% ch.)
Total
N=42
22.19
(42.75)
27.31
(73.81)
32.46
(68.16)
42.46
(76.73)
71.71
(220.66)
75.60
(299.78)
df F p Group (between) Valence (within) Period (within) Type (within) Gender (covariate) Valence*group (within) Valence*period*group (within) Valence*period*type*group (within)
1, 39 1.76, 68.47
1, 39 1, 39 1, 39
1.76, 68.47 1.35, 52.49 1.81, 70.63
2.48 1.13 0.11 0.54 2.98 0.94 0.08 0.27
=0.12 n.s. n.s. n.s. n.s. n.s. n.s. n.s.
Single comparisons valence*period*group df t p Imagery: Pleasant Neutral Fear Post-interval: Pleasant Neutral Fear
40 29.25 27.06
40 25.15 22.87
-1.52 -1.59 -1.80 -0.96 -1.16 -1.04
=0.14 =0.12 <0.10
n.s. n.s. n.s.
Soc. ph., n=23 Contr., n=19 Single comparisons valence* group M (SD) M (SD) df t p Pleasant 41.95 (72.07) 20.68 (30.11) 40 -1.20 n.s. Neutral 73.51 (178.43) 20.46 (48.81) 25.91 -1.37 n.s. Fear 81.74 (238.89) 20.49 (37.40) 23.30 -1.21 n.s.
Imagery: Fear-related scenes standardized personalized
Single comparisons val.* period*type*group
M (SD) M (SD) df t p Social phob., n=23 29.01 (56.34) 67.00 (122.81) 22 -2.26 <0.05 Controls, n=19 6.58 (22.79) 20.70 (42.40) 18 -1.49 n.s.
Women, n=19 Men, n=23 Single comparisons valence* gender M (SD) M (SD) df t p*
Pleasant 25.37 (23.78) 38.07 (74.91) 27.20 -0.77 n.s. Neutral 11.01 (18.94) 81.31 (180.23) 22.50 -1.86 n.s. Fear 15.41 (22.50) 85.93 (239.21) 22.47 -1.41 n.s.
Note: *after Bonferoni-correction.
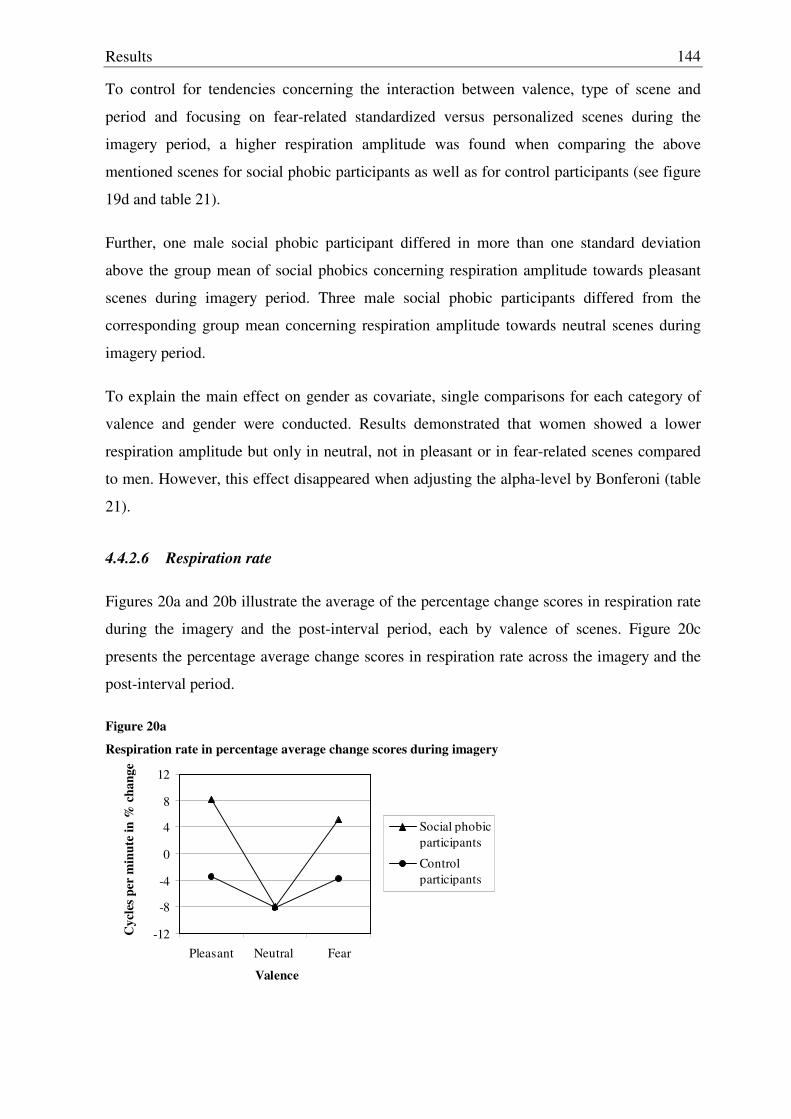
Results
144
To control for tendencies concerning the interaction between valence, type of scene and
period and focusing on fear-related standardized versus personalized scenes during the
imagery period, a higher respiration amplitude was found when comparing the above
mentioned scenes for social phobic participants as well as for control participants (see figure
19d and table 21).
Further, one male social phobic participant differed in more than one standard deviation
above the group mean of social phobics concerning respiration amplitude towards pleasant
scenes during imagery period. Three male social phobic participants differed from the
corresponding group mean concerning respiration amplitude towards neutral scenes during
imagery period.
To explain the main effect on gender as covariate, single comparisons for each category of
valence and gender were conducted. Results demonstrated that women showed a lower
respiration amplitude but only in neutral, not in pleasant or in fear-related scenes compared
to men. However, this effect disappeared when adjusting the alpha-level by Bonferoni (table
21).
4.4.2.6 Respiration rate
Figures 20a and 20b illustrate the average of the percentage change scores in respiration rate
during the imagery and the post-interval period, each by valence of scenes. Figure 20c
presents the percentage average change scores in respiration rate across the imagery and the
post-interval period.
Figure 20a
Respiration rate in percentage average change scores during imagery
-12
-8
-4
0
4
8
12
Pleasant Neutral Fear
Valence
Cyc
les p
er m
inut
e in
% c
hang
e
Social phobicparticipants
Control participants
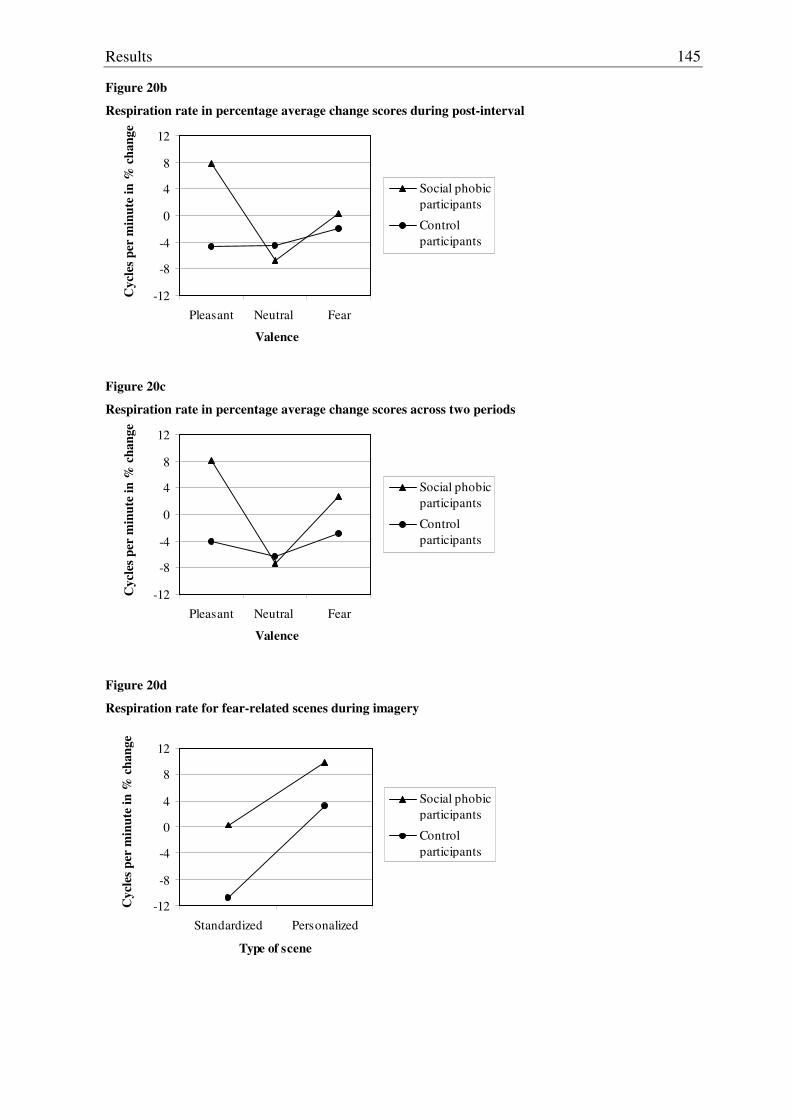
Results
145
Figure 20b
Respiration rate in percentage average change scores during post-interval
-12
-8
-4
0
4
8
12
Pleasant Neutral Fear
Valence
Cyc
les p
er m
inut
e in
% c
hang
e
Social phobicparticipants
Control participants
Figure 20c
Respiration rate in percentage average change scores across two periods
-12
-8
-4
0
4
8
12
Pleasant Neutral Fear
Valence
Cyc
les p
er m
inut
e in
% c
hang
e
Social phobicparticipants
Control participants
Figure 20d
Respiration rate for fear-related scenes during imagery
-12
-8
-4
0
4
8
12
Standardized Personalized
Type of scene
Cyc
les p
er m
inut
e in
% c
hang
e
Social phobicparticipants
Control participants
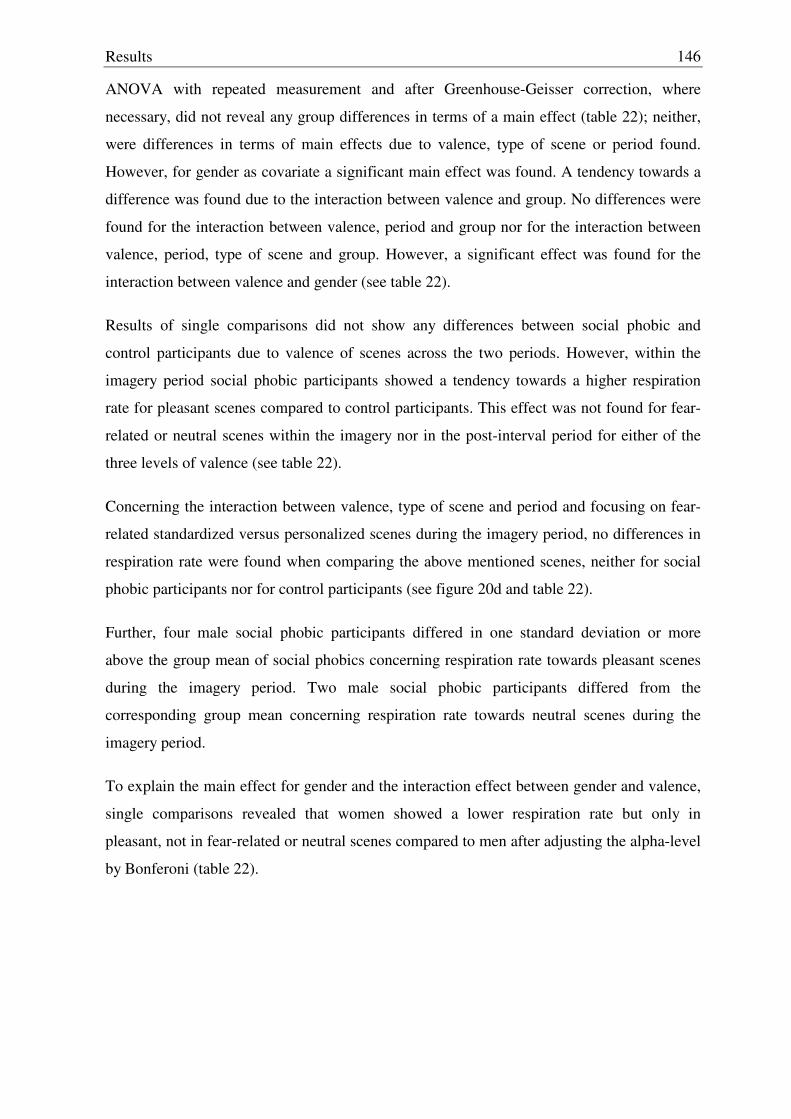
Results
146
ANOVA with repeated measurement and after Greenhouse-Geisser correction, where
necessary, did not reveal any group differences in terms of a main effect (table 22); neither,
were differences in terms of main effects due to valence, type of scene or period found.
However, for gender as covariate a significant main effect was found. A tendency towards a
difference was found due to the interaction between valence and group. No differences were
found for the interaction between valence, period and group nor for the interaction between
valence, period, type of scene and group. However, a significant effect was found for the
interaction between valence and gender (see table 22).
Results of single comparisons did not show any differences between social phobic and
control participants due to valence of scenes across the two periods. However, within the
imagery period social phobic participants showed a tendency towards a higher respiration
rate for pleasant scenes compared to control participants. This effect was not found for fear-
related or neutral scenes within the imagery nor in the post-interval period for either of the
three levels of valence (see table 22).
Concerning the interaction between valence, type of scene and period and focusing on fear-
related standardized versus personalized scenes during the imagery period, no differences in
respiration rate were found when comparing the above mentioned scenes, neither for social
phobic participants nor for control participants (see figure 20d and table 22).
Further, four male social phobic participants differed in one standard deviation or more
above the group mean of social phobics concerning respiration rate towards pleasant scenes
during the imagery period. Two male social phobic participants differed from the
corresponding group mean concerning respiration rate towards neutral scenes during the
imagery period.
To explain the main effect for gender and the interaction effect between gender and valence,
single comparisons revealed that women showed a lower respiration rate but only in
pleasant, not in fear-related or neutral scenes compared to men after adjusting the alpha-level
by Bonferoni (table 22).
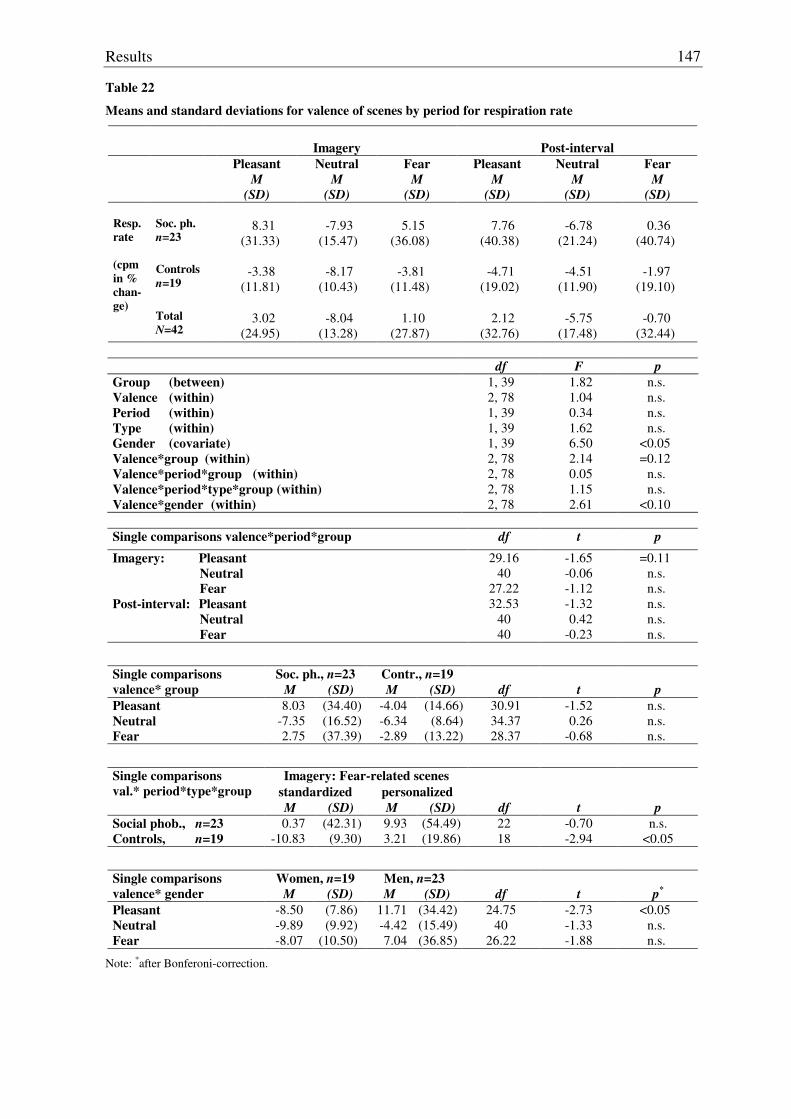
Results
147
Table 22
Means and standard deviations for valence of scenes by period for respiration rate
Imagery
Post-interval
Pleasant M
(SD)
Neutral M
(SD)
Fear M
(SD)
Pleasant M
(SD)
Neutral M
(SD)
Fear M
(SD) Soc. ph. n=23
8.31
(31.33)
-7.93
(15.47)
5.15
(36.08)
7.76
(40.38)
-6.78
(21.24)
0.36
(40.74) Controls
n=19
-3.38
(11.81)
-8.17
(10.43)
-3.81
(11.48)
-4.71
(19.02)
-4.51
(11.90)
-1.97
(19.10)
Resp. rate (cpm in % chan-ge)
Total
N=42
3.02
(24.95)
-8.04
(13.28)
1.10
(27.87)
2.12
(32.76)
-5.75
(17.48)
-0.70
(32.44)
df F p Group (between) Valence (within) Period (within) Type (within) Gender (covariate) Valence*group (within) Valence*period*group (within) Valence*period*type*group (within) Valence*gender (within)
1, 39 2, 78 1, 39 1, 39 1, 39 2, 78 2, 78 2, 78 2, 78
1.82 1.04 0.34 1.62 6.50 2.14 0.05 1.15 2.61
n.s. n.s. n.s. n.s.
<0.05 =0.12
n.s. n.s.
<0.10
Single comparisons valence*period*group df t p
Imagery: Pleasant Neutral Fear Post-interval: Pleasant Neutral Fear
29.16 40
27.22 32.53
40 40
-1.65 -0.06 -1.12 -1.32 0.42
-0.23
=0.11 n.s. n.s. n.s. n.s. n.s.
Soc. ph., n=23 Contr., n=19 Single comparisons valence* group M (SD) M (SD) df t p Pleasant 8.03 (34.40) -4.04 (14.66) 30.91 -1.52 n.s. Neutral -7.35 (16.52) -6.34 (8.64) 34.37 0.26 n.s. Fear 2.75 (37.39) -2.89 (13.22) 28.37 -0.68 n.s.
Imagery: Fear-related scenes standardized personalized
Single comparisons val.* period*type*group
M (SD) M (SD) df t p Social phob., n=23 0.37 (42.31) 9.93 (54.49) 22 -0.70 n.s. Controls, n=19 -10.83 (9.30) 3.21 (19.86) 18 -2.94 <0.05
Women, n=19 Men, n=23 Single comparisons valence* gender M (SD) M (SD) df t p*
Pleasant -8.50 (7.86) 11.71 (34.42) 24.75 -2.73 <0.05 Neutral -9.89 (9.92) -4.42 (15.49) 40 -1.33 n.s. Fear -8.07 (10.50) 7.04 (36.85) 26.22 -1.88 n.s.
Note: *after Bonferoni-correction.
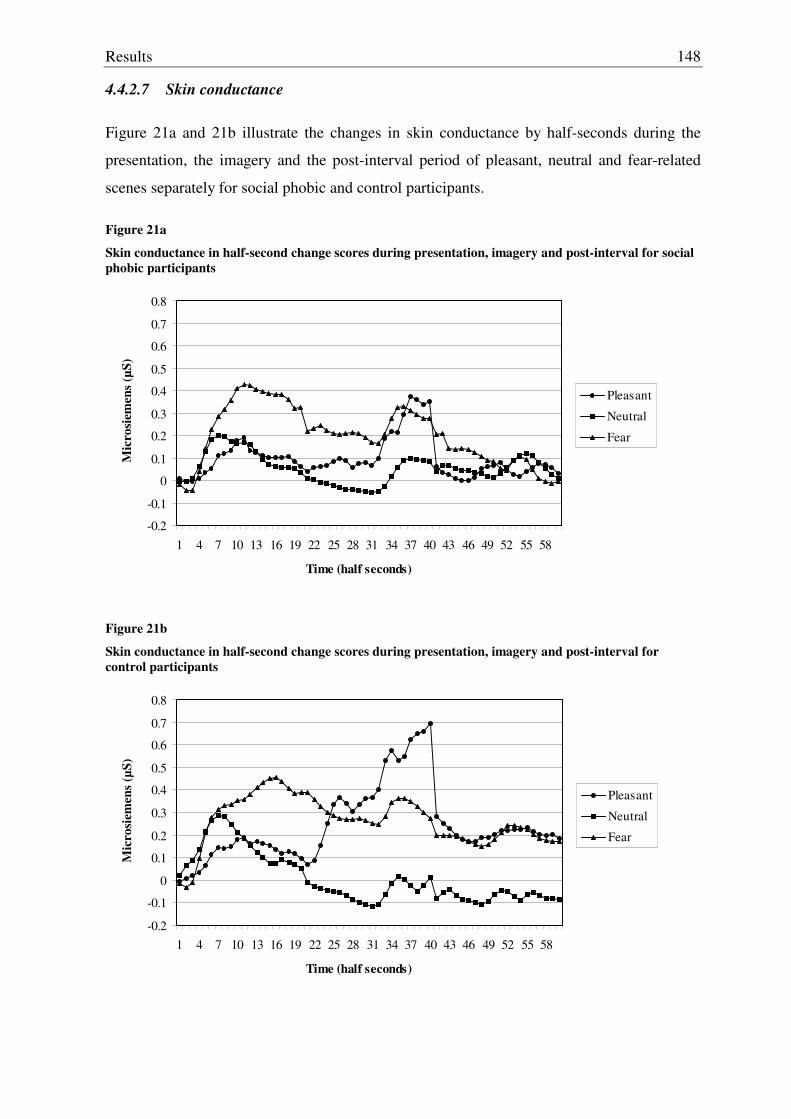
Results
148
4.4.2.7 Skin conductance
Figure 21a and 21b illustrate the changes in skin conductance by half-seconds during the
presentation, the imagery and the post-interval period of pleasant, neutral and fear-related
scenes separately for social phobic and control participants.
Figure 21a
Skin conductance in half-second change scores during presentation, imagery and post-interval for social phobic participants
-0.2
-0.1
0
0.1
0.2
0.3
0.4
0.5
0.6
0.7
0.8
1 4 7 10 13 16 19 22 25 28 31 34 37 40 43 46 49 52 55 58
Time (half seconds)
Mic
rosi
emen
s (µS
)
Pleasant
Neutral
Fear
Figure 21b
Skin conductance in half-second change scores during presentation, imagery and post-interval for control participants
-0.2
-0.1
0
0.1
0.2
0.3
0.4
0.5
0.6
0.7
0.8
1 4 7 10 13 16 19 22 25 28 31 34 37 40 43 46 49 52 55 58
Time (half seconds)
Mic
rosi
emen
s (µS
)
Pleasant
Neutral
Fear
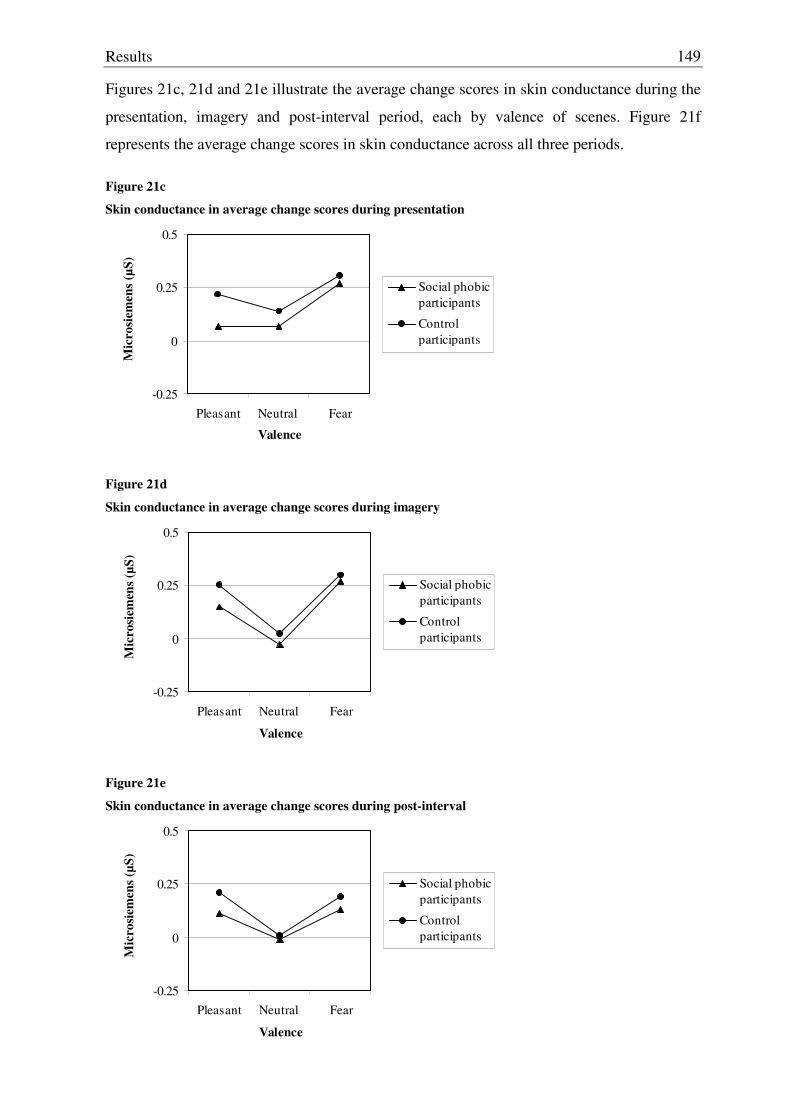
Results
149
Figures 21c, 21d and 21e illustrate the average change scores in skin conductance during the
presentation, imagery and post-interval period, each by valence of scenes. Figure 21f
represents the average change scores in skin conductance across all three periods.
Figure 21c
Skin conductance in average change scores during presentation
-0.25
0
0.25
0.5
Pleasant Neutral Fear
Valence
Mic
rosi
emen
s (µS
)
Social phobicparticipants
Control participants
Figure 21d
Skin conductance in average change scores during imagery
-0.25
0
0.25
0.5
Pleasant Neutral Fear
Valence
Mic
rosi
emen
s (µS
)
Social phobicparticipants
Control participants
Figure 21e
Skin conductance in average change scores during post-interval
-0.25
0
0.25
0.5
Pleasant Neutral Fear
Valence
Mic
rosi
emen
s (µS
)
Social phobicparticipants
Control participants
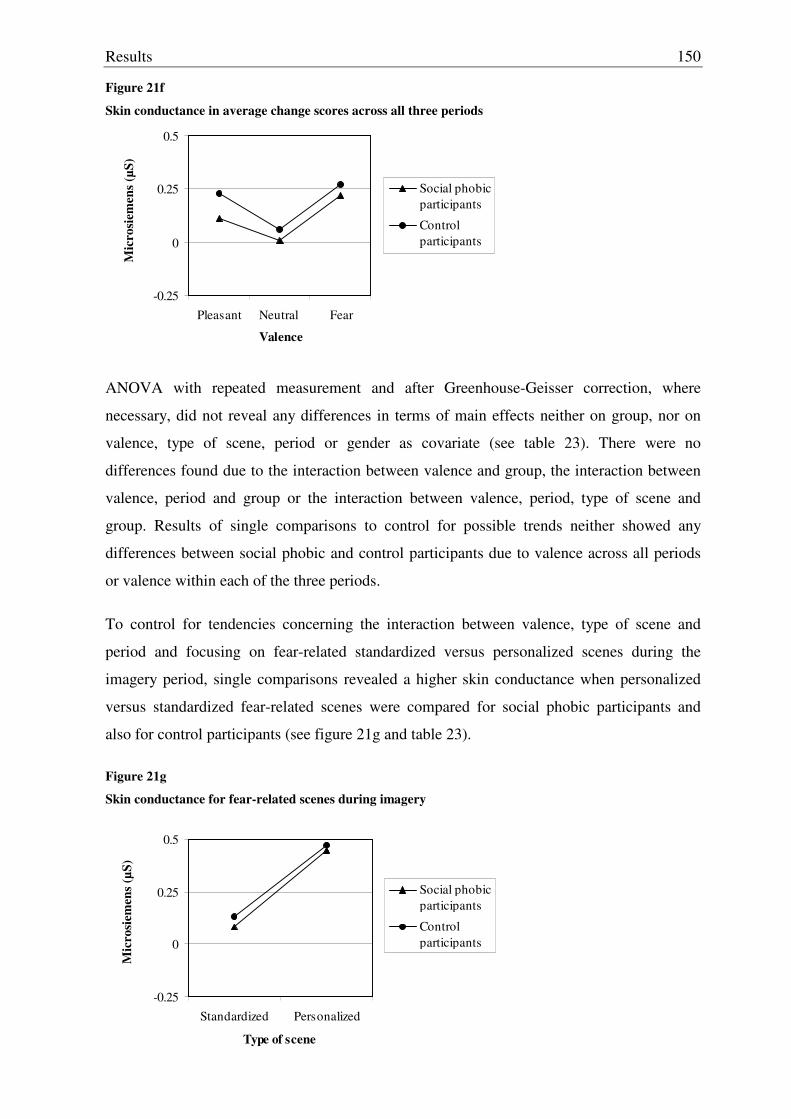
Results
150
Figure 21f
Skin conductance in average change scores across all three periods
-0.25
0
0.25
0.5
Pleasant Neutral Fear
Valence
Mic
rosi
emen
s (µS
)
Social phobicparticipants
Control participants
ANOVA with repeated measurement and after Greenhouse-Geisser correction, where
necessary, did not reveal any differences in terms of main effects neither on group, nor on
valence, type of scene, period or gender as covariate (see table 23). There were no
differences found due to the interaction between valence and group, the interaction between
valence, period and group or the interaction between valence, period, type of scene and
group. Results of single comparisons to control for possible trends neither showed any
differences between social phobic and control participants due to valence across all periods
or valence within each of the three periods.
To control for tendencies concerning the interaction between valence, type of scene and
period and focusing on fear-related standardized versus personalized scenes during the
imagery period, single comparisons revealed a higher skin conductance when personalized
versus standardized fear-related scenes were compared for social phobic participants and
also for control participants (see figure 21g and table 23).
Figure 21g
Skin conductance for fear-related scenes during imagery
-0.25
0
0.25
0.5
Standardized Personalized
Type of scene
Mic
rosi
emen
s (µS
)
Social phobicparticipants
Control participants
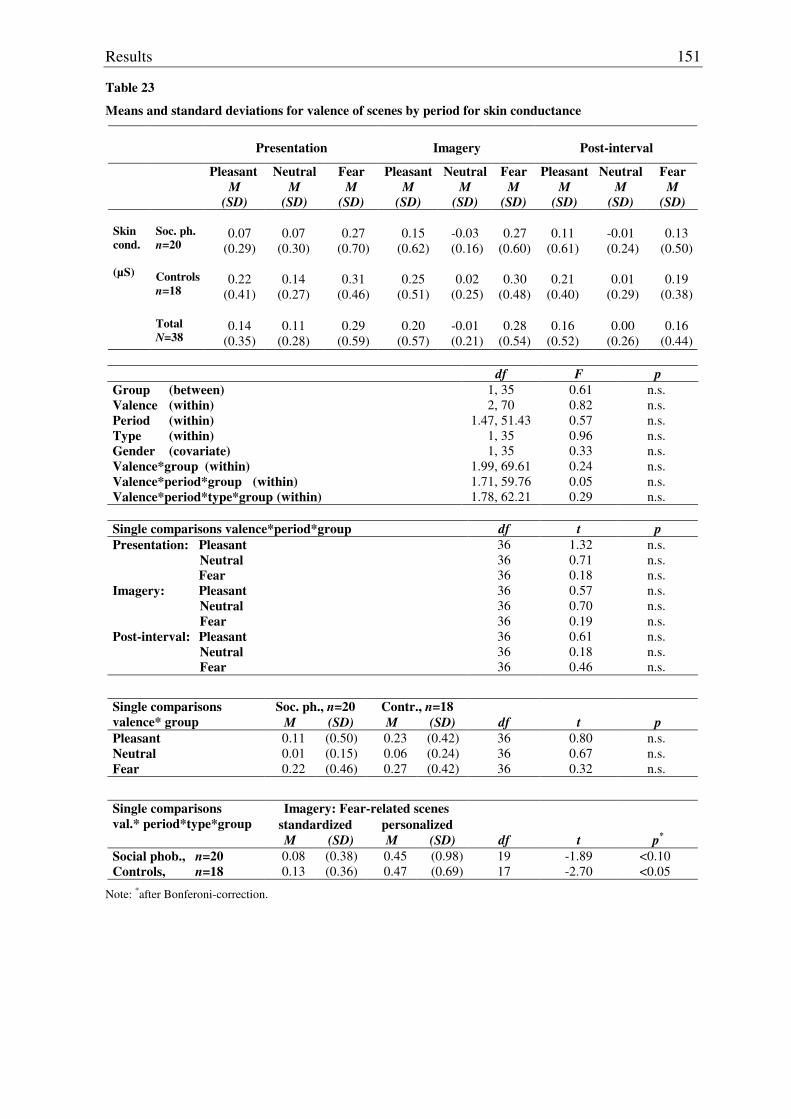
Results
151
Table 23
Means and standard deviations for valence of scenes by period for skin conductance
Presentation
Imagery
Post-interval
Pleasant M
(SD)
Neutral M
(SD)
Fear M
(SD)
Pleasant M
(SD)
Neutral M
(SD)
Fear M
(SD)
Pleasant M
(SD)
Neutral M
(SD)
Fear M
(SD) Soc. ph. n=20
0.07
(0.29)
0.07
(0.30)
0.27
(0.70)
0.15
(0.62)
-0.03 (0.16)
0.27
(0.60)
0.11
(0.61)
-0.01 (0.24)
0.13
(0.50) Controls
n=18
0.22
(0.41)
0.14
(0.27)
0.31
(0.46)
0.25
(0.51)
0.02
(0.25)
0.30
(0.48)
0.21
(0.40)
0.01
(0.29)
0.19
(0.38)
Skin cond. (µS)
Total
N=38
0.14
(0.35)
0.11
(0.28)
0.29
(0.59)
0.20
(0.57)
-0.01 (0.21)
0.28
(0.54)
0.16
(0.52)
0.00
(0.26)
0.16
(0.44)
df F p Group (between) Valence (within) Period (within) Type (within) Gender (covariate) Valence*group (within) Valence*period*group (within) Valence*period*type*group (within)
1, 35 2, 70
1.47, 51.43 1, 35 1, 35
1.99, 69.61 1.71, 59.76 1.78, 62.21
0.61 0.82 0.57 0.96 0.33 0.24 0.05 0.29
n.s. n.s. n.s. n.s. n.s. n.s. n.s. n.s.
Single comparisons valence*period*group df t p Presentation: Pleasant Neutral Fear Imagery: Pleasant Neutral Fear Post-interval: Pleasant Neutral Fear
36 36 36 36 36 36 36 36 36
1.32 0.71 0.18 0.57 0.70 0.19 0.61 0.18 0.46
n.s. n.s. n.s. n.s. n.s. n.s. n.s. n.s. n.s.
Soc. ph., n=20 Contr., n=18 Single comparisons valence* group M (SD) M (SD) df t p Pleasant 0.11 (0.50) 0.23 (0.42) 36 0.80 n.s. Neutral 0.01 (0.15) 0.06 (0.24) 36 0.67 n.s. Fear 0.22 (0.46) 0.27 (0.42) 36 0.32 n.s.
Imagery: Fear-related scenes standardized personalized
Single comparisons val.* period*type*group
M (SD) M (SD) df t p*
Social phob., n=20 0.08 (0.38) 0.45 (0.98) 19 -1.89 <0.10 Controls, n=18 0.13 (0.36) 0.47 (0.69) 17 -2.70 <0.05
Note: *after Bonferoni-correction.
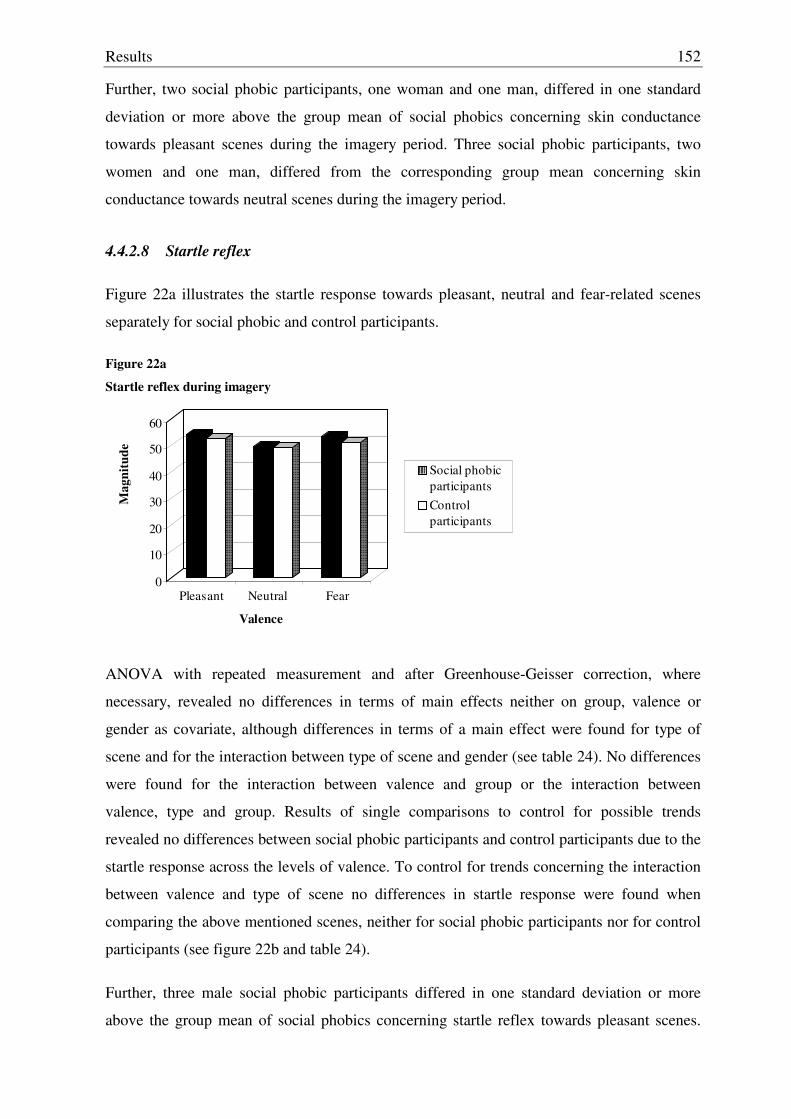
Results
152
Further, two social phobic participants, one woman and one man, differed in one standard
deviation or more above the group mean of social phobics concerning skin conductance
towards pleasant scenes during the imagery period. Three social phobic participants, two
women and one man, differed from the corresponding group mean concerning skin
conductance towards neutral scenes during the imagery period.
4.4.2.8 Startle reflex
Figure 22a illustrates the startle response towards pleasant, neutral and fear-related scenes
separately for social phobic and control participants.
Figure 22a
Startle reflex during imagery
0
10
20
30
40
50
60
Mag
nitu
de
Pleasant Neutral Fear
Valence
Social phobicparticipantsControl participants
ANOVA with repeated measurement and after Greenhouse-Geisser correction, where
necessary, revealed no differences in terms of main effects neither on group, valence or
gender as covariate, although differences in terms of a main effect were found for type of
scene and for the interaction between type of scene and gender (see table 24). No differences
were found for the interaction between valence and group or the interaction between
valence, type and group. Results of single comparisons to control for possible trends
revealed no differences between social phobic participants and control participants due to the
startle response across the levels of valence. To control for trends concerning the interaction
between valence and type of scene no differences in startle response were found when
comparing the above mentioned scenes, neither for social phobic participants nor for control
participants (see figure 22b and table 24).
Further, three male social phobic participants differed in one standard deviation or more
above the group mean of social phobics concerning startle reflex towards pleasant scenes.
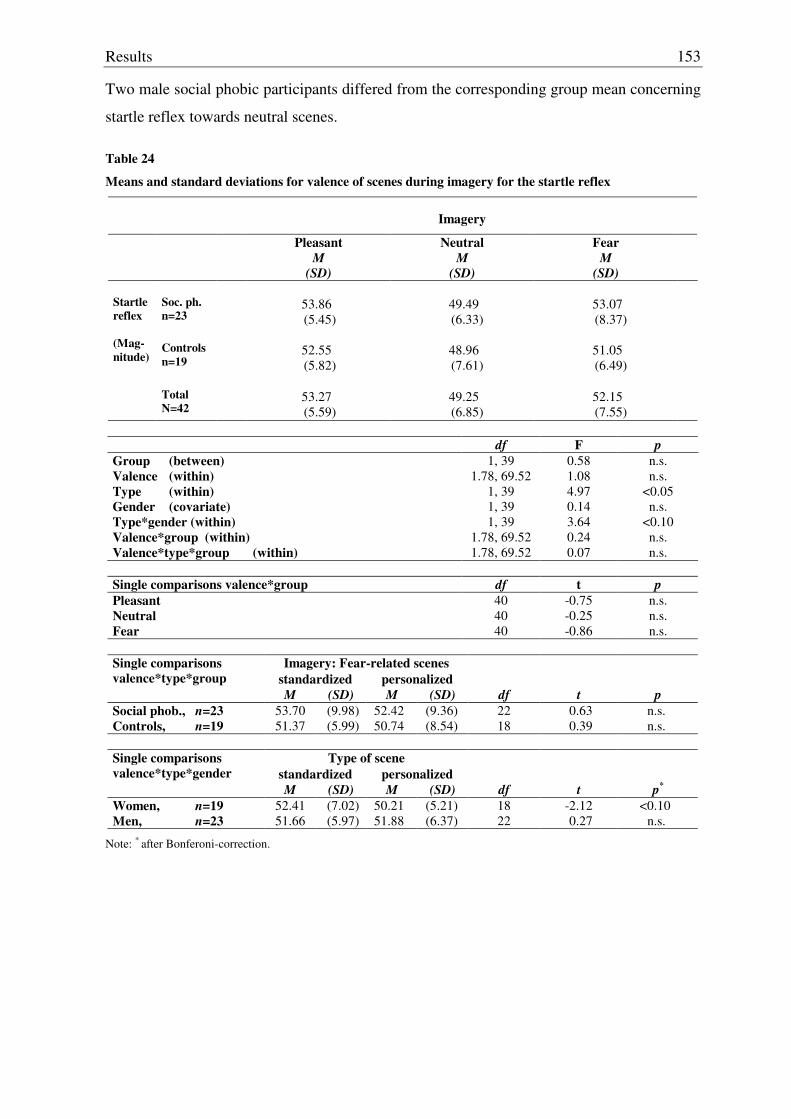
Results
153
Two male social phobic participants differed from the corresponding group mean concerning
startle reflex towards neutral scenes.
Table 24
Means and standard deviations for valence of scenes during imagery for the startle reflex
Imagery
Pleasant M
(SD)
Neutral M
(SD)
Fear M
(SD)
Soc. ph. n=23
53.86 (5.45)
49.49 (6.33)
53.07 (8.37)
Controls
n=19
52.55 (5.82)
48.96 (7.61)
51.05 (6.49)
Startle reflex (Mag- nitude)
Total
N=42
53.27 (5.59)
49.25 (6.85)
52.15 (7.55)
df F p
Group (between) Valence (within) Type (within) Gender (covariate) Type*gender (within) Valence*group (within) Valence*type*group (within)
1, 39 1.78, 69.52
1, 39 1, 39 1, 39
1.78, 69.52 1.78, 69.52
0.58 1.08 4.97 0.14 3.64 0.24 0.07
n.s. n.s.
<0.05 n.s.
<0.10 n.s. n.s.
Single comparisons valence*group df t p Pleasant Neutral Fear
40 40 40
-0.75 -0.25 -0.86
n.s. n.s. n.s.
Imagery: Fear-related scenes
standardized personalized Single comparisons valence*type*group
M (SD) M (SD) df t p Social phob., n=23 53.70 (9.98) 52.42 (9.36) 22 0.63 n.s. Controls, n=19 51.37 (5.99) 50.74 (8.54) 18 0.39 n.s.
Type of scene
standardized personalized Single comparisons valence*type*gender
M (SD) M (SD) df t p*
Women, n=19 52.41 (7.02) 50.21 (5.21) 18 -2.12 <0.10 Men, n=23 51.66 (5.97) 51.88 (6.37) 22 0.27 n.s.
Note: * after Bonferoni-correction.
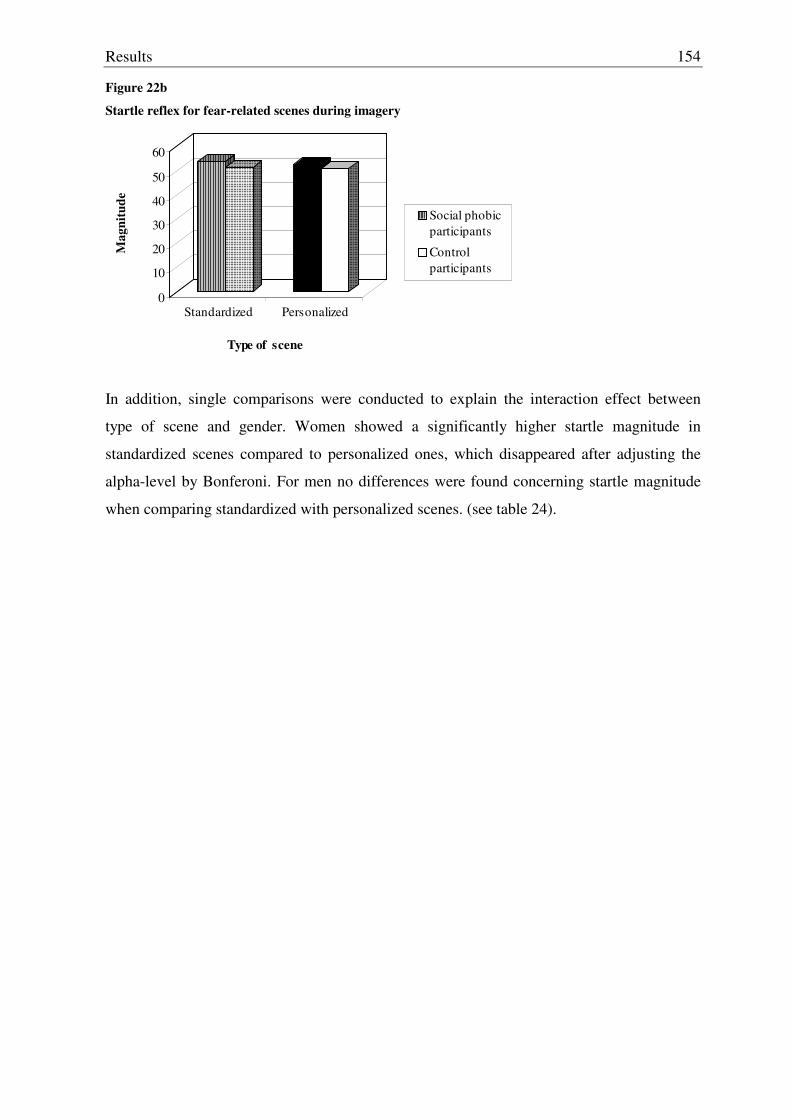
Results
154
Figure 22b
Startle reflex for fear-related scenes during imagery
0
10
20
30
40
50
60
Mag
nitu
de
Standardized Personalized
Type of scene
Social phobicparticipants
Control participants
In addition, single comparisons were conducted to explain the interaction effect between
type of scene and gender. Women showed a significantly higher startle magnitude in
standardized scenes compared to personalized ones, which disappeared after adjusting the
alpha-level by Bonferoni. For men no differences were found concerning startle magnitude
when comparing standardized with personalized scenes. (see table 24).
Discussion
155
5. DISCUSSION
The aim of this study was to examine subjective perceived symptoms of social anxiety as
well as physiological parameters in different, anxiety provoking versus non-anxiety
provoking conditions in social phobic participants versus control participants to contribute to
a better understanding of the activation versus non-activation of assumed underlying fear
network structures in a Spanish student sample. In this chapter, results concerning the
hypotheses are discussed from the point of view of content and methods separately for each
of the three paradigms and preceded by the results concerning questionnaire-based data.
5.1 Discussion concerning questionnaire-based data
5.1.1 Questionnaires used for the screening
Concerning the criteria for the selection of social phobic and control participants used in the
screening, post-hoc analyses confirmed that both groups differed significantly in their report
due to social fear in general, avoidance of socially related situations, physiological arousal,
fear of being scrutinized during routine activities, fear in terms of cognitive, affective and
behavioral reactions concerning general social interactions and due to positive and negative
self-statements regarding fearful thoughts that arise during public speaking. These results
confirm that a sufficient differentiation between these two groups in terms of subjective
reports towards social phobic related symptoms was ensured and the selection criteria had
been chosen successfully.
5.1.2 Questionnaires used before physiological recording
Results of questionnaires used before the physiological recording indicated, with regard to
social phobia, that social phobic participants compared to control participants reported
experiencing more somatic, cognitive and behavioral aspects of social phobia, even when
results were controlled for agoraphobia-related symptoms. In addition they reported more
negative thoughts regarding social interactions and with regard to fear and anxiety related
symptoms in general, more agoraphobic-related symptoms, a higher sensitivity towards
anxiety provoking situations in general, a higher focus on panic related symptoms and a
higher state and trait anxiety. Social phobic participants also reported experiencing more
intensive and excessive worries and more severe depressive symptoms compared to control
participants. Especially the latter aspect can be interpreted in line with the findings of
Discussion
156
McNeil and colleagues that for social phobic participants worry is a significant component
(McNeil et al., 1993). Thus, from the point of view of content, the results can be definitely
interpreted in favor of hypothesis 1a and 1b, which states that social phobic participants
show a higher social anxiety, trait and state anxiety as well as a higher severity of depressive
symptomatology and worries. Interestingly, although social phobic participants reported
having more negative thoughts pertaining to social interactions than control participants, the
groups did not differ due to positive thoughts pertaining to social interactions. These results
are only partly in line with a study by Beidel and colleagues, who reported more negative
thoughts, but also fewer positive thoughts in social phobics (Beidel, Turner & Dancun,
1985). This might be seen as a hint that even for control participants, social interactions are
stressful to some extent which might explain that they did not report more positive thoughts.
But the fact that they reported less negative thoughts can be interpreted in such a way that
they do not experience these situations as stressful and negative as social phobic participants.
In sum, these results are consistent with results found in the literature about the report of
subjective well-being and symptomatology when social phobic and control participants were
compared (see paragraph 2.2.3.5) and also in line with the assumed dysfunctional cognitive
schemata, a general maladaptive cognitive processing style, that often leads to a shift in
attention towards themselves and incorrect memory processing (see Barlow, 2002; Beck &
Emery, 1985; Stangier & Fiedrich, 2002 and paragraph 2.3.3.2)
Concerning the general ability to imagine objects and experiences as well as the a priori
experience concerning the contents of the standardized scenes that were presented within the
imagery paradigm no group differences could be found, so that results within the imagery
paradigm seemed not to be influenced by a systematic bias with regard to the general ability
to imagine scenes or to the frequency with which such types of situations described in the
scenes had been experienced before. However, social phobic participants reported having
thought more often about contents of standardized scenes than control participants. It
remains open if and what kind of influence this could have had on results within the imagery
paradigm. On the one hand it could have facilitated the imagination of scenes for social
phobic participants and therefore could have led to a greater physiological arousal in turn.
On the other hand this can also be seen in the context of the above mentioned worries and
preoccupations which are experienced to a greater extent by social phobic participants and
that might have interfered with the imagination of scenes. This in turn might have
interrupted a greater physiological arousal at least towards anxiety provoking scenes, as
cognitive resources were not sufficiently available.
Discussion
157
From the point of view of methods, it should be considered for all questionnaires that normal
distribution of means must not be assumed for all scales, which is caused mainly by the
small sample sizes. This might lead to limitations when interpreting results. In particular
with regard to results concerning fear that is related to social situations, negative self-
statements, the general sensitivity towards anxiety provoking situations, state anxiety and the
severity of depressive symptomatology. Although homogeneity of variances was not given
for all scales, possible resulting limitations could be resolved through the appropriate
correction of degrees of freedom. In addition, results concerning internal consistency of
scales are good to excellent, which points towards a good reliability concerning
questionnaire-based data, even for those scales that have not been validated in Spanish
samples. As always for questionnaire-based data, artifacts regarding tendencies in
responding in a social desirable way, that could have influenced results, cannot be
controlled, neither within nor between the two groups.
5.2 Discussion concerning the defense paradigm
5.2.1 Heart rate
Although the non-significant main effect for group concerning heart rate within the defense
reaction does not support hypothesis 2a, the significant main effect for interval and for the
interaction between intervals and group as well as results concerning single comparisons for
interval 6, 7, 9 and 10 can be interpreted in favor of hypothesis 2a, in that social phobic
participants showed a higher sympathetic activation compared to control participants within
the second acceleration and deceleration, which are both typical components of the defense
reaction. So, the significant main effect for intervals reflect the typical, dynamic pattern for
heart rate as a defense reaction in both social phobic and control participants, with a primary
accelerative and decelerative component, which reflects mainly parasympathetic inhibition
followed by activation controlled by the vagus and might reflect in terms of its functional
significance an attentional component towards the defense eliciting stimulus. This is
followed by a second acceleration and deceleration, that reflect a reciprocal sympathetic
activation and parasympathetic inhibition, where the sympathetic activation seems to
dominate slightly, which might reflect in terms of its functional significance an action
component towards the defense eliciting stimulus. Therefore, the typical pattern of the
cardiac defense reaction could be replicated (see Vila et al., 2003). As the physiological
mediation of the second acceleration and deceleration of the defense response is supposed to
Discussion
158
be controlled reciprocally by the sympathetic and parasympathetic branches of the nervous
system, results concerning group differences might result due to the greater sympathetic and
lower parasympathetic activation shown by social phobic participants in response to the
defense stimulus. These two physiological mechanisms have been consistently associated
with poor autonomic and emotion regulation (Thayer & Siegle, 2002).
From a methodic point of view, although homogeneity of variances is given for heart rate, it
should be mentioned that for interval 3 and 7 normal distribution of means must not be
assumed, which should be considered when interpreting the above mentioned results.
However, as this influenced only one of the above mentioned intervals, the general
interpretation should not be too much affected by this.
5.2.2 Systolic blood pressure
Although the non-significant main effect for group and the non-significant interaction effect
between interval and group concerning systolic blood pressure do not support hypothesis 2a,
the results of related single comparisons concerning interval 7 and therefore the second
acceleration, can be interpreted partly as a tendency in favor of hypothesis 2a, as social
phobic participants showed a higher activation due to the defense stimulus compared to
control participants. On a descriptive level, a tendency for the typical pattern described for
heart rate could be found for systolic blood pressure in both social phobic participants and
control participants, which is again characterized by an initial increase in systolic blood
pressure, followed by a decrease, a second increase and a final decrease.
From a methodic point of view, neither normal distribution of means must be assumed for
interval 4, 8 and 9 nor homogeneity of variances for interval 1, 2 and 5. As this does not
affect the tendency found for interval 7, too much importance should not be attached to these
results.
5.2.3 Diastolic blood pressure
Although the significant main effect for interval seem to support hypothesis 2a, the non-
significant result concerning the main effect for group and the interaction effect between
interval and group with regard to diastolic blood pressure do not support this hypothesis, as
social phobic participants did not show the expected higher activation due to a defense
stimulus compared to control participants.
Discussion
159
Differences found for intervals showed a tendency on a descriptive level for a similar pattern
found in heart rate and systolic blood pressure for both, social phobic and control
participants, except that the tendency for a final decrease in diastolic blood pressure did not
come up that clearly. Since the diastolic blood pressure reflects mainly peripheral
mechanisms of blood vessels resistance, it may be concluded that the differences between
social phobic participants and controls in heart rate and systolic blood pressure are mainly
due to specific sympathetic activation affecting the heart but not the blood vessels.
From a methodic point of view, it should be mentioned as a limitation that normal
distribution of means must not be assumed for interval 3, 5 and 8, nor homogeneity of
variances for interval 10.
5.2.4 Pulse amplitude
Results towards the non-significant main effect for group, for interval and for the interaction
between interval and group do not support hypothesis 2a. However, results of single
comparisons revealed a group difference in interval 6 (27th second), which typically falls into
the second heart rate acceleration, that can be interpreted in favor of hypothesis 2a, in that
social participants showed a trend towards a higher activation due to a defense stimulus
compared to control participants, which might be interpreted as a higher vasodilatation.
On a descriptive level, a tendency for a typical pattern in pulse within defense could be
found with an increasing vasodilatation within the first four intervals, this means during the
first 16 seconds after the defense stimulus, which is maintained in the social phobic group,
whereas in the control group the initial vasodilatation is followed by a decrease, which
reflects vasoconstriction and again a progressive vasodilatation until the last interval.
In this context from a methodic point of view it should be considered that for interval 6 - and
other intervals - normal distribution of means must not be assumed. However variances
within each interval seemed to be homogeneous, although homogeneity of variances
regarding the complete matrix of variances and covariances must not be assumed.
Discussion
160
5.2.5 Respiration amplitude
Results concerning the non-significant main effect for group and the interaction between
interval and group as well as related single comparisons do not support hypothesis 2a, as
social phobic participants did not show the expected higher respiration amplitude compared
to controls.
On a descriptive level the general tendency for respiration amplitude showed a clear pattern
of increased amplitude within the first 15 seconds after the defense stimulus in interval 1, -
which might be reflected by the significant main effect for intervals - and which tends to
return towards the baseline level during the subsequent two intervals. This reversed trend is
less pronounced within the social phobic participants, but did not reach statistical
significance.
Although not relevant for the hypothesis, there was a significant main effect for gender and a
significant interaction effect between interval and gender. This could be explained by single
comparisons, in that women showed a tendency towards a higher respiration amplitude in
interval 1 compared to men. Although this difference disappeared after adjusting the alpha-
level by Bonferoni, this is congruent with the general finding that women tend to show a
higher heart rate than men in the first acceleration of the cardiac defense reaction (Vila et al.,
2003).
Strictly speaking, it must be mentioned that under a methodic point of view for interval 1
and 2 normal distribution of means must not be assumed, although homogeneity of variances
is given.
5.2.6 Respiration rate
Results concerning the non-significant main effects for group and interval and the non-
significant interaction effect between interval and group do not support hypothesis 2a.
However, results of single comparisons support the hypothesis in that social phobic
participants showed a higher respiration rate in interval 1 compared to control participants.
In addition, on a descriptive level, the general pattern for respiration rate showed a tendency
towards a higher respiration rate for the three intervals in social phobic participants
compared to control participants.
Discussion
161
Although not directly relevant for the hypothesis, there was a main effect for gender as
covariate. When conducting single comparisons women had a lower respiration rate than
men in interval 2 and 3. Controlling for group, this effect was only significant in social
phobic participants in interval 3 but not in controls. These results are congruent with the
general finding of a lower heart rate in women during the second acceleration compared to
men. A further explanation would be, that anxiety might enhance the already existing pattern
in normal subjects. However, strictly speaking differences disappeared after adjusting the
alpha-level by Bonferoni.
Although normal distribution of means must not be assumed for interval 3, not too much
importance should be attached to this. In addition, homogeneity of variances can be
assumed.
5.2.7 Skin conductance
Results concerning the non-significant main effect for group and the non-significant
interaction effect for interval and group do not support hypothesis 2a. Also, results of single
comparisons do not support the expected higher activation due to the defense stimulus, with
one exception: For interval 1, a significant group difference was found, in that social phobic
participants showed a lower skin conductance compared to control participants. This result is
not only against hypothesis 1, it can not be interpreted meaningfully in regard to content, as
skin conductance is a slow-moving response and therefore, no differences should occur
within at least the first interval. From a methodic point of view this result can only be
meaningfully explained by a small variance between groups, the fact that homogeneity of
variances must not be assumed for interval 1 and a different number of data points included
in each of the ten intervals. In addition, for none of the ten intervals normal distribution of
the means must be assumed.
On a descriptive level, the general pattern of the response can be seen in an increase in skin
conductance after the first three seconds after the presentation of the defense stimulus and a
return towards the baseline along the 80 seconds, which might be reflected in the main effect
for intervals. This pattern seemed to be more pronounced in social phobic participants,
although no significant group differences were found except for interval 1, which showed
the opposite direction, as mentioned before. Thus, apart from the unexpected results
concerning group differences in the first interval, results concerning skin conductance do not
Discussion
162
support hypothesis 2a, as social phobic participants compared to control participants did not
show the expected higher activation due to a defense stimulus.
5.2.8 Startle reflex
Social phobic participants showed a more pronounced startle reflex to the defense stimulus
compared to control participants and therefore, results support hypothesis 2a. No differences
were found for the covariate gender. From a methodic point of view, it must not be assumed
that means of startle magnitude are normally distributed, neither that variances are
homogeneous. Thus, results indicate that the greater defense reaction of social phobics is not
limited to autonomic defensive components such as heart rate, as startle is a motor defensive
reflex. It also includes somatic components with different neurophysiological pathways. In
the case of the acoustic motor startle, the neurophysiological mediation is via the nucleus
reticularis pontis caudalis in the brainstem, connecting the cochlea neurons with the
motoneurons in the facial motor nucleus or spinal cord (Lang, Davis & Öhman, 2000). The
simultaneous potentiation of cardiac defense and motor startle in social phobic participants
suggests that both primary neural circuits controlling heart rate and eye blink response are
connected with the same higher neural structures that mediate the defensive motivational
system, such as the central nucleus of the amygdala. From this perspective, the greater
defensive reaction of social phobic participants can be explained by a greater activation of
the defensive motivational system modulating a variety of autonomic and somatic defensive
outputs.
5.2.9 Heart rate variability
Although the non-significant effects concerning the square roots of successive difference
means of heart rate and its reciprocal, heart period and the coefficient of variation for both
heart rate and heart period do not support hypothesis 2b, social phobic participants showed a
significant higher mean heart rate and a lower mean heart period during the last five minutes
of the resting period. This can be interpreted indirectly in favor of the hypothesis, as heart
rate variability tends to correlate negatively with heart rate and positively with heart period
in normal and clinical populations (Thayer, Friedman & Borkovec, 1996; Thayer & Siegle,
2002; Hayano et al., 2000).
From a methodic point of view, normal distribution of means must not be assumed for the
square roots of successive difference means and the coefficient of variation due to heart rate
Discussion
163
nor for the square roots of successive difference means due to heart period. However,
homogeneity of variances can be assumed for all of the parameters measuring heart rate
variability.
The higher heart rate mean found in social phobic participants, together with the tendency
towards a lower heart rate variability, can be interpreted as the consequence of an
interruption of the inhibitory control of the assumed underlying central autonomic network.
Therefore, the prefrontal cortex is assumed to be inhibited which would allow automatic
processes to regulate behavior (see paragraph 2.4.2.2). This can be associated with
hypervigilance, the activation of the defensive behavioral system and a reduced emotional
regulation (Thayer & Siegle, 2002). Similarly, this finding may be interpreted in favor of
fear networks in social phobic participants that are characterized by general apprehension
and hypervigilance (Lang, 1985, 1988).
5.2.10 Summary discussion defense paradigm
In sum, concerning hypothesis 2a, results concerning diastolic blood pressure, respiration
amplitude and skin conductance do not support the assumed elevated physiological defense
response in social phobic participants compared with controls. However, heart rate, systolic
blood pressure, pulse, respiration rate and startle reflex point towards an elevated
physiological defense response and therefore support hypothesis 2a. Although results
concerning the square roots of successive difference means of heart rate and heart period and
the coefficient of variation for both heart rate and heart period do not support directly the
assumed reduced heart rate variability, results due to heart rate and heart period support
indirectly hypothesis 2b that social phobic participants show a reduced heart rate variability.
The evidence towards a lower heart rate variability can be interpreted in terms of the
activation of the defensive behavioral system but also in terms of an underlying fear network
whose structure is characterized by general apprehension, hypervigilance and poor
autonomic control as it can be found not only in depression but also in anxiety (Thayer &
Siegle, 2002). Also, the tendency towards a higher physiological activation with regard to a
defense stimulus in social phobic participants shows that even aversive stimuli that are not
related to social phobic contents lead to the activation of the fear network. This can be
interpreted in terms of a hypervigilance towards even simple stressors, which can lead to the
activation of the underlying fear network and in turn lead to even greater physiological
responses (Lang, 1985, 1988).
Discussion
164
In addition, this interpretation can be assumed equally for women and men, as results
relevant for the hypotheses were controlled anyway for possible gender effects by including
gender as a covariate in each of the analyses. Further, except for respiration amplitude and
respiration rate no significant main effect for gender and no significant interaction effect for
valence and gender were found. As gender differences due to respiration disappeared after
adjusting the alpha-level by Bonferoni, not too much importance should be attached to these
results.
Discussion
165
5.3 Discussion concerning the picture paradigm
5.3.1 Affective rating due to pictures
5.3.1.1 Valence
The non-significant main effect for group and the non-significant interaction effect between
valence and group as well as results related to single comparisons do not support hypothesis
3a, assuming that social phobic participants would rate unpleasant pictures as more
unpleasant compared to controls. With regard to research question 1a, the already mentioned
non-significant results as well as results concerning related single comparisons do not
support group differences due to pleasant and neutral pictures concerning the self-report
towards the dimension of valence.
Although not relevant for the hypothesis, the significant main effect for valence and results
of related single comparisons are in line with previous studies on affective ratings towards
pictures, as pleasant pictures were rated as more pleasant compared to neutral or unpleasant
ones and in that neutral pictures were rated as more pleasant than unpleasant ones. (Bradley
& Lang, 2000; Moltó et al., 1999; Vila et al., 2001).
To be exact, it should be mentioned that from a methodic point of view normal distribution
must not be assumed for means regarding neutral and unpleasant pictures on the dimension
of valence and that homogeneity of variances must not be assumed for the overall matrix of
variances and covariances. However, on the level of single comparisons of variances
homogeneity of variances can be assumed, so that not too much importance should be
attached to this.
5.3.1.2 Arousal
The non-significant main effect for group and the non-significant interaction effect between
valence and group as well as results related to single comparisons do not support hypothesis
3a, assuming that social phobic participants would rate unpleasant pictures as more arousing
compared to controls. With regard to research question 1a, the already mentioned non-
significant results as well as results concerning related single comparisons do not support
group differences due to pleasant and neutral pictures concerning the self-report towards the
dimension of arousal.
Discussion
166
Although not relevant for the hypothesis, the significant main effect for valence and results
of related single comparisons are in line with previous studies on affective ratings towards
pictures, as pleasant and unpleasant pictures were rated as more arousing compared to
neutral ones and no differences were found between pleasant and unpleasant ones (Bradley
& Lang, 2000; Moltó et al., 1999; Vila et al., 2001).
To be precise, it should be mentioned that from a methodic point of view normal distribution
must not be assumed for means regarding pleasant pictures on the dimension of arousal.
However, homogeneity of variances can be assumed for arousal.
5.3.1.3 Dominance
The non-significant main effect for group and the non-significant interaction effect between
valence and group do not support hypothesis 3a. However, results concerning related single
comparisons support hypothesis 3a in that social phobic participants compared to control
participants reported feeling less dominant towards unpleasant pictures. With regard to
research question 1a, the already mentioned non-significant results as well as results
concerning related single comparisons do not support group differences due to pleasant and
neutral pictures concerning the self-report towards the dimension of dominance.
Although not relevant for the hypothesis, the significant main effect for valence and results
of related single comparisons are in line with previous studies on affective ratings towards
pictures, as for pleasant and neutral pictures participants reported feelings of being more in
control and dominant compared to unpleasant pictures and no differences were found
between pleasant and neutral ones. (Bradley & Lang, 1994; Moltó et al., 1999; Vila et al.,
2001).
Strictly speaking, it should be mentioned that from a methodic point of view normal
distribution must not be assumed for means regarding pleasant, neutral and unpleasant
pictures on the dimension of dominance. However, homogeneity of variances can be
assumed for dominance.
Discussion
167
5.3.2 Physiological responses due to pictures
5.3.2.1 Heart rate
The non-significant main effect for group and the non-significant interaction effect between
valence of pictures and group and results of related single comparisons do not support
hypothesis 3b, as social phobic participants did not show the expected elevated heart rate
response compared to control participants. With regard to research question 1b, the above
mentioned non-significant effects do not support group differences. However, results of
single comparisons do support differences in that social phobic participants showed a lower
heart rate compared to controls, at least for neutral pictures, whereas for pleasant pictures
again, no differences were found.
Although not directly relevant for the hypotheses and research questions, no main effect for
valence was found. At least on the levels of valence, significant differences could have been
expected in that pleasant pictures show greatest peak acceleration within the triphasic
pattern, whereas for unpleasant pictures the acceleration peak is often missed, but instead
sustained deceleration across picture interval can be observed (Bradley, Greenwald &
Hamm, 1993).
From a methodic point of view no limitations have to be mentioned concerning normal
distribution of means and homogeneity of variances regarding heart rate.
5.3.2.2 Systolic blood pressure
The non-significant results concerning the main effect for group, the interaction effect
between valence and group and the related single comparisons do not support hypothesis 3b,
as social phobic participants did not show the expected elevated heart rate response
compared to control participants. Concerning pleasant and neutral pictures, research question
1b can be explained in the way that results do not support group differences regarding either
pleasant or neutral pictures.
In addition, no overall effect for gender nor for valence could be found. However, the
interaction effect between valence and gender revealed significant differences. Single
comparisons on the level of picture valence revealed no differences between women and
men concerning unpleasant or neutral pictures, though women showed a lower systolic blood
pressure towards pleasant pictures compared to men. This result is consistent with the
Discussion
168
findings that men show a higher appetitive activation when viewing pleasant, erotic pictures
(Bradley, Codispoti, Sabatinelli & Lang, 2001).
From a methodic point of view no limitations have to be mentioned concerning normal
distribution of means and homogeneity of variances regarding systolic blood pressure.
5.3.2.3 Diastolic blood pressure
Although results concerning the non-significant main effect for group do not support
hypothesis 3b, the significant interaction effect between valence and group and results of
related single comparisons do support hypothesis 3b, as social phobic participants showed
the expected elevated response concerning diastolic blood pressure compared to control
participants. Concerning pleasant and neutral pictures, research question 1b can be explained
as follows: on the one hand the significant interaction effect between valence and group
support group differences and on the other hand the non-significant main effect for group
and also results of single comparisons due to the interaction effect do not support group
differences either for pleasant or for neutral pictures.
In addition, no main effect for valence was found. From a methodic point of view limitations
have to be mentioned in so far as normal distribution must not be assumed, neither for
pleasant nor for neutral nor for unpleasant pictures. Further, homogeneity of variances must
not be assumed for neutral pictures.
5.3.2.4 Pulse amplitude
Although the significant main effect for group seemed to support hypothesis 3b, the non-
significant interaction effect between valence and group as well as results of related single
comparisons do not support hypothesis 3b, as social phobic participants did not differ from
control participants due to pulse amplitude. Concerning research question 1b the non-
significant interaction effect does not support group differences. However, the significant
main effect for group and results of related single comparisons do support them for pleasant
pictures in that social phobic participants showed a lower pulse compared to controls,
whereas for neutral pictures no differences were found.
In addition no overall effect for gender was found, although the interaction between valence
and gender and an overall effect for valence were found to be significant. Single
comparisons on the levels of picture valence did not reveal any differences, so that the
Discussion
169
overall effect for valence could be better explained by the interaction effect between valence
and gender. Women and men did not differ in pulse amplitude concerning neutral and
pleasant pictures after adjusting the alpha-level by Bonferoni. However, women showed a
higher pulse amplitude compared to men for unpleasant pictures. This result is consistent
with findings that women respond with greater defensive reactivity to aversive pictures
regardless of their specific content (Bradley, Codispoti, Cuthbert & Lang, 2001).
From a methodic point of few it should be mentioned that normal distribution must not be
assumed for neutral pictures. However, no limitations have to be mentioned concerning
homogeneity of variances with regard to pulse.
5.3.2.5 Skin conductance
Results concerning the non-significant group effect, the non-significant interaction effect
between valence and group as well as results of related single comparisons do not support
hypothesis 3b, as social phobic participants did not show the expected elevated response in
skin conductance compared to control participants. Also with regard to research question 1b,
results do not support group differences regarding neither pleasant nor neutral pictures.
Although not directly relevant for the hypotheses and research questions, no main effects for
valence were found. At least on the levels of valence, significant differences could be
expected, in that for highly arousing pictures, as for pleasant and unpleasant ones, compared
to low arousing pictures, as in neutral ones an increase in skin conductance could be
observed (see for example, Winton et al., 1984; Manning & Melchiori, 1974).
From a methodic point of view limitations have to be mentioned in so far as normal
distribution must not be assumed, neither for pleasant nor for neutral nor for unpleasant
pictures. However, variances within each of the levels of picture valence seemed to be
homogeneous, although homogeneity of variances regarding the complete matrix of
variances and covariances must not be assumed.
Discussion
170
5.3.2.6 Startle reflex
Although the non-significant interaction effect between valence and group do not support
hypothesis 3b, the significant main effect for group seemed to do so. However, when
controlling for possible tendencies, single comparisons on the levels of valence revealed that
results do not support hypothesis 3b, as social phobic participants did not show the expected
elevated startle response compared to control participants, on the contrary they showed a
smaller startle magnitude. Concerning pleasant and neutral pictures, research question 1b can
be explained by considering the above mentioned effects in the way that results do support
group differences in that social phobic participants show a lower startle magnitude compared
to controls for both, pleasant and neutral pictures.
In addition, no overall effect for valence could be found, which means, that picture valence
could not be differentiated by the pattern usually found for pictures, with a startle
potentiation for unpleasant and a diminuation for pleasant pictures not even across subjects
(Bradley, 2000). Further, a main effect for the covariate gender was found to be significant.
However, single comparisons after adjusting the alpha-level by Bonferoni did not reveal
differences in startle magnitude between women and men within each of the three levels of
picture valence.
From a methodic point of view no limitations have to be mentioned concerning normal
distribution of means and homogeneity of variances regarding startle magnitude.
5.3.3 Summary of the discussion concerning the picture paradigm
Thus, concerning affective rating of unpleasant pictures, the results are mixed and support
hypothesis 3a only partly, as social phobic participants compared to controls did not rate
unpleasant pictures as more unpleasant and more arousing as expected. These results
indicate, that on the level of affective report, unpleasant pictures as aversive stimuli do not
automatically lead to an activation of the fear network in social phobic participants.
However, results concerning single comparisons due to dominance support hypothesis 3a in
that social phobic participants compared to control participants reported feelings of less
dominance towards unpleasant pictures. Concerning pleasant and neutral pictures, research
question 1a can be explained in the way that results do not support group differences
concerning affective report due to pleasant and neutral pictures, on none of the three
dimensions of valence, arousal or dominance.
Discussion
171
Results with regard to physiological activation formulated in hypothesis 3b are also mixed.
With regard to the expected higher physiological activation in social phobic participants due
to unpleasant pictures, only results concerning diastolic blood pressure are clearly in favor of
the hypothesis. Results concerning heart rate, systolic blood pressure, pulse and skin
conductance do not reveal any group differences. These results are rather unexpected, as it
had been assumed that aversive stimuli, like unpleasant pictures, even if not related towards
a social content, might lead to an activation of the fear network in social phobia and thus in a
higher physiological activation. Even more unexpected are these results in view of those
concerning a tendency towards a hyperreactivity in social phobic participants within the
defense paradigm. One can argue that auditory and visual stimuli represent different qualities
and are therefore not directly comparable. In addition, the defense stimulus is not only an
auditory stimulus, but its characteristic is to trigger a defensive reaction, which is not
necessarily true regarding unpleasant pictures. For startle reflex, a group difference was
found although in the opposite of the expected direction, as social phobic participants show a
lower startle magnitude towards unpleasant pictures compared to controls. These results,
which are in contrast to the results concerning startle magnitude towards the defense
stimulus, can be explained when considering the tendency towards a lower heart rate
variability in social phobic participants compared to controls. Other studies found
correlations between a lower heart rate variability and a less differentiated startle effect
towards pleasant, neutral and unpleasant pictures. However, the startle potentiation described
by the authors towards neutral and the marginally potentiation towards positive pictures
could also not be found in this study (see Ruiz-Padial, Sollers, Vila & Thayer, 2003; Thayer
& Siegle, 2002).
Results with regard to physiological activation did not explain research question 1b clearly.
Concerning pleasant pictures, on the one hand results due to heart rate, systolic and diastolic
blood pressure and skin conductance can be interpreted in this way, that social phobic and
control participants do not differ in their physiological response. On the other hand, results
due to pulse and startle reflex might interpreted in the way, that social phobic participants
show a lower physiological response towards pleasant pictures. Concerning neutral pictures,
results due to systolic and diastolic blood pressure, pulse and skin conductance support the
idea that social phobic and control participants do not differ in their physiological response.
However, results due to heart rate and startle reflex might be interpreted in favor of a lower
physiological response in social phobic participants due to neutral pictures. So for pleasant
and neutral pictures it can be summarized that either no group differences concerning
Discussion
172
physiological activation can be found or, if differences were found, social phobic
participants showed a lower physiological activation.
In sum, unpleasant pictures as aversive stimuli do not necessarily lead to an activation of the
fear network in social phobic participants, as physiological activation does not consistently
occur across measured parameters and was found only for diastolic blood pressure. Neither
did the affective report reflect a possible activation of the fear network with the only
exception that unpleasant pictures seemed to evoke more intense feelings of being less in
control in social phobic participants. The latter results can also be explained in the context of
more severe depressive symptomatology, as symptoms of depression are often positively
correlated with feelings of being out of control (Weinmann, Bader, Endrass & Hell, 2001).
Pleasant and neutral pictures lead to a similar pattern, namely no differences in affective
rating and no consistent differences concerning measured physiological parameters, although
some of them, like pulse and startle reflex towards pleasant pictures as well as heart rate and
startle reflex towards neutral pictures, indicate a lower physiological activation for social
phobic participants. Interestingly for none of the physiological variables a significant main
effect for valence was found in contrast to the valence effect found for affective rating of
pictures. This points towards a discordance between affective rating and physiological
reactivity on the levels of valence towards the stimulus material and might be interpreted in
the way that the fear network in social phobic participants not only remained inactivated, but
that they might also have a tendency towards a hyporeactivity towards more complex stimuli
like pictures in general which will be discussed below in more detail (see paragraph 5.5).
In addition, this interpretation can be assumed for women and men, as results relevant for the
hypotheses and research questions were controlled anyway by including gender as a
covariate in each of the analyses. Further, except for systolic blood pressure, pulse and
startle, no significant main effects for gender and no significant interaction effects between
gender and valence were found. Concerning gender differences due to the mentioned
parameters, they are in line with previous findings indicating a higher physiological
activation for women due to unpleasant and for men due to pleasant pictures.
Discussion
173
5.4 Discussion concerning the imagery paradigm
5.4.1 Affective rating due to scenes
5.4.1.1 Valence
Although no overall group effect was found on the dimension of valence, which does not
support hypothesis 4 that social phobic participants would rate fear-related scenes as more
unpleasant, as opposed to the interaction effect between valence and group and the
interaction effect between valence, type of scene and group were found to be significant and
can be interpreted in favor of the hypothesis. On the level of single comparisons results
again are mixed. Not conform with the hypothesis are the results, that social phobic
participants did not differ from controls due to fear-related scenes in general and that they
rated fear-related personalized scenes as more pleasant compared to controls. However, the
result that fear-related standardized scenes are rated more unpleasant by social phobic
participants compared to controls can be interpreted in line with hypothesis 4.
With regard to research question 2, although no overall group difference was found, both
significant interaction mentioned above, can be interpreted that social phobic and control
participants differ in their affective rating at least due to neutral scenes. Although, on the
level of single comparisons no group differences were found for pleasant scenes in general
nor when differentiating for standardized versus personalized scenes, neutral scenes were
rated as less pleasant by social phobic participants compared to controls. This pattern could
be explained by neutral personalized scenes, as no group differences were found for
standardized scenes. To be precise, for all results concerning affective rating due to valence
it should be mentioned that from a methodic point of view normal distribution must not be
assumed for all means except for neutral personalized scenes. However, homogeneity of
variances can be assumed. Concerning pleasant and neutral scenes, research question 2 can
be explained in the way that results do not support group differences but only regarding
neutral standardizes scenes, that were rated as more unpleasant by social phobic participants
compared to controls.
Although not relevant for the hypothesis nor the research question, first, a significant overall
effect was found for valence which revealed on the level of single comparisons that pleasant
scenes were rated as more pleasant compared to neutral or fear-related ones and that neutral
scenes were also rated as more pleasant compared to fear-related ones. As scenes had not
Discussion
174
been validated before, like the picture material, these results confirm the a priori assumed
valence of scenes and can be seen in line with results of other studies due to imagery
material (Cuthbert et al., 2003) and also to picture valence (Bradley & Lang, 2000; Moltó et
al., 1999; Vila et al., 2001). Second, although a significant effect for gender as covariate and
a significant interaction effect between valence and gender were found, on the levels of
single comparisons no differences could be found between women and men due to the three
levels of valence, except a tendency for neutral scenes, where women rated neutral scenes as
more pleasant than men. As this effect disappeared when correcting the alpha-level by
Bonferoni, there seemed to be no clear gender differences due to the affective rating of
valence. As gender was included as covariate, results not concerning gender are controlled
anyway for the possible influence gender might have had as a variable.
5.4.1.2 Arousal
Neither the main effect for group, nor the interaction effect between valence and group, nor
the interaction effect between valence, type of scene and group were significant and not even
a tendency due to group differences on the level of single comparisons for arousal were
found to be significant and therefore, these results do not support hypothesis 4 that social
phobic participants would rate fear-related scenes as more arousing compared to controls.
However, a tendency on the level of single comparison for valence, type of scene and group
are in favor of hypothesis 4 as social phobic participants rated fear-related standardized
scenes as more arousing compared to control participants. This effect was not found for fear-
related personalized scenes, which contrast results of other studies, in which personalized
scenes were rated as more arousing than standardized ones (Cuthbert et al., 2003).
With regard to research question 2 the fact that neither an overall group effect, nor a
significant interaction effect between valence and group, nor a significant interaction effect
for valence, type of scene and group were found; neither tendencies on the level of single
comparisons, indicate that social phobic participants do not differ from control participants
due their affective rating on the dimension of arousal concerning pleasant and neutral scenes.
However, one exception was found pointing towards a group difference. On the level of
single comparisons, social phobic participants rated neutral standardized scenes as more
arousing compared to control participants. To be precise, for all results concerning affective
rating due to arousal it should be mentioned that from a methodic point of view normal
distribution must not be assumed for either of the means. However, homogeneity of
variances can be assumed for all scenes, except for neutral standardized ones.
Discussion
175
Thus, concerning fear-related scenes, results support hypothesis 4 only with regard to the
results concerning fear-related standardized scenes in the way that social phobic participants
rated them as more arousing compared to controls. Concerning pleasant and neutral scenes,
research question 2 can be explained in the way that result do support group differences but
only with regard to neutral standardized scenes, that were rated as more arousing by social
phobic participants compared to controls.
Although not relevant for the hypothesis nor the research question, a significant overall
effect was found for valence which revealed on the level of single comparisons that pleasant
scenes were rated as more arousing compared to neutral scenes and that fear-related scenes
were also rated as more arousing compared to neutral ones, whereas no differences were
found due to arousal concerning pleasant and fear-related scenes. As scenes had not been
validated before like the picture material, these results are in line with the rating concerning
the pictures material (see Bradley & Lang, 2000; Moltó et al., 1999; Vila et al., 2001) and
also with results of studies that included imagery material (see Cuthbert et al., 2003) that
pleasant and fear-related scenes should be rated as more arousing but not so neutral ones.
5.4.1.3 Dominance
Neither the main effect for group, nor the interaction effect between valence and group, nor
the interaction effect between valence, type of scene and group were significant. As
additionally single comparisons did not reveal any group differences for fear-related scenes
in general, nor for fear-related standardized or personalized scenes, are clearly against
hypothesis 4a that social phobic would report feelings of being less in control and less
dominant concerning fear-related scenes.
With regard to research question 2 the fact that no significant overall effect, no effect on the
level of the interactions nor on the level of single comparisons revealed any group
difference, it can be concluded that social phobic and control participants do not differ due to
their ratings on the dimension of dominance concerning pleasant or neutral scenes. To be
exact, it must be mentioned, that for all results concerning affective ratings due to
dominance it should be mentioned that form a methodic point of view normal distribution
must not be assumed only for pleasant personalized scenes. However, homogeneity of
variances can be assumed for all scenes.
Discussion
176
Thus, results concerning fear-related scenes do not support hypothesis 4, as no differences
were found between groups due to their rating concerning dominance. Concerning pleasant
and neutral scenes, research question 2 can be explained in the way that results do not
support group differences.
Although not relevant for the hypothesis nor the research question, a significant overall
effect was found for valence, which revealed on the level of single comparisons for pleasant
scenes that subjects felt more in control and more dominant compared to fear-related ones.
Also, subjects felt more in control due to neutral scenes compared to fear-related ones,
whereas for neutral and pleasant scenes no differences were found. As scenes had not been
validated before like the picture material, these results are in line with results concerning
picture material (see Bradley & Lang, 2000; Moltó et al., 1999; Vila et al., 2001) and also
with results of studies that included imagery material (see Cuthbert et al., 2003), that
pleasant and neutral scenes should be correlated with feelings of being in control, whereas
fear-related scenes are correlated with feelings of being out of control or less in control.
5.4.2 Physiological responses due to scenes
5.4.2.1 Heart rate
Neither the main effects for group, valence, type of scene and period, nor the interaction
effects between valence and group, between valence, period and group and between valence,
period, type of scene and group nor single comparisons revealed any group differences.
These results are against hypothesis 5 assuming that social phobic participants would show
an elevated physiological response concerning heart rate due to fear-related scenes during
the imagery period. As the heart is innervated by the sympathetic and parasympathetic
system (see Stern et al., 2001), these results can be interpreted in this way that social phobics
compared to controls do not show an elevated activation of the autonomous nervous system,
which is discussed controversially in the literature (see paragraph 2.2.5.4; Hermann, 2002).
With regard to research question 3a and 3b these results indicate that neither social phobic
participants nor control participants showed a more pronounced elevated physiological
response concerning heart rate when comparing fear-related standardized versus
personalized scenes during the imagery period.
Discussion
177
With regard to research question 4, there were three male social phobic participants who
showed an elevated physiological response towards pleasant scenes - defined as the
deviation of one or more standard deviations above the social phobic group mean. Further,
five social phobic participants, three women and two men showed an elevated physiological
response towards neutral scenes. This might reflect an already activated fear structure
influencing further the processing in terms of the priming-hypothesis (see paragraph 2.4.2).
With regard to research questions 5 and 6 the above mentioned results indicate that social
phobic participants do not differ from controls due to heart rate concerning fear-related
scenes neither during the presentation period nor during the post-interval.
Concerning pleasant and neutral pictures and therefore referring to research questions 7a, 7b
and 7c the above mentioned results indicate that social phobic participants do not differ from
control participants concerning heart rate due to pleasant or neutral scenes, neither during the
presentation period, the imagery period nor during the post-interval.
For all results concerning heart rate it should be mentioned that from a methodic point of
view rather no limitations have to be drawn as normal distribution can be assumed for all
means, except for pleasant standardized scenes during the post-interval. In addition,
homogeneity of variances can be assumed except for pleasant standardized scenes during the
imagery period.
Thus results are mixed as they neither support hypothesis 5 assuming a higher heart rate for
social phobic participants compared to controls due to fear-related scenes during imagery,
nor do they confirm research question 3a and 3b towards differences in heart rate when
comparing fear-related personalized versus standardized scenes during imagery for both
groups, nor research questions 5 or 6 towards group differences in heart rate regarding fear-
related scenes during the presentation period and the post-interval nor research questions 7a,
7b and 7c in terms of group differences towards heart rate for pleasant and neutral scenes
within each of the three levels of period. Concerning research question 4, there were social
phobic participants who showed an elevated physiological response concerning heart rate
due to pleasant and neutral scenes.
Although not directly relevant for the hypotheses and research questions, no significant main
effect for valence was found which is not in line with other studies comparing heart rate
across different categories of imagined scenes. So, for example, a higher heart rate reactivity
was found for active versus passive scenes, which could be seen as corresponding to
Discussion
178
unpleasant and pleasant scenes compared with neutral ones (see Jones & Johnson, 1978;
Jones & Johnson, 1980) and also for personally experienced scenes compared to those, that
are not as personally relevant (see Miller et al., 1987). This is also against the findings of
Grayson (1982) who reported a higher defensive response concerning heart rate when
comparing fear-related scenes compared to neutral ones and against the findings of several
other studies, where heart rate increased with increasing arousal due to scenes (see also
Fiorito, Simons, 1994; vanOyen Witvliet & Vrana, 1995). This contradicts the findings of
Cuthbert and colleagues who found that social phobics, simple phobics and controls showed
a similar reactivity towards fear imagery and interpreted this in favor of a normal
functioning defense motive system with appropriate arousal for fear cues (Cuthbert et al.,
2003). In contrast, results replicate the finding of McNeil and colleagues who found heart
rate reactivity positively correlated with reports of affective distress in specific but not in
social phobics (McNeil et al., 1993).
5.4.2.2 Systolic blood pressure
Although the significant overall effect for group seemed to support hypothesis 5, the non-
significant main effect for valence and period, as well as the non-significant interaction
effect between valence, period and group and even when taking into account single
comparisons focusing only on the imagery period, where both groups did not differ in
systolic blood pressure with regard to fear-related scenes and therefore again do not support
hypothesis 5, assuming that social phobic participants would show a higher systolic blood
pressure towards fear-related scenes during the imagery period compared to controls.
With regard to research question 3a and 3b, although the above mentioned non-significant
results due to main effects concerning valence, type of scene and period and the non-
significant interaction effect between valence, period, type of scene and group seemed to
point towards no differences, results of related single comparisons indicate that both, social
phobic participants and controls showed a more pronounced elevated physiological response
concerning systolic blood pressure when comparing personalized versus standardized fear-
related scenes during the imagery period.
With regard to research question 4, there were three social phobic participants, one woman
and two men, who showed an elevated physiological response - defined as the deviation of
one or more standard deviations above the social phobic group mean - towards pleasant
scenes. Further, two social phobic participants, one woman and one man, showed an
Discussion
179
elevated response towards neutral scenes, which again might reflect an already activated fear
structure influencing further the processing in terms of the priming-hypothesis (see
paragraph 2.4.2).
With regard to research question 5 and 6, although the above mentioned non-significant
main effect for valence and period and the non-significant interaction effect between
valence, period and group do not support group differences concerning systolic blood
pressure due to fear-related scenes during the post-interval, the main effect for group and
results of single comparisons comparing groups on the level of valence within each period,
indicate that social phobic participants differ from controls, both during the presentation and
the post-interval period, in so far as they showed a lower systolic blood pressure towards
fear-related scenes.
Concerning pleasant and neutral scenes and therefore referring to research questions 7a, 7b
and 7c, although there was a significant main effect for group, the non-significant main
effects for valence and period and the non-significant interaction effect between valence,
period and group do not support group differences concerning systolic blood pressure due to
pleasant or neutral scenes neither during the presentation, nor during the imagery nor during
the post-interval period. For results concerning pleasant scenes single comparisons confirm
this. However, for neutral scenes single comparisons speak in favor of group differences as
social phobic participants showed a significantly lower systolic blood pressure during the
presentation, the imagery and the post-interval period compared to controls.
In addition, interpretations concerning results with regard to hypothesis 5 and research
questions 5, 6 and 7a to 7c are supported by the non-significant interaction effect between
valence and group and related single comparisons, revealing a lower systolic blood pressure
concerning fear-related and neutral scenes, but no differences for pleasant scenes.
Strictly speaking, for all results concerning systolic blood pressure it should be mentioned
that from a methodic point of view normal distribution of means must not be assumed for
pleasant personalized scenes during the presentation period, for fear-related standardized
scenes during presentation period, the imagery and the post-interval period, for fear-related
personalized scenes and neutral standardized during the imagery period. Concerning the
overall matrix of variances and covariances homogeneity of variances must not be assumed
for systolic blood pressure. This should not be given too much importance, as on the level of
single comparisons homogeneity of variances can be assumed.
Discussion
180
5.4.2.3 Diastolic blood pressure
Although the significant main effect for period might be seen in favor of hypothesis 5, the
non-significant main effects for group and valence and the non significant interaction effect
between valence, period and group and results of related single comparisons revealing no
group differences for fear-related scenes within the imagery-period do not support
hypothesis 5 assuming that social phobic participants would show a higher diastolic blood
pressure towards fear-related scenes during the imagery period compared to controls.
With regard to research question 3a and 3b, although the significant main effect for period
and the significant interaction effect between valence, period, type of scene and group can be
interpreted in favor of differences, the related single comparisons do not support any
differences in diastolic blood pressure when comparing fear-related personalized versus
standardized scenes during the imagery period in neither of both groups.
With regard to research question 4, there are three social phobic participants, one woman
and two men, who showed an elevated physiological response regarding diastolic blood
pressure - defined as the deviation of one or more standard deviations above the social
phobic group mean - towards pleasant scenes. Further, four social phobic participants, two
women and two men, showed an elevated response towards neutral scenes, which again
might reflect an already activated fear structure influencing further the processing in terms of
the priming-hypothesis (see paragraph 2.4.2).
With regard to research question 5 and 6, although there was a significant main effect for
period which might be interpreted in favor of differences, the non-significant main effects
for group and valence and the non-significant interaction effect between valence, period and
group as well as results concerning related single comparisons do not support group
differences due to diastolic blood pressure regarding fear-related scenes neither during the
presentation nor during the post-interval period.
Concerning pleasant and neutral scenes and therefore referring to research questions 7a, 7b
and 7c, the non-significant main effects for group and valence and the non-significant
interaction effect between valence, period and group as well as results of related single
comparisons do not support group differences concerning diastolic blood pressure due to
pleasant or neutral scenes within each of the three levels of period, the significant main
effect for period and the results of single comparisons concerning possible group differences
on the levels of valence within each level of period, support differences in that social phobic
Discussion
181
participants showed a lower diastolic blood pressure for neutral scenes during the
presentation period and a higher diastolic blood pressures for pleasant scenes during the
imagery period compared to controls. However, further results of single comparisons do not
support group differences for pleasant scenes neither during the presentation nor during the
post-interval period nor for neutral scenes neither during the imagery nor the post-interval
period.
In addition, interpretations concerning results with regard to hypothesis 5 and research
questions 5, 6 and 7a to 7c are supported by single comparisons between valence and group,
revealing no group differences for none of the three levels of valence, although the
interaction effect was significant.
To be precise, for all results concerning diastolic blood pressure it should be mentioned that
from a methodic point of view normal distribution for means must not be assumed for
pleasant personalized scenes during the presentation period, for fear-related personalized
scenes during the presentation period and the post-interval and for neutral standardized and
personalized scenes during imagery. Concerning the overall matrix of variances and
covariances homogeneity of variances must not be assumed for diastolic blood pressure.
This should not be given too much importance as on the level of single comparisons
homogeneity of variances can be assumed except for pleasant personalized scenes during
imagery.
Although not directly relevant for the hypotheses nor the research questions, the significant
main effect for period revealed on the level of single comparisons a higher diastolic blood
pressure during the presentation compared to the post-interval period, which might be
explained by a higher arousal due to stimulus presentation, whereas in the post-interval
period subjects might be more relaxed. The significant main effect for gender as covariate
and the significant interaction effect between period might be explained further through the
results of single comparisons revealing a lower diastolic blood pressure for women
compared to men but only during the post-interval. This might be interpreted in that women
relax more easily and therefore reach the physiological starting level more easily after
having imagined a scene compared to men.
Discussion
182
5.4.2.4 Pulse amplitude
The non-significant main effects for group, valence and period, the non-significant
interaction effect between valence, period and group as well as results of related single
comparisons do not support hypothesis 5 assuming that social phobic participants would
show a higher pulse amplitude towards fear-related scenes during the imagery period
compared to controls.
With regard to research questions 3a and 3b, the non-significant main effects for valence,
period and type of scene and the non-significant interaction effect between valence, period,
type and group as well as results for single comparisons do not support a more pronounced
elevated physiological arousal concerning pulse when comparing personalized versus
standardized fear-related scenes during the imagery period, neither for social phobic
participants nor for controls.
With regard to research question 4, there were three social phobic participants, one woman
and two men, who showed an elevated physiological response - defined as the deviation of
one or more standard deviations above the social phobic group mean - towards pleasant
scenes. Further, three social phobic participants, two women and one man, showed an
elevated response towards neutral scenes, which again might reflect an already activated fear
structure influencing further the processing in terms of the priming-hypothesis (see
paragraph 2.4.2).
With regard to research questions 5 and 6, the non-significant main effects for group,
valence and period, the non-significant interaction effect between valence, period and group
as well as results of related single comparisons do not support group differences concerning
pulse due to fear-related scenes neither during the presentation period nor during the post-
interval period.
Concerning pleasant and neutral scenes and therefore referring to research questions 7a, 7b
and 7c, the non-significant main effects for group, valence and period and the non-
significant interaction effect between valence, period and group do not support group
differences concerning pulse due to pleasant or neutral scenes neither during the
presentation, the imagery nor during the post-interval period. For results concerning neutral
scenes single comparisons confirm this. However, for pleasant scenes single comparisons
confirm this only for the imagery and the post-interval period. Results concerning the
Discussion
183
presentation period speak in favor of group differences as social phobic participants showed
a higher pulse compared to controls.
In addition, interpretations concerning results with regard to research questions 7a to 7c are
supported by the significant interaction effect between valence and group, although related
single comparisons on the levels on valence did not reveal any differences.
Strictly speaking, for all results concerning pulse it should be mentioned that from a
methodic point of view normal distribution for means must not be assumed. However,
homogeneity of variances can be assumed except for pleasant standardized scenes during the
imagery period.
5.4.2.5 Respiration amplitude
Although the non-significant main effect for valence and period and the non-significant
interaction effect between valence, period and group do not support hypothesis 5, the
tendency towards a significant main effect for group and results of related single
comparisons support hypothesis 5 in that social phobic participants showed a higher
respiration amplitude for fear-related scenes during imagery compared to controls.
With regard to research questions 3a and 3b, the non-significant main effects for valence,
period and type as well as the non-significant interaction effect between valence, period,
type of scene and group do not support any differences. However single comparisons do
support differences in terms of a higher respiration amplitude when comparing fear-related
personalized versus standardized scenes during the imagery period, but only for social
phobic participants, as no differences were found for controls.
With regard to research question 4, there was one male social phobic participant who
showed an elevated physiological response regarding respiration amplitude - defined as the
deviation of one or more standard deviations above the social phobic group mean towards
pleasant scenes. Further, three male social phobic participants showed an elevated response
towards neutral scenes, which again might reflect an already activated fear structure
influencing further the processing in terms of the priming-hypothesis (see paragraph 2.4.2).
With regard to research question 6, although there was a tendency towards a significant main
effect for group, the non-significant main effect for valence and period and the non-
significant interaction effect between valence, period and group as well as the results of
Discussion
184
related single comparisons do not support a group difference for fear-related scenes during
the post-interval period.
Concerning pleasant and neutral scenes and therefore referring to research questions 7b and
7c, results are mixed. The non-significant main effect for valence and period and the non-
significant interaction effect between valence, period and group do not support group
differences. However, the tendency towards a significant main effect for group and results of
related single comparisons at least partly support differences, in that social phobic
participants showed a tendency towards a higher respiration amplitude for pleasant and
neutral scenes during the imagery period, but not so during the post-interval, where no group
differences were found.
In addition, interpretations concerning results with regard to research questions 7b and 7c are
also supported by the non-significant interaction effect between valence and group and the
non-significant results concerning related single comparisons. This might reflect the above
mentioned mixed results. Further, the significant main effect for the covariate gender and
also single comparisons between valence and gender, should not ascribed too much
significance, as all results which are relevant for the hypotheses and research questions are
controlled by the influence the gender might have had on results and that gender differences
within the single comparisons disappeared when controlling the alpha-level by Bonferoni.
To be precise, for all results concerning respiration amplitude it should be mentioned that
from a methodic point of view normal distribution for means must not be assumed.
Concerning the overall matrix of variances and covariances homogeneity of variances must
not be assumed for respiration amplitude. It should not be accorded too much importance to
this as on the level of single comparisons homogeneity of variances can be assumed, except
for pleasant standardized scenes during the imagery and pleasant personalized scenes during
the post-interval period.
5.4.2.6 Respiration rate
The non-significant main effects for group, valence and period as well as the non-significant
interaction effect between valence, period and group and results of related single
comparisons revealing no group differences for fear-related scenes within the imagery period
do not support hypothesis 5 assuming that social phobic participants would show a higher
respiration rate compared to controls.
Discussion
185
With regard to research questions 3a and 3b, the non-significant main effects for valence,
period and type of scene as well as the non-significant interaction effect between valence,
period, type of scene and group do not support any differences. However, single
comparisons do support differences in terms of a higher respiration rate when comparing
fear-related personalized versus standardized scenes during the imagery period, but only for
control participants, as no differences were found for social phobic participants.
With regard to research question 4, there were four male social phobic participants who
showed an elevated physiological response regarding respiration rate - defined as the
deviation of one or more standard deviation above the social phobic group mean towards
pleasant scenes. Further, two male social phobic participants showed an elevated response
towards neutral scenes, which again might reflect an already activated fear structure
influencing further the processing in terms of the priming-hypothesis (see paragraph 2.4.2).
With regard to research question 6, the non-significant main effects for group, valence and
period as well as the non-significant interaction effect between valence, period and group
and results of related single comparisons revealing no group differences for fear-related
scenes within the imagery period do not support group differences for fear-related scenes
during the post-interval period.
Concerning pleasant and neutral scenes and therefore referring to research questions 7b and
7c, results are mixed. The non-significant main effects for group, valence and period and the
non-significant interaction effect between valence, period and group as well as a part of the
results of related single comparisons do not support group differences neither for neutral
scenes during the imagery period nor during the post-interval period and neither for pleasant
scenes during the post-interval period. However, single comparisons concerning pleasant
scenes during the imagery period can be construed in favor of group differences, as social
phobic participants showed a tendency towards a higher respiration amplitude.
In addition, interpretations concerning results with regard to research question 7b and 7c are
also supported by the tendency towards a significant interaction effect between valence and
group and the non-significant results concerning single comparisons. This might reflect the
above mentioned mixed results. Further, the significant main effect for the covariate gender,
the significant interaction effect between valence and gender and related single comparisons
revealing a significant lower respiration rate for women compared to men, even when the
alpha-level was corrected by Bonferoni, can be interpreted in this way that men show an
Discussion
186
increased appetitive activation, paralleling the findings due to pictures (see Bradley,
Codispoti, Sabatinelli & Lang, 2001), although scenes did not contain erotic contents.
Strictly speaking, for the interpretations of results concerning respiration rate it should be
mentioned that from a methodic point of view normal distribution for means must not be
assumed, except for neutral personalized scenes during the imagery-period. Concerning the
overall matrix of variances and covariances homogeneity of variances must not be assumed
for respiration rate. This should not be accorded too much significance as on the level of
single comparisons homogeneity of variances can be assumed, except for neutral
standardized and personalized scenes during the imagery period.
5.4.2.7 Skin conductance
Neither the main effects for group, valence, type of scene and period, nor the interaction
effects between valence and group, between valence, period and group and between valence,
period, type of scene and group, nor single comparisons revealed any group differences, with
one exception that will be discussed below concerning research questions 3a and 3b. These
results are not consistent with hypothesis 5 assuming that social phobic participants would
show an elevated physiological response concerning skin conductance due to fear-related
scenes during the imagery period. With regard to research questions 3a and 3b only single
comparisons support differences in terms of a higher skin conductance for fear-related
personalized compared to standardized scenes during imagery, for both groups.
With regard to research question 4, there were two social phobic participants, one woman
and one man, who showed an elevated physiological response concerning skin conductance
towards pleasant scenes - defined as the deviation of one or more standard deviations above
the social phobic group mean. Further, three social phobic participants, two women and one
man, showed an elevated skin conductance towards neutral scenes. This might reflect an
already activated fear structure influencing further the processing in terms of the priming-
hypothesis (see 2.4.2).
With regard to research questions 5 and 6, the above mentioned results indicate that social
phobic participants do not differ from controls due to skin conductance concerning fear-
related scenes neither during the presentation nor during the post-interval period.
Discussion
187
Concerning pleasant and neutral pictures and therefore referring to research questions 7a, 7b
and 7c, the above mentioned results indicate that social phobic participants do not differ
from control participants concerning skin conductance due to pleasant or neutral scenes,
neither during the presentation, the imagery nor during the post-interval period.
To be exact, for the interpretations of results concerning skin conductance it should be
mentioned that from a methodic point of view, normal distribution for means must not be
assumed. However, homogeneity of variances can be assumed for all scenes.
Although not directly relevant for the hypotheses and research questions, no significant main
effect for valence was found which is not in line with other studies comparing skin
conductance across different categories of imagined scenes. So, for example, a higher skin
conductance was found for active versus passive scenes, which could be seen as
corresponding to unpleasant and pleasant scenes compared with neutral ones (see Jones &
Johnson, 1978; Jones & Johnson, 1980) and also for personally experienced scenes
compared to those, that are not as personally relevant (see Miller et al., 1987). This is also
against the findings of Grayson (1982) who reported a higher defensive response concerning
skin conductance when comparing fear-related scenes compared to neutral ones and against
the findings of Cuthbert and colleagues who found that social phobics, simple phobics and
controls showed a similar reactivity towards fear imagery and interpreted this as a generally
normal functioning defense motive system with appropriate arousal for fear cues (Cuthbert
et al., 2003). Further, as skin conductance provides a representation of sympathetic activity
(see paragraph 2.4.25; Dawson, Schell & Filion, 2000) and as it should be most responsive
compared to other parameters in terms of a reaction towards a stimulus that elicit anxiety,
but in which no active avoidance can be made, skin conductance data of this study cannot be
interpreted in terms of an activated fear network, that would include several neuronal
pathways (see paragraph 2.4.2.5; Dawson, Schell & Filion, 2000; Tranel & Damasio, 1994).
5.4.2.8 Startle reflex
The non-significant main effects for group and valence and the non-significant interaction
effect between valence and group as well as results of related single comparisons revealing
no group differences do not support hypothesis 5 assuming that social phobic participants
would show an augmented startle reflex compared to controls.
Discussion
188
With regard to research questions 3a and 3b, although the significant main effect for type of
scene might be a hint towards differences, the non-significant main effect for valence and the
non-significant interaction effect between valence, type of scene and group as well as related
single comparisons do not support any differences in startle reflex when comparing fear-
related personalized versus standardized scenes in neither of the groups.
With regard to research question 4, there were three male social phobic participants, who
showed an elevated physiological response regarding startle reflex - defined as the deviation
of one or more standard deviations above the social phobic group mean towards pleasant
scenes. Further, two male social phobic participants showed an elevated response towards
neutral scenes, which again might reflect an already activated fear structure influencing
further the processing in terms of the priming-hypothesis (see paragraph, 2.4.2).
Concerning pleasant and neutral scenes and therefore referring to research question 7b, the
non-significant main effects for group and valence and the non-significant interaction effect
between valence and group as well as related results of single comparisons do not support
group differences concerning startle reflex due to pleasant or neutral scenes.
Although not directly relevant for the hypotheses and research questions, no significant main
effect for valence was found which is not in accordance with other studies comparing the
startle reflex across different categories of imagined scenes. So, for example, a startle
potentiation could be observed for fear-related scenes compared to neutral ones and for
highly arousing unpleasant compared to low arousing unpleasant scenes (see Bradley,
Cuthbert & Lang, 1996; Vrana & Lang, 1990). Potentiation for fear-related compared to
neutral scenes and inhibition for pleasant scenes could be found. (Cook et al., 1991; Cuthbert
et al., 2003). In addition, an augmentation of the startle potentiation, in both pleasant and
unpleasant images were found, when highly arousing or personally relevant scenes were
used (Bradley, Gianaros & Lan, 1995). These results are also not consistent with the findings
of Cuthbert and colleagues, who found a startle potentiation for social phobic and control
participants when comparing startle magnitude across the levels of valence. Interestingly,
they reported that the potentiation effect disappeared for social phobic participants, when
excluding specific social phobics from the group (Cuthbert et al., 2003). They also found
consistent with the results found by Cook and colleagues as well as McNeil and colleagues
(Cook et al., 1988; McNeil et al., 1993) that startle potentiation was more pronounced for
focal phobics compared to other anxiety disorders and for patients with no anxiety disorders
Discussion
189
respectively, concluding that startle potentiation seem to depend also on diagnosis and
negative affect.
Although not directly relevant for hypotheses and research questions, the significant
interaction effect between type and gender could not be further explained by results of
related single comparisons. Even though women showed an augmented startle reflex for
standardized compared to personalized scenes after adjusting the alpha-level by Bonferoni
this effect disappeared.
For the interpretations of results concerning the startle reflex it should be mentioned that
from a methodic point of view normal distribution for means can be assumed, except for
neutral personalized scenes. Further, homogeneity of variances can be assumed as well.
5.4.3 Summary of the discussion concerning the imagery paradigm
Concerning hypothesis 4 which assumes that social phobic participants would judge fear-
related scenes as more unpleasant, more arousing and that they would report feelings of less
dominance compared to control participants, results are mixed. Only by considering the type
of scene, results showed the expected pattern as social phobic participants rated fear-related
standard scenes as more unpleasant and more arousing. Results concerning the dominance
rating do not support hypothesis 4 as no group differences were found. So, the affective
rating towards fear-related scenes do not seem to correspond to a higher activation of the
assumed underlying fear network in social phobics.
Concerning research question 2, results which support differences refer only to neutral
scenes, and differentiating for type of scene, only for neutral personalized ones, which are
rated as more unpleasant by social phobic participants compared to controls. Only by
considering the type of scene, results support group differences referring to neutral
standardized scenes, which are rated as more arousing by social phobic participants. Apart
from that, results do not support any group differences with regard to affective report
towards pleasant and neutral scenes.
With regard to hypothesis 5, only results concerning respiration amplitude support the
assumed higher physiological activation in social phobic participants due to fear-related
scenes during the imagery period, whereas results concerning heart rate, systolic and
diastolic blood pressure, pulse, respiration rate, skin conductance and startle reflex did not
reveal any group differences and hence do not support hypothesis 5. As it was assumed that
Discussion
190
the networks of social phobic participants would have more elaborated stimulus, response
and meaning propositions and deeper associative connections than networks relating to
general feared situations, aspects that might contribute to this non-activation or even
hyporeactivity, will be discussed below, together with similar results obtained in the picture
paradigm.
Pertaining to research question 3a, results concerning heart rate, diastolic blood pressure,
pulse, respiration rate and startle do not support a difference within the social phobic group
in their physiological activation due to personalized versus standardized fear-related scenes
during the imagery period. However, results due to systolic blood pressure and respiration
amplitude speak in favor of a more pronounced physiological response. Nearly the same
pattern was found concerning research question 3b. Results concerning heart rate, diastolic
blood pressure, pulse, respiration amplitude and startle reflex do not support a difference
within the control group in the physiological activation due to personalized versus
standardized fear-related scenes during the imagery period. However, results due to systolic
blood pressure and respiration rate speak in favor of a more pronounced physiological
response. Thus, results are mixed and support partly the assumption that personalized scenes
should match propositions of the network more accurately and therefore enhance the
probability of network activation. On the other hand, results also support the assumption that
standardized scenes describe social situations in a way, that they should contain sufficient
features that match the network propositions so that they could serve as well as an activating
stimulus.
With regard to research question 4, there were social phobic participants who showed an
elevated physiological response concerning all measured parameters due to pleasant and
neutral scenes during the imagery period. Interestingly for pleasant scenes there were four
times more men represented than women. These results can be interpreted in terms of an
already activated fear structure that might influence further processing in terms of the
priming-hypothesis (see paragraph 2.4.2.6).
Pertaining to research question 5, results concerning heart rate, diastolic blood pressure,
pulse and skin conductance do not support any group differences due to fear-related scenes
during the presentation period. However, a group difference is supported by the result
concerning systolic blood pressure, with a lower physiological activation for social phobic
participants compared to controls. Thus, results are mixed. As group differences are only
found in systolic blood pressure, it remains open if this difference can be interpreted as
Discussion
191
hyporeactivity of the network. It seems more likely that these relative complex stimuli and
meaning associations need sufficient time to be activated or as they are not activated
consistently during the imagery period, they might be characterized rather by vigilance in
general.
With regard to research question 6, the same pattern can be found for fear-related scenes
during the post-interval period, with the only difference being that in addition results
concerning respiration amplitude and respiration rate have to be considered; none of them
support a group difference.
Concerning research question 7a, results concerning heart rate, systolic and diastolic blood
pressure and skin conductance do not support group differences concerning pleasant scenes
during the presentation period. However, results concerning pulse point towards a group
difference as social phobic participants showed a higher pulse compared to controls. With
regard to neutral scenes, results due to heart rate, pulse and skin conductance do not support
group differences, whereas results concerning systolic and diastolic blood pressure point
towards a group difference, as social phobics showed a lower systolic and diastolic blood
pressure compared to controls. Again, results are mixed and cannot be clearly interpreted in
terms of an elevated or diminished physiological reactivity towards neutral and pleasant
stimuli.
Concerning research question 7b, results concerning heart rate, systolic blood pressure,
pulse, skin conductance and startle reflex point towards no group differences concerning
pleasant scenes during the imagery period. However, results concerning diastolic blood
pressure, respiration amplitude and respiration rate support group differences, as within all
three parameters, social phobic participants showed a higher physiological activation or at
least a tendency towards it. With regard to neutral scenes during the imagery period, results
due to heart rate, diastolic blood pressure, pulse, respiration rate, skin conductance and
startle reflex do not support group differences. However, results due to systolic blood
pressure and respiration amplitude do so, as social phobic participants showed a lower
systolic blood pressure and a tendency towards a higher respiration amplitude compared to
controls.
Concerning research question 7c, results concerning heart rate, blood pressure, pulse,
respiration and skin conductance do not support group differences for pleasant scenes during
the post-interval period. With regard to neutral scenes the same pattern of results can be
Discussion
192
found, except for a lower systolic blood pressure in social phobic participants compared to
controls. Again, results point towards a possible hyporeactivity.
In sum, affective rating at least for standardized scenes, point towards the activation of the
assumed underlying fear network, whereas mixed results concerning physiological
parameters indicate that fear-related scenes did not lead consistently to the activation of the
fear network in social phobic participants. This discordance between the report of affective
rating and physiological reactivity is also found in other studies (Cuthbert et al., 2003).
Therefore, results for this study are not in line with results of authors who found a higher
physiological reactivity in social phobics (see Hofmann, Ehlers & Roth, 1995). Instead,
results can be interpreted partly in line with the findings of the study of Cook and colleagues,
who found a lower physiological response for social phobic participants compared to
specific and multiple phobic participants and no correlation between heart rate reactivity and
reports of affective distress (Cook et al., 1988). Also, results can be partly interpreted in line
with the findings of the study of McNeil and colleagues, when considering the distinction
into fearful versus anxious subjects, as the authors found the smallest physiological response
and the reported highest scores due to fear and anxiety concerning social distress for anxious
subjects versus fearful subjects within an imagery task (McNeil et al., 1993). So, regarding
this study, social phobic participants seem to respond similarly to anxious subjects and might
therefore not represent a more specific type of social phobic symptoms although one can
assume that subjects who did not fulfill DSM-IV criteria for social phobia should have less
severe symptoms and less generalization of situations that lead to fear. Although subjects
were not confronted with a stressful speech task within this study and groups consisted of
controls versus social phobic participants and not high versus low trait socially anxious
individuals, results seem to be similar to the findings of Mauss and colleagues (Mauss,
Wilhelm & Gross, 2003), who found group differences neither in heart rate, electrodermal
and respiratory measures nor in vagal activation, although groups differed in their verbal
report due to symptoms of anxiety. Results also parallel findings of Grossman and
colleagues, who found that physiological measures in general did not distinguish social
phobic from control participants but only subjectively perceived anxiety, although subjects
again were confronted with a speech task and not with an imagery task (Grossman, Wilhelm,
Kawachi & Sparrow, 2001). As subjects did not have to perform nor were exposed to an in-
vivo confrontation with a social situation, feelings of embarrassment and shame which are
often experienced in contexts typically feared by social phobics and which might have led to
a decrease in physiological reactivity due to an increase in parasympathetical arousal (see
Discussion
193
paragraph 2.4.5.2) is not a satisfying explanation for the tendency towards a missing or even
diminished physiological arousal. Also, with regard to characteristics concerning the
stimulus material and considering the encoding of fear memories, one should consider that
parts of the information is not encoded linguistically, especially stimulus and response
information (see paragraph 2.2.1) and that from the perspective of attention, cognition and
language processing, worries might have served as a distraction that prevented subjects from
imagining scenes and therefore from activating the fear network, as cognitive resources are
not sufficiently available (Cuthbert et al., 2003), although subjects did not differ
systematically with regard to imagery ability. According to Lang (1985, 1988) data can be
interpreted in terms of an underlying fear network which is rather characterized by vigilance
and worries and which is not activated in each social situation (see also Thayer, Friedman &
Borkovec, 1996). Social phobics might have more stimulus and meaning representations, but
the lower overall associative strength leads to practical consequences, namely, that
emotional language is less likely to activate emotional expression (see also Bond and Siddle,
1996). Further, concerning the encoding of fear memories one should consider, that parts of
the information are not encoded linguistically, especially stimulus and response information
and also that associative connections within the fear network are independently formed of
language. So on the one hand it could be possible, that language representations are not
sufficiently strongly associated with the efferent and sensory memories of fear. In this case,
fear language input as given in the presentation period of imagery, gets fear language output,
which does not include necessarily visceral and somatic aspects of the network and might
explain the observed hyporeactivity (see also Cuthbert et al., 2003).
In addition, this interpretation can be assumed for women and men, as results relevant for the
hypotheses were controlled anyway for a possible gender effect, as gender was included as a
covariate in each of the analyses. Further, except for diastolic blood pressure no significant
main effect and no significant interaction effects or related single comparisons after
Bonferoni-correction were found for gender. Concerning diastolic blood pressure, women
seem to return quicker to the starting level during the post-interval period compared to men.
No significant main effects were found for valence, except for the three dimensions of
affective rating. This again reflects a discordance between affective report and physiological
parameters depending on the levels of valence, which again supports a hyporeactivity.
Discussion
194
For type of scene no main effect and no interaction effects were found, except for startle.
This makes it clear, that it does not matter whether scenes are presented as standardized or
personalized ones.
So social phobics seem to react physiologically at least partly rather like patients with
generalized anxiety or panic disorder in terms of a non-activation or even a hyporeactivity of
the fear network (see Cuthbert et al., 2003), which can also be observed within the picture
paradigm and is in contrast to results concerning the hyperreactivity found towards a defense
stimulus.
Discussion
195
5.5 Summary of discussion
Considering results of all three paradigms under the perspective of the reactivity of the
autonomous nervous system as well as brain functioning inconsistent findings concerning
the hyperreactivity towards a defense stimulus and the hyporeactivity towards picture and
scenes, with the latter including fear-related imagery contents, might be integrated (see also
Cuthbert et al., 2003). One possible explanation comes from Friedman and Thayer (1998)
who interpreted a less reactive autonomous nervous system in terms of a deficit in the
parasympathetical branch of the autonomous nervous system, where sympathetical
activation dominates which in turn is associated with a sustained arousal but impaired
reactance. This can be indexed by a lower heart rate variability, which is highly correlated
with a cognitive style, and language processing typical for worries (Friedman, Thayer,
Borkovec & Tyrell 1993). So, observed hyperreactivity in this study towards the defense
stimulus might be seen in the context of a sustained arousal, whereas the lower heart rate
variability during the preceding baseline and the non-activation or even hyporeactivity
towards the picture and imagery material might reflect impaired reactance. Under the
perspective of brain functioning, the hyporeactivity is interpreted as an approach-avoidance
conflict and therefore is related to the assumed activated behavioral inhibition system (see
paragraph 2.3.2). This system might be mediated by a septal-hippocampal circuit, which
mediates the suppression of approach and excessive avoidance of threat (McNaughton &
Gray, 2000). Alternatively, Davis and Lang (2001) propose an anxiety path that is different
from fear and involves the bed nucleus of the stria terminalis. This might also help to explain
the diminished startle magnitude in social phobic participants compared to controls: as the
bed nucleus of the stria terminalis is critical for the acquisition of the more general context
sensitization, it might be possible that social phobic participants have a lower context
sensitization (Lang, Davis & Öhman, 2000). In contrast, the activation of the behavioral
activation system, which is assumed to be mediated by the amygdala circuit (Davis & Lang,
2001), might be seen in the context of the hyperreactivity towards the defense stimulus,
which can be interpreted as an attempt to a fight-flight reaction. So different neuronal
pathways might be responsible for the two opposite tendencies, hyperreactivity versus
hyporeactivity found in this study.
When viewing these data in the context of applied clinical psychology, the observed
hyporeactivity should be considered in terms of lower probability to access and activate the
related fear network. However, the activation of the fear network is the first, necessary step
Discussion
196
towards a modification of the network which in turn is inevitable with regard to a successful
treatment of the disorder (Foa & Kozak, 1991), as participants with a more specific structure
concerning the fear network should have the greater probability to modify their networks
successfully and thus reaching considerable improvement of symptoms in contrast to
participants with a fear structure that is characterized by vigilance and hyporeactivity
towards specific fear-related stimuli.
Discussion
197
5.6 Conclusions
In sum, this study contributes to a better understanding of the assumed underlying fear
structure in a Spanish sample of social phobic participants. Results concerning
questionnaire-based data point towards the expected verbal report of more severe social fear
and more general anxiety related symptomatology as well as more severe worries and
depressive symptoms in social phobics. The tendency towards a lower heart rate variability
and significant differences in several physiological parameters, like heart rate, systolic blood
pressure, respiration and startle reflex point clearly towards a hyperreactivity in social
phobic participants triggered by a defense eliciting stimulus. So fear networks might be
characterized by general hypervigilance and poor autonomic control in social phobics. These
results can be seen in line with the hypotheses. Results concerning the picture and imagery
paradigm were mixed and revealed at least within the imagery paradigm a clear discordance
between affective report and physiological activation. So, results only partly support an
activation of the fear network, for example, with regard to diastolic blood pressure
concerning unpleasant pictures and affective report on the levels of valence and arousal for
standardized fear-related scenes as well as for respiration amplitude for fear-related scenes
during the imagery period. Further results do not support this activation or are even in favor
of a lower activation in social phobics. This hyporeactivity was not assumed, at least not for
unpleasant material, as in previous studies from other authors, social phobic participants
showed a similar response pattern compared to controls and specific phobic participants in
contrast to, for example, patients with generalized anxiety or panic disorder for which
hyporeactivity was repeatedly found. Therefore, at least concerning the sample of this study,
the underlying fear network structures in social phobic participants might be more related
towards anxious as opposed to fearful characteristics (see Lang, 1985). With regard to the
interpretation of these data, several aspects should be considered restrictively: first of all, the
small sample size, under a methodic point of view leads, at least in some parameters, to the
difficulty that normal distribution of means and homogeneity of variances must not be
assumed for all parameters. Although analyses are normally robust towards the violation of
these assumptions, conditions between means and variances are not always the same from a
methodic point of view. Also, due to the small sample size, it was not possible to
differentiate further within social phobic participants into more specific versus more
generalized symptomatology, as proposed by other authors (McNeil et al., 1993). Although
McNeil and colleagues (McNeil et al., 1993) report more similarities than differences
Discussion
198
between phobic research volunteers with subclinical symptomatology and phobic patients, it
remains open if data can be generalized towards social phobic patients. Therefore, future
studies should not only include a larger number of participants in general, but also patients
who fulfill the DSM-IV criteria of social phobia in order to compare them to subclinical
participants as well as other types of anxiety disorders, subclinical and clinical, to get a
broader data base for possible comparisons which could contribute to a better understanding
towards differential diagnoses. Also, the relationship between non-activation or
hyporeactivity and worry as well as associated language processing styles should be
considered in future research to understand better fear imagery processing, variation in
attention, associative learning and efferent reactivity. Further, brain imaging techniques,
electroencephalogram and magnetencephalogram might help to better understand the brain
function due to the activation of the fear network and if there might be a differentiation
possible in terms of subgroups with focus on different activated brain circuits. Under an
applied clinical perspective this also might give valuable hints towards the planning and
outcome of treatment, as it can be assumed that anxiety disorders in general and therefore
also social phobia require an activation of the underlying fear network, as this is the
prerequisite to change the network structure in terms of emotional processing and therefore
to contribute substantially to improve symptomatology.
Summary
199
6. SUMMARY
This study undertakes an effort to contribute to a better understanding concerning patterns of
activation versus non-activation of the assumed underlying fear network in a Spanish sample
of social phobic participants in comparison to a control group. Therefore, questionnaire-
based data concerning symptomatology and several physiological response measurements as
well as affective report due to different stimulus material were assessed within the so-called
defense, picture and imagery paradigm.
Methods
Subjects were 43 Spanish students, 23 social phobic and 20 control participants with a mean
age of 21 years. Besides symptoms typical for social phobia, general anxiety, depressive
symptomatology, worries as well as imagery ability were assessed by questionnaires and
participants’ physiological activation, measured in heart rate, hea rt rate variability, blood
pressure, pulse, respiration, skin conductance and startle reflex were assessed across the
three different paradigms. For the defense paradigm a burst of white noise with
instantaneous rise time was presented for 500 ms. For the picture paradigm, pleasant, neutral
and unpleasant pictures were presented, 10 for each category of valence during a 6-second
duration. For the imagery paradigm, stimulus material contained pleasant, neutral and fear-
related scenes, 4 for each category of valence and within each category 2 standardized and 2
personalized ones. Scenes were presented during a 12-second period via headphone,
followed by a 12-second imagery and a 12-second post-interval period. Startle probes were
evenly distributed, 27 probes during the picture paradigm and 21 probes during the imagery
paradigm. Participants gave an affective rating towards pictures and scenes on the
dimensions of valence, arousal and dominance. Data were recorded by the VPM program
and reduced into average change scores respectively percentage average change scores for
physiological parameters and t-scores concerning startle reflex.
Results
Concerning questionnaire-based data, social phobic participants reported having more severe
social fear, more general anxiety related symptoms, more worries and more severe
depressive symptomatology compared to controls. No differences were found due to
imagery ability. Regarding results due to the defense paradigm, social phobic participants
showed a tendency towards a lower heart rate variability as reflected indirectly by heart rate
Summary
200
and heart period during a preceding baseline. In addition, they showed a higher physiological
activation indicated by a higher heart rate, systolic blood pressure, pulse, respiration rate and
startle reflex towards the defense stimulus compared to controls.
Within the picture paradigm, social phobic participants did not differ from controls due to
their affective report with the only exception that unpleasant pictures evoked more intense
feelings of being less in control in social phobic participants compared to controls.
Physiological activation did not occur consistently across measured parameters and groups
differed only in diastolic blood pressure in terms of a higher arousal found for social
phobics.
Within the imagery paradigm, social phobic participants rated fear-related standardized
scenes as more unpleasant and more arousing compared to controls, whereas no differences
were found for the dominance rating. Concerning affective rating of pleasant and neutral
scenes, differences were found only for neutral personalized scenes, which are rated as more
unpleasant by social phobic participants compared to controls and for neutral standardized
scenes, which are rated as more arousing by social phobic participants. Pertaining to
physiological response measurement, social phobic participants showed a higher respiration
amplitude towards fear-related scenes during the imagery period, whereas for the remaining
parameters no group differences were found. Social phobic participants showed a more
pronounced physiological response towards personalized versus standardized fear-related
scenes during the imagery period for systolic blood pressure and respiration amplitude. The
same pattern was found for control participants. For each of the physiological parameters,
there were social phobic participants found, who showed an elevated physiological response,
defined as a standard deviation equal to or more than the group mean due to pleasant and
neutral scenes during the imagery period. During the presentation period social phobic
participants showed a lower systolic blood pressure due to fear-related scenes compared to
controls and no differences were found due to the other parameters. The same pattern was
found for the post-interval period. Concerning pleasant scenes during the presentation
period, social phobic participants showed a higher pulse compared to controls and
concerning neutral scenes a lower systolic and diastolic blood pressure. With regard to
pleasant scenes during imagery social phobic participants showed a higher diastolic blood
pressure, respiration amplitude and respiration rate and with regard to neutral scenes a lower
systolic blood pressure and respiration amplitude. During the post-interval period social
Summary
201
phobic participants did not differ from controls due to pleasant and neutral scenes, with the
exception of a lower systolic blood pressure for neutral scenes.
Discussion
Results concerning questionnaire-based data can be seen in line with the literature about
subjective well-being and symptomatology when social phobic and control participants were
compared. Regarding imagery ability, results within the imagery paradigm seemed not to be
influenced by a systematic bias.
The tendency towards a lower heart rate variability and an elevated defense response in
social phobic participants be interpreted in terms of an activation of the defensive behavioral
system but also in terms of an underlying fear network structure that is characterized by
general apprehension, hypervigilance and poor autonomic control.
Results with regard to the picture paradigm are interpreted in this way that unpleasant
pictures as aversive stimuli do not necessarily lead to an activation of the fear network in
social phobic participants, as physiological activation did not occur consistently across
measured parameters and also affective report did not reveal consistent differences. Contrary
to the results found within the defense paradigm, results due to pictures can be interpreted
more in line with a non-activation or even a hyporeactivity.
Results pertaining to the imagery paradigm are characterized by a discordance found
between the report of affective rating which points towards an activation of the assumed
underlying fear network and physiological reactivity which do not consistently support the
activation of the fear network. Results due to physiological parameters are discussed in
terms of hyporeactivity and an underlying fear network that is characterized by vigilance,
apprehension and a lower overall associative strength, a pattern which is more characteristic
for generalized anxiety and panic disorder. Under a cognitive perspective considering the
encoding of fear memories, language input might become fear language output, which does
not necessarily include visceral and somatic aspects of the network.
Considering the results of all of the paradigms, a further explanation would be a less reactive
autonomous nervous system that is associated with a sustained arousal, which might explain
the hyperreactivity found towards the defense stimulus, but also impaired reactance, which
might explain the lower heart rate variability during a preceding baseline and the
hyporeactivity towards picture and imagery material. Under the perspective of brain
Summary
202
functioning, the hyperreactivity can be explained by the activation of the behavioral
activation system, triggering fight-flight reactions based on the amygdala circuit, whereas
the non-activation or hyporeactivity can be interpreted as an approach-avoidance conflict
related to an assumed behavioral inhibition system, which in turn is associated with the
septal-hippocampal circuit, that mediates suppression of approach and excessive avoidance
of threat. Alternatively the bed nucleus of the stria terminalis as anxiety path is discussed. In
the context of applied clinical psychology, the observed hyporeactivity should be considered
in terms of a lower probability to access the related fear network, thus impeding emotional
processing necessary to improve symptomatology in social phobia and hence for a
successful treatment outcome. Future studies should consider subgroups of social phobics,
including subclinical versus clinical symptomatology, further types of anxiety disorders as
well as a differentiation of subjects on the continuum of fearful versus anxious. In addition
to peripherphysiological measurements, brain imaging techniques, electroencephalogram
and magnetencephalogram would help to clear the function several neuronal pathways play.
Further, it should be considered in how far different treatment techniques could lead to
changes in symptomatology and the activation and modulation of the underlying fear
network.
Zusammenfassung
203
7. ZUSAMMENFASSUNG
Diese Studie soll zu einem besseren Verständnis von sozialer Phobie und der damit
verbundenen Aktivierung versus Nicht-Aktivierung der zugrundeliegenden Furchtstruktur
beitragen. Untersucht wurde eine spanische Stichprobe von sozial phobischen Probanden
und Kontrollprobanden. Zum einen wurden angstbezogene Symptome sowie die subjektive
Einschätzung des dargebotenen Stimulusmaterials in Form von Fragebögen erfaßt. Zum
anderen wurde die physiologische Reaktion der Probanden im Rahmen der sog. Defense,
Picture und Imagery Paradigmen untersucht.
Methode
Es wurden 43 spanische Studenten, davon 23 Probanden mit Symptomen einer sozialen
Phobie und 20 Kontrollprobanden, mit einem Altersdurchschnitt von 21 Jahren untersucht.
Symptome von sozialer Phobie, genereller Ängstlichkeit, Depression und generalisierter
Angststörung sowie die Fähigkeit sich Situationen möglichst lebhaft vorstellen zu können
wurden mit Fragebögen erfaßt. Physiologische Aktivierung wurde anhand der Herzrate, der
Herzratenvariabilität, Blutdruck, Puls, Atmung, Hautleitwiderstand und Lidschlagreflex über
drei verschiedene Paradigmen hinweg gemessen. Im Rahmen des Defense Paradigmas
wurde ein akustischer Stimulus für die Dauer von 500 ms präsentiert. Im Rahmen des
Picture Paradigmas wurden pro Valenzkategorie je zehn angenehme, neutrale und
unangenehme Dias für die Dauer von sechs Sekunden präsentiert. Das Material für das
Imagery Paradigma beinhaltete angenehme, neutrale und angstbezogene Szenen. Pro
Valenzkategorie wurden vier Szenen dargeboten. Von diesen vier Szenen waren jeweils
zwei standardisiert und zwei persönlich auf den jeweiligen Probanden abgestimmt. Die
Szenen wurden dem Probanden über Kopfhörer für 12 Sekunden eingespielt. Darauf folgten
weitere 12 Sekunden, in denen sich der Proband die Szene möglichst detailliert und lebhaft
vorstellen sollte. Diese Phase wurde von einem 12 Sekunden andauernden Post-Interval
gefolgt. Akustische Stimuli zur Evozierung des Lidschlagreflexes, sog. Startle Probes,
wurden mit einer Dauer von 50 ms wiederholt dargeboten: Es wurden 27 Startle Probes
während des Picture Paradigmas und 21 Startle Probes während des Imagery Paradigmas
präsentiert. Die Probanden gaben eine subjektive Einschätzung bezüglich der Dias und
Szenen hinsichtlich der Dimensionen Valenz, Arousal und Dominanz ab. Daten wurden mit
dem VPM-Programm aufgezeichnet und in durchschnittliche Change Scores für die
Zusammenfassung
204
physiologischen Parameter bzw. prozentuale durchschnittliche Change Scores für den
Lidschlagreflex reduziert.
Ergebnisse
In Bezug auf die Fragebogendaten berichteten sozial phobische Probanden eine höher
ausgeprägte soziale Angst, mehr Sorgen und ausgeprägtere Symptome bezüglich
generalisierter Angststörung und Depression im Vergleich zu Kontrollprobanden. Die
Probanden unterschieden sich nicht im Hinblick auf die Fähigkeit sich Szenen möglichst
lebhaft vorstellen zu können. Hinsichtlich der Ergebnisse zum Defense Paradigma zeigten
sozial phobische Probanden im Vergleich zu Kontrollprobanden eine niedrigere
Herzratenvariabilität, die sich indirekt in der Herzrate und Herzperiode während der
vorausgehenden Baseline widerspiegelte. Zudem zeigten sozial phobische Probanden eine
höhere physiologische Reaktion, die sich in einer höheren Herzrate, höherem systolischem
Blutdruck, Puls, Atmungsrate und Lidschlagreflex auf den Defense Stimulus zeigte.
Im Rahmen des Picture Paradigmas unterschieden sich sozial phobische Probanden nicht
von Kontrollprobanden bezüglich ihrer subjektiven Einschätzung, abgesehen von folgender
Ausnahme: Sozial phobische Probanden schätzten negative Dias auf der Dominanzebene mit
einer einhergehenden niedrigeren Kontrolle ein als Kontrollprobanden. Eine physiologische
Aktivierung konnte nicht konsistent über die gemessenen Parameter beobachtet werden.
Lediglich hinsichtlich des diastolischen Blutdrucks unterschieden sich die Gruppen
dahingehend, daß sozial phobische Probanden einen höheren diastolischen Blutdruck hatten.
Im Hinblick auf das Imagery Paradigma schätzten sozial phobische Probanden
angstbezogene, standardisierte Szenen als unangenehmer und physiologisch aktivierender
ein als Kontrollprobanden, wohingegen sich auf der Dimension Dominanz keine
Unterschiede zwischen den beiden Gruppen zeigten. Bezüglich der subjektiven
Einschätzung von angenehmen und neutralen Szenen unterschieden sich die beiden Gruppen
nur hinsichtlich neutraler standardisierter sowie neutraler persönlich abgestimmter Szenen:
Erstere wurden von sozial phobischen Probanden als unangenehmer und letztere als
physiologisch aktivierender im Vergleich zu Kontrollprobanden eingeschätzt. Bezüglich der
Messung der physiologischen Parameter zeigten sozial phobische Probanden eine höhere
Atmungsamplitude als Reaktion auf angstbezogene Szenen während der Imagery-Phase. In
den weiteren physiologischen Parametern unterschieden sich die Gruppen hingegen nicht.
Sozial phobische Probanden zeigten zudem während der Imagery-Phase eine ausgeprägtere
Zusammenfassung
205
physiologische Reaktion in Form eines höheren systolischen Blutdrucks und einer höheren
Atmungsamplitude gegenüber persönlich abgestimmten versus standardisierten
angstbezogenen Szenen. Ein vergleichbares Muster zeigten ebenfalls die Kontrollprobanden.
Innerhalb jedes physiologischen Parameters konnten sozial phobische Probanden
identifiziert werden, die eine erhöhte physiologische Reaktion zeigten. Diese wurde als
mindestens eine Standardabweichung über dem Gruppenmittelwert in Bezug auf angenehme
und neutrale Szenen während der Imagery-Phase definiert. Während der Präsentationsphase
zeigten sozial phobische Probanden im Vergleich zu Kontrollprobanden einen niedrigeren
diastolischen Blutdruck hinsichtlich angstbezogener Szenen. In Bezug auf die übrigen
untersuchten physiologischen Parameter unterschieden sich die Gruppen nicht. Ein
vergleichbares Muster wurde für die Post-Interval Phase gefunden. Hinsichtlich angenehmer
Szenen während der Präsentationsphase zeigten sozial phobische Probanden im Vergleich zu
Kontrollprobanden einen höheren Puls und hinsichtlich neutraler Szenen einen niedrigeren
systolischen und diastolischen Blutdruck. In Bezug auf angenehme Szenen während der
Imagery Phase zeigten sozial phobische Probanden einen höheren diastolischen Blutdruck
sowie eine höhere Atmungsamplitude und Atmungsrate und hinsichtlich neutraler Szenen
einen niedrigeren systolischen Blutdruck und eine niedrigere Atmungsamplitude. Während
der Post-Interval Phase unterschieden sich sozial phobische Probanden nicht von den
Kontrollprobanden hinsichtlich angenehmer und neutraler Szenen abgesehen von einem
niedrigeren systolischen Blutdruck für neutrale Szenen.
Diskussion
Der Vergleich der Ergebnisse zwischen sozial phobischen Probanden und
Kontrollprobanden hinsichtlich der in den Fragebögen erhobenen Symptome lassen sich als
konsistent mit der vorhandenen Literatur interpretieren. Bezüglich der Fähigkeit, sich
Szenen lebhaft vorstellen zu können scheinen die Ergebnisse hinsichtlich des Imagery
Paradigmas nicht durch einen systematischen Bias beeinflußt zu sein.
Die Tendenz zu einer niedrigeren Herzratenvariabilität und einer erhöhten Defense Reaktion
bei sozial phobischen Probanden kann sowohl im Sinne einer Aktivierung des defensiven
behavioralen Systems als auch im Sinne eines zugrundeliegenden Furchtnetzwerks
interpretiert werden, das sich durch eine generelle Tendenz zur Sorge, Hyperaufmerksamkeit
und niedriger autonomer Kontrolle charakterisieren läßt.
Zusammenfassung
206
Ergebnisse hinsichtlich des Picture Paradigmas lassen sich dahingehend interpretieren, daß
unangenehme Dias im Sinne von aversiven Stimuli nicht notwendigerweise zu einer
Aktivierung des Furchtnetzwerks bei sozial phobischen Probanden führt, da die
physiologische Aktivierung nicht konsistent über die gemessenen physiologischen Parameter
auftrat und sich auch keine durchgehenden Unterschiede in Bezug auf die subjektive
Einschätzung des Stimulusmaterials ergaben. Entgegen der Ergebnisse bezüglich des
Defense Paradigmas lassen sich die Ergebnisse hinsichtlich des Picture Paradigmas eher im
Sinne einer Nicht-Aktivierung, wenn nicht sogar einer Hyporeaktivität interpretieren.
Ergebnisse bezüglich des Imagery Paradigmas lassen sich durch eine Diskrepanz zwischen
subjektiver Einschätzung und physiologischer Reaktivität kennzeichnen: Die Interpretation
der Fragebogendaten spricht für eine Aktivierung des zugrundeliegenden Furchtnetzwerks,
wohingegen die physiologische Reaktivität nur sehr inkonsistent auf die Aktivierung des
zugrundeliegenden Furchtnetzwerks hinweist. Ergebnisse bezüglich der untersuchten
physiologischen Parameter werden im Sinne einer Hyporeaktivität und eines
zugrundeliegenden Furchtnetzwerks diskutiert. Letzteres ist von erhöhter Aufmerksamkeit,
Sorge und insgesamt schwächerer assoziativer Verbindungen gekennzeichnet, einem Muster,
das typischerweise bei generalisierter Angststörung und Panikstörung auftritt. Unter einer
kognitiven Perspektive, die die Enkodierung angstbezogener Inhalte im Gedächtnis
berücksichtigt wird Sprachinput zu Sprachoutput, der aber nicht notwendigerweise viszerale
und somatische Aspekte des Netzwerks beinhaltet.
Eine weitere Erklärung, die die Ergebnisse aus allen drei Paradigmen erlaubt, ist die eines
weniger reaktiven autonomen Nervensystems. Dieses ist einerseits gekennzeichnet von einer
anhaltenden Aktivierung, die die Hyperreaktivität hinsichtlich des Defense Stimulus erklären
könnte und andererseits von einer eingeschränkten Reaktanz, die die niedrigere
Herzratenvariabilität während der vorausgehenden Baseline und die im Picture und Imagery
Paradigma beobachtete Hyporeaktivität erklären könnte. Unter Einbeziehen der Hirnfunktion
läßt sich die Hyperreaktivität als die Aktivierung eines behavioralen Aktivierungssystems
interpretieren, das Kampf-und-Flucht-Reaktionen steuert und in engem Zusammenhang mit
der Amygdala und den damit verbundenen Schaltkreisen beruht. Die Nicht-Aktivierung oder
Hyporeaktivität hingegen kann in Zusammenhang mit einem Annäherungs-
Vermeidungskonflikt und einem angenommenen behavioralen Hemmungssystem
interpretiert werden. Dieses läßt sich wiederum mit dem Septo-hippocampalen Schaltkreis
assoziieren, der die Unterdrückung von Annäherungsverhalten und exzessiver Vermeidung
Zusammenfassung
207
von Bedrohung steuert. Als alternative Erklärung wird auch der Bed nucleus der Stria
terminalis als Angstpfad diskutiert. Im Kontext angewandter klinischer Psychologie sollte
die beobachtete Hyporeaktivität im Sinne einer niedrigeren Wahrscheinlichkeit für die
Aktivierung des Furchtnetzwerks gesehen werden, was das sog. Emotional Processing
behindert, das notwendig für eine Verbesserung der Symptome der sozialen Phobie und
einem erfolgreichen Therapieergebnis ist. Zukünftige Studien sollten eine Differenzierung
von Untergruppen der sozialen Phobie berücksichtigen, die subklinische versus klinische
Symptome, weitere Typen von Angststörungen und die Differenzierung von Probanden auf
einem Kontinuum zwischen furchtsam versus ängstlich miteinbeziehen. Zusätzlich zu
peripherphysiologischen Messungen sollten bildgebende Verfahren,
Elektroenzephalogramm und Magnetenzephalogramm miteinbezogen werden, um die
Funktion zu klären, die verschiedene neuronale Pfade im Gehirn spielen. Des weiteren sollte
berücksichtigt werden, inwieweit verschiedene Behandlungsverfahren zu einer Veränderung
von Symptomen und der Aktivierung und Veränderung des zugrundeliegenden
Furchtnetzwerks beitragen.
List of References
208
LIST OF REFERENCES
Agostoni, E. (1963). Diaphragm activity during breath holding: factors related to its onset. Journal of Applied Physiology, 18, 30-36.
American Psychiatric Association. (1987). Diagnostic and statistical manual of mental disorders (Rev. 3rd ed.). Washington DC: Author.
American Psychiatric Association. (2000). Diagnostic and statistical manual of mental disorders, (4th ed., text revised). Washington, DC: Author.
Amies, P. L., Gelder, M. G. & Shaw, P. M. (1983). Social phobia: A comparative clinical study. British Journal of Psychiatry, 142, 174-179.
Amir, N., Foa, E. B. & Coles, M. E. (1998). Negative interpretation bias in social phobia. Behaviour Research and Therapy, 36, 945-957.
Anderson, A. K. & Phelps, E. A. (1998). Intact recognition of vocal expressions of fear following bilateral lesions of the human amygdala. Neuroreport, 9, (16), 3607-3613.
Anderson, C. A. & Harvey, R. J. (1988). Discriminating between problems in living: an examination of measures of depression, loneliness, shyness and social anxiety. Journal of Social and Clinical Psychology, 6,482-491.
Anderson, J. R. & Bower, G. H. (1974). A prepositional theory of recognition memory. Memory and Cognition, 2, 406-412.
Andrews, G., Hall, W., Teesson, M. & Henderson, S. (1999). The mental health of Australians. National survey of mental health and well-being report 2. Mental Health Branch, Commonwealth: Department of Health and Aged Care.
Antony, M. M. (2001). Assessment of anxiety and the anxiety disorders: an overview. In M. M. Antony, S. M. Orsillo & L. Romer (Eds.), Practitioner's guide to empirically based measures of anxiety (pp. 9-17). New York: Klumer/Plenum.
Arntz, A., Rauner, M. & van den Hout, M. A. (1994). “If I feel anxious, there must be danger“: The fallacy of ex -consequentia reasoning in inferring danger in anxiety disorders. Manuscript submitted for publication.
Bados, A. (2001). Fobia social. Madrid: Síntesis.
Bados, A. (2002). Adaptación al español del Cuestionario de autoverbalizaciónes al hablar en público (Self-statement during public speaking scale). Manuscrito no publicado. Universidad de Barcelona, España.
Baños, R. M., Gallardo, M., Medina, P., Jorquera, M., Botella, C., Quero, S. & Periñá, C. (in preparation). The Social phobia and anxiety inventory (SPAI): Evaluation of psychometric properties in a Spanish sample.
Barlow, D. H. (1988). Anxiety and its disorders. The nature and treatment of anxiety and panic. New York, NY: Guilford Press.
List of References
209
Barlow, D. H. (2002). Anxiety and its disorders. The nature and treatment of anxiety and panic (2nd ed.). New York, NY: Guilford Press.
Barlow, D. H. (2002). Fear, anxiety, and theories of emotion. In D. H. Barlow, Anxiety and its disorders: The nature and treatment of anxiety and panic (pp. 37-63). New York, NY: Guilford Press.
Bauer, R. M. & Craighead, W. E. (1979). Psychophysiological responses in the imagination of fearful and neutral situations: The effect of imagery instructions. Behavior Therapy, 10, 389-403.
Beck, A. T., Brown, G., Epstein, N. & Steer, R. A. (1988). An Inventory for Measuring Clinical Anxiety: Psychometric Properties. Journal of Consulting and Clinical Psychology, 56, 893-897.
Beck, A. T., Emery, G. & Greenberg, R. L. (1985). Cognitive therapy and the emotional disorders. New York: International University Press.
Beck, A. T., Kovacs, M. & Weissman, A. (1979). Assessment of suicidal ideation: the scale for suicide ideation. Journal of Consulting and Clinical Psychology, 47, 343-352.
Beck, A. T., Steer, R. A. & Brown, G. K. (1996). Manual for the BDI-II. San Antonio, TX: The Psychological Corporation.
Becker, E. S., Türke, V., Neumer, S., Soeder, U., Krause, P. & Margraf, J. (2000). Incidence and prevalence rates of mental disorders in a community sample of young women: results for the “Dresden Study”. In: R. Manz & W. Kirch (Eds.), Public Health Research and Practice: Report of the Public Health Research Association Saxony, Vol. 11 (pp. 259-291). Regensburg: Roderer.
Beidel, D. C., Turner, S. M. & Cooley, M. R. (1993). Assessing reliable and clinically significant change in social phobia: Validity of the social phobia and anxiety inventory. Behaviour Research and Therapy, 31, 331-337.
Beidel, D. C., Turner, S. M. & Dancu, C. V. (1985). Physiological, cognitive and behavioral aspects of social anxiety. Behaviour Research and Therapy, 23, 109-117.
Beidel, D. C., Turner, S. M., Stanley, M. A. & Dancu, C. V. (1989). The Social phobia and anxiety inventory: concurrent and external validity. Behavior Therapy, 20, 417-427.
Bell, C. J., Malizia, A. L. & Nutt, D. J. (1999). The neurobiology of social phobia. European Archives of Psychiatry and Clinical Neuroscience, 249 (Suppl 1), 11-18.
Bermúdez, J. (1978a). Ansiedad y rendimiento. Revista de Psicología General y Aplicada, 151, 183-207.
Bermúdez, J. (1978b). Análisis funcional de la ansiedad. Revista de Psicología General y Aplicada, 153, 617-634.
Bernston, G. G., Cacioppo, J. T. & Quigley, K. S. & Fabro, V. T. (1994). Autonomic space and psychophysiological response. Psychophysiology, 31, 44-61.
List of References
210
Bernston, G. G., Cacioppo, J. T. & Quigley, K. S. (1991). Autonomic determinism: The modes of autonomic control, the doctrine of autonomic space, and the laws of autonomic constraint. Psychological Review, 98, 459-487.
Bieling, P. J., Antony, M. M. & Swinson, R. P. (1998). The State-trait anxiety inventory, trait version: structure and content re-examined. Behaviour Research and Therapy, 36, 777-788.
Birbaumer, N. Grodd, W., Diedrich, O., Klose, U., Erb, M., Lotze, M., Schneider, F., Weiss, U. & Flor, H. (1998). fMRI reveals amygdala activation to human faces in social phobics. Neuro-Report, 9, 1223-1226.
Birbaumer, N. & Schmidt, R. F. (1991). Biologische Psychologie. Heidelberg: Springer-Verlag.
Black, B., Uhde, T. W. & Tancer, M. E. (1992). Fluoxetine for the treatment of social phobia [Letter to the editor]. Journal of Clinical Psychopharmacology, 12, 293-295.
Blanchard, R. J. & Blanchard, D. C. (1989). Attack and defense in rodents as experimental models for the study of emotion. Progress in Neuro-Psychopharmacology and Biological Psychiatry, 13, 3-14.
Bobes, J., González, M.P., Sáiz, P. A. & Bousoño, M. (Eds.). (1999). Abordaje actual del trastorno por ansiedad social. Barcelona: Masson.
Boiten, F. A. (1998). The effects of emotional behaviour on components of the respiratory cycle. Biological Psychology, 49, 29-51.
Boiten, F. A., Frijda, N. H. & Wientjes, C. J. E. (1994). Emotions and respiratory patterns: review and critical analysis. International Journal of Psychophysiology, 17, 103-128.
Bond, N. W. & Siddle, D. A. T. (1996). The preparedness account of social phobia: Some data and alternative explanations. In R. M. Rapee (Ed.), Current controversies in the anxiety disorders (pp. 291-316). New York, NY: The Guilford Press.
Boone, M. L., McNeil, D., Masia, C. L., Turk, C. L., Carter, L. E., Ries, B. J. & Lewin, M. R. (1999). Multimodal comparisons of social phobia subtypes and avoidant personality disorder. Journal of Anxiety Disorders, 13, (3), 271-292.
Bortz, J. (1993). Statistik für Sozialwissenschaftler (4. Auflage). Berlin: Springer-Verlag.
Botella, C., Baños, R. M. & Periñá, C. (2003). Fobia social. Avances en la psicopatología, la evaluación y el tratamiento psicológico del trastorno de ansiedad social. Barcelona: Piados Ibérica.
Bower, D., Eckert, M., Gilmore, R., Leonard, C. M., Bauer, R., Roper, S., Bradley, M., Lang, P. & Barta, P. (1997). Startle eyeblink magnitude in humans depends on extent of right amygdala removal. Society of Neuroscience Abstracts, 23, 570.
Bradley, M. M. (2000). Emotion and motivation. In J. T. Cacioppo, L. G. Tassinary & G. Bernston (Eds.), Handbook of Psychophysiology (pp. 602-642). New York: Cambridge University Press.
List of References
211
Bradley, M. M., Codispoti, M., Cuthbert, B. N. & Lang, P. J. (2001). Emotion and
motivation I: Defensive and appetitive reactions in picture processing. Emotion, 1, (3), 276-298.
Bradley, M. M., Codispoti, M., Sabatinelli, D. & Lang, P. J. (2001). Emotion and motivation II: Sex differences in picture processing. Emotion, 1, (3), 300-319.
Bradley, M. M., Cuthbert, B. N. & Lang, P. J. (1993a). Pictures as prepulse: Attention and emotion in startle modification. Psychophysiology, 30, 541-545.
Bradley, M. M., Cuthbert, B. N. & Lang, P. J. (1996). Picture media and emotion: Effects of sustained affective content. Psychophysiology, 33, (6), 662-670.
Bradley, M. M., Cuthbert, B. N. & Lang, P. J. (1999). Affect and the startle reflex. In M. E. Dawson, A. M. Schell & A. H. Bohmelt (Eds.), Startle modification: implications for neuroscience, cognitive science and clinical science (pp. 157-183). New York: Cambridge University Press.
Bradley, M. M., Gianaros, P. & Lang, P. J. (1995). As time goes by: stability of affective startle modulation [Abstract]. Psychophysiology, 32, 21.
Bradley, M. M., Greenwald, M. K. & Hamm, A. O. (1993). Affective picture processing. In N. Birbaumer & A. Öhman (Eds.), The structure of emotion: psychophysiological, cognitive and clinical aspects. Toronto: Hogrefe& Huber.
Bradley, M. M., Kolchakian, M., Cuthbert, B. N. & Lang, P. J. (1997). What’s new? What’s exciting? Novelty and emotion in perception [Abstract]. Psychophysiology, 34, 22.
Bradley, M. M. & Lang, P. J. (1994). Measuring emotion: The self-assessment manikin and the semantic differential. Journal of Behavioral Therapy and Experimental Psychiatry, 25, 49-59.
Bradley, M. M. & Lang, P. J. (2000). Measuring Emotion: Behavior, Feeling and Physiology. In R. D. Lane & L. Nadel (Eds.), Cognitive Neuroscience of Emotion (pp. 246-276). Oxford: University Press.
Bradley, M. M., Lang, P. J. & Cuthbert, B. N. (1993). Emotion, novelty and the startle reflex: Habituation in humans. Behavioral Neuroscience, 107, 970-980.
Bradley, M. M. & Vrana, S. R. (1993). The Startle Probe in the Study of Emotion and Emotional Disorders. In N. Birbaumer & A. Öhman (Eds.), The Structure of Emotion (pp. 93-109). Toronto: Hogrefe & Huber Publishers.
Brener, J. (1987). Behavioural energetics: some effects of uncertainty on the mobilization and distribution of energy. Psychophysiology, 24, 499-512.
Broks, P., Young, A. W., Maratos, E. J., Coffey, P. L., Calder, A. J., Isaac, C., Mayes, A. R., Hodges, J. R., Montaldi, D., Cezayirli, E., Roberts, N. & Hadley, D. (1998). Face processing impairments after encephalitis: Amygdala damage and recognition of fear. Neuropsychology, 36, 59-70.
List of References
212
Brown, E. J., Heimberg, R. G. & Juster, H. R. (1995). Social phobia subtype and avoidant personality disorder: Effect on severity of social phobia, impairment, and outcome of cognitive behavioral treatment. Behavior Therapy, 26, 467-489.
Brown, T. A., Campbell, L. A., Lehman, C. L., Grisham, J. R. & Mancill, R. B. (2001). Current and lifetime comorbidity of the DSM-IV anxiety and mood disorders in a large clinical sample. Journal of Abnormal Psychology, 110, 49-58.
Brown, T. A., DiNardo, P. & Barlow, D. H. (1994). Anxiety disorder interview schedule for DSM-IV. San Antonio, TX: The Psychological Corporation.
Brownley, K. A., Hurwitz, B. E. & Scheiderman, N. (2000). Cardiovascular Psychophysiology. In J. T. Cacioppo, L. G. Tassinary, & G. G. Bernston (Eds.), Handbook of Psychophysiology, 2nd edition (pp. 224-264). Camebridge: University Press.
Bruch, M. A. & Heimberg, R. G. (1994). Differences in perceptions of parental and personal characteristics between generalized and non-generalized social phobics. Journal of Anxiety Disorders, 8, 155-168.
Bruch, B. A., Heimberg, R. G., Berger, P. A. & Collins, T. M. (1989). Social phobia and perception of early parental and personal characteristics. Anxiety Research, 12, 57-65.
Brunnello, N., den Boer, J. A., Judd, L. L., Kasper, S., Kelsey, J. E., Lader, M., Lecrubier, Y., Lepine, J. P., Lydiard, R. B., Mendlewicz, J., Montgomery, S. A., Racagni, G., Stein, M B. & Wittchen, H.-U. (2000). Social phobia: diagnoses and epidemiology, neurobiology, comorbidity and treatment. Journal of Affective Disorder, 60, 61-74.
Bryant, N. E., Sullivan, E. R., Strauss, C. C., Cuthbert, B. N. & Lang, P. J. (1997). Predictors of treatment attrition in patients with anxiety disorders. Poster presented at the 31st Annual Convention of the Association for Advancement of Behavior Therapy, Miami Beach, FL.
Büchel, C. & Dolan, R. J. (2000). Classical fear conditioning in functional neuroimaging. Current Opinion in Neurobiology, 10, 219-223.
Buck, R. & Parke, R. D. (1972). Behavioral and physiological response to the presence of a friendly or neutral person in two types of stressful situations. Journal of Personality and Social Psychology, 24, 143-153.
Buck, R., Parke, R. D. & Buck, M. (1970). Differences in the cardiac response to the environment in two types of stressful situations. Psychonomic Science, 18, 95-96.
Buela-Casal, G. & Sierra, J. C. (Eds.) (2001) Manual de evaluación y tratamientos psicológicos. Madrid: Editorial Biblioteca Nueva.
Buss, A. H. (1980). Self-consciousness and social anxiety. San Francisco: W. H. Freemann and Company.
List of References
213
Caballo, V. E. (1987). Evaluación y entrenamiento de las habilidades sociales: una estrategia multimodal. Doctoral dissertation, Universidad Autónoma de Madrid (Microficha).
Caballo, V. E. (1993a). Manual de evaluación y entrenamiento de las habilidades sociales. Madrid: Siglo XXI.
Caballo, V. E. (1993b). Relationships among some behavioral and self-report measures of social skills. Psicología Conductual, 1, (1), 69-91.
Caballo, V. E. & Buela, G. (1989). Diferencias conductuales, cognitivas y emocionales entre sujetos de alta y baja habilidad social. Revista de Análisis del Comportamiento, 4, (1), 1-19.
Cacioppo, J. T. & Bernston, G. G. (1994). Relationships between attitudes and evaluative space: A critical review with emphasis on the separability of positive and negative substrates. Psychological Bulletin, 115, 401-423.
Cacioppo, J. T., Klein, D. J., Bernston, G. G. & Hatfield, E. (1993). The psychophysiology of emotion. In M. L. & J. M. Haviland (Eds.), Handbook of Emotions, pp. 67-83. New York: Guilford.
Cacioppo, J. T., Tassinary, L. G. & Bernston, G. G. (2000). Handbook of Psychophysiology, 2nd edition. Cambridge: University Press.
Caldirola, D., Perna, G., Arancio, C., Bertani, A. & Bellodi, L. (1997). The 35% CO2
challenge test in patients with social phobia. Psychiatry Research, 71, 41-48.
Canino, G. S., Bird, H. R., Shrout, P. E., Rubio-Stipec, M., Bravo, M., Martinez, R., Sesman, M. & Guevara, L. M. (1987). The prevalence of specific psychiatric disorders in Puerto Rico. Archives of General Psychiatry, 44, 727-735.
Carroll, D., Marziller, J. S. & Merian, S. (1982). Psychophysiological changes accompanying different types of arousing and relaxing imagery. Psychophysiology, 19, 75-82.
Center for the Study of Emotion and Attention [CSEA-NIMH]. (1999). The international affective picture system: Photographic slides. Gainesville, FL: University of Florida: The Center for Research in Psychophysiology.
Chance, M. R. A. (1988). Introduction. In M. R. A. Chance (Ed.), Social fabrics of the mind (pp. 1-35). Hove, Sussex: Erlbaum.
Chatterjee, S., Sunitha, T. A., Velayudhan, A. & Khanna, S. (1997). An investigation into the psychobiology of social phobia: Personality domains and serotonergic function. Acta Psiquiatrica Scandinavica, 95, 544-550.
Clark, D. M. & Ehlers, A. (2002). Soziale Phobie: Eine kognitive Perspektive. In U. Stangier & T. Fydrich (Eds.). Soziale Phobie und Soziale Angststörung. Psychologische Grundlagen, Diagnostik und Therapie (pp. 157-180). Göttingen: Hogrefe Verlag.
List of References
214
Clark, D. M. & McManus, F. (2002). Information processing in social phobia. Biological Psychiatry, 51, (1), 92-100.
Clark, D. M. & Wells, A. (1995). A cognitive model of social phobia. In R. G. Heimberg, R. M. Liebowitz, D. A. Hope & f. R. Schneier (Eds.), Social phobia: Diagnoses, assessment, and treatment (pp. 69-93). New York, NY: The Guilford Press.
Cloninger, C. R. (1994). Temperament and personality. Current opinion in neurobiology, 4, 266-273.
Coles, M. E., Turk, C. L., Heimberg, R. G. & Fresco, D. M. (2001). Effects of varying levels of anxiety within social situations: relationship to memory perspective and attributions in social phobia. Behaviour Research and Therapy, 39, 651-665.
Comeche, M. I., Garcia, M. I. & Pareja, M. A. (1995). Terapia de conducta y salud: Cuestionarios, inventarios y escalas, ansiedad, depresión y habilidades sociales. Madrid: Fundación Universidad-Empresa.
Connor, K. M., Davidson, J. R. T., Churchill, L. E., Sherwood, A., Foa, E. & Wesler, R. H. (2000). Psychometric properties of the Social phobia inventory (SPIN). British Journal of Psychiatry, 176, 379-386.
Cook, E.W. III. (2000). VPM reference manual. Birmingham, Alabama: Author.
Cook, E. W. III, Hawk, L. W., Davis, T. L. & Stevenson, V. E. (1991). Affective individual differences and startle reflex modulation. Journal of Abnormal Psychology, 100, 5-13.
Cook, E. W. III, Melamed, B. G., Cuthbert, B. N., McNeil, D. W. & Lang, P. J. (1988). Emotional imagery and the differential diagnosis of anxiety. Journal of Consulting and Clinical Psychology, 56, 734-740.
Cook, E. W. III & Turpin, G. (1997). Differentiating orienting, startle and defense responses: The role of affect and its implications for psychopathology. In P. J. Lang, R. F. Simons & M. T. Balaban (Eds.), Attention and orienting: sensory and motivational processes. Hillsdale, NJ: Erlbaum.
Coupland, N. J., Bell, C., Potokar, J. P., Dorkins, E. & Nutt, D. J. (2000). Flumazenil challenge in social phobia. Depression and Anxiety, 11, 27-30.
Cox, B. J., Ross, L., Swinson, R. P. & Direnfeld, D. M. (1998). A comparison of social phobia outcome measures in cognitive-behavioral group therapy. Behavior Modification, 22, 285-297.
Craske, M. G. (1999). Anxiety disorders. Psychological approaches to theory and treatment. Colorado: Westview Press.
Creamer, M., Foran, J. & Bell, R. (1995). The Beck anxiety inventory in a non-clinical sample. Behaviour Research and Therapy, 33, (4), 477-485.
Crites, S. L. & Cacioppo, J. T. (1996). Electrocortical differentiation of evaluative and non-evaluative categorizations. Psychological Science, 7, 318-321.
List of References
215
Crozier, W. R. & Alden, L. E. (2001). The social nature of social anxiety. In W. R. Crozier & L. E. Alden (Eds.), International handbook of social anxiety: Concepts, research and interventions relating to the self and shyness (pp. 1-27). New York, NY: John Wiley & Sons, LTD.
Curtis, R. C. & Miller, K. (1986). Believing another likes or dislikes you: Behaviors making the beliefs come true. Journal of Personality and Social Psychology, 51, 284-290.
Cuthbert, B. N., Lang, P. J., Strauss, C., Drobes, D., Patrick, C. J. & Bradley, M. M. (2003). The psychophysiology of anxiety disorder: fear memory imagery. Psychophysiology, 40, 407-422.
Cuthbert, B. N. & Melamed, B.G. (1993). Anxiety and clinical psychophysiology: Three decades of research on three response systems in three anxiety disorders. In N. Birbaumer & A. Öhman (Eds.), The Structure of Emotion (pp. 93-109). Toronto: Hogrefe & Huber Publishers.
Cuthbert, B. N., Strauss, C., Drobes, D., Patrick, C. J., Bradley, M. M. & Lang, P. J. (1999). Startle and the anxiety disorders. Manuscript submitted for publication.
Cuthbert, B. N., Vrana, S. R. & Bradley, M. M. (1991). Imagery: function and physiology. In P. K. Ackles, J. R. Jennings & M. G. H. Coles (Eds.), Advances in Psychophysiology, Vol. 4 (pp. 1-42). Greenwich, CT: JAI.
Daly, J. A., Vangelisti, A. L. & Lawrence, S. G. (1989). Self-focused attention and public speaking anxiety. Personality and Individual Differences, 10, 903-913.
Davey, G. C. L. (1989). UCS evaluation and conditioning models of acquired fears. Behaviour Research and Therapy, 27, 521-528.
Davidson, J. R. T., Hughes, D. L., George, L. K. & Blazer, D. G. (1993). The epidemiology of social phobia: findings from the Duke Epidemiologic Catchment Area Study. Psychological Medicine, 23, 709-718.
Davidson, R. J. (1992). Anterior cerebral asymmetry and the nature of emotion. Brain and Cognition, 20, 125-151.
Davidson, R. J. (2000). Affective style, mood, and anxiety disorders: An affective neuroscience approach. In: R. J. Davidson (Ed.), Anxiety, depression and emotion (pp. 88-108). Oxford: University Press.
Davidson, R. J., Marshall, J. R., Tomarken, A. J. & Henriques, J. B. (2000). While a phobic waits: Regional brain electrical and autonomic activity in social phobics during anticipation of public speaking. Biological Psychiatry, 47, 85-95.
Davis, C. (1988). Reliability of psychophysiological assessment within temperamental groups. International Journal of Psychophysiology, 6, (4), 299-305.
Davis, M. & Lang, P. J. (2001). Emotion: Integration of animal and human data and theory. In M. Gallagher & R. J. Nelson (Eds.), Comprehensive handbook of psychology: Vol. 3 Biological psychology. New York: Wiley.
List of References
216
Davis, M., Walker, D. L. & Lee, Y. (1997). Roles of the amygdala and bed nucleus of the stria terminalis in fear and anxiety measured with the acoustic startle reflex: Possible relevance to PTSD. Annals of the New York Academy of Sciences, Psychobiology of Post-traumatic Stress Disorder, 821, 305-331.
Dawson, M. E., Schell, A. M. & Filion, D. L. (2000). The electrodermal system. In J. T. Cacioppo, L. G. Tassinary & G. G. Bernston (Eds.), Handbook of Psychophysiology, 2nd edition (pp.200-223). Camebridge: University Press.
DeCharms, R. (1968). Personal causation. New York: Academic Press.
Degonda, M. & Angst, J. (1993). The Zürich study. XX. Social phobia and agoraphobia. European Archives of Psychiatry and Clinical Neuroscience, 243, 95-102.
DePaulo, B. M., Epstein, J. A. & LeMay, C. S. (1990). Responses of the socially anxious to the prospect of interpersonal evaluation. Journal of Personality, 58, 623-640.
Depue, R. A. & Collins, P. F. (1999). Neurobiology of the structure of personality: Dopamine, facilitation of incentive motivation, and extraversion. Behavioral and Brain Sciences, 22, 491-517.
DeWit, D. J., Ogborne, A., Offord, D. R. & MacDonald, K. (1999). Antecedents of the risk of recovery from DSM-III-R social phobia. Psychological Medicine, 29, 569-582.
Diehl, J. M. & Staufenbiel, T. (2001). Statistik mit SPSS, Version 10.0. Frankfurt: Verlag Dietmar Klotz GmbH.
Dimberg, U. (1986). Facial expressions as excitatory and inhibitory stimuli for conditioned autonomic responses. Biological Psychology, 22, 37-57.
DiNardo, P. A., Brown, T. A., Lawton, J. K. & Barlow, D. H. (1995). The Anxiety disorder interview schedule for DSM-IV lifetime version: description and initial evidence for diagnostic reliability. Communication presented at the Meeting of the Association for Advancement of Behavior Therapy, Washington, DC.
Dodge, C. S., Heimberg, R. G., Nyman, D. & O’Brien, G. T. (1987). Daily heterosocial interactions of high and low socially anxious college students: A diary study. Behavior Therapy, 18, 90-96.
Dodge, C. S., Hope, D. A., Heimberg, R. G. & Becker, R. E. (1988). Evaluation of the social interaction self-statement test with a social phobic population. Cognitive Therapy and Research, 12, 211-222.
Dolan, R. J. & Morris, J. S. (2000). The functional anatomy of innate and acquired fear: Perspectives from neuroimaging. In R. D. Lane & L. Nadel (Eds.), Cognitive neuroscience of emotion (pp. 225-241). Oxford: University Press.
Drummond, P. D. (1997). The effect of adrenergic blockade on blushing and facial flushing. Psychophysiology, 34 (2), 163-168.
Dudley, D. L., Martin, C. J. & Holmes, T. H. (1994). Psychophysiologic studies of pulmonary ventilation. Psychosomatic Medicine, 26, 645-660.
List of References
217
Dudley, D. L., Martin, C. J., Masuda, M, Ripley, H. S. & Holmes, T. H. (1969). Psychophysiology of respiration in health and disease. New York: Appleton-Century-Crofts.
Echeburúa, E. (1995). Evaluación y tratamiento de la fobia social. Barcelona: Martínez Roca.
Echeburúa, E. (1996). Evaluación psciológica de los trastornos de ansiedad. En: G. Buela-Casal, V. E. Caballo, & J. C. Sierra (Eds.): Manual de evaluación en psicología clínica y de la salud. Madrid: Siglo XXI.
Eng, W., Heimberg, R. G., Coles, M. E., Schneier, F. R. & Liebowitz, M. R. (2000). An empirical approach to subtype identification in individuals with social phobia. Psychological Medicine, 30, 1345-1357.
Epstein, S. (1972). The nature of anxiety with emphasis upon its relationship to expectancy. In C. D. Spielberger (Ed.), Anxiety: current trends in theory and research (Vol. 2). New York: Academic Press.
FAES: Cuestionarios y escalas de valoración en salud mental, programa. Faes Farma Grupo www.faes.es.
Fanselow, M. S., DeCola, J. P., DeOca, B. M. & Landeira-Fernandez, J. (1995). Ventral and dorsolateral regions of the midbrain periaqueductual gray (PAG) control different stages of defensive behavior: dorsolateral PAG lesions enhance the defensive freezing produced by massed and immediate shock. Aggressive Behavior, 21, (1), 63-77.
Fanselow, M. S. & Lester, L. S. (1988). A functional behavioristic approach to aversively motivated behavior: predatory imminence as a determinant of the topography of defensive behavior. In R. C. Bolles & M. D. Beecher (Eds.), Evolution and learning (pp. 185-211). Hillsdale, NJ: Lawrence Erlbaum Associates.
Faravelli, C., Zucchi, T, Viviani, B., Salmoria, R., Perone, A., Paionni, A., Scarpato, A., Vigliaturo, D., Rosi, S., Dadomo, D., Bartolozzi, D., Cecchi, C. & Abrardi, L. (2000). Epidemiology of social phobia: a clinical approach. European Psychiatry, 15, 17-24.
Fernández, M. C. (1987). La respuesta cardíaca de defensa en humanos: Significación autonómica y comportamental. Unpublished doctoral dissertation, University of Granada, Spain.
Fernández, M. C. & Vila, J. (1989a). Cognitive versus motivational significance of the cardiac response to intense auditory stimulation. International Journal of Psychophysiology, 8, 49-59.
Fernández, M. C. & Vila, J. (1989b). Sympathetic-parasympathetic mediation of the cardiac defense response in humans. Biological Psychology, 28, 123-133.
Fiorito, E. R. & Simons, R. F. (1994). Emotional imagery and physical anhedonia. Psychophysiology, 31, 513-521.
List of References
218
Foa, E. B., Franklin, M. E., Perry, K. J. & Herbert, J. D. (1996). Cognitive biases in social phobia. Journal of Abnormal Psychology, 105, 433-439.
Foa, E. B. & Kozak, M. J. (1991). Emotional processing: Theory, research and clinical implications for anxiety disorders. In J. D. Safran & L. S. Greenberg (Eds.), Emotion, psychotherapy, and change (pp. 21-49). New York, NY: Guilford Press.
Fowles, D. C. (2000). Electrodermal hyporeactivity and antisocial behavior: Does anxiety mediate the relationship? Journal of Affective Disorders, 61, (3), 177-189.
Fridja, N. H. (1986). The emotions. New York: Cambridge.
Fridlund, A. J. & Cacioppo, J. T. (1986). Guidelines for human electromyographic research. Psychophysiology, 23, 567-589.
Fridlund, A. J. & Izard, C. E. (1983). Electromyographic studies of facial expressions of emotion and patterns of emotion. In J. T. Cacioppo & R. E. Petty (Eds.), Social Psychophysiology (pp. 243-280). New York: Guilford Press.
Friedman, B. H. & Thayer, J. F. (1998). “Anxiety and autonomic flexibility: A cardiovascular approach”: Erratum. Biological Psychology, 49, (3), 303-323.
Friedman, B. H., Thayer, J. F., Borkovec, T. D. & Tyrrell, R. A. (1993). Autonomic characteristics of nonclinical panic and blood phobia. Biological Psychiatry, 34, (5), 298-310.
Funayama, E. S., Grillon, C. G., Davis, M & Phelps, E. A. (in press). A double dissociation in the affective modulation of startle in humans: Effects of unilateral temporal lobectomy. Journal of Cognitive Neuroscience.
Fyer, A. J., Mannuzza, S., Chapman, T. F., Liebowitz, M. R. & Klein, D. F. (1993). A direct interview family study of social phobia. Archives of General Psychiatry, 50, 286-293.
Gallardo, M. (2002). Delimitación de subtipos clínicos en fobia social. Doctoral thesis, University of Valencia.
Garcia, R., Vouimba, R. M., Baudry, M. & Thompson, R. F. (1999). The amygdala modulates prefrontal cortex activity relative to conditioned fear. Nature, 402, 294-296.
García-Lopéz, L. J., Olivares, J., Hidalgo, M. D., Beidel, D. C. & Turner, S. M. (2001). Psychometric properties of the Social phobia and anxiety inventory, the Social anxiety scale for adolescents, the Fear of negative evaluation scale, and the Social avoidance and distress scale in an adolescent Spanish-speaking sample. Journal of Psychopathology and Behavioral Assessment, 23, 51-59.
García-Sancho, M. J. (2002). Entrevista diagnóstica de trastorno por ansiedad según el DSM-IV. Traducción y adaptación del ADIS-IV de Brown, di Nardo & Barlow, 1994, Universidad de Murcia.
List of References
219
Geer, J. H. (1965). The development of a scale to measure fear. Behaviour Research and Therapy, 3, 45-53.
Gelernter, C. S., Uhde, T. W., Cimbolic, P., Arnkoff, D. B., Vittone, B. J., Tancer, M. E. & Bartko, J. J. (1991). Cognitive-behavioral and pharmacological treatment for social phobia: A controlled study. Archives of General Psychiatry, 48, 938-945.
Gerlach, A. L. (1998). Blushing, embarrassment, and social phobia: Physiological, behavioral and self-report assessment. Edition Wissenschaft, Unterreihe Psychologie; Band 48. Marburg: Tectum Verlag.
Gerlach, A. L. (2002). Psychophysiologie der sozialen Phobie - Symptom oder Ursache? In U. Stangier & T. Fydrich (Eds.). Soziale Phobie und Soziale Angststörung. Psychologische Grundlagen, Diagnostik und Therapie (pp. 87-111). Göttingen: Hogrefe Verlag.
Gerlach, A. L., Wilhelm, F. H. & Roth, W. T. (2003). Embarrassment and social phobia: the role of parasympathetic activation. Anxiety Disorders, 17, 197-210.
Gilbert, P. & McGuire, M. T. (1998). Shame, status, and social roles: Psychobiology and evolution. In P. Gilbert & B. Andrews (Eds.), Shame: Interpersonal behaviour, psychopathology, and culture (pp. 99-125). Oxford: Oxford University Press.
Gilbert, P. & Trower, P. (1990). The evolution and manifestation of social anxiety. In W. R. Crozier (Ed.), Shyness and embarrassment: Perspectives from social psychology (pp. 144-177). New York: Cambridge University Press.
Glass, C. R., Merluzzi, T. V., Biever, J. L. & Larsen, K. H. (1982). Cognitive assessment of social anxiety: Development and validation of a self-statement questionnaire. Cognitive Therapy and Research, 6, 37-55.
Godart, N. T., Flament, M. F., Lecrubier, Y. & Jeammet, P. (2000). Anxiety disorders in anorexia nervosa and bulimia nervosa: Comorbidity and chronology of appearance. European Psychiatry, 15, 38-45.
Gorman, J. M. & Kent, J. M. (1999). SSRIs and SNRIs: Broad spectrum of efficacy beyond major depression. Journal of Clinical Psychiatry, 60, (Suppl. 4), 33-38.
Gorman, J. M., Papp, L. A., Martinez, J., Goetz, R. R., Hollander, E., Liebowitz, M. R. & Jordan, F. (1990). High-dose carbon dioxide challenge test in anxiety disorder patients. Biological Psychiatry, 28, 743-757.
Graham, F. K. (1979). Distinguishing among orienting, defense and startle reflexes. In H. D. Kimmel, E. H. vanOlst & J. F. Orlebke (Eds.), The orienting reflex in humans. An international conference sponsored by the Scientific Affairs Division of the North Atlantic Treaty Organization (pp. 137-167). Hillsdale, NJ: Lawrence Erlbaum Associates.
Grayson, J. B. (1982). The elicitation and habituation of orienting and defensive responses to phobic imagery and the incremental stimulus intensity effect. Psychophysiology, 19, 104-111.
List of References
220
Greenwald, M. K., Bradley, M. M., Cuthbert, B. N. & Lang, P. J. (1998). Sensitization of the startle reflex in humans following aversive electric shock exposure. Behavioral Neuroscience, 112, 1069-1079.
Greenwald, M. K., Cook, E. W. III & Lang, P. J. (1989). Affective judgment and psychophysiological response: dimensional covariation in the evaluation of pictoral stimuli. Journal of Psychophysiology, 3, 51-64.
Grossman, P. (1983). Respiration, stress and cardiovascular function. Psychophysiology, 20, 284-300.
Grossman, P. Karemaker, J. & Wieling, W. (1991). Prediction of tonic parasympathetic cardiac control using respiratory sinus arrhythmia: The need for respiratory control. Psychophysiology, 28, 201-216.
Grossman, P., Wilhelm, F. H., Kawachi, I. & Sparrow, D. (2001). Gender differences in psychophysiological responses to speech stress among older social phobics. Congruence and incongruence between self-evaluative and cardiovascular reactions. Psychosomatic Medicine, 63, (5), 765-777.
Guyton, A. C. & Hall, J. E. (1996). Textbook of Medical Physiology, rev. ed. Philadelphia: Saunders.
Hamm, A. O., Cuthbert, B. N., Globisch, J. & Vaitl, D. (1997). Fear and startle reflex: blink modulation and autonomic response patterns in animal and mutilation fearful subjects. Psychophysiology, 34, 97-107.
Harver, A., & Lorig, T. S. (2000). Respiration. In J. T. Cacioppo, L. G. Tassinary & G. G. Bernston (Eds.), Handbook of Psychophysiology, 2nd edition (pp. 265-293). Camebridge: University Press.
Hayano, J., Sakakibara, Y., Yamada, A., Yamada, M., Mukai, T., Fujinami, T., Yokoyama, K., Watanaba, Y. & Takata, K. (1991). Accuracy of assessment of cardiac vagal tone by heart rate variability in normal subjects. American Journal of Cardiology, 67, 199-204.
Hazlett, R. L., McLeod, D. R. & Hoehn-Saric, R. (1994). Muscle tension in generalized anxiety disorder: elevated muscle tonus or agitated movement? Psychophysiology, 31, 189-195.
Hebb, D. O. (1949). The organization of behavior: A neuropsychological theory. New York: Wiley.
Heimberg, R. G. (1996). Social phobia, avoidant personality disorder and the multiaxial conceptualization of interpersonal anxiety. In P. M. Salkovskis (Ed.), Trends in cognitive and behavioral therapies. New York: Wiley.
Heimberg, R. G., Holt, C. S., Schneier, F. R., Spitzer, R. L. & Liebowitz, M. R. (1993). The issue of subtypes in the diagnoses of social phobia. Journal of Anxiety Disorders, 7, 249-269.
List of References
221
Heimberg, R. G., Hope, D. A., Dodge, C. S. & Becker, R. E. (1990). DSM-III-R subtypes of social phobia comparison of generalized social phobics and public speaking phobics. Journal of Nervous and Mental Disease, 178, 172-179.
Heimberg, R. G., Hope, D. A., Rapee, R. M. & Bruch, M. A. (1988). The validity of the Social Avoidance and Distress Scale and the Fear of Negative Evaluation Scale with social phobic patients. Behaviour Research and Therapy, 26, 407-410.
Heinrichs, N. & Hofmann, S. G. (2001). Information processing in social phobia: A critical review. Clinical Psychology Review, 21, 751-770.
Heiser, N. A., Turner, S. M. & Beidel, D. C. (2003). Shyness: relationship to social phobia and other psychiatric disorders. Behaviour Research and Therapy, 41, 209-221.
Herbert, J. D., Bellack, A. S. & Hope, D. A. (1991). Concurrent validity of the Social phobia and anxiety inventory. Journal of Psychopathology and Behavioral Assessment, 13, 357-368.
Herbert, J. D., Hope, D. A. & Bellack, A. S. (1992). Validity of the distinction between generalized social phobia and avoidant personality disorder. Journal of Abnormal Psychology, 101, 332-339.
Herd, A. (1984). Cardiovascular response to stress in man. Annual Review of Physiology, 46, 177-185.
Hermann, C. (2002). Neurobiologische Aspekte und lerntheoretische Grundlagen der sozialen Phobie. In U. Stangier & T. Fydrich (Eds.). Soziale Phobie und Soziale Angststörung. Psychologische Grundlagen, Diagnostik und Therapie (pp. 112-156). Göttingen: Hogrefe Verlag.
Hettema, J. M., Neale, M. C. & Kendler, K. S. (2001). A review and meta-analysis of the genetic epidemiology of anxiety disorders. American Journal of Psychiatry, 158, 1568-1578.
Hirsch, C. R., Clark, D. M., Mathews, A. & Williams R. (2003). Self-images play a causal role in social phobia. Behaviour Research and Therapy, 41 , 909-921.
Hofmann, S. G., Albano, A. M., Heimberg, R. G., Tracey, S., Chorpita, B. F. & Barlow, D. H. (1999). Subtypes of social phobia in adolescents. Depression and Anxiety, 9, 15-18.
Hofmann, S. G. & Barlow, D. H. (2002). Social Phobia (social anxiety disorder). In D. H. Barlow, Anxiety and its disorders: The nature and treatment of anxiety and panic (pp. 454-476). New York, NY: Guilford Press.
Hofmann, S. G. & DiBartolo, P. M. (2000). An instrument to assess self-statements during public speaking: Scale development and preliminary psychometric properties. Behavior Therapy, 31, 499-515.
Hofmann, S. G., Ehlers, A. & Roth, W. T. (1995). Conditioning theory: A model for the etiology of public speaking anxiety? Behaviour Research and Therapy, 33, 567-571.
List of References
222
Hofmann, S. G., Gerlach, A., Wender, A. & Roth, W. T. (1997). Speech disturbances and gaze behavior during public speaking in subtypes of social phobia. Journal of Anxiety Disorders, 11, 573-585.
Hofmann, S. G., Newman, M. G., Ehlers, A. & Roth, W. T. (1995). Psychophysiological differences between subgroups of social phobia. Journal of Abnormal Psychology, 104, 224-231.
Hofmann, S. G. & Roth, W. T. (1996). Issues related to social anxiety among controls in social phobia research. Behavior Therapy, 17, 26-42.
Hollander, E., Kwon, J., Weiller, F., Cohen, L., Stein, D. J., DeCaria, C., Liebowitz, M. & Simeon, D. (1998). Serotonergic function in social phobia: Comparison to normal control and obsessive-compulsive disorder subjects. Psychiatry Research, 79, 213-217.
Holt, C. S., Heimberg, R. G. & Hope, D. A. (1992). Avoidant personality disorder and the generalized subtype of social phobia. Journal of Abnormal Psychology, 101, 318-325.
Holt, P. E. & Andrews, G. (1989). Provocation of panic: Three elements of the panic reaction in four anxiety disorders. Behaviour Research and Therapy, 27, 253-261.
Hope, D. A. & Heimberg, R. G. (1988). Public and private self-consciousness and social phobia. Journal of Personality Assessment, 52, 626-639.
Hope, D. A., Heimberg, R. G. & Klein, J. F. (1990). Social anxiety and the recall of interpersonal information. Journal of Cognitive Psychotherapy, 4, 185-195.
Hwu, H. G., Yeh, E. K. & Chang, L. Y. (1989). Prevalence of psychiatric disorders in Taiwan defined by the Chinese diagnostic interview schedule. Acta Psychiatrica Scandinavia, 79, 136-147.
Ibáñez, I., Peñate, W. & González, M. (1997). La estructura factorial de Inventario e depresión de Beck. Psicología Conductual, 5, 71-91.
Iglesias, R. (1982). La ansiedad estado/rasgo (STAI) en un grupo clínico (Síndrome Tóxico). Memoria de Licenciatura, Facultad de Psicología, Universidad de Salamanca.
James, G. D., Yee, L. S., Harshfield, G. & Pickering T. (1988). Sex differences in factors affecting the daily variation of blood pressure. Social Science and Medicine, 26, (10), 1019-1023.
Johansson, J. & Öst, L. G. (1982). Perception of autonomic reactions and actual heart rate in phobic patients. Journal of Behavioral Assessment, 4, 133-143.
Johnson, M. R., Lydiard, R. B., Zealberg, J. J., Fossey, M. D. & Ballenger, J. C. (1994). Plasma and CSF HVA levels in panic patients with comorbid social phobia. Biological Psychiatry, 36, 425-427.
List of References
223
Johnson, M. R., Marazziti, D., Brawman-Mintzer, O., Emmanuel, N. P., Ware, M. R., Morton, W. A., Rossi, A., Cassano, G. B. & Lydiard, R. B. (1998). Abnormal peripheral benzodiazepine receptor density associated with generalized social phobia. Biological Psychiatry, 43, 306-309.
Jones, G. E. & Johnson, H. J. (1978). Physiological responding during self generated imagery of contextually complete stimuli. Psychophysiology, 15, 439-446.
Jones, G. E. & Johnson, H. J. (1980). Heart rate and somatic concomitants of mental imagery. Psychophysiology, 17, 339-347.
Juhasz, J. B. (1972). On the reliability of two measures of imagery. Perceptual and Motor Skills, 35, 874.
Juster, H. R., Brown, E. J. & Heimberg, R. G. (1996). Soziale Phobie. In J. Margraf (Eds.), Lehrbuch der Verhaltenstherapie, (2nd ed., pp.43-59). Berlin: Springer.
Katzelnick, D. J., Kobak, K. A., Greist, J. H., Jefferson, J. W., Mantle, J. M. & Serlin, R. C. (1995). Sertraline for social phobia: A double-blind, placebo-controlled crossover study. American Journal of Psychiatry, 152, 1368-1371.
Kendler, K. S., Heath, A. C., Martin, N. G. & Eaves, L. J. (1987). Symptoms of anxiety and symptoms of depression. Same genes, different environments? Archives of General Psychiatry, 44, 451-457.
Kendler, K. S., Neale, M. C., Kessler, R. C., Heath, A. C. & Eaves, L. J. (1992). The genetic epidemiology of phobias in women: The interrelationship of agoraphobia, social phobia, situational phobia, and simple phobia. Archives of General Psychiatry, 49, 273-281.
Kessler, R. C., McGonagle, K. A., Zhao, S., Nelson, C. B., Hughes, M., Eshleman, S., Wittchen, H.-U. & Kendler, K. S. (1994). Lifetime and 12-month prevalence of DSM-III-R psychiatric disorders in the United States: Results from the National Comorbidity Survey. Archives of General Psychiatry, 51, 8-19.
Kessler, R. C., Stang, P. E., Wittchen, H.-U., Ustan, T. B., Roy-Byrne, P. P. & Walters, E. E. (1998). Lifetime panic-depression comorbidity in the National Comorbidity Survey. Psychological Medicine, 29, 555-567.
Kessler, R. C., Stein, M. B. & Berglund, P. (1998). Social phobia subtypes in the National Comorbidity Survey. American Journal of Psychiatry, 155, (5), 613-619.
Kestler, L. P., Malhotra, A. K., Finch, C., Adler, C. & Breier, A. (2000). The relation between dopamine d2 receptor density and personality: Preliminary evidence from the NEO personality inventory-revised. Neuropsychiatry, Neuropsychology and Behavioral Neurology, 13, 48-52.
Kimble, C. E. & Zehr, H. D. (1982). Self-consciousness, information load, self-presentation, and memory in a social situation. Journal of Social Psychology, 118, 39-46.
Kintsch, W. (1974). The representation of meaning in memory. Hillsdale, NJ: Erlbaum.
List of References
224
Klein, D. F. (1993). False suffocation alarms, spontaneous panics, and related conditions. An integrative hypothesis. Archives of General Psychiatry, 50, 306-317.
Klorman, R. & Ryan, R. M. (1980). Heart rate, contingent negative variation, and evoked potentials during anticipation of affective stimulation. Psychophysiology, 14, 45-51.
Klorman, R., Weissbert, R. P. & Wiessenfeld, A. R. (1977). Individual differences in fear and autonomic reactions to affective stimulation. Psychophysiology, 14, 45-51.
Lacey, J. I. (1958). Psychophysiological approaches to the evaluation of psychotherapeutic process and outcome. In E. A. Rubinstein & M. B. Perloff (Eds.), Research in psychotherapy. Washington, DC: National.
Lacey, J. I. (1967). Somatic response patterning and stress: Some revisions of activation theory. In M. H. Appley & R. Trumbull (Eds.), Psychological Stress: Issues in Research, pp. 14-38. New York: Appleton-Century-Crofts.
Lacey, J. I. & Lacey, B. C. (1970). Some autonomic-central nervous system interrelationships. In P. Black (Ed.), Physiological correlates of emotion (pp. 205-227). New York: Academic Press.
Lang, P. J. (1968). Fear reduction and fear behavior: Problems in treating a construct. Research in Psychotherapy, 3, 90-102.
Lang, P. J. (1970). Stimulus control, response control and the desensitization of fear. In D. J. Levis (Ed.), Learning approaches to therapeutic behavior change. Chicago: Aldine.
Lang, P. J. (1978). Anxiety: Toward a psychophysiological definition. In H. S. Akiskal & W. L. Webb (Eds.), Psychiatric diagnosis: Exploration of biological predictors (pp. 365-389). New York: Spectrum.
Lang, P. J. (1979). A bio-informational theory of emotional imagery. Psychophysiology, 16, (6), 495-804.
Lang, P. J. (1984). Cognition in emotion: Concept and action. In C. Izard, J. Kagan & R. Zajonc (Eds.), Emotion, cognition and behavior. Cambridge University Press.
Lang, P. J. (1985). The cognitive psychophysiology of emotion: Fear and anxiety. In A. H. Tuma & J. D. Maser (Eds.), Anxiety and the anxiety disorders (pp. 131-170). Hillsdale, NJ: Erlbaum.
Lang, P. J. (1987). Image as action: A reply to Watts and Blackstock. Cognition and Emotion, 1, 407-426.
Lang, P. J. (1988). Fear, anxiety, and panic: context, cognition, and visceral arousal. In S. Rachman & D. Jack, Panic: psychological perspectives (pp. 219-236). Hillsdale, NJ: Lawrence Erlbaum Associates.
Lang, P. J. (1993). The network model of emotion: motivational connections. In R. S. Wyer & T. K. Srull (Eds.), Perspectives on anger and emotion (109-133). Hillsdale, NJ: Lawrence Erlbaum.
List of References
225
Lang, P. J. (1994). The varieties of emotional experience: A mediation on James-Lange Theory. Psychophysiology, 101, (2), 211-221.
Lang, P. J. (1995). The emotion probe. Studies of motivation and attention. American Psychologist, 50, (5), 372-385.
Lang, P. J., Bradley, M. M. & Cuthbert, B. N. (1990). Emotion, attention, and the startle reflex. Psychological Review, 3, 337-395.
Lang, P. J., Bradley, M. M. & Cuthbert, B. M. (1997). Motivated attention: Affect, activation and action. In P. J. Lang, R. F. Simons, & M. T. Balaban (Eds.), Attention and orienting: Sensory and motivational processes (pp. 97-135). Hillsdale, NJ: Lawrence Erlbaum Associates.
Lang, P. J., Bradley, M. M. & Cuthbert, B. N. (1998). Emotion and motivation: measuring affective perception. Journal of Clinical Neurophysiology, 15, (5), 397-408.
Lang, P. J., Bradley, M. M. & Cuthbert, B. N. (1999). International affective picture system (IAPS): Instruction manual and affective ratings (Tech. Rep. No. A-4). Gainesville, FL: University of Florida, The Center for Research in Psychophysiology.
Lang, P. J., Cuthbert, B. N. & Bradley, M. M. (1998). Measuring emotion in therapy: imagery, activation, and feeling. Behavior Therapy, 29, (4), 655-674.
Lang, P. J., Davis, M. & Öhman, A. (2000). Fear and anxiety: animal models and human cognitive psychophysiology. Journal of Affective Disorder, 61, 137-159.
Lang, P. J., Greenwald, M. K., Bradley, M. M. & Hamm, A. O. (1993). Looking at pictures: Affective, facial, visceral and behavioral reactions. Psychophysiology, 30, 261-273.
Lang, P. J. & Hnatiow, M. (1962). Stimulus repetition and the heart rate response. Journal of Comparative and Physiological Psychology, 55, 781-785.
Lang, P. J., Levin, D. N., Miller, G. A. & Kozak, M. J. (1983). Fear behavior, fear imagery, and the psychophysiology of emotion: The problem of affective response integration. Journal of Abnormal Psychology, 92, (3), 276-306.
Latane, B. (1981). The psychology of social impact. American Psychologist, 36, 343-356.
Leary, M. R. & Kowalsky, R. M. (1995). Social anxiety. New York: The Guilford Press.
Leary, M. R., Kowalski, R. M. & Campbell, C. D. (1988). Self-presentational concerns and social anxiety: The role of generalized impression expectancies. Journal of Research in Personality, 22, 308-321.
Leary, M. R., Rejeski, W. J., Britt, T. W. & Smith, G. E. (1996). Physiological differences between embarrassment and social anxiety. Unpublished manuscript, Winston-Saalem, NC: Wake Forest University.
LeDoux, J. E. (1990). Information flow form sensation to emotion: Plasticity in the neural computation of stimulus value. In M. Gabriel & J. Moore (Eds.), Learning, and computational neuroscience: Foundations of adaptive networks. Cambridge, MA: MIT Press.
List of References
226
LeDoux, J. E. (2000). Emotion circuits in the brain. Annual Review of Neuroscience, 23, 155-184.
Lee, C. K., Kwak, Y. S., Yamamoto, J., Rhee, H., Kim, Y. S., Han, J. H., Choi, J. O. & Lee, Y. H. (1990). Psychiatric epidemiology in Korea Part II: urban ad rural differences. Journal of Nervous and Mental Disease, 178 (4), 247-252.
Lee, G. P., Bechara, A., Adolphs, R., Arena, J., Meador, K. J., Loring, D. W. & Smith, J. R. (1998). Clinical and physiological effects of stereotaxic bilateral amygdalotomy for intractable aggression. Journal of Neuropsychiatry and Clinical Neurosciences, 10, 413-420.
Lelliot, P., McNamee, G. & Marks, I. (1991). Features of agora-, social-, and related phobias and validation of the diagnoses. Journal of Anxiety Disorders, 5, 313-322.
Levin, A. P., Saoud, J. B., Strauman, T., Gorman, J. M., Fyer, A., Crawford, R. & Liebowitz, M. R. (1993). Responses of “generalized” and “discrete” social phobics during public speaking. Journal of Anxiety Disorders, 7, 207-221.
Lieb, R. & Müller, N. (2002). Epidemiologie und Komorbidität der Sozialen Phobie. In Ulrich Stangier and Thomas Fydrich (Eds.), Soziale Phobie und Soziale Angststörung. Psychologische Grundlagen, Diagnostik und Therapie (pp. 35-65). Göttingen: Hogrefe.
Liebowitz, M. R., Campeas, R. & Hollander, E. (1987). MAOIs: Impact on social behavior. Psychiatry Research, 22, 89-90.
Liebowitz, M. R., Fyer, A. J., Gorman, J. M., Dillon, D., Davies, S., Stein, J. M., Cohen, B. S. & Klein, D. F. (1985). Specificity of lactate infusions in social phobia versus panic disorders. American Journal of Psychiatry, 142, 947-950.
Liebowitz, M. R., Schneier, F., Campeas, R., Hollander, E., Hatterer, J., Fyer, A., Gorman, J., Papp, L., Davies, S., Gully, R. & Klein, D. F. (1992). Phenelzine versus atenolol in social phobia: A placebo-controlled comparison. Archives of General Psychiatry, 49, 290-300.
Lundh, L. G. & Öst, L. G. (1996). Recognition bias for critical faces in social phobics. Behaviour Research and Therapy, 34, 787-795.
Lykken, D. T. & Venables, P. H. (1971). Direct measurement of skin conductance: a proposal for standardization. Psychophysiology, 8, (5), 656-672.
Maddux, J. E., Norton, L. W. & Leary, M. R. (1988). Cognitive components of social anxiety: An investigation of the integration of self-presentation theory and self-efficacy theory. Journal of Social and Clinical Psychology, 6, 180-190.
Magee, W. J., Eaton, W. W., Wittchen, H.-U., McGonagle, K. A. & Kessler, R. C. (1996). Agoraphobia, simple phobia, and social phobia in the National Comorbidity Survey. Archives of General Psychiatry, 53, 159-168.
List of References
227
Mahone, E. M., Bruch, M. A. & Heimberg, R. G. (1993). Focus of attention and social anxiety: The role of negative self-thoughts and perceived positive attributes of the other. Cognitive Therapy and Research, 17, 209-224.
Mandler, G., Mandler, J. M., Kremen, I. & Sholiton, R. D. (1961). The response to threat: Relations among verbal and physiological indices. Psychological Monographs, 75, (9), 22.
Manning, S. K. & Melchiori, M. P. (1974). Words that upset urban college students: measured with GSRs and rating scales. Journal of Social Psychology, 94, 305-306.
Mannuzza, S., Schneier, F. R., Chapman, T. F., Liebowitz, M. R., Klein, D. F. & Fyer, A. J. (1995). Generalized social phobia: Reliability and validitiy. Archives of General Psychiatry, 141, 154-161.
Mansell, W. & Clark, D. M. (1999). How do I appear to others? Social anxiety and processing of the observable self. Behaviour Research and Therapy, 37, 419-434.
Mansell, W., Clark, D. M. & Ehlers, A. (2003). Internal versus external attention in social anxiety: an investigation using a novel paradigm. Behaviour Research and Therapy, 41, 555-572.
Mansell, W., Clark, D. M., Ehlers, A. & Chen, Y. P. (1999). Social anxiety and attention away from emotional faces. Cognition and Emotion, 13, 673-690.
Margraf, J. & Schneider, S. (2003). Angst und Angststörungen. In J. Hoyer & J. Margraf (Eds.), Angstdiagnostik. Grundlagen und Testverfahren (pp. 3-30). Heidelberg: Springer Verlag.
Marks, I. M. (1969). Fears and phobias. New York: Academic Press.
Marks, I. M. (1970). The classification of phobic disorders. British Journal of Psychiatry, 116, 377-386.
Marks, I. M. & Gelder, M. G. (1966). Different ages of onset in varieties of phobias. American Journal of Psychiatry, 123, 218-221.
Marks, I. M. & Lader, M. (1973). Anxiety states (anxiety neurosis): A review. Journal of Nervous and Mental Disease, 156, (1), 3-18.
Mattick, R. P. & Clarke, J. C. (1998). Development and validation of measures of social phobia scrutiny fear and social interaction anxiety. Behaviour Research and Therapy, 36, 455-470.
Mauss, I. B., Wilhelm, F. H. & Gross, J. J. (2003). Autonomic recovery and habituation in social anxiety. Psychophysiology, 40, (4), 648-653.
May, J. R. (1977). A psychophysiological study of self and externally regulated phobic thoughts. Behavior Therapy, 8, 849-861.
May, J. R. & Johnson, H. J. (1973). Physiological activity to internally elicited arousal and inhibitory thoughts. Journal of Abnormal Psychology, 83, 239-245.
List of References
228
McCann, U. D., Slates, S. O., Geraci, M., Roscow-Terrill, D. & Uhde, T. W. (1997). A comparison of the effects of intravenous pentagastrin on patients with social phobia, panic disorder and healthy controls. Neuropsychopharmacology, 16, 229-237.
McNally, R. J. (1990). Psychological approaches to panic disorder: a review. Psychological Bulletin, 108, 403-419.
McNaughton, N. & Gray, J. A. (2000). Anxiolytic action on the behavioural inhibition system implies multiple types of arousal contribute to anxiety. Journal of Affective Disorders, 61, (3), 161-176.
McNeil, D. W. (2001). Terminology and evolution of the constructs. In S. G. Hofmann & P. M. DiBartolo (Eds.), From social anxiety to social phobia: Multiple perspectives. Needham Heights, MA: Allyn &Bacon.
McNeil, D. W., Ries, B. J., Taylor, L. J., Boone, M. L., Carter, L. E., Turk, C. L. & Lewin, M. R. (1995). Comparison of social phobia subtypes using Stroop tests. Journal of Anxiety Disorders, 9, 47-57.
McNeil, D. W., Vrana, S. R., Melamed, B. G., Cuthbert, B. N. & Lang, P. J. (1993). Emotional imagery in simple an social phobia: Fear versus anxiety. Journal of Abnormal Psychology, 102, (2), 212-225.
Mellings, T. M. B. & Alden, L. E. (2000). Cognitive processes in social anxiety: the effects of self-focus, rumination and anticipatory processing. Behaviour Research and Therapy, 38, 243-257.
Menzies, R. G. & Clarke, J. C. (1993). The etiology of fear of heights and its relationship to severity and individual response patterns. Behaviour Research and Therapy, 31, 355-365.
Menzies, R. G. & Clarke, J. C. (1995). The etiology of phobias: A non-associative account. Clinical Psychological Review, 15, 23-48.
Merinkangas, K. R. & Angst, J. (1995). Comorbidity and social phobia: evidence from clinical, epidemiologic, and genetic studies. European Archives of Psychiatry and Clinical Neurosciences, 244, 297-303.
Merikangas, K. R., Risch, N. J. & Weissman, M. M. (1994). Comorbidity and co-transmission of alcoholism, anxiety and depression. Psychological Medicine, 24, 69-80.
Meyer, T. J., Miller, M. L., Metzger, R. L. & Borkovec, T. D. (1990). Development and validation of the Penn state worry questionnaire. Behaviour Research and Therapy, 28, 487-495.
Mikkelsen, E. J., Detlor, J. & Cohen, D. J. (1981). School avoidance and social phobia triggered by haloperidol in patients with Tourette’s disorder. American Journal of Psychiatry, 138, 1572-1576.
List of References
229
Miller, G. A., Levin, D. N., Kozak, M. J., Cook, E. W. III, Mc Lean, A. & Lang, P. J. (1987). Individual differences in emotional imagery. Cognition and Emotion, 1, 367-390.
Mogg, K. & Bradley, B. P. (2002). Selective orienting of attention to masked threat faces in social anxiety. Behaviour Research and Therapy, 40, 1403-1414.
Molina, S. & Borkovec, T. D. (1994). The Penn state questionnaire: psychometric properties and associated characteristics. In G. C. L. Davey & F. Tallis (Eds.), Worrying: perspective on theory, assessment and treatment (pp. 265-283). New York: Wiley.
Moltó, J., Montañés, S., Poy, R., Segarra, P., Pastor, M. C. & Tormo, M. P. (1999). Un nuevo método par el estudio experimental de las emociones: El International Affective Picture System (IAPS). Adaptación española. Revista de Psicología Gral y Aplicación, 52, (1), 55-87.
Morris, M., Bradley, M., Bowers, D., Lang, P. & Heilman, K. (1991). Valence-specific hypoarousal following right temporal lobectomy. Journal of Clinical and Experimental Neuropsychology, 13, 42 [Abstract].
Morris, J. S., Öhman, A. & Dolan, R. J. (1998). Conscious and unconscious emotional learning in the human amygdala. Nature, 393, 467-600.
Mowrer, O. H. (1947). On the dual nature of learning: A reinterpretation of “conditioning” and “problem solving. Harvard Educational Review, 17, 102-148.
Mowrer, O. H. (1960). Learning theory and behavior. New York: Wiley.
Müller, N. (2002). Die soziale Angststörung bei Jugendlichen und jungen Erwachsenen: Erscheinungsformen, Verlauf und Konsequenzen. Münster: Waxmann.
Musa, C., Lépine, J.-P., Clark, D. M., Mansell, W. & Ehlers, A. (2003). Selective attention in social phobia and the moderating effect of a concurrent depressive disorder. Behaviour Research and Therapy, 41, 1043-1054.
Nesse, R. M. (1987). An evolutionary perspective on panic disorder and agoraphobia. Ethology and Sociobiology, 8, (3), 73-83.
Nesse, R. M. (1998). Emotional disorders in evolutionary perspective. British Journal of Medical Psychology, 71, 397-415.
Nesse, R. M., Curtis, G. C., Thyer, B. A., McCann, D. S., Huber-Smith, J. & Knopf, R. F. (1985). Endocrine and cardiovascular responses during phobic anxiety. Psychosomatic Medicine, 47, 320-332.
Neufeld, K. J., Swartz, K. L., Bienvenu, O. J., Eaton, W. W. & Cai, G. (1999). Incidence of DIS/DSM-IV social phobia in adults. Acta Psychiatrica Scandinavica, 100, 186-192.
Nicholas, L. M. & Tancer, M. E. (1995). Neurobiological studies of social phobia. Psychiatric Annals, 25, 564-569.
List of References
230
Öhman, A. (1986). Face the beast and fear the face: Animal and social fears as prototypes for evolutionary analysis of emotion. Psychophysiology, 23, 123-145.
Öhman, A. (1993). Fear and anxiety as emotional phenomena: Clinical phenomenology, evolutionary perspectives, and information-processing mechanisms. In M. Lewis & J. M. Haviland (Eds.), Handbook of emotions (pp. 511-536). New York: Guilford Press.
Öhman, A. & Birbaumer, N. (1993). Psychophysiological and cognitive-clinical perspectives on emotion: introduction and overview. In N. Birbaumer & A. Öhman (Eds.), The Structure of Emotion (pp. 3-17). Toronto: Hogrefe & Huber Publishers.
Öhman, A. & Dimberg, U. (1978). Facial expressions as conditioned stimuli for electrodermal responses: A case of „preparedness“? Journal of Personality and Social Psychology, 36, 1251-1258.
Öhman, A., Dimberg, U. & Öst, L.-G. (1985). Animal and social phobias: Biological constraints on learned fear responses. In: S. Reiss & R. R. Bootzin (Eds.), Theoretical issues in behavior therapy (pp. 123-173). New York: Academic Press.
Öhman, A. & Mineka, S. (2001). Fears, phobias, and preparedness: toward an evolved module of fear and fear learning. Psychological Review, 108, (3), 483-522.
Olivares, J., García-López, L.J., Hidalgo, M.D., Turner, S.M. & Beidel, D.C. (1999). The Social Phobia and Anxiety Inventory: Reliability and validity in an adolescent Spanish population. Journal of Psychopathology and Behavioral Assessment, 21, 67-78.
Orr, S. P. & Pitman R. K. (1993). Psychophysiologic assessment of attempts to simulate posttraumatic stress disorder. Biological Psychiatry, 33, (2), 127-129.
Orsillo, S. M. (2001). Measures for social phobia. In M. M. Antony, S. M. Orsillo & L. Romer (Eds.), Practitioner's guide to empirically based measures of anxiety (pp. 165-187). New York: Klumer/Plenum.
Osman, A., Barrios, F. X., Aukes, D. & Osman, J. R. (1995). Psychometric evaluation of the Social phobia and anxiety inventory in college students. Journal of Clinical Psychology, 51, 235-243.
Osman, A., Barrios, F. X., Haupt, D., King, K., Osman, J. R. & Slavens, S. (1996). The social phobia and anxiety inventory: further validation in two nonclincial samples. Journal of Psychopathology and Behavioral Assessment, 18, 35-47.
Osman, A., Markway, K. & Osman, J. R. (1992). Psychometric properties of the Social interaction self-statement test in a college sample. Psychological Reports, 71, 1171-1177.
Öst, L. G. (1987). Age of onset of different phobias. Journal of Abnormal Psychology, 96, 223-229.
Öst, L. G. & Hughdal, K. (1981). Acquisition of phobias and anxiety response patterns in clinical patients. Behaviour Research and Therapy, 16, 439-447.
List of References
231
Paloma, D., Angrilli, A. & Mini, A. (1997). Visual evoked potentials, heart rate responses and memory to emotional pictorial stimuli. International Journal of Psychophysiology, 27, 55-67.
Panayiotou, G. & Vrana, S. R. (1998). Effect of self-focused attention on the startle reflex, heart rate, and memory performance among socially anxious and nonanxious individuals. Psychophysiology, 35, 328-336.
Papp, L. A., Gorman, J., Liebowitz, M. R., Fyer, A. J., Cohen, B. & Klein, D. F. (1988). Epinephrine infusions in patients with social phobia. American Journal of Psychiatry, 145, 733-736.
Papp, L. A., Klein, D. F. & Gorman, J. M. (1993). Carbon dioxide hypersensitivity, hyperventilation, and panic disorder. American Journal of Psychiatry, 150, 1149-1157.
Parsey, R. V., Oquendo, M. A., Zea-Ponce, Y., Rodenhiser, J., Kegeles, L. S., Pratap, M., Cooper, T. B., vanHeertum, R., Mann, J. J. & Laruelle, M. (2001). Dopamine (d2) receptor availability and amphetamine-induced dopamine release in unipolar depression. Biological Psychiatry, 50, 313-322.
Pavlov, I. P. (1927). Conditioned reflexes. London: Oxford University Press.
Perna, G., Bertani, A., Caldirola, D. & Bellodi, L. (1996). Family history of panic disorder and hypersensitivity to CO2 in patients with panic disorder. American Journal of Psychiatry, 153, 1060-1064.
Perna, G., Cocchi, S., Bertani, A., Arancio, C. & Bellodi, L. (1995). Sensitivity to 35% CO2
in healthy first-degree relatives of patients with panic disorder. American Journal of Psychiatry, 152, 623-625.
Perugi, G., Simmonini, E., Savino, M., Mengali, F., Cassano, G. B. & Akiskal, H. S. (1990). Primary and secondary social phobia: Psychopathologic and familial differentiations. Comprehensive Psychiatry, 31, 245-252.
Peterson, R. A. & Reiss, S. (1993). Anxiety sensitivity index revised test manual. Worthington, OH: IDS Publishing Corporation.
Pine, D. S., Klein, R. G., Coplan, J. D., Papp, L. A., Hoven, C. W., Martinez, J., Kovalenko, P., Mandell, D. J., Moreau, D., Klein, D. F. & Gorman, J. M. (2000). Differential carbon dioxide sensitivity in childhood anxiety disorders and non-ill comparison group. Archives of General Psychiatry, 57, 960-967.
Potts, N. L. & Davidson, J. R. (1992). Social phobia: Biological aspects and pharmacotherapy. Progress in Neuorpsychopharmacological Biological Psychiatry, 16, 635-646.
Potts, N. L., Davidson, J. R., Krishnan, K. R. R., Doraiswamy, P. M. & Ritchie, J. C. (1991). Levels of urinary free cortisol in social phobia. Journal of Clinical Psychiatry, 52, 41-42.
List of References
232
Poulton, R. G. & Andrews, G. (1994). Appraisal of danger and proximity in social phobics. Behaviour Research and Therapy, 32, 639-642.
Pylyshyn, Z. W. (1973). The role of competence theories in cognitive psychology. Journal of Psycholinguistic Research, 2, (1), 21-50.
Quigley, K. S. & Bernston G. G. (1990). Autonomic origins of cardiac responses to nonsignal stimuli in the rat. Behavioral Neuroscience, 104, 751-762.
Rachman, S., Grüter-Andrew, J. & Shafran, R. (2000). Post-event processing in social anxiety. Behaviour Research and Therapy, 38, 611-617.
Rapee, R. M. (1995). Descriptive psychopathology of social phobia. In R. G. Heimberg, M. Liebowitz, D. Hope & F. Schneier (Eds.). Social phobia: Diagnoses, assessment, and treatment (pp. 41-66). New York: Guilford.
Rapee, R. M., Brown, T. A., Antony, M. M. & Barlow, D. H. (1992). Response to hyperventilation and inhalation of 5.5% carbon dioxide-enriched air across the DSM-III-R anxiety disorders. Journal of Abnormal Psychology, 101, 538-552.
Rapee, R. M. & Heimberg, R. G. (1997). A cognitive-behavioral model of anxiety in social phobia. Behaviour Research and Therapy, 35, 741-756.
Rapee, R. M. & Lim, L. (1992). Discrepancy between self-and observer ratings of performance in social phobics. Journal of Abnormal Psychology, 101, 728-731.
Rapee, R. M., Sanderson, W. C. & Barlow, D. H. (1988). Social phobia features across the DSM-III-R anxiety disorders. Journal of Psychopathology and Behavioural Assessment, 10, 287-299.
Reich, J. & Yates, W. (1988). Family history of psychiatric disorders in social phobia. Comprehensive Psychiatry, 42, 446-452.
Reiss, S., Peterson, R., Gursky, D. M. & McNally, R. (1986). Anxiety sensitivity, anxiety frequency and the prediction of fearfulness. Behaviour Research and Therapy, 24, (1), 1-8.
Reiss, D., Plomin, R. & Hetherington, E. M. (1991). Genetics and psychiatry: An unheralded window on the environment. American Journal of Psychiatry, 148, 283-291.
Ries, B. J., McNeil, D. W., Boone, M. L., Turk, C. L., Carter, L. E. & Heimberg, R. G. (1998). Assessment of contemporary social phobia verbal report instruments. Behaviour Research and Therapy, 36, 983-994.
Robins, L. N. & Regier, D. A. (Eds.). (1991). Psychiatric disorders in America. The Epidemiologic Catchment Area Study. New York, Oxford, Singapore, Sydney: Maxwell Macmillan International.
Rolls, E. T. (1992). Neurophysiology and functions of the primate amygdala. In J. P. Aggleton (Ed.), The amygdala: Neurobiological aspects of emotion, memory and mental dysfunction (pp. 143-167). New York: Wiley.
List of References
233
Roth, D., Antony, M . M. & Swinson, R. P. (2001). Interpretations for anxiety symptoms in social phobia. Behaviour Research and Therapy, 39, 129-138.
Rotter, J. B. (1966). Generalized expectancies for internal versus external control of reinforcement. Psychological Monographs, 80, 1-28.
Ruiz-Padial, E., Sollers, J. J., Vila, J. & Thayer, J. F. (2003). The rhythm of the heart in the blink of an eye: Emotion-modulated startle magnitude covaries with heart rate variability. Psychophysiology, 40, (2), 306-313.
Sabatinelli, D., Bradley, M. M., Cuthbert, B. N. & Lang, P. J. (1996). Wait and see: aversion and activation in anticipation and perception. Psychophysiology, 34, S77.
Saboonchi, F., Lundh, L. G. & Ost, L. G. (1999). Perfectionism and self-consciousness in social phobia and panic disorder with agoraphobia. Behaviour Research and Therapy, 37, 799-808.
Salkovskis, P. (1991). The importance of behaviour in the maintenance of anxiety and panic: A cognitive account. Behavioural Psychotherapy, 19, 6-19.
Salter, A. (1949). Conditioned reflex therapy. New York: Farrat & Straus.
Sandín, B. (1981). Consideraciones sobre el cuestionario BSQ. Revista de Psicología General y Aplicada, 169, 323-327.
Sandín, B., Chorot, P. & McNally, R. J. (1996). Validation of the Spanish version of the Anxiety sensitivity index in a clinical sample. Behaviour Research and Therapy, 34, 283-290.
Sánz, J. & Vázquez, C. (1998). Fiabilidad, validez y datos normativos del Inventario para la depresión de Beck. Psicothema, 10, 303-318.
Schlenker, B. R. & Leary, M. R. (1982). Social anxiety and self-presentation: A conceptualization and model. Psychological Bulletin, 92, 641-669.
Schneider, F., Weiss, U., Kessler, C. Müller-Gärtner, H.-W., Posse, S., Salloum, J. B., Grodd, W., Himmelmann, F., Gaebel, W. & Birbaumer, N. (1999). Subcortical correlates of differential classical conditioning of aversive emotional reactions in social phobia. Biological Psychiatry, 45, 863-871.
Schneier, F. R., Chin, S. J., Hollander, E. & Liebowitz, M. R. (1992). Fluoxetine in social phobia [Letter to the editor]. Journal of Clinical Psychopharmacology, 12, 62-64.
Schneier, F. R., Johnson, J., Hornig, C. D., Liebowitz, M. R. & Weissman, M. M. (1992). Social phobia. Comorbidity and morbidity in an epidemiologic sample. Archives of General Psychiatry, 49, 282-288.
Schneier, F. R., Liebowitz, M. R., Abi-Dargham, A., Zea-Ponce, Y., Lin, S.-H. & Laruelle, M. (2000). Low dopamine d2 receptor binding potential in social phobia. American Journal of Psychiatry, 157, 457-459.
List of References
234
Schneier, F. R., Spitzer, R. L., Gibbon, M., Fyer, A. J. & Liebowitz, M. R. (1991). The relationship of social phobia subtypes and avoidant personality disorder. Comprehensive Psychiatry, 32, 496-502.
Schneirla, T. (1959). An evolutionary and developmental theory of biphasic processes underlying approach and withdrawal. In M. Jones (Ed), Nebraska Symposium on Motivation (pp. 1-42). Lincoln: University of Nebraska Press.
Schupp, H. T., Cuthbert, B. N., Bradley, M. M., Lang, P. J. & Birbaumer, N. (1993). Imaging the percept: Cortical and peripheral measures [Abstract]. Psychophysiology, 30, 58.
Schwaber, J. S., Kapp, B. S., Higgins, G. A. & Rapp, P. R. (1982). Amygdaloid basal forebrain direct connections with the nucleus of the solitary tract and the dorsal motor nucleus. Journal of Neuroscience, 2, 1424-1438.
Schwartz, G. E. (1971). Cardiac responses to self-induced thoughts. Psychophysiology, 8, (4), 462-467.
Schwartz, G. E., Weinberger, D. A. & Singer, J. A. (1981). Cardiovascular differentiation of happiness, sadness, anger and fear following imagery and exercise. Psychosomatic Medicine, 43, 343-364.
Schwebel, D. & Suls, J. (1999). Cardiovascular reactivity and neuroticism: Results from a laboratory and controlled ambulatory stress protocol. Journal of Personality, 67, (1), 67-92.
Sequeira-Martinho, H. & Roy, J. C. (1993). Cortical and hypothalamo-limbic control of electrodermal responses. In J. C. Roy & W. Boucsein, Progress in electrodermal research (pp. 93-114). New York, NY: Plenum Press.
Shapiro, D., Jamner, L. D., Lane, J. D., Light, K. C., Myrtek, M., Sawada, Y. & Steptoe, A. (1996). Blood pressure publication guidelines. Psychophysiology, 33 (1), 1-12.
Sheehan, P. W. (1967a). A shortened form of the Betts’ Questionnaire upon mental imagery. Journal of Clinical Psychology, 23, 386-389.
Sheehan, P. W. (1967b). Reliability of a short test of imagery. Perceptual and Motor Skills, 25, 744.
Shields, S. A., MacDowell, K. A., Fairchild, S. B. & Campbell, M. L. (1987). Is mediation of sweating cholinerg, adrenergic, or both? A comment on the literature. Psychophysiology, 24, 312-319
Shiffrin, R. M. & Schneider, W. (1977). Controlled and automatic human information processing: II. Perceptual learning, automatic attending, and a general theory. Psychological Review, 84, 127-190.
Siegel, W. C., Blumenthal, J. A. & Divine, G. W. (1990). Physiological, psychological and behavioral factors and white coat hypertension. Hypertension, 16, (2), 140-146.
List of References
235
Skinner, E. A. (1996). A guide to constructs of control. Journal of Personality and Social Psychology, 71, 549-570.
Skre, I., Onstad, S., Torgersen, S., Lygren, S. & Kringlen, E. (2000). The heritability of common phobic fear: A twin study of a clinical sample. Journal of Anxiety Disorders, 14, 549-562.
Slaap, B. R., vanVliet, I. M., Westenberg, H. G. M. & den Boer, J. A. (1996). Responders and non-responders to drug treatment in social phobia: differences at baseline and prediction of response. Journal of Affective Disorders, 39, 13-19.
Spielberger, C. D., Gorsuch, R. L., Lushene, R., Vagg, P. R. & Jacobs, G. A. (1983). Manual for the State-trait anxiety inventory (from Y). Palo Alto, CA: Mind Garden.
Spurr, J. M. & Stopa, L. (2003). The observer perspective: effects on social anxiety and performance. Behaviour Research and Therapy, 41, 1009-1028.
Stangier, U. & Fydrich, T. (2002). Das Störungskonzept der Sozialen Phobie oder der Sozialen Angststörung. In U. Stangier & T. Fydrich (Eds.). Soziale Phobie und Soziale Angststörung. Psychologische Grundlagen, Diagnostik und Therapie (pp. 10-33). Göttingen: Hogrefe Verlag.
Stein, M. B., Asmundson, G. J. G. & Chartier, M. (1994). Autonomic responsivity in generalized social phobia. Journal of Affective Disorders, 31, 211-221.
Stein, M. B., Chartier, M. J., Hazen, A. L., Kozak, M. V., Tancer, M. E., Lander, S., Furer, P., Chubaty, D. & Walker, J. R. (1998). A direct-interview family study of generalized social phobia. American Journal of Psychiatry, 155, 90-97.
Stein, M. B., Delaney, S. M., Chartier, M. J., Kroft, C. D. L. & Hazan, A. L. (1995). Paroxetine binding to patelets of patients with social phobia: Comparison to patients with panic disorder and healthy volunteers. Biological Psychiatry, 37, 224-228.
Stein, M. B., Heuser, I. J., Juncos, J. L. & Uhde, T. W. (1990). Anxiety disorders in patients with Parkinson’s disease. American Journal of Psychiatry, 147, 217-220.
Stein, M. B., Huzel, L. L. & Delaney, S. M. (1993). Lymphocyte beta-adrenoceptors in social phobia. Biological Psychiatry, 34, 45-50.
Stein, M. B., Walker, J. R. & Forde, D. R. (1996). Public speaking fears in a community sample. Prevalence, impact on functioning, and diagnostic classification. Archives of General Psychiatry, 53, 169-174.
Stemberger, R. T., Turner, S. M., Beidel, D. C. & Calhoun, K. S. (1995). Social phobia: An analysis of possible developmental factors. Journal of Abnormal Psychology, 104, 526-531.
Stern, R. M., Ray, W. J. & Quigley, K. S. (2001). Psychophysiological recording, 2nd edition. Oxford: University Press.
Sternbach, H. (1990). Fluoxetine treatment of social phobia. Journal of Clinical Psychopharmacology, 10, 230-231.
List of References
236
Stopa, L. & Clark, D. M. (1993). Cognitive processes in social phobia. Behaviour Research and Therapy, 31, 225-267.
Stopa, L. & Clark, D. M. (2000). Social phobia and interpretation of social events. Behaviour Research and Therapy, 38, 273-283.
Strauman, T. J. (1989). Self-discrepancies in clinical depression and social phobia: Cognitive structures that underlie emotional disorders? Journal of Abnormal Psychology, 98, (1), 14-22.
Strom, J. C. & Buck, R. W. (1979). Staring and participant’s sex: Physiological and subjective reactions. Personality and Social Psychology Bulletin, 5 (1), 114-117.
Tancer, M. E., Mailman, R. B., Stein, M. B., Mason, G. A., Carson, S. W. & Golden, R. N. (1994). Neuroendocrine responsivity to monaminergic system probes in generalized social phobia. Anxiety, 1, 216-223.
Tancer, M. E., Stein, M. B., Gelernter, C. S. & Uhde, T. W. (1990). The hypothalamic-pituitary-thyroid axis in social phobia. American Journal of Psychiatry, 147, 929-933.
Tancer, M. E., Stein, M. B. & Uhde, T. W. (1993). Growth hormone response to intravenous clonidine in social phobia: Comparison to patients with panic disorder and healthy volunteers. Biological Psychiatry, 34, 591-595.
Tancer, M. E., Stein, M. B. & Uhde, T. W. (1994). Lactic acid response to caffeine in panic disorder: comparison with social phobics and normal controls. Anxiety, 1, 138-140.
Tassinary, L. G. & Cacioppo, J. T. (1992). Unobservable facial actions and emotion. Psychological Science, 3, (1), 28-33.
Tassinary, L. G. & Cacioppo, J. T. (2000). The skeletomotor system. Surface Electromyography. In J. T. Cacioppo, L. G. Tassinary, & G. G. Bernston (Eds.), Handbook of Psychophysiology, 2nd ed., (pp.163-199). Cambridge: University Press.
Thayer, J. F., Friedman, B. H. & Borkovec, T. D. (1996). Autonomic characteristics of generalized anxiety disorder and worry. Biological Psychiatry, 39, 255-266.
Thayer, J. F. & Siegle, G. J. (2002). Neurovisceral integration in cardiac and emotional regulation. IEEE-E. Medical Biological Magazine, 21, (4), 24-29.
Tiihonen, J., Kuikka, J., Bergström, K., Leopola, U., Koponen, H. & Leinonen, E. (1997). Dopamine reuptake site densities in patients with social phobia. American Journal of Psychiatry, 154, 239-242.
Tillfors, M., Furmark, T., Marteinsdottir, I., Fischer, H., Pissiota, A., Långström, B. & Fredrikson, M. (2001). Cerebral blood flow in subjects with social phobia during stressful speaking tasks: A PET study. American Journal of Psychiatry, 158, (8), 1220-1226.
Tooby, J. & Cosmides, L. (1990). The past explains the present: Emotional adaptations and the structure of ancestral environment. Ethological Sociobiology, 11, 375-424.
List of References
237
Townsley, R. M. (1992). Social phobia: Identification of possible etiological factors. Doctoral dissertation: University of Georgia, Athens.
Tran, G. O. & Chambless, D. L. (1994). Subtypes of social phobia and avoidant personality disorder. Manuscript submitted for publication.
Tran, G. O. & Chambless, D. L. (1995). Psychopathology of social phobia: Effects of subtype and of avoidant personality disorder. Journal of Anxiety Disorders, 9, 489-501.
Tranel, D. & Damasio, H. (1994). Neuroanatomical correlates of electrodermal skin conductance responses. Psychophysiology, 31, 427-438.
Trower, P., Bryant, B. & Argyle, M. (1978). Social skills and mental health. Pittsburgh: University of Pittsburgh Press.
Turner, S. M., Beidel, D. C., Dancu, C. V. & Keys, D. J. (1986). Psychopathology of social phobia and comparison to avoidant personality disorder. Journal of Abnormal Psychology, 95, 389-394.
Turner, S. M., Beidel, D. C., Dancu, C. V. & Stanley, M. A. (1989). An empirically derived inventory to measure social fears and anxiety: The social phobia and anxiety inventory. Psychological Assessment, 1, 35-40.
Turner,. S. M., Beidel, D. C. & Larkin, K. T. (1986). Situational determinants of social anxiety in clinic and nonclinic samples: physiological and cognitive correlates. Journal of Consulting and Clinical Psychology, 33, 338-457.
Turner, S. M., Beidel, D. C. & Townsley, R. M. (1992). Social phobia: Relationship to shyness. Behaviour Research and Therapy, 28, 497-505.
Turner, J. R., Carroll, D. & Courtney, H. (1983). Cardiac and metabolic responses to “space invaders”: An instance of metabolically exaggerated cardiac adjustment? Psychophysiology, 20, (5), 544-549.
Uhde, T. W., Tancer, M. E., Gelernter, C. S. & Vittone, B. J. (1994). Normal urinary free cortisol and postdexamethasone cortisol in social phobia: Comparison to normal volunteers. Journal of Affective Disorders, 30, 155-161.
Urraca, S. (1981). Actitudes ante la muerte (preocupación, ansiedad, temor) y religiosidad. Tesis Doctoral, Facultad de Psicología, Universidad Complutense de Madrid.
vanAmeringen, M., Mancini, C. & Streiner, D. L. (1993). Fluoxetine efficacy in social phobia. Journal of Clinical Psychiatry, 54, 27-32.
vanOyen Witvliet, C. & Vrana, S. R. (1995). Psychophysiological responses as indices of affective dimensions. Psychophysiology, 32, (5), 436-443.
vanSteenis, H. G., Martens, W. L. & Tulen, J. H. (2002). Time-frequency parameters of heart-rate variability. IEEE-E. Medical Biological Magazine, 21, (4), 46-58.
List of References
238
vanVliet, I. M., den Boer, J. A. & Westenberg, H. G. M. (1994). Psychopharmacological treatment of social phobia: A double-blind, placebo-controlled study with fluvoxamine. Psychopharmacology, 155, 128-134.
vanVliet, I. R., den Boer, J. A. & Westenberg, H. G. M. (1992). Psychopharmacological treatment of social phobia: clinical and biochemical effects of brofaromine, a selective MAO-A inhibitor. European Neuropsychopharmacology, 2, 21-29.
Vasey, M. W. & Thayer, J. F. (1987). The continuing problem of false positives in repeated measures ANOVA in psychophysiology: A multivariate solution. Psychophysiology, 24, 479-486.
Vázquez, C. & Sánz, J. (1997). Fiabilidad y valores normativos de la versión española del Inventario para la Depresión de Beck de 1978. Clínica y Salud, 8, 403-422.
Vázquez, C. & Sánz, J. (1999). Fiabilidad y validez de la versión española del Inventario para la Depresión de Beck de 1978, en pacientes con trastornos psicológicos. Clínica y Salud, 10, 59-81.
Versiani, M., Nardi, A. E., Mundim, F. D., Alves, A. B., Liebowitz, M. R. & Amrein, R. (1992). Pharmacotherapy of social phobia: A controlled study with moclobemide and phenelzine. British Journal of Psychiatry, 161, 353-360.
Vila, J. (2000). Una introducción a la psicofisiología clínica. Madrid: Ediciones Pirámide.
Vila, J., Fernández, M. C., Pegalajar, J., Vera, M. N., Robles, H., Pérez, N., Sánchez, M. B., Ramírez, I. & Ruiz-Padial, E. (2003). A new look at cardiac defense: attention or emotion? The Spanish Journal of Psychology, 6, (1), 60-78.
Vila, J., Sánchez, M., Ramírez, I., Fernández, M. C., Cobos, P., Rodríguez, S., Muñoz, M. A., Tormo, M. P., Herrero, M., Segarra, P., Pastor, M. C., Montañes, S., Poy, R. & Moltó, J. (2001). El sistema internacional de imágenes afectivas (IAPS): Adaptación española. Segunda parte. Revista de Psicología Gral y Aplicación, 54, (4), 635-657.
Vrana, S. R., Constantine, J. A. & Westman, J. S. (1992). Startle reflex modification as an outcome measure in the treatment of phobia: two case studies. Behavioral Assessment, 14, (3-4), 279-291.
Vrana, S. R., Cuthbert, B. N. & Lang, P. J. (1986). Fear imagery and text processing. Psychophysiology, 23, 247-253.
Vrana, S. R. & Lang, P. L. (1990). Fear imagery and the startle-probe reflex. Journal of Abnormal Psychology, 99, (2), 189-197.
Vrana, S. R., Spence, E. L. & Lang, P. J. (1988). The startle probe response: A new measure of emotion? Journal of Abnormal Psychology, 97, (4), 487-491.
Wacker, H. R., Müllejans, R., Klein, K. H. & Battegay, R. (1992). Identification of cases of anxiety disorders and affective disorders in the community according to ICD-10 and DSM-III-R using the Composite International Diagnostic Interview (CIDI). International Journal of Methods in Psychiatric Research, 2, 91-100.
List of References
239
Wallace, S. T. & Alden, L. E. (1991). A comparison of social standards and perceived ability in anxious and nonanxious men. Cognitive Therapy and Research, 15, 237-254.
Watson, D. & Friend, R. (1969). Measurement of social evaluative anxiety. Journal of Consulting and Clinical Psychology, 33, 448-457.
Weinmann, M., Bader, J.-P., Endrass J. & Hell, D. (2001). Sind Kompetenz- und Kontrollüberzeugungen depressionsabhängig? Eine Verlaufsuntersuchung. Zeitschrift für Klinische Psychologie, 30, (3), 153-158.
Weizman, R., Laor, N., Karp, L., Dagan, E., Reiss, A., Dar, D. E., Wolmer, L. & Gavish, M. (1994). Alteration of platelet benzodiazaepine receptors by stress of war. American Journal of Psychiatry, 151, 766-767.
Wells, A., Clark, D. M. & Ahmad, S. (1998). How do I look with my minds eye: perspective taking in social phobic imagery. Behaviour Research and Therapy, 36, 631-634.
Wells, A., Clark, D. M., Salkovskis, P., Ludgate, J., Hackmann, A. & Gelder, M. G. (1995). Social phobia: The role of in-situation safety behaviors in maintaining anxiety and negative beliefs. Behavior Therapy, 26, 153-161.
White, K. D. & Davey, G. C. L. (1989). Sensory preconditioning and UCS inflation in human fear conditioning. Behaviour Research and Therapy, 27, 161-166.
White, K. D., Sheehan, P. W. & Ashton, R. (1977). Imagery assessment: A survey of self-report measures. Journal of Mental Imagery, 1, 145-179.
White, R. W. (1959). Motivation reconsidered: The concept of competence. Psychological Review, 66, 279-333.
White, S. R. & Neuman, R. S. (1980). Facilitation of spinal motoneuron excitability by 5-hydroxytryptamine and noradrenaline. Brain Research, 185, 1-9.
Winton, E. C., Clark, D. M. & Edelmann, R. J. (1995). Social anxiety, fear of negative evaluation and the detection of negative emotion in others. Behaviour Research and Therapy, 33, 193-196.
Winton, W. M., Putnam, L. E. & Krauss, R. M. (1984). Facial and autonomic manifestations of the dimensional structure of emotion. Journal of Experimental Social Psychology, 20, 195-216.
Wittchen, H.-U. (1993). Epidemiologie und Komorbidität. In F. Holsboer & M. Phillipp (Eds.), Angststörungen, Pathogenese-Diagnostik-Therapie (pp. 40-58). Gräfelfing: SM Verlagsgesellschaft GmbH.
Wittchen, H.-U. & Fehm, L. (2001). Epidemiology, patterns of comorbidity, and associated disabilities of social phobia. The Psychiatric Clinics of North America, 24, (4), 617-641.
List of References
240
Wittchen, H.-U., Lieb, R., Schuster, P. & Oldehinkel, T. (1999). When is onset? Investigations into early developmental stages of anxiety and depressive disorders. In J. L. Rapoport (Ed.), Childhood onset of “adult” psychopathology, clinical and research advances (pp. 259-302). Washington: American Psychiatric Press.
Wittchen, H.-U., Nelson, C. B. & Lachner, G. (1998). Prevalence of mental disorders and psychological impairments in adolescents and young adults. Psychological Medicine, 28, 109-126.
Wittchen, H.-U., Pfister, H. B., Winter, S. & Müller, N. (2000). Zusatzsurvey „Psychische Störungen“ ( Bundesgesundheitssurvey 98): Häufigkeit, psychosoziale Beeinträchtigung und Zusammenhänge mit körperlichen Erkrankungen. Teil 2: Tabellenband (Grundauszählung) und Anleitung Public Use File. Ergänzung zum Schlussbericht, Förderkennzeichen 01EH970/8 BMBFBW. München: Max-Planck-Institut für Psychiatrie, Eigendruck.
Wittchen, H.-U., Stein, M. B. & Kessler, R. (1999). Social fears and social phobia in a community sample of adolescents and young adults: Prevalence, risk factors and comorbidity. Psychological Medicine, 29, 309-323.
Wolpe, J. (1958). Psychotherapy by reciprocal inhibition. Stanford: Stanford University Press.
Young, A. W., Aggleton, J. P., Hellawell, D. J. Johnson, M., Broks, P. & Hanley, J. R. (1995). Face processing impairments after amygdalotomy. Brain, 118, 15-24.
Zweig, D. R. & Brown, S. D. (1985). Psychometric evaluation of a written stimulus presentation format for the Social interaction self-statement test. Cognitive Therapy and Research, 9, 285-295.
Appendix
APPENDIX
Questionnaire-based measurements1
A-1 Social phobia inventory (SPIN)
A-2 Social phobia scale (SPS)
A-3 Social interaction anxiety scale (SIAS)
A-4 Self-statement during public speaking scale (SSPS)
A-5 ADIS-Fobia social
A-6 Información General
A-7 Social phobia and anxiety inventory (SPAI)
A-8 Social interaction self-statement test (SISST)
A-9 Anxiety sensitivity index (ASI)
A-10 State trait anxiety inventory, subscale state anxiety (STAI-S)
A-11 State trait anxiety inventory, subscale trait anxiety (STAI-T)
A-12 Penn state worry questionnaire (PSWQ)
A-13 Beck depression inventory (BDI)
A-14 Questionnaire upon mental imagery (QMI)
A-15 Personal constructed scenes
A-16 Pre-imagery questionnaire
A-17 Self-assessment manikin (SAM)
A-18 Post-imagery questionnaire
A-19 Informed consent
1 For authors of the original version, translation and description of measurements see paragraph 2.2.1.
Appendix
Tables
B-1 Results concerning the assumption of normal distribution of means regarding questionnaires
B-2 Results concerning the assumption of normal distribution of means regarding physiological parameters during the defense paradigm
B-3 Results concerning the assumption of normal distribution of means regarding the SAM-rating and physiological parameters during the picture paradigm
B-4 Results concerning the assumption of normal distribution of means regarding the SAM-rating and physiological parameters during the imagery paradigm
B-5 Results concerning the assumption of homogeneity of variances regarding physiological parameters during the defense paradigm
B-6 Results concerning the assumption of homogeneity of variances regarding the SAM-rating and physiological parameters during the picture paradigm
B-7 Results concerning the assumption of homogeneity of variances regarding the SAM-rating and physiological parameters during the imagery paradigm
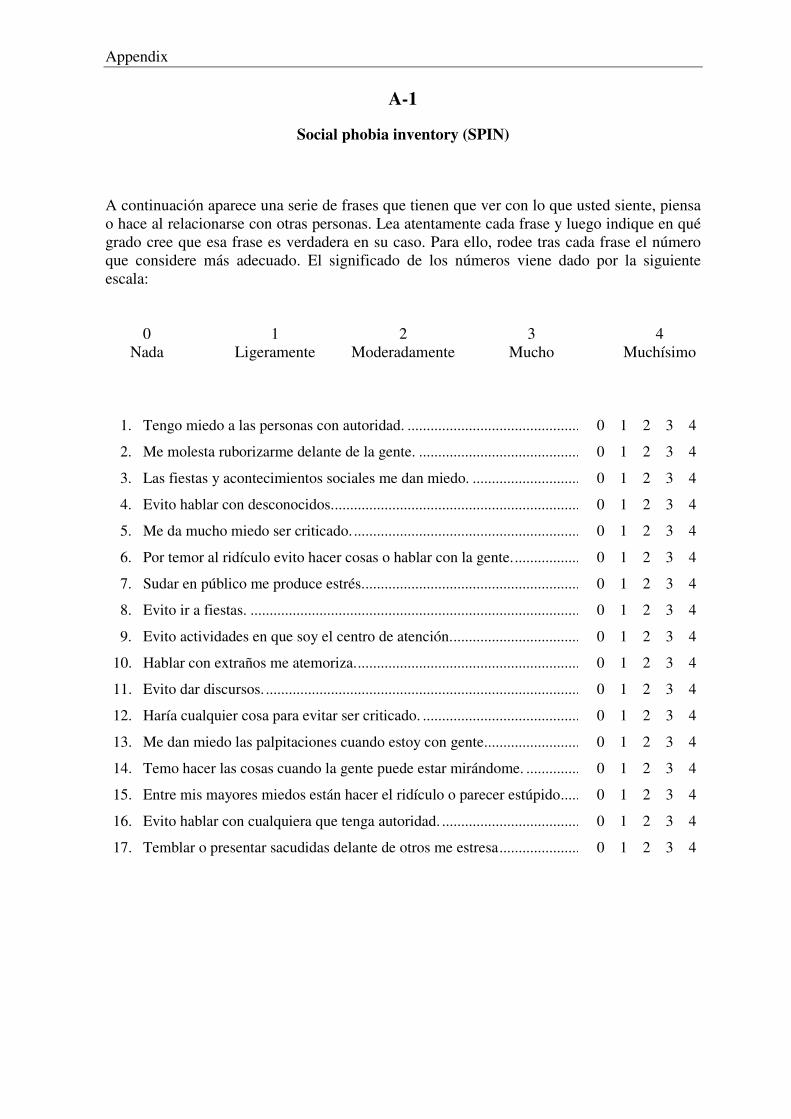
Appendix
A-1
Social phobia inventory (SPIN)
A continuación aparece una serie de frases que tienen que ver con lo que usted siente, piensa o hace al relacionarse con otras personas. Lea atentamente cada frase y luego indique en qué grado cree que esa frase es verdadera en su caso. Para ello, rodee tras cada frase el número que considere más adecuado. El significado de los números viene dado por la siguiente escala: 0 1 2 3 4 Nada Ligeramente Moderadamente Mucho Muchísimo 1. Tengo miedo a las personas con autoridad. ...............................................................
2. Me molesta ruborizarme delante de la gente. ............................................................
3. Las fiestas y acontecimientos sociales me dan miedo. ..............................................
4. Evito hablar con desconocidos...................................................................................
5. Me da mucho miedo ser criticado. .............................................................................
6. Por temor al ridículo evito hacer cosas o hablar con la gente....................................
7. Sudar en público me produce estrés...........................................................................
8. Evito ir a fiestas. ........................................................................................................
9. Evito actividades en que soy el centro de atención....................................................
10. Hablar con extraños me atemoriza.............................................................................
11. Evito dar discursos. ....................................................................................................
12. Haría cualquier cosa para evitar ser criticado. ...........................................................
13. Me dan miedo las palpitaciones cuando estoy con gente...........................................
14. Temo hacer las cosas cuando la gente puede estar mirándome. ................................
15. Entre mis mayores miedos están hacer el ridículo o parecer estúpido.......................
16. Evito hablar con cualquiera que tenga autoridad. ......................................................
17. Temblar o presentar sacudidas delante de otros me estresa.......................................
0 1 2 3 4
0 1 2 3 4
0 1 2 3 4
0 1 2 3 4
0 1 2 3 4
0 1 2 3 4
0 1 2 3 4
0 1 2 3 4
0 1 2 3 4
0 1 2 3 4
0 1 2 3 4
0 1 2 3 4
0 1 2 3 4
0 1 2 3 4
0 1 2 3 4
0 1 2 3 4
0 1 2 3 4
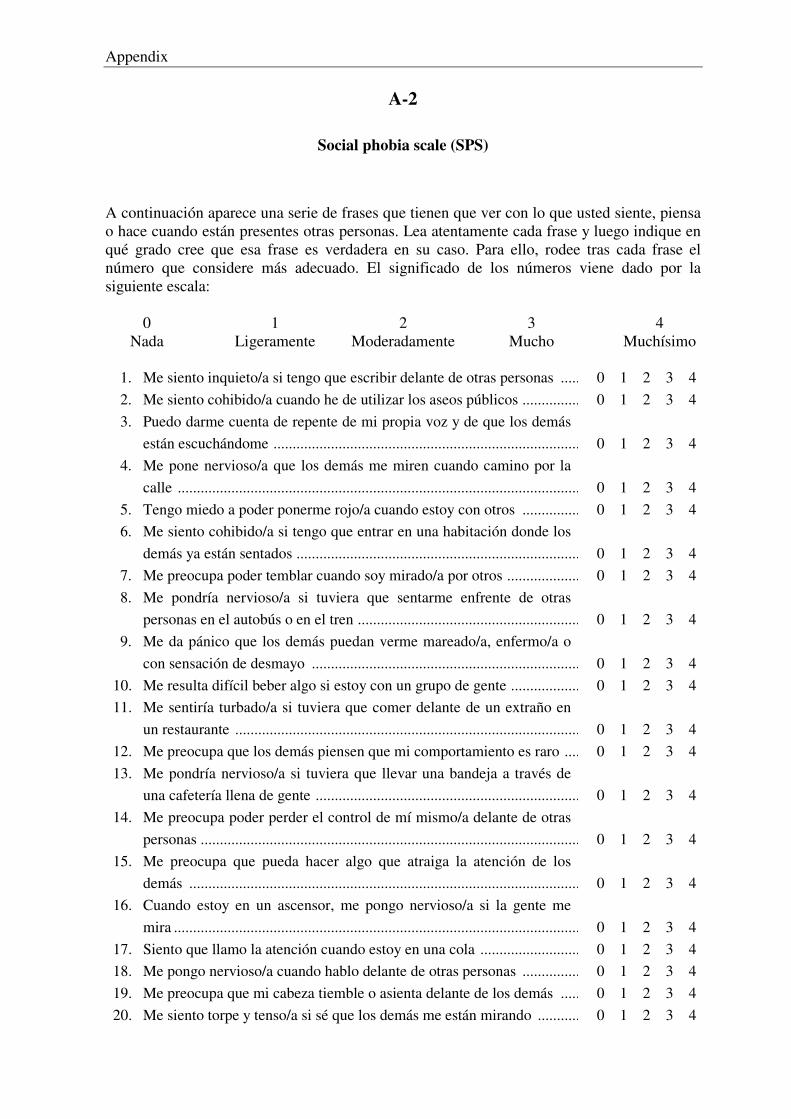
Appendix
A-2
Social phobia scale (SPS)
A continuación aparece una serie de frases que tienen que ver con lo que usted siente, piensa o hace cuando están presentes otras personas. Lea atentamente cada frase y luego indique en qué grado cree que esa frase es verdadera en su caso. Para ello, rodee tras cada frase el número que considere más adecuado. El significado de los números viene dado por la siguiente escala: 0 1 2 3 4 Nada Ligeramente Moderadamente Mucho Muchísimo 1. Me siento inquieto/a si tengo que escribir delante de otras personas ....................... 2. Me siento cohibido/a cuando he de utilizar los aseos públicos ................................. 3. Puedo darme cuenta de repente de mi propia voz y de que los demás
están escuchándome .................................................................................................. 4. Me pone nervioso/a que los demás me miren cuando camino por la
calle ........................................................................................................................... 5. Tengo miedo a poder ponerme rojo/a cuando estoy con otros ................................. 6. Me siento cohibido/a si tengo que entrar en una habitación donde los
demás ya están sentados ............................................................................................ 7. Me preocupa poder temblar cuando soy mirado/a por otros ..................................... 8. Me pondría nervioso/a si tuviera que sentarme enfrente de otras
personas en el autobús o en el tren ............................................................................ 9. Me da pánico que los demás puedan verme mareado/a, enfermo/a o
con sensación de desmayo ........................................................................................ 10. Me resulta difícil beber algo si estoy con un grupo de gente .................................... 11. Me sentiría turbado/a si tuviera que comer delante de un extraño en
un restaurante ............................................................................................................ 12. Me preocupa que los demás piensen que mi comportamiento es raro ...................... 13. Me pondría nervioso/a si tuviera que llevar una bandeja a través de
una cafetería llena de gente ....................................................................................... 14. Me preocupa poder perder el control de mí mismo/a delante de otras
personas ..................................................................................................................... 15. Me preocupa que pueda hacer algo que atraiga la atención de los
demás ........................................................................................................................ 16. Cuando estoy en un ascensor, me pongo nervioso/a si la gente me
mira ............................................................................................................................ 17. Siento que llamo la atención cuando estoy en una cola ............................................ 18. Me pongo nervioso/a cuando hablo delante de otras personas ................................. 19. Me preocupa que mi cabeza tiemble o asienta delante de los demás ....................... 20. Me siento torpe y tenso/a si sé que los demás me están mirando .............................
0 1 2 3 4 0 1 2 3 4
0 1 2 3 4
0 1 2 3 4 0 1 2 3 4
0 1 2 3 4 0 1 2 3 4
0 1 2 3 4
0 1 2 3 4 0 1 2 3 4
0 1 2 3 4 0 1 2 3 4
0 1 2 3 4
0 1 2 3 4
0 1 2 3 4
0 1 2 3 4 0 1 2 3 4 0 1 2 3 4 0 1 2 3 4 0 1 2 3 4
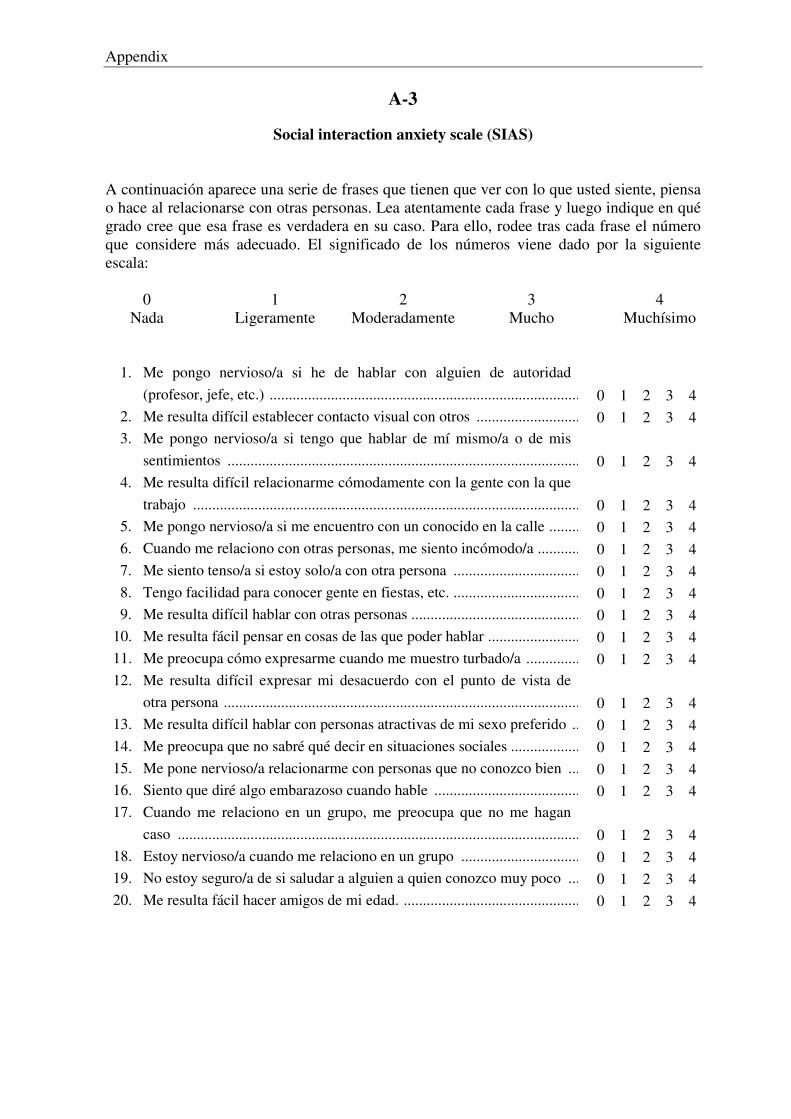
Appendix
A-3
Social interaction anxiety scale (SIAS) A continuación aparece una serie de frases que tienen que ver con lo que usted siente, piensa o hace al relacionarse con otras personas. Lea atentamente cada frase y luego indique en qué grado cree que esa frase es verdadera en su caso. Para ello, rodee tras cada frase el número que considere más adecuado. El significado de los números viene dado por la siguiente escala: 0 1 2 3 4 Nada Ligeramente Moderadamente Mucho Muchísimo 1. Me pongo nervioso/a si he de hablar con alguien de autoridad
(profesor, jefe, etc.) ................................................................................................... 2. Me resulta difícil establecer contacto visual con otros ............................................. 3. Me pongo nervioso/a si tengo que hablar de mí mismo/a o de mis
sentimientos .............................................................................................................. 4. Me resulta difícil relacionarme cómodamente con la gente con la que
trabajo ....................................................................................................................... 5. Me pongo nervioso/a si me encuentro con un conocido en la calle .......................... 6. Cuando me relaciono con otras personas, me siento incómodo/a ............................. 7. Me siento tenso/a si estoy solo/a con otra persona ................................................... 8. Tengo facilidad para conocer gente en fiestas, etc. ................................................... 9. Me resulta difícil hablar con otras personas .............................................................. 10. Me resulta fácil pensar en cosas de las que poder hablar .......................................... 11. Me preocupa cómo expresarme cuando me muestro turbado/a ................................ 12. Me resulta difícil expresar mi desacuerdo con el punto de vista de
otra persona ............................................................................................................... 13. Me resulta difícil hablar con personas atractivas de mi sexo preferido .................... 14. Me preocupa que no sabré qué decir en situaciones sociales .................................... 15. Me pone nervioso/a relacionarme con personas que no conozco bien ..................... 16. Siento que diré algo embarazoso cuando hable ........................................................ 17. Cuando me relaciono en un grupo, me preocupa que no me hagan
caso ........................................................................................................................... 18. Estoy nervioso/a cuando me relaciono en un grupo ................................................. 19. No estoy seguro/a de si saludar a alguien a quien conozco muy poco ..................... 20. Me resulta fácil hacer amigos de mi edad. ................................................................
0 1 2 3 4 0 1 2 3 4
0 1 2 3 4
0 1 2 3 4 0 1 2 3 4 0 1 2 3 4 0 1 2 3 4 0 1 2 3 4 0 1 2 3 4 0 1 2 3 4 0 1 2 3 4
0 1 2 3 4 0 1 2 3 4 0 1 2 3 4 0 1 2 3 4 0 1 2 3 4
0 1 2 3 4 0 1 2 3 4 0 1 2 3 4 0 1 2 3 4
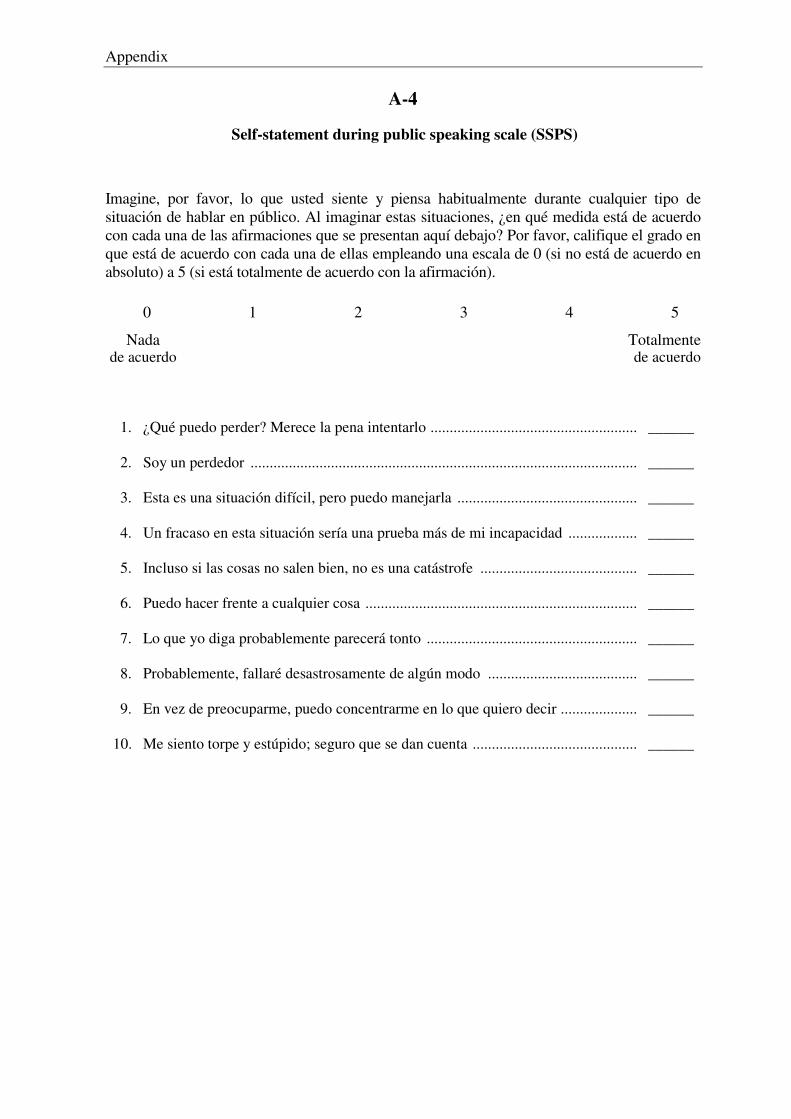
Appendix
A-4
Self-statement during public speaking scale (SSPS)
Imagine, por favor, lo que usted siente y piensa habitualmente durante cualquier tipo de situación de hablar en público. Al imaginar estas situaciones, ¿en qué medida está de acuerdo con cada una de las afirmaciones que se presentan aquí debajo? Por favor, califique el grado en que está de acuerdo con cada una de ellas empleando una escala de 0 (si no está de acuerdo en absoluto) a 5 (si está totalmente de acuerdo con la afirmación).
0 1 2 3 4 5 Nada Totalmente de acuerdo de acuerdo 1. ¿Qué puedo perder? Merece la pena intentarlo ..........................................................
2. Soy un perdedor .........................................................................................................
3. Esta es una situación difícil, pero puedo manejarla ...................................................
4. Un fracaso en esta situación sería una prueba más de mi incapacidad ......................
5. Incluso si las cosas no salen bien, no es una catástrofe .............................................
6. Puedo hacer frente a cualquier cosa ...........................................................................
7. Lo que yo diga probablemente parecerá tonto ...........................................................
8. Probablemente, fallaré desastrosamente de algún modo ...........................................
9. En vez de preocuparme, puedo concentrarme en lo que quiero decir ........................
10. Me siento torpe y estúpido; seguro que se dan cuenta ...............................................
______
______
______
______
______
______
______
______
______
______
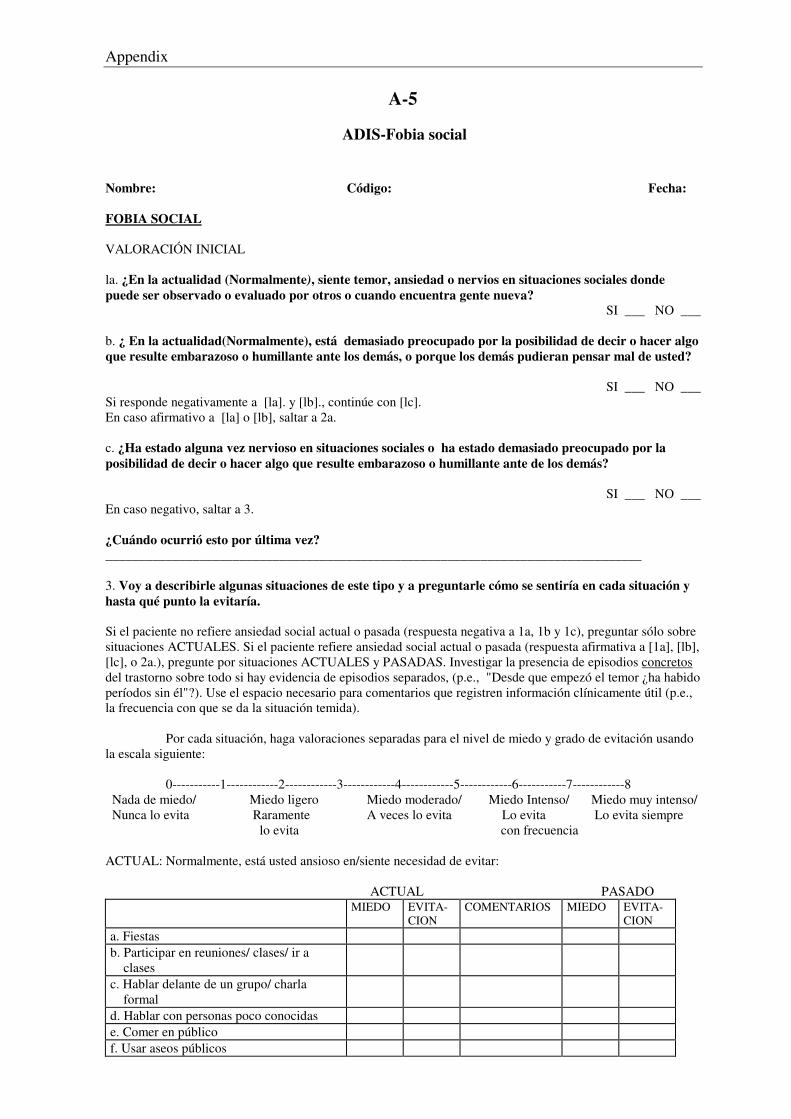
Appendix
A-5
ADIS-Fobia social Nombre: Código: Fecha: FOBIA SOCIAL VALORACIÓN INICIAL la. ¿En la actualidad (Normalmente), siente temor, ansiedad o nervios en situaciones sociales donde puede ser observado o evaluado por otros o cuando encuentra gente nueva?
SI ___ NO ___
b. ¿ En la actualidad(Normalmente), está demasiado preocupado por la posibilidad de decir o hacer algo que resulte embarazoso o humillante ante los demás, o porque los demás pudieran pensar mal de usted?
SI ___ NO ___ Si responde negativamente a [la]. y [lb]., continúe con [lc]. En caso afirmativo a [la] o [lb], saltar a 2a. c. ¿Ha estado alguna vez nervioso en situaciones sociales o ha estado demasiado preocupado por la posibilidad de decir o hacer algo que resulte embarazoso o humillante ante de los demás?
SI ___ NO ___ En caso negativo, saltar a 3. ¿Cuándo ocurrió esto por última vez? ________________________________________________________________________________ 3. Voy a describirle algunas situaciones de este tipo y a preguntarle cómo se sentiría en cada situación y hasta qué punto la evitaría. Si el paciente no refiere ansiedad social actual o pasada (respuesta negativa a 1a, 1b y 1c), preguntar sólo sobre situaciones ACTUALES. Si el paciente refiere ansiedad social actual o pasada (respuesta afirmativa a [1a], [lb], [lc], o 2a.), pregunte por situaciones ACTUALES y PASADAS. Investigar la presencia de episodios concretos del trastorno sobre todo si hay evidencia de episodios separados, (p.e., "Desde que empezó el temor ¿ha habido períodos sin él"?). Use el espacio necesario para comentarios que registren información clínicamente útil (p.e., la frecuencia con que se da la situación temida). Por cada situación, haga valoraciones separadas para el nivel de miedo y grado de evitación usando la escala siguiente: 0-----------1------------2------------3------------4------------5------------6-----------7------------8 Nada de miedo/ Miedo ligero Miedo moderado/ Miedo Intenso/ Miedo muy intenso/ Nunca lo evita Raramente A veces lo evita Lo evita Lo evita siempre lo evita con frecuencia ACTUAL: Normalmente, está usted ansioso en/siente necesidad de evitar: ACTUAL PASADO MIEDO EVITA-
CION COMENTARIOS MIEDO EVITA-
CION a. Fiestas b. Participar en reuniones/ clases/ ir a clases
c. Hablar delante de un grupo/ charla formal
d. Hablar con personas poco conocidas e. Comer en público f. Usar aseos públicos
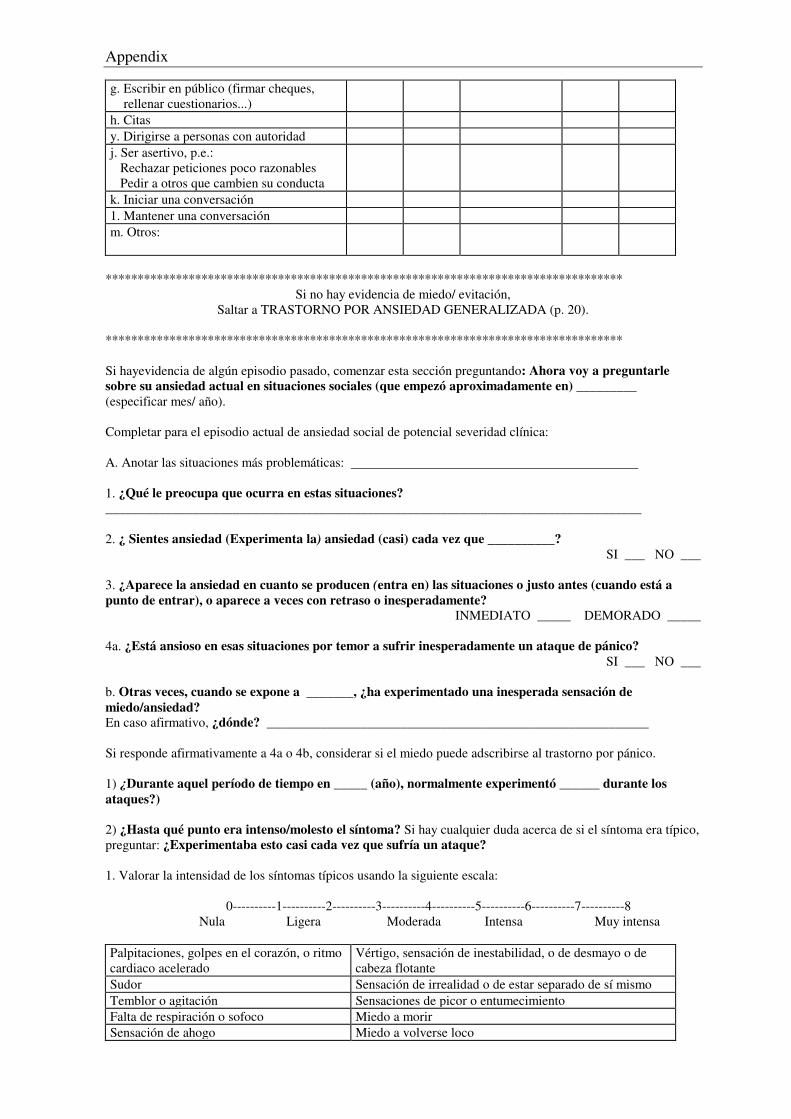
Appendix
g. Escribir en público (firmar cheques, rellenar cuestionarios...)
h. Citas y. Dirigirse a personas con autoridad j. Ser asertivo, p.e.: Rechazar peticiones poco razonables Pedir a otros que cambien su conducta
k. Iniciar una conversación 1. Mantener una conversación m. Otros:
*********************************************************************************
Si no hay evidencia de miedo/ evitación, Saltar a TRASTORNO POR ANSIEDAD GENERALIZADA (p. 20).
********************************************************************************* Si hayevidencia de algún episodio pasado, comenzar esta sección preguntando: Ahora voy a preguntarle sobre su ansiedad actual en situaciones sociales (que empezó aproximadamente en) _________ (especificar mes/ año). Completar para el episodio actual de ansiedad social de potencial severidad clínica: A. Anotar las situaciones más problemáticas: 1. ¿Qué le preocupa que ocurra en estas situaciones? ________________________________________________________________________________ 2. ¿ Sientes ansiedad (Experimenta la) ansiedad (casi) cada vez que __________?
SI ___ NO ___ 3. ¿Aparece la ansiedad en cuanto se producen (entra en) las situaciones o justo antes (cuando está a punto de entrar), o aparece a veces con retraso o inesperadamente?
INMEDIATO _____ DEMORADO _____ 4a. ¿Está ansioso en esas situaciones por temor a sufrir inesperadamente un ataque de pánico?
SI ___ NO ___
b. Otras veces, cuando se expone a _______, ¿ha experimentado una inesperada sensación de miedo/ansiedad? En caso afirmativo, ¿dónde? _________________________________________________________ Si responde afirmativamente a 4a o 4b, considerar si el miedo puede adscribirse al trastorno por pánico. 1) ¿Durante aquel período de tiempo en _____ (año), normalmente experimentó ______ durante los ataques?) 2) ¿Hasta qué punto era intenso/molesto el síntoma? Si hay cualquier duda acerca de si el síntoma era típico, preguntar: ¿Experimentaba esto casi cada vez que sufría un ataque? 1. Valorar la intensidad de los síntomas típicos usando la siguiente escala: 0----------1----------2----------3----------4----------5----------6----------7----------8 Nula Ligera Moderada Intensa Muy intensa Palpitaciones, golpes en el corazón, o ritmo cardiaco acelerado
Vértigo, sensación de inestabilidad, o de desmayo o de cabeza flotante
Sudor Sensación de irrealidad o de estar separado de sí mismo Temblor o agitación Sensaciones de picor o entumecimiento
Falta de respiración o sofoco Miedo a morir Sensación de ahogo Miedo a volverse loco
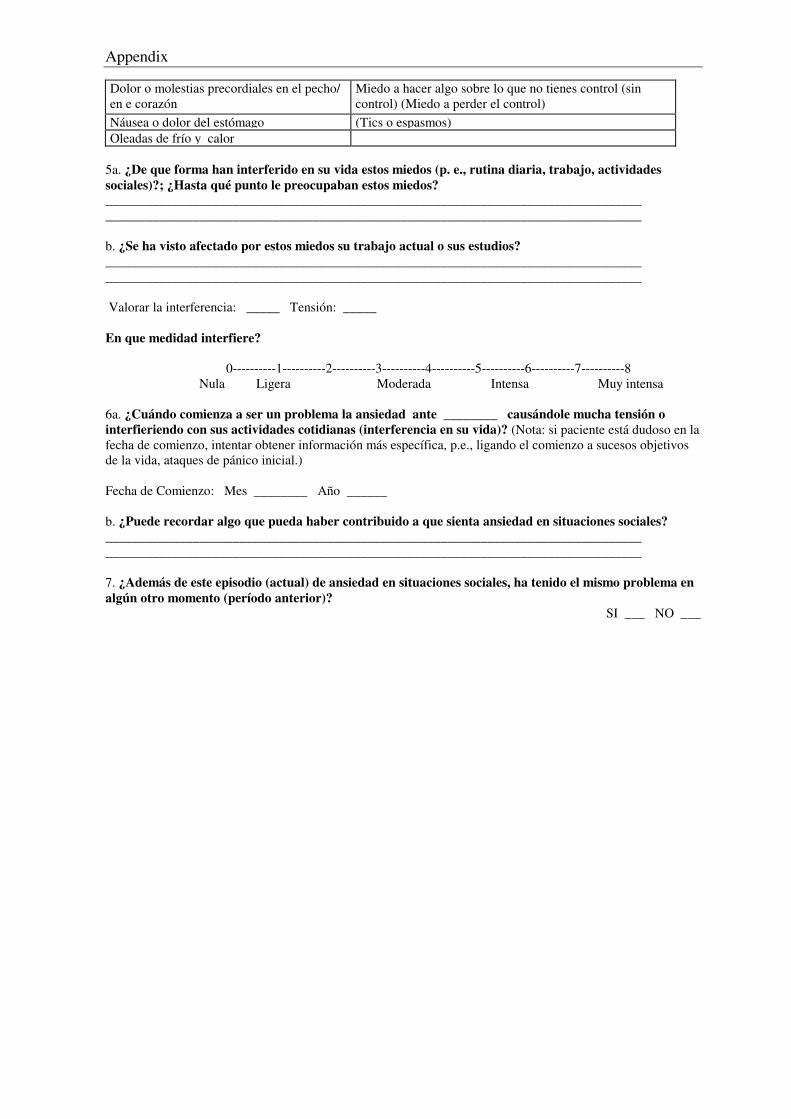
Appendix
Dolor o molestias precordiales en el pecho/ en e corazón
Miedo a hacer algo sobre lo que no tienes control (sin control) (Miedo a perder el control) Náusea o dolor del estómago (Tics o espasmos) Oleadas de frío y calor
5a. ¿De que forma han interferido en su vida estos miedos (p. e., rutina diaria, trabajo, actividades sociales)?; ¿Hasta qué punto le preocupaban estos miedos? ________________________________________________________________________________ ________________________________________________________________________________ b. ¿Se ha visto afectado por estos miedos su trabajo actual o sus estudios? ________________________________________________________________________________ ________________________________________________________________________________ Valorar la interferencia: _____ Tensión: _____ En que medidad interfiere? 0----------1----------2----------3----------4----------5----------6----------7----------8 Nula Ligera Moderada Intensa Muy intensa 6a. ¿Cuándo comienza a ser un problema la ansiedad ante ________ causándole mucha tensión o interfieriendo con sus actividades cotidianas (interferencia en su vida)? (Nota: si paciente está dudoso en la fecha de comienzo, intentar obtener información más específica, p.e., ligando el comienzo a sucesos objetivos de la vida, ataques de pánico inicial.) Fecha de Comienzo: Mes ________ Año ______ b. ¿Puede recordar algo que pueda haber contribuido a que sienta ansiedad en situaciones sociales? ________________________________________________________________________________ ________________________________________________________________________________ 7. ¿Además de este episodio (actual) de ansiedad en situaciones sociales, ha tenido el mismo problema en algún otro momento (período anterior)?
SI ___ NO ___
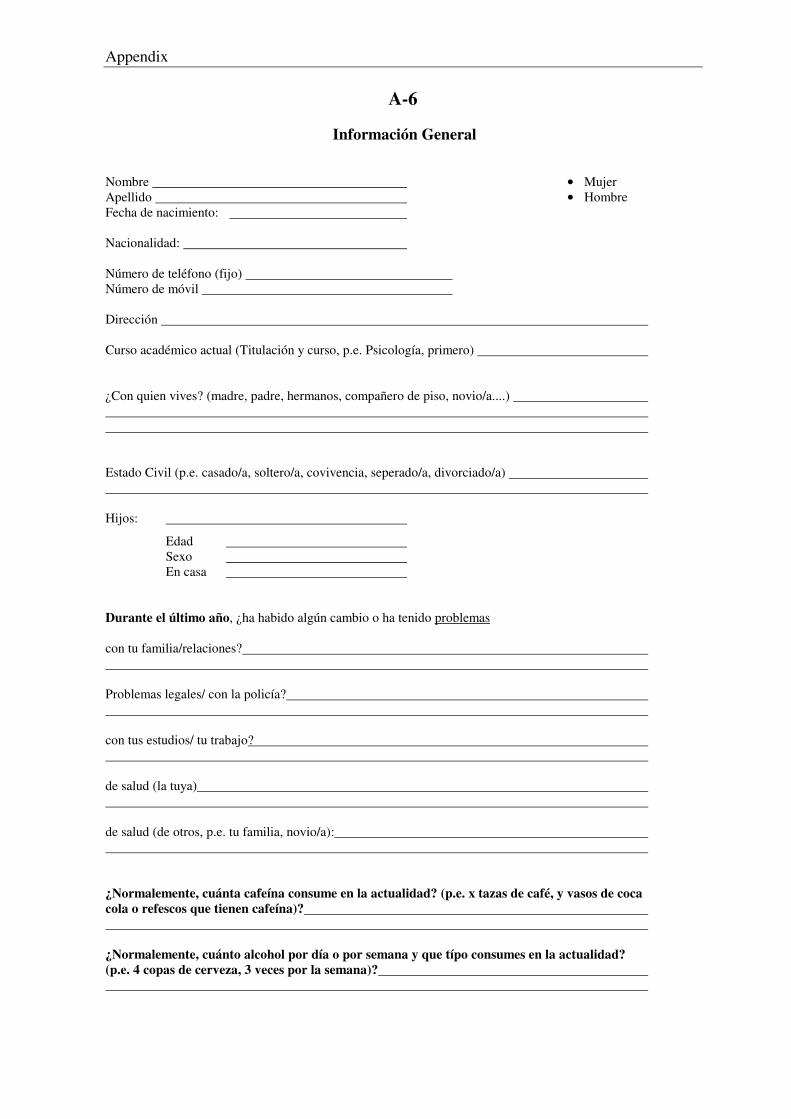
Appendix
A-6
Información General
Nombre • Mujer Apellido • Hombre Fecha de nacimiento: Nacionalidad: Número de teléfono (fijo) Número de móvil Dirección Curso académico actual (Titulación y curso, p.e. Psicología, primero) ¿Con quien vives? (madre, padre, hermanos, compañero de piso, novio/a....) Estado Civil (p.e. casado/a, soltero/a, covivencia, seperado/a, divorciado/a) Hijos:
Edad Sexo En casa Durante el último año, ¿ha habido algún cambio o ha tenido problemas con tu familia/relaciones? Problemas legales/ con la policía? con tus estudios/ tu trabajo? de salud (la tuya) de salud (de otros, p.e. tu familia, novio/a): ¿Normalemente, cuánta cafeína consume en la actualidad? (p.e. x tazas de café, y vasos de coca cola o refescos que tienen cafeína)? ¿Normalemente, cuánto alcohol por día o por semana y que típo consumes en la actualidad? (p.e. 4 copas de cerveza, 3 veces por la semana)?
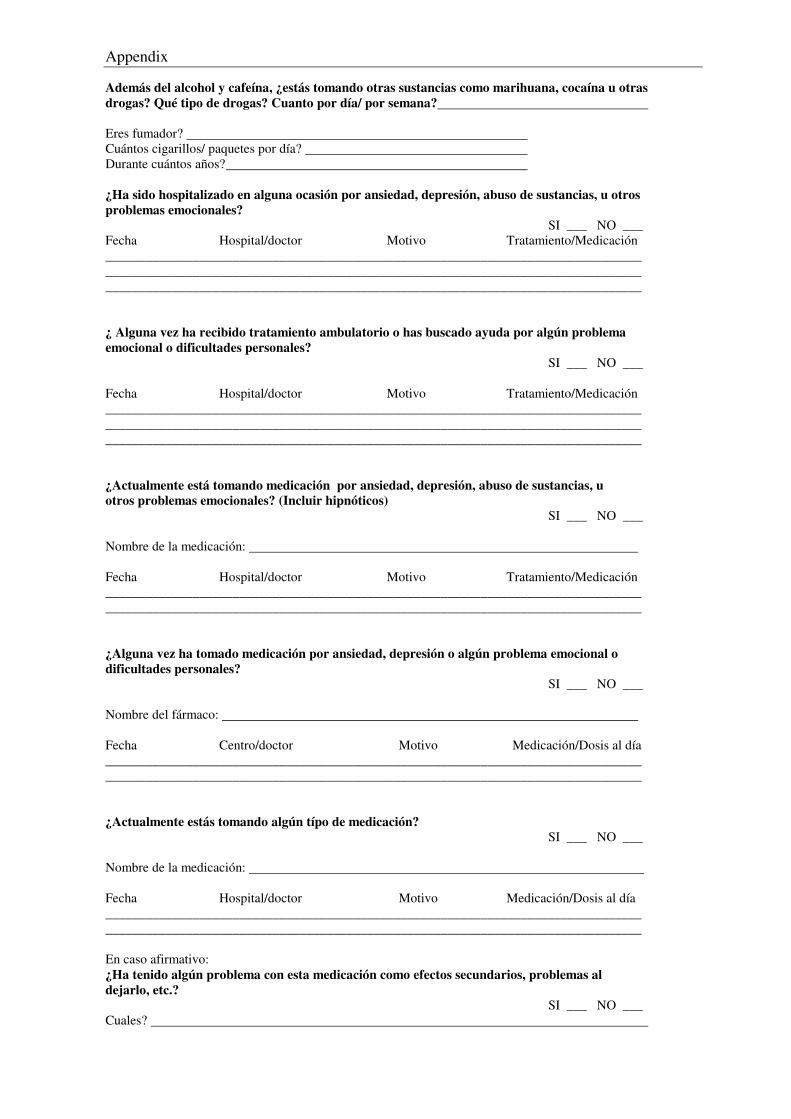
Appendix
Además del alcohol y cafeína, ¿estás tomando otras sustancias como marihuana, cocaína u otras drogas? Qué tipo de drogas? Cuanto por día/ por semana? Eres fumador? Cuántos cigarillos/ paquetes por día? Durante cuántos años? ¿Ha sido hospitalizado en alguna ocasión por ansiedad, depresión, abuso de sustancias, u otros problemas emocionales? SI ___ NO ___ Fecha Hospital/doctor Motivo Tratamiento/Medicación ________________________________________________________________________________ ________________________________________________________________________________ ________________________________________________________________________________ ¿ Alguna vez ha recibido tratamiento ambulatorio o has buscado ayuda por algún problema emocional o dificultades personales? SI ___ NO ___ Fecha Hospital/doctor Motivo Tratamiento/Medicación ________________________________________________________________________________ ________________________________________________________________________________ ________________________________________________________________________________ ¿Actualmente está tomando medicación por ansiedad, depresión, abuso de sustancias, u otros problemas emocionales? (Incluir hipnóticos) SI ___ NO ___
Nombre de la medicación:
Fecha Hospital/doctor Motivo Tratamiento/Medicación ________________________________________________________________________________ ________________________________________________________________________________ ¿Alguna vez ha tomado medicación por ansiedad, depresión o algún problema emocional o dificultades personales? SI ___ NO ___ Nombre del fármaco:
Fecha Centro/doctor Motivo Medicación/Dosis al día ________________________________________________________________________________ ________________________________________________________________________________ ¿Actualmente estás tomando algún típo de medicación? SI ___ NO ___
Nombre de la medicación:
Fecha Hospital/doctor Motivo Medicación/Dosis al día ________________________________________________________________________________ ________________________________________________________________________________ En caso afirmativo: ¿Ha tenido algún problema con esta medicación como efectos secundarios, problemas al dejarlo, etc.? SI ___ NO ___ Cuales?
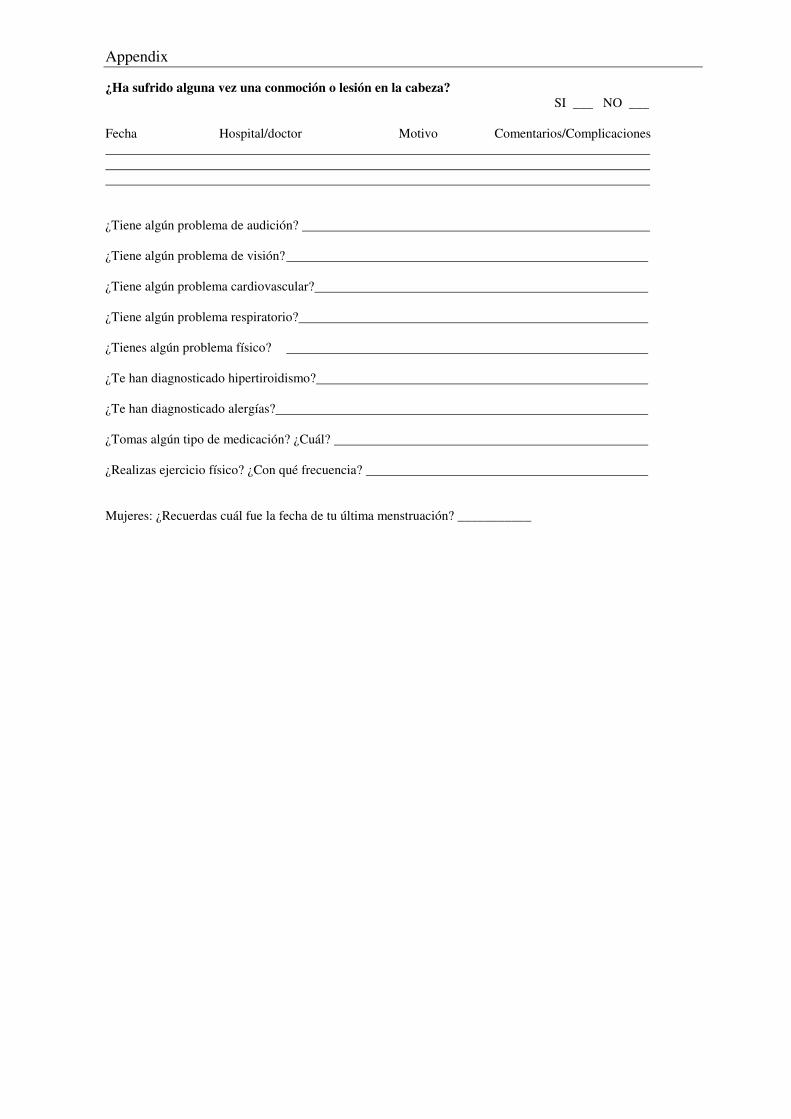
Appendix
¿Ha sufrido alguna vez una conmoción o lesión en la cabeza? SI ___ NO ___
Fecha Hospital/doctor Motivo Comentarios/Complicaciones
¿Tiene algún problema de audición? ¿Tiene algún problema de visión? ¿Tiene algún problema cardiovascular? ¿Tiene algún problema respiratorio? ¿Tienes algún problema físico? ¿Te han diagnosticado hipertiroidismo? ¿Te han diagnosticado alergías? ¿Tomas algún tipo de medicación? ¿Cuál? ¿Realizas ejercicio físico? ¿Con qué frecuencia? Mujeres: ¿Recuerdas cuál fue la fecha de tu última menstruación? ___________
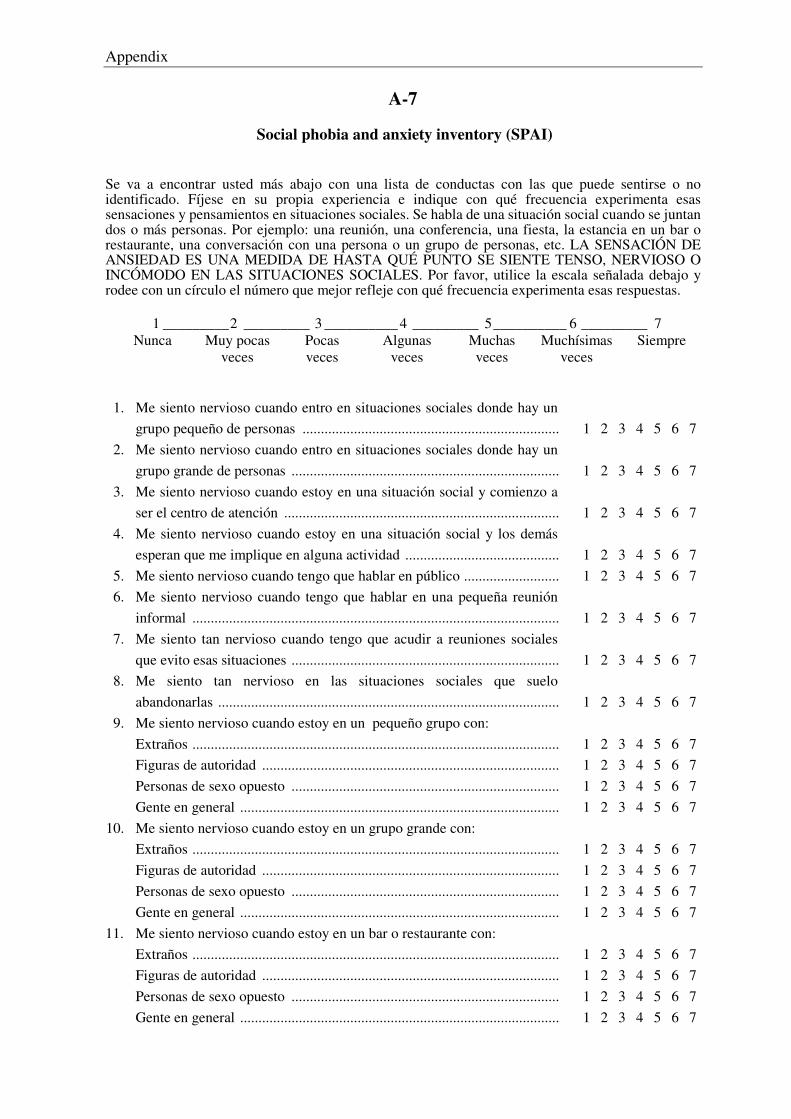
Appendix
A-7
Social phobia and anxiety inventory (SPAI)
Se va a encontrar usted más abajo con una lista de conductas con las que puede sentirse o no identificado. Fíjese en su propia experiencia e indique con qué frecuencia experimenta esas sensaciones y pensamientos en situaciones sociales. Se habla de una situación social cuando se juntan dos o más personas. Por ejemplo: una reunión, una conferencia, una fiesta, la estancia en un bar o restaurante, una conversación con una persona o un grupo de personas, etc. LA SENSACIÓN DE ANSIEDAD ES UNA MEDIDA DE HASTA QUÉ PUNTO SE SIENTE TENSO, NERVIOSO O INCÓMODO EN LAS SITUACIONES SOCIALES. Por favor, utilice la escala señalada debajo y rodee con un círculo el número que mejor refleje con qué frecuencia experimenta esas respuestas. 1 _________2 _________ 3 __________ 4 _________ 5__________ 6 _________ 7 Nunca Muy pocas Pocas Algunas Muchas Muchísimas Siempre veces veces veces veces veces 1. Me siento nervioso cuando entro en situaciones sociales donde hay un
grupo pequeño de personas ...................................................................... 2. Me siento nervioso cuando entro en situaciones sociales donde hay un
grupo grande de personas ......................................................................... 3. Me siento nervioso cuando estoy en una situación social y comienzo a
ser el centro de atención ........................................................................... 4. Me siento nervioso cuando estoy en una situación social y los demás
esperan que me implique en alguna actividad .......................................... 5. Me siento nervioso cuando tengo que hablar en público .......................... 6. Me siento nervioso cuando tengo que hablar en una pequeña reunión
informal .................................................................................................... 7. Me siento tan nervioso cuando tengo que acudir a reuniones sociales
que evito esas situaciones ......................................................................... 8. Me siento tan nervioso en las situaciones sociales que suelo
abandonarlas ............................................................................................. 9. Me siento nervioso cuando estoy en un pequeño grupo con: Extraños .................................................................................................... Figuras de autoridad ................................................................................. Personas de sexo opuesto ......................................................................... Gente en general ....................................................................................... 10. Me siento nervioso cuando estoy en un grupo grande con: Extraños .................................................................................................... Figuras de autoridad ................................................................................. Personas de sexo opuesto ......................................................................... Gente en general ....................................................................................... 11. Me siento nervioso cuando estoy en un bar o restaurante con: Extraños .................................................................................................... Figuras de autoridad ................................................................................. Personas de sexo opuesto ......................................................................... Gente en general .......................................................................................
1 2 3 4 5 6 7
1 2 3 4 5 6 7
1 2 3 4 5 6 7
1 2 3 4 5 6 7 1 2 3 4 5 6 7
1 2 3 4 5 6 7
1 2 3 4 5 6 7
1 2 3 4 5 6 7
1 2 3 4 5 6 7 1 2 3 4 5 6 7 1 2 3 4 5 6 7 1 2 3 4 5 6 7
1 2 3 4 5 6 7 1 2 3 4 5 6 7 1 2 3 4 5 6 7 1 2 3 4 5 6 7
1 2 3 4 5 6 7 1 2 3 4 5 6 7 1 2 3 4 5 6 7 1 2 3 4 5 6 7
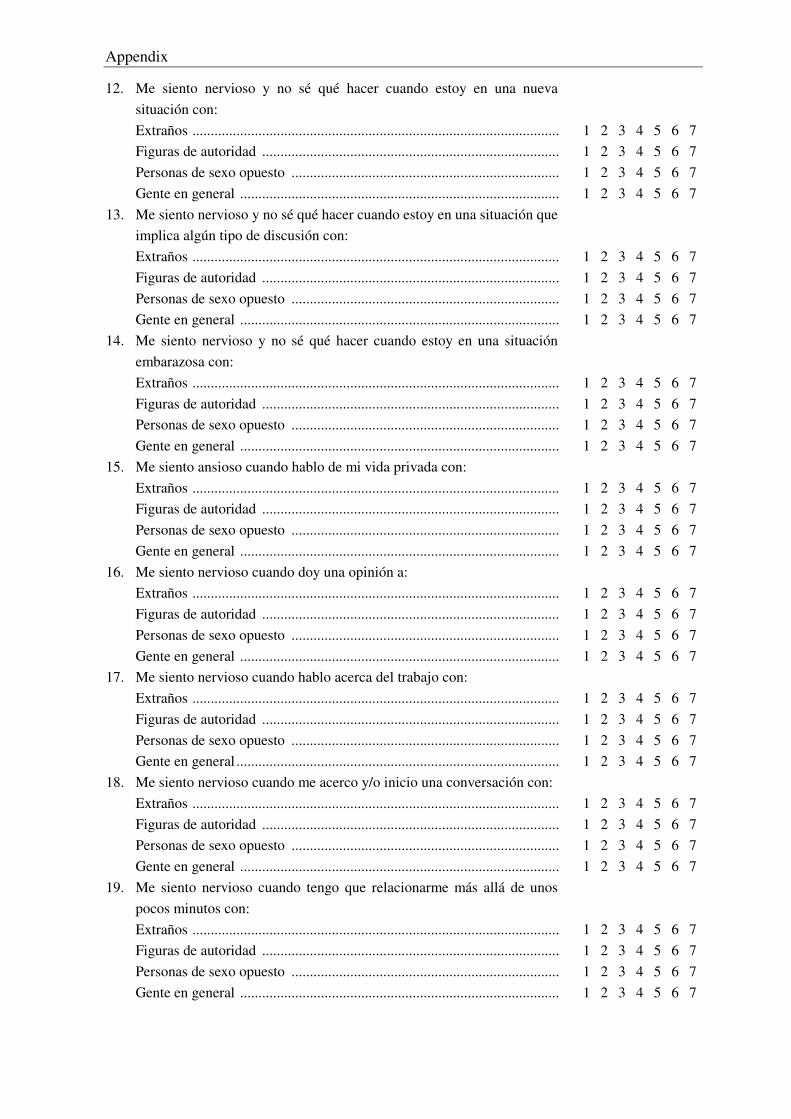
Appendix
12. Me siento nervioso y no sé qué hacer cuando estoy en una nueva situación con:
Extraños .................................................................................................... Figuras de autoridad ................................................................................. Personas de sexo opuesto ......................................................................... Gente en general ....................................................................................... 13. Me siento nervioso y no sé qué hacer cuando estoy en una situación que
implica algún tipo de discusión con: Extraños .................................................................................................... Figuras de autoridad ................................................................................. Personas de sexo opuesto ......................................................................... Gente en general ....................................................................................... 14. Me siento nervioso y no sé qué hacer cuando estoy en una situación
embarazosa con: Extraños .................................................................................................... Figuras de autoridad ................................................................................. Personas de sexo opuesto ......................................................................... Gente en general ....................................................................................... 15. Me siento ansioso cuando hablo de mi vida privada con: Extraños .................................................................................................... Figuras de autoridad ................................................................................. Personas de sexo opuesto ......................................................................... Gente en general ....................................................................................... 16. Me siento nervioso cuando doy una opinión a: Extraños .................................................................................................... Figuras de autoridad ................................................................................. Personas de sexo opuesto ......................................................................... Gente en general ....................................................................................... 17. Me siento nervioso cuando hablo acerca del trabajo con: Extraños .................................................................................................... Figuras de autoridad ................................................................................. Personas de sexo opuesto ......................................................................... Gente en general ........................................................................................ 18. Me siento nervioso cuando me acerco y/o inicio una conversación con: Extraños .................................................................................................... Figuras de autoridad ................................................................................. Personas de sexo opuesto ......................................................................... Gente en general ....................................................................................... 19. Me siento nervioso cuando tengo que relacionarme más allá de unos
pocos minutos con: Extraños .................................................................................................... Figuras de autoridad ................................................................................. Personas de sexo opuesto ......................................................................... Gente en general .......................................................................................
1 2 3 4 5 6 7 1 2 3 4 5 6 7 1 2 3 4 5 6 7 1 2 3 4 5 6 7
1 2 3 4 5 6 7 1 2 3 4 5 6 7 1 2 3 4 5 6 7 1 2 3 4 5 6 7
1 2 3 4 5 6 7 1 2 3 4 5 6 7 1 2 3 4 5 6 7 1 2 3 4 5 6 7
1 2 3 4 5 6 7 1 2 3 4 5 6 7 1 2 3 4 5 6 7 1 2 3 4 5 6 7
1 2 3 4 5 6 7 1 2 3 4 5 6 7 1 2 3 4 5 6 7 1 2 3 4 5 6 7
1 2 3 4 5 6 7 1 2 3 4 5 6 7 1 2 3 4 5 6 7 1 2 3 4 5 6 7
1 2 3 4 5 6 7 1 2 3 4 5 6 7 1 2 3 4 5 6 7 1 2 3 4 5 6 7
1 2 3 4 5 6 7 1 2 3 4 5 6 7 1 2 3 4 5 6 7 1 2 3 4 5 6 7
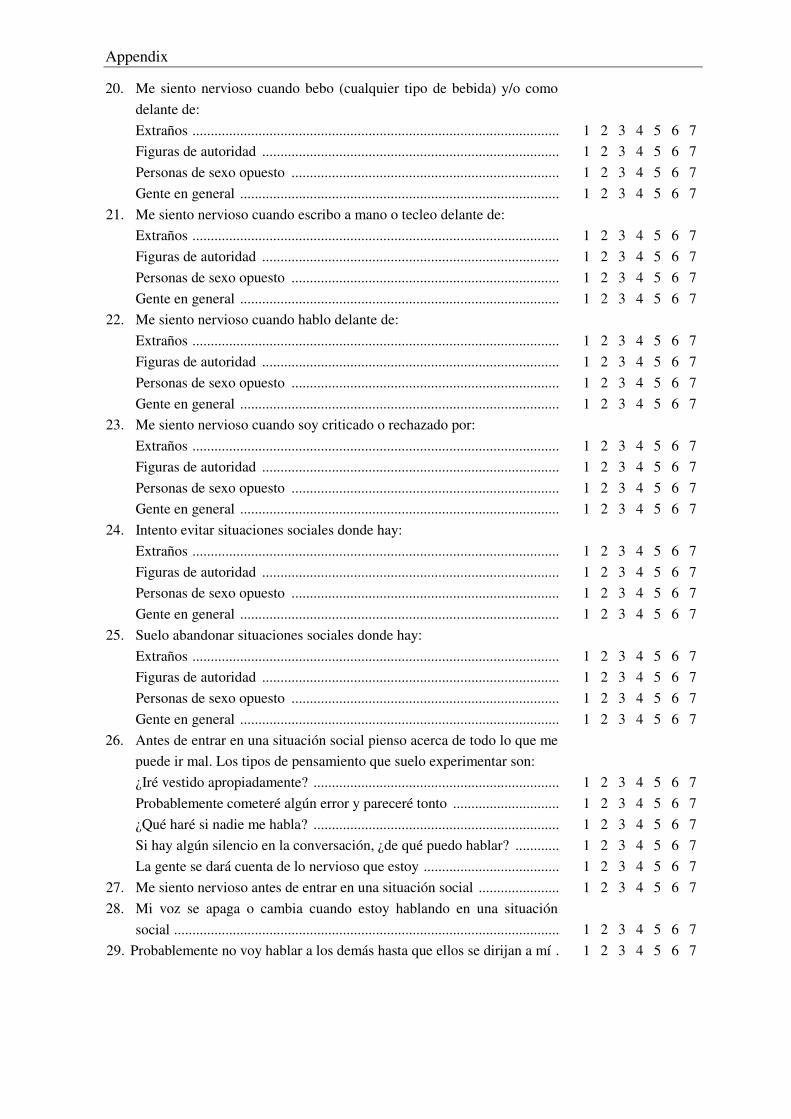
Appendix
20. Me siento nervioso cuando bebo (cualquier tipo de bebida) y/o como delante de:
Extraños .................................................................................................... Figuras de autoridad ................................................................................. Personas de sexo opuesto ......................................................................... Gente en general ....................................................................................... 21. Me siento nervioso cuando escribo a mano o tecleo delante de: Extraños .................................................................................................... Figuras de autoridad ................................................................................. Personas de sexo opuesto ......................................................................... Gente en general ....................................................................................... 22. Me siento nervioso cuando hablo delante de: Extraños .................................................................................................... Figuras de autoridad ................................................................................. Personas de sexo opuesto ......................................................................... Gente en general ....................................................................................... 23. Me siento nervioso cuando soy criticado o rechazado por: Extraños .................................................................................................... Figuras de autoridad ................................................................................. Personas de sexo opuesto ......................................................................... Gente en general ....................................................................................... 24. Intento evitar situaciones sociales donde hay: Extraños .................................................................................................... Figuras de autoridad ................................................................................. Personas de sexo opuesto ......................................................................... Gente en general ....................................................................................... 25. Suelo abandonar situaciones sociales donde hay: Extraños .................................................................................................... Figuras de autoridad ................................................................................. Personas de sexo opuesto ......................................................................... Gente en general ....................................................................................... 26. Antes de entrar en una situación social pienso acerca de todo lo que me
puede ir mal. Los tipos de pensamiento que suelo experimentar son: ¿Iré vestido apropiadamente? ................................................................... Probablemente cometeré algún error y pareceré tonto ............................. ¿Qué haré si nadie me habla? ................................................................... Si hay algún silencio en la conversación, ¿de qué puedo hablar? ............ La gente se dará cuenta de lo nervioso que estoy ..................................... 27. Me siento nervioso antes de entrar en una situación social ...................... 28. Mi voz se apaga o cambia cuando estoy hablando en una situación
social ......................................................................................................... 29. Probablemente no voy hablar a los demás hasta que ellos se dirijan a mí .
1 2 3 4 5 6 7 1 2 3 4 5 6 7 1 2 3 4 5 6 7 1 2 3 4 5 6 7
1 2 3 4 5 6 7 1 2 3 4 5 6 7 1 2 3 4 5 6 7 1 2 3 4 5 6 7
1 2 3 4 5 6 7 1 2 3 4 5 6 7 1 2 3 4 5 6 7 1 2 3 4 5 6 7
1 2 3 4 5 6 7 1 2 3 4 5 6 7 1 2 3 4 5 6 7 1 2 3 4 5 6 7
1 2 3 4 5 6 7 1 2 3 4 5 6 7 1 2 3 4 5 6 7 1 2 3 4 5 6 7
1 2 3 4 5 6 7 1 2 3 4 5 6 7 1 2 3 4 5 6 7 1 2 3 4 5 6 7
1 2 3 4 5 6 7 1 2 3 4 5 6 7 1 2 3 4 5 6 7 1 2 3 4 5 6 7 1 2 3 4 5 6 7 1 2 3 4 5 6 7
1 2 3 4 5 6 7 1 2 3 4 5 6 7
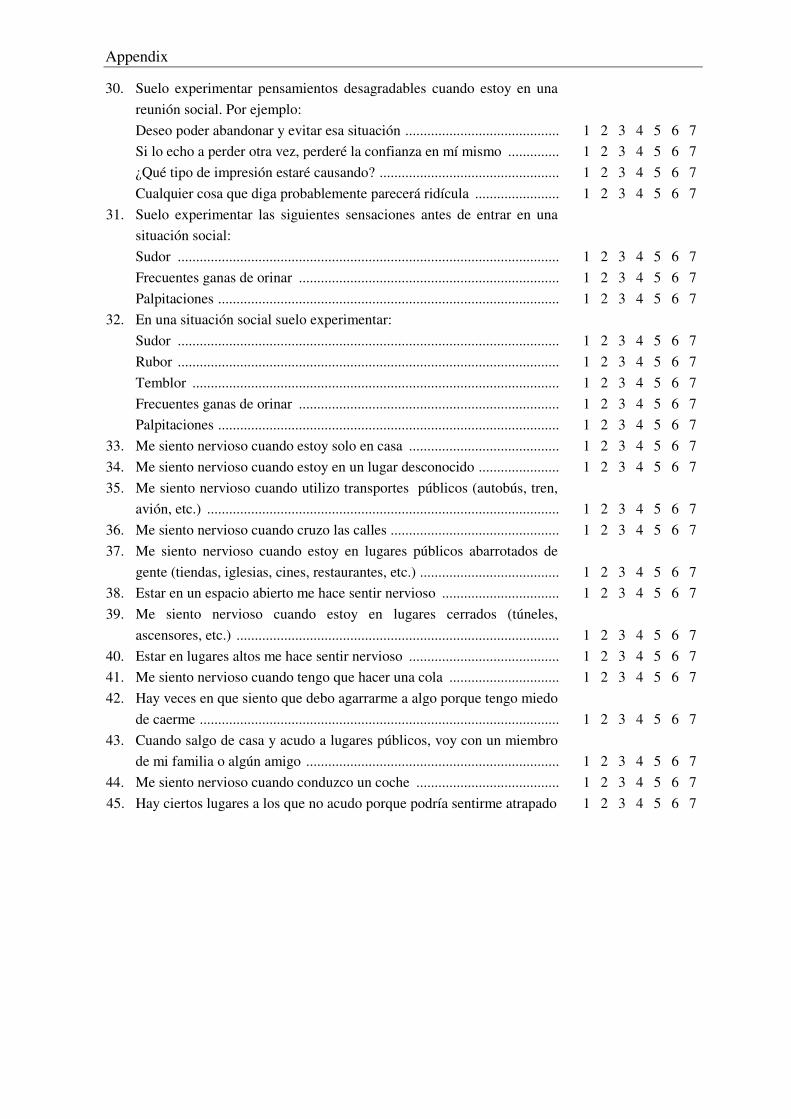
Appendix
30. Suelo experimentar pensamientos desagradables cuando estoy en una reunión social. Por ejemplo:
Deseo poder abandonar y evitar esa situación .......................................... Si lo echo a perder otra vez, perderé la confianza en mí mismo .............. ¿Qué tipo de impresión estaré causando? ................................................. Cualquier cosa que diga probablemente parecerá ridícula ....................... 31. Suelo experimentar las siguientes sensaciones antes de entrar en una
situación social: Sudor ........................................................................................................ Frecuentes ganas de orinar ....................................................................... Palpitaciones ............................................................................................. 32. En una situación social suelo experimentar: Sudor ........................................................................................................ Rubor ........................................................................................................ Temblor .................................................................................................... Frecuentes ganas de orinar ....................................................................... Palpitaciones ............................................................................................. 33. Me siento nervioso cuando estoy solo en casa ......................................... 34. Me siento nervioso cuando estoy en un lugar desconocido ...................... 35. Me siento nervioso cuando utilizo transportes públicos (autobús, tren,
avión, etc.) ................................................................................................ 36. Me siento nervioso cuando cruzo las calles .............................................. 37. Me siento nervioso cuando estoy en lugares públicos abarrotados de
gente (tiendas, iglesias, cines, restaurantes, etc.) ...................................... 38. Estar en un espacio abierto me hace sentir nervioso ................................ 39. Me siento nervioso cuando estoy en lugares cerrados (túneles,
ascensores, etc.) ........................................................................................ 40. Estar en lugares altos me hace sentir nervioso ......................................... 41. Me siento nervioso cuando tengo que hacer una cola .............................. 42. Hay veces en que siento que debo agarrarme a algo porque tengo miedo de caerme .................................................................................................. 43. Cuando salgo de casa y acudo a lugares públicos, voy con un miembro
de mi familia o algún amigo ..................................................................... 44. Me siento nervioso cuando conduzco un coche ....................................... 45. Hay ciertos lugares a los que no acudo porque podría sentirme atrapado
1 2 3 4 5 6 7 1 2 3 4 5 6 7 1 2 3 4 5 6 7 1 2 3 4 5 6 7
1 2 3 4 5 6 7 1 2 3 4 5 6 7 1 2 3 4 5 6 7
1 2 3 4 5 6 7 1 2 3 4 5 6 7 1 2 3 4 5 6 7 1 2 3 4 5 6 7 1 2 3 4 5 6 7 1 2 3 4 5 6 7 1 2 3 4 5 6 7
1 2 3 4 5 6 7 1 2 3 4 5 6 7
1 2 3 4 5 6 7 1 2 3 4 5 6 7
1 2 3 4 5 6 7 1 2 3 4 5 6 7 1 2 3 4 5 6 7
1 2 3 4 5 6 7
1 2 3 4 5 6 7 1 2 3 4 5 6 7 1 2 3 4 5 6 7
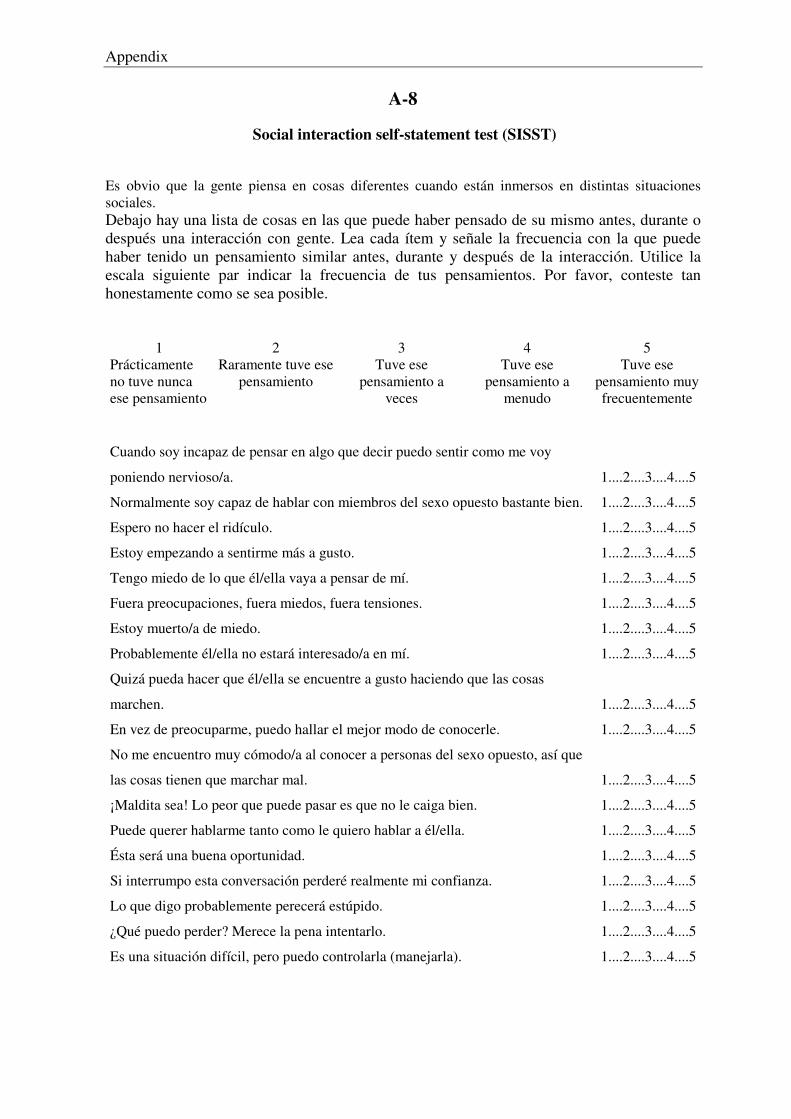
Appendix
A-8
Social interaction self-statement test (SISST) Es obvio que la gente piensa en cosas diferentes cuando están inmersos en distintas situaciones sociales. Debajo hay una lista de cosas en las que puede haber pensado de su mismo antes, durante o después una interacción con gente. Lea cada ítem y señale la frecuencia con la que puede haber tenido un pensamiento similar antes, durante y después de la interacción. Utilice la escala siguiente par indicar la frecuencia de tus pensamientos. Por favor, conteste tan honestamente como se sea posible.
1 2 3 4 5 Prácticamente no tuve nunca ese pensamiento
Raramente tuve ese pensamiento
Tuve ese pensamiento a
veces
Tuve ese pensamiento a
menudo
Tuve ese pensamiento muy frecuentemente
Cuando soy incapaz de pensar en algo que decir puedo sentir como me voy
poniendo nervioso/a.
1....2....3....4....5
Normalmente soy capaz de hablar con miembros del sexo opuesto bastante bien. 1....2....3....4....5
Espero no hacer el ridículo. 1....2....3....4....5
Estoy empezando a sentirme más a gusto. 1....2....3....4....5
Tengo miedo de lo que él/ella vaya a pensar de mí. 1....2....3....4....5
Fuera preocupaciones, fuera miedos, fuera tensiones. 1....2....3....4....5
Estoy muerto/a de miedo. 1....2....3....4....5
Probablemente él/ella no estará interesado/a en mí. 1....2....3....4....5
Quizá pueda hacer que él/ella se encuentre a gusto haciendo que las cosas
marchen.
1....2....3....4....5
En vez de preocuparme, puedo hallar el mejor modo de conocerle. 1....2....3....4....5
No me encuentro muy cómodo/a al conocer a personas del sexo opuesto, así que
las cosas tienen que marchar mal.
1....2....3....4....5
¡Maldita sea! Lo peor que puede pasar es que no le caiga bien. 1....2....3....4....5
Puede querer hablarme tanto como le quiero hablar a él/ella. 1....2....3....4....5
Ésta será una buena oportunidad. 1....2....3....4....5
Si interrumpo esta conversación perderé realmente mi confianza. 1....2....3....4....5
Lo que digo probablemente perecerá estúpido. 1....2....3....4....5
¿Qué puedo perder? Merece la pena intentarlo. 1....2....3....4....5
Es una situación difícil, pero puedo controlarla (manejarla). 1....2....3....4....5
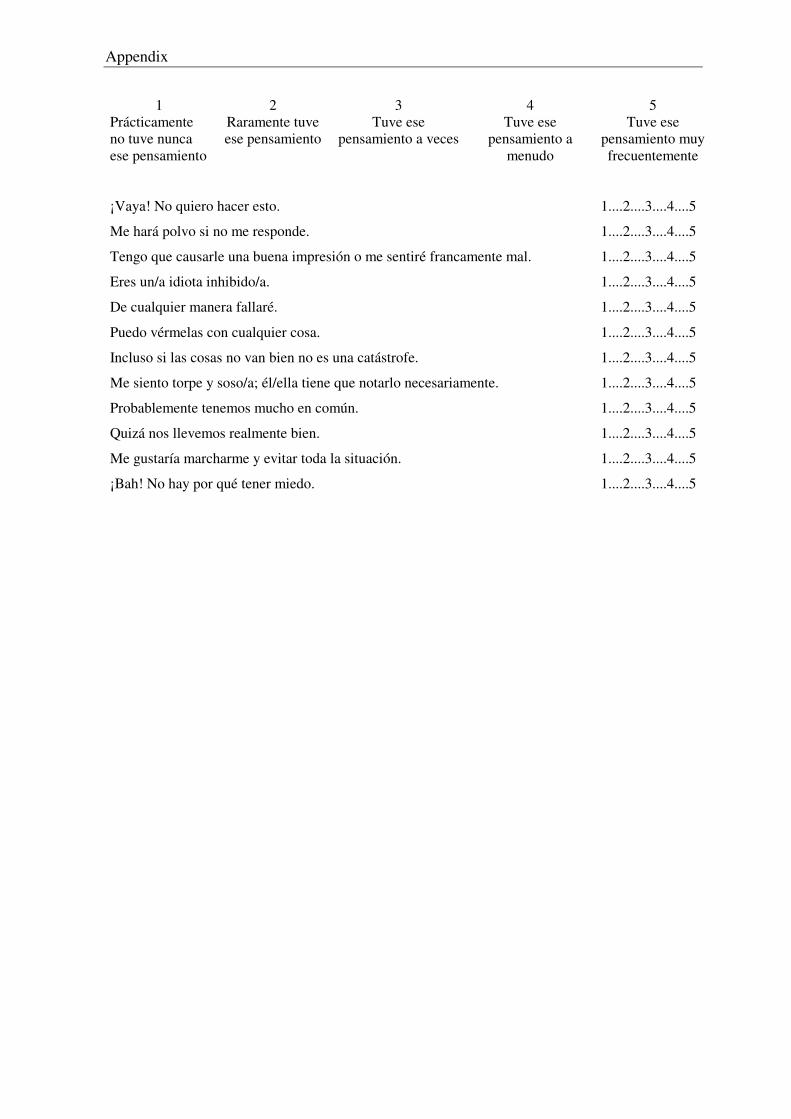
Appendix
1 2 3 4 5
Prácticamente no tuve nunca ese pensamiento
Raramente tuve ese pensamiento
Tuve ese pensamiento a veces
Tuve ese pensamiento a
menudo
Tuve ese pensamiento muy frecuentemente
¡Vaya! No quiero hacer esto. 1....2....3....4....5
Me hará polvo si no me responde. 1....2....3....4....5
Tengo que causarle una buena impresión o me sentiré francamente mal. 1....2....3....4....5
Eres un/a idiota inhibido/a. 1....2....3....4....5
De cualquier manera fallaré. 1....2....3....4....5
Puedo vérmelas con cualquier cosa. 1....2....3....4....5
Incluso si las cosas no van bien no es una catástrofe. 1....2....3....4....5
Me siento torpe y soso/a; él/ella tiene que notarlo necesariamente. 1....2....3....4....5
Probablemente tenemos mucho en común. 1....2....3....4....5
Quizá nos llevemos realmente bien. 1....2....3....4....5
Me gustaría marcharme y evitar toda la situación. 1....2....3....4....5
¡Bah! No hay por qué tener miedo. 1....2....3....4....5
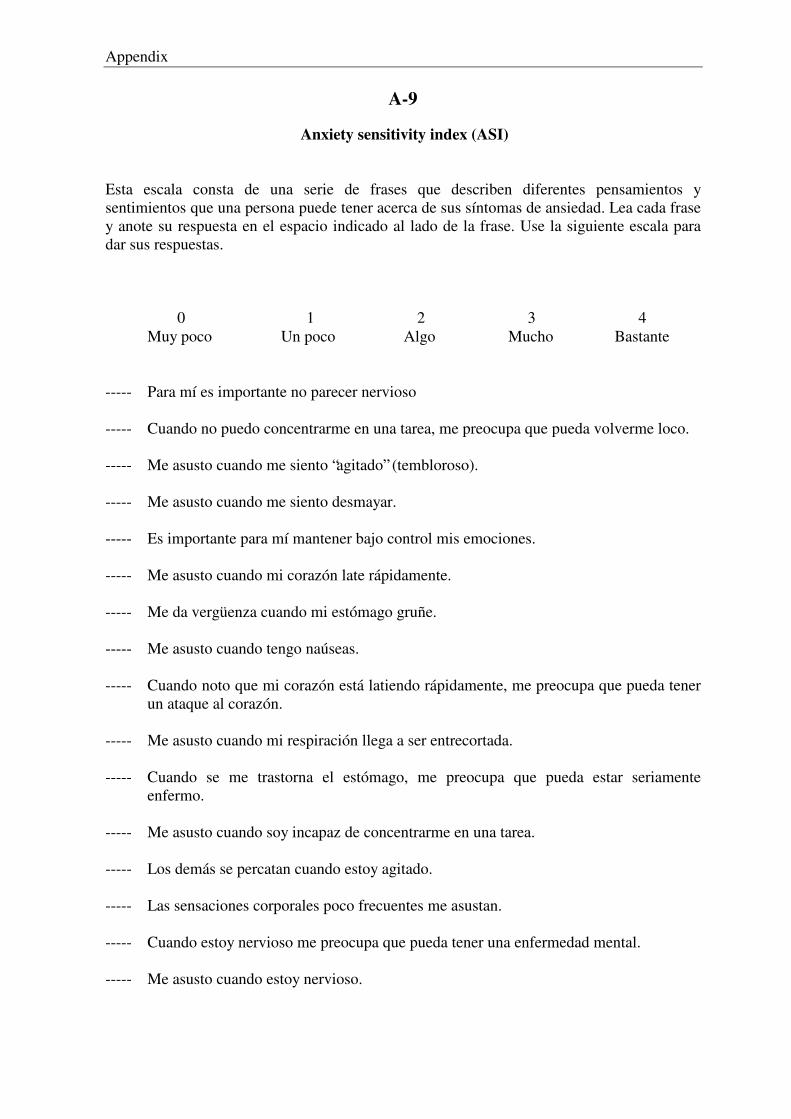
Appendix
A-9
Anxiety sensitivity index (ASI) Esta escala consta de una serie de frases que describen diferentes pensamientos y sentimientos que una persona puede tener acerca de sus síntomas de ansiedad. Lea cada frase y anote su respuesta en el espacio indicado al lado de la frase. Use la siguiente escala para dar sus respuestas.
0 1 2 3 4
Muy poco Un poco Algo Mucho Bastante ----- Para mí es importante no parecer nervioso ----- Cuando no puedo concentrarme en una tarea, me preocupa que pueda volverme loco. ----- Me asusto cuando me siento “agitado” (tembloroso). ----- Me asusto cuando me siento desmayar. ----- Es importante para mí mantener bajo control mis emociones. ----- Me asusto cuando mi corazón late rápidamente. ----- Me da vergüenza cuando mi estómago gruñe. ----- Me asusto cuando tengo naúseas. ----- Cuando noto que mi corazón está latiendo rápidamente, me preocupa que pueda tener un ataque al corazón. ----- Me asusto cuando mi respiración llega a ser entrecortada. ----- Cuando se me trastorna el estómago, me preocupa que pueda estar seriamente enfermo. ----- Me asusto cuando soy incapaz de concentrarme en una tarea. ----- Los demás se percatan cuando estoy agitado. ----- Las sensaciones corporales poco frecuentes me asustan. ----- Cuando estoy nervioso me preocupa que pueda tener una enfermedad mental. ----- Me asusto cuando estoy nervioso.
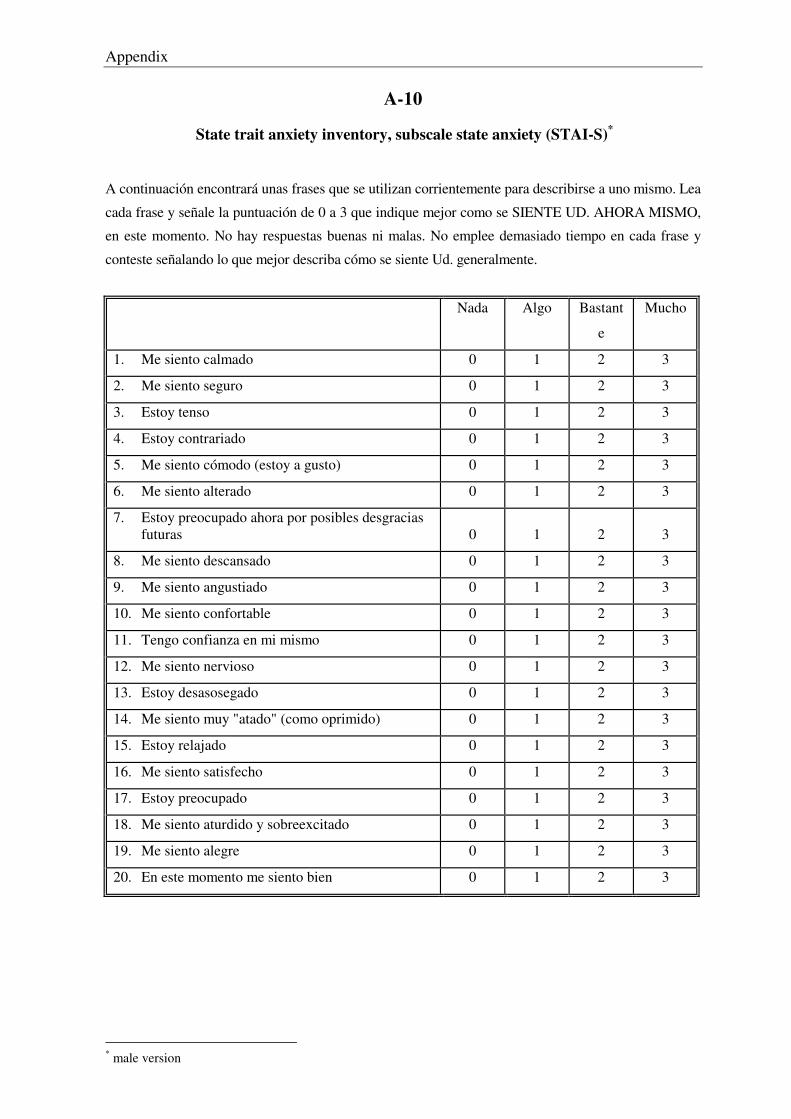
Appendix
A-10
State trait anxiety inventory, subscale state anxiety (STAI-S)*
A continuación encontrará unas frases que se utilizan corrientemente para describirse a uno mismo. Lea
cada frase y señale la puntuación de 0 a 3 que indique mejor como se SIENTE UD. AHORA MISMO,
en este momento. No hay respuestas buenas ni malas. No emplee demasiado tiempo en cada frase y
conteste señalando lo que mejor describa cómo se siente Ud. generalmente.
Nada Algo Bastant
e
Mucho
1. Me siento calmado 0 1 2 3
2. Me siento seguro 0 1 2 3
3. Estoy tenso 0 1 2 3
4. Estoy contrariado 0 1 2 3
5. Me siento cómodo (estoy a gusto) 0 1 2 3
6. Me siento alterado 0 1 2 3
7. Estoy preocupado ahora por posibles desgracias futuras
0
1
2
3
8. Me siento descansado 0 1 2 3
9. Me siento angustiado 0 1 2 3
10. Me siento confortable 0 1 2 3
11. Tengo confianza en mi mismo 0 1 2 3
12. Me siento nervioso 0 1 2 3
13. Estoy desasosegado 0 1 2 3
14. Me siento muy "atado" (como oprimido) 0 1 2 3
15. Estoy relajado 0 1 2 3
16. Me siento satisfecho 0 1 2 3
17. Estoy preocupado 0 1 2 3
18. Me siento aturdido y sobreexcitado 0 1 2 3
19. Me siento alegre 0 1 2 3
20. En este momento me siento bien 0 1 2 3
* male version
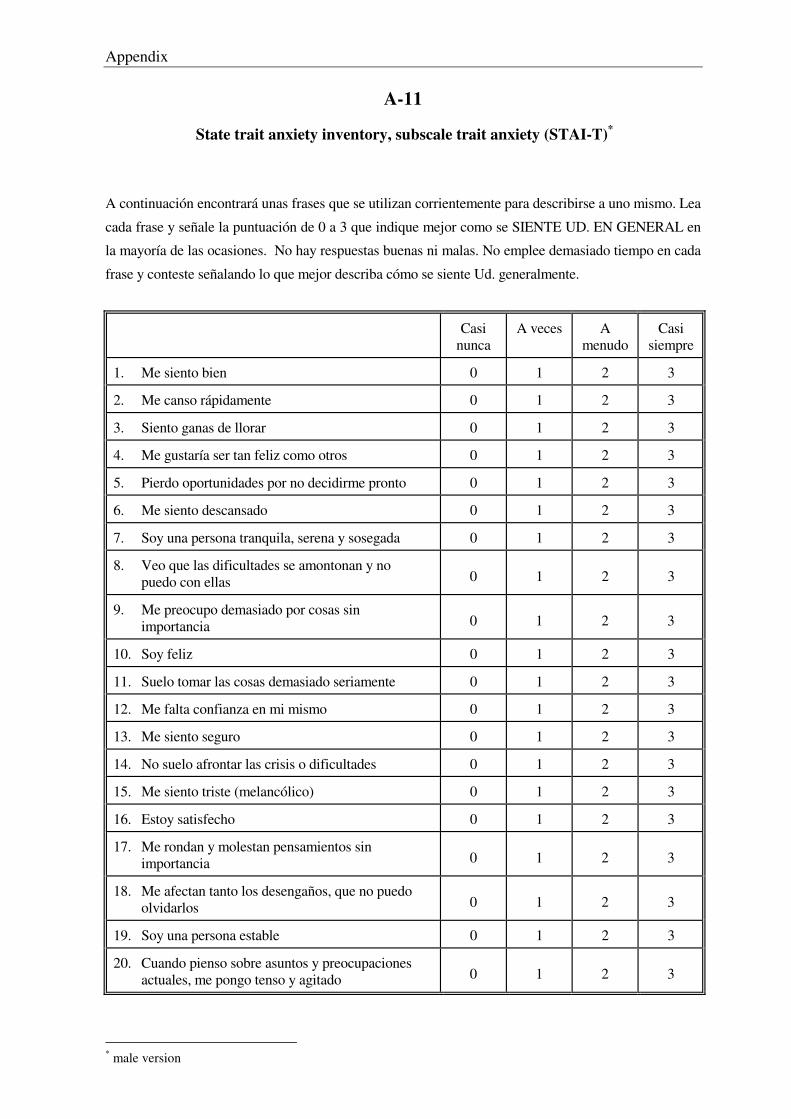
Appendix
A-11
State trait anxiety inventory, subscale trait anxiety (STAI-T)*
A continuación encontrará unas frases que se utilizan corrientemente para describirse a uno mismo. Lea
cada frase y señale la puntuación de 0 a 3 que indique mejor como se SIENTE UD. EN GENERAL en
la mayoría de las ocasiones. No hay respuestas buenas ni malas. No emplee demasiado tiempo en cada
frase y conteste señalando lo que mejor describa cómo se siente Ud. generalmente.
Casi nunca
A veces A menudo
Casi siempre
1. Me siento bien 0 1 2 3
2. Me canso rápidamente 0 1 2 3
3. Siento ganas de llorar 0 1 2 3
4. Me gustaría ser tan feliz como otros 0 1 2 3
5. Pierdo oportunidades por no decidirme pronto 0 1 2 3
6. Me siento descansado 0 1 2 3
7. Soy una persona tranquila, serena y sosegada 0 1 2 3
8. Veo que las dificultades se amontonan y no puedo con ellas
0
1
2
3
9. Me preocupo demasiado por cosas sin importancia
0
1
2
3
10. Soy feliz 0 1 2 3
11. Suelo tomar las cosas demasiado seriamente 0 1 2 3
12. Me falta confianza en mi mismo 0 1 2 3
13. Me siento seguro 0 1 2 3
14. No suelo afrontar las crisis o dificultades 0 1 2 3
15. Me siento triste (melancólico) 0 1 2 3
16. Estoy satisfecho 0 1 2 3
17. Me rondan y molestan pensamientos sin importancia
0
1
2
3
18. Me afectan tanto los desengaños, que no puedo olvidarlos
0
1
2
3
19. Soy una persona estable 0 1 2 3
20. Cuando pienso sobre asuntos y preocupaciones actuales, me pongo tenso y agitado
0
1
2
3
* male version
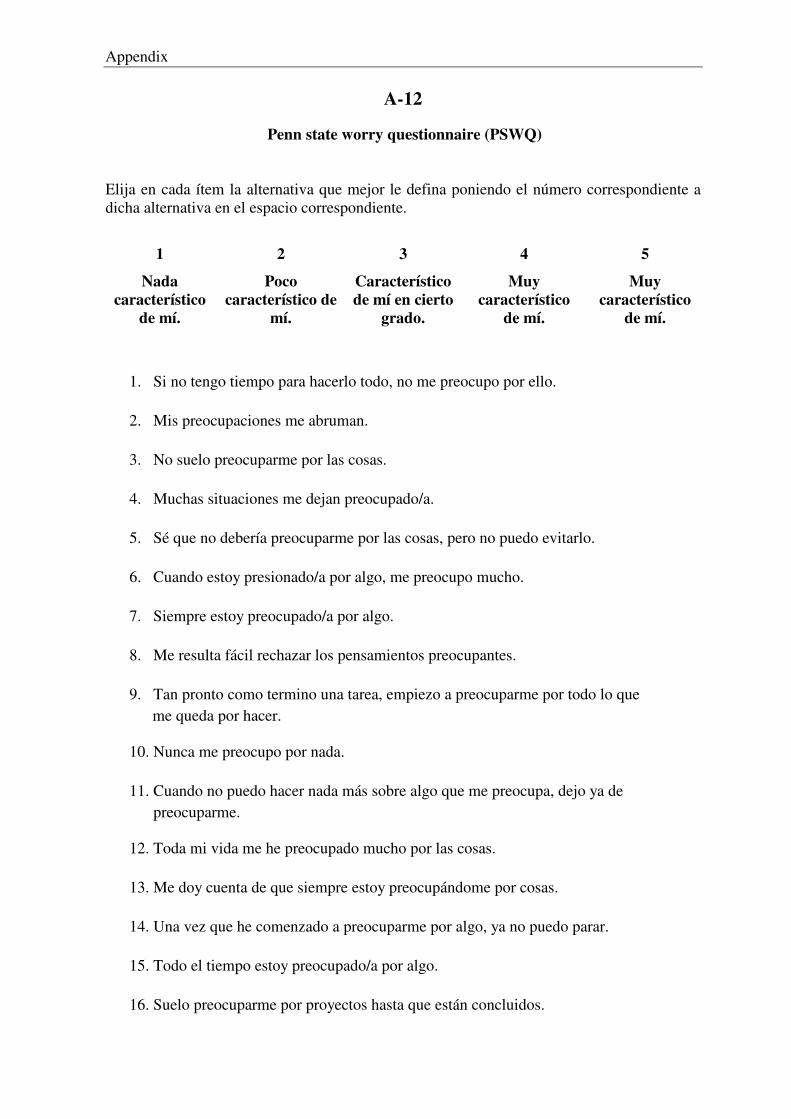
Appendix
A-12
Penn state worry questionnaire (PSWQ)
Elija en cada ítem la alternativa que mejor le defina poniendo el número correspondiente a dicha alternativa en el espacio correspondiente.
1 2 3 4 5
Nada característico
de mí.
Poco característico de
mí.
Característico de mí en cierto
grado.
Muy característico
de mí.
Muy característico
de mí.
1. Si no tengo tiempo para hacerlo todo, no me preocupo por ello. �
2. Mis preocupaciones me abruman. �
3. No suelo preocuparme por las cosas. �
4. Muchas situaciones me dejan preocupado/a. �
5. Sé que no debería preocuparme por las cosas, pero no puedo evitarlo. �
6. Cuando estoy presionado/a por algo, me preocupo mucho. �
7. Siempre estoy preocupado/a por algo. �
8. Me resulta fácil rechazar los pensamientos preocupantes. �
9. Tan pronto como termino una tarea, empiezo a preocuparme por todo lo que � me queda por hacer.
10. Nunca me preocupo por nada. �
11. Cuando no puedo hacer nada más sobre algo que me preocupa, dejo ya de � preocuparme.
12. Toda mi vida me he preocupado mucho por las cosas. �
13. Me doy cuenta de que siempre estoy preocupándome por cosas. �
14. Una vez que he comenzado a preocuparme por algo, ya no puedo parar. �
15. Todo el tiempo estoy preocupado/a por algo. �
16. Suelo preocuparme por proyectos hasta que están concluidos. �
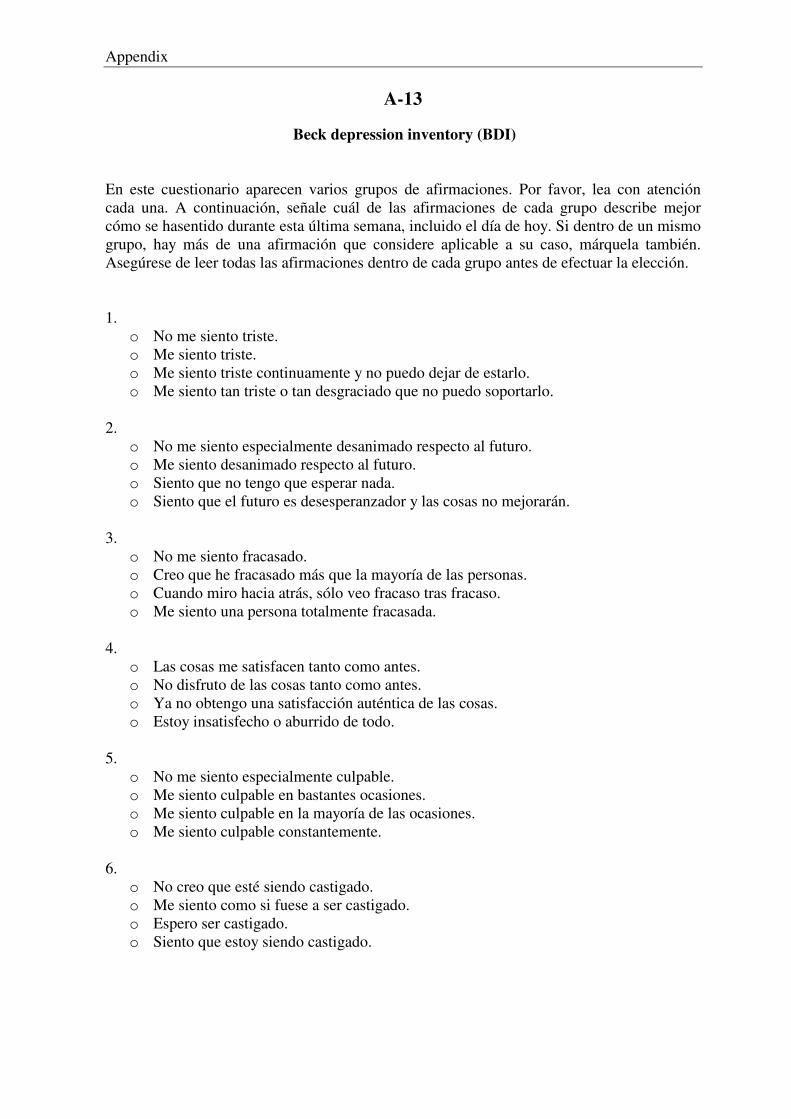
Appendix
A-13
Beck depression inventory (BDI)
En este cuestionario aparecen varios grupos de afirmaciones. Por favor, lea con atención cada una. A continuación, señale cuál de las afirmaciones de cada grupo describe mejor cómo se hasentido durante esta última semana, incluido el día de hoy. Si dentro de un mismo grupo, hay más de una afirmación que considere aplicable a su caso, márquela también. Asegúrese de leer todas las afirmaciones dentro de cada grupo antes de efectuar la elección. 1.
o No me siento triste. o Me siento triste. o Me siento triste continuamente y no puedo dejar de estarlo. o Me siento tan triste o tan desgraciado que no puedo soportarlo.
2. o No me siento especialmente desanimado respecto al futuro. o Me siento desanimado respecto al futuro. o Siento que no tengo que esperar nada. o Siento que el futuro es desesperanzador y las cosas no mejorarán.
3. o No me siento fracasado. o Creo que he fracasado más que la mayoría de las personas. o Cuando miro hacia atrás, sólo veo fracaso tras fracaso. o Me siento una persona totalmente fracasada.
4. o Las cosas me satisfacen tanto como antes. o No disfruto de las cosas tanto como antes. o Ya no obtengo una satisfacción auténtica de las cosas. o Estoy insatisfecho o aburrido de todo.
5. o No me siento especialmente culpable. o Me siento culpable en bastantes ocasiones. o Me siento culpable en la mayoría de las ocasiones. o Me siento culpable constantemente.
6. o No creo que esté siendo castigado. o Me siento como si fuese a ser castigado. o Espero ser castigado. o Siento que estoy siendo castigado.
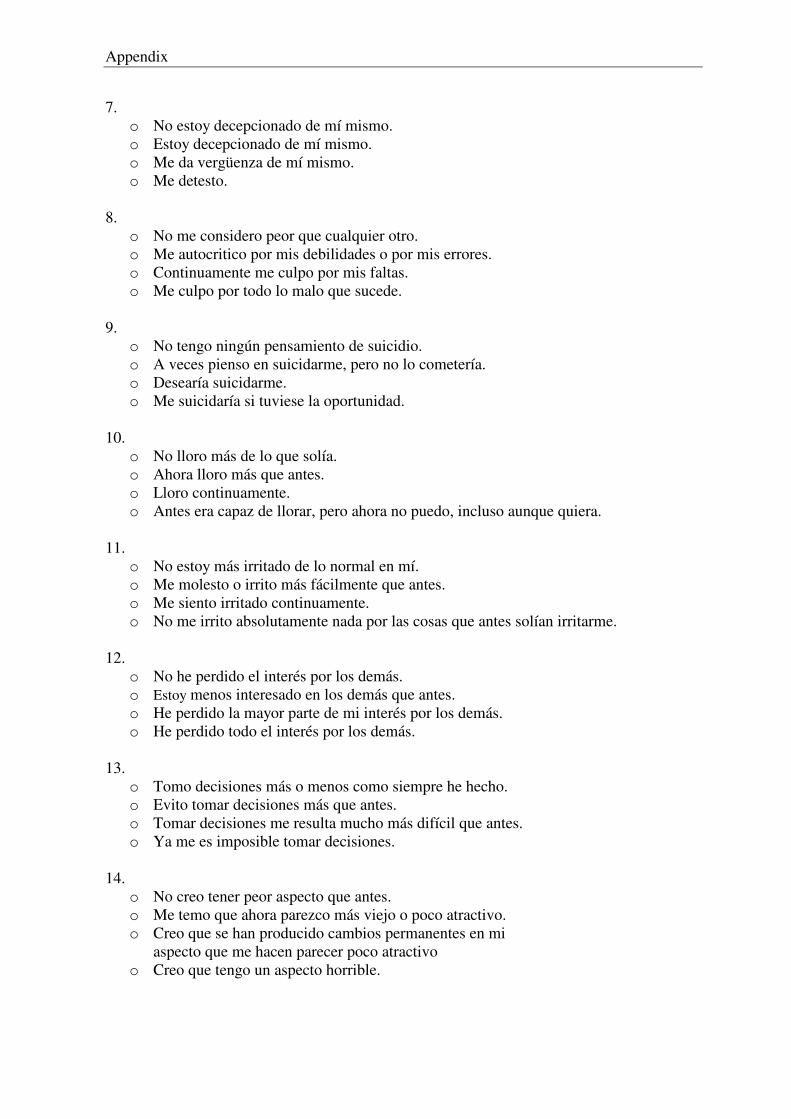
Appendix
7.
o No estoy decepcionado de mí mismo. o Estoy decepcionado de mí mismo. o Me da vergüenza de mí mismo. o Me detesto.
8.
o No me considero peor que cualquier otro. o Me autocritico por mis debilidades o por mis errores. o Continuamente me culpo por mis faltas. o Me culpo por todo lo malo que sucede.
9. o No tengo ningún pensamiento de suicidio. o A veces pienso en suicidarme, pero no lo cometería. o Desearía suicidarme. o Me suicidaría si tuviese la oportunidad.
10. o No lloro más de lo que solía. o Ahora lloro más que antes. o Lloro continuamente. o Antes era capaz de llorar, pero ahora no puedo, incluso aunque quiera.
11. o No estoy más irritado de lo normal en mí. o Me molesto o irrito más fácilmente que antes. o Me siento irritado continuamente. o No me irrito absolutamente nada por las cosas que antes solían irritarme.
12. o No he perdido el interés por los demás. o Estoy menos interesado en los demás que antes. o He perdido la mayor parte de mi interés por los demás. o He perdido todo el interés por los demás.
13. o Tomo decisiones más o menos como siempre he hecho. o Evito tomar decisiones más que antes. o Tomar decisiones me resulta mucho más difícil que antes. o Ya me es imposible tomar decisiones.
14. o No creo tener peor aspecto que antes. o Me temo que ahora parezco más viejo o poco atractivo. o Creo que se han producido cambios permanentes en mi aspecto que me hacen parecer poco atractivo o Creo que tengo un aspecto horrible.
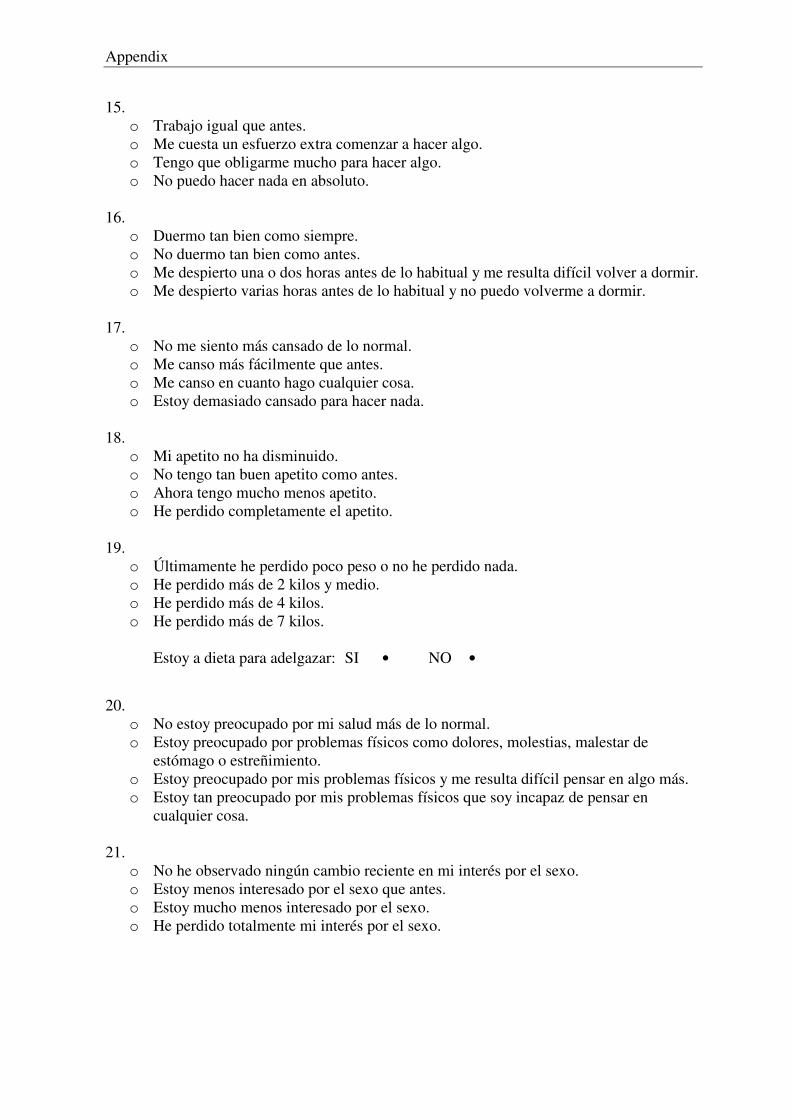
Appendix
15.
o Trabajo igual que antes. o Me cuesta un esfuerzo extra comenzar a hacer algo. o Tengo que obligarme mucho para hacer algo. o No puedo hacer nada en absoluto.
16. o Duermo tan bien como siempre. o No duermo tan bien como antes. o Me despierto una o dos horas antes de lo habitual y me resulta difícil volver a dormir. o Me despierto varias horas antes de lo habitual y no puedo volverme a dormir.
17. o No me siento más cansado de lo normal. o Me canso más fácilmente que antes. o Me canso en cuanto hago cualquier cosa. o Estoy demasiado cansado para hacer nada.
18. o Mi apetito no ha disminuido. o No tengo tan buen apetito como antes. o Ahora tengo mucho menos apetito. o He perdido completamente el apetito.
19. o Últimamente he perdido poco peso o no he perdido nada. o He perdido más de 2 kilos y medio. o He perdido más de 4 kilos. o He perdido más de 7 kilos. Estoy a dieta para adelgazar: SI • NO •
20. o No estoy preocupado por mi salud más de lo normal. o Estoy preocupado por problemas físicos como dolores, molestias, malestar de
estómago o estreñimiento. o Estoy preocupado por mis problemas físicos y me resulta difícil pensar en algo más. o Estoy tan preocupado por mis problemas físicos que soy incapaz de pensar en
cualquier cosa.
21. o No he observado ningún cambio reciente en mi interés por el sexo. o Estoy menos interesado por el sexo que antes. o Estoy mucho menos interesado por el sexo. o He perdido totalmente mi interés por el sexo.
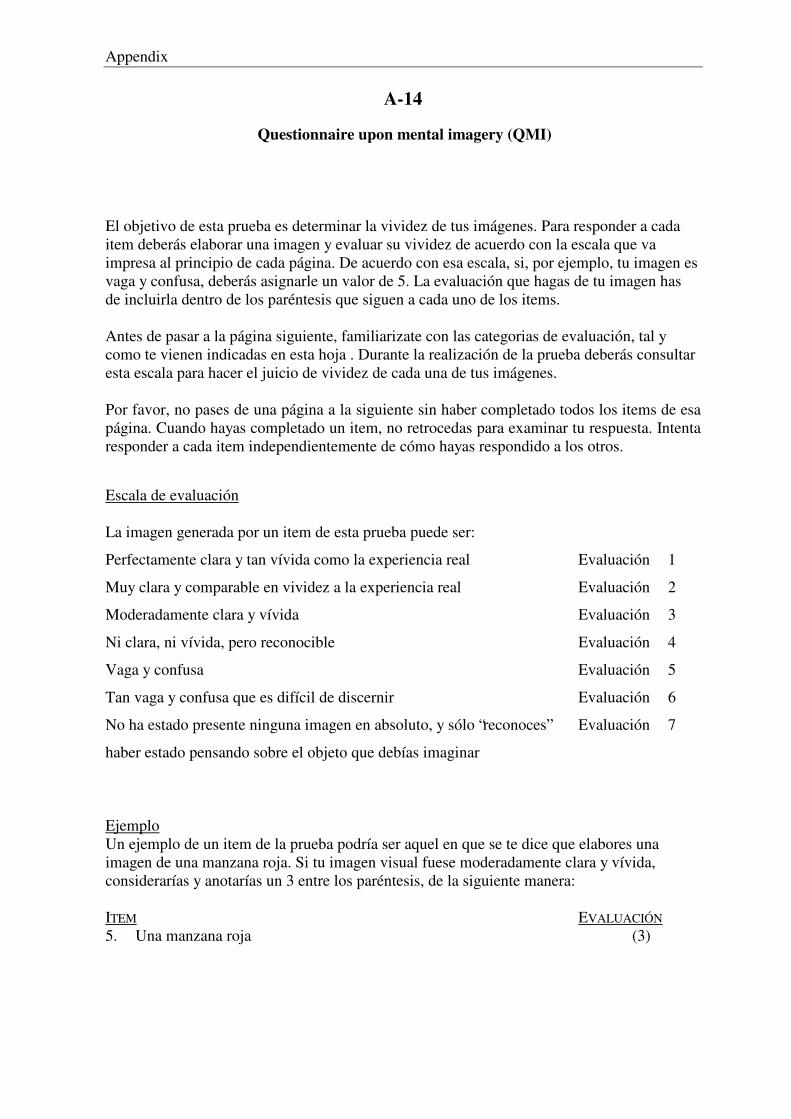
Appendix
A-14
Questionnaire upon mental imagery (QMI)
El objetivo de esta prueba es determinar la vividez de tus imágenes. Para responder a cada item deberás elaborar una imagen y evaluar su vividez de acuerdo con la escala que va impresa al principio de cada página. De acuerdo con esa escala, si, por ejemplo, tu imagen es vaga y confusa, deberás asignarle un valor de 5. La evaluación que hagas de tu imagen has de incluirla dentro de los paréntesis que siguen a cada uno de los items.
Antes de pasar a la página siguiente, familiarizate con las categorias de evaluación, tal y como te vienen indicadas en esta hoja . Durante la realización de la prueba deberás consultar esta escala para hacer el juicio de vividez de cada una de tus imágenes.
Por favor, no pases de una página a la siguiente sin haber completado todos los items de esa página. Cuando hayas completado un item, no retrocedas para examinar tu respuesta. Intenta responder a cada item independientemente de cómo hayas respondido a los otros.
Escala de evaluación La imagen generada por un item de esta prueba puede ser:
Perfectamente clara y tan vívida como la experiencia real Evaluación 1
Muy clara y comparable en vividez a la experiencia real Evaluación 2
Moderadamente clara y vívida Evaluación 3
Ni clara, ni vívida, pero reconocible Evaluación 4
Vaga y confusa Evaluación 5
Tan vaga y confusa que es difícil de discernir Evaluación 6
No ha estado presente ninguna imagen en absoluto, y sólo “reconoces” Evaluación 7
haber estado pensando sobre el objeto que debías imaginar
Ejemplo Un ejemplo de un item de la prueba podría ser aquel en que se te dice que elabores una imagen de una manzana roja. Si tu imagen visual fuese moderadamente clara y vívida, considerarías y anotarías un 3 entre los paréntesis, de la siguiente manera: ITEM EVALUACIÓN 5. Una manzana roja (3)
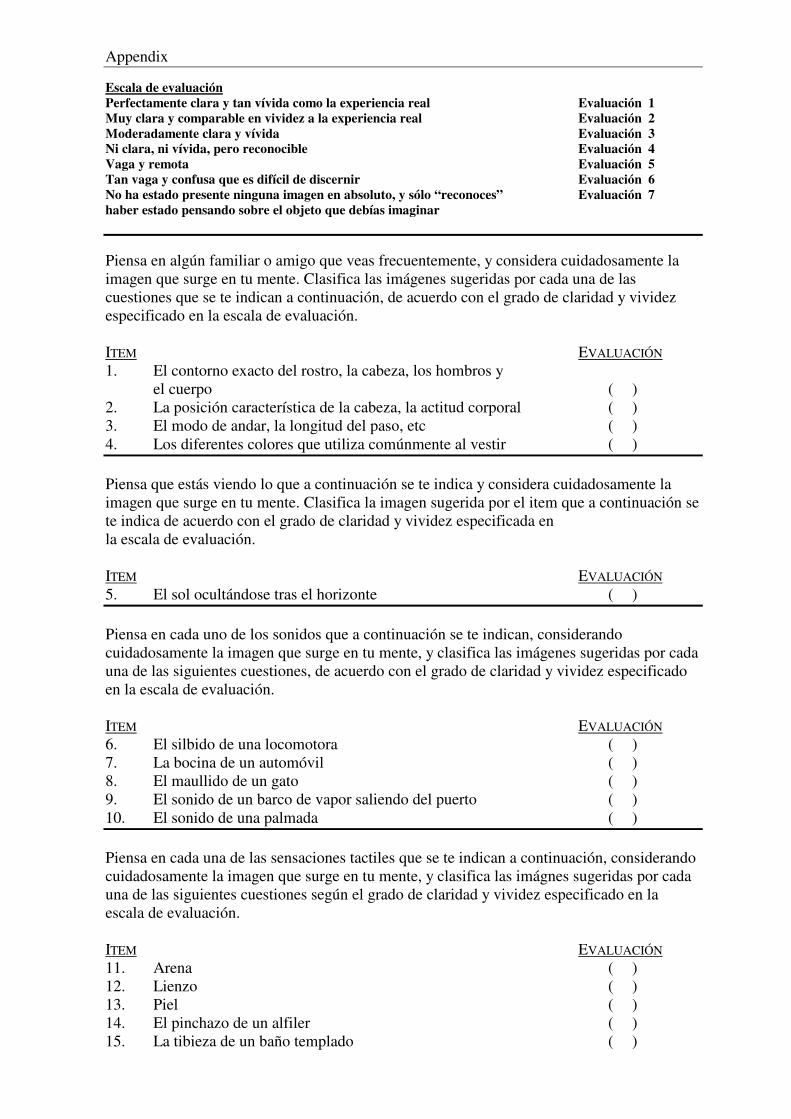
Appendix
Escala de evaluación Perfectamente clara y tan vívida como la experiencia real Evaluación 1 Muy clara y comparable en vividez a la experiencia real Evaluación 2 Moderadamente clara y vívida Evaluación 3 Ni clara, ni vívida, pero reconocible Evaluación 4 Vaga y remota Evaluación 5 Tan vaga y confusa que es difícil de discernir Evaluación 6 No ha estado presente ninguna imagen en absoluto, y sólo “reconoces” Evaluación 7 haber estado pensando sobre el objeto que debías imaginar Piensa en algún familiar o amigo que veas frecuentemente, y considera cuidadosamente la imagen que surge en tu mente. Clasifica las imágenes sugeridas por cada una de las cuestiones que se te indican a continuación, de acuerdo con el grado de claridad y vividez especificado en la escala de evaluación. ITEM EVALUACIÓN 1. El contorno exacto del rostro, la cabeza, los hombros y el cuerpo ( ) 2. La posición característica de la cabeza, la actitud corporal ( ) 3. El modo de andar, la longitud del paso, etc ( ) 4. Los diferentes colores que utiliza comúnmente al vestir ( ) Piensa que estás viendo lo que a continuación se te indica y considera cuidadosamente la imagen que surge en tu mente. Clasifica la imagen sugerida por el item que a continuación se te indica de acuerdo con el grado de claridad y vividez especificada en la escala de evaluación. ITEM EVALUACIÓN 5. El sol ocultándose tras el horizonte ( ) Piensa en cada uno de los sonidos que a continuación se te indican, considerando cuidadosamente la imagen que surge en tu mente, y clasifica las imágenes sugeridas por cada una de las siguientes cuestiones, de acuerdo con el grado de claridad y vividez especificado en la escala de evaluación. ITEM EVALUACIÓN 6. El silbido de una locomotora ( ) 7. La bocina de un automóvil ( ) 8. El maullido de un gato ( ) 9. El sonido de un barco de vapor saliendo del puerto ( ) 10. El sonido de una palmada ( ) Piensa en cada una de las sensaciones tactiles que se te indican a continuación, considerando cuidadosamente la imagen que surge en tu mente, y clasifica las imágnes sugeridas por cada una de las siguientes cuestiones según el grado de claridad y vividez especificado en la escala de evaluación. ITEM EVALUACIÓN 11. Arena ( ) 12. Lienzo ( ) 13. Piel ( ) 14. El pinchazo de un alfiler ( ) 15. La tibieza de un baño templado ( )
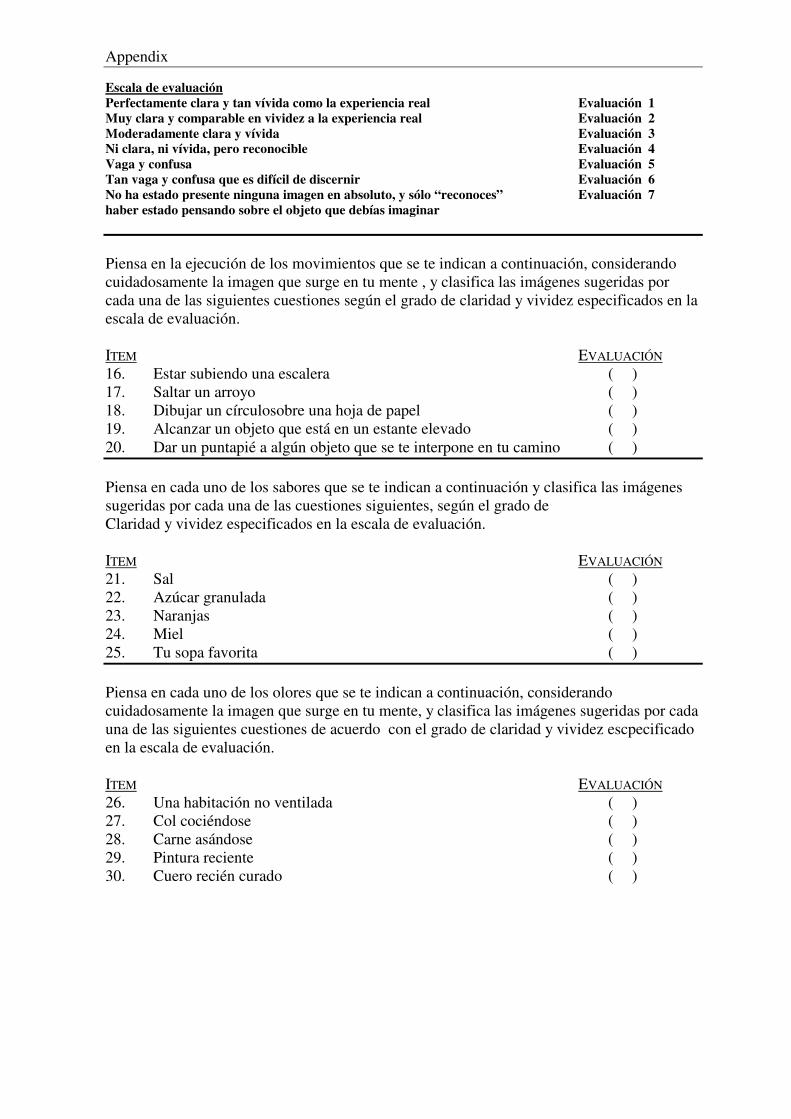
Appendix
Escala de evaluación Perfectamente clara y tan vívida como la experiencia real Evaluación 1 Muy clara y comparable en vividez a la experiencia real Evaluación 2 Moderadamente clara y vívida Evaluación 3 Ni clara, ni vívida, pero reconocible Evaluación 4 Vaga y confusa Evaluación 5 Tan vaga y confusa que es difícil de discernir Evaluación 6 No ha estado presente ninguna imagen en absoluto, y sólo “reconoces” Evaluación 7 haber estado pensando sobre el objeto que debías imaginar Piensa en la ejecución de los movimientos que se te indican a continuación, considerando cuidadosamente la imagen que surge en tu mente , y clasifica las imágenes sugeridas por cada una de las siguientes cuestiones según el grado de claridad y vividez especificados en la escala de evaluación. ITEM EVALUACIÓN 16. Estar subiendo una escalera ( ) 17. Saltar un arroyo ( ) 18. Dibujar un círculosobre una hoja de papel ( ) 19. Alcanzar un objeto que está en un estante elevado ( ) 20. Dar un puntapié a algún objeto que se te interpone en tu camino ( ) Piensa en cada uno de los sabores que se te indican a continuación y clasifica las imágenes sugeridas por cada una de las cuestiones siguientes, según el grado de Claridad y vividez especificados en la escala de evaluación. ITEM EVALUACIÓN 21. Sal ( ) 22. Azúcar granulada ( ) 23. Naranjas ( ) 24. Miel ( ) 25. Tu sopa favorita ( ) Piensa en cada uno de los olores que se te indican a continuación, considerando cuidadosamente la imagen que surge en tu mente, y clasifica las imágenes sugeridas por cada una de las siguientes cuestiones de acuerdo con el grado de claridad y vividez escpecificado en la escala de evaluación. ITEM EVALUACIÓN 26. Una habitación no ventilada ( ) 27. Col cociéndose ( ) 28. Carne asándose ( ) 29. Pintura reciente ( ) 30. Cuero recién curado ( )
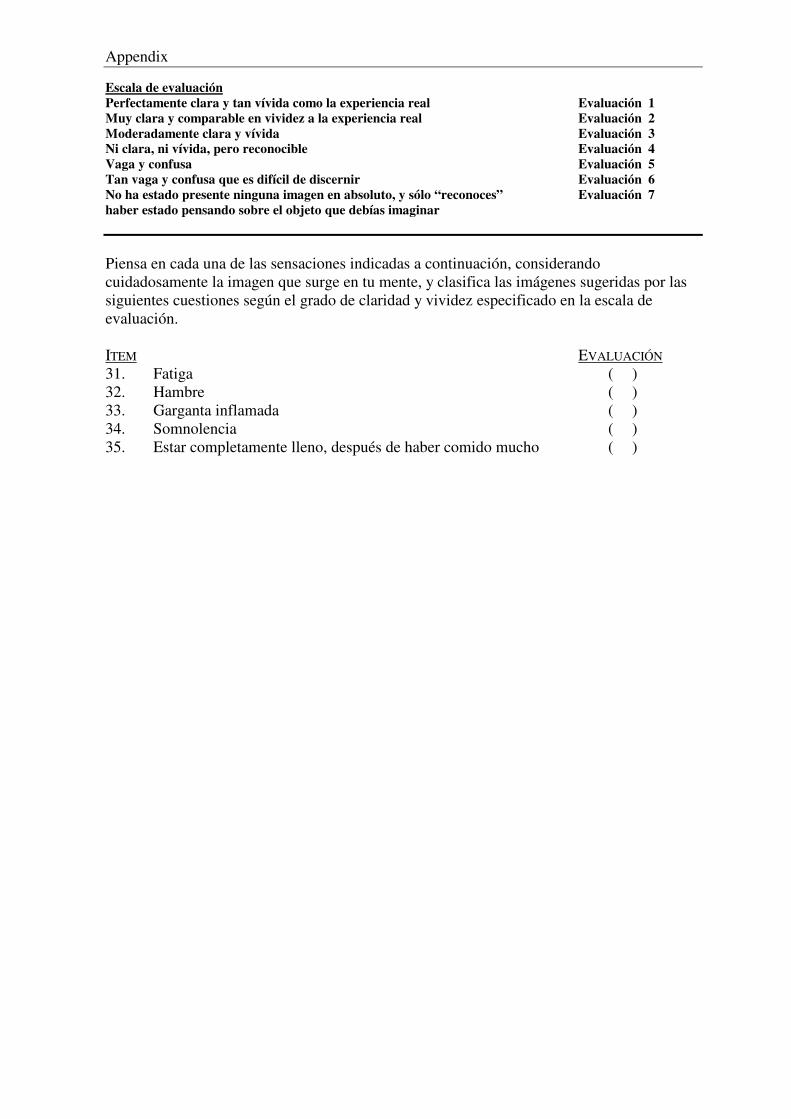
Appendix
Escala de evaluación Perfectamente clara y tan vívida como la experiencia real Evaluación 1 Muy clara y comparable en vividez a la experiencia real Evaluación 2 Moderadamente clara y vívida Evaluación 3 Ni clara, ni vívida, pero reconocible Evaluación 4 Vaga y confusa Evaluación 5 Tan vaga y confusa que es difícil de discernir Evaluación 6 No ha estado presente ninguna imagen en absoluto, y sólo “reconoces” Evaluación 7 haber estado pensando sobre el objeto que debías imaginar
Piensa en cada una de las sensaciones indicadas a continuación, considerando cuidadosamente la imagen que surge en tu mente, y clasifica las imágenes sugeridas por las siguientes cuestiones según el grado de claridad y vividez especificado en la escala de evaluación. ITEM EVALUACIÓN 31. Fatiga ( ) 32. Hambre ( ) 33. Garganta inflamada ( ) 34. Somnolencia ( ) 35. Estar completamente lleno, después de haber comido mucho ( )
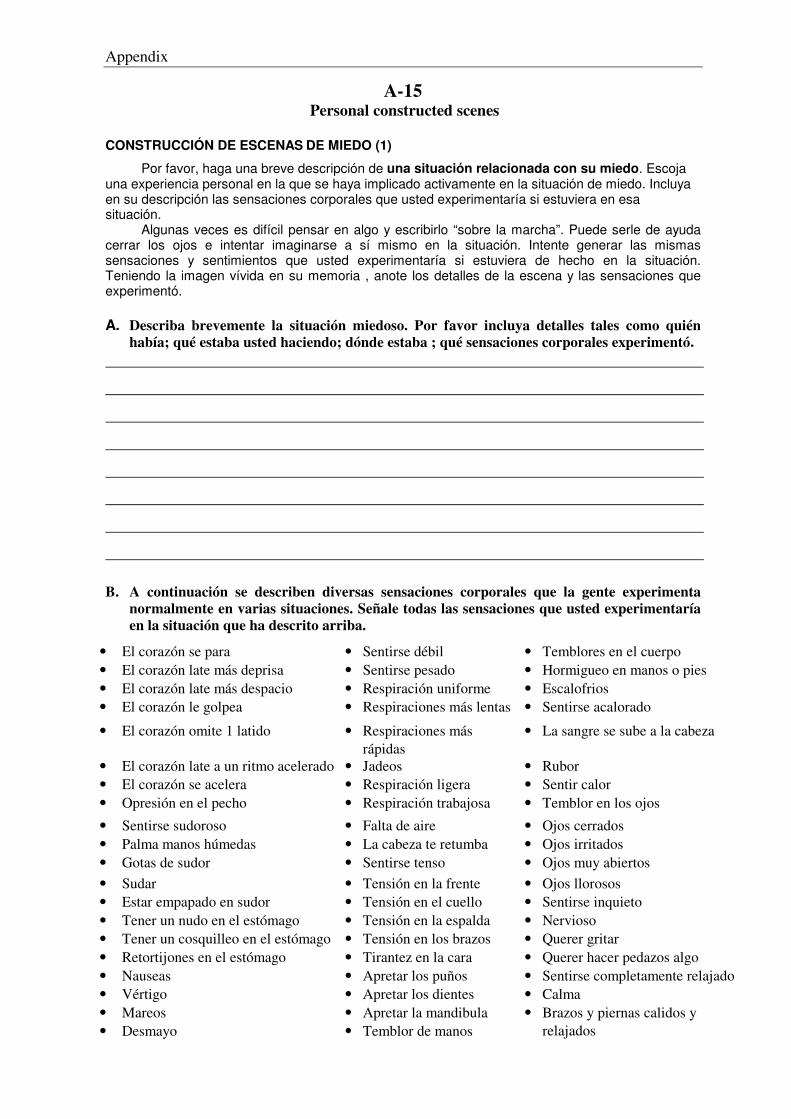
Appendix
A-15 Personal constructed scenes
CONSTRUCCIÓN DE ESCENAS DE MIEDO (1)
Por favor, haga una breve descripción de una situación relacionada con su miedo. Escoja una experiencia personal en la que se haya implicado activamente en la situación de miedo. Incluya en su descripción las sensaciones corporales que usted experimentaría si estuviera en esa situación. Algunas veces es difícil pensar en algo y escribirlo “sobre la marcha”. Puede serle de ayuda cerrar los ojos e intentar imaginarse a sí mismo en la situación. Intente generar las mismas sensaciones y sentimientos que usted experimentaría si estuviera de hecho en la situación. Teniendo la imagen vívida en su memoria , anote los detalles de la escena y las sensaciones que experimentó. A. Describa brevemente la situación miedoso. Por favor incluya detalles tales como quién
había; qué estaba usted haciendo; dónde estaba ; qué sensaciones corporales experimentó.
B. A continuación se describen diversas sensaciones corporales que la gente experimenta normalmente en varias situaciones. Señale todas las sensaciones que usted experimentaría en la situación que ha descrito arriba.
• El corazón se para • Sentirse débil • Temblores en el cuerpo • El corazón late más deprisa • Sentirse pesado • Hormigueo en manos o pies • El corazón late más despacio • Respiración uniforme • Escalofrios • El corazón le golpea • Respiraciones más lentas • Sentirse acalorado
• El corazón omite 1 latido • Respiraciones más rápidas
• La sangre se sube a la cabeza
• El corazón late a un ritmo acelerado • Jadeos • Rubor • El corazón se acelera • Respiración ligera • Sentir calor • Opresión en el pecho • Respiración trabajosa • Temblor en los ojos
• Sentirse sudoroso • Falta de aire • Ojos cerrados • Palma manos húmedas • La cabeza te retumba • Ojos irritados • Gotas de sudor • Sentirse tenso • Ojos muy abiertos • Sudar • Tensión en la frente • Ojos llorosos • Estar empapado en sudor • Tensión en el cuello • Sentirse inquieto • Tener un nudo en el estómago • Tensión en la espalda • Nervioso • Tener un cosquilleo en el estómago • Tensión en los brazos • Querer gritar • Retortijones en el estómago • Tirantez en la cara • Querer hacer pedazos algo • Nauseas • Apretar los puños • Sentirse completamente relajado • Vértigo • Apretar los dientes • Calma • Mareos • Apretar la mandibula • Desmayo • Temblor de manos
• Brazos y piernas calidos y relajados
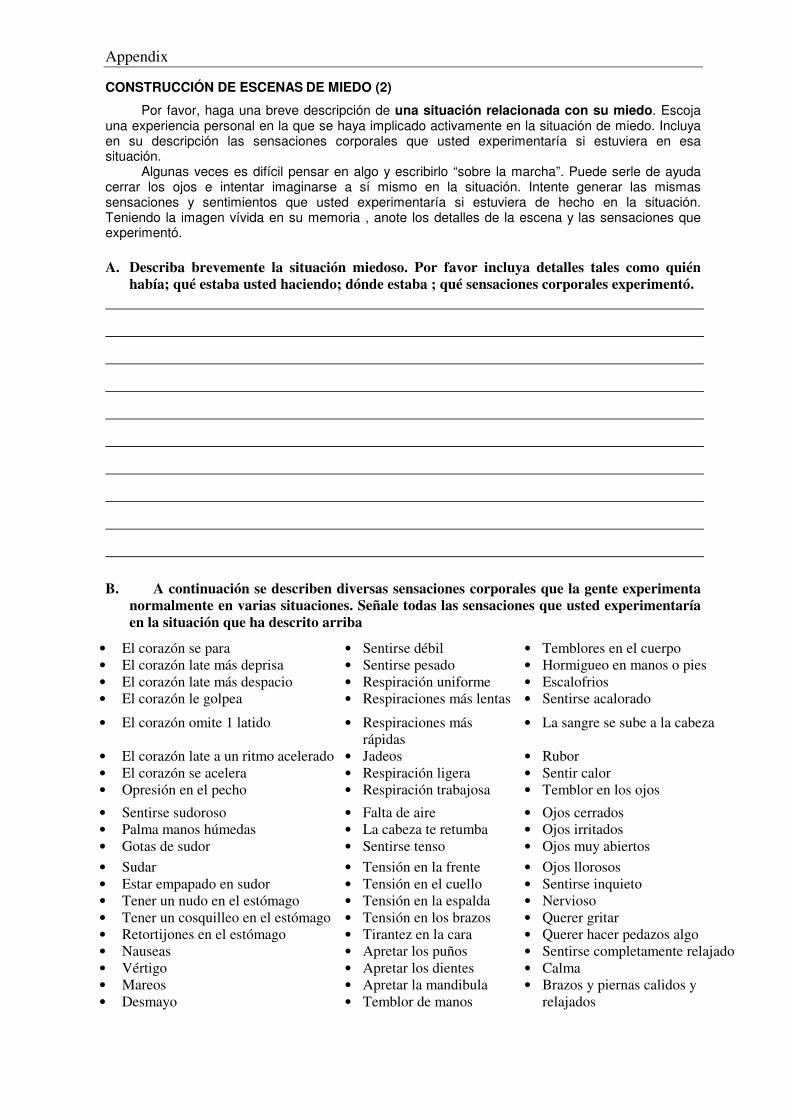
Appendix
CONSTRUCCIÓN DE ESCENAS DE MIEDO (2)
Por favor, haga una breve descripción de una situación relacionada con su miedo. Escoja una experiencia personal en la que se haya implicado activamente en la situación de miedo. Incluya en su descripción las sensaciones corporales que usted experimentaría si estuviera en esa situación. Algunas veces es difícil pensar en algo y escribirlo “sobre la marcha”. Puede serle de ayuda cerrar los ojos e intentar imaginarse a sí mismo en la situación. Intente generar las mismas sensaciones y sentimientos que usted experimentaría si estuviera de hecho en la situación. Teniendo la imagen vívida en su memoria , anote los detalles de la escena y las sensaciones que experimentó. A. Describa brevemente la situación miedoso. Por favor incluya detalles tales como quién
había; qué estaba usted haciendo; dónde estaba ; qué sensaciones corporales experimentó.
B. A continuación se describen diversas sensaciones corporales que la gente experimenta normalmente en varias situaciones. Señale todas las sensaciones que usted experimentaría en la situación que ha descrito arriba
• El corazón se para • Sentirse débil • Temblores en el cuerpo • El corazón late más deprisa • Sentirse pesado • Hormigueo en manos o pies • El corazón late más despacio • Respiración uniforme • Escalofrios • El corazón le golpea • Respiraciones más lentas • Sentirse acalorado
• El corazón omite 1 latido • Respiraciones más rápidas
• La sangre se sube a la cabeza
• El corazón late a un ritmo acelerado • Jadeos • Rubor • El corazón se acelera • Respiración ligera • Sentir calor • Opresión en el pecho • Respiración trabajosa • Temblor en los ojos
• Sentirse sudoroso • Falta de aire • Ojos cerrados • Palma manos húmedas • La cabeza te retumba • Ojos irritados • Gotas de sudor • Sentirse tenso • Ojos muy abiertos • Sudar • Tensión en la frente • Ojos llorosos • Estar empapado en sudor • Tensión en el cuello • Sentirse inquieto • Tener un nudo en el estómago • Tensión en la espalda • Nervioso • Tener un cosquilleo en el estómago • Tensión en los brazos • Querer gritar • Retortijones en el estómago • Tirantez en la cara • Querer hacer pedazos algo • Nauseas • Apretar los puños • Sentirse completamente relajado • Vértigo • Apretar los dientes • Calma • Mareos • Apretar la mandibula • Desmayo • Temblor de manos
• Brazos y piernas calidos y relajados
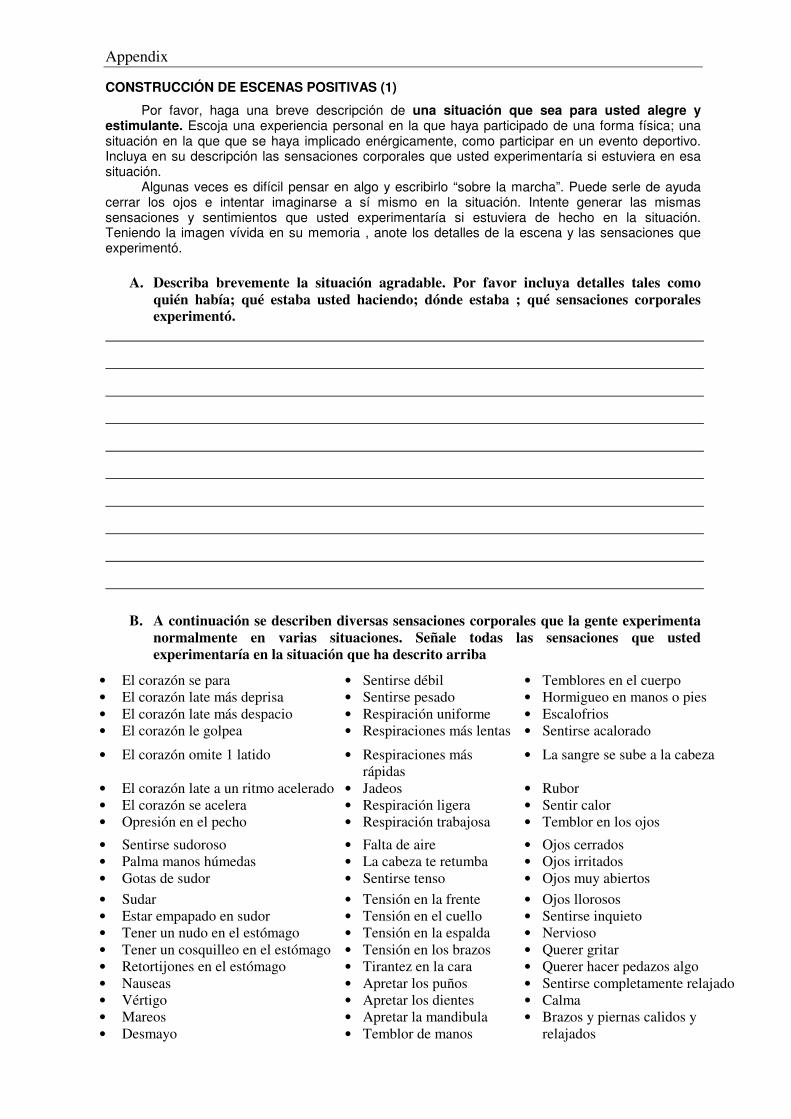
Appendix
CONSTRUCCIÓN DE ESCENAS POSITIVAS (1)
Por favor, haga una breve descripción de una situación que sea para usted alegre y estimulante. Escoja una experiencia personal en la que haya participado de una forma física; una situación en la que que se haya implicado enérgicamente, como participar en un evento deportivo. Incluya en su descripción las sensaciones corporales que usted experimentaría si estuviera en esa situación. Algunas veces es difícil pensar en algo y escribirlo “sobre la marcha”. Puede serle de ayuda cerrar los ojos e intentar imaginarse a sí mismo en la situación. Intente generar las mismas sensaciones y sentimientos que usted experimentaría si estuviera de hecho en la situación. Teniendo la imagen vívida en su memoria , anote los detalles de la escena y las sensaciones que experimentó.
A. Describa brevemente la situación agradable. Por favor incluya detalles tales como quién había; qué estaba usted haciendo; dónde estaba ; qué sensaciones corporales experimentó.
B. A continuación se describen diversas sensaciones corporales que la gente experimenta normalmente en varias situaciones. Señale todas las sensaciones que usted experimentaría en la situación que ha descrito arriba
• El corazón se para • Sentirse débil • Temblores en el cuerpo • El corazón late más deprisa • Sentirse pesado • Hormigueo en manos o pies • El corazón late más despacio • Respiración uniforme • Escalofrios • El corazón le golpea • Respiraciones más lentas • Sentirse acalorado
• El corazón omite 1 latido • Respiraciones más rápidas
• La sangre se sube a la cabeza
• El corazón late a un ritmo acelerado • Jadeos • Rubor • El corazón se acelera • Respiración ligera • Sentir calor • Opresión en el pecho • Respiración trabajosa • Temblor en los ojos
• Sentirse sudoroso • Falta de aire • Ojos cerrados • Palma manos húmedas • La cabeza te retumba • Ojos irritados • Gotas de sudor • Sentirse tenso • Ojos muy abiertos • Sudar • Tensión en la frente • Ojos llorosos • Estar empapado en sudor • Tensión en el cuello • Sentirse inquieto • Tener un nudo en el estómago • Tensión en la espalda • Nervioso • Tener un cosquilleo en el estómago • Tensión en los brazos • Querer gritar • Retortijones en el estómago • Tirantez en la cara • Querer hacer pedazos algo • Nauseas • Apretar los puños • Sentirse completamente relajado • Vértigo • Apretar los dientes • Calma • Mareos • Apretar la mandibula • Desmayo • Temblor de manos
• Brazos y piernas calidos y relajados

Appendix
CONSTRUCCIÓN DE ESCENAS POSITIVAS (2)
Por favor, haga una breve descripción de una situación que sea para usted alegre y estimulante. Escoja una experiencia personal en la que haya participado de una forma física; una situación en la que que se haya implicado enérgicamente, como participar en un evento deportivo. Incluya en su descripción las sensaciones corporales que usted experimentaría si estuviera en esa situación. Algunas veces es difícil pensar en algo y escribirlo “sobre la marcha”. Puede serle de ayuda cerrar los ojos e intentar imaginarse a sí mismo en la situación. Intente generar las mismas sensaciones y sentimientos que usted experimentaría si estuviera de hecho en la situación. Teniendo la imagen vívida en su memoria , anote los detalles de la escena y las sensaciones que experimentó.
A. Describa brevemente la situación agradable. Por favor incluya detalles tales como quién había; qué estaba usted haciendo; dónde estaba ; qué sensaciones corporales experimentó.
B. A continuación se describen diversas sensaciones corporales que la gente experimenta normalmente en varias situaciones. Señale todas las sensaciones que usted experimentaría en la situación que ha descrito arriba.
• El corazón se para • Sentirse débil • Temblores en el cuerpo • El corazón late más deprisa • Sentirse pesado • Hormigueo en manos o pies • El corazón late más despacio • Respiración uniforme • Escalofrios • El corazón le golpea • Respiraciones más lentas • Sentirse acalorado
• El corazón omite 1 latido • Respiraciones más rápidas
• La sangre se sube a la cabeza
• El corazón late a un ritmo acelerado • Jadeos • Rubor • El corazón se acelera • Respiración ligera • Sentir calor • Opresión en el pecho • Respiración trabajosa • Temblor en los ojos
• Sentirse sudoroso • Falta de aire • Ojos cerrados • Palma manos húmedas • La cabeza te retumba • Ojos irritados • Gotas de sudor • Sentirse tenso • Ojos muy abiertos • Sudar • Tensión en la frente • Ojos llorosos • Estar empapado en sudor • Tensión en el cuello • Sentirse inquieto • Tener un nudo en el estómago • Tensión en la espalda • Nervioso • Tener un cosquilleo en el estómago • Tensión en los brazos • Querer gritar • Retortijones en el estómago • Tirantez en la cara • Querer hacer pedazos algo • Nauseas • Apretar los puños • Sentirse completamente relajado • Vértigo • Apretar los dientes • Calma • Mareos • Apretar la mandibula • Desmayo • Temblor de manos
• Brazos y piernas calidos y relajados
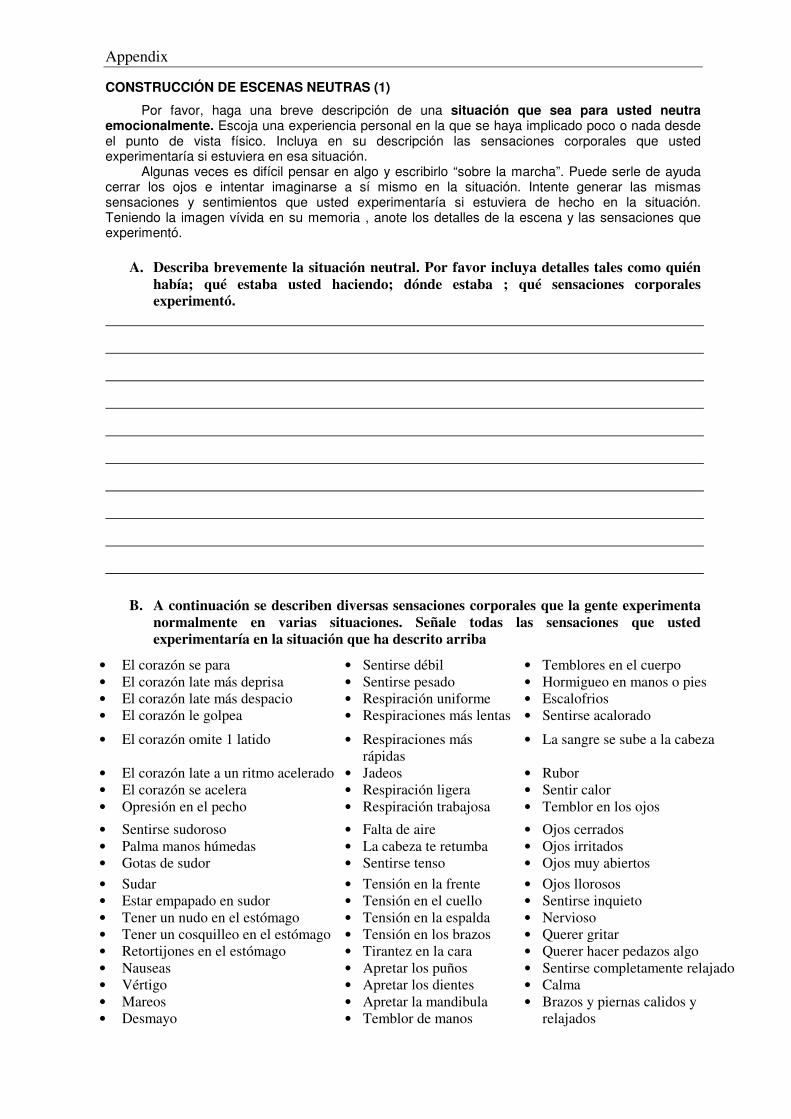
Appendix
CONSTRUCCIÓN DE ESCENAS NEUTRAS (1)
Por favor, haga una breve descripción de una situación que sea para usted neutra emocionalmente. Escoja una experiencia personal en la que se haya implicado poco o nada desde el punto de vista físico. Incluya en su descripción las sensaciones corporales que usted experimentaría si estuviera en esa situación. Algunas veces es difícil pensar en algo y escribirlo “sobre la marcha”. Puede serle de ayuda cerrar los ojos e intentar imaginarse a sí mismo en la situación. Intente generar las mismas sensaciones y sentimientos que usted experimentaría si estuviera de hecho en la situación. Teniendo la imagen vívida en su memoria , anote los detalles de la escena y las sensaciones que experimentó.
A. Describa brevemente la situación neutral. Por favor incluya detalles tales como quién había; qué estaba usted haciendo; dónde estaba ; qué sensaciones corporales experimentó.
B. A continuación se describen diversas sensaciones corporales que la gente experimenta normalmente en varias situaciones. Señale todas las sensaciones que usted experimentaría en la situación que ha descrito arriba
• El corazón se para • Sentirse débil • Temblores en el cuerpo • El corazón late más deprisa • Sentirse pesado • Hormigueo en manos o pies • El corazón late más despacio • Respiración uniforme • Escalofrios • El corazón le golpea • Respiraciones más lentas • Sentirse acalorado
• El corazón omite 1 latido • Respiraciones más rápidas
• La sangre se sube a la cabeza
• El corazón late a un ritmo acelerado • Jadeos • Rubor • El corazón se acelera • Respiración ligera • Sentir calor • Opresión en el pecho • Respiración trabajosa • Temblor en los ojos
• Sentirse sudoroso • Falta de aire • Ojos cerrados • Palma manos húmedas • La cabeza te retumba • Ojos irritados • Gotas de sudor • Sentirse tenso • Ojos muy abiertos • Sudar • Tensión en la frente • Ojos llorosos • Estar empapado en sudor • Tensión en el cuello • Sentirse inquieto • Tener un nudo en el estómago • Tensión en la espalda • Nervioso • Tener un cosquilleo en el estómago • Tensión en los brazos • Querer gritar • Retortijones en el estómago • Tirantez en la cara • Querer hacer pedazos algo • Nauseas • Apretar los puños • Sentirse completamente relajado • Vértigo • Apretar los dientes • Calma • Mareos • Apretar la mandibula • Desmayo • Temblor de manos
• Brazos y piernas calidos y relajados

Appendix
CONSTRUCCIÓN DE ESCENAS NEUTRAS (2)
Por favor, haga una breve descripción de una situación que sea para usted neutra emocionalmente. Escoja una experiencia personal en la que se haya implicado poco o nada desde el punto de vista físico. Incluya en su descripción las sensaciones corporales que usted experimentaría si estuviera en esa situación. Algunas veces es difícil pensar en algo y escribirlo “sobre la marcha”. Puede serle de ayuda cerrar los ojos e intentar imaginarse a sí mismo en la situación. Intente generar las mismas sensaciones y sentimientos que usted experimentaría si estuviera de hecho en la situación. Teniendo la imagen vívida en su memoria , anote los detalles de la escena y las sensaciones que experimentó.
A. Describa brevemente la situación neutral. Por favor incluya detalles tales como quién había; qué estaba usted haciendo; dónde estaba ; qué sensaciones corporales experimentó.
B. A continuación se describen diversas sensaciones corporales que la gente experimenta normalmente en varias situaciones. Señale todas las sensaciones que usted experimentaría en la situación que ha descrito arriba
• El corazón se para • Sentirse débil • Temblores en el cuerpo • El corazón late más deprisa • Sentirse pesado • Hormigueo en manos o pies • El corazón late más despacio • Respiración uniforme • Escalofrios • El corazón le golpea • Respiraciones más lentas • Sentirse acalorado
• El corazón omite 1 latido • Respiraciones más rápidas
• La sangre se sube a la cabeza
• El corazón late a un ritmo acelerado • Jadeos • Rubor • El corazón se acelera • Respiración ligera • Sentir calor • Opresión en el pecho • Respiración trabajosa • Temblor en los ojos
• Sentirse sudoroso • Falta de aire • Ojos cerrados • Palma manos húmedas • La cabeza te retumba • Ojos irritados • Gotas de sudor • Sentirse tenso • Ojos muy abiertos • Sudar • Tensión en la frente • Ojos llorosos • Estar empapado en sudor • Tensión en el cuello • Sentirse inquieto • Tener un nudo en el estómago • Tensión en la espalda • Nervioso • Tener un cosquilleo en el estómago • Tensión en los brazos • Querer gritar • Retortijones en el estómago • Tirantez en la cara • Querer hacer pedazos algo • Nauseas • Apretar los puños • Sentirse completamente relajado • Vértigo • Apretar los dientes • Calma • Mareos • Apretar la mandibula • Desmayo • Temblor de manos
• Brazos y piernas calidos y relajados
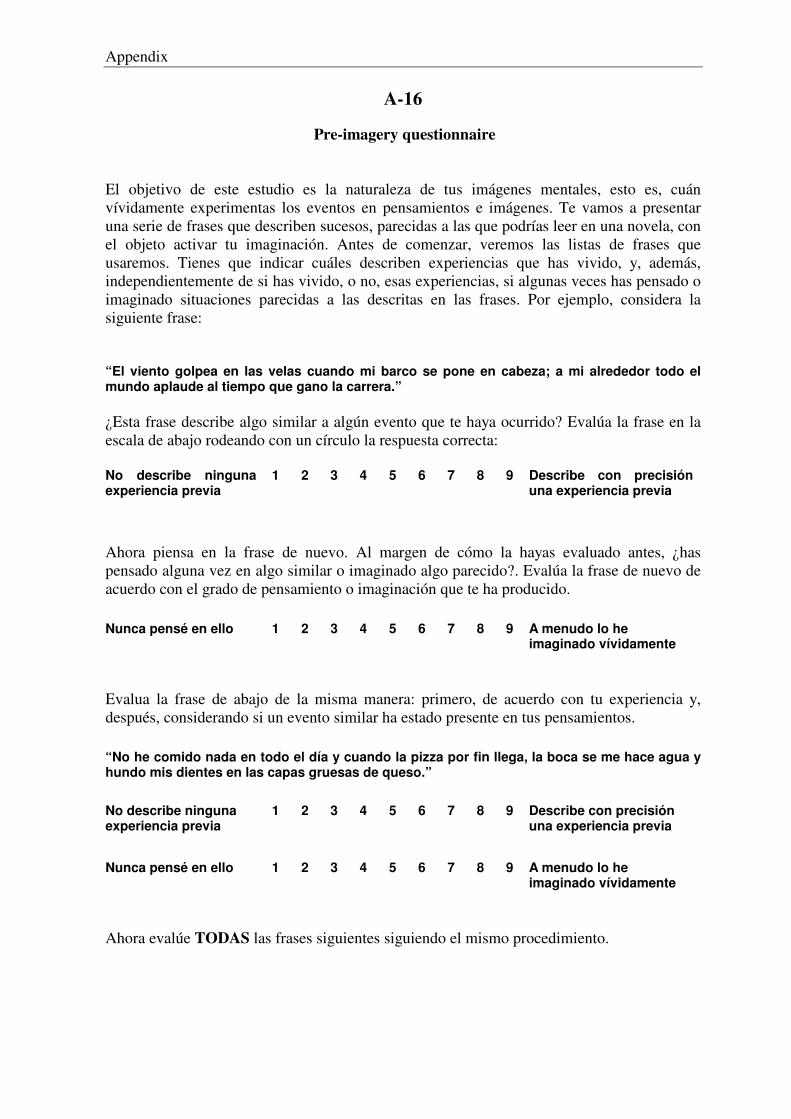
Appendix
A-16
Pre-imagery questionnaire
El objetivo de este estudio es la naturaleza de tus imágenes mentales, esto es, cuán vívidamente experimentas los eventos en pensamientos e imágenes. Te vamos a presentar una serie de frases que describen sucesos, parecidas a las que podrías leer en una novela, con el objeto activar tu imaginación. Antes de comenzar, veremos las listas de frases que usaremos. Tienes que indicar cuáles describen experiencias que has vivido, y, además, independientemente de si has vivido, o no, esas experiencias, si algunas veces has pensado o imaginado situaciones parecidas a las descritas en las frases. Por ejemplo, considera la siguiente frase: “El viento golpea en las velas cuando mi barco se pone en cabeza; a mi alrededor todo el mundo aplaude al tiempo que gano la carrera.” ¿Esta frase describe algo similar a algún evento que te haya ocurrido? Evalúa la frase en la escala de abajo rodeando con un círculo la respuesta correcta: No describe ninguna experiencia previa
1 2 3 4 5 6 7 8 9 Describe con precisión una experiencia previa
Ahora piensa en la frase de nuevo. Al margen de cómo la hayas evaluado antes, ¿has pensado alguna vez en algo similar o imaginado algo parecido?. Evalúa la frase de nuevo de acuerdo con el grado de pensamiento o imaginación que te ha producido.
Nunca pensé en ello 1 2 3 4 5 6 7 8 9 A menudo lo he imaginado vívidamente
Evalua la frase de abajo de la misma manera: primero, de acuerdo con tu experiencia y, después, considerando si un evento similar ha estado presente en tus pensamientos.
“No he comido nada en todo el día y cuando la pizza por fin llega, la boca se me hace agua y hundo mis dientes en las capas gruesas de queso.”
No describe ninguna experiencia previa
1 2 3 4 5 6 7 8 9 Describe con precisión una experiencia previa
Nunca pensé en ello 1 2 3 4 5 6 7 8 9 A menudo lo he
imaginado vívidamente
Ahora evalúe TODAS las frases siguientes siguiendo el mismo procedimiento.
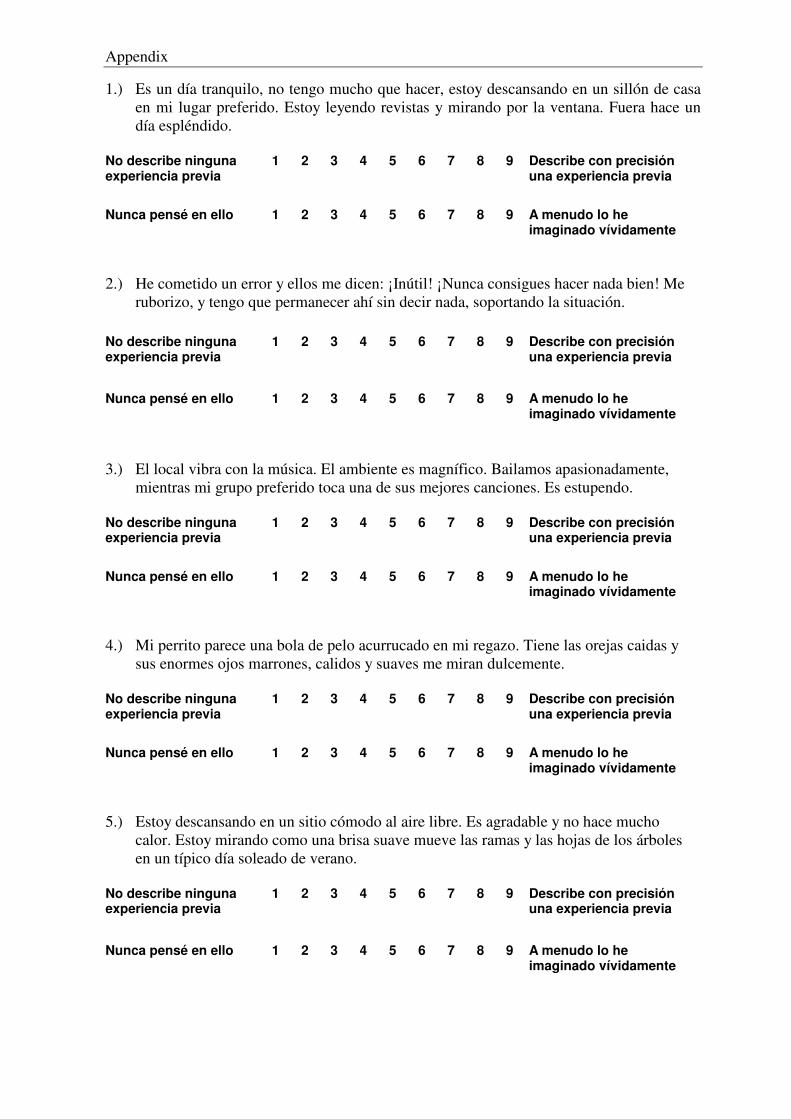
Appendix
1.) Es un día tranquilo, no tengo mucho que hacer, estoy descansando en un sillón de casa en mi lugar preferido. Estoy leyendo revistas y mirando por la ventana. Fuera hace un día espléndido. No describe ninguna experiencia previa
1 2 3 4 5 6 7 8 9 Describe con precisión una experiencia previa
Nunca pensé en ello 1 2 3 4 5 6 7 8 9 A menudo lo he
imaginado vívidamente 2.) He cometido un error y ellos me dicen: ¡Inútil! ¡Nunca consigues hacer nada bien! Me ruborizo, y tengo que permanecer ahí sin decir nada, soportando la situación.
No describe ninguna experiencia previa
1 2 3 4 5 6 7 8 9 Describe con precisión una experiencia previa
Nunca pensé en ello 1 2 3 4 5 6 7 8 9 A menudo lo he
imaginado vívidamente
3.) El local vibra con la música. El ambiente es magnífico. Bailamos apasionadamente, mientras mi grupo preferido toca una de sus mejores canciones. Es estupendo. No describe ninguna experiencia previa
1 2 3 4 5 6 7 8 9 Describe con precisión una experiencia previa
Nunca pensé en ello 1 2 3 4 5 6 7 8 9 A menudo lo he
imaginado vívidamente 4.) Mi perrito parece una bola de pelo acurrucado en mi regazo. Tiene las orejas caidas y sus enormes ojos marrones, calidos y suaves me miran dulcemente. No describe ninguna experiencia previa
1 2 3 4 5 6 7 8 9 Describe con precisión una experiencia previa
Nunca pensé en ello 1 2 3 4 5 6 7 8 9 A menudo lo he
imaginado vívidamente 5.) Estoy descansando en un sitio cómodo al aire libre. Es agradable y no hace mucho calor. Estoy mirando como una brisa suave mueve las ramas y las hojas de los árboles en un típico día soleado de verano. No describe ninguna experiencia previa
1 2 3 4 5 6 7 8 9 Describe con precisión una experiencia previa
Nunca pensé en ello 1 2 3 4 5 6 7 8 9 A menudo lo he
imaginado vívidamente
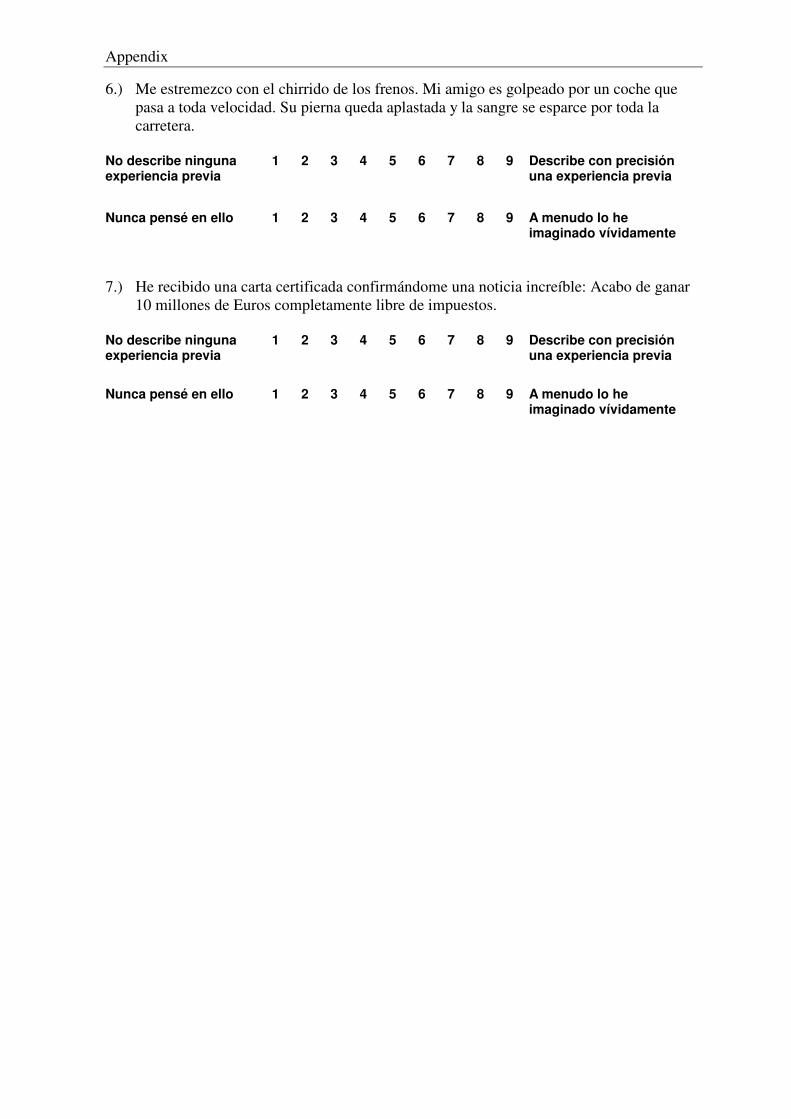
Appendix
6.) Me estremezco con el chirrido de los frenos. Mi amigo es golpeado por un coche que pasa a toda velocidad. Su pierna queda aplastada y la sangre se esparce por toda la carretera. No describe ninguna experiencia previa
1 2 3 4 5 6 7 8 9 Describe con precisión una experiencia previa
Nunca pensé en ello 1 2 3 4 5 6 7 8 9 A menudo lo he
imaginado vívidamente 7.) He recibido una carta certificada confirmándome una noticia increíble: Acabo de ganar 10 millones de Euros completamente libre de impuestos. No describe ninguna experiencia previa
1 2 3 4 5 6 7 8 9 Describe con precisión una experiencia previa
Nunca pensé en ello 1 2 3 4 5 6 7 8 9 A menudo lo he
imaginado vívidamente
Appendix
A-17
Self-assessment manikin (SAM)*
* reduced size
Appendix
Appendix
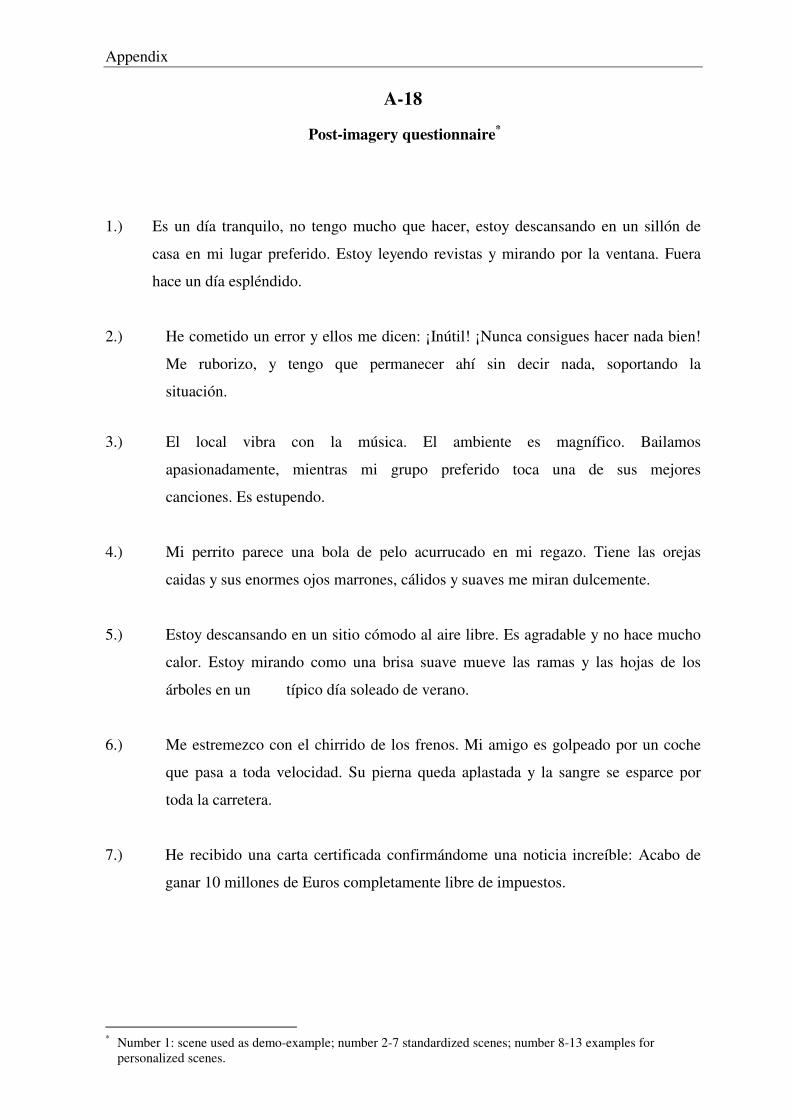
Appendix
A-18
Post-imagery questionnaire*
1.) Es un día tranquilo, no tengo mucho que hacer, estoy descansando en un sillón de
casa en mi lugar preferido. Estoy leyendo revistas y mirando por la ventana. Fuera
hace un día espléndido.
2.) He cometido un error y ellos me dicen: ¡Inútil! ¡Nunca consigues hacer nada bien!
Me ruborizo, y tengo que permanecer ahí sin decir nada, soportando la
situación.
3.) El local vibra con la música. El ambiente es magnífico. Bailamos
apasionadamente, mientras mi grupo preferido toca una de sus mejores
canciones. Es estupendo.
4.) Mi perrito parece una bola de pelo acurrucado en mi regazo. Tiene las orejas
caidas y sus enormes ojos marrones, cálidos y suaves me miran dulcemente.
5.) Estoy descansando en un sitio cómodo al aire libre. Es agradable y no hace mucho
calor. Estoy mirando como una brisa suave mueve las ramas y las hojas de los
árboles en un típico día soleado de verano.
6.) Me estremezco con el chirrido de los frenos. Mi amigo es golpeado por un coche
que pasa a toda velocidad. Su pierna queda aplastada y la sangre se esparce por
toda la carretera.
7.) He recibido una carta certificada confirmándome una noticia increíble: Acabo de
ganar 10 millones de Euros completamente libre de impuestos.
* Number 1: scene used as demo-example; number 2-7 standardized scenes; number 8-13 examples for personalized scenes.
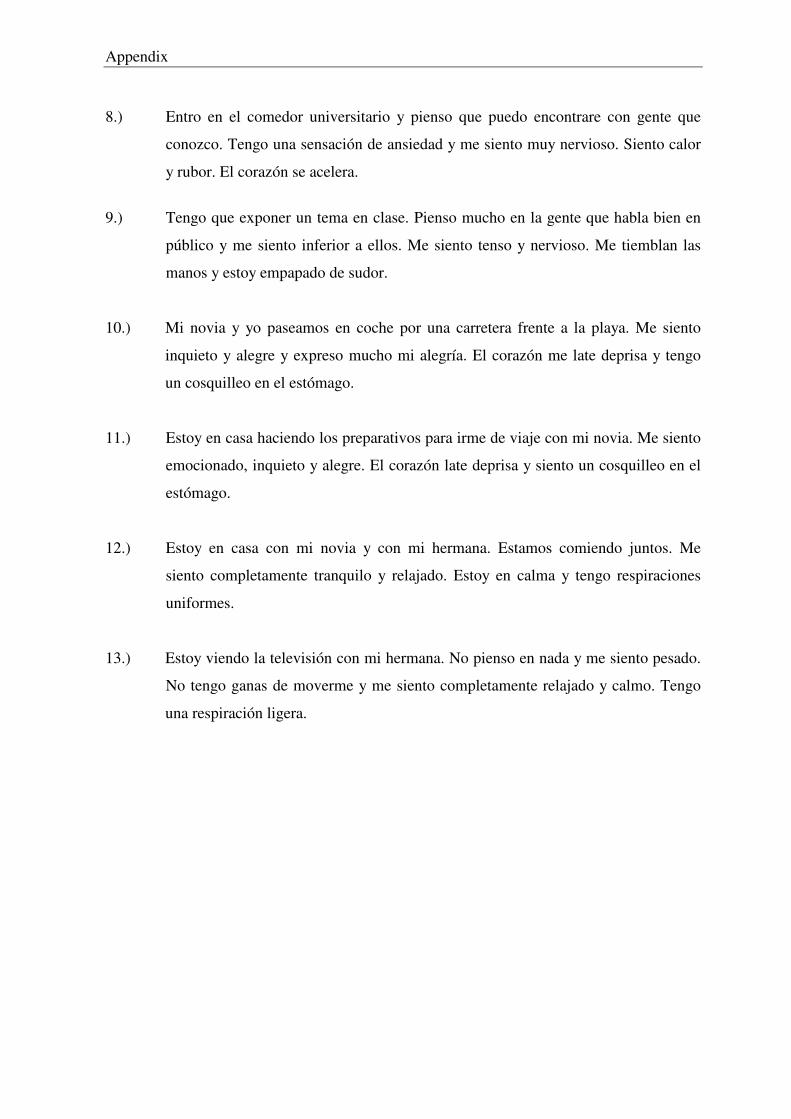
Appendix
8.) Entro en el comedor universitario y pienso que puedo encontrare con gente que
conozco. Tengo una sensación de ansiedad y me siento muy nervioso. Siento calor
y rubor. El corazón se acelera.
9.) Tengo que exponer un tema en clase. Pienso mucho en la gente que habla bien en
público y me siento inferior a ellos. Me siento tenso y nervioso. Me tiemblan las
manos y estoy empapado de sudor.
10.) Mi novia y yo paseamos en coche por una carretera frente a la playa. Me siento
inquieto y alegre y expreso mucho mi alegría. El corazón me late deprisa y tengo
un cosquilleo en el estómago.
11.) Estoy en casa haciendo los preparativos para irme de viaje con mi novia. Me siento
emocionado, inquieto y alegre. El corazón late deprisa y siento un cosquilleo en el
estómago.
12.) Estoy en casa con mi novia y con mi hermana. Estamos comiendo juntos. Me
siento completamente tranquilo y relajado. Estoy en calma y tengo respiraciones
uniformes.
13.) Estoy viendo la televisión con mi hermana. No pienso en nada y me siento pesado.
No tengo ganas de moverme y me siento completamente relajado y calmo. Tengo
una respiración ligera.
Appendix
A-19
Informed consent
SEGUIMIENTO Y TASA DE RESPUESTA
CONSENTIMIENTO
Una vez informado sobre las características del estudio sobre respuestas psicofisiológicas, en el que voy a realizar tareas de seguimiento y/o de tasa de respuesta y en el que se presentarán una serie de estímulos auditivos intensos, diapositivas y descripciones que pueden resultarme desagradables, doy mi consentimiento a participar en el mismo.
Granada, a de de 2003
Firmado:...................................................................
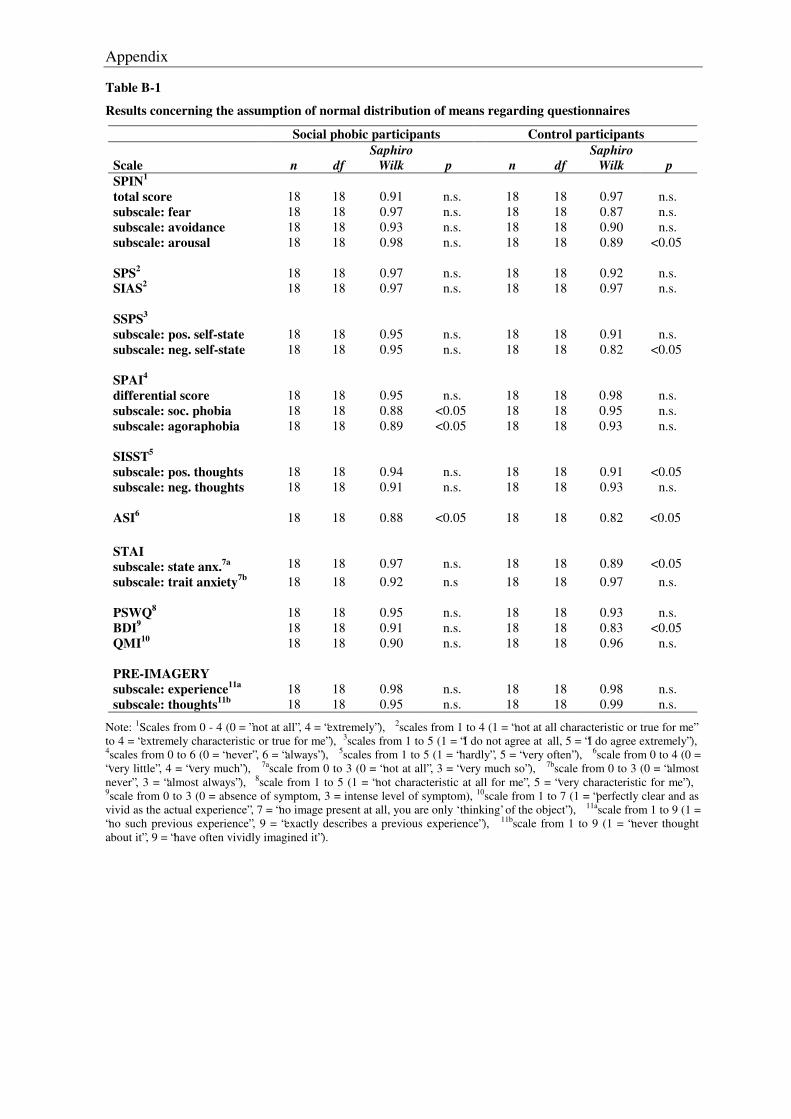
Appendix
Table B-1
Results concerning the assumption of normal distribution of means regarding questionnaires
Social phobic participants Control participants Scale
n
df
Saphiro Wilk
p
n
df
Saphiro Wilk
p
SPIN1 total score
18
18
0.91
n.s.
18
18
0.97
n.s.
subscale: fear 18 18 0.97 n.s. 18 18 0.87 n.s. subscale: avoidance 18 18 0.93 n.s. 18 18 0.90 n.s. subscale: arousal 18 18 0.98 n.s. 18 18 0.89 <0.05 SPS2
18
18
0.97
n.s.
18
18
0.92
n.s.
SIAS2 18 18 0.97 n.s. 18 18 0.97 n.s. SSPS3
subscale: pos. self-state
18
18
0.95
n.s.
18
18
0.91
n.s. subscale: neg. self-state 18 18 0.95 n.s. 18 18 0.82 <0.05 SPAI4
differential score
18
18
0.95
n.s.
18
18
0.98
n.s. subscale: soc. phobia 18 18 0.88 <0.05 18 18 0.95 n.s. subscale: agoraphobia 18 18 0.89 <0.05 18 18 0.93 n.s.
SISST5
subscale: pos. thoughts
18
18
0.94
n.s.
18
18
0.91
<0.05 subscale: neg. thoughts 18 18 0.91 n.s. 18 18 0.93 n.s. ASI6
18
18
0.88
<0.05
18
18
0.82
<0.05
STAI
subscale: state anx.7a
18
18
0.97
n.s.
18
18
0.89
<0.05 subscale: trait anxiety7b 18 18 0.92 n.s 18 18 0.97 n.s. PSWQ8
18
18
0.95
n.s.
18
18
0.93
n.s.
BDI9 18 18 0.91 n.s. 18 18 0.83 <0.05 QMI10 18 18 0.90 n.s. 18 18 0.96 n.s. PRE-IMAGERY subscale: experience11a
18
18
0.98
n.s.
18
18
0.98
n.s. subscale: thoughts11b 18 18 0.95 n.s. 18 18 0.99 n.s.
Note: 1Scales from 0 - 4 (0 = ”not at all”, 4 = “extremely”), 2scales from 1 to 4 (1 = “not at all characteristic or true for me” to 4 = “extremely characteristic or true for me”), 3scales from 1 to 5 (1 = “I do not agree at all, 5 = “I do agree extremely”), 4scales from 0 to 6 (0 = “never”, 6 = “always”), 5scales from 1 to 5 (1 = “hardly”, 5 = “very often”), 6scale from 0 to 4 (0 = “very little”, 4 = “very much”), 7ascale from 0 to 3 (0 = “not at all”, 3 = “very much so”), 7bscale from 0 to 3 (0 = “almost never”, 3 = “almost always”), 8scale from 1 to 5 (1 = “not characteristic at all for me”, 5 = “very characteristic for me”), 9scale from 0 to 3 (0 = absence of symptom, 3 = intense level of symptom), 10scale from 1 to 7 (1 = “perfectly clear and as vivid as the actual experience”, 7 = “no image present at all, you are only ‘thinking’ of the object”), 11ascale from 1 to 9 (1 = “no such previous experience”, 9 = “exactly describes a previous experience”), 11bscale from 1 to 9 (1 = “never thought about it”, 9 = “have often vividly imagined it”).
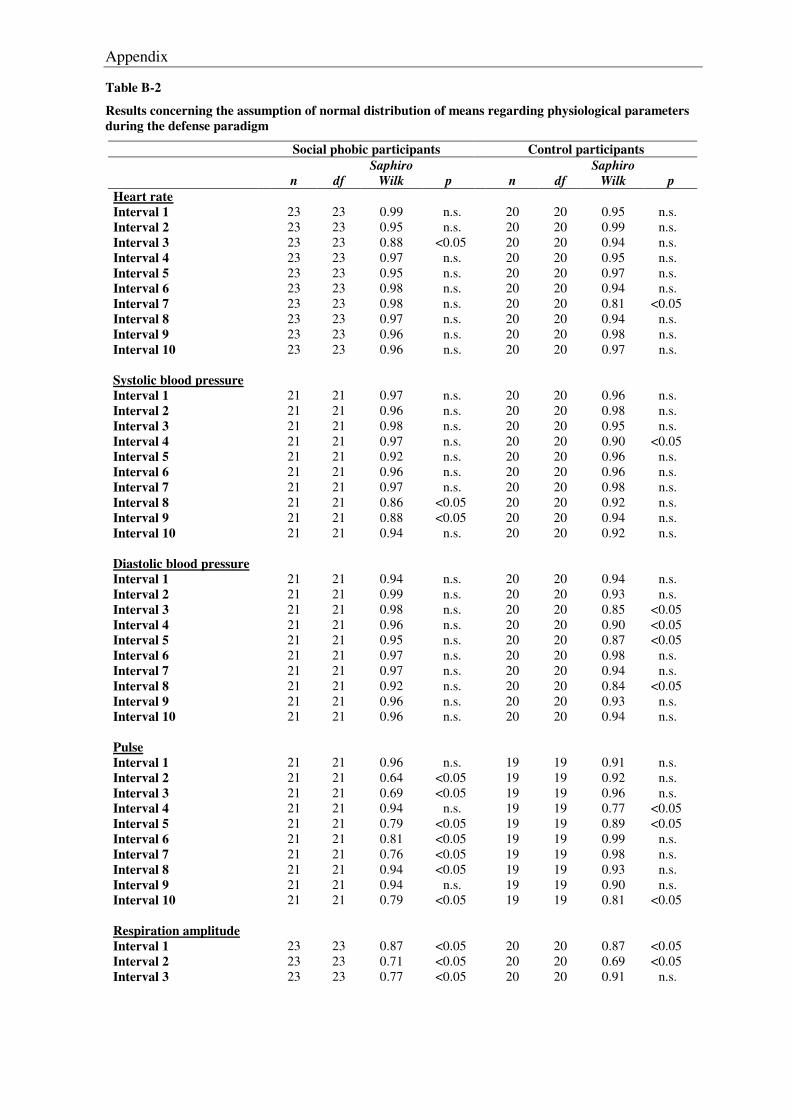
Appendix
Table B-2
Results concerning the assumption of normal distribution of means regarding physiological parameters during the defense paradigm
Social phobic participants Control participants
n
df
Saphiro Wilk
p
n
df
Saphiro Wilk
p
Heart rate Interval 1
23
23
0.99
n.s.
20
20
0.95
n.s.
Interval 2 23 23 0.95 n.s. 20 20 0.99 n.s. Interval 3 23 23 0.88 <0.05 20 20 0.94 n.s. Interval 4 23 23 0.97 n.s. 20 20 0.95 n.s. Interval 5 23 23 0.95 n.s. 20 20 0.97 n.s. Interval 6 23 23 0.98 n.s. 20 20 0.94 n.s. Interval 7 23 23 0.98 n.s. 20 20 0.81 <0.05 Interval 8 23 23 0.97 n.s. 20 20 0.94 n.s. Interval 9 23 23 0.96 n.s. 20 20 0.98 n.s. Interval 10 23 23 0.96 n.s. 20 20 0.97 n.s. Systolic blood pressure Interval 1
21
21
0.97
n.s.
20
20
0.96
n.s.
Interval 2 21 21 0.96 n.s. 20 20 0.98 n.s. Interval 3 21 21 0.98 n.s. 20 20 0.95 n.s. Interval 4 21 21 0.97 n.s. 20 20 0.90 <0.05 Interval 5 21 21 0.92 n.s. 20 20 0.96 n.s. Interval 6 21 21 0.96 n.s. 20 20 0.96 n.s. Interval 7 21 21 0.97 n.s. 20 20 0.98 n.s. Interval 8 21 21 0.86 <0.05 20 20 0.92 n.s. Interval 9 21 21 0.88 <0.05 20 20 0.94 n.s. Interval 10 21 21 0.94 n.s. 20 20 0.92 n.s. Diastolic blood pressure Interval 1
21
21
0.94
n.s.
20
20
0.94
n.s.
Interval 2 21 21 0.99 n.s. 20 20 0.93 n.s. Interval 3 21 21 0.98 n.s. 20 20 0.85 <0.05 Interval 4 21 21 0.96 n.s. 20 20 0.90 <0.05 Interval 5 21 21 0.95 n.s. 20 20 0.87 <0.05 Interval 6 21 21 0.97 n.s. 20 20 0.98 n.s. Interval 7 21 21 0.97 n.s. 20 20 0.94 n.s. Interval 8 21 21 0.92 n.s. 20 20 0.84 <0.05 Interval 9 21 21 0.96 n.s. 20 20 0.93 n.s. Interval 10 21 21 0.96 n.s. 20 20 0.94 n.s. Pulse Interval 1
21
21
0.96
n.s.
19
19
0.91
n.s.
Interval 2 21 21 0.64 <0.05 19 19 0.92 n.s. Interval 3 21 21 0.69 <0.05 19 19 0.96 n.s. Interval 4 21 21 0.94 n.s. 19 19 0.77 <0.05 Interval 5 21 21 0.79 <0.05 19 19 0.89 <0.05 Interval 6 21 21 0.81 <0.05 19 19 0.99 n.s. Interval 7 21 21 0.76 <0.05 19 19 0.98 n.s. Interval 8 21 21 0.94 <0.05 19 19 0.93 n.s. Interval 9 21 21 0.94 n.s. 19 19 0.90 n.s. Interval 10 21 21 0.79 <0.05 19 19 0.81 <0.05 Respiration amplitude Interval 1
23
23
0.87
<0.05
20
20
0.87
<0.05
Interval 2 23 23 0.71 <0.05 20 20 0.69 <0.05 Interval 3 23 23 0.77 <0.05 20 20 0.91 n.s.
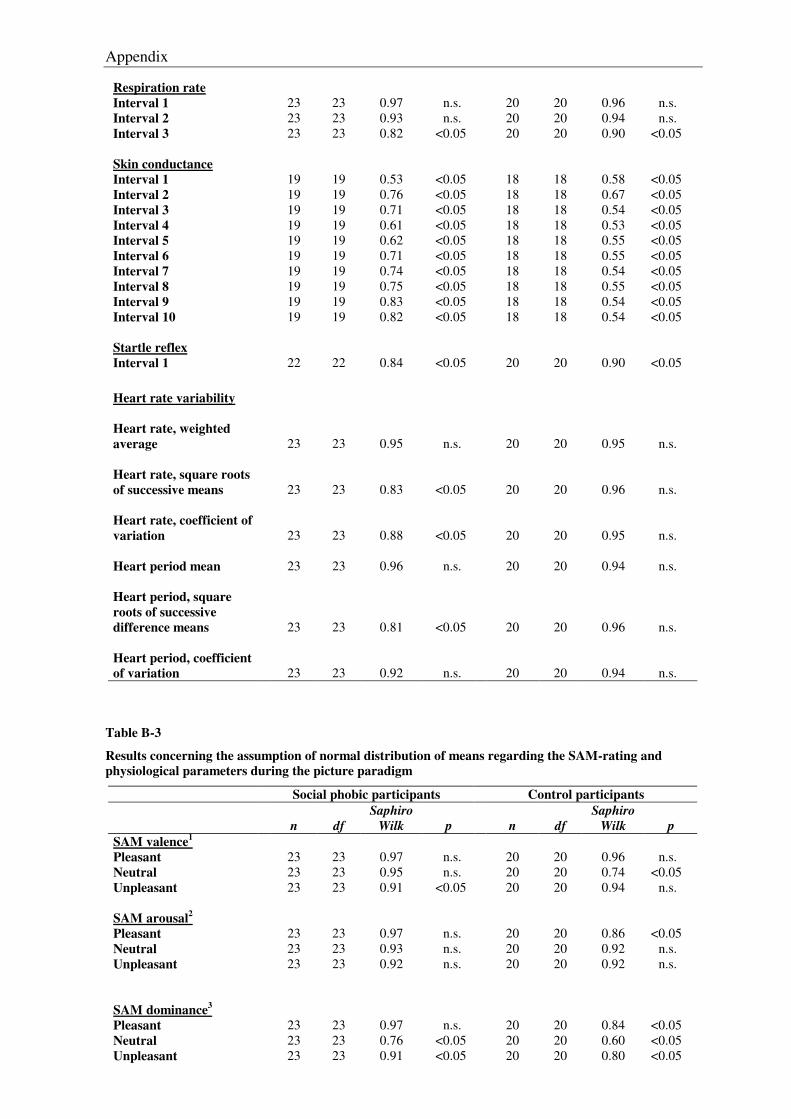
Appendix
Respiration rate Interval 1
23
23
0.97
n.s.
20
20
0.96
n.s.
Interval 2 23 23 0.93 n.s. 20 20 0.94 n.s. Interval 3 23 23 0.82 <0.05 20 20 0.90 <0.05 Skin conductance Interval 1
19
19
0.53
<0.05
18
18
0.58
<0.05
Interval 2 19 19 0.76 <0.05 18 18 0.67 <0.05 Interval 3 19 19 0.71 <0.05 18 18 0.54 <0.05 Interval 4 19 19 0.61 <0.05 18 18 0.53 <0.05 Interval 5 19 19 0.62 <0.05 18 18 0.55 <0.05 Interval 6 19 19 0.71 <0.05 18 18 0.55 <0.05 Interval 7 19 19 0.74 <0.05 18 18 0.54 <0.05 Interval 8 19 19 0.75 <0.05 18 18 0.55 <0.05 Interval 9 19 19 0.83 <0.05 18 18 0.54 <0.05 Interval 10 19 19 0.82 <0.05 18 18 0.54 <0.05 Startle reflex Interval 1 22 22 0.84 <0.05 20 20 0.90 <0.05
Heart rate variability
Heart rate, weighted average
23
23
0.95
n.s.
20
20
0.95
n.s.
Heart rate, square roots of successive means
23
23
0.83
<0.05
20
20
0.96
n.s.
Heart rate, coefficient of variation
23
23
0.88
<0.05
20
20
0.95
n.s.
Heart period mean
23 23 0.96 n.s. 20 20 0.94 n.s.
Heart period, square roots of successive difference means
23
23
0.81
<0.05
20
20
0.96
n.s.
Heart period, coefficient of variation
23
23
0.92
n.s.
20
20
0.94
n.s.
Table B-3
Results concerning the assumption of normal distribution of means regarding the SAM-rating and physiological parameters during the picture paradigm
Social phobic participants Control participants
n
df
Saphiro Wilk
p
n
df
Saphiro Wilk
p
SAM valence1
Pleasant
23
23
0.97
n.s.
20
20
0.96
n.s. Neutral 23 23 0.95 n.s. 20 20 0.74 <0.05 Unpleasant 23 23 0.91 <0.05 20 20 0.94 n.s. SAM arousal2
Pleasant
23
23
0.97
n.s.
20
20
0.86
<0.05 Neutral 23 23 0.93 n.s. 20 20 0.92 n.s. Unpleasant 23 23 0.92 n.s. 20 20 0.92 n.s. SAM dominance3
Pleasant
23
23
0.97
n.s.
20
20
0.84
<0.05 Neutral 23 23 0.76 <0.05 20 20 0.60 <0.05 Unpleasant 23 23 0.91 <0.05 20 20 0.80 <0.05
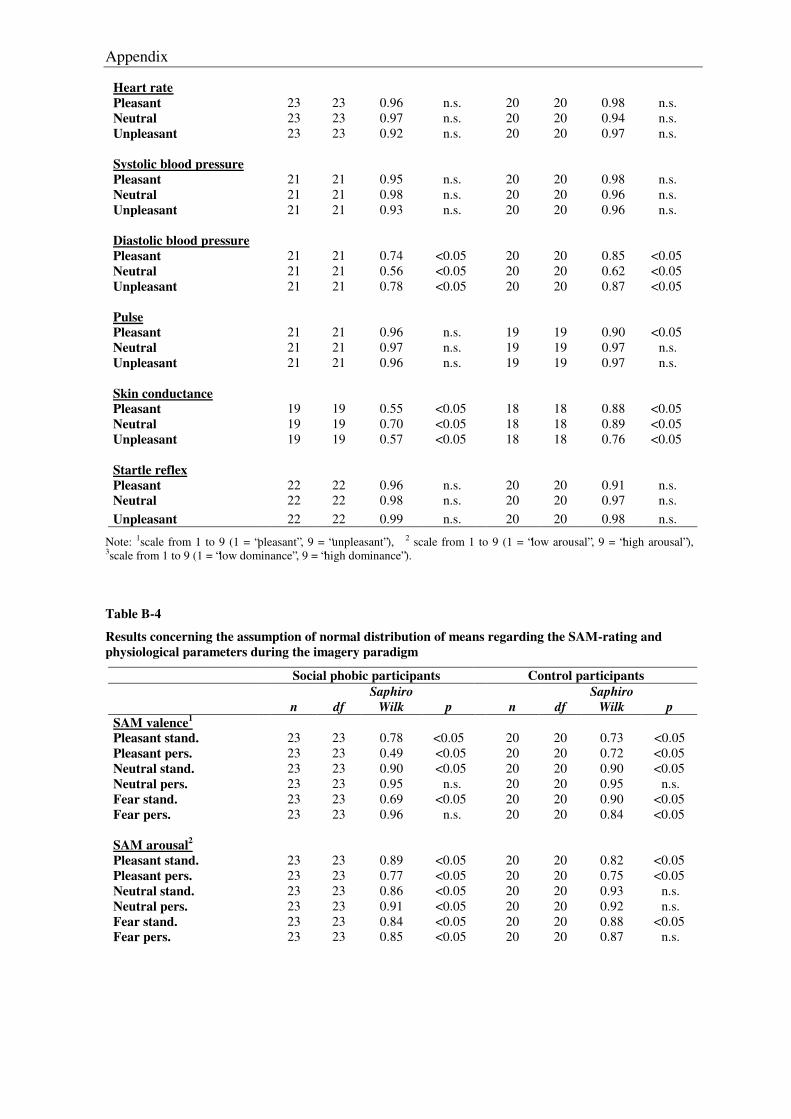
Appendix
Heart rate Pleasant
23
23
0.96
n.s.
20
20
0.98
n.s.
Neutral 23 23 0.97 n.s. 20 20 0.94 n.s. Unpleasant 23 23 0.92 n.s. 20 20 0.97 n.s. Systolic blood pressure Pleasant
21
21
0.95
n.s.
20
20
0.98
n.s.
Neutral 21 21 0.98 n.s. 20 20 0.96 n.s. Unpleasant 21 21 0.93 n.s. 20 20 0.96 n.s. Diastolic blood pressure Pleasant
21
21
0.74
<0.05
20
20
0.85
<0.05
Neutral 21 21 0.56 <0.05 20 20 0.62 <0.05 Unpleasant 21 21 0.78 <0.05 20 20 0.87 <0.05 Pulse Pleasant
21
21
0.96
n.s.
19
19
0.90
<0.05
Neutral 21 21 0.97 n.s. 19 19 0.97 n.s. Unpleasant 21 21 0.96 n.s. 19 19 0.97 n.s. Skin conductance Pleasant
19
19
0.55
<0.05
18
18
0.88
<0.05
Neutral 19 19 0.70 <0.05 18 18 0.89 <0.05 Unpleasant 19 19 0.57 <0.05 18 18 0.76 <0.05 Startle reflex Pleasant
22
22
0.96
n.s.
20
20
0.91
n.s.
Neutral 22 22 0.98 n.s. 20 20 0.97 n.s. Unpleasant 22 22 0.99 n.s. 20 20 0.98 n.s.
Note: 1scale from 1 to 9 (1 = “pleasant”, 9 = “unpleasant”), 2 scale from 1 to 9 (1 = “low arousal”, 9 = “high arousal”), 3scale from 1 to 9 (1 = “low dominance”, 9 = “high dominance”).
Table B-4
Results concerning the assumption of normal distribution of means regarding the SAM-rating and physiological parameters during the imagery paradigm
Social phobic participants Control participants
n
df
Saphiro Wilk
p
n
df
Saphiro Wilk
p
SAM valence1
Pleasant stand.
23
23
0.78
<0.05
20
20
0.73
<0.05 Pleasant pers. 23 23 0.49 <0.05 20 20 0.72 <0.05 Neutral stand. 23 23 0.90 <0.05 20 20 0.90 <0.05 Neutral pers. 23 23 0.95 n.s. 20 20 0.95 n.s. Fear stand. 23 23 0.69 <0.05 20 20 0.90 <0.05 Fear pers. 23 23 0.96 n.s. 20 20 0.84 <0.05 SAM arousal2
Pleasant stand.
23
23
0.89
<0.05
20
20
0.82
<0.05 Pleasant pers. 23 23 0.77 <0.05 20 20 0.75 <0.05 Neutral stand. 23 23 0.86 <0.05 20 20 0.93 n.s. Neutral pers. 23 23 0.91 <0.05 20 20 0.92 n.s. Fear stand. 23 23 0.84 <0.05 20 20 0.88 <0.05 Fear pers. 23 23 0.85 <0.05 20 20 0.87 n.s.
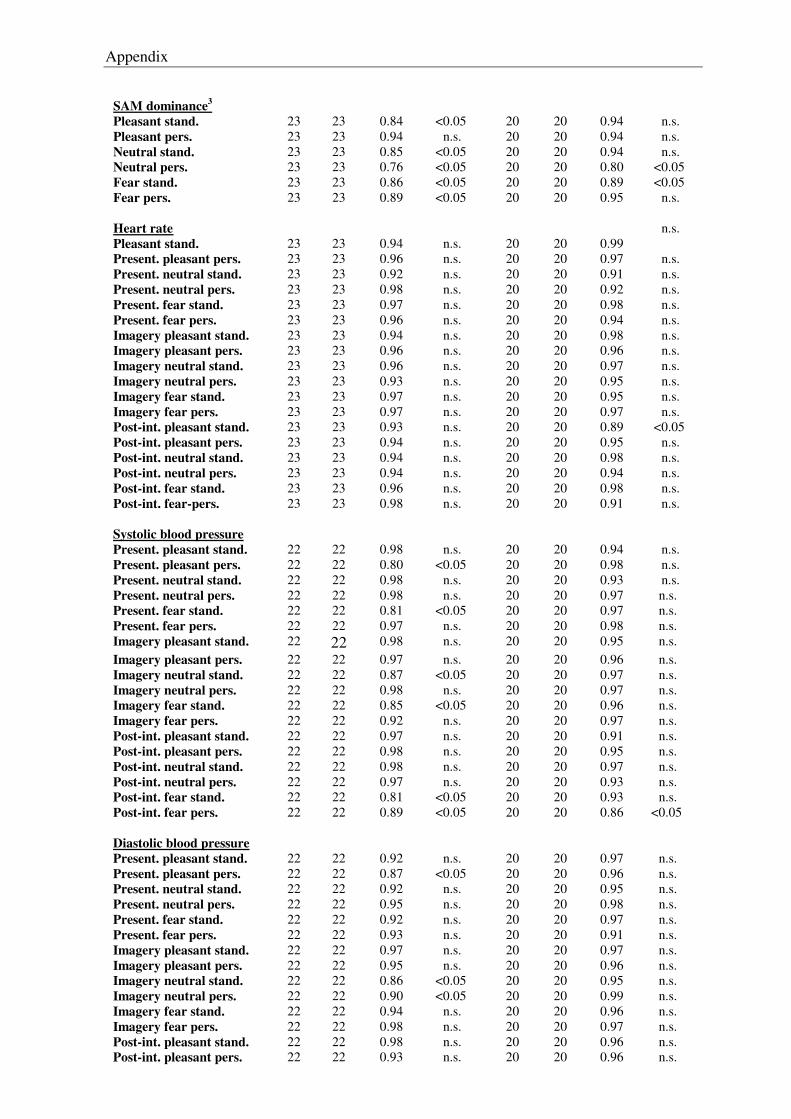
Appendix
SAM dominance3
Pleasant stand.
23
23
0.84
<0.05
20
20
0.94
n.s. Pleasant pers. 23 23 0.94 n.s. 20 20 0.94 n.s. Neutral stand. 23 23 0.85 <0.05 20 20 0.94 n.s. Neutral pers. 23 23 0.76 <0.05 20 20 0.80 <0.05 Fear stand. 23 23 0.86 <0.05 20 20 0.89 <0.05 Fear pers. 23 23 0.89 <0.05 20 20 0.95 n.s. Heart rate Pleasant stand.
23
23
0.94
n.s.
20
20
0.99
n.s.
Present. pleasant pers. 23 23 0.96 n.s. 20 20 0.97 n.s. Present. neutral stand. 23 23 0.92 n.s. 20 20 0.91 n.s. Present. neutral pers. 23 23 0.98 n.s. 20 20 0.92 n.s. Present. fear stand. 23 23 0.97 n.s. 20 20 0.98 n.s. Present. fear pers. 23 23 0.96 n.s. 20 20 0.94 n.s. Imagery pleasant stand. 23 23 0.94 n.s. 20 20 0.98 n.s. Imagery pleasant pers. 23 23 0.96 n.s. 20 20 0.96 n.s. Imagery neutral stand. 23 23 0.96 n.s. 20 20 0.97 n.s. Imagery neutral pers. 23 23 0.93 n.s. 20 20 0.95 n.s. Imagery fear stand. 23 23 0.97 n.s. 20 20 0.95 n.s. Imagery fear pers. 23 23 0.97 n.s. 20 20 0.97 n.s. Post-int. pleasant stand. 23 23 0.93 n.s. 20 20 0.89 <0.05 Post-int. pleasant pers. 23 23 0.94 n.s. 20 20 0.95 n.s. Post-int. neutral stand. 23 23 0.94 n.s. 20 20 0.98 n.s. Post-int. neutral pers. 23 23 0.94 n.s. 20 20 0.94 n.s. Post-int. fear stand. 23 23 0.96 n.s. 20 20 0.98 n.s. Post-int. fear-pers. 23 23 0.98 n.s. 20 20 0.91 n.s. Systolic blood pressure Present. pleasant stand.
22
22
0.98
n.s.
20
20
0.94
n.s.
Present. pleasant pers. 22 22 0.80 <0.05 20 20 0.98 n.s. Present. neutral stand. 22 22 0.98 n.s. 20 20 0.93 n.s. Present. neutral pers. 22 22 0.98 n.s. 20 20 0.97 n.s. Present. fear stand. 22 22 0.81 <0.05 20 20 0.97 n.s. Present. fear pers. 22 22 0.97 n.s. 20 20 0.98 n.s. Imagery pleasant stand. 22 22 0.98 n.s. 20 20 0.95 n.s. Imagery pleasant pers. 22 22 0.97 n.s. 20 20 0.96 n.s. Imagery neutral stand. 22 22 0.87 <0.05 20 20 0.97 n.s. Imagery neutral pers. 22 22 0.98 n.s. 20 20 0.97 n.s. Imagery fear stand. 22 22 0.85 <0.05 20 20 0.96 n.s. Imagery fear pers. 22 22 0.92 n.s. 20 20 0.97 n.s. Post-int. pleasant stand. 22 22 0.97 n.s. 20 20 0.91 n.s. Post-int. pleasant pers. 22 22 0.98 n.s. 20 20 0.95 n.s. Post-int. neutral stand. 22 22 0.98 n.s. 20 20 0.97 n.s. Post-int. neutral pers. 22 22 0.97 n.s. 20 20 0.93 n.s. Post-int. fear stand. 22 22 0.81 <0.05 20 20 0.93 n.s. Post-int. fear pers. 22 22 0.89 <0.05 20 20 0.86 <0.05 Diastolic blood pressure Present. pleasant stand.
22
22
0.92
n.s.
20
20
0.97
n.s.
Present. pleasant pers. 22 22 0.87 <0.05 20 20 0.96 n.s. Present. neutral stand. 22 22 0.92 n.s. 20 20 0.95 n.s. Present. neutral pers. 22 22 0.95 n.s. 20 20 0.98 n.s. Present. fear stand. 22 22 0.92 n.s. 20 20 0.97 n.s. Present. fear pers. 22 22 0.93 n.s. 20 20 0.91 n.s. Imagery pleasant stand. 22 22 0.97 n.s. 20 20 0.97 n.s. Imagery pleasant pers. 22 22 0.95 n.s. 20 20 0.96 n.s. Imagery neutral stand. 22 22 0.86 <0.05 20 20 0.95 n.s. Imagery neutral pers. 22 22 0.90 <0.05 20 20 0.99 n.s. Imagery fear stand. 22 22 0.94 n.s. 20 20 0.96 n.s. Imagery fear pers. 22 22 0.98 n.s. 20 20 0.97 n.s. Post-int. pleasant stand. 22 22 0.98 n.s. 20 20 0.96 n.s. Post-int. pleasant pers. 22 22 0.93 n.s. 20 20 0.96 n.s.
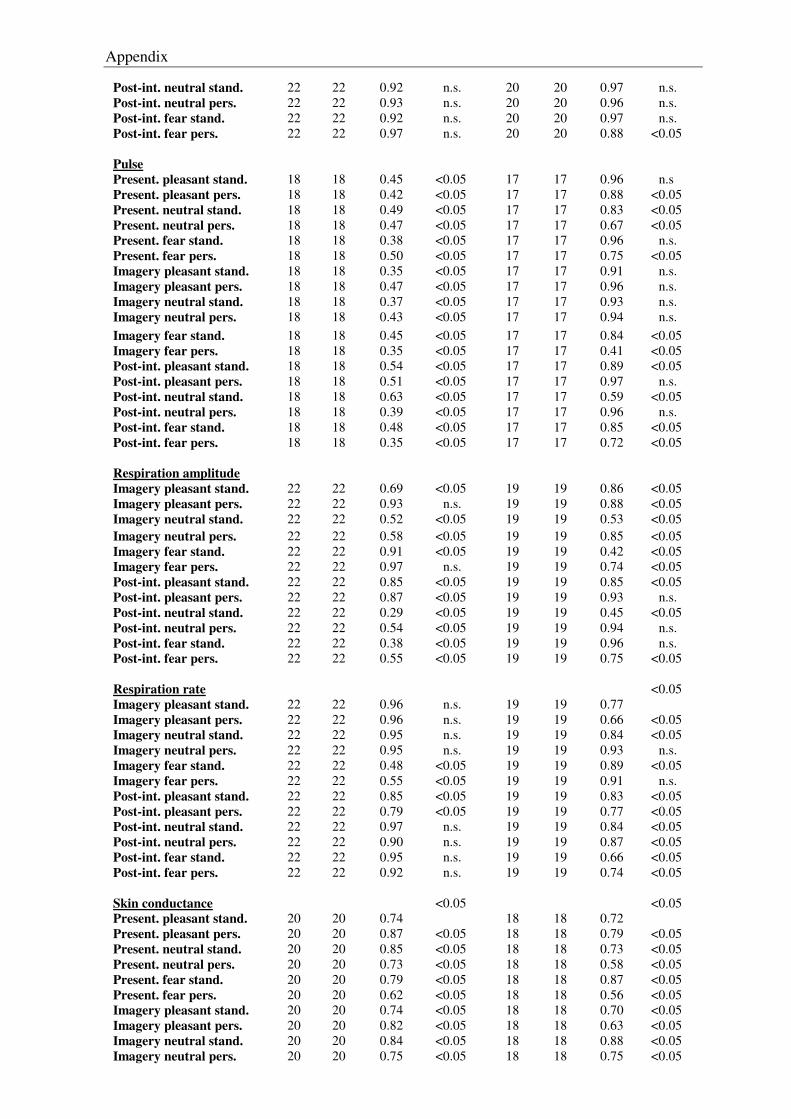
Appendix
Post-int. neutral stand. 22 22 0.92 n.s. 20 20 0.97 n.s. Post-int. neutral pers. 22 22 0.93 n.s. 20 20 0.96 n.s. Post-int. fear stand. 22 22 0.92 n.s. 20 20 0.97 n.s. Post-int. fear pers. 22 22 0.97 n.s. 20 20 0.88 <0.05 Pulse Present. pleasant stand.
18
18
0.45
<0.05
17
17
0.96
n.s
Present. pleasant pers. 18 18 0.42 <0.05 17 17 0.88 <0.05 Present. neutral stand. 18 18 0.49 <0.05 17 17 0.83 <0.05 Present. neutral pers. 18 18 0.47 <0.05 17 17 0.67 <0.05 Present. fear stand. 18 18 0.38 <0.05 17 17 0.96 n.s. Present. fear pers. 18 18 0.50 <0.05 17 17 0.75 <0.05 Imagery pleasant stand. 18 18 0.35 <0.05 17 17 0.91 n.s. Imagery pleasant pers. 18 18 0.47 <0.05 17 17 0.96 n.s. Imagery neutral stand. 18 18 0.37 <0.05 17 17 0.93 n.s. Imagery neutral pers. 18 18 0.43 <0.05 17 17 0.94 n.s. Imagery fear stand. 18 18 0.45 <0.05 17 17 0.84 <0.05 Imagery fear pers. 18 18 0.35 <0.05 17 17 0.41 <0.05 Post-int. pleasant stand. 18 18 0.54 <0.05 17 17 0.89 <0.05 Post-int. pleasant pers. 18 18 0.51 <0.05 17 17 0.97 n.s. Post-int. neutral stand. 18 18 0.63 <0.05 17 17 0.59 <0.05 Post-int. neutral pers. 18 18 0.39 <0.05 17 17 0.96 n.s. Post-int. fear stand. 18 18 0.48 <0.05 17 17 0.85 <0.05 Post-int. fear pers. 18 18 0.35 <0.05 17 17 0.72 <0.05 Respiration amplitude Imagery pleasant stand.
22
22
0.69
<0.05
19
19
0.86
<0.05
Imagery pleasant pers. 22 22 0.93 n.s. 19 19 0.88 <0.05 Imagery neutral stand. 22 22 0.52 <0.05 19 19 0.53 <0.05 Imagery neutral pers. 22 22 0.58 <0.05 19 19 0.85 <0.05 Imagery fear stand. 22 22 0.91 <0.05 19 19 0.42 <0.05 Imagery fear pers. 22 22 0.97 n.s. 19 19 0.74 <0.05 Post-int. pleasant stand. 22 22 0.85 <0.05 19 19 0.85 <0.05 Post-int. pleasant pers. 22 22 0.87 <0.05 19 19 0.93 n.s. Post-int. neutral stand. 22 22 0.29 <0.05 19 19 0.45 <0.05 Post-int. neutral pers. 22 22 0.54 <0.05 19 19 0.94 n.s. Post-int. fear stand. 22 22 0.38 <0.05 19 19 0.96 n.s. Post-int. fear pers. 22 22 0.55 <0.05 19 19 0.75 <0.05 Respiration rate Imagery pleasant stand.
22
22
0.96
n.s.
19
19
0.77
<0.05
Imagery pleasant pers. 22 22 0.96 n.s. 19 19 0.66 <0.05 Imagery neutral stand. 22 22 0.95 n.s. 19 19 0.84 <0.05 Imagery neutral pers. 22 22 0.95 n.s. 19 19 0.93 n.s. Imagery fear stand. 22 22 0.48 <0.05 19 19 0.89 <0.05 Imagery fear pers. 22 22 0.55 <0.05 19 19 0.91 n.s. Post-int. pleasant stand. 22 22 0.85 <0.05 19 19 0.83 <0.05 Post-int. pleasant pers. 22 22 0.79 <0.05 19 19 0.77 <0.05 Post-int. neutral stand. 22 22 0.97 n.s. 19 19 0.84 <0.05 Post-int. neutral pers. 22 22 0.90 n.s. 19 19 0.87 <0.05 Post-int. fear stand. 22 22 0.95 n.s. 19 19 0.66 <0.05 Post-int. fear pers. 22 22 0.92 n.s. 19 19 0.74 <0.05 Skin conductance Present. pleasant stand.
20
20
0.74
<0.05 18
18
0.72
<0.05
Present. pleasant pers. 20 20 0.87 <0.05 18 18 0.79 <0.05 Present. neutral stand. 20 20 0.85 <0.05 18 18 0.73 <0.05 Present. neutral pers. 20 20 0.73 <0.05 18 18 0.58 <0.05 Present. fear stand. 20 20 0.79 <0.05 18 18 0.87 <0.05 Present. fear pers. 20 20 0.62 <0.05 18 18 0.56 <0.05 Imagery pleasant stand. 20 20 0.74 <0.05 18 18 0.70 <0.05 Imagery pleasant pers. 20 20 0.82 <0.05 18 18 0.63 <0.05 Imagery neutral stand. 20 20 0.84 <0.05 18 18 0.88 <0.05 Imagery neutral pers. 20 20 0.75 <0.05 18 18 0.75 <0.05
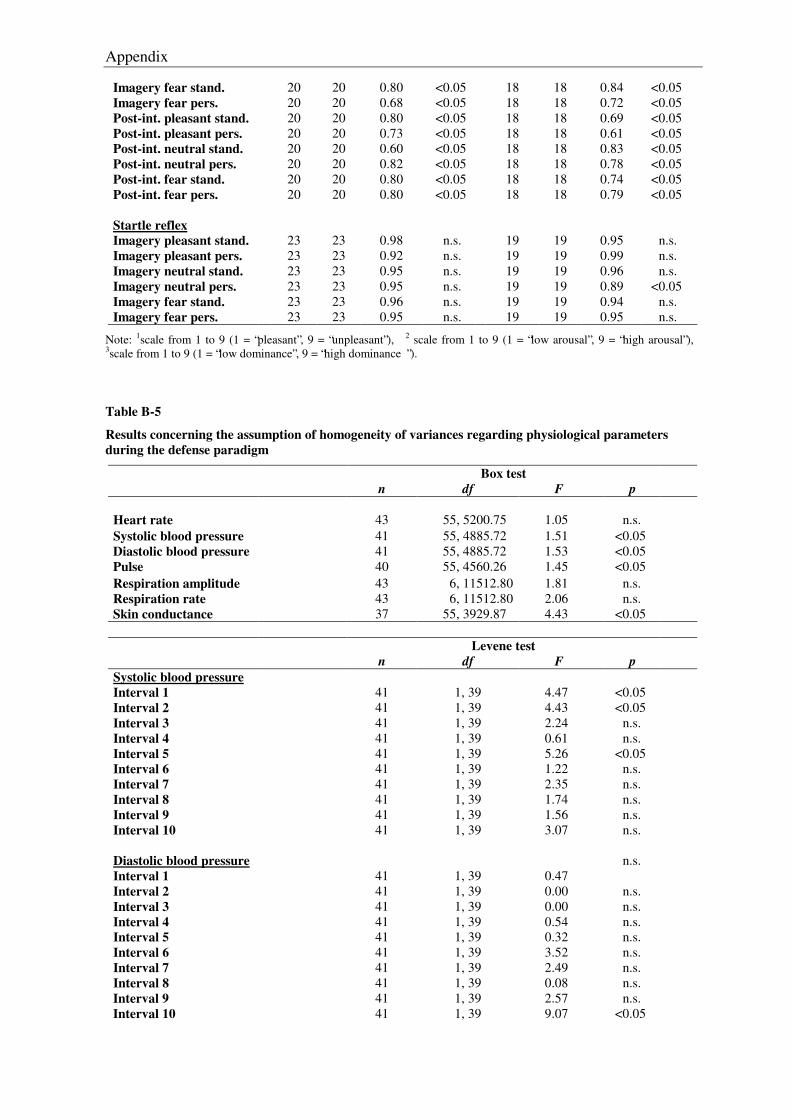
Appendix
Imagery fear stand. 20 20 0.80 <0.05 18 18 0.84 <0.05 Imagery fear pers. 20 20 0.68 <0.05 18 18 0.72 <0.05 Post-int. pleasant stand. 20 20 0.80 <0.05 18 18 0.69 <0.05 Post-int. pleasant pers. 20 20 0.73 <0.05 18 18 0.61 <0.05 Post-int. neutral stand. 20 20 0.60 <0.05 18 18 0.83 <0.05 Post-int. neutral pers. 20 20 0.82 <0.05 18 18 0.78 <0.05 Post-int. fear stand. 20 20 0.80 <0.05 18 18 0.74 <0.05 Post-int. fear pers. 20 20 0.80 <0.05 18 18 0.79 <0.05 Startle reflex Imagery pleasant stand.
23
23
0.98
n.s.
19
19
0.95
n.s.
Imagery pleasant pers. 23 23 0.92 n.s. 19 19 0.99 n.s. Imagery neutral stand. 23 23 0.95 n.s. 19 19 0.96 n.s. Imagery neutral pers. 23 23 0.95 n.s. 19 19 0.89 <0.05 Imagery fear stand. 23 23 0.96 n.s. 19 19 0.94 n.s. Imagery fear pers. 23 23 0.95 n.s. 19 19 0.95 n.s.
Note: 1scale from 1 to 9 (1 = “pleasant”, 9 = “unpleasant”), 2 scale from 1 to 9 (1 = “low arousal”, 9 = “high arousal”), 3scale from 1 to 9 (1 = “low dominance”, 9 = “high dominance ”).
Table B-5
Results concerning the assumption of homogeneity of variances regarding physiological parameters during the defense paradigm
Box test n df F p Heart rate
43
55, 5200.75
1.05
n.s.
Systolic blood pressure 41 55, 4885.72 1.51 <0.05 Diastolic blood pressure 41 55, 4885.72 1.53 <0.05 Pulse 40 55, 4560.26 1.45 <0.05 Respiration amplitude 43 6, 11512.80 1.81 n.s. Respiration rate 43 6, 11512.80 2.06 n.s. Skin conductance 37 55, 3929.87 4.43 <0.05
Levene test
n df F p Systolic blood pressure Interval 1
41
1, 39
4.47
<0.05
Interval 2 41 1, 39 4.43 <0.05 Interval 3 41 1, 39 2.24 n.s. Interval 4 41 1, 39 0.61 n.s. Interval 5 41 1, 39 5.26 <0.05 Interval 6 41 1, 39 1.22 n.s. Interval 7 41 1, 39 2.35 n.s. Interval 8 41 1, 39 1.74 n.s. Interval 9 41 1, 39 1.56 n.s. Interval 10 41 1, 39 3.07 n.s. Diastolic blood pressure Interval 1
41
1, 39
0.47
n.s.
Interval 2 41 1, 39 0.00 n.s. Interval 3 41 1, 39 0.00 n.s. Interval 4 41 1, 39 0.54 n.s. Interval 5 41 1, 39 0.32 n.s. Interval 6 41 1, 39 3.52 n.s. Interval 7 41 1, 39 2.49 n.s. Interval 8 41 1, 39 0.08 n.s. Interval 9 41 1, 39 2.57 n.s. Interval 10 41 1, 39 9.07 <0.05
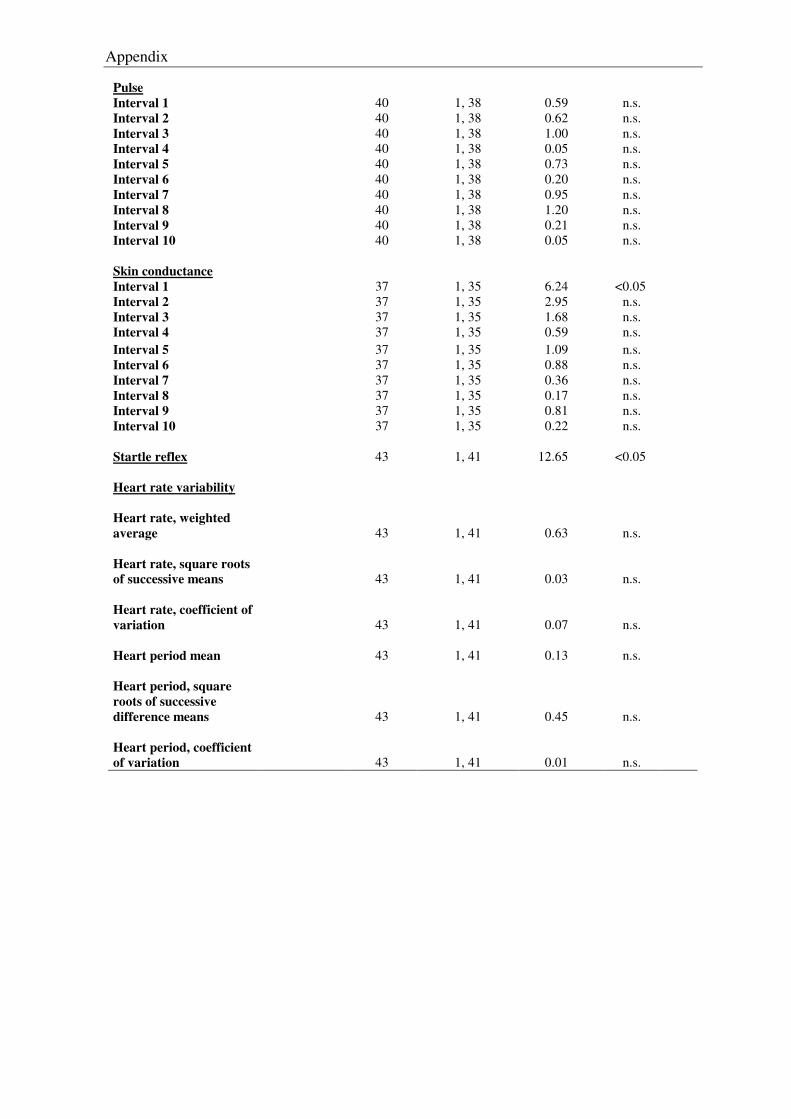
Appendix
Pulse Interval 1
40
1, 38
0.59
n.s.
Interval 2 40 1, 38 0.62 n.s. Interval 3 40 1, 38 1.00 n.s. Interval 4 40 1, 38 0.05 n.s. Interval 5 40 1, 38 0.73 n.s. Interval 6 40 1, 38 0.20 n.s. Interval 7 40 1, 38 0.95 n.s. Interval 8 40 1, 38 1.20 n.s. Interval 9 40 1, 38 0.21 n.s. Interval 10 40 1, 38 0.05 n.s. Skin conductance Interval 1
37
1, 35
6.24
<0.05
Interval 2 37 1, 35 2.95 n.s. Interval 3 37 1, 35 1.68 n.s. Interval 4 37 1, 35 0.59 n.s. Interval 5 37 1, 35 1.09 n.s. Interval 6 37 1, 35 0.88 n.s. Interval 7 37 1, 35 0.36 n.s. Interval 8 37 1, 35 0.17 n.s. Interval 9 37 1, 35 0.81 n.s. Interval 10 37 1, 35 0.22 n.s. Startle reflex 43 1, 41 12.65 <0.05 Heart rate variability
Heart rate, weighted average
43
1, 41
0.63
n.s.
Heart rate, square roots of successive means
43
1, 41
0.03
n.s.
Heart rate, coefficient of variation
43
1, 41
0.07
n.s.
Heart period mean
43 1, 41 0.13 n.s.
Heart period, square roots of successive difference means
43
1, 41
0.45
n.s.
Heart period, coefficient of variation
43
1, 41
0.01
n.s.
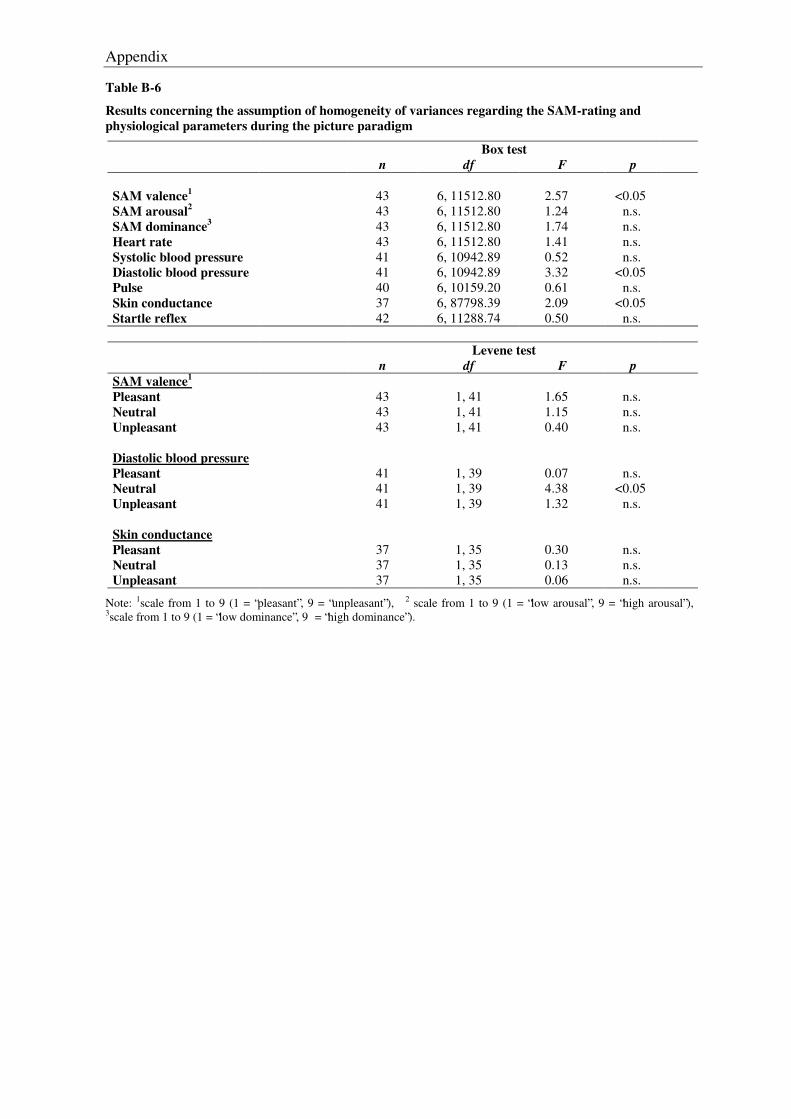
Appendix
Table B-6
Results concerning the assumption of homogeneity of variances regarding the SAM-rating and physiological parameters during the picture paradigm
Box test n df F p SAM valence1 43 6, 11512.80 2.57 <0.05 SAM arousal2 43 6, 11512.80 1.24 n.s. SAM dominance3 43 6, 11512.80 1.74 n.s. Heart rate 43 6, 11512.80 1.41 n.s. Systolic blood pressure 41 6, 10942.89 0.52 n.s. Diastolic blood pressure 41 6, 10942.89 3.32 <0.05 Pulse 40 6, 10159.20 0.61 n.s. Skin conductance 37 6, 87798.39 2.09 <0.05 Startle reflex 42 6, 11288.74 0.50 n.s.
Levene test
n df F p SAM valence1
Pleasant
43
1, 41
1.65
n.s.
Neutral 43 1, 41 1.15 n.s. Unpleasant 43 1, 41 0.40 n.s. Diastolic blood pressure
Pleasant
41
1, 39
0.07
n.s.
Neutral 41 1, 39 4.38 <0.05 Unpleasant 41 1, 39 1.32 n.s. Skin conductance Pleasant
37
1, 35
0.30
n.s.
Neutral 37 1, 35 0.13 n.s. Unpleasant 37 1, 35 0.06 n.s.
Note: 1scale from 1 to 9 (1 = “pleasant”, 9 = “unpleasant”), 2 scale from 1 to 9 (1 = “low arousal”, 9 = “high arousal”), 3scale from 1 to 9 (1 = “low dominance”, 9 = “high dominance”).
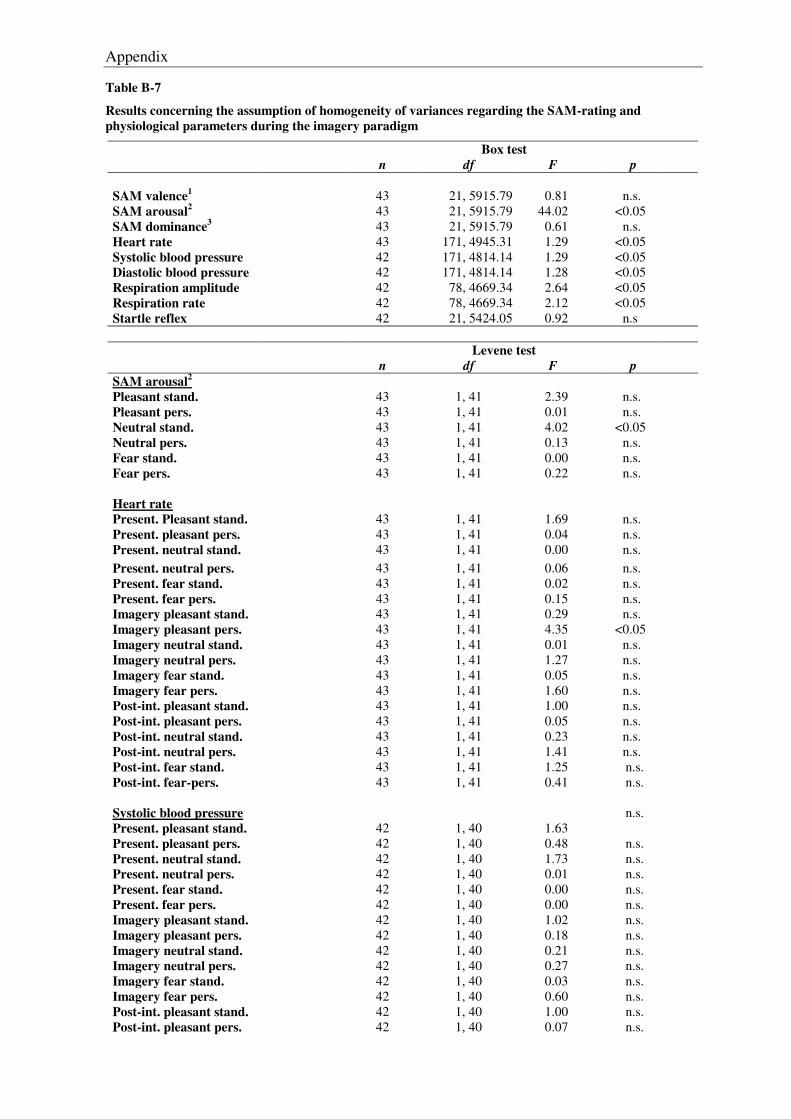
Appendix
Table B-7
Results concerning the assumption of homogeneity of variances regarding the SAM-rating and physiological parameters during the imagery paradigm
Box test n df F p SAM valence1 43 21, 5915.79 0.81 n.s. SAM arousal2 43 21, 5915.79 44.02 <0.05 SAM dominance3 43 21, 5915.79 0.61 n.s. Heart rate 43 171, 4945.31 1.29 <0.05 Systolic blood pressure 42 171, 4814.14 1.29 <0.05 Diastolic blood pressure 42 171, 4814.14 1.28 <0.05 Respiration amplitude 42 78, 4669.34 2.64 <0.05 Respiration rate 42 78, 4669.34 2.12 <0.05 Startle reflex 42 21, 5424.05 0.92 n.s
Levene test
n df F p SAM arousal2
Pleasant stand.
43
1, 41
2.39
n.s.
Pleasant pers. 43 1, 41 0.01 n.s. Neutral stand. 43 1, 41 4.02 <0.05 Neutral pers. 43 1, 41 0.13 n.s. Fear stand. 43 1, 41 0.00 n.s. Fear pers. 43 1, 41 0.22 n.s. Heart rate Present. Pleasant stand.
43
1, 41
1.69
n.s.
Present. pleasant pers. 43 1, 41 0.04 n.s. Present. neutral stand. 43 1, 41 0.00 n.s. Present. neutral pers. 43 1, 41 0.06 n.s. Present. fear stand. 43 1, 41 0.02 n.s. Present. fear pers. 43 1, 41 0.15 n.s. Imagery pleasant stand. 43 1, 41 0.29 n.s. Imagery pleasant pers. 43 1, 41 4.35 <0.05 Imagery neutral stand. 43 1, 41 0.01 n.s. Imagery neutral pers. 43 1, 41 1.27 n.s. Imagery fear stand. 43 1, 41 0.05 n.s. Imagery fear pers. 43 1, 41 1.60 n.s. Post-int. pleasant stand. 43 1, 41 1.00 n.s. Post-int. pleasant pers. 43 1, 41 0.05 n.s. Post-int. neutral stand. 43 1, 41 0.23 n.s. Post-int. neutral pers. 43 1, 41 1.41 n.s. Post-int. fear stand. 43 1, 41 1.25 n.s. Post-int. fear-pers. 43 1, 41 0.41 n.s. Systolic blood pressure Present. pleasant stand.
42
1, 40
1.63
n.s.
Present. pleasant pers. 42 1, 40 0.48 n.s. Present. neutral stand. 42 1, 40 1.73 n.s. Present. neutral pers. 42 1, 40 0.01 n.s. Present. fear stand. 42 1, 40 0.00 n.s. Present. fear pers. 42 1, 40 0.00 n.s. Imagery pleasant stand. 42 1, 40 1.02 n.s. Imagery pleasant pers. 42 1, 40 0.18 n.s. Imagery neutral stand. 42 1, 40 0.21 n.s. Imagery neutral pers. 42 1, 40 0.27 n.s. Imagery fear stand. 42 1, 40 0.03 n.s. Imagery fear pers. 42 1, 40 0.60 n.s. Post-int. pleasant stand. 42 1, 40 1.00 n.s. Post-int. pleasant pers. 42 1, 40 0.07 n.s.
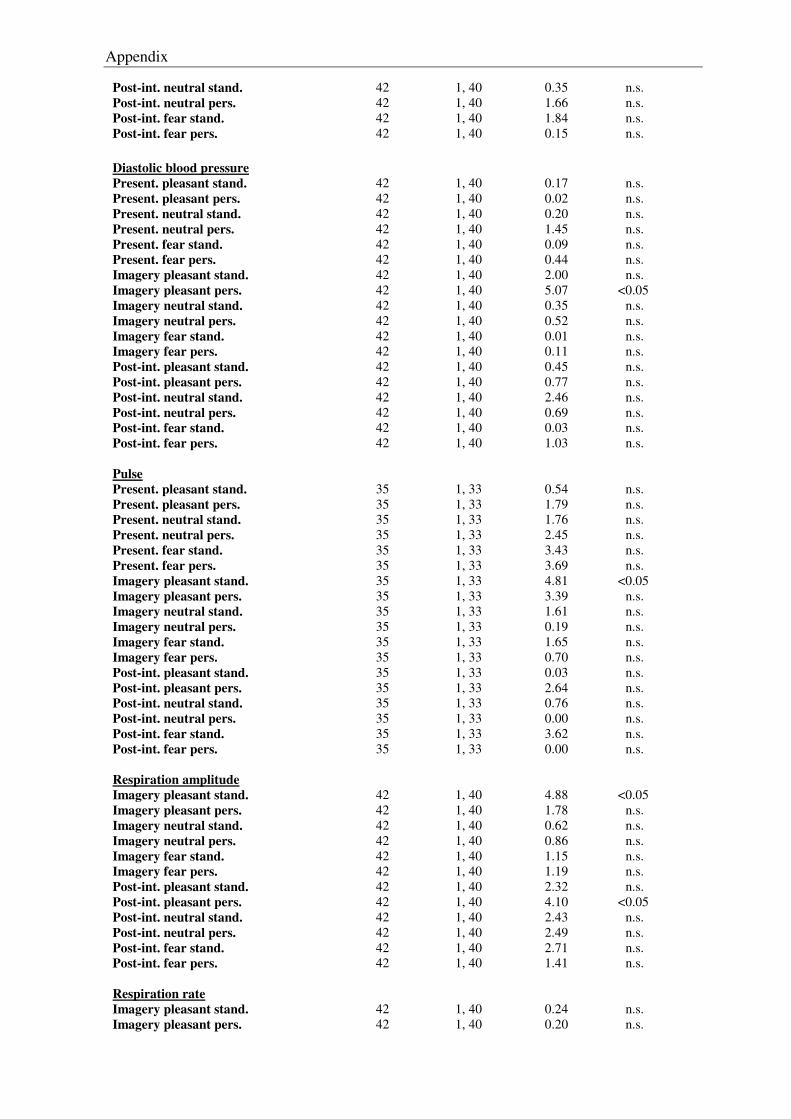
Appendix
Post-int. neutral stand. 42 1, 40 0.35 n.s. Post-int. neutral pers. 42 1, 40 1.66 n.s. Post-int. fear stand. 42 1, 40 1.84 n.s. Post-int. fear pers. 42 1, 40 0.15 n.s. Diastolic blood pressure Present. pleasant stand.
42
1, 40
0.17
n.s.
Present. pleasant pers. 42 1, 40 0.02 n.s. Present. neutral stand. 42 1, 40 0.20 n.s. Present. neutral pers. 42 1, 40 1.45 n.s. Present. fear stand. 42 1, 40 0.09 n.s. Present. fear pers. 42 1, 40 0.44 n.s. Imagery pleasant stand. 42 1, 40 2.00 n.s. Imagery pleasant pers. 42 1, 40 5.07 <0.05 Imagery neutral stand. 42 1, 40 0.35 n.s. Imagery neutral pers. 42 1, 40 0.52 n.s. Imagery fear stand. 42 1, 40 0.01 n.s. Imagery fear pers. 42 1, 40 0.11 n.s. Post-int. pleasant stand. 42 1, 40 0.45 n.s. Post-int. pleasant pers. 42 1, 40 0.77 n.s. Post-int. neutral stand. 42 1, 40 2.46 n.s. Post-int. neutral pers. 42 1, 40 0.69 n.s. Post-int. fear stand. 42 1, 40 0.03 n.s. Post-int. fear pers. 42 1, 40 1.03 n.s. Pulse Present. pleasant stand.
35
1, 33
0.54
n.s.
Present. pleasant pers. 35 1, 33 1.79 n.s. Present. neutral stand. 35 1, 33 1.76 n.s. Present. neutral pers. 35 1, 33 2.45 n.s. Present. fear stand. 35 1, 33 3.43 n.s. Present. fear pers. 35 1, 33 3.69 n.s. Imagery pleasant stand. 35 1, 33 4.81 <0.05 Imagery pleasant pers. 35 1, 33 3.39 n.s. Imagery neutral stand. 35 1, 33 1.61 n.s. Imagery neutral pers. 35 1, 33 0.19 n.s. Imagery fear stand. 35 1, 33 1.65 n.s. Imagery fear pers. 35 1, 33 0.70 n.s. Post-int. pleasant stand. 35 1, 33 0.03 n.s. Post-int. pleasant pers. 35 1, 33 2.64 n.s. Post-int. neutral stand. 35 1, 33 0.76 n.s. Post-int. neutral pers. 35 1, 33 0.00 n.s. Post-int. fear stand. 35 1, 33 3.62 n.s. Post-int. fear pers. 35 1, 33 0.00 n.s. Respiration amplitude Imagery pleasant stand.
42
1, 40
4.88
<0.05
Imagery pleasant pers. 42 1, 40 1.78 n.s. Imagery neutral stand. 42 1, 40 0.62 n.s. Imagery neutral pers. 42 1, 40 0.86 n.s. Imagery fear stand. 42 1, 40 1.15 n.s. Imagery fear pers. 42 1, 40 1.19 n.s. Post-int. pleasant stand. 42 1, 40 2.32 n.s. Post-int. pleasant pers. 42 1, 40 4.10 <0.05 Post-int. neutral stand. 42 1, 40 2.43 n.s. Post-int. neutral pers. 42 1, 40 2.49 n.s. Post-int. fear stand. 42 1, 40 2.71 n.s. Post-int. fear pers. 42 1, 40 1.41 n.s. Respiration rate Imagery pleasant stand.
42
1, 40
0.24
n.s.
Imagery pleasant pers. 42 1, 40 0.20 n.s.
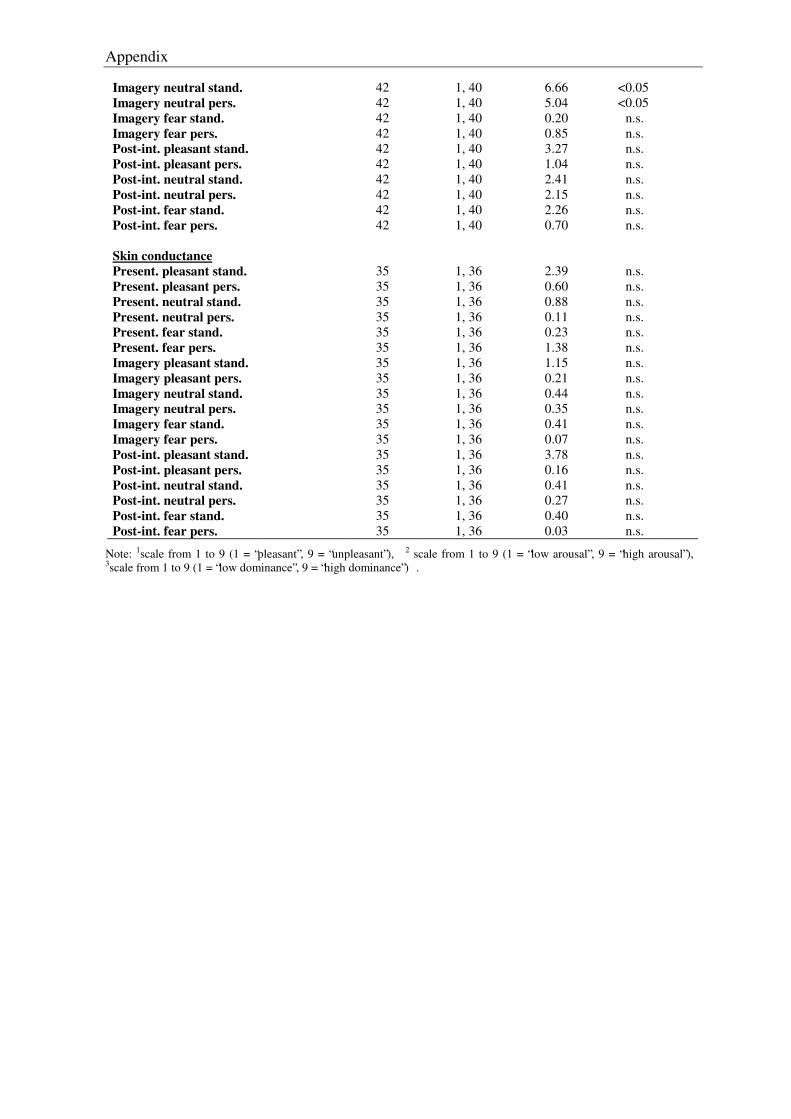
Appendix
Imagery neutral stand. 42 1, 40 6.66 <0.05 Imagery neutral pers. 42 1, 40 5.04 <0.05 Imagery fear stand. 42 1, 40 0.20 n.s. Imagery fear pers. 42 1, 40 0.85 n.s. Post-int. pleasant stand. 42 1, 40 3.27 n.s. Post-int. pleasant pers. 42 1, 40 1.04 n.s. Post-int. neutral stand. 42 1, 40 2.41 n.s. Post-int. neutral pers. 42 1, 40 2.15 n.s. Post-int. fear stand. 42 1, 40 2.26 n.s. Post-int. fear pers. 42 1, 40 0.70 n.s. Skin conductance Present. pleasant stand.
35
1, 36
2.39
n.s.
Present. pleasant pers. 35 1, 36 0.60 n.s. Present. neutral stand. 35 1, 36 0.88 n.s. Present. neutral pers. 35 1, 36 0.11 n.s. Present. fear stand. 35 1, 36 0.23 n.s. Present. fear pers. 35 1, 36 1.38 n.s. Imagery pleasant stand. 35 1, 36 1.15 n.s. Imagery pleasant pers. 35 1, 36 0.21 n.s. Imagery neutral stand. 35 1, 36 0.44 n.s. Imagery neutral pers. 35 1, 36 0.35 n.s. Imagery fear stand. 35 1, 36 0.41 n.s. Imagery fear pers. 35 1, 36 0.07 n.s. Post-int. pleasant stand. 35 1, 36 3.78 n.s. Post-int. pleasant pers. 35 1, 36 0.16 n.s. Post-int. neutral stand. 35 1, 36 0.41 n.s. Post-int. neutral pers. 35 1, 36 0.27 n.s. Post-int. fear stand. 35 1, 36 0.40 n.s. Post-int. fear pers. 35 1, 36 0.03 n.s.
Note: 1scale from 1 to 9 (1 = “pleasant”, 9 = “unpleasant”), 2 scale from 1 to 9 (1 = “low arousal”, 9 = “high arousal”), 3scale from 1 to 9 (1 = “low dominance”, 9 = “high dominance”) .
Recommended


