
lable at ScienceDirect
Polymer 50 (2009) 4656–4670
Contents lists avai
Polymer
journal homepage: www.elsevier .com/locate/polymer
Poly(3-hydroxybutyrate-co-3-hydroxyhexanoate) nanocomposites withoptimal mechanical properties
Yuping Xie a, Doug Kohls b, Isao Noda c, Dale W. Schaefer b, Yvonne A. Akpalu b,d,*
a Department of Chemical and Biological Engineering, Rensselaer Polytechnic Institute, Troy, NY 12180, USAb Department of Chemical and Materials Engineering, University of Cincinnati, Cincinnati, OH 45221, USAc The Procter & Gamble Company, Beckett Ridge Technical Center, 8611 Beckett Road, West Chester, OH 45069, USAd Department of Chemistry and Chemical Biology, Rensselaer Polytechnic Institute, Troy, NY 12180, USA
a r t i c l e i n f o
Article history:Received 24 March 2009Received in revised form30 June 2009Accepted 4 July 2009Available online 21 July 2009
Keywords:BioplasticsRenewable polymerNanocomposite
* Corresponding author. Department of ChemicalUniversity of Cincinnati, 110 8th Street, Cincinnati, OH4489; fax: þ1 513 556 2569.
E-mail address: [email protected] (Y.A. Akpa
0032-3861/$ – see front matter � 2009 Elsevier Ltd.doi:10.1016/j.polymer.2009.07.023
a b s t r a c t
With the ultimate goal to design renewable polymer nanocomposites with optimal mechanical prop-erties, this study reports an investigation of structure–property relationships for a model system – silica/poly(3-hydroxybutyrate-co-3-hydroxyhexanoate) (PHBHx) nanocomposites. Two molecular weights ofPHBHx (Mw¼ 903,000 g/mol and Mw¼ 633,000 g/mol) and two types of silica nanoparticles (nominallyspheres and fibers according to the manufacturer) were used to prepare the nanocomposites. Small-angle X-ray scattering shows that the sphere and fiber nanoparticles had similar surface areas andprimary particle size, but differed in degree of aggregation of the primary particles. The thermal stabilityof the PHBHx matrix was slightly improved by the addition of nanofillers. Simultaneous improvement ofboth stiffness and toughness was observed at 1-wt% loading for the higher molecular weight matrix. Themore highly aggregated SiO2 fibers had a greater toughening effect than the SiO2 spheres. Compared tothe unfilled polymer matrix, a 30% increase in Young’s modulus and 34% increase in toughness wereobtained for the 1-wt% SiO2 fiber/PHBHx072 nanocomposite. The addition of SiO2 spheres to PHBHx072resulted in the same increase in Young’s modulus (30%) but a smaller increase (11%) in toughness. Thedramatic increases in modulus for PHBHx072 cannot be explained on the basis of two-componentmicromechanical models. Apparently the filler alters the character of the semicrystalline matrix. Whenthe loading was 3 wt% and above, Young’s modulus continued to increase, but the strain at break andtoughness decreased. The ultimate strength did not change compared with the unfilled polymer. In orderto understand the mechanical properties observed, the thermal behavior, spherulitic morphology andthe deformation mechanisms of the nanocomposites and the dispersion state of the nanofillers werestudied. We found that a high molecular weight of the polymer matrix, weak interfacial adhesion anda good dispersion of the nanofillers are necessary to improve toughness and stiffness simultaneously.
� 2009 Elsevier Ltd. All rights reserved.
1. Introduction
The progressive dwindling of fossil resources, coupled withincreasing public preference for environmentally friendly plastics, hasincreased academic and industrial interests in biodegradable poly-mers prepared from renewable sources [1]. Polyhydroxyalkanoates(PHAs) are biodegradable and thermoplastic polyesters produced bya variety of bacteria from renewable resources like corn sugar and oil.In comparison with petroleum-based plastics, PHAs need less energyfor production [2], can reduce the green house gas emissions [2] and
and Materials Engineering,45221, USA. Tel.: þ1 518 894
lu).
All rights reserved.
generate less landfill waste. PHAs can replace petroleum-basedamorphous and semicrystalline polymers currently in use for pack-aging, adhesives, and coating applications.
PHAs have recently attracted considerable interest because oftheir biodegradability and biocompatibility [3–14]. Since PHAs areproduced from renewable resources and biodegrade to carbondioxide and water, they are often described as environmentallyfriendly plastics [15].
PHAs also offer significant advantages in medical applications,particularly in tissue engineering [6,16,17]. Recent studies [18,19]have shown that poly(3-hydroxybutyrate-co-3-hydroxyhexanoate)(PHBHx) tissue scaffolds have better mechanical properties andbiocompatibility than other biodegradable polymers, such aspolylactic acid (PLA). In addition, the use of PHAs in biodegradablepersonal hygiene articles, such as diapers, has already beendescribed [8].
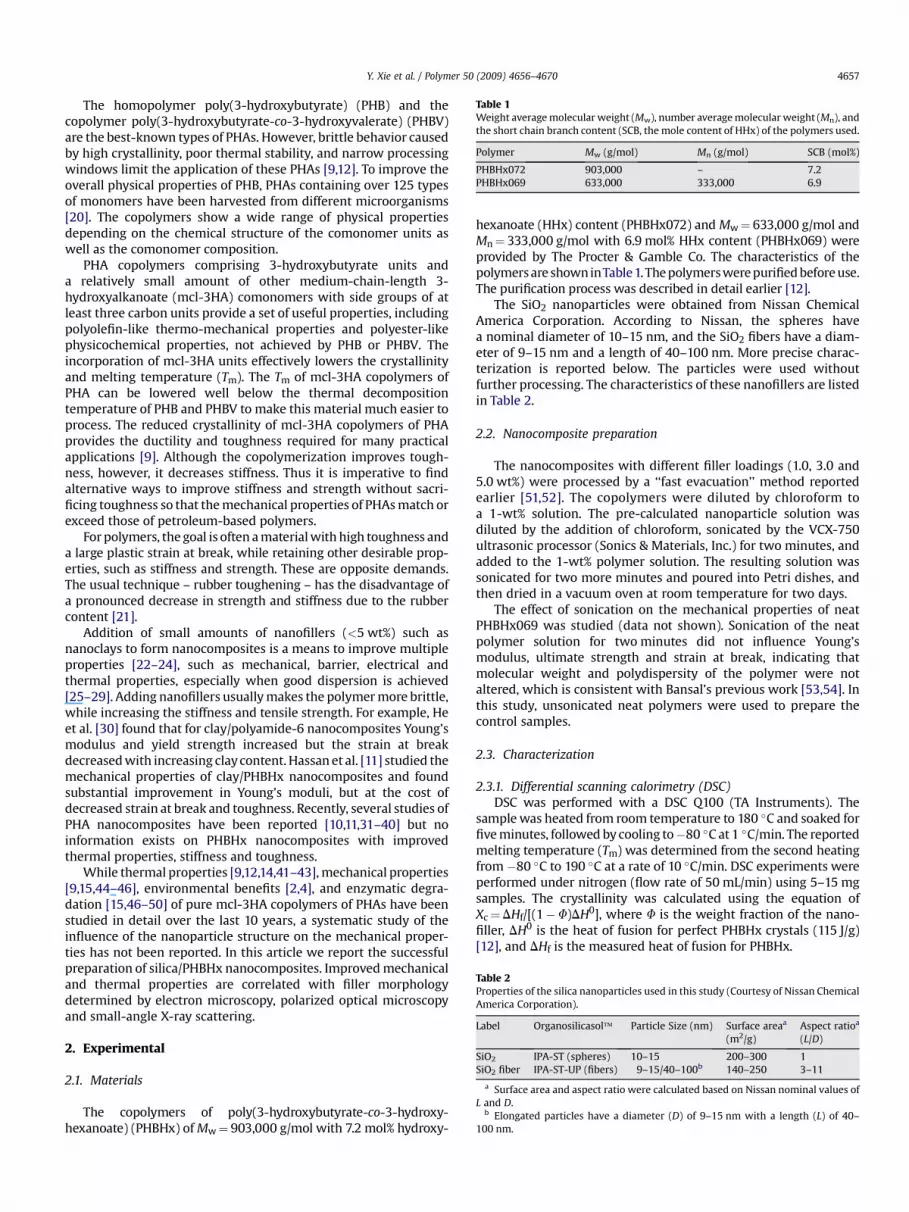
Table 1Weight average molecular weight (Mw), number average molecular weight (Mn), andthe short chain branch content (SCB, the mole content of HHx) of the polymers used.
Polymer Mw (g/mol) Mn (g/mol) SCB (mol%)
PHBHx072 903,000 – 7.2PHBHx069 633,000 333,000 6.9
Table 2Properties of the silica nanoparticles used in this study (Courtesy of Nissan ChemicalAmerica Corporation).
Label Organosilicasol� Particle Size (nm) Surface areaa
(m2/g)Aspect ratioa
(L/D)
SiO2 IPA-ST (spheres) 10–15 200–300 1SiO2 fiber IPA-ST-UP (fibers) 9–15/40–100b 140–250 3–11
a Surface area and aspect ratio were calculated based on Nissan nominal values ofL and D.
b Elongated particles have a diameter (D) of 9–15 nm with a length (L) of 40–100 nm.
Y. Xie et al. / Polymer 50 (2009) 4656–4670 4657
The homopolymer poly(3-hydroxybutyrate) (PHB) and thecopolymer poly(3-hydroxybutyrate-co-3-hydroxyvalerate) (PHBV)are the best-known types of PHAs. However, brittle behavior causedby high crystallinity, poor thermal stability, and narrow processingwindows limit the application of these PHAs [9,12]. To improve theoverall physical properties of PHB, PHAs containing over 125 typesof monomers have been harvested from different microorganisms[20]. The copolymers show a wide range of physical propertiesdepending on the chemical structure of the comonomer units aswell as the comonomer composition.
PHA copolymers comprising 3-hydroxybutyrate units anda relatively small amount of other medium-chain-length 3-hydroxyalkanoate (mcl-3HA) comonomers with side groups of atleast three carbon units provide a set of useful properties, includingpolyolefin-like thermo-mechanical properties and polyester-likephysicochemical properties, not achieved by PHB or PHBV. Theincorporation of mcl-3HA units effectively lowers the crystallinityand melting temperature (Tm). The Tm of mcl-3HA copolymers ofPHA can be lowered well below the thermal decompositiontemperature of PHB and PHBV to make this material much easier toprocess. The reduced crystallinity of mcl-3HA copolymers of PHAprovides the ductility and toughness required for many practicalapplications [9]. Although the copolymerization improves tough-ness, however, it decreases stiffness. Thus it is imperative to findalternative ways to improve stiffness and strength without sacri-ficing toughness so that the mechanical properties of PHAs match orexceed those of petroleum-based polymers.
For polymers, the goal is often a material with high toughness anda large plastic strain at break, while retaining other desirable prop-erties, such as stiffness and strength. These are opposite demands.The usual technique – rubber toughening – has the disadvantage ofa pronounced decrease in strength and stiffness due to the rubbercontent [21].
Addition of small amounts of nanofillers (<5 wt%) such asnanoclays to form nanocomposites is a means to improve multipleproperties [22–24], such as mechanical, barrier, electrical andthermal properties, especially when good dispersion is achieved[25–29]. Adding nanofillers usually makes the polymer more brittle,while increasing the stiffness and tensile strength. For example, Heet al. [30] found that for clay/polyamide-6 nanocomposites Young’smodulus and yield strength increased but the strain at breakdecreased with increasing clay content. Hassan et al. [11] studied themechanical properties of clay/PHBHx nanocomposites and foundsubstantial improvement in Young’s moduli, but at the cost ofdecreased strain at break and toughness. Recently, several studies ofPHA nanocomposites have been reported [10,11,31–40] but noinformation exists on PHBHx nanocomposites with improvedthermal properties, stiffness and toughness.
While thermal properties [9,12,14,41–43], mechanical properties[9,15,44–46], environmental benefits [2,4], and enzymatic degra-dation [15,46–50] of pure mcl-3HA copolymers of PHAs have beenstudied in detail over the last 10 years, a systematic study of theinfluence of the nanoparticle structure on the mechanical proper-ties has not been reported. In this article we report the successfulpreparation of silica/PHBHx nanocomposites. Improved mechanicaland thermal properties are correlated with filler morphologydetermined by electron microscopy, polarized optical microscopyand small-angle X-ray scattering.
2. Experimental
2.1. Materials
The copolymers of poly(3-hydroxybutyrate-co-3-hydroxy-hexanoate) (PHBHx) of Mw¼ 903,000 g/mol with 7.2 mol% hydroxy-
hexanoate (HHx) content (PHBHx072) and Mw¼ 633,000 g/mol andMn¼ 333,000 g/mol with 6.9 mol% HHx content (PHBHx069) wereprovided by The Procter & Gamble Co. The characteristics of thepolymers are shown inTable 1. The polymers were purified before use.The purification process was described in detail earlier [12].
The SiO2 nanoparticles were obtained from Nissan ChemicalAmerica Corporation. According to Nissan, the spheres havea nominal diameter of 10–15 nm, and the SiO2 fibers have a diam-eter of 9–15 nm and a length of 40–100 nm. More precise charac-terization is reported below. The particles were used withoutfurther processing. The characteristics of these nanofillers are listedin Table 2.
2.2. Nanocomposite preparation
The nanocomposites with different filler loadings (1.0, 3.0 and5.0 wt%) were processed by a ‘‘fast evacuation’’ method reportedearlier [51,52]. The copolymers were diluted by chloroform toa 1-wt% solution. The pre-calculated nanoparticle solution wasdiluted by the addition of chloroform, sonicated by the VCX-750ultrasonic processor (Sonics & Materials, Inc.) for two minutes, andadded to the 1-wt% polymer solution. The resulting solution wassonicated for two more minutes and poured into Petri dishes, andthen dried in a vacuum oven at room temperature for two days.
The effect of sonication on the mechanical properties of neatPHBHx069 was studied (data not shown). Sonication of the neatpolymer solution for two minutes did not influence Young’smodulus, ultimate strength and strain at break, indicating thatmolecular weight and polydispersity of the polymer were notaltered, which is consistent with Bansal’s previous work [53,54]. Inthis study, unsonicated neat polymers were used to prepare thecontrol samples.
2.3. Characterization
2.3.1. Differential scanning calorimetry (DSC)DSC was performed with a DSC Q100 (TA Instruments). The
sample was heated from room temperature to 180 �C and soaked forfive minutes, followed by cooling to�80 �C at 1 �C/min. The reportedmelting temperature (Tm) was determined from the second heatingfrom �80 �C to 190 �C at a rate of 10 �C/min. DSC experiments wereperformed under nitrogen (flow rate of 50 mL/min) using 5–15 mgsamples. The crystallinity was calculated using the equation ofXc¼DHf/[(1�F)DH0], where F is the weight fraction of the nano-filler, DH0 is the heat of fusion for perfect PHBHx crystals (115 J/g)[12], and DHf is the measured heat of fusion for PHBHx.

I
Y. Xie et al. / Polymer 50 (2009) 4656–46704658
2.3.2. Thermogravimetric analysis (TGA)TGA was done with a TGA Q50 (TA Instruments) to determine
the mass loss as a function of temperature. The thermal stabilitywas also studied by TGA. Samples were heated from 30 �C to 900 �Cat a rate of 20 �C/min under a 50 mL/min dry N2 flow. Sample sizesof 10–15 mg were used. To obtain accurate filler loadings, we sub-tracted the background of the empty crucible heated under thesame conditions.
2.3.3. Polarized optical microscopy (POM)POM measurements were performed on film samples sealed
between two round glass cover slips at room temperature. Anoptical microscope (Olympus BX51) coupled to an Insight digitalcamera was used to characterize the solid-state morphology of filmsamples (w15 mm thick). Before any measurements were taken,samples were first melted at 180 �C for five minutes under nitrogento remove any thermal history, and then cooled to room temper-ature at 1 �C/min. All the melting and cooling procedures wereperformed on a computer-interfaced Instec HCS600V hot stage tominimize sample movement and temperature fluctuations.
2.3.4. Field emission scanning electron microscope (FESEM)The fracture surfaces of specimens after the tensile tests were
coated with platinum to prevent charging and studied with a JEOLJSM-6335 FESEM. A filament emission current of 10–12 mA wasaccelerated towards the sample with a voltage of 5 kV.
2.3.5. Ultra-small-angle X-ray scattering (USAXS)USAXS measurements were carried out at the X-ray Operations
and Research beamline 32-ID-B, located at the Advanced PhotonSource (APS), Argonne National Laboratory (Argonne, IL, USA). At thisbeamline, a Bonse–Hart camera allows one to record USAXS scat-tering curves in a q range from 0.0001 to 1.0 Å�1. The scattering vectorq is the independent variable in small-angle scattering and is relatedto the scattering angle (q), via the relation q¼ (4p/l)sin(q/2), where l
is the X-ray wavelength. After subtraction of an air background, theUSAXS data were desmeared using routines provided by APS.
The samples had disk-like shapes with diameters of 6.5 mm andthicknesses of approximately 1 mm. The samples were heated to170 �C in three minutes and stabilized at 170 �C for five minutesbefore the measurements were taken. The samples were kept at170 �C while being measured to assure that the polymer crystalliteswere melted.
2.3.6. Tensile testingSamples for tensile tests were prepared by compression
molding to Type-V dimensions in ASTM D 638-02. To obtain thesample thickness of about 0.30 mm, 0.2 g of each sample was used.The samples were heated in a dog-bone mold at 180 �C underpressure of one metric ton for ten minutes and then slowly cooledto room temperature with the heater off while still under pressure.The cooling process took about three hours, so the cooling rate wasabout 1 �C/min.
The mechanical properties were measured using tensile tests inaccordance with ASTM 882-02 (for thin films less than 1.0 mm inthickness) at room temperature on an Instron (Model 5843) loadframe with a 1-kN load cell and an Instron video-extensometer. Thespeed of testing was 1 mm/min. Young’s modulus was determinedfrom the slope in the elastic region (0–0.4% strain) of the stress–strain curve. The toughness was calculated by taking the area underthe stress–strain curve. The ultimate strength was obtained fromthe maximum stress on the stress–strain curve. At least five repli-cates were tested to obtain an average value. All samples weretested after two days of conditioning at 23� 2 �C and 50� 5%relative humidity (RH).
The effect of sample thickness (0.3 mm vs. 1.0 mm) on themechanical properties of neat PHBHx was studied (data not shown).Thicker samples showed a slight increase in Young’s modulus,ultimate strength and strain at break. The thinner samples (0.3 mm)were used in this study.
3. Data analysis
3.1. USAXS data analysis
The USAXS data were analyzed in several ways. The mostgeneric approach is fitting to unified model proposed by Beaucageet al. [55–57]. The unified method is useful to ascertain the sizescales associated with various levels of hierarchical structures suchas aggregates and agglomerates [58]. The unified method assumesa series of structural levels consisting of a Guinier-like region fol-lowed by a power-law or Porod region:
ðqÞ ¼Xn
i¼1
Giexp
�� q2R2
gi=3�þ Biexp
�� q2R2
giþ1=3�
��h
erf�
qkRgi=61=2
�i3=q�Pi!
(1)
Here i¼ 1 refers to the smallest-size structural level. Gi is theGuinier pre-factor; Bi is the power-law pre-factor; Rgi
is the averageradius of gyration; and Pi the power-law of the structural level irespectively. We used 2-level fits (n¼ 2), in which case level 1 refersthe elementary building blocks or primary particles and level-2describes how these elementary particles are aggregated. In somecases we used three levels (n¼ 3). Level 3 was added to account forexcess scattering at very small q, which is due to scattering frombubbles or imperfections on the surface of the sample. The Irena2.32 package [59] was used to fit the scattering data.
For a sphere of radius r, the radius of gyration Rg is obtained[60,61] by
Rg ¼ffiffiffi35
rr (2)
And for a rod of length L and radius r,
Rg ¼
ffiffiffiffiffiffiffiffiffiffiffiffiffiffiffiffiL2
12þ r2
2
s(3)
The primary SiO2 spheres have a diameter of 100–150 Å accordingto the manufacturer. Nominally, the primary SiO2 fibers havea length of 400–1000 Å and a diameter of 90–150 Å. Based on thesevalues, the radii of gyration of SiO2 spheres and SiO2 fibers would be39–58 Å and 120–294 Å, respectively. As we show below, however,the two fillers are structurally very similar, with no evidence ofsignificant rod-like character in either case and quite similar radii ofgyration of 57� 5 Å.
The data were also analyzed by Porod analysis in the high-qregion [62–64]. Specifically, the Porod pre-factor of level 1, B1 isused to determine the interfacial area per unit sample volume, Sv:
B1 ¼ 2phDri2Sv (4)
where Dr is the contrast or difference in scattering-length-densitybetween the filler and the matrix, which can be calculated from thechemical formula and densities of the filler and matrix. The interfa-cial area per unit mass of the filler is gotten from Sv using the skeletaldensity of the filler (see below) and the filler volume fraction 4.
In our case the data are on an absolute scale, so the Porodinvariant, Qp can be used to calculate contrast.

Y. Xie et al. / Polymer 50 (2009) 4656–4670 4659
Qp ¼ q2IðqÞdq ¼ 2p2�
Dr2�
4ð1� 4Þ (5)
ZLevel 1
If the chemical formulas of the filler and matrix are known, Qp canbe used to determine the skeletal density of the filler self-consis-tently, given that the density of the matrix (1.285 g/cm3) is known.For these calculations, the chemical formula of the filler was takento be SiO2 and the matrix to be C5H10O2. The analysis is only weaklydependent on the chemical formulas. We find a skeletal density of2.0� 0.2 g/cm3 for the fiber sample. This value is consistent withprevious determinations for silica [64]. We assumed this valuewhen analyzing the sphere data (Fig. 8(b)) because the Guiniercrossover associated with the sphere primary particle is not suffi-ciently distinct to reliably extract Qp.
The data were also analyzed using the fractal rod modelproposed by Schaefer and Justice [65–67]. In this case, the large-scale structure is modeled as a worm-like, branched fractal clusterwith a persistence length to reflect local rod-like character. Thisapproach was used to determine if there is any evidence of short-scale linear morphology in the case of the nominally fibroussample. As described below, however, the best fit was obtainedassuming the persistence length is comparable to the rod diameter,which means that the primary particle is nearly symmetric.
3.2. Halpin–Tsai model
To interpret the modulus data we used a simplified version ofthe Halpin–Tsai model. According to the Halpin–Tsai model [68–72], Young’s modulus of a composite can be expressed in terms of
302520151050Strain (%)
neat PHBHx072 1 wt% SiO2 fiber/PHBHx072 3 wt% SiO2 fiber/PHBHx072 5 wt% SiO2 fiber/PHBHx072
25
20
15
10
5
0
Stre
ss
(M
Pa
)
a
302520151050Strain (%)
neat PHBHx069 1 wt% SiO2 fiber/PHBHx069 3 wt% SiO2 fiber/PHBHx069 5 wt% SiO2 fiber/PHBHx069
25
20
15
10
5
0
Stre
ss
(M
Pa
)
c
b
Fig. 1. Typical stress–strain curves of (a) SiO2 fiber/PHBHx072, (b) SiO2/PHBHx072, (c) SiO2 fi
the corresponding properties of the matrix and the filler, togetherwith their proportions and the filler geometry, using Eq. (6):
Er ¼Ec
Em¼ 1þ x$h$4
1� h$4
and
h ¼
�Ef=Em � 1
��
Ef=Em þ x� (6)
In Eq. (6), Er is the relative Young’s modulus and Ec, Em, and Ef arethe moduli of the composite, matrix, and filler, respectively; 4 is thefiller volume fraction. The Halpin–Tsai model assumes the filler isfirmly bonded to the matrix. The factor x¼ 2 (L/D) describes theinfluence of the geometry of the reinforcing phase, where L/D is theaspect ratio. Ef is 80 GPa [73].
Eq. (6) assumes that the fibers are oriented. In our case, we aredealing with very short fibers that are randomly oriented. In thissituation Schaefer and Justice find that Eq. (6) simplifies consider-ably assuming rigid fibers at low volume fraction [65]:
Er ¼ 1þ 2�
LD
�Ca4 (7)
where the angular factor, Ca is approximately 0.2 [74]. Eq. (7) isrelevant to the systems studied here since it shows that large aspectratio, L/D, is essential to fiber reinforcement. Eq. (7) assumes L/D [ 1.In the limit L/D / 1, the Smallwood [75] limiting law for indepen-dent spherical particles obtains, which is independent of filler size:
302520151050Strain (%)
neat PHBHx072 1 wt% SiO2/PHBHx072 3 wt% SiO2/PHBHx072 5 wt% SiO2/PHBHx072
302520151050Strain (%)
neat PHBHx069 1 wt% SiO2/PHBHx069 3 wt% SiO2/PHBHx069 5 wt% SiO2/PHBHx069
25
20
15
10
5
0
Stre
ss
(M
Pa
)
d
25
20
15
10
5
0
Stre
ss
(M
Pa
)
ber/PHBHx069, and (d) SiO2/PHBHx069 nanocomposites with different filler contents.

Y. Xie et al. / Polymer 50 (2009) 4656–46704660
Er ¼ 1þ 2:54 (8)
4. Results
The typical stress–strain curves of the SiO2 fiber/PHBHx072,SiO2/PHBHx072, SiO2 fiber/PHBHx069 and SiO2/PHBHx069 nano-composites are shown in Fig. 1. For all nanocomposites, the curvesshow that Young’s modulus increased with filler content. With theexception of the SiO2/PHBHx069 nanocomposites, the elongation atbreak and toughness reached a maximum value at 1-wt% loadingand then decreased with further loading. These results show thataddition of SiO2 to PHBHx069 makes this polymer more brittle(Fig. 1(d)) while improved ductility was achieved when SiO2 fiberswere added to either PHBHx matrix.
The variation of mechanical properties such as Young’s modulus,ultimate strength and toughness on filler content of the PHBHxnanocomposites is shown in Fig. 2. The ultimate strength of thepolymer changed little while the increase in the modulus, strain atbreak and toughness was matrix dependent. Compared to theunfilled polymer matrix, a 30% increase in Young’s modulus and
1.6
1.4
1.2
1.0
0.8
Yo
un
g's
M
od
ulu
s (G
Pa)
543210Filler content (wt %)
SiO2 Fiber/PHBHx072 SiO2 Sphere/PHBHx072 SiO2 Fiber/PHBHx069 SiO2 Sphere/PHBHx069
a
30
25
20
15
10
5
0
Ultim
ate S
tren
gth
(M
Pa)
210 Filler con
SiO2 FibSiO2 SphSiO2 FibSiO2 Sph
c
Fig. 2. Young’s modulus (a), toughness (b) and ultimate strength (c) of SiO2 fiber/PHBHxcomposites with different filler contents.
a 34% increase in toughness were obtained for the 1-wt% SiO2 fiber/PHBHx072 nanocomposite. The addition of SiO2 to PHBHx072resulted in the same increase in Young’s modulus (30%) but a smallerincrease (11%) in toughness.
In the lower molecular weight matrix, PHBHx069, the additionof 1-wt% SiO2 fiber also gave smaller increase (9%) in the toughnessas compared to unfilled PHBHx069. When PHBHx069 was filledwith SiO2, the strain at break and toughness decreased at 1-wt%filler loading and went through a maximum at 3 wt% (Fig. 2).
In subsequent paragraphs we show that these variations inmechanical properties depend on the amorphous structure of thepolymer and the filler aggregate morphology.
The morphology of tensile fracture surfaces obtained aftertensile testing provides clues to the toughening mechanisms forpolymers. Uniaxial tensile testing of unfilled and nanoparticle-filledPHBHx samples yielded with stress whitening bands (crazes). Fig. 3shows the typical stress whitening after the sample reached theyield point. These bands were perpendicular to the tensile directionand throughout the gauge length. The 1-wt% SiO2/PHBHx072 andthe 1-wt% SiO2 fiber/PHBHx072 nanocomposites fractured with
6
5
4
3
2
1
0
To
ug
hn
ess (M
J/m
3)
543210Filler content (wt %)
SiO2 Fiber/PHBHx072 SiO2 Sphere/PHBHx072 SiO2 Fiber/PHBHx069 SiO2 Sphere/PHBHx069
b
543tent (wt %)
er/PHBHx072ere/PHBHx072
er/PHBHx069ere/PHBHx069
072, SiO2 sphere/PHBHx072, SiO2 fiber/PHBHx069 and SiO2 sphere/PHBHx069 nano-

Fig. 3. A typical photo that shows the stress whitening after the yield point for all thesamples tested during the tensile testing.
Y. Xie et al. / Polymer 50 (2009) 4656–4670 4661
a slight necking. All other samples fractured without a necking,indicating that the enhancement in toughness obtained for thesesamples depends on the extent of shear yielding and crazing in thesamples.
FESEM images (Figs. 4–6) of the morphologies of the tensilefracture surfaces after the tensile testing show that unfilled PHBHxand silica/PHBHx nanocomposites exhibit varying degrees of inten-sive craze-like mechanisms including cavitation and fibrillation.
The voids caused by the debondings at the particle–polymerinterfaces were seen by FESEM for all the nanocomposites, espe-cially for the PHBHx072 nanocomposites. It is worth noting thatvoids are seen in Fig. 4(e), (g) and (h). In comparison with PHBHx072samples, PHBHx069 samples had fewer voids (Fig. 5). For the 5-wt%SiO2 fiber/PHBHx069 nanocomposite, many fine cracks were foundon its fracture surface (Fig. 5(j)). It is believed that the biggeragglomerates at higher loadings cannot prevent the voids fromcoalescing to form catastrophic cracks [76].
As with other nanocomposites [77,78], the dispersion of silicainfluences the mechanical properties. In the PHBHx072 nano-composites, good dispersion of SiO2 and SiO2 fibers at 1 wt% loadingis obtained (Fig. 6(a) and (b)) in the sense that the agglomerates areevenly distributed. As the filler content is increased, the size of theagglomerates increases and their distribution broadens. In the3 wt% and 5 wt% nanocomposites the agglomerates are aboutw1 mm in diameter (Fig. 6(c)–(f)). These large agglomerates lead tocracks in the sample as indicated by arrows (Fig. 6(c)).
To correlate the mechanical properties with filler morphology,USAXS measurements on the SiO2/PHBHx072 and the SiO2 fiber/PHBHx072 nanocomposites were carried out at 170 �C. USAXSprovides information on the internal structure of the silica agglom-erates. Since the q range of the USAXS measurements was from0.0001 to 1 �1, the size of the objects that could be detected (2p/q)was from 6 Što 6 mm.
Fig. 7 shows the USAXS scattering cross-section per unit samplevolume (called the intensity) as a function of q and the correspondingunified fits for the 1-wt%, 3-wt% and 5-wt% SiO2/PHBHx072 (a) andSiO2 fiber/PHBHx072 nanocomposites (b). At the smallest q region(structure level 3), all the samples showed a power-law tail with
slope of about �4. Such scattering is usually seen for solid samplesand probably arises from large-scale defects (dust or bubbles) in thebulk of the sample or on the surface.
Although the data in Fig. 7(a) and (b) appear quite different,detailed analysis reveals some key similarities. The radius of gyra-tion of the primary particles is the same (Rg¼ 57� 6 Å). Bothsystems consist of primary particles aggregated to form a second-level aggregate structure. Neither system consists of independent,dispersed spheres or rods. The key difference is the size andmorphology of the level-2 aggregate. In the case of SiO2/PHBHx072a distinct Guinier crossover is seen in the 1 and 5-wt% samples. Inthe 3-w% sample the crossover is less distinct but still present. Forthe SiO2 fiber/PHBHx072 sample (Fig. 7(b)), however, no crossoveris seen so the aggregate size is either beyond the resolution of theinstrument or masked by the parasitic scattering at very small q.
To address the filler morphology quantitatively, we examinedthe 5-wt% sphere and fiber/PHBHx072 samples at 170 �C in detail(Fig. 8). The data were analyzed using the unified method and thePorod method described above. In the case of the nominally fibersample, we also fit the data with a fractal rod model in an attemptto estimate the effective aspect ratio of the filler.
Fig. 8(a) shows the analysis of the 5-wt% SiO2 fiber/PHBHx072 at170 �C. The low-q power-law scattering was subtracted. The plotshows a fit to the fractal rod model [65–67] as well as a 2-levelunified fit assuming that the level-2 Rg is infinite.
From the unified fit, the primary particle Rg is of 56� 6 Å cor-responding to an equivalent hard-sphere radius of 72 Å. In this casethe large-scale aggregate is mass fractal in character with a fractaldimension of 2.1�0.1.
Porod analysis gives a surface area per unit mass of Sm¼ 285� 50m2/g of silica and a skeletal density of rSiO2
¼ 2:0� 0:3 g=cm3. Thecorresponding equivalent sphere radius ð3=ðrSiO2
SmÞÞ is 53 Å. If theprimary segments are rod-like, the equivalent rod radiusð2=ðrSiO2
SmÞÞ is 35 Å.The best fit to the fractal rod model gives a persistence length
(actually a half length) of 70 Å. Although the model is crude and thefit is poor, it does show that the primary particles are nearlysymmetric.
The nominally spherical silica (Fig. 8(b)) differs only in the sizeand morphology of the aggregate. The primary particle Rg is58� 10 Å, matching the fiber sample. The interfacial area, however,is 195�75 m2/g, also the same as the fiber cousin. In this case weassumed a skeletal density of 2.0 g/cm3, because the primaryparticle scattering is not sufficiently distinct to extract the Porodinvariant.
The agglomerate is more compact and much smaller for thesphere sample. The fractal dimension is 2.8� 0.2 as compared with2.1�0.1 for the fiber case. More importantly, the aggregatesare quite small with an Rg of 662� 40 Å and an aggregation numberof 11.
These results indicate that the improved performance of thefiber-type fillers is due to the larger more open aggregatemorphology. Although we cannot determine the size or aggregationnumber of the fiber filler from the USAXS data we can say that thesize is greater than 5000 Å and the aggregation number is greaterthan 1�104.
The physical and mechanical properties of polymer nano-composites depend on the strength/type of interaction between thefiller and the matrix, and the crystalline and the spherulitic struc-tures of the matrix. To investigative the influence of silica on thethermal properties and crystalline structure of PHBHx matrices,DSC cooling and melting (Figs. 9 and 10) measurements wereperformed.
In our silica/PHBHx nanocomposites, the glass transition temper-ature (Tg) for all the samples was the same (8� 1 �C) (Figs. 9(a) and

Fig. 4. SEM micrographs of the fracture surfaces of tensile specimens: (a) neat PHBHx072, (b) 1 wt% SiO2, (c) 3 wt% SiO2, (d) 5 wt% SiO2, (e) lots of nanovoids in 3 wt% SiO2, (f) 1 wt%SiO2 fiber, (g) 3 wt% SiO2 fiber, and (h) 5 wt% SiO2 fiber.
Y. Xie et al. / Polymer 50 (2009) 4656–46704662
10(a)). Increases in Tg have been attributed to attractive interactionbetween the filler and the polymer; depression of Tg is found when theinterface between filler and polymer is weak [79,80]. Since Tg did notchange, there were no strong attractive or repulsive interactions
between the nanoparticles and the polymers. Therefore, the interfa-cial adhesion between them must be weak.
As with other crystalline polymers, the addition of nanofillers toPHBHx can be used to control the crystallization behavior and

Fig. 5. SEM micrographs of the fracture surfaces of tensile specimens: (a) neat PHBHx069, (b) 1 wt% SiO2, (c) and (d) 1 wt% SiO2 fiber, (e) 3 wt% SiO2, (f) 3 wt% SiO2 fiber, (g) and (h)5 wt% SiO2, and (i) and (j) 5 wt% SiO2 fiber. The arrows point to the cracks formed in the sample.
Y. Xie et al. / Polymer 50 (2009) 4656–4670 4663
resulting morphology. Nanoparticles can change the lamellae size[81], spherulitic structure [82–89] degree of crystallinity [90] andrate of crystallization [91–94]. Nanoparticles can also suppress theformation of the thermodynamic crystal phase and stabilize the
metastable phase [90]. Recently Giannelis and co-workers havedemonstrated the enhanced crystallization rate in clay–PHBcomposites [91]. Our silica/PHBHx nanocomposites show similarbehavior.

Fig. 5. (continued).
Fig. 6. SEM micrographs of the fracture surfaces of PHBHx072 nanocomposites: (a) 1 wt% SiO2, (b) 1 wt% SiO2 fiber, (c) 3 wt% SiO2, (d) 3 wt% SiO2 fiber, (e) 5 wt% SiO2, and (f) 5 wt%SiO2 fiber. The circles represent the agglomerations of the nanoparticles and the arrow points to a crack formed in the sample.
Y. Xie et al. / Polymer 50 (2009) 4656–46704664

100
101
102
103
104
101102103104
105
106
107
100
101
102
103
104
105
106
107
108
109
In
ten
sity (cm
-1)
In
ten
sity (cm
-1)
q (A-1
)
q (A-1
)
-4
1 wt% SiO2/PHBHx072 3 wt% SiO2/PHBHx072 5 wt% SiO2/PHBHx072
a
b
0.001 0.01 0.1
1 wt% SiO2 fiber/PHBHx072 3 wt% SiO2 fiber/PHBHx072 5 wt% SiO2 fiber/PHBHx072
Fig. 7. USAXS scattering profiles for (a) the SiO2/PHBHx072 nanocomposites with1 wt%, 3 wt% and 5 wt% SiO2, and (b) the SiO2 fiber/PHBHx072 nanocomposites with1 wt%, 3 wt% and 5 wt% SiO2 fiber. The solid lines are unified fits. Although the datalook qualitatively different, the basic morphology is very similar except for the size ofthe second-level aggregate structure.
2 3 4 5 6 7 8 90.001
2 3 4 5 6 7 890.01
2 3 4 5 6 7 890.1
q (Å-1
)
Rg = 56.1ÅP = 4P = 2.1
5% FiberUnified Fit Fractal Rod
Fractal Rod
S/m = 285 m2/gHard radius = 52 A
100
101
102
103
104
105
106
In
ten
sity (cm
-1)
a
q (Å-1
)
2 3 4 5 6 7 8 90.001
2 3 4 5 6 7 8 90.01
2 3 4 5 6 7 8 90.1
5% SphereUnified Fit
Rg = 58 ÅP = 4
Rg = 662 ÅP = 2.8Nagg = 11
S/m = 195 m2/gHard radius = 77 A
100
101
102
103
104
105
106
In
ten
sity (cm
-1)
b
Fig. 8. (a) Analysis of USAXS data for the 5-wt% SiO2 fiber/PHBHx072 at 170 �C. The Rg
from the unified fit of 56�10 Å is essentially the same as that for the sphere sample.The primary particles are aggregated as a mass fractal of dimension 2.1�0.1 and thesize of the aggregate exceeds 0.5 mm. The fractal rod model gives a persistence lengthof 70 Å, only slightly larger than the rod radius calculated from the surface area. Thekey difference between the fiber and sphere samples is the nature of the aggregate,which is much large and more open (lower fractal dimension) than the sphere sample.‘‘P’’ is the Porod slope, which is equal to the mass fractal dimension in the aggregateregime. The surface area/unit mass of the filler (S/m) is gotten from Porod analysis ofthe high-q region. (b) Analysis of USAXS data for the 5-wt% SiO2 sphere/PHBHx072 at170 �C. The Rg from the unified fit of 58� 6 Å is essentially the same as that for thefiber sample. In this case, however, the primary particles are aggregated as a massfractal of dimension 2.8� 0.1 and the size of the aggregate is 662� 80 Å. The aggre-gation number (Nagg¼ 11) is at least 1000 times smaller than the fiber in (a). Thesurface area/unit mass of the filler (S/m) is gotten from Porod analysis of the high-qregion.
Y. Xie et al. / Polymer 50 (2009) 4656–4670 4665
For all the silica/PHBHx nanocomposites studied, the addition ofthe silica fibers or the silica spheres did not change the peak or thefinal melting temperatures significantly (Table 3), indicating thatthe crystal structures did not change, although the degree ofcrystallinity decreased slightly. During cooling, a crystallizationpeak was observed at about 95 �C for the 1 �C/min cooling rate(Figs. 9(b) and 10(b)). During the subsequent heating, a cold crys-tallization peak was not observed (Figs. 9(a) and 10(a)).
Unfilled PHBHx069 had a slightly higher degree of crystallinity(Xc¼ 50%) than the unfilled PHBHx072 (Xc¼ 48%). The peak crys-tallization temperature (Tc
p¼ 96.3 �C) and the onset crystallizationtemperature (Tc
onset¼ 105.5 �C) of the neat PHBHx069 were higherthan those of the neat PHBHx072, indicating that the crystallizationrate of the neat PHBHx069 was faster than that of the neatPHBHx072.
For the PHBHx072 materials at 5-wt% loading the degree ofcrystallinity is reduced from 48% to 43%, a 5% reduction. If theparticles reduced the crystallinity in a halo region of dimension x,x can be calculated from the surface area per unit volumemeasured by USAXS (Sv¼ 16 m2/cm3 for 5-wt% fiber) as 0.05/(XcSv)¼ 8 nm. Given that the long period (L) is about 6 nm, andthe average size of the crystalline and amorphous phases is about3 nm, the reduction of crystallinity is accounted for by minimalalteration of the interface region between lamellar stacks and
spherulites. In other words, because of the large interfacial area,the impact of nanoparticles is large even though the halo region issmall.
With the same filler loading, the SiO2 fiber nanocompositesalways had a lower Tc
onset and a lower Tcp than the corresponding SiO2
nanocomposites, indicating that the silica spheres accelerated thecrystallization more than the silica fibers (Table 3). USAXS showsthat the Sv for spheres is comparable to that for fibers (13� 3 m2/cm3 vs. 16� 3 m2/cm3 at 5-wt% loading), so the small change incrystallinity is not likely due to a nucleation effect. The 1-wt% and 3-wt% SiO2/PHBHx072 nanocomposites had a faster crystallizationrate than the neat polymer, but the 5-wt% SiO2/PHBHx072 nano-composite had a slower crystallization rate. For the SiO2 fiber/PHBHx072 nanocomposites, high filler concentrations (3-wt% and5-wt%) also reduced the rate of crystallization. Similar effects havebeen observed for nanocomposites in other matrices like nylon 6[95] and poly(3-caprolactone) systems [96].

Heat F
lo
w, E
nd
o U
p
16012080400-40Temperature (°C)
PHBHx072 Heating
0 wt%
1 wt% Silica fiber
1 wt% Silica
3 wt% Silica fiber
5 wt% Silica fiber
3 wt% Silica
5 wt% Silica
a
Temperature (°C)
Heat F
lo
w, E
nd
o U
p
120 115 110 105 100 95 90 85 80 75 70 65 60
0 wt%
1 wt% Silica fiber1 wt% Silica
3 wt% Silica
5 wt% Silica
3 wt% Silica fiber
5 wt% Silica fiber
PHBHx072 Coolingb
Fig. 9. DSC heating scans (a) and cooling scans (b) of neat PHBHx072 and its nano-composites with different filler contents. Samples were cooled from a melt to �80 �Cat a rate of 1 �C/min. Scans are shifted for clarity.
Heat F
lo
w, E
nd
o U
p
16012080400-40Temperature (°C)
PHBHx069 Heating
0 wt%
1 wt% Silica fiber
1 wt% Silica
3 wt% Silica fiber
3 wt% Silica
5 wt% Silica
5 wt% Silica fiber
a
Temperature (°C)
Heat F
lo
w, E
nd
o U
p
120 115 110 105 100 95 90 85 80 75 70 65 60
PHBHx069 Cooling
0 wt%
1 wt% Silica fiber
1 wt% Silica
3 wt% Silica fiber
3 wt% Silica
5 wt% Silica fiber
5 wt% Silica
b
Fig. 10. DSC heating scans (a) and cooling scans (b) of neat PHBHx069 and its nano-composites with different filler contents. Samples were cooled from a melt to �80 �Cat a rate of 1 �C/min. Scans are shifted for clarity.
Y. Xie et al. / Polymer 50 (2009) 4656–46704666
The acceleration of crystallization at low and intermediateloadings can be explained by the two roles that the nanofillers playin the crystallization: nucleation facilitating the crystallization andphysical hindrance slowing growth [71,97,98]. At low concentra-tions, the distance between dispersed particles is large so it isrelatively easy for the additional nucleation sites to incorporate thesurrounding polymer. At high concentrations, however, diffusion ofpolymer chains to the growing crystallite is hindered.
The effect of silica nanoparticles on the spherulitic morpho-logies of PHBHx072 was studied by POM. The dark regions (or moreprecisely, less contrast regions) in Fig. 11(a), are actually spheruliteswith much smaller sizes, which were verified by DSC (crystallinity)and small-angle light scattering (data not shown in the manu-script). Thus at a moderate (10 �C/min) (Fig. 11(a)) cooling rate, theaverage spherulite size decreased significantly with filler content.However, at a slow (1 �C/min) cooling rate (Fig. 11(b)), there was nosignificant change of the average size (w500� 200 mm) and textureof the spherulites after adding silica nanoparticles into the polymermatrix. Therefore, the spherulitic morphologies obtained at 1 �C/min cooling rate suggest that the cooling rate rather than thenucleating agents dominated the growth of the spherulites.
TGA shows that the thermal stability of PHBHx is also improvedby addition of silica (Fig. 12). The effect of filler content on theweight loss of the nanocomposites was deduced from thetemperature at 50% weight loss of polymer.
The temperatures at 50 wt% weight loss of neat PHBHx072, 5-wt% SiO2/PHBHx072 and 5-wt% SiO2 fiber/PHBHx072 nano-composites were 294.2 �C, 297.4 �C and 299.5 �C, respectively.
Therefore, the thermal stability of the polymer was slightlyimproved by the addition of nanofillers, indicating that the nano-fillers were effective barriers to the heat and mass transport.
5. Discussion
The mechanical properties of polymer nanocomposites can beaffected by many factors, such as the interaction between particlesand a polymer matrix, crystallinity of the polymer, spheruliticmorphology, molecular weight of the polymer matrix, dispersionstate of the particles in the polymer matrix, etc.
Matrix characteristics do not change significantly in the nano-composites. From the DSC data, the transition temperature (Tg) forall the samples did not change, indicating that there are no strongattractive or repulsive interactions between the nanoparticles andthe polymers. Therefore, the interfacial adhesion between themmust be weak. In addition, changes in degree of crystallinity andspherulitic morphology caused by the addition of filler are minimalat 1 �C/min cooling rate. From the tensile testing results, the neatPHBHx069 is stiffer but less ductile than the neat PHBHx072.
The major difference between the neat PHBHx072 and the neatPHBHx069 is their molecular weights. Fornes and co-workers[95,99–101] studied the effect of molecular weight on themechanical properties of nylon 6 organoclay nanocomposites. Theyfound that neat nylon 6 with lower molecular weight (Mn¼ 16,400)

Table 3Thermal properties of neat PHBHx072, neat PHBHx069 and their nanocomposites cooled from a melt at 1 �C/min, obtained from the analysis of the DSC data.
Samples Tmp (�C) Tm
f (�C) DHm (J/g) Xc (%) Tconset (�C) Tc
p (�C) DHc (J/g)
Neat PHBHx072 133.5, 147.4 152.0 54.8 48 101.8 91.4 45.51 wt% SiO2 fiber/PHBHx072 132.6, 146.2 152.0 50.7 45 102.1 91.1 47.21 wt% SiO2/PHBHx072 132.6, 146.7 150.6 53.3 47 104.6 92.6 49.13 wt% SiO2 fiber/PHBHx072 131.8, 145.8 151.7 46.3 42 99.6 88.1 44.73 wt% SiO2/PHBHx072 133.2, 147.1 151.1 49.4 44 104.8 94.8 48.55 wt% SiO2 fiber/PHBHx072 133.2, 146.6 152.7 46.6 43 98.9 88.3 41.95 wt% SiO2/PHBHx072 133.2, 146.8 151.2 47.1 43 100.4 91.3 47.2
Neat PHBHx069 133.1, 146.0 152.7 57.3 50 105.5 96.3 47.31 wt% SiO2 fiber/PHBHx069 133.8, 146.3 152.7 53.0 46 105.8 97.4 47.91 wt% SiO2/PHBHx069 134.5, 146.7 152.5 52.9 46 107.4 98.8 47.83 wt% SiO2 fiber/PHBHx069 134.6, 147.0 153.0 52.8 47 105.9 97.3 45.93 wt% SiO2/PHBHx069 133.3, 145.6 151.5 53.2 48 105.9 97.3 45.35 wt% SiO2 fiber/PHBHx069 134.6, 147.0 153.1 52.9 48 104.8 96.1 42.55 wt% SiO2/PHBHx069 133.8, 146.3 152.3 52.3 48 105.7 96.7 43.1
Y. Xie et al. / Polymer 50 (2009) 4656–4670 4667
had higher Young’s modulus and less ductility than the highermolecular weight (Mn¼ 29,300). In general, decreasing the molec-ular weight results in a faster crystallization, which is to be expectedon the basis of mobility considerations and has been observed formany polymers [102]. Although we do observe higher crystallinityin the lower molecular weight sample (PHBHx069), the difference isonly 2%.
Fig. 11. The effect of filler content (0, 1 and 5 wt%) on the spherulitic morphologies of PHBHxcooling rate. The scale bar ¼ 100 mm.
Stress whitening is seen in all samples. Plastic tensile deforma-tion of crystalline polymers can cause cavitation, producing suddenpolymer whitening near the yield point [21]. Michler et al. [21]studied the influence of molecular weight on the micromechanicaldeformation and found that their significant differences are con-nected with the decreasing thickness of the amorphous materialbetween lamellae with decreasing molecular weight. Fewer tie
072 samples that were cooled from a melt with (a) 10 �C/min cooling rate, (b) 1 �C/min

100
80
60
40
20
0
Weig
ht (%
)
320310300290280270260250240Temperature (°C)
neat PHBHx072 1 wt% SiO2 fiber/PHBHx072 3 wt% SiO2 fiber/PHBHx072 5 wt% SiO2 fiber/PHBHx072
a
Temperature (°C)
100
80
60
40
20
0
Weig
ht (%
)
320310300290280270260250240
neat PHBHx072 1 wt% SiO2/PHBHx072 3 wt% SiO2/PHBHx072 5 wt% SiO2/PHBHx072
b
Fig. 12. TGA curves for (a) neat PHBHx072 and its nanocomposites with differentcontents of SiO2 fibers, and (b) PHBHx072 and its nanocomposites with differentcontents of SiO2 spheres.
Y. Xie et al. / Polymer 50 (2009) 4656–46704668
molecules or entanglements between lamellae exist at lowermolecular weights. Cavitation in the amorphous phase, therefore,cannot be stabilized and local stress concentrations result in longercrazes and a transition from ductile to quasi-brittle behavior [21].
If the interfacial adhesion is not high, debonding at the particle–polymer interface can occur, leading to crazing and/or shear
1.8
1.6
1.4
1.2
1.0
0.8
Er
2.5 3.0 3.52.01.51.00.50.0
Volume Percent
0.072 fiber0.072 sphere0.069 fiber0.069 sphere
Eq 8, L/D =1
Eq. 7, L/D = 11
Fig. 13. Measured relative modulus compared to the prediction for reinforcement withsymmetric and asymmetric particles. The 072 matrix seems to give anonymously largereinforcement.
yielding [21,76,103]. In our case, this mechanism may have beenactive in the 1 wt% SiO2/PHBHx072 and 1 wt% SiO2 fiber/PHBHx072nanocomposites, which fractured with a slight necking that led toa more ductile behavior.
Although void formation is a secondary factor contributing totoughness (in other words, only a small part of energy dissipationmay contribute to toughness), it plays an important role for theactivation of further plastic deformation [104]. When filler loadingis low (1 wt%) the formation of nanovoids releases strain constraintsand induces local shear deformation in polymer ligaments betweennanoparticles. As loading increases, however, the aggregates act asflaws, which trigger brittle response and premature material failurebefore the shear yielding is able to start.
In principle modulus should be less sensitive to defects andtherefore easier to interpret. In our case, however, the modulus isstrongly dependent on the matrix, which, based on the above results,is nearly the same for the two polymers. Fig. 13 shows the experi-mental values of Er¼ Ec/Em and the predictions based on the simpli-fied Halpin–Tsai model (Eqs. (7) and (8)). Based on the USAXS results,the primary particles are nearly symmetric so Eq. (8) should beapplicable. Even if the extreme value of the aspect ratio from Nissan isassumed (L/D¼ 11) the prediction changes little. Both predictionsagree with the 069 data, but fall outside the error bars for the 072 data.
Eqs. (7) and (8) assume independent, rigid particles so that theelastic energy is stored in the strain field around the particles. Inprinciple these equations could be altered for aggregated particles.Interactions between the strain fields of the primary particles wouldalter these simple predictions. Also Eq. (8) represents the minimumexpected reinforcement because it neglects energy stored in thefiller itself [65]. Since we observe no difference in modulusenhancement for the spheres and fibers, which differ dramaticallyin the nature of the aggregate, it seems like these compromisingfactors are not relevant.
Some insight into the anomalous modulus enhancement for thePHBHx072 material comes from the observation that theenhancement would be ‘‘normal’’ if the modulus of the unfilledmaterials was under estimated by 30%. That is if the modulus of thefilled samples is extrapolated to zero loading, the intercept is toohigh by about 30%. This observation leads us to believe that theenhancement is due the impact of the filler particles on the matrix.Given that a semicrystalline polymer is itself a composite consistingof a stiff crystalline regions and more elastic amorphous regions,simple 2-component micromechanical models like Halpin–Tsaimay not be adequate to account for observed enhancement. Itseems that in this case, the particles would enhance the modulus ofthe amorphous regions more than the crystalline regions. Beingless crystalline the PHBHx072 sample is therefore more susceptibleto enhancement.
6. Conclusions
Simultaneous improvement of both stiffness and toughness wasobserved at 1 wt% loading of SiO2 spheres or SiO2 fibers for thehigher molecular weight PHBHx matrix. The SiO2 fibers hada greater toughening effect than SiO2 spheres. When the loadingwas 3 wt% and above, Young’s modulus continued to increase, butthe strain at break and toughness decreased. The ultimate strengthdid not change for all the nanocomposites compared with theunfilled polymer.
The improvement of the mechanical properties observed wasnot caused by the change of crystallinity or spheruliticmorphology. Instead, a sufficiently high molecular weight of thepolymer matrix, weak interfacial adhesion and a good dispersionof the nanofillers are necessary to improve toughness and stiff-ness simultaneously.

Y. Xie et al. / Polymer 50 (2009) 4656–4670 4669
Acknowledgements
This research was supported by the US Department of Energy,Office of Basic Energy Sciences (Grant No. FG02-06ER46349). TheUSAXS data were collected at the X-ray Operations and Researchbeamline 32-ID-B, located at the Advanced Photon Source, ArgonneNational Laboratory. The use of the Advanced Photon Source wassupported by the US Department of Energy, Office of Science, Officeof Basic Energy Sciences, under Contract No. DE-AC02-06CH11357.
References
[1] Williams CK, Hillmyer MA. Polymer Reviews 2008;48(1):1–10.[2] Akiyama M, Tsuge T, Doi Y. Polymer Degradation and Stability
2003;80(1):183–94.[3] Madison LL, Huisman GW. Microbiology and Molecular Biology Reviews
1999;63(1):21–53.[4] Anderson AJ, Dawes EA. Microbiological Reviews 1990;54(4):450–72.[5] Smith R. Biodegradable polymers for industrial applications. Boca Raton: CRC
Press LLC; 2005.[6] Chen GQ, Wu Q. Biomaterials 2005;26(33):6565–78.[7] Wang YW, Wu QO, Chen JC, Chen GQ. Biomaterials 2005;26(22):4693.[8] Noda I. Films comprising biodegradable PHA copolymers. US Patent No.
6,174,990; 2001.[9] Noda I, Green PR, Satkowski MM, Schechtman LA. Biomacromolecules
2005;6(2):580–6.[10] Zini E, Focarete ML, Noda I, Scandola M. Composites Science and Technology
2007;67(10):2085–94.[11] Hassan MK, Abou-Hussein R, Zhang XJ, Mark JE, Noda I. Molecular Crystals
and Liquid Crystals 2006;447:341–62.[12] Xie YP, Noda I, Akpalu YA. Journal of Applied Polymer Science
2008;109(4):2259–68.[13] Tullo A. Chemical and Engineering News 2008;86(39):21–5.[14] Sato H, Dybal J, Murakami R, Noda I, Ozaki Y. Journal of Molecular Structure
2005;744–747:35–46.[15] Asrar J, Valentin HE, Berger PA, Tran M, Padgette SR, Garbow JR. Bio-
macromolecules 2002;3(5):1006–12.[16] Freier T. Biopolyesters in tissue engineering applications. Polymers for
Regenerative Medicine 2006:1–61.[17] Williams SF, Martin DP, Horowitz DM, Peoples OP. International Journal of
Biological Macromolecules 1999;25(1–3):111–21.[18] Yang XS, Zhao K, Chen GQ. Biomaterials 2002;23(5):1391–7.[19] Zhao K, Yang X, Chen GQ, Chen JC. Journal of Materials Science: Materials in
Medicine 2002;13(9):849–54.[20] Yoshie N, Menju H, Sato H, Inoue Y. Macromolecules 1995;28(19):6516–21.[21] Michler GH, Balta-Calleja FJ. Mechanical properties of polymers based on
nanostructure and morphology. Boca Raton: CRC Press; 2005.[22] Vaia RA, Giannelis EP. MRS Bulletin 2001;26(5):394–401.[23] Pinnavaia TJ, Beall GW. In: Pinnavaia TJ, Beall GW, editors. Polymer–clay
nanocomposites. Chichester, England; New York: Wiley; 2000. p. 349.[24] Giannelis EP. Advanced Materials 1996;8(1):29.[25] Vollenberg PHT, Heikens D. Polymer 1989;30(9):1656–62.[26] Vollenberg PHT, Dehaan JW, Vandeven LJM, Heikens D. Polymer
1989;30(9):1663–8.[27] Sternstein SS, Zhu AJ. Macromolecules 2002;35(19):7262–73.[28] Mitchell CA, Bahr JL, Arepalli S, Tour JM, Krishnamoorti R. Macromolecules
2002;35(23):8825–30.[29] Ash BJ, Siegel RW, Schadler LS. Macromolecules 2004;37(4):1358–69.[30] He CB, Liu TX, Tjiu WC, Sue HJ, Yee AF. Macromolecules 2008;41(1):193–202.[31] Zini E, Baiardo M, Armelao L, Scandola M. Macromolecular Bioscience
2004;4(3):286–95.[32] Singh S, Mohanty AK, Sugie T, Takai Y, Hamada H. Composites Part A: Applied
Science and Manufacturing 2008;39(5):875–86.[33] Bordes P, Pollet E, Bourbigot S, Averous L. Macromolecular Chemistry and
Physics 2008;209(14):1473–84.[34] Lim JS, Noda I, Im SS. Polymer 2007;48(9):2745–54.[35] Maiti P, Batt CA, Giannelis EP. Biomacromolecules 2007;8(11):3393–400.[36] Maiti P, Yadav PJP. Journal of Nanoscience and Nanotechnology
2008;8(4):1858–66.[37] Hsu SF, Wu TM, Liao CS. Journal of Polymer Science, Part B: Polymer Physics
2007;45(9):995–1002.[38] Bruzaud S, Bourmaud A. Polymer Testing 2007;26(5):652–9.[39] Sanchez-Garcia MD, Gimenez E, Lagaron JM. Journal of Applied Polymer
Science 2008;108(5):2787–801.[40] Choi WM, Kim TW, Park OO, Chang YK, Lee JW. Journal of Applied Polymer
Science 2003;90(2):525–9.[41] Sato H, Murakami R, Padermshoke A, Hirose F, Senda K, Noda I, et al.
Macromolecules 2004;37(19):7203–13.[42] Sato H, Nakamura M, Padermshoke A, Yamaguchi H, Terauchi H, Ekgasit S,
et al. Macromolecules 2004;37(10):3763–9.
[43] He J-D, Cheung MK, Yu PH, Chen G-Q. Journal of Applied Polymer Science2001;82(1):90–8.
[44] Iwata T, Doi Y. Bio-based polymers. Macromolecular Symposia 2005;224:11–9.
[45] Noda I, Satkowski MM, Dowrey AE, Marcott C. Polymer alloys of Nodaxcopolymers and poly(lactic acid). Wiley-VCH Verlag Gmbh; 2004. p.269–75.
[46] Fischer JJ, Aoyagi Y, Enoki M, Doi Y, Iwata T. Polymer Degradation andStability 2004;83(3):453–60.
[47] Abe H, Doi Y. RIKEN Review 2001;42:7–10.[48] Abe H, Doi Y. Biomacromolecules 2002;3(1):133–8.[49] Abe H, Doi Y, Aoki H, Akehata T. Macromolecules 1998;31(6):1791–7.[50] Abe H. Macromolecular Bioscience 2006;6(7):469–86.[51] Sen S, Xie Y, Bansal A, Yang H, Cho K, Schadler LS, et al. European Physical
Journal – Special Topics 2007;141:161–5.[52] Sen S, Xie YP, Kumar SK, Yang HC, Bansal A, Ho DL, et al. Physical Review
Letters 2007;98(12):128301–4.[53] Bansal A, Yang HC, Li CZ, Cho KW, Benicewicz BC, Kumar SK, et al. Nature
Materials 2005;4(9):693–8.[54] Bansal A. PhD dissertation. Rensselaer Polytechnic Institute; 2004.[55] Beaucage G. Journal of Applied Crystallography 1995;28:717–28.[56] Beaucage G, Kammler HK, Pratsinis SE. Journal of Applied Crystallography
2004;37:523–35.[57] Beaucage G. Journal of Applied Crystallography 1996;29:134–46.[58] Schaefer DW, Rieker T, Agamalian M, Lin JS, Fischer D, Sukumaran S, et al.
Journal of Applied Crystallography June 2000;33:587–91.[59] Dobbins TA, Bruster EL, Oteri EU, Ilavsky J. Journal of Alloys and Compounds
2007;446:248–54.[60] Roe R-J. Methods of X-ray and neutron scattering in polymer science. Oxford,
UK: Oxford University Press; 2000.[61] Higgins JS, Benoit HC. Polymers and neutron scattering. New York, USA:
Oxford University Press; 1997.[62] Schaefer DW, Beaucage G, Loy DA, Shea KJ, Lin JS. Chemistry of Materials
2004;16(8):1402–10.[63] Schaefer DW, Zhao J, Dowty H, Alexander M, Orler EB. Soft Matter
2008;4(10):2071–9.[64] Schaefer DW, Chen CY. Rubber Chemistry and Technology 2002;75(5):
773–93.[65] Schaefer DW, Justice RS. Macromolecules 2007;40(24):8501–17.[66] Zhao C, Hu G, Justice R, Schaefer DW, Zhang S, Yang M, et al. Polymer
2005;46(14):5125–32.[67] Justice RS, Wang DH, Tan LS, Schaefer DW. Journal of Applied Crystallography
2007;40:S88–92.[68] Halpin JC, Kardos JL. Polymer Engineering and Science 1976;16(5):344–52.[69] Hub C, Harton SE, Hunt MA, Fink R, Ade H. Journal of Polymer Science, Part B:
Polymer Physics 2007;45(16):2270–6.[70] Mondadori NML, Nunes RCR, Zattera AJ, Oliveira RVB, Canto LB. Journal of
Applied Polymer Science 2008;109(5):3266–74.[71] Tjong SC. Materials Science and Engineering R: Reports 2006;53(3–4):
73–197.[72] Fornes TD, Paul DR. Polymer 2003;44(17):4993–5013.[73] Cannillo V, Bondioli F, Lusvarghi L, Montorsi M, Avella M, Errico ME, et al.
Composites Science and Technology 2006;66(7–8):1030–7.[74] Fukuda H, Kawata K. Fiber Science and Technology 1974;7(3):207–22.[75] Smallwood HM. Journal of Applied Physics 1944;15:758–66.[76] Jiang L, Zhang JW, Wolcott MP. Polymer 2007;48(26):7632–44.[77] Ou YC, Yang F, Yu ZZ. Journal of Polymer Science, Part B: Polymer Physics
1998;36(5):789–95.[78] Yang F, Ou YC, Yu ZZ. Journal of Applied Polymer Science 1998;69(2):355–61.[79] Arrighi V, McEwen IJ, Qian H, Prieto MBS. Polymer 2003;44(20):6259–66.[80] Liu FK, Hsieh SY, Ko FH, Chu TC. Colloids and Surfaces A: Physicochemical and
Engineering Aspects 2003;231(1–3):31–8.[81] Bafna A, Beaucage Mirabella F, Mehta S. 3D hierarchical orientation in
polymer–clay nanocomposite films. Polymer 2003;44:1103–15.[82] Ma D, Akpalu Y, Li Y, Siegel R, Schadler L. Journal of Polymer Science, Part B:
Polymer Physics 2005;43(5):488–97.[83] Sawyer WG, Freudenberg KD, Bhimaraj P, Schadler LS. A study on the friction
and wear behavior of PTFE filled with alumina nanoparticles. Wear2003;254:573–80.
[84] Schwartz CJ, Bahadur S. Studies on the tribological behavior and transferfilm–counterface bond strength for polyphenylene sulfide filled with nano-scale alumina particles. Wear 2000;237:261–73.
[85] Ueki MM, Zanin M. Influence of additives on the dielectric strength of high-density polyethylene. IEEE Transactions on Dielectrics and Electrical Insu-lation 1999;6:876–81.
[86] Vaughan AS, Zhao Y, Barre LL, Sutton SJ, Swingler SG. On additives,morphological evolution and dielectric breakdown in low density poly-ethylene. European Polymer Journal 2003;39:355–65.
[87] Wang QH, Xu JF, Shen WC, Xue QJ. The effect of nanometer SiC filler on thetribological behavior of PEEK. Wear 1997;209:316–21.
[88] Wang QH, Xue QJ, Liu HW, Shen WC, Xu JF. The effect of particle size ofnanometer ZrO2 on the tribological behaviour of PEEK. Wear 1996;198:216–9.
[89] Yamano Y, Endoh H. Increase in breakdown strength of PE film by additivesof azocompounds. IEEE Transactions on Dielectrics and Electrical Insulation1998;5:270–5.

Y. Xie et al. / Polymer 50 (2009) 4656–46704670
[90] Bureau MN, Denault J, Cole KC, Enright GD. The role of crystallinity andreinforcement in the mechanical behavior of polyamide-6/clay nano-composites. Polymer Engineering and Science 2002;42:1897–906.
[91] Maiti P, Batt C, Giannelis E. New biodegradable polyhydroxybutyrate/layeredsilicate nanocomposites. Biomacromolecules 2007;8:3393–400.
[92] Petrovicova E, Knight R, Schadler LS, Twardowski TE. Journal of AppliedPolymer Science 2000;78(13):2272–89.
[93] Priya L, Jog JP. Journal of Polymer Science, Part B: Polymer Physics2002;40(15):1682–9.
[94] Saujanya C, Radhakrishnan S. Journal of Materials Science 2000;35(9):2319–23.
[95] Fornes TD, Paul DR. Polymer 2003;44(14):3945–61.
[96] Jimenez G, Ogata N, Kawai H, Ogihara T. Journal of Applied Polymer Science1997;64(11):2211–20.
[97] Xie YC, Yu DM, Kong J, Fan XD, Qiao WQ. Journal of Applied Polymer Science2006;100(5):4004–11.
[98] Zhang GS, Yan DY. Journal of Applied Polymer Science 2003;88(9):2181–8.[99] Fornes TD, Yoon PJ, Keskkula H, Paul DR. Polymer 2001;42(25):9929–40.
[100] Fornes TD, Yoon PJ, Keskkula H, Paul DR. Polymer 2002;43(7):2121–2.[101] Fornes TD, Yoon PJ, Hunter DL, Keskkula H, Paul DR. Polymer 2002;43(22):5915–33.[102] Wunderlich B. Macromolecular physics. New York: Academic Press; 1973.[103] Zuiderduin WCJ, Westzaan C, Huetink J, Gaymans RJ. Polymer 2003;
44(1):261–75.[104] Kim GM, Michler GH. Polymer 1998;39(23):5699–703.
Recommended


![Mathematical modelling and process optimization of a continuous 5-stage bioreactor cascade for production of poly[-(R)-3-hydroxybutyrate] by Cupriavidus necator](https://img.pdfslide.net/doc/110x75/635c22e53c91984d2605daa7/mathematical-modelling-and-process-optimization-of-a-continuous-5-stage-bioreactor.jpg)


