
RAPID PULLOUT TEST OF SOIL NAIL
OOI POH HAI
NATIONAL UNIVERSITY OF SINGAPORE
2006
RAPID PULLOUT TEST OF SOIL NAIL
OOI POH HAI (B.Eng. (Hons), UTM)
A THESIS SUBMITTED
FOR THE DEGREE OF DOCTOR OF PHILOSOPHY
DEPARTMENT OF CIVIL ENGINEERING
NATIONAL UNIVERSITY OF SINGAPORE
2006

i
Acknowledgments
I would like to express my sincere gratitude and appreciation to my supervisor,
Assoc. Prof. Dr. Tan Siew Ann, for his invaluable advice throughout this study. I am
grateful for his relentless efforts in helping to overcome the difficuities encountered
during the course of this research program.
I would like to thank my friend, Mr. William Cheang, for spending time
clarifying doubts I had and providing me with the background information regarding
this project.
I would like to thank all colleagues and technicians from Geotechnical
Laboratory for providing assistance throughout this project.
I would like to thank the examiners of this thesis for their valuable and
constructive comments which helps to improve the quality of this thesis.
At last, I would like to thank my parents for their kind support and
encouragement.
ii
Table of Contents
Page
Acknowledgements i
Table of Contents ii
Summary vi
List of Tables viii
List of Figures ix
List of Symbols
xvi
Chapter 1: Introduction 1
1.1 Problem Background 1
1.2 Literature Review 5
1.2.1 Dynamic Testing Techniques 5
1.2.1.1 Low Strain Integrity test 6
1.2.1.2 High Strain Dynamic test 7
1.2.1.3 Rapid Test 10
1.2.1.4 Testing Technique for Dynamic Pullout Test of
This Study
15
1.2.2 Dynamic Shaft Resistance 16
1.3 Problem Definition 19
1.4 Objectives and Scope 21
Chapter 2: Descriptions of Experiments 29
2.1 Introduction 29
2.2 Pullout Box 29
2.3 Quasi Static Pullout Machine 31
2.4 Impulse Hammer 32
2.4.1 Working Mechanism 32
2.4.2 The Characteristic of Impulse Load 35
iii
2.5 Instrumentations 35
2.5.1 Load Cell 35
2.5.2 Linear Motion potentiometer 36
2.5.3 Strain Gauge 37
2.5.4 Data Acquisition System 40
2.6 Nail 41
2.6.1 Dimension and Material 41
2.6.2 Types of Nail Surface 41
2.6.2.1 Preparation of Nail Surface 42
2.6.2.2 Normalized Roughness Rn 43
2.7 Sand 45
2.7.1 Basic Properties 45
2.7.2 Direct Shear Test 46
2.7.3 The Construction of Sand Medium 51
2.8 Experimental Program 54
Chapter 3: Quasi Static Pullout Test 84
3.1 Introduction 84
3.2 The Plot of Load Displacement Curve 84
3.2.1 Repeatability of Test Results 85
3.3 Quasi Static Pullout Response 86
3.3.1 Rough Nail 86
3.3.2 Smooth Nail 89
3.4 Quasi Static Load Distribution Curve 90
3.5 Peak Quasi Static Pullout Strength and Restrained Dilatancy
Effect
90
3.6 Quasi Static Reload Test 96
3.7 Concluding Remarks 98
Chapter 4: High Energy Rapid Pullout Test 112
4.1 Introduction 112
4.2 The Plot of Load Displacement Curve 113

iv
4.3 Pre Peak Rapid Pullout Response of Rough Nail 115
4.3.1 Pre Peak rapid Pullout Stiffness 115
4.3.2 Peak rapid Pullout Strength 116
4.3.3 The Causes of Improvements in Pre Peak Rapid Pullout
Response
119
4.3.4 Rapid Load Distribution Curve 126
4.4 The ‘Actual’ Damping Coefficient 127
4.5 Post Peak Softening Behaviour of Rough Nail 134
4.6 Rapid Pullout Response of Smooth Nail 139
4.7 Quasi Static Reload Test 141
4.8 Concluding Remarks 142
Chapter 5: Low Energy Rapid Pullout Test 174
5.1 Introduction 174
5.2 The Plot of Load Displacement Curve 175
5.3 Pullout Response of Low Energy Rapid Pullout Test 176
5.4 Successive Low Energy Rapid Pullout Tests 178
5.5 Succeeding Quasi Static Pullout Test 179
5.6 Modified Unloading Point Method 180
5.7 Concluding Remarks 184
Chapter 6: Discussion on Spring and Dashpot Model 192
6.1 Introduction 192
6.2 Reviews on Available Shaft Models Appiled to Pile 192
6.3 Modelling of Rapid Pullout Response of Rough Nail 197
6.3.1 Model with Constant Pre Failure Stiffness 199
6.3.2 Model with Weaken Zone Hyperbolic Spring 201
6.4 Concluding Remarks 205
Chapter 7 Conclusions 212
7.1 Introduction 212
7.2 Findings of this Study
212

v
7.3 Implications on the Development of Rapid Pullout Test of Soil
Nail
216
7.4 Recommendations for Future Research 219
References 221
Appendix A 234
Appendix B 244
vi
Summary
The main purposes of this research project were to investigate the pullout
response of soil nail under rapid loading condition and to clarify the potential of rapid
pullout test as a supplementary test method to assess the quasi static pullout response
of soil nail. The rapid loading condition is referred to the loading condition similar to
‘Statnamic’ pile load test. These purposes were achieved by conducting a series of
large scale laboratory rapid and quasi static pullout tests on horizontal nails embedded
in dry clean sand. To conduct the laboratory rapid pullout tests, a spring based
impulse hammer was designed and built in this research project.
Results of these experiments showed that the influence of loading rate on
pullout response is highly dependent on the roughness condition of nail surface. For
rough nail, although the pre peak rapid pullout response was generally similar to the
pre peak quasi static pullout response in trend, the pre peak pullout stiffness and peak
pullout strength of rapid pullout test were higher than those of corresponding quasi
static pullout test. These variations were found to be in direct proportion to nail
diameter and were identified to be most probably caused by the mobilization of
radiation damping effect. ‘Actual’ damping coefficient mobilized in these tests,
defined by the difference in load between equivalent quasi static and rapid load
displacement curves divided by nail’s velocity, was not a constant but decrease with
the increase in pullout displacement. Restrained dilatancy effect mobilized in rapid
pullout test is also found to be almost similar to that mobilized in quasi static pullout
test.
In contrary, the rapid pullout response of smooth nail was virtually identical to
the corresponding quasi static pullout response with negligible damping effect.

vii
For low energy rapid pullout tests which the nails were not loaded to complete
pullout failure, the unloading point, the point of maximum displacement and zero
velocity on rapid load displacement curve, was observed to coincide with the
corresponding quasi static load displacement curve. By using this unique
characteristic of the unloading point, ‘Modified Unloading Point Method’ was
suggested to predict the equivalent quasi static pullout response from low energy
rapid pullout test result by simple interpretation procedures. Besides, it is also
observed that the quasi static pullout response of a nail was not adversely affected by
the conduct of preceding rapid pullout test as long as the peak quasi static pullout
capacity was not exceeded. This observation suggests the capability of low energy
rapid pullout test to be applied as an inspection test method for working nail.
At the end of this thesis, discussion on modeling by spring and dashpot model
was presented. Experiences and concepts learned from the modelling of dynamic pile
shaft resistance were applied to model the high energy rapid pullout response of rough
nail. It is found that although current knowledge learned from dynamic pile shaft
modelling can simulate the rapid pullout response of rough nail reasonably well,
equivalent quasi static pullout response derived from the simulation results is
generally disagree with the experimental quasi static pullout response. More research
works are needed before spring and dashpot model can be conveniently used in
routine interpretation of field soil nail rapid pullout test results in future.
As a conclusion, the use of rapid pullout test as a supplementary test method
to assess the quasi static pullout response of soil nail seems to be feasible if the results
of rapid pullout test are interpreted by a proper interpretation method.

viii
List of Tables
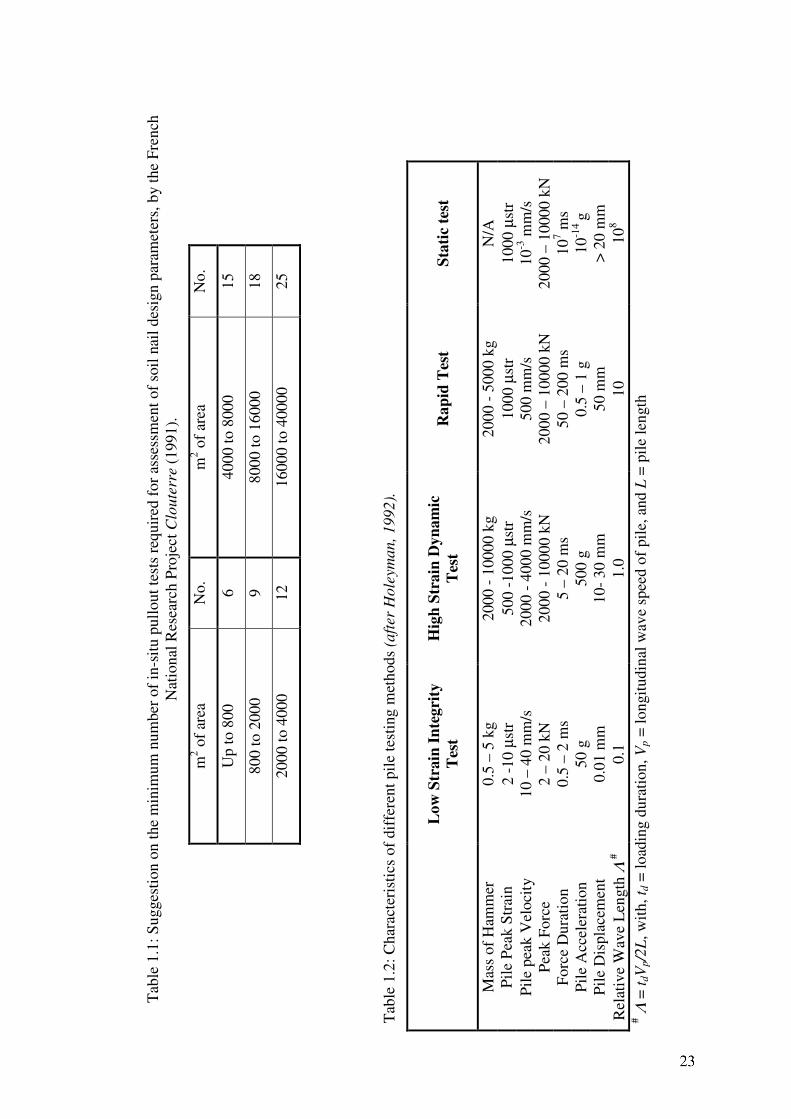
Table 1.1 Suggestion on the minimum number of in-situ pullout tests required for
assessment of soil nail design parameters, by the French National
Research Project Clouterre (1991).
Table 1.2 Characteristics of different pile testing methods (after Holeyman,
1992).
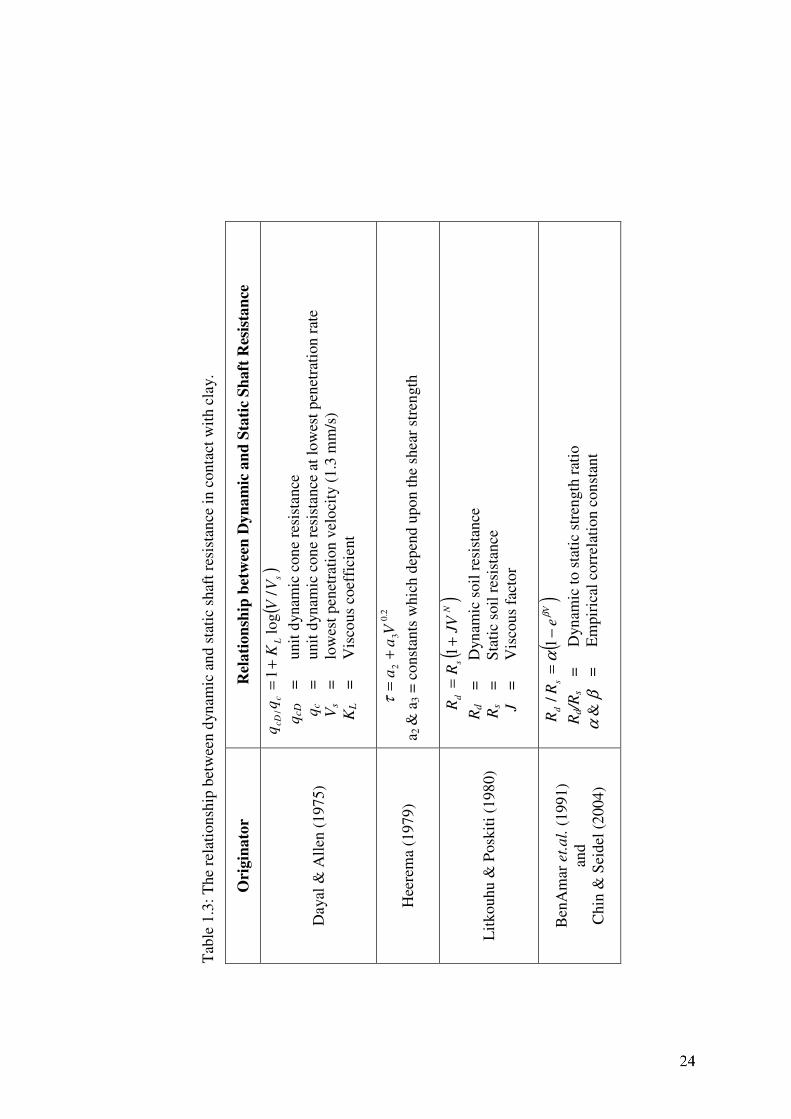
Table 1.3 The relationship between dynamic and static shaft resistance in contact
with clay.
Table 2.1 Normalized Roughness Rn of nail surfaces.
Table 2.2 Descriptions and results of direct shear tests.
Table 2.3 Descriptions and results of sand density calibration tests.
Table 2.4 The details of test series conducted in these experiments.
Table 2.5 The details of pullout tests conducted under each test series.
Table 3.1 Summary of quasi static pullout tests results.
Table 4.1 Summary of high energy rapid pullout tests results for test series on
rough nail.

ix
List of Figures
Figure 1.1 The working mechanism of soil nail.
Figure 1.2 Typical setup of quasi static soil nail pullout test.
Figure 1.3 Typical result of low stain integrity test of a defective pile.
Figure 1.4 Typical result of high strain dynamic test on pile.
Figure 1.5 Comparison of load displacement curve of pile between high strain
dynamic test and static test (after Chow, 1999).
Figure 1.6 Comparison of load distribution curve of pile between high strain
dynamic test and static test (after Chow, 1999).
Figure 1.7 Example result of stress wave matching method
Figure 1.8 Comparison of load displacement curve of pile between rapid test and
static test (after Chow, 1999).
Figure 1.9 Comparison of load distribution curve of pile between rapid test and
static test (after Chow, 1999).
Figure 2.1 (a) The pullout box and (b) the steel frame that reduced the length of
pullout box from 2 m to 1.1 m.
Figure 2.2 Cross section of pullout box.
Figure 2.3 Reflection of circularly propagated stress wave by the square pullout
box.
Figure 2.4 The displacement controlled quasi static pullout machine.
Figure 2.5 Connection between pulling arm and connection rod.
Figure 2.6 Picture of impulse hammer.
Figure 2.7 Cross section of impulse hammer.
Figure 2.8 Steps of impulse generation, (a) compression of spring ‘A’, (b)
projecting of impact ram toward spring ‘B’, (c) collision of impact ram
with spring ‘B’.
Figure 2.9 Close view of mechanical lock.
Figure 2.10 Comparison of impulse load generated by the impulse hammer with
and without ‘Polyfoam’ on the impact face of spring ‘B’.
x
Figure 2.11 Calibration result of static load cell.
Figure 2.12 Static calibration result of potentiometer ‘T’.
Figure 2.13 Dynamic calibration result of potentiometer ‘T’.
Figure 2.14 Installed strain gauge.
Figure 2.15 Setup of (a) static strain calibration test, and (b) dynamic strain
calibration test.
Figure 2.16 Static strain calibration result of nail with surface sand glued by coarse
sand, for strain gauges installed at (a) 0.25 m, and (b) 0.45 m from nail
head.
Figure 2.17 Dynamic strain calibration results for nail with surface sand glued by
coarse sand, with impulse load imposed at (a) nail head, and (b) nail
end.
Figure 2.18 Close view of (a) C surface, (b) F surface, (c) P surface and (d) U
surface.
Figure 2.19 Surface profiles of F surface measured at three random locations.
Figure 2.20 Surface profiles of P surface measured at three random locations.
Figure 2.21 Surface profiles of U surface measured at three random locations.
Figure 2.22 Particle distribution curve of coarse sand and fine sand.
Figure 2.23 Shear stress – normal stress relationship of direct shear test results.
Figure 2.24 Result of direct shear tests with dense coarse sand medium.
Figure 2.25 Comparison of direct shear test results between DCs-C test (90% Id)
and MCs-C test (82% Id).
Figure 2.26 Results of direct shear tests with dense fine sand medium.
Figure 2.27 The motion of sand hopper during sand pluviation process.
Figure 3.1 The load displacement curves of DCs-S25C test series measured at 0
m, 0.25 m and 0.45 m from nail head, (a) quasi static pullout test; (b)
quasi static reload test.
Figure 3.2 The load displacement curves of DCs-S45C test series measured at nail
head, (a) quasi static pullout test; (b) quasi static reload test.
xi
Figure 3.3 The load displacement curves of MCs-S25C test series measured at 0
m, 0.25 m and 0.45 m from nail head, (a) quasi static pullout test; (b)
quasi static reload test.
Figure 3.4 The load displacement curves of DCs-S25F test series measured at 0
m, 0.25 m and 0.45 m from nail head, (a) quasi static pullout test; (b)
quasi static reload test.
Figure 3.5 The load displacement curves of DCs-S45F test series measured at 0
m, 0.25 m and 0.45 m from nail head, (a) quasi static pullout test; (b)
quasi static reload test.
Figure 3.6 The load displacement curves of DCs-L25F test series measured at 0
m, 0.4 m, 0.8 m and 1.2 m from nail head, (a) quasi static pullout test;
(b) quasi static reload test.
Figure 3.7 The load displacement curves of DFs-S25F test series measured at 0 m,
0.25 m and 0.45 m from nail head, (a) quasi static pullout test; (b)
quasi static reload test.
Figure 3.8 The load displacement curves of DCs-S22U test series measured at nail
head, (a) quasi static pullout test; (b) quasi static reload test.
Figure 3.9 The load displacement curves of DCs-S25P test series measured at nail
head, (a) quasi static pullout test; (b) quasi static reload test.
Figure 3.10 Comparison of quasi static load displacement curves of test series with
rough nail embedded in dense coarse sand medium.
Figure 3.11 Comparison of quasi static load displacement curves of DCs-S25C test
series and MCs-S25C test series.
Figure 3.12 Load distribution curves of quasi static pullout tests on rough nail.
Figure 3.13 The relationship between ratio of friction coefficient µ at peak and nail
diameter, (a) between DCs-S25C test series and DCs-S45C test series;
and (b) between DCs-S25F test series and DCs-S45F test series.
Figure 4.1 Load displacement curves of high energy rapid pullout tests of DCs-
S25C test series measured at 0 m, 0.25 m and 0.45 m from nail head.
Figure 4.2 Load displacement curves of high energy rapid pullout tests of DCs-
S45C test series.
Figure 4.3 Load displacement curves of high energy rapid pullout tests of MCs-
S25C test series measured at 0 m, 0.25 m and 0.45 m from nail head.
Figure 4.4 Load displacement curves of high energy rapid pullout tests of DCs-
S25F test series measured at 0 m, 0.25 m and 0.45 m from nail head.
xii
Figure 4.5 Load displacement curves of high energy rapid pullout tests of DCs-
S45F test series measured at 0 m, 0.25 m and 0.45 m from nail head.
Figure 4.6 Load displacement curves of high energy rapid pullout tests of DCs-
L25F test series measured at (a) 0 m and 0.4 m from nail head, and (b)
0.8m and 1.2 m from nail head.
Figure 4.7 Load displacement curves of high energy rapid pullout tests of DFs-
S25F test series measured at 0 m, 0.25 m and 0.45 m from nail head.
Figure 4.8 Load displacement curves of high energy rapid pullout tests of DCs-
S22U test series.
Figure 4.9 Load displacement curves of high energy rapid pullout tests of DCs-
S25P test series.
Figure 4.10 The influence of inertia effect on rapid pullout response of (a) DCs-
S25C test series, (b) DCs-S25P test series, and (c) DCs-S22U test
series.
Figure 4.11 Comparisons of peak quasi static pullout strength, peak rapid pullout
strength and ‘analytical’ peak pullout strength of DCs-S25C test series,
DCs-S25F test series, DFs-S25F test series and MCs-S25C test series.
Figure 4.12 Comparison of rapid and quasi static load distribution curves of test
series on rough nails.
Figure 4.13 ‘Actual’ damping coefficient of DCs-S25C test series.
Figure 4.14 ‘Actual’ damping coefficient of DCs-S45C test series.
Figure 4.15 ‘Actual’ damping coefficient of MCs-S25C test series.
Figure 4.16 ‘Actual’ damping coefficient of DCs-S25F test series.
Figure 4.17 ‘Actual’ damping coefficient of DCs-S45F test series.
Figure 4.18 ‘Actual’ damping coefficient of DCs-L25F test series.
Figure 4.19 ‘Actual’ damping coefficient of DFs-S25F test series.
Figure 4.20 Comparison of ‘actual’ damping coefficient between DCs-S25C test
series and DCs-S25F test series.
Figure 4.21 Comparison of ‘actual’ damping coefficient between DCs-S25C test
series and MCs-S25C test series.
Figure 4.22 Comparison of ‘actual’ damping coefficient between DCs-S25F test
series and DCs-L25F test series.
xiii
Figure 4.23 Comparison of ‘actual’ damping coefficient between DCs-S25C test
series and DCs-S45C test series (normalized to 25 mm nail diameter).
Figure 4.24 Comparison of ‘actual’ damping coefficient between DCs-S25F test
series and DCs-S45F test series (normalized to 25 mm nail diameter).
Figure 4.25 Load distribution curves of residual rapid pullout strength.
Figure 4.26 Comparison of load displacement curve and velocity displacement
curve of DCs-S25C-2-RH test.
Figure 4.27 Comparison of load displacement curve and velocity displacement
curve of DCs-S45C-2-RH test.
Figure 4.28 Comparison of load displacement curve and velocity displacement
curve of MCs-S25C-2-RH test.
Figure 4.29 Comparison of load displacement curve and velocity displacement
curve of DCs-S25F-2-RH test.
Figure 4.30 Comparison of load displacement curve and velocity displacement
curve of DCs-S45F-2-RH test.
Figure 4.31 Comparison of load displacement curve and velocity displacement
curve of DCs-L25F-2-RH test.
Figure 4.32 Comparison of load displacement curve and velocity displacement
curve of DFs-S25F-2-RH test.
Figure 4.33 Shear band model by Oda and Kanzama (1998).
Figure 4.34 Postulation on shear band evolution mechanism of rough nail – sand
interface in (a) quasi static pullout test, and (b) rapid pullout test.
Figure 4.35 Comparison of quasi static reload test results conducted after the high
energy rapid pullout test and quasi static pullout test.
Figure 5.1 Load displacement curves of low energy rapid pullout test, DCs-S25C-
3-RL.
Figure 5.2 Load displacement curves of low energy rapid pullout test, DCs-S25F-
3-RL.
Figure 5.3 Load displacement curves of low energy rapid pullout test, DCs-S45F-
3-RL.
Figure 5.4 Load displacement curves of low energy rapid pullout test, DCs-L25F-
3-RL
xiv
Figure 5.5 Load displacement curves of low energy rapid pullout test, DFs-S25F-
3-RL.
Figure 5.6 ‘Actual’ damping coefficient of DCs-S25F-3-RL test.
Figure 5.7 ‘Actual’ damping coefficient of DCs-S45F-3-RL test.
Figure 5.8 ‘Actual’ damping coefficient of DCs-L25F-3-RL test.
Figure 5.9 Comparison of derived and experimental quasi static curves of DCs-
S25C test series.
Figure 5.10 Comparison of derived and experimental quasi static curves of DCs-
S25F test series.
Figure 5.11 Comparison of derived and experimental quasi static curves of DCs-
S45F test series.
Figure 5.12 Comparison of derived and experimental quasi static curves of DCs-
L25F test series.
Figure 5.13 Comparison of derived and experimental quasi static curves of DFs-
S25F test series.
Figure 6.1 Dynamic shaft resistance models proposed by (a) Smith (1960), (b)
Randolph and Simon (1986), and (c) El-Naggar and Novak (1994).
Figure 6.2 Comparison of simulated load displacement curves by multiple
element wave equation model and single element lumped mass model.
Figure 6.3 Approximation of non linear hyperbolic load displacement response by
constant stiffness matched at particular pullout stage.
Figure 6.4 Load displacement curves of DCs-S25C test series simulated by the
model with constant pre failure stiffness, compare to the experimental
results.
Figure 6.5 Damping coefficient predicted by the model with constant pre failure
stiffness, compare to the experimental ‘actual’ damping coefficient
(DCs-S25C test series).
Figure 6.6 Load displacement curves of DCs-S25C test series simulated by the
model with weaken zone hyperbolic spring, compare to the
experimental results.
Figure 6.7 Damping coefficient predicted by the model with weaken zone
hyperbolic spring, compare to the experimental results (DCs-S25C test
series).
xv
Figure 6.8 Velocity of shaft node and outer field soil medium simulated by model
with weaken zone hyperbolic spring, for DCs-S25C test series.
Figure 6.9 Load displacement response of DCs-S45C test series simulated by the
model with weaken zone hyperbolic spring, compare to the
experimental results.

xvi
List of Symbols
a Acceleration
ao Dimensionless frequency
C Damping coefficient
Cul
Damping coefficient at the unloading point.
c Damping coefficient (per unit length)
c* ‘Actual’ damping coefficient (per unit length)
d Diameter of shaft / nail
D50 Mean particle size of sand
e Void ratio
f Apparent ratio of friction coefficient
Gm Shear modulus of high strain weaken zone
Gmi
Initial shear modulus of high strain weaken zone
Gs Shear modulus of soil
Id Relative density of soil
J*
Loading rate factor
Js Smith’s damping factor
K Pullout stiffness
Ko Horizontal earth pressure at rest
Ksi Initial quasi static pullout stiffness
Ksp Secant pullout stiffness at peak of quasi static pullout response
k Stiffness coefficient of shaft resistance (per unit length)
kst Tangent stiffness of quasi static pullout response (per unit length)
L Length of pile

xvii
Le Effective nail length
M Mass of nail
Nw Wave Number
Pd Dynamic impulse load (before subtraction of inertia effect)
Pr Rapid load (after subtraction of inertia effect)
Prmax
Maximum rapid load (after subtraction of inertia effect)
Prp Peak rapid pullout strength (after subtraction of inertia effect)
Prres
Rapid residual pullout strength (after subtraction of inertia effect)
Prul
Rapid load at the unloading point (after subtraction of inertia effect)
Ps Static load
Psp Quasi static peak pullout strength
Psreload
Maximum quasi static reloading pullout strength
pd Dynamic shaft resistance (per unit length)
pd(u) Limiting dynamic shaft resistance (per unit length)
ps Static shaft resistance (per unit length)
ps(u) Limiting static shaft resistance (per unit length)
Rmax Maximum distance between highest peak and lowest through of a surface
profile within a length equal to D50 of sand in contact
Rn Normalized roughness
Rncri
Critical normalized roughness
r Radius of shaft / nail
r1 Radius of weaken zone
td Loading duration of impulse load
u Displacement
up(r)
Displacement at peak rapid pullout strength
xviii
up(s)
Displacement at peak quasi static pullout strength
uul
Displacement at the unloading point
Vp Longitudinal Wave Speed
Vs Shear wave (distortional) speed
v Velocity
vmax
Velocity at the point of maximum rapid load
αp Ratio of peak rapid pullout strength to peak quasi static pullout strength
β Correlation factor between static tangent stiffness and ‘actual’ damping
coefficient
∆e Elastic elongation of model nail.
∆v Relative velocity between shaft and adjacent soil
δ’ Interface friction angle
δ’r Rapid interface friction angle
δ’s Static interface friction angle
φ’ds Direct shear friction angle of soil
φ’ps Plane strain friction angle of soil
Λ Relative Wave Length
µ Ratio of friction coefficient
ρs Dry density of sand medium
ρg Density of sand particles
σ’n(p) Mean effective normal stress on nail shaft at peak pullout stage
σ’n(i) Initial mean effective normal stress on nail shaft
σ’v Effective vertical stress
σ’o Mean effective confining stress

xix
∆σ’ Increment of effective normal stress
τo Shear stress of soil adjacent to shaft
τf Ultimate shear stress
ω Angular frequency of loading
ψ Dilatancy angle

Chapter 1: Introduction
1.1 Problem Background
In recent years, soil nailing technique has been widely accepted by the
industry as an effective and economic reinforcement method to stabilize natural slope
or excavation face. In this technique, a number of discrete reinforcement elements are
installed near horizontally into the reinforced ground in grid pattern. The presence of
these discrete reinforcement elements essentially restrict the degree of stress relief of
the ground by holding the active zone of unstable soil wedge to the stable passive
wedge at the back (Figure 1.1).
Although there are a number of soil nail design methods available today, such
as the methods proposed by Shen et.al., (1978), Stocker et.al. (1979), Schlosser,
(1982) and Juran et.al., (1990), all of these methods emphasize the important role of
shaft resistance at nail - soil interface. The contribution of bending resistance has been
found to be fairy insignificant in common application of soil nail especially when
large lateral movement of the soil nailed structure is undesirable. Gassler (1990)
stated that the contribution of bending resistance is minimal and in second order when
compared to the role of shaft resistance, and can reasonably be ignored in the design.
The French National Research Project Clouterre (1991) also stated that although the
consideration of bending resistance may be beneficial for ductile reinforcement at
failure, its contribution is usually less than 15 % and most of the resistance is
contributed by shaft resistance. Jewell and Pedley (1992) concluded from laboratory
test that bending or shear resistance mobilized in nail is modest when compared with
that due to shaft resistance. Kenny and Kawai (1996) by finite element analysis also

arrived at the same conclusion. All of these results strengthen the importance of shaft
resistance in soil nail design.
Due to the importance of nail- soil shaft resistance, reliable assessment of
shaft resistance is crucial for a safe and economical soil nailing design. Although
design charts that correlate the limiting shaft resistance with soil types (French
National Research Project Clouterre, 1991) and analytical equilibrium equations that
calculate the limiting shaft resistance from basic soil properties and stress boundary
conditions (Schlosser, 1982, Jewell, 1980) were proposed, in-situ pullout test still
appears to be the most reliable and straightforward method to directly assess the
limiting shaft resistance of an installed nail including its load displacement
characteristic. Several soil nail design codes, such as the Euro code, the FHWA code
and the ‘Recommendations Clouterre’ (French National Research Project Clouterre,
1991) have stressed the importance of in-situ pullout test and stated that in-situ
pullout test must be conducted in every soil nailing work although the limiting shaft
resistance has been predicted by other methods. Inspection (acceptance) pullout test
must also be conducted to examine the as-constructed performance of working nails.
Table 1.1 tabulates the minimum number of in-situ pullout tests suggested by the
French National Research Project Clouterre (1991) for reliable assessment of soil nail
design parameters, depending on the area covered by each soil type. The French
National Research Project Clouterre (1991) also specifies that for each soil type and
each excavation stage, minimum 5 inspection tests shall be conducted for the first
1000 m2 of soil nailed area, and adds 1 test for every additional 200 m
2. Additional
inspection tests are also needed for suspicious working nails. Based on the
suggestions by the French National Research Project Clouterre (1991), the total
number of in-situ pullout tests required for a soil nailing site with highly

heterogeneous soil profile such as the tropical residual soil would be particularly high.
As an example, for a site consists of 3 different soil types covering 1000 m2 each, the
minimum number of in-situ pullout tests required for the assessment of soil nail
design parameters is 27 (based on Table 1.1, 9 test per 1000m2) and the minimum
number of inspection tests required for confirmation of as-constructed performance of
working nails is 15 (5 tests per 1000 m2). In total, the minimum number of in-situ
pullout tests required is as high as 42. Additional inspection tests would also be
needed if unforeseen soil condition such as localized soft soil pocket is revealed
during the installation process.
Nowadays, the only available in-situ soil nail pullout test method is quasi
static pullout test. In this method, quasi static pullout load is applied to nail head
either at constant slow displacement rate (displacement controlled test) or at constant
small load increment (force controlled test). A typical setup of quasi static pullout test
is shown in Figure 1.2. A rigid reaction frame is raised on the sloping ground to
transfer and support the pullout load exerted in the test. This reaction frame is usually
supported at four corners either by concrete pads or existing wall facing. Bearing
capacity of these supports must be sufficient enough to bear the maximum pullout
load anticipated for the test. These supports must also be placed as far as possible
from the nail to minimize the transfer of additional stresses to nail – soil interface
which will affect the pullout test result. But on the other hands these supports can not
be placed too far away from the nail to ensure the rigidity and stability of the whole
setup.
It has to be said that raising this reaction frame on sloping ground is in fact
quite tough and challenging because the slope angle of soil nailed structure is
normally very steep or even at 90o. Sometimes days will be needed to prepare the

slope surface for proper sitting of this reaction frame, especially for slope with weak
surface ground. The pullout test itself normally will take about half to one day
depending on the size of load increment or pullout rate of the test.
As has been discussed before, the total number of pullout tests needed for a
soil nailing work may be quite high especially for site with highly heterogeneous soil
profile. Therefore, the time consumed by pullout tests is sometimes impractically long.
Moreover, construction of soil nailed structure adopts top – down sequence. If the
working performance of soil nails installed for a particular excavation stage still can
not be confirmed because pending for the result of inspection tests, the excavation of
following stage shall not be on halt. Consequently, this may result in delay of
construction, or the worst causes the reduction in the number of inspection tests to
compensate the lost in time, which either is undesirable.
In view of this, idea to explore the feasibility of using dynamic pullout test as
a supplement to the conventional quasi static pullout test was recently initiated in the
National University of Singapore. It has to be stressed that dynamic pullout test is not
intended to replace the conventional quasi static pullout test which still appear to be
the most reliable and straightforward method to assess the static nail – soil shaft
resistance. Dynamic pullout test is intended to be used as a supplementary test method
that after being calibrated by equivalent quasi static pullout test results, it may be used
as part of the whole in-situ pullout test scheme, especially the inspection test. This
will reduce the number of quasi static pullout tests required, and will eventually save
the testing time (and hence construction time) while keeping the total number of
pullout tests to a reasonable number.
The application of dynamic pullout test technique to soil nail is a novel
attempt. Therefore, as the first step to the development, it is necessary to investigate
the dynamic pullout response of soil nail and the feasibility of this method by
laboratory test with well controlled test conditions before applying it to the more
expensive and complicated field trial. This forms the basis of study presented in this
thesis.
However, although the application of dynamic pullout test on soil nail is a new
attempt, dynamic testing technique has been widely applied to assess the compression
capacity of pile for the past few decades. Hence, a review on the types of dynamic
testing techniques that have been applied to pile and the experiences on behaviour of
dynamic shaft resistance of piles would be valuable. The review on types of dynamic
testing technique may help to determine the type of dynamic testing technique that
will be adopted for the newly initiated dynamic soil nail pullout test and facilitate the
design of a suitable impulse hammer to conduct the dynamic pullout test in this study.
1.2 Literature Review
In this section, the experience of dynamic testing on pile, emphasising on the
characteristics of each dynamic testing techniques and the behaviour of dynamic shaft
resistance of pile, are presented and reviewed.
1.2.1 Dynamic Testing Techniques
Nowadays, dynamic testing techniques that have been applied to pile can be
grouped into three categories, the low strain integrity test, high strain dynamic load
test and rapid test. Table 1.2 summarizes the main characteristics of these dynamic
testing techniques and compare them with the characteristics of conventional static
load test of pile (Holeyman, 1992). It has to be noted that the rapid test is termed as
kinetic test in the original paper by Holeyman (1992) but the terms ‘kinetic test’,
‘rapid test’ or the commercial name ‘Statnamic test’ all referred to the same type of
dynamic testing technique. A review on the characteristics and behaviours of these
dynamic testing techniques is given below, including the limited experiences of
utilizing the dynamic compression test result to predict the tension capacity of pile.
1.2.1.1 Low Strain Integrity Test
In low strain integrity test, the pile head is knocked by a small hand held
hammer to send a low strain impulse wave down the pile. The loading duration of this
impulse wave is relatively short, usually in the range of 0.5 ms to 2 ms only (Table
1.2). The relatively short impulse duration of this test is essential to ensure good depth
resolution of test result.
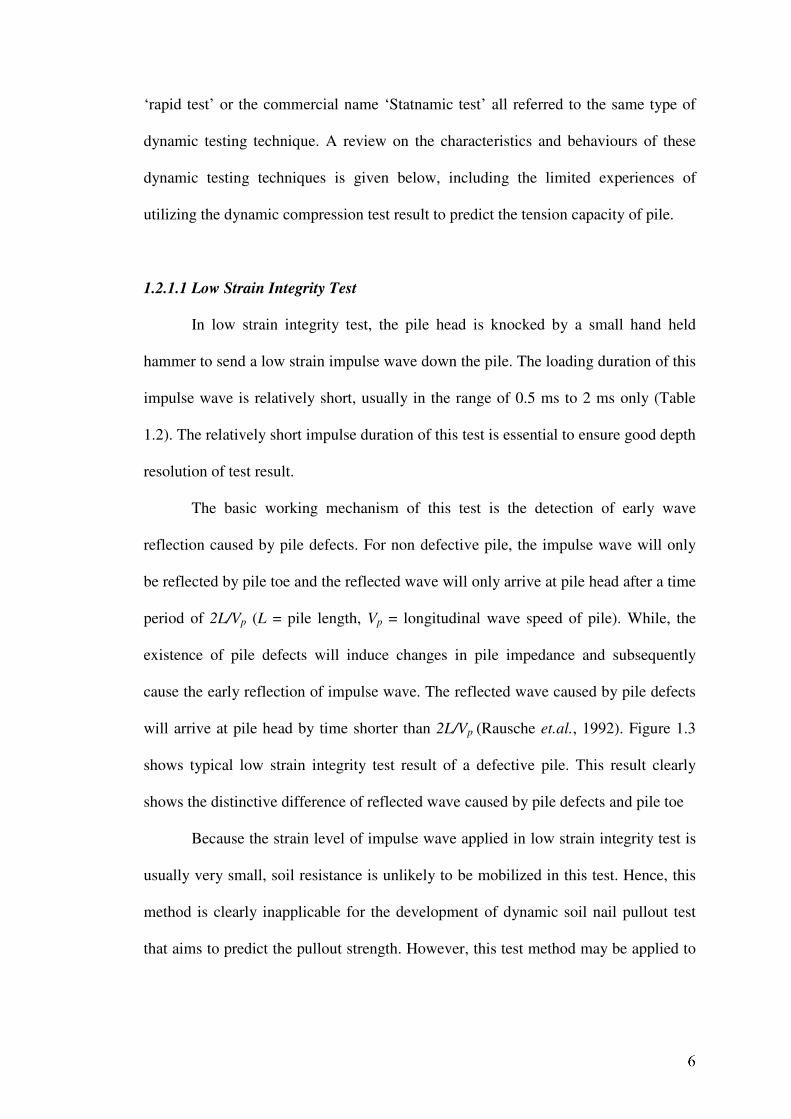
The basic working mechanism of this test is the detection of early wave
reflection caused by pile defects. For non defective pile, the impulse wave will only
be reflected by pile toe and the reflected wave will only arrive at pile head after a time
period of 2L/Vp (L = pile length, Vp = longitudinal wave speed of pile). While, the
existence of pile defects will induce changes in pile impedance and subsequently
cause the early reflection of impulse wave. The reflected wave caused by pile defects
will arrive at pile head by time shorter than 2L/Vp (Rausche et.al., 1992). Figure 1.3
shows typical low strain integrity test result of a defective pile. This result clearly
shows the distinctive difference of reflected wave caused by pile defects and pile toe
Because the strain level of impulse wave applied in low strain integrity test is
usually very small, soil resistance is unlikely to be mobilized in this test. Hence, this
method is clearly inapplicable for the development of dynamic soil nail pullout test
that aims to predict the pullout strength. However, this test method may be applied to
examine the integrity and length of installed nail. But these subjects are not the
purposes of this study.
1.2.1.2 High Strain Dynamic test
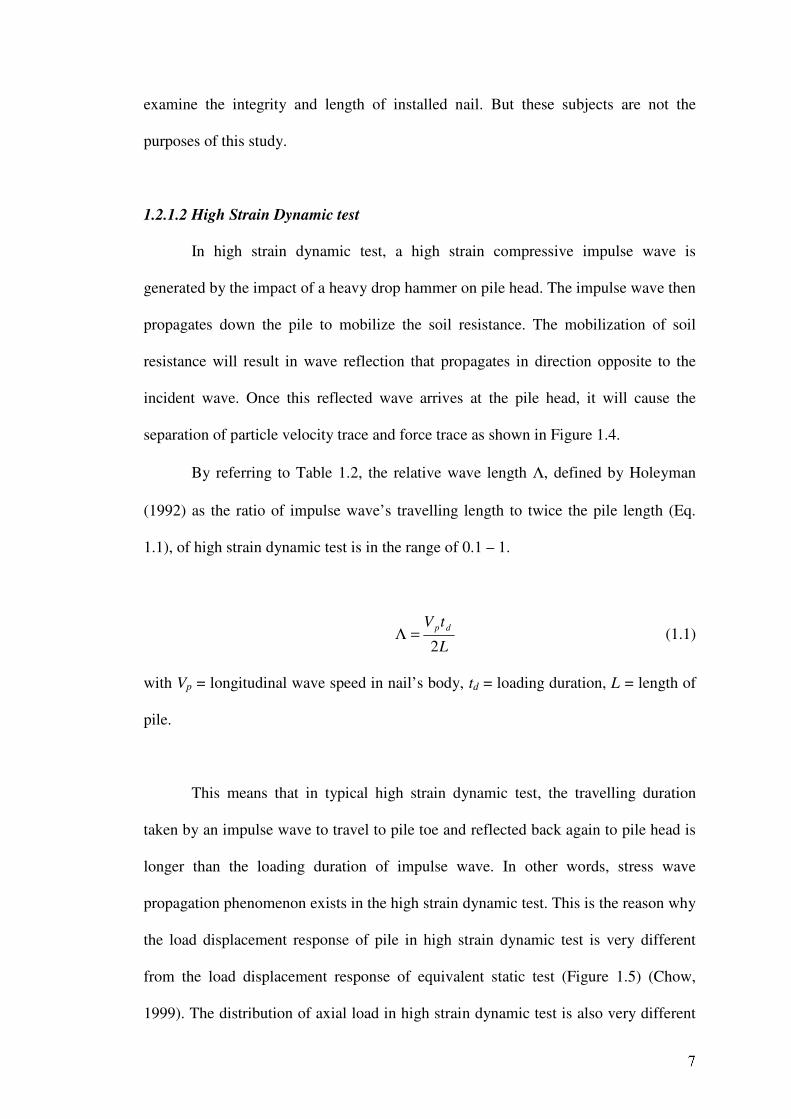
In high strain dynamic test, a high strain compressive impulse wave is
generated by the impact of a heavy drop hammer on pile head. The impulse wave then
propagates down the pile to mobilize the soil resistance. The mobilization of soil
resistance will result in wave reflection that propagates in direction opposite to the
incident wave. Once this reflected wave arrives at the pile head, it will cause the
separation of particle velocity trace and force trace as shown in Figure 1.4.
By referring to Table 1.2, the relative wave length Λ, defined by Holeyman
(1992) as the ratio of impulse wave’s travelling length to twice the pile length (Eq.
1.1), of high strain dynamic test is in the range of 0.1 – 1.
L
tV dp
2=Λ (1.1)
with Vp = longitudinal wave speed in nail’s body, td = loading duration, L = length of
pile.
This means that in typical high strain dynamic test, the travelling duration
taken by an impulse wave to travel to pile toe and reflected back again to pile head is
longer than the loading duration of impulse wave. In other words, stress wave
propagation phenomenon exists in the high strain dynamic test. This is the reason why
the load displacement response of pile in high strain dynamic test is very different
from the load displacement response of equivalent static test (Figure 1.5) (Chow,
1999). The distribution of axial load in high strain dynamic test is also very different
from that of static test (Figure 1.6). Hence, the prediction of equivalent static load
displacement response of pile from the high strain dynamic test result can only be
achieved by relatively complicated and non straightforward procedures. Nowadays,
the most popular interpretation method of high strain dynamic test result is the stress
wave matching method (Rausche et.al., 1972).
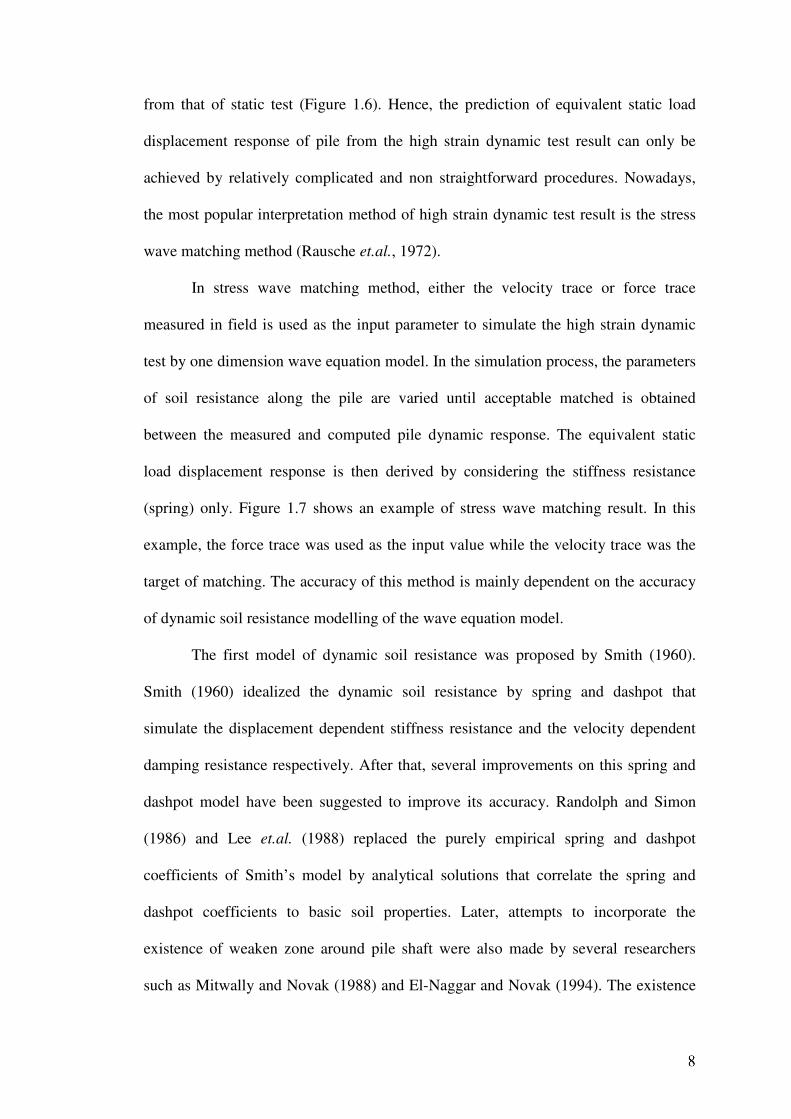
In stress wave matching method, either the velocity trace or force trace
measured in field is used as the input parameter to simulate the high strain dynamic
test by one dimension wave equation model. In the simulation process, the parameters
of soil resistance along the pile are varied until acceptable matched is obtained
between the measured and computed pile dynamic response. The equivalent static
load displacement response is then derived by considering the stiffness resistance
(spring) only. Figure 1.7 shows an example of stress wave matching result. In this
example, the force trace was used as the input value while the velocity trace was the
target of matching. The accuracy of this method is mainly dependent on the accuracy
of dynamic soil resistance modelling of the wave equation model.
The first model of dynamic soil resistance was proposed by Smith (1960).
Smith (1960) idealized the dynamic soil resistance by spring and dashpot that
simulate the displacement dependent stiffness resistance and the velocity dependent
damping resistance respectively. After that, several improvements on this spring and
dashpot model have been suggested to improve its accuracy. Randolph and Simon
(1986) and Lee et.al. (1988) replaced the purely empirical spring and dashpot
coefficients of Smith’s model by analytical solutions that correlate the spring and
dashpot coefficients to basic soil properties. Later, attempts to incorporate the
existence of weaken zone around pile shaft were also made by several researchers
such as Mitwally and Novak (1988) and El-Naggar and Novak (1994). The existence
of weaken zone around pile shaft has been identified to reduce the radiation damping
resistance (Novak and Sheta, 1980). Detailed discussions on these spring and dashpot
models for dynamic shaft resistance will be given in Chapter 6.
Despite the stress wave matching method has been widely applied since its
introduction, Poulos (1998) commented that the prediction of static pile response by
this method is just a best fit prediction obtained through trial and error procedure only.
The main disadvantage of stress wave matching technique is the non-uniqueness of its
solution, which means that different set of soil parameters may still lead to
considerable matched of the measured and computed dynamic response. Therefore,
the accuracy of this method depends a lot on the experience and knowledge of the
engineer. This disadvantage can be seen from the results of prediction activity
reported by Holeyman et.al. (2000) which showed that the percentage of variation in
ultimate pile capacity predicted by different parties from the same set of high strain
dynamic test result was as high as 100 %.
To the author’s knowledge, although high strain dynamic test technique has
been extensively applied to conduct pile dynamic compression test, only one attempt
to apply this technique on dynamic tension test is available. This attempt was reported
by Klingberg and Wong (1996). But unfortunately due to the technical limitation of
their apparatus, full mobilization of tension capacity was not achieved in their
dynamic tension test. Tension capacity predicted by their dynamic tension test was
only 46 % of tension capacity resulted from equivalent static tension test. After that,
no further attempts are reported on the application of high strain dynamic tension test
probably due to the difficulty to develop an apparatus capable of supplying sufficient
dynamic tension energy. Hence, nowadays tension capacity of pile is usually
estimated from total shaft resistance of equivalent high strain dynamic compression
test by applying a reduction factor of 0.75 - 0.8 (Randolph, 2000 and Martel and
Klingberg, 2004). This reduction factor is applied to account for the variation in
mobilization characteristic of shaft resistance between compression test and tension
test. However, this method requires accurate separation of shaft resistance from the
total compression resistance of pile. Although this can be achieved by the stress wave
matching method that models the shaft and toe resistance independently, sometimes
the outcomes is arbitrary due to the non uniqueness of stress wave matching result
(Middendorp and van Weele, 1986), particularly for the case with high shaft
resistance near to pile toe.
1.2.1.3 Rapid Test
Rapid test technique is a relatively recent development by the collaboration
works of Canada and the Netherlands (Middendorp et.al., 1992 and Bermingham
et.al,. 1994). This technique is usually known by its commercial name ‘Statnamic’
test. In some region, rapid test is also known as kinetic test.
The main characteristic of rapid test is the lengthening of impulse duration to
an extent that is sufficient to eliminate the influence of stress wave propagation
phenomenon. Holeyman (1992), Middendorp and Biefield (1995), Nishimura et.al.
(1998) and Chow (1999) suggested that the relative wave length (Eq. 1.1) of a rapid
test should exceed the minimum value of 5 - 10. This means that the impulse duration
of rapid test should be at least 5 - 10 times longer than the traveling period needed by
the impulse wave to be reflected back to pile head again. It has to be noted that the
suggestions by Middendorp and Biefield (1995), Nishimura et.al. (1998) and Chow
(1999) were reported in the form of wave number Nw which is exactly twice the value
of equivalent relative wave length.
For a commercial rapid test on pile (Statnamic test), the typical impulse
duration is in the range of 50 ms to 200 ms (Table 1.2), significantly larger than the
impulse duration used in high strain dynamic test. However, rapid test is still
considered as a category of dynamic tests because its loading duration is still
significantly shorter than that of static test.
Although in the commercial rapid test on pile (Statnamic test), the downward
compressive impulse wave is generated by the upward acceleration of a huge mass
induced by explosion, the impulse wave needed for a rapid test in fact can be
generated by any method as long as the duration of the generated impulse wave is
long enough to exceed the minimum relative wave length required to achieve the
rapid loading condition. As an example, Matsumoto et.al. (2004) has invented an
innovative rapid test method by attaching an additional soft spring and damper on pile
head. In this innovative method, the impulse wave is generated by the impact of drop
hammer on pile head similar to that in high strain dynamic test, but the duration of the
generated impulse wave was lengthen by the additional soft spring and damper to
meet the requirement of rapid loading condition. The load displacement response of
pile tested by this innovative method was shown to be similar to that of the
commercial rapid test.
Figure 1.8 plots the typical load displacement result of rapid test on pile.
When compared to the result of high strain dynamic test (Figure 1.5), it is clearly seen
that the rapid load displacement response of pile is similar to the static load
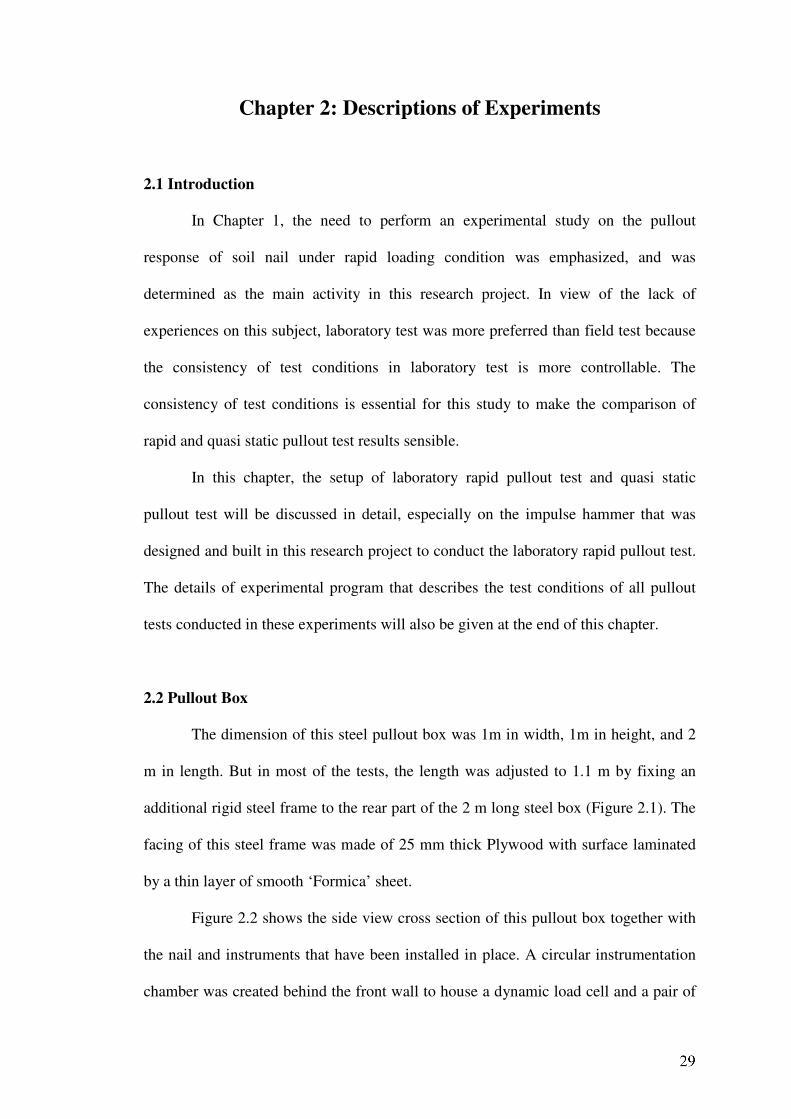
displacement response in trend. Besides, the load distribution curve of rapid test and
static test is also similar to each other in trend (Figure 1.9). These characteristics of
rapid test are the results of minimal influence of stress wave propagation in rapid test
due to longer impulse duration. These characteristics are the merits of rapid test when
compared to high strain dynamic test which is highly influenced by stress wave
propagation phenomenon. The stiffer and stronger rapid load displacement response
observed in Figure 1.8 is mainly attributed to the mobilization of damping effect
(Middendorp et.al., 1992). Besides, the unloading point, the point on rapid load
displacement curve with maximum displacement and zero velocity (Figure 1.8), is
also observed to coincide with the static load displacement curve. It is because the
damping resistance mobilized at the unloading point is negligible due to zero velocity
of this point.
The similar in trend of both rapid and static load displacement response and
the unique characteristic of the unloading point offer the possibility of deriving
equivalent static load displacement response from rapid test result with simple and
straightforward interpretation procedures, such as by the ‘Unloading Point Method’
proposed by Horvath et.al. (1995) and Kusakabe and Matsumoto (1995). In this
method, after the subtraction of inertia resistance, a constant damping coefficient Cul
is first calculated by Eq. 1.2 shown below:
max
max
v
PPC
ul
rrul −= (1.2)
with Prmax
= maximum rapid load, Prul
= rapid load at the unloading point, vmax
=
velocity at the point of maximum rapid load.
The equivalent static load displacement curve is then constructed by applying
Eq. 1.3 shown below to the measured rapid load displacement curve.
iuli
r
i
s vCPP −= (1.3)
with Psi = equivalent static load at point i, Pr
i = rapid load at point i after subtraction
of inertia effect, vi = velocity of point i.
Since the first introduction of ‘Unloading Point Method’, this method has been
widely applied to interpret the rapid pile test result and is found to usually result in
reasonably good prediction of equivalent static load displacement response. However,
the ‘Unloading Point Method’ also has its disadvantage. This method only treats the
measured rapid load displacement curve without any proper modeling of shaft and toe
resistance.
Therefore, attempts to model the rapid pile test response by spring and dashpot
model were also made. Kato et.al. (1998) and Chow (1999) proposed the use of
lumped mass models that model the shaft and toe resistance separately. In their
method, the spring and dashpot coefficients of the shaft and toe models are adjusted
until acceptable matched between simulated and measured rapid pile response is
obtained. However, the use of these lumped mass models requires the pile to behave
as rigid body and the distribution of shaft resistance along the pile shaft also needs to
be fairly uniform. Therefore, the use of one – dimensional wave equation model was
also attempted by several researchers (El Naggar and Novak, 1992, Ochiai et.al., 1996,
Asai et.al., 1997, Nishimura et.al., 1998) and has been reported to obtain reasonably
good results. The use of one dimensional wave equation model has the advantages of
being able to model the non uniform distribution of shaft resistance along the pile and
the pile does not need to behave as rigid body. However, Matsumoto et.al. (1997)
pointed out that allowance for the difference in drainage condition between rapid test
and static test must be provided for proper prediction of equivalent static load
displacement response from rapid test result. Besides, Hayashi et.al. (1998) pointed
out that back analysis of rapid pile response by wave equation model is non unique
and insensitive to the variation in distribution of shaft resistance along the pile and the
variation in proportion of contribution by toe resistance. These shortcomings are
mainly due to the nature of low depth resolution of rapid test. However, Hayashi et.al.
(1998) also stated that the uniqueness of rapid pile load test simulation can be
enhanced if measurements of axial body load along the pile are available.
The use of finite element method to interpret the rapid pile test result was also
attempted lately. The advantage of this method is more realistic modelling of
surrounding soil medium by more sophisticated soil model. Besides, the contribution
of radiation damping effect also evolves naturally in the finite element calculation
without the need of any external treatment. Horikoshi et.al. (1998) and Matsumoto
(1998) used the finite element method to simulate rapid pile test response and has
claimed to achieve reasonably good agreement. However, the use of finite element
method to back analyze the rapid pile test result is still tedious work and unpopular as
it requires much longer computational time.
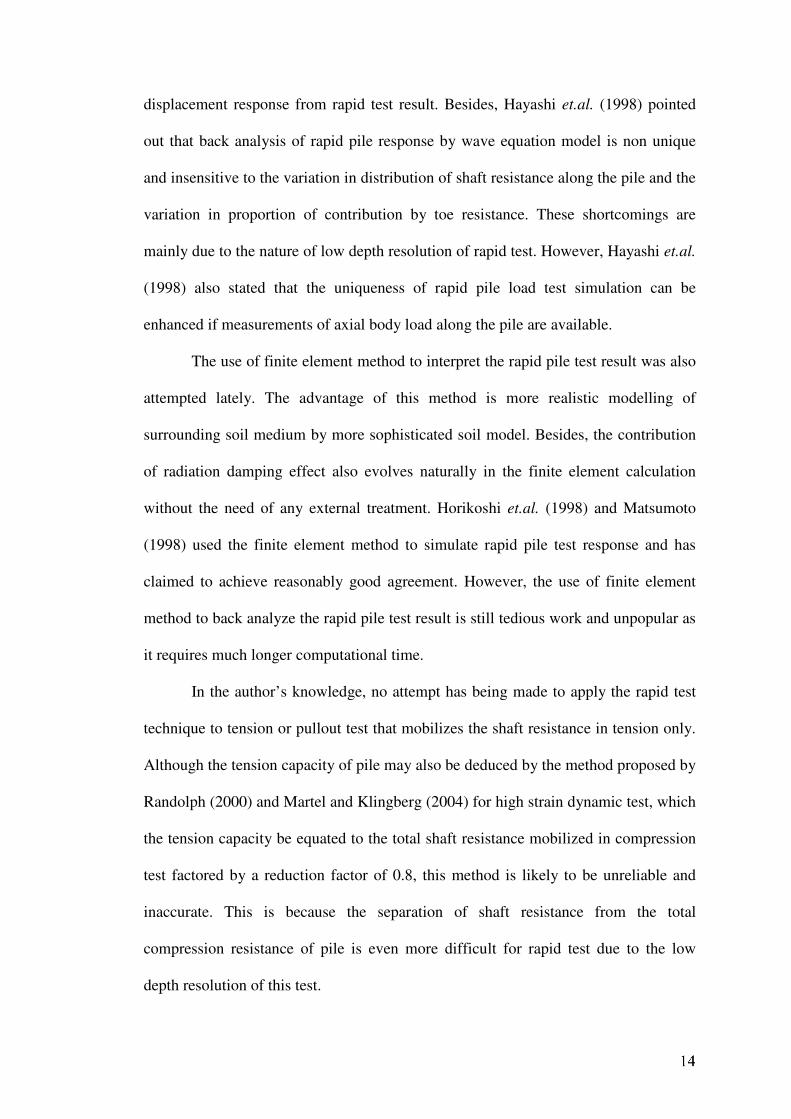
In the author’s knowledge, no attempt has being made to apply the rapid test
technique to tension or pullout test that mobilizes the shaft resistance in tension only.
Although the tension capacity of pile may also be deduced by the method proposed by
Randolph (2000) and Martel and Klingberg (2004) for high strain dynamic test, which
the tension capacity be equated to the total shaft resistance mobilized in compression
test factored by a reduction factor of 0.8, this method is likely to be unreliable and
inaccurate. This is because the separation of shaft resistance from the total
compression resistance of pile is even more difficult for rapid test due to the low
depth resolution of this test.
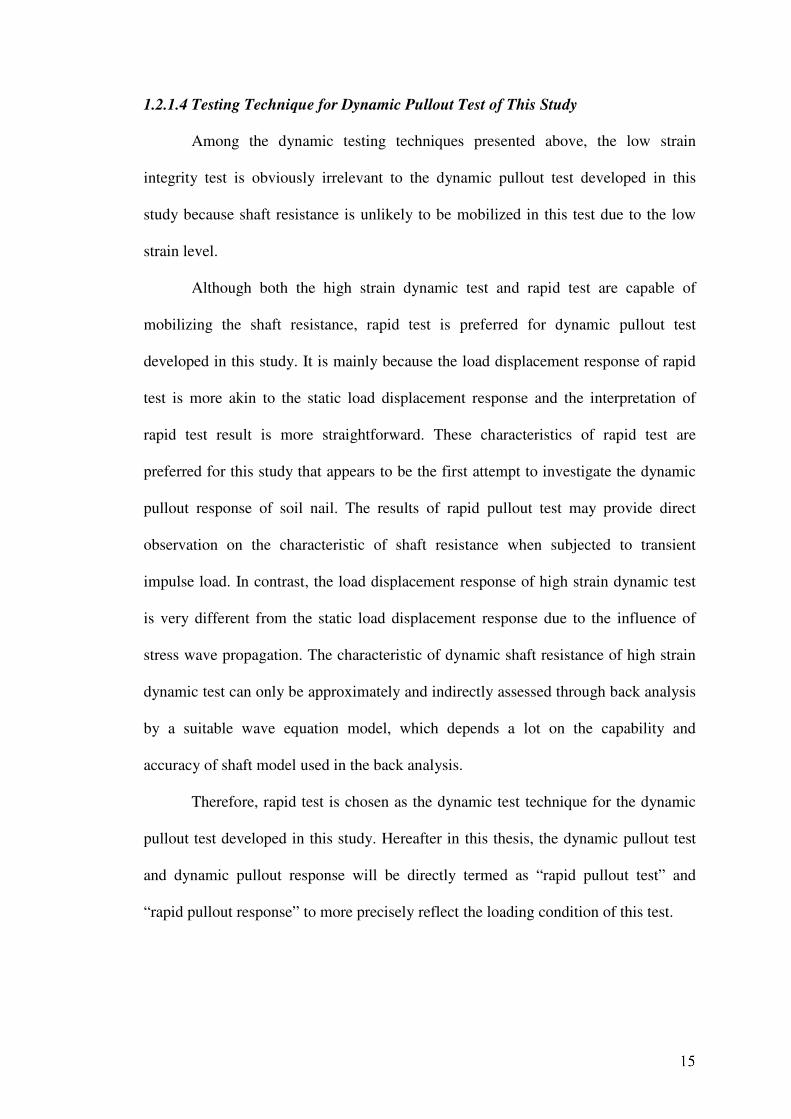
1.2.1.4 Testing Technique for Dynamic Pullout Test of This Study
Among the dynamic testing techniques presented above, the low strain
integrity test is obviously irrelevant to the dynamic pullout test developed in this
study because shaft resistance is unlikely to be mobilized in this test due to the low
strain level.
Although both the high strain dynamic test and rapid test are capable of
mobilizing the shaft resistance, rapid test is preferred for dynamic pullout test
developed in this study. It is mainly because the load displacement response of rapid
test is more akin to the static load displacement response and the interpretation of
rapid test result is more straightforward. These characteristics of rapid test are
preferred for this study that appears to be the first attempt to investigate the dynamic
pullout response of soil nail. The results of rapid pullout test may provide direct
observation on the characteristic of shaft resistance when subjected to transient
impulse load. In contrast, the load displacement response of high strain dynamic test
is very different from the static load displacement response due to the influence of
stress wave propagation. The characteristic of dynamic shaft resistance of high strain
dynamic test can only be approximately and indirectly assessed through back analysis
by a suitable wave equation model, which depends a lot on the capability and
accuracy of shaft model used in the back analysis.
Therefore, rapid test is chosen as the dynamic test technique for the dynamic
pullout test developed in this study. Hereafter in this thesis, the dynamic pullout test
and dynamic pullout response will be directly termed as “rapid pullout test” and
“rapid pullout response” to more precisely reflect the loading condition of this test.
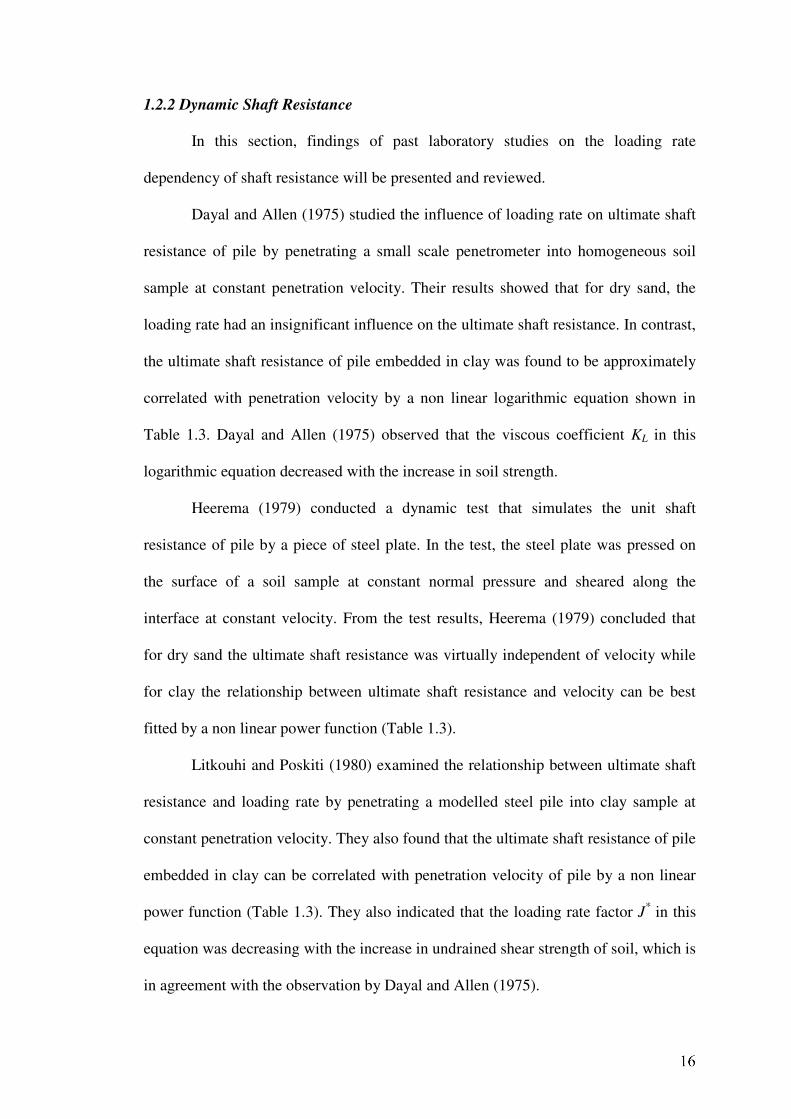
1.2.2 Dynamic Shaft Resistance
In this section, findings of past laboratory studies on the loading rate
dependency of shaft resistance will be presented and reviewed.
Dayal and Allen (1975) studied the influence of loading rate on ultimate shaft
resistance of pile by penetrating a small scale penetrometer into homogeneous soil
sample at constant penetration velocity. Their results showed that for dry sand, the
loading rate had an insignificant influence on the ultimate shaft resistance. In contrast,
the ultimate shaft resistance of pile embedded in clay was found to be approximately
correlated with penetration velocity by a non linear logarithmic equation shown in
Table 1.3. Dayal and Allen (1975) observed that the viscous coefficient KL in this
logarithmic equation decreased with the increase in soil strength.
Heerema (1979) conducted a dynamic test that simulates the unit shaft
resistance of pile by a piece of steel plate. In the test, the steel plate was pressed on
the surface of a soil sample at constant normal pressure and sheared along the
interface at constant velocity. From the test results, Heerema (1979) concluded that
for dry sand the ultimate shaft resistance was virtually independent of velocity while
for clay the relationship between ultimate shaft resistance and velocity can be best
fitted by a non linear power function (Table 1.3).
Litkouhi and Poskiti (1980) examined the relationship between ultimate shaft
resistance and loading rate by penetrating a modelled steel pile into clay sample at
constant penetration velocity. They also found that the ultimate shaft resistance of pile
embedded in clay can be correlated with penetration velocity of pile by a non linear
power function (Table 1.3). They also indicated that the loading rate factor J* in this
equation was decreasing with the increase in undrained shear strength of soil, which is
in agreement with the observation by Dayal and Allen (1975).
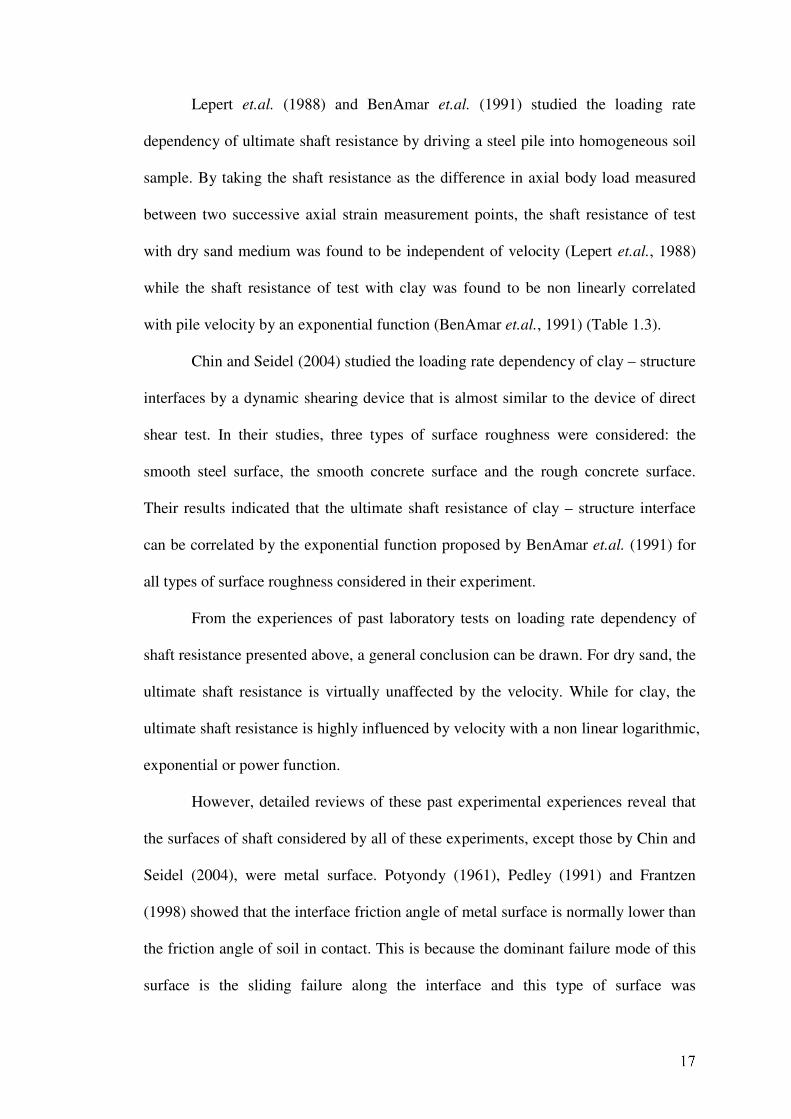
Lepert et.al. (1988) and BenAmar et.al. (1991) studied the loading rate
dependency of ultimate shaft resistance by driving a steel pile into homogeneous soil
sample. By taking the shaft resistance as the difference in axial body load measured
between two successive axial strain measurement points, the shaft resistance of test
with dry sand medium was found to be independent of velocity (Lepert et.al., 1988)
while the shaft resistance of test with clay was found to be non linearly correlated
with pile velocity by an exponential function (BenAmar et.al., 1991) (Table 1.3).
Chin and Seidel (2004) studied the loading rate dependency of clay – structure
interfaces by a dynamic shearing device that is almost similar to the device of direct
shear test. In their studies, three types of surface roughness were considered: the
smooth steel surface, the smooth concrete surface and the rough concrete surface.
Their results indicated that the ultimate shaft resistance of clay – structure interface
can be correlated by the exponential function proposed by BenAmar et.al. (1991) for
all types of surface roughness considered in their experiment.
From the experiences of past laboratory tests on loading rate dependency of
shaft resistance presented above, a general conclusion can be drawn. For dry sand, the
ultimate shaft resistance is virtually unaffected by the velocity. While for clay, the
ultimate shaft resistance is highly influenced by velocity with a non linear logarithmic,
exponential or power function.
However, detailed reviews of these past experimental experiences reveal that
the surfaces of shaft considered by all of these experiments, except those by Chin and
Seidel (2004), were metal surface. Potyondy (1961), Pedley (1991) and Frantzen
(1998) showed that the interface friction angle of metal surface is normally lower than
the friction angle of soil in contact. This is because the dominant failure mode of this
surface is the sliding failure along the interface and this type of surface was
categorized as smooth surface by Uesugi and Kishida (1986) and Hu and Pu (2004).
The behaviour of smooth surface is very different from the behaviour of rough surface.
The failure plane of rough surface is usually formed within the adjacent soil mass and
its interface friction angle is usually limited and equal to the friction angle of soil in
contact (Uesugi and Kishida, 1986). From the experience of Schlosser and Elias
(1978), Jewell (1980) and Frantzen (1998), the surface of in-situ grouted nail and
ribbed driven nail is most likely ‘the rough surface’ as the interface strength of these
nail are widely found to be identical to the shear strength of soil medium in contact.
Hence, the use of laboratory test results with smooth metal surface to predict the
loading rate dependency of these rough nails is questionable.
Although three types of surfaces were considered by Chin and Seidel (2004) in
their experiments, no clear conclusion on the influence of surface roughness on the
extent of loading rate dependency of ultimate shaft resistance was shown in their
paper. They only stated that the loading rate dependency of these surfaces was fairly
similar to each other in trend. Besides, only clay was considered in their experiments.
The possible influence of surface roughness on the loading rate dependency of rough
surface in contact with sandy soil was not reported. Moreover, the roughness
conditions of the surfaces considered in their experiments were not described
quantitatively such as by the normalized roughness Rn proposed by Uesugi and
Kishida (1986). Hence, reference to their result is quite difficult and uncertain.
Besides, all of the reviewed literature only reported the results on ultimate
shaft resistance without mentioning the influence of loading rate on load displacement
response. A good understanding of loading rate dependency on load displacement
response is important for the interpretation of rapid pullout test result because the
aims of rapid pullout test are not on the prediction of ultimate pullout capacity only
but also on the prediction of equivalent static load displacement response.
1.3 Problem Definition
Recently, rapid test has been used substantially in the pile testing industry, but
no experience on the application of this testing method to tension test that mobilizes
only the shaft resistance in tension is available. Although the tension or pullout
capacity of a geotechnical structure such as pile or soil nail may be deduced from the
equivalent rapid compression test result by taking the tension capacity as the total
shaft resistance mobilized in compression test factored by a reduction factor, the
result is arbitrary and non unique. This is mainly caused by the difficulty in accurate
separation of shaft resistance from the total pile compression resistance due to the low
depth resolution of rapid test result. Although some attempts have been made to
separate the total compression resistance of rapid compression test to shaft and toe
resistance (Hayashi et.al., 1998)), the outcomes are very dependent on the nature of
spring and dashpot model used in the back analysis. The characteristic of dynamic
shaft resistance deduced from the back analysis of rapid compression test is not a
physical measurement result but just an approximated result that depends a lot on the
nature of the shaft model. Any characteristics of dynamic shaft resistance that are
unforeseen or not considered by the shaft model will be misinterpreted or remain
undetected. Hence, rapid test in tension that enables the direct assessment of shaft
resistance is needed if good prediction of tension or pullout capacity as well as its
load displacement behaviour is targeted.
From the experimental results presented above on the loading rate dependency
of ultimate shaft resistance, it is noticed that most of these experiments were

conducted on smooth surface. It has been discussed before that the interface
behaviour of smooth surface and rough surface is far different from each other due to
the difference in mode of interface failure (Section 1.2.2). Hence, the use of these
experimental results to describe the pullout behaviour of rough nails such as the in-
situ grouted nail and ribbed driven nail is doubtful, especially for nails embedded in
sandy soil that has been shown to have negligible loading rate effect when in contact
with smooth metal surface. Moreover, the loading rate dependency of load
displacement behaviour of shaft resistance was not addressed by any of the
experimental works presented above. As a conclusion, the currently available
experimental results are still inadequate to provide confident description of the rapid
pullout behaviour of soil nail, especially for rough nails.
Besides, the influence of loading rate on restrained dilatancy effect is also
never being assessed before. Restrained dilatancy is an important mechanism that
influences the pullout capacity of rough soil nail embedded in dense dilative soil
(Schlosser, 1982). In the mobilization of dilative interfacial shaft resistance, soil
adjacent to shaft (within weaken zone) tends to dilate but this dilation tendency is
restrained by the surrounding relatively undisturbed soil medium. As a consequence,
additional circumferential compression pressure is induced by the surrounding soil
medium to elastically compress the weaken zone to compensate the plastic dilation
tendency. This additional compression pressure will then be transferred to the nail –
soil interface as an enhancement in normal stress, and finally increase the interfacial
shaft resistance. Restrained dilatancy effect is an important characteristic that must
also be mobilized in rapid pullout test if the rapid pullout test result is to be applied
for the prediction of equivalent quasi static pullout response. Detailed discussions on
restrained dilatancy effect will be given in Section 3.5 of Chapter 3.

1.4 Objectives and Scope
In view of the inadequacy of knowledge of rapid pullout response, a series of
large scale laboratory tests were conducted in this study to provide high quality data
for the physical observation on the rapid pullout response of soil nail and to compare
it with the corresponding quasi static pullout response.
The objectives of these experiments were:
• To investigate the pullout response of soil nail including its load displacement
characteristics under rapid loading condition. The influence of loading rate is
assessed by comparing the rapid pullout test results to the corresponding quasi
static pullout test results under the same test conditions.
• To examine the influence of surface roughness, nail diameter and effective
nail length on rapid pullout response of soil nail.
• To assess the mobilization characteristic of radiation damping effect in a rapid
pullout test.
• To evaluate the loading rate dependency of restrained dilatancy effect which is
an important mechanism that influences the pullout capacity of soil nail.
• To explore the potential of rapid pullout test as an alternative method to assess
the quasi static pullout response of soil nail.
• To evaluate the quasi static pullout response of soil nail after the conduct of
preceding rapid pullout test. This is important for the assessment of the
potential of rapid pullout test as an inspection test method that shall not
adversely affect the working performance of tested nail.
In these experiments, only dry sand medium was considered. The main reason
for this is to avoid the influence of viscous damping effect in order to focus the
investigations on radiation damping effect and loading rate effect only.
Besides, to avoid the random error of test conditions caused by the installation
of soil nail, pre buried nail installed in-place before the construction of soil medium
was used for all tests. The consistency of test conditions among tests is crucial for
these experiments to make the comparison of rapid and quasi static pullout results
sensible. Moreover, only nails installed horizontally were considered.
The findings of this study may serve as a basis for the development of a field
scale in-situ rapid pullout test capable of predicting the quasi static pullout behaviour
of soil nail. It needs to be stressed that this study only aims to investigate the
feasibility of rapid pullout test from a geotechnical perspective.
The author has to admit that currently the economical competitiveness of field
scale rapid pullout test still can not be assessed. It is because the cost of a field scale
rapid pullout test depends a lot on the mechanism and system applied, which are both
still an unknown. The laboratory scale apparatus used in these experiments may not
be applied to field scale test because of the large difference in impact energy needed.
It has to be said that the apparatus for field scale rapid pullout test is much
complicated and requires large input from mechanical engineering specialist.
However, due to the time saving in rapid pullout test, it is believed that the ‘final cost’
of a rapid pullout test will be lower than a quasi static pullout test.
Tab
le 1
.1:
Su
gges
tio
n o
n t
he
min
imum
num
ber
of
in-s
itu p
ull
out
test
s re
quir
ed f
or
asse
ssm
ent
of
soil
nai
l des
ign p
aram
eter
s, b
y t
he
Fre
nch
Nat
ional
Res
earc
h P
roje
ct C
loute
rre
(199
1).
m2 o
f ar
ea
No.
m2 o
f ar
ea
No.
Up t
o 8
00
6
4000 t
o 8
000
15
800 t
o 2
000
9
8000 t
o 1
6000
18
2000 t
o 4
000
12
16000 t
o 4
0000
25
Tab
le 1
.2:
Ch
arac
teri
stic
s o
f d
iffe
ren
t pil
e te
stin
g m
ethods
(aft
er H
ole
yman
, 1992).
L
ow
Str
ain
In
tegri
ty
Tes
t
Hig
h S
train
Dyn
am
ic
Tes
t R
ap
id T
est
Sta
tic
test
Mas
s of
Ham
mer
0.5
– 5
kg
2000 -
10000 k
g
2000 -
5000 k
g
N/A
Pil
e P
eak
Str
ain
2 -
10 µ
str
500 -
1000 µ
str
1000 µ
str
1000 µ
str
Pil
e pea
k V
elo
city
1
0 –
40 m
m/s
2000 -
4000 m
m/s
500 m
m/s
10
-3 m
m/s
Pea
k F
orc
e 2
– 2
0 k
N
2000 -
10000 k
N
2000 –
10000 k
N
2000 –
10000 k
N
Forc
e D
ura
tio
n
0.5
– 2
ms
5 –
20 m
s 50 –
200 m
s 10
7 m
s
Pil
e A
ccel
erat
ion
50 g
500 g
0.5
– 1
g
10
-14
g
Pil
e D
isp
lace
men
t 0.0
1 m
m
10-
30 m
m
50 m
m
> 2
0 m
m
Rel
ativ
e W
ave
Len
gth
Λ #
0.1
1.0
10
10
8
# Λ
= t
dV
p/2
L, w
ith
, t d
= l
oad
ing d
ura
tion, V
p =
longit
udin
al w
ave
spee
d o
f pil
e, a
nd L
= p
ile
len
gth
T
able
1.3
: T
he
rela
tio
nsh
ip b
etw
een d
ynam
ic a
nd s
tati
c sh
aft
resi
stan
ce i
n c
onta
ct w
ith c
lay.
Ori
gin
ato
r R
elati
on
ship
bet
wee
n D
yn
am
ic a
nd
Sta
tic
Sh
aft
Res
ista
nce
Dayal
& A
llen
(1
97
5)
(
)s
Lc
cDV
VK
/lo
g1
/+
=
qcD
=
unit
dynam
ic c
on
e re
sist
ance
qc
=
unit
dynam
ic c
on
e re
sist
ance
at
low
est
pen
etra
tion r
ate
Vs
=
low
est
pen
etra
tion v
elo
city
(1.3
mm
/s)
KL
=
Vis
cous
coef
fici
ent
Hee
rem
a (1
97
9)
2.0
32
Va
a+
=τ
a 2 &
a3 =
const
ants
whic
h d
epen
d u
pon t
he
shea
r st
ren
gth
Lit
ko
uh
u &
Po
skit
i (1
98
0)
()
N
sd
JVR
R+
=1
Rd
=
Dyn
amic
soil
res
ista
nce
Rs
=
Sta
tic
soil
res
ista
nce
J =
V
isco
us
fact
or
Ben
Am
ar e
t.a
l. (
19
91
)
and
Ch
in &
Sei
del
(2
00
4)
()
V
sd
eR
Rβ
α−
=1
/
Rd/R
s =
D
yn
amic
to s
tati
c st
ren
gth
rat
io
α &
β
=
Em
pir
ical
corr
elat
ion c
on
stan
t
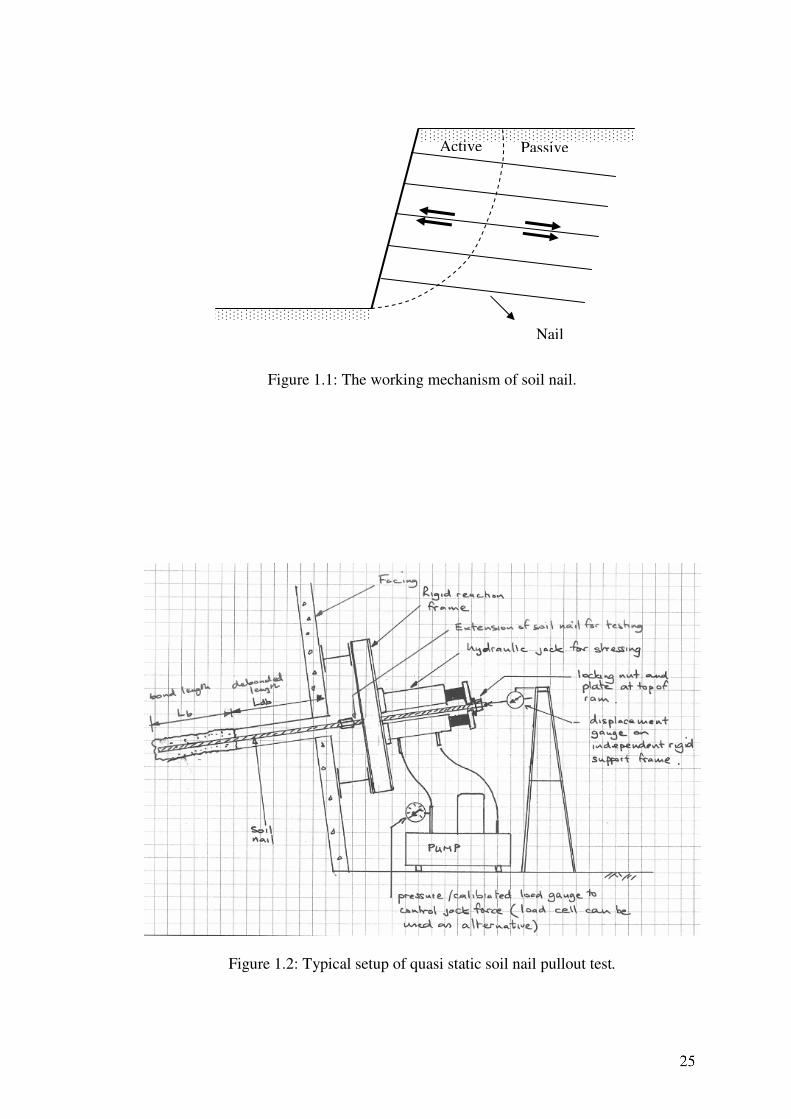
Figure 1.1: The working mechanism of soil nail.
Figure 1.2: Typical setup of quasi static soil nail pullout test.
Passive Active
Nail
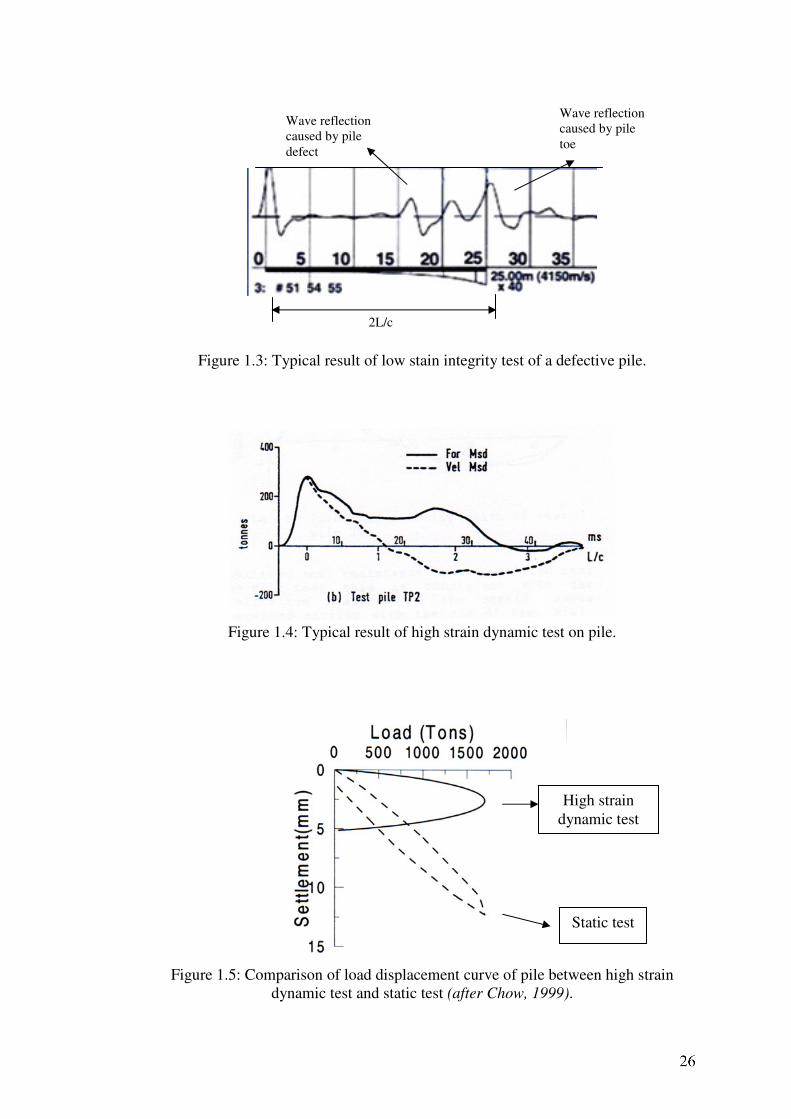
Figure 1.3: Typical result of low stain integrity test of a defective pile.
Figure 1.4: Typical result of high strain dynamic test on pile.
Figure 1.5: Comparison of load displacement curve of pile between high strain
dynamic test and static test (after Chow, 1999).
High strain
dynamic test
Static test
Wave reflection
caused by pile
toe
Wave reflection
caused by pile
defect
2L/c
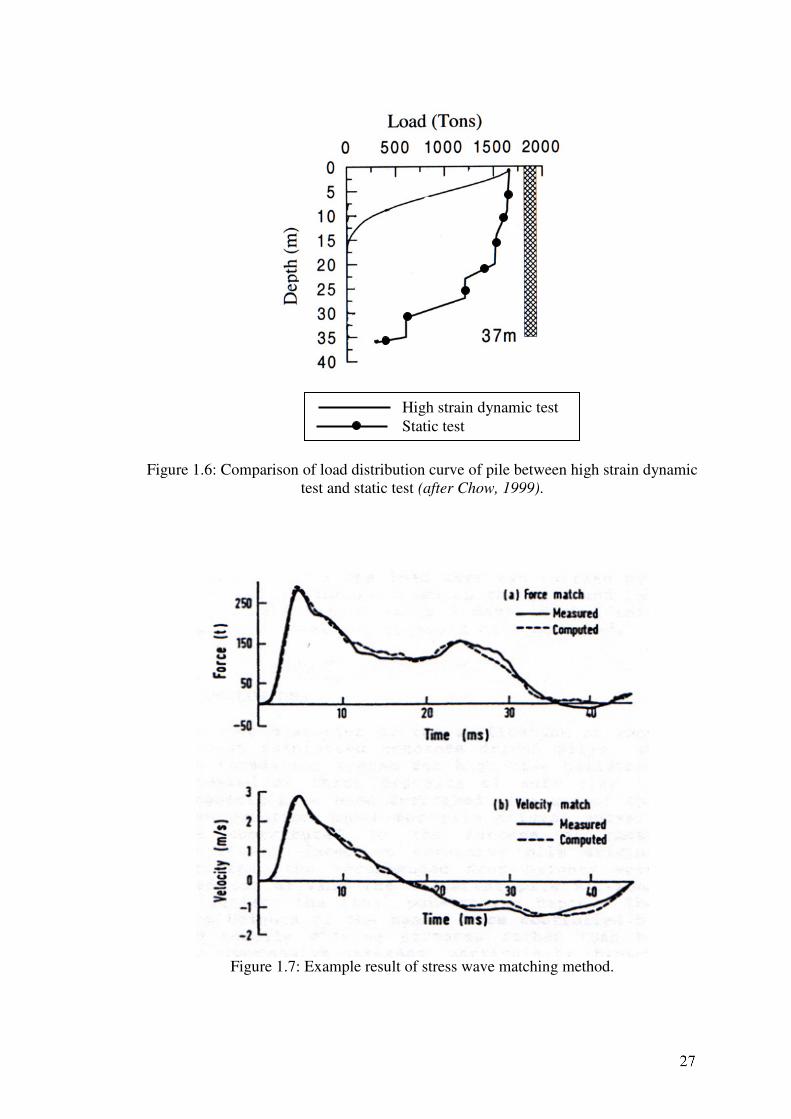
Figure 1.6: Comparison of load distribution curve of pile between high strain dynamic
test and static test (after Chow, 1999).
Figure 1.7: Example result of stress wave matching method.
High strain dynamic test
Static test
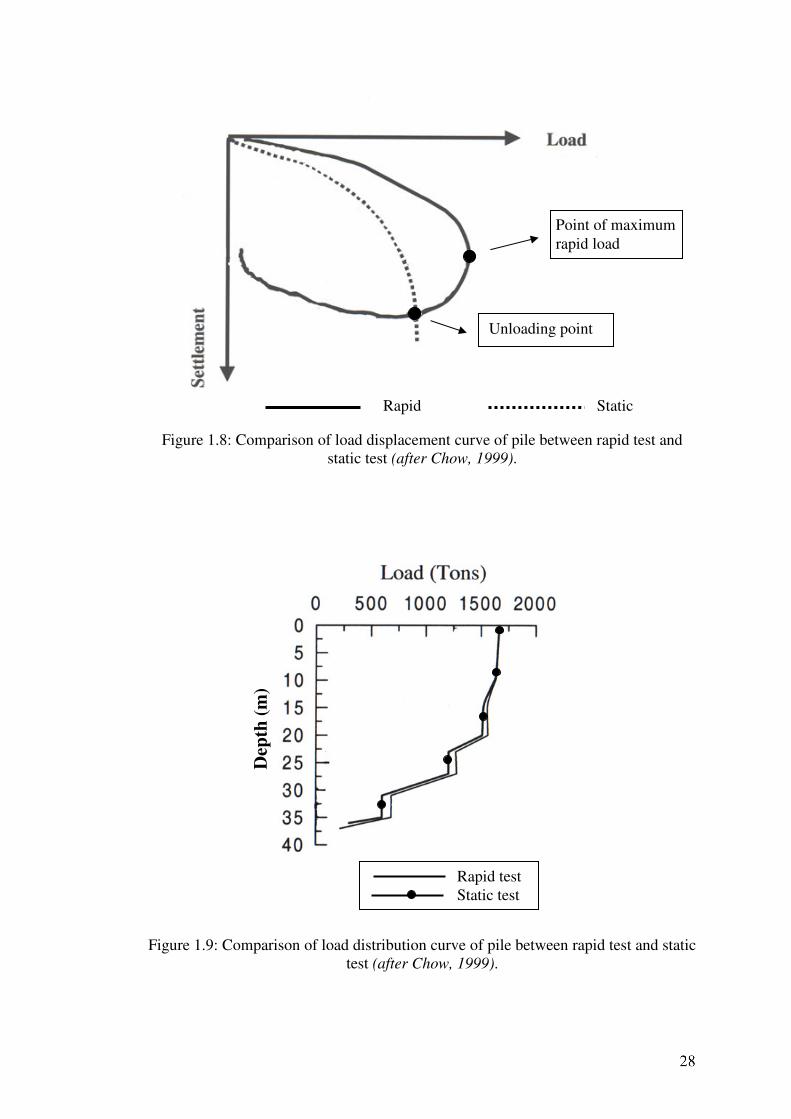
Figure 1.8: Comparison of load displacement curve of pile between rapid test and
static test (after Chow, 1999).
Figure 1.9: Comparison of load distribution curve of pile between rapid test and static
test (after Chow, 1999).
Unloading point
Rapid test
Static test
Point of maximum
rapid load
Rapid Static
Dep
th (
m)
Chapter 2: Descriptions of Experiments
2.1 Introduction
In Chapter 1, the need to perform an experimental study on the pullout
response of soil nail under rapid loading condition was emphasized, and was
determined as the main activity in this research project. In view of the lack of
experiences on this subject, laboratory test was more preferred than field test because
the consistency of test conditions in laboratory test is more controllable. The
consistency of test conditions is essential for this study to make the comparison of
rapid and quasi static pullout test results sensible.
In this chapter, the setup of laboratory rapid pullout test and quasi static
pullout test will be discussed in detail, especially on the impulse hammer that was
designed and built in this research project to conduct the laboratory rapid pullout test.
The details of experimental program that describes the test conditions of all pullout
tests conducted in these experiments will also be given at the end of this chapter.
2.2 Pullout Box
The dimension of this steel pullout box was 1m in width, 1m in height, and 2
m in length. But in most of the tests, the length was adjusted to 1.1 m by fixing an
additional rigid steel frame to the rear part of the 2 m long steel box (Figure 2.1). The
facing of this steel frame was made of 25 mm thick Plywood with surface laminated
by a thin layer of smooth ‘Formica’ sheet.
Figure 2.2 shows the side view cross section of this pullout box together with
the nail and instruments that have been installed in place. A circular instrumentation
chamber was created behind the front wall to house a dynamic load cell and a pair of
linear motion potentiometers (Figure 2.2). These instruments were located in this
manner because the measurement of impulse load and pullout displacement should be
taken as close as possible to the nail head to minimize the error caused by inertia
effect or elongation of any connection parts existed in between the nail head and the
energy source.
To eliminate the adverse influence of rigid front wall, a 100 mm long sleeve
was attached to the end of instrumentation chamber as shown in Figure 2.2. The inner
diameter of this sleeve was chosen to be at least 15 mm larger than the outer diameter
of soil nail. The use of sleeve to eliminate the influence of rigid front wall was
illustrated by Palmeira and Milligan (1989) and has been widely applied to pullout
tests of Geogrid and soil nail by Farrag et.al. (1993), Franzen (1998), Chang et.al.,
(2000) and etc. The effectiveness of this 100 mm long sleeve in eliminating the rigid
front wall effect of these experiments will be shown later in Chapter 3 by the results
of quasi static pullout tests.
With the maximum outer diameter of nails considered in these experiments as
45 mm, the rigid side wall of this pullout box was at least 11 times of nail diameter
away from the nail center. This distance should be sufficient to avoid the boundary
side wall effect. This is supported by the experience of Ekstrom (1989) on driven pile
test which indicated the influence of stress distribution only reached about 5 times of
pile diameter from the pile center.
In the event of rapid pullout test, consideration should also be given to the
reflection of shear wave by the rigid side wall. By taking the small strain shear wave
velocity of sand medium used in these experiments as 100 m/s - 110 m/s (Table 2.3),
time period required for a shear wave to travel across the 0.5 m thick of sand medium
and reflected back again to the nail is round 9 ms – 10 ms. This time period is smaller
than the loading duration of impulse load applied to rapid pullout tests of these
experiments, which is typically in the range of 25 ms - 30 ms. This comparison seems
to suggest the inevitable influence of shear wave reflection. However, due to the
difference between the pattern of shear wave propagation (circularly away from the
nail) and the square shape of pullout box (Figure 2.3), most of the shear wave would
not hit the rigid side wall at right angle. Thus, it is postulated that most of the
reflected waves would not be directly reflected back to the nail, but will be reflected
at direction further away from the nail (Figure 2.3). As a result, the intensity of
reflected waves that travel back to the nail would be greatly reduced. The
effectiveness of square container in dispersing and minimizing the reflection of
circularly propagated stress wave was also observed by Lenke et.al. (1991) in their
centrifuge tests.
2.3 Quasi static pullout machine
The quasi static pullout tests of these experiments were performed by the slow
speed displacement controlled pullout machine shown in Figure 2.4. Throughout the
experiments, the pullout rate was fixed at 0.006 mm/s, the lowest pullout rate
achievable by this machine.
The pulling arm of this pullout machine was connected to the end of
connection rod (and hence the nail since another end of this connection rod was
connected to nail head) by an adapter shown in Figure 2.5. A static load cell was
installed in between the pulling arm and the connection rod to measure the quasi static
pullout load. In rapid pullout test, this connection was detached.
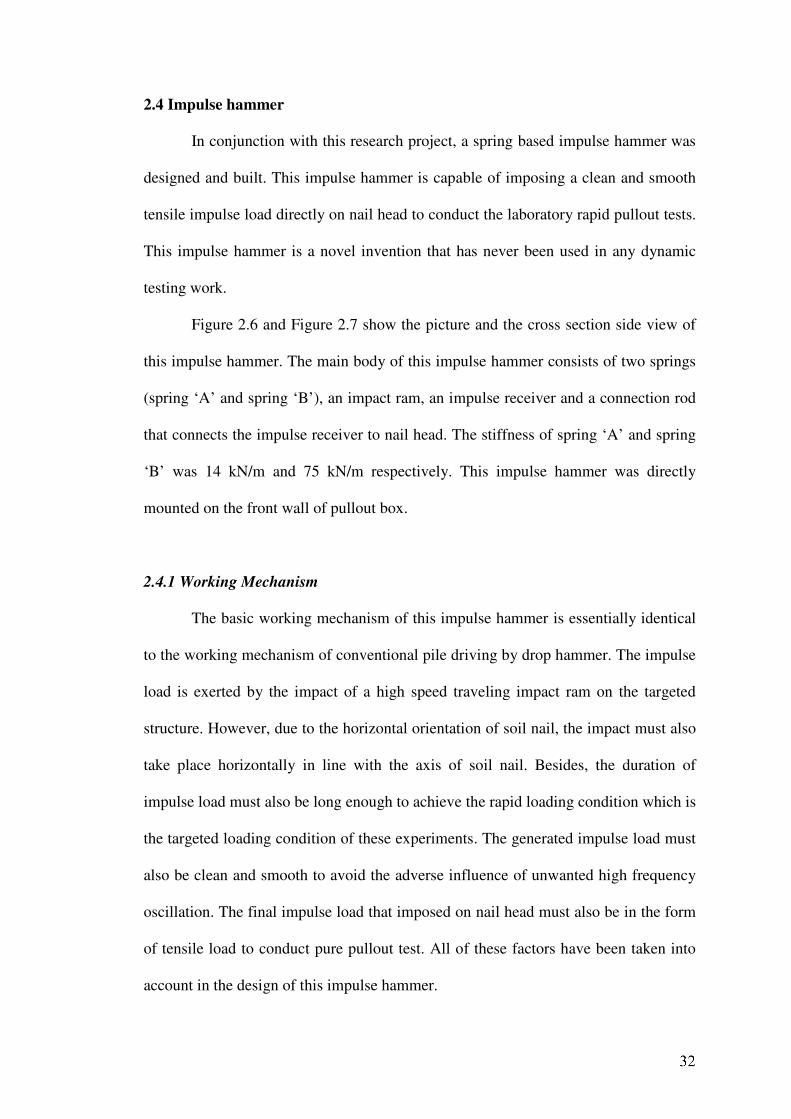
2.4 Impulse hammer
In conjunction with this research project, a spring based impulse hammer was
designed and built. This impulse hammer is capable of imposing a clean and smooth
tensile impulse load directly on nail head to conduct the laboratory rapid pullout tests.
This impulse hammer is a novel invention that has never been used in any dynamic
testing work.
Figure 2.6 and Figure 2.7 show the picture and the cross section side view of
this impulse hammer. The main body of this impulse hammer consists of two springs
(spring ‘A’ and spring ‘B’), an impact ram, an impulse receiver and a connection rod
that connects the impulse receiver to nail head. The stiffness of spring ‘A’ and spring
‘B’ was 14 kN/m and 75 kN/m respectively. This impulse hammer was directly
mounted on the front wall of pullout box.
2.4.1 Working Mechanism
The basic working mechanism of this impulse hammer is essentially identical
to the working mechanism of conventional pile driving by drop hammer. The impulse
load is exerted by the impact of a high speed traveling impact ram on the targeted
structure. However, due to the horizontal orientation of soil nail, the impact must also
take place horizontally in line with the axis of soil nail. Besides, the duration of
impulse load must also be long enough to achieve the rapid loading condition which is
the targeted loading condition of these experiments. The generated impulse load must
also be clean and smooth to avoid the adverse influence of unwanted high frequency
oscillation. The final impulse load that imposed on nail head must also be in the form
of tensile load to conduct pure pullout test. All of these factors have been taken into
account in the design of this impulse hammer.
To conduct a rapid pullout test by this impulse hammer, the required impulse
energy is first generated in the form of spring potential energy by compressing the
impact ram against spring ‘A’ as shown in Figure 2.8a. The impact ram is then locked
in position by a pair of mechanical locks, the clip - like components mounted on both
sides of this impulse hammer (Figure 2.6). Figure 2.9 shows close-up view of a
mechanical lock together with its mounting bar. Multiple mounting holes were
fabricated along the mounting bar to allow for adjustment of mechanical lock’s
location so that the level of potential energy stored in spring ‘A’ can be easily
adjusted according to the level of energy required by a particular rapid pullout test.
In the execution of rapid pullout test, the impact ram is released by simply
pressing the lever arm of the mechanical locks. The potential energy of spring ‘A’ is
then converted into kinetic energy and projecting the impact ram toward spring ‘B’
(Figure 2.8b). The movement of impact ram was guided by six guide rods as shown in
Figure 2.6 and Figure 2.7. To minimize the dissipation of kinetic energy through
frictional resistance between the moving impact ram and guide rods, the contacts sat
on bearing balls.
Subsequently, the impact ram collides with spring ‘B’ to generate a impulse
load (Figure 2.8c). The generated impulse load is then transferred to nail head in the
form of tensile load through the connection rod that runs through the hollow center of
this impulse hammer and connects the impulse receiver to nail head (Figure 2.7). In
the design of this impulse hammer, the spring ‘B’ was designed to function as a
‘cushion’ that reduces the peak impulse load and elongate the impulse duration. The
use of spring as a ‘cushion’ to reduce the peak impulse load and elongate the impulse
duration has been tried and proved workable by Matsumoto et.al. (2004) with their
newly invented innovative rapid pile load test method.
However, as can be seen from Figure 2.10, the impulse load generated by this
impulse hammer with spring ‘B’ only suffered from low amplitude oscillation with
frequency that is obviously higher than the frequency of generated impulse load. This
oscillation was probably caused by the ‘hard’ impact that took place in between the
steel impact ram and the steel front cap of spring ‘B’. This oscillation can be
eliminated by attaching a 5 mm thick ‘Polyfoam’ sheet to the front cap of spring ‘B’,
as shown by the smooth resulting impulse load shown in Figure 2.10.
The end cap of spring ‘B’ was designed to just ‘touch’ the impulse receiver
without any mechanical joint. With this design, the propagation of compressive load
from the end of spring ‘B’ to impulse receiver is allowed but any existence of tensile
load will automatically detach this contact. The main purpose of this design is to
minimize the influence of recoil by spring ‘B’. The connection between impulse
receiver and connection rod was designed as the ‘bolt and nut’ connection to make it
perfectly tight. A ‘loose’ connection tends to vibrate in an impact event and may
cause unwanted oscillation on the resulting impulse load.
From Figure 2.7, it is seen that the end of connection rod protrudes
approximately 20 mm from the face of impulse receiver. The time period for a
longitudinal wave to travel from the impulse receiver to this end and reflected back
again is only 6 µs (with longitudinal wave speed in steel as 5000 m/s). This time
period is much shorter than the typical loading duration of impulse load considered in
these experiments, which was around 25 ms – 30 ms. therefore, the reflection of
longitudinal wave by the end of connection rod should not cause significant influence
on the characteristic of tensile impulse load transferred to nail head.
2.4.2 The Characteristic of Impulse Load
The traces of impulse loads that were generated by this impulse hammer in
these experiments are plotted in Appendix A and Appendix B. From these plots, it can
be seen that the characteristic of these impulse loads were approximately the same.
The loading duration of this impulse was around 27 ms, with approximately 8 ms of
rise time and 19 ms of fall time. Although these parameters slightly differ from test to
test, the differences were marginal. The dominant loading frequency was found as
approximately 35 Hz by Fast Fourier Transform (FFT) analysis. The level of peak
impulse load was mainly determined by the level of spring potential energy stored in
spring ‘A’ (and hence the compressed length of spring ‘A’) before test.
With the typical loading duration of impulse loads applied to these
experiments as 27 ms, the corresponding relative wave length defined by Eq. 1.1 for
rapid pullout tests with 0.75 m and 1.65 m of effective nail length was 90 and 41
respectively (with compression wave speed vp of steel nail = 5000 m/s). These relative
wave lengths are significantly larger than the lower boundary value of 10 proposed by
Holeyman (1992) for the validity of rapid loading condition. Therefore, it is
reasonable to say rapid loading condition with minimal influence of stress wave
propagation was achieved by all rapid pullout tests of these experiments.
2.5 Instrumentations
2.5.1 Load cell
The static load cell was a strain gauge based load cell, INTERFACE SML
series, with 100 Ibf (approximately 2200 N) of tension capacity. The calibration factor
of this load cell was deduced by loading this load cell in tension with dead weight.
The calibration result is shown in Figure 2.11.
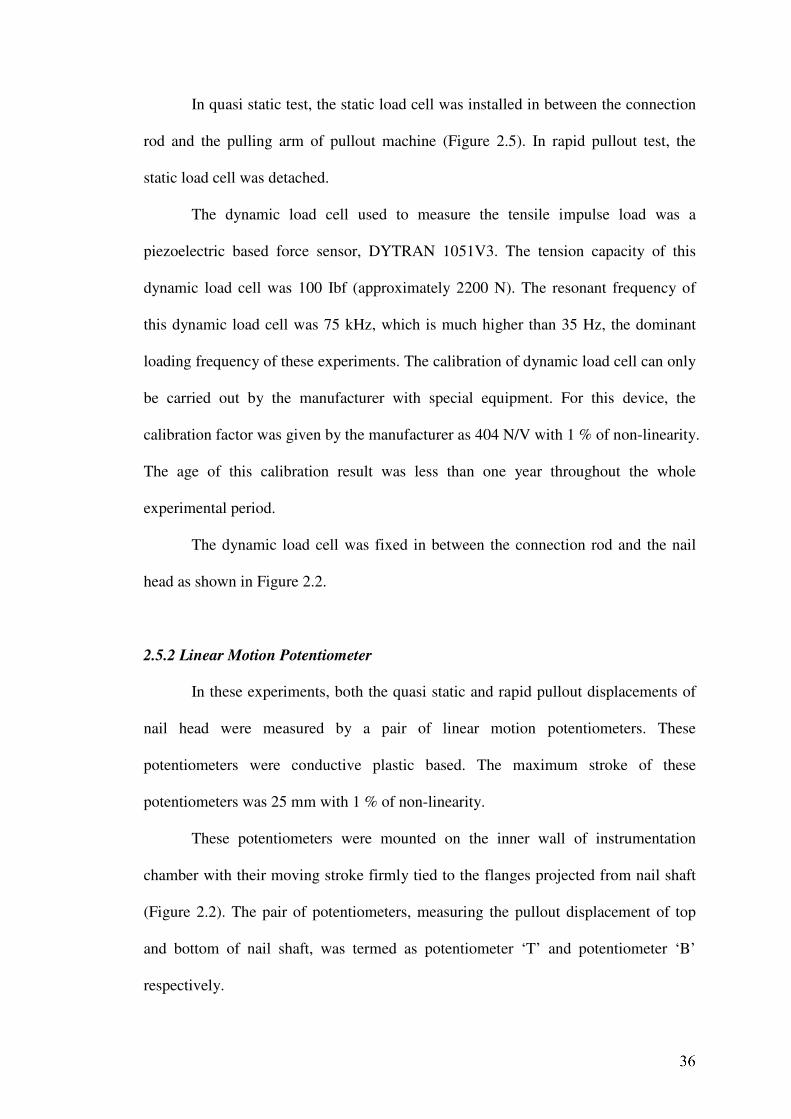
In quasi static test, the static load cell was installed in between the connection
rod and the pulling arm of pullout machine (Figure 2.5). In rapid pullout test, the
static load cell was detached.
The dynamic load cell used to measure the tensile impulse load was a
piezoelectric based force sensor, DYTRAN 1051V3. The tension capacity of this
dynamic load cell was 100 Ibf (approximately 2200 N). The resonant frequency of
this dynamic load cell was 75 kHz, which is much higher than 35 Hz, the dominant
loading frequency of these experiments. The calibration of dynamic load cell can only
be carried out by the manufacturer with special equipment. For this device, the
calibration factor was given by the manufacturer as 404 N/V with 1 % of non-linearity.
The age of this calibration result was less than one year throughout the whole
experimental period.
The dynamic load cell was fixed in between the connection rod and the nail
head as shown in Figure 2.2.
2.5.2 Linear Motion Potentiometer
In these experiments, both the quasi static and rapid pullout displacements of
nail head were measured by a pair of linear motion potentiometers. These
potentiometers were conductive plastic based. The maximum stroke of these
potentiometers was 25 mm with 1 % of non-linearity.
These potentiometers were mounted on the inner wall of instrumentation
chamber with their moving stroke firmly tied to the flanges projected from nail shaft
(Figure 2.2). The pair of potentiometers, measuring the pullout displacement of top
and bottom of nail shaft, was termed as potentiometer ‘T’ and potentiometer ‘B’
respectively.
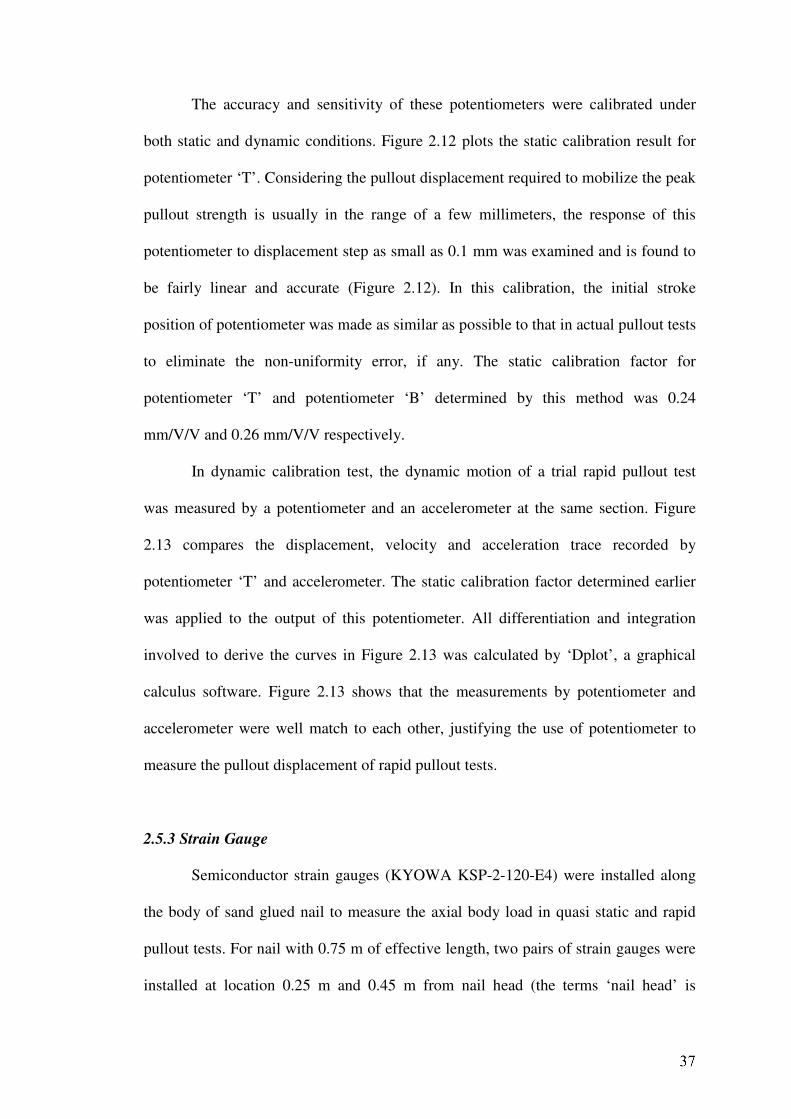
The accuracy and sensitivity of these potentiometers were calibrated under
both static and dynamic conditions. Figure 2.12 plots the static calibration result for
potentiometer ‘T’. Considering the pullout displacement required to mobilize the peak
pullout strength is usually in the range of a few millimeters, the response of this
potentiometer to displacement step as small as 0.1 mm was examined and is found to
be fairly linear and accurate (Figure 2.12). In this calibration, the initial stroke
position of potentiometer was made as similar as possible to that in actual pullout tests
to eliminate the non-uniformity error, if any. The static calibration factor for
potentiometer ‘T’ and potentiometer ‘B’ determined by this method was 0.24
mm/V/V and 0.26 mm/V/V respectively.
In dynamic calibration test, the dynamic motion of a trial rapid pullout test
was measured by a potentiometer and an accelerometer at the same section. Figure
2.13 compares the displacement, velocity and acceleration trace recorded by
potentiometer ‘T’ and accelerometer. The static calibration factor determined earlier
was applied to the output of this potentiometer. All differentiation and integration
involved to derive the curves in Figure 2.13 was calculated by ‘Dplot’, a graphical
calculus software. Figure 2.13 shows that the measurements by potentiometer and
accelerometer were well match to each other, justifying the use of potentiometer to
measure the pullout displacement of rapid pullout tests.
2.5.3 Strain Gauge
Semiconductor strain gauges (KYOWA KSP-2-120-E4) were installed along
the body of sand glued nail to measure the axial body load in quasi static and rapid
pullout tests. For nail with 0.75 m of effective length, two pairs of strain gauges were
installed at location 0.25 m and 0.45 m from nail head (the terms ‘nail head’ is
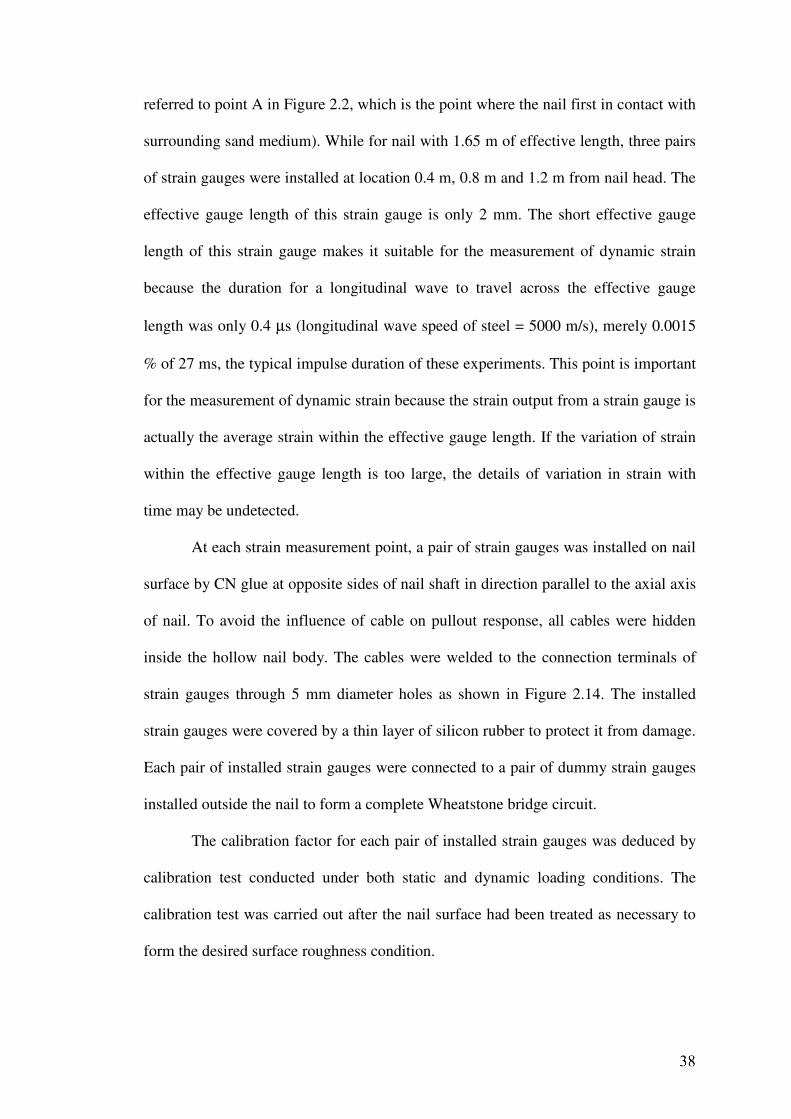
referred to point A in Figure 2.2, which is the point where the nail first in contact with
surrounding sand medium). While for nail with 1.65 m of effective length, three pairs
of strain gauges were installed at location 0.4 m, 0.8 m and 1.2 m from nail head. The
effective gauge length of this strain gauge is only 2 mm. The short effective gauge
length of this strain gauge makes it suitable for the measurement of dynamic strain
because the duration for a longitudinal wave to travel across the effective gauge
length was only 0.4 µs (longitudinal wave speed of steel = 5000 m/s), merely 0.0015
% of 27 ms, the typical impulse duration of these experiments. This point is important
for the measurement of dynamic strain because the strain output from a strain gauge is
actually the average strain within the effective gauge length. If the variation of strain
within the effective gauge length is too large, the details of variation in strain with
time may be undetected.
At each strain measurement point, a pair of strain gauges was installed on nail
surface by CN glue at opposite sides of nail shaft in direction parallel to the axial axis
of nail. To avoid the influence of cable on pullout response, all cables were hidden
inside the hollow nail body. The cables were welded to the connection terminals of
strain gauges through 5 mm diameter holes as shown in Figure 2.14. The installed
strain gauges were covered by a thin layer of silicon rubber to protect it from damage.
Each pair of installed strain gauges were connected to a pair of dummy strain gauges
installed outside the nail to form a complete Wheatstone bridge circuit.
The calibration factor for each pair of installed strain gauges was deduced by
calibration test conducted under both static and dynamic loading conditions. The
calibration test was carried out after the nail surface had been treated as necessary to
form the desired surface roughness condition.
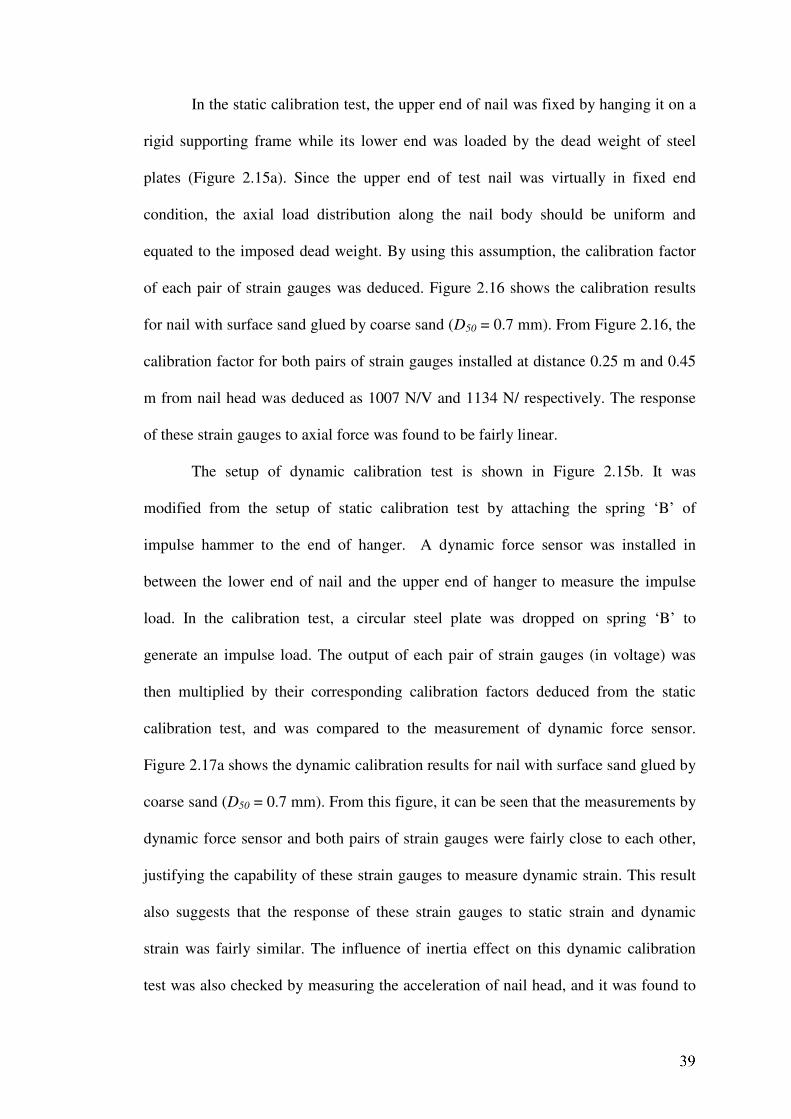
In the static calibration test, the upper end of nail was fixed by hanging it on a
rigid supporting frame while its lower end was loaded by the dead weight of steel
plates (Figure 2.15a). Since the upper end of test nail was virtually in fixed end
condition, the axial load distribution along the nail body should be uniform and
equated to the imposed dead weight. By using this assumption, the calibration factor
of each pair of strain gauges was deduced. Figure 2.16 shows the calibration results
for nail with surface sand glued by coarse sand (D50 = 0.7 mm). From Figure 2.16, the
calibration factor for both pairs of strain gauges installed at distance 0.25 m and 0.45
m from nail head was deduced as 1007 N/V and 1134 N/ respectively. The response
of these strain gauges to axial force was found to be fairly linear.
The setup of dynamic calibration test is shown in Figure 2.15b. It was
modified from the setup of static calibration test by attaching the spring ‘B’ of
impulse hammer to the end of hanger. A dynamic force sensor was installed in
between the lower end of nail and the upper end of hanger to measure the impulse
load. In the calibration test, a circular steel plate was dropped on spring ‘B’ to
generate an impulse load. The output of each pair of strain gauges (in voltage) was
then multiplied by their corresponding calibration factors deduced from the static
calibration test, and was compared to the measurement of dynamic force sensor.
Figure 2.17a shows the dynamic calibration results for nail with surface sand glued by
coarse sand (D50 = 0.7 mm). From this figure, it can be seen that the measurements by
dynamic force sensor and both pairs of strain gauges were fairly close to each other,
justifying the capability of these strain gauges to measure dynamic strain. This result
also suggests that the response of these strain gauges to static strain and dynamic
strain was fairly similar. The influence of inertia effect on this dynamic calibration
test was also checked by measuring the acceleration of nail head, and it was found to

be negligible since the upper end of nail was in fixed end condition and the
extensibility of the nail was negligible.
To ensure that the response of strain gauges to dynamic strain was unaffected
by the loading direction, dynamic calibration test was repeated by reversing the
direction of nail. The result is plotted in Figure 2.17b. It showed that the response of
installed strain gauges to dynamic strain was virtually unaffected by the loading
direction.
These calibration procedures were repeated on every pairs of strain gauges
used in these experiments. It is found that the calibration factors of all pairs of strain
gauges determined from static calibration tests worked well in the measurement of
dynamic strain
2.5.4 Data Acquisition System
The data acquisition system consists of an oscilloscope and an amplifier. The
output signals (in form of voltage) of all instruments were real time monitored and
recorded by a digital oscilloscope. The sampling rate was set to 0.5 Hz for quasi static
pullout tests while was set to 20 kHz for rapid pullout tests. High frequency electrical
noise was filtered by the built-in filtering function of oscilloscope. The filtering
frequency was set to 10 Hz and 50 kHz for quasi static pullout tests and rapid pullout
tests respectively. Because the signals from static load cell and strain gauges were
very small, usually in the range of a few milliVolt, there were amplified by 300 times
and 100 times respectively before being transmitted to oscilloscope.
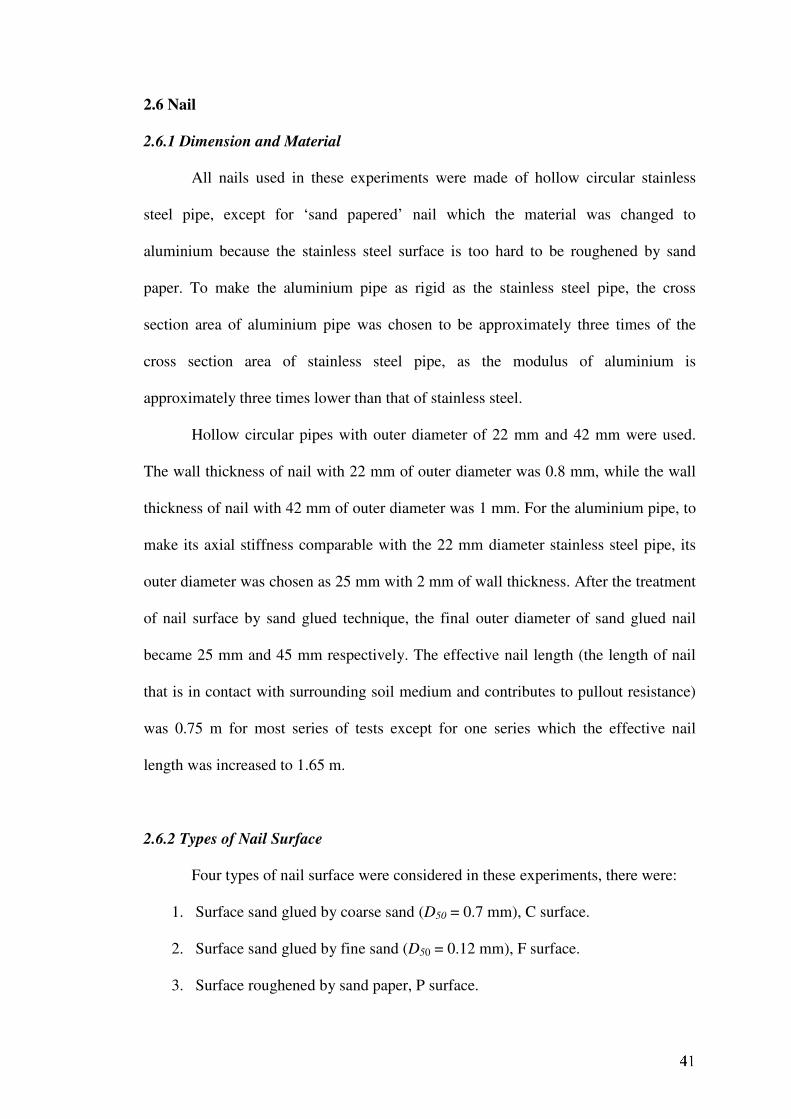
2.6 Nail
2.6.1 Dimension and Material
All nails used in these experiments were made of hollow circular stainless
steel pipe, except for ‘sand papered’ nail which the material was changed to
aluminium because the stainless steel surface is too hard to be roughened by sand
paper. To make the aluminium pipe as rigid as the stainless steel pipe, the cross
section area of aluminium pipe was chosen to be approximately three times of the
cross section area of stainless steel pipe, as the modulus of aluminium is
approximately three times lower than that of stainless steel.
Hollow circular pipes with outer diameter of 22 mm and 42 mm were used.
The wall thickness of nail with 22 mm of outer diameter was 0.8 mm, while the wall
thickness of nail with 42 mm of outer diameter was 1 mm. For the aluminium pipe, to
make its axial stiffness comparable with the 22 mm diameter stainless steel pipe, its
outer diameter was chosen as 25 mm with 2 mm of wall thickness. After the treatment
of nail surface by sand glued technique, the final outer diameter of sand glued nail
became 25 mm and 45 mm respectively. The effective nail length (the length of nail
that is in contact with surrounding soil medium and contributes to pullout resistance)
was 0.75 m for most series of tests except for one series which the effective nail
length was increased to 1.65 m.
2.6.2 Types of Nail Surface
Four types of nail surface were considered in these experiments, there were:
1. Surface sand glued by coarse sand (D50 = 0.7 mm), C surface.
2. Surface sand glued by fine sand (D50 = 0.12 mm), F surface.
3. Surface roughened by sand paper, P surface.
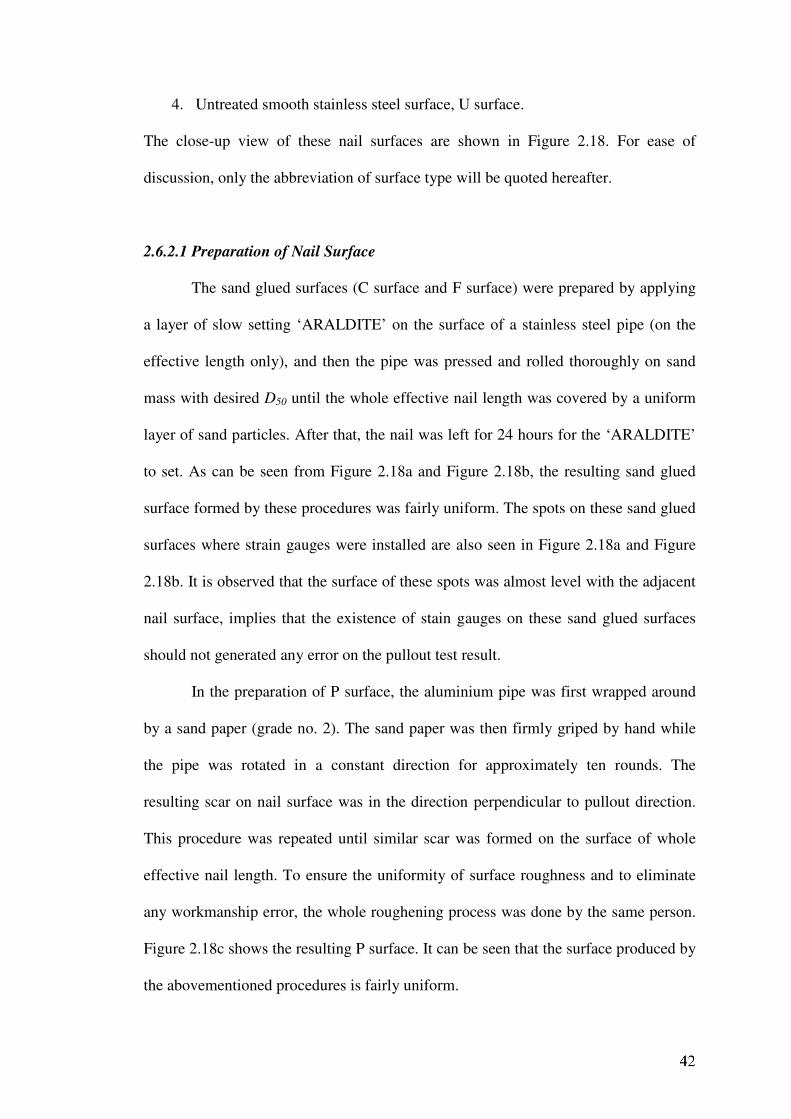
4. Untreated smooth stainless steel surface, U surface.
The close-up view of these nail surfaces are shown in Figure 2.18. For ease of
discussion, only the abbreviation of surface type will be quoted hereafter.
2.6.2.1 Preparation of Nail Surface
The sand glued surfaces (C surface and F surface) were prepared by applying
a layer of slow setting ‘ARALDITE’ on the surface of a stainless steel pipe (on the
effective length only), and then the pipe was pressed and rolled thoroughly on sand
mass with desired D50 until the whole effective nail length was covered by a uniform
layer of sand particles. After that, the nail was left for 24 hours for the ‘ARALDITE’
to set. As can be seen from Figure 2.18a and Figure 2.18b, the resulting sand glued
surface formed by these procedures was fairly uniform. The spots on these sand glued
surfaces where strain gauges were installed are also seen in Figure 2.18a and Figure
2.18b. It is observed that the surface of these spots was almost level with the adjacent
nail surface, implies that the existence of stain gauges on these sand glued surfaces
should not generated any error on the pullout test result.
In the preparation of P surface, the aluminium pipe was first wrapped around
by a sand paper (grade no. 2). The sand paper was then firmly griped by hand while
the pipe was rotated in a constant direction for approximately ten rounds. The
resulting scar on nail surface was in the direction perpendicular to pullout direction.
This procedure was repeated until similar scar was formed on the surface of whole
effective nail length. To ensure the uniformity of surface roughness and to eliminate
any workmanship error, the whole roughening process was done by the same person.
Figure 2.18c shows the resulting P surface. It can be seen that the surface produced by
the abovementioned procedures is fairly uniform.
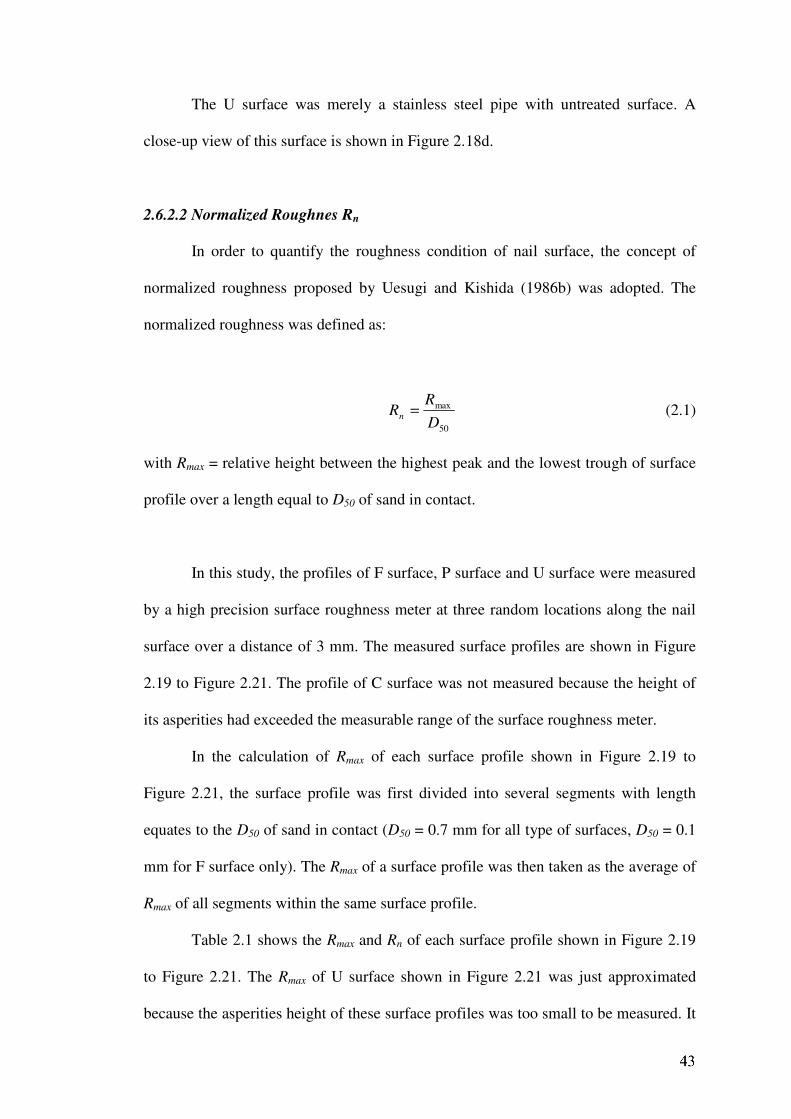
The U surface was merely a stainless steel pipe with untreated surface. A
close-up view of this surface is shown in Figure 2.18d.
2.6.2.2 Normalized Roughnes Rn
In order to quantify the roughness condition of nail surface, the concept of
normalized roughness proposed by Uesugi and Kishida (1986b) was adopted. The
normalized roughness was defined as:
50
max
D
RRn = (2.1)
with Rmax = relative height between the highest peak and the lowest trough of surface
profile over a length equal to D50 of sand in contact.
In this study, the profiles of F surface, P surface and U surface were measured
by a high precision surface roughness meter at three random locations along the nail
surface over a distance of 3 mm. The measured surface profiles are shown in Figure
2.19 to Figure 2.21. The profile of C surface was not measured because the height of
its asperities had exceeded the measurable range of the surface roughness meter.
In the calculation of Rmax of each surface profile shown in Figure 2.19 to
Figure 2.21, the surface profile was first divided into several segments with length
equates to the D50 of sand in contact (D50 = 0.7 mm for all type of surfaces, D50 = 0.1
mm for F surface only). The Rmax of a surface profile was then taken as the average of
Rmax of all segments within the same surface profile.
Table 2.1 shows the Rmax and Rn of each surface profile shown in Figure 2.19
to Figure 2.21. The Rmax of U surface shown in Figure 2.21 was just approximated
because the asperities height of these surface profiles was too small to be measured. It
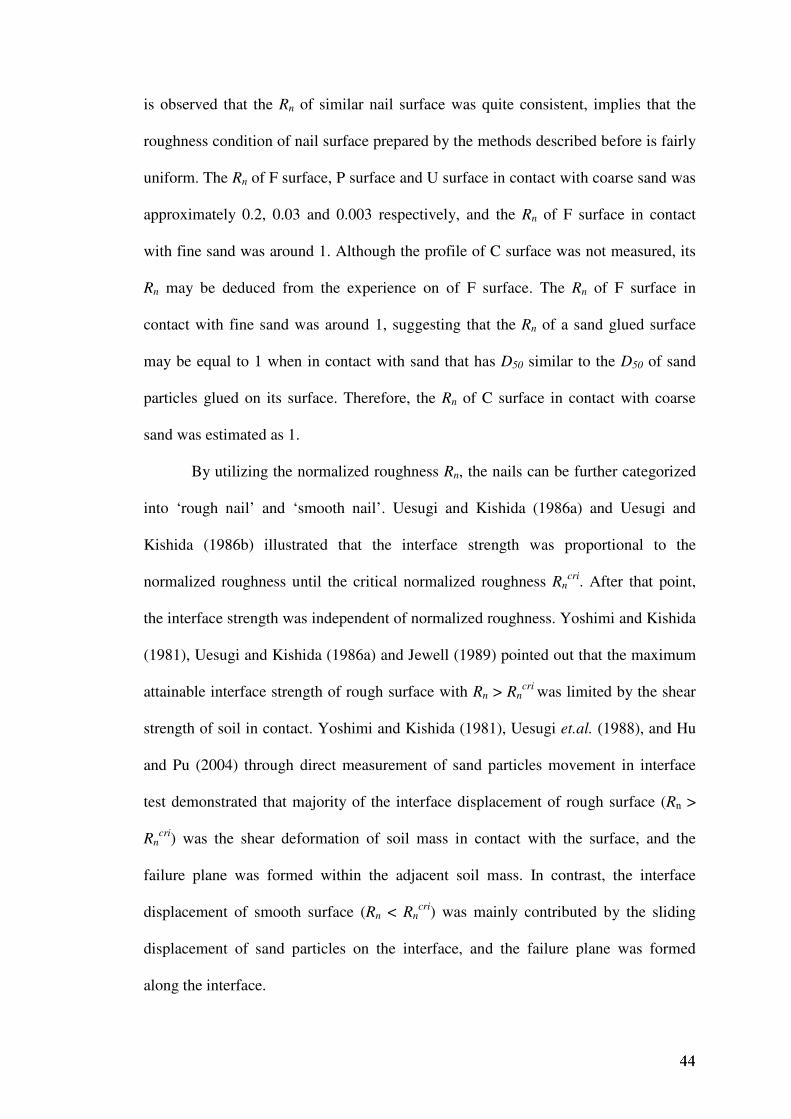
is observed that the Rn of similar nail surface was quite consistent, implies that the
roughness condition of nail surface prepared by the methods described before is fairly
uniform. The Rn of F surface, P surface and U surface in contact with coarse sand was
approximately 0.2, 0.03 and 0.003 respectively, and the Rn of F surface in contact
with fine sand was around 1. Although the profile of C surface was not measured, its
Rn may be deduced from the experience on of F surface. The Rn of F surface in
contact with fine sand was around 1, suggesting that the Rn of a sand glued surface
may be equal to 1 when in contact with sand that has D50 similar to the D50 of sand
particles glued on its surface. Therefore, the Rn of C surface in contact with coarse
sand was estimated as 1.
By utilizing the normalized roughness Rn, the nails can be further categorized
into ‘rough nail’ and ‘smooth nail’. Uesugi and Kishida (1986a) and Uesugi and
Kishida (1986b) illustrated that the interface strength was proportional to the
normalized roughness until the critical normalized roughness Rncri
. After that point,
the interface strength was independent of normalized roughness. Yoshimi and Kishida
(1981), Uesugi and Kishida (1986a) and Jewell (1989) pointed out that the maximum
attainable interface strength of rough surface with Rn > Rncri
was limited by the shear
strength of soil in contact. Yoshimi and Kishida (1981), Uesugi et.al. (1988), and Hu
and Pu (2004) through direct measurement of sand particles movement in interface
test demonstrated that majority of the interface displacement of rough surface (Rn >
Rncri
) was the shear deformation of soil mass in contact with the surface, and the
failure plane was formed within the adjacent soil mass. In contrast, the interface
displacement of smooth surface (Rn < Rncri
) was mainly contributed by the sliding
displacement of sand particles on the interface, and the failure plane was formed
along the interface.
From the literature review, the critical normalized roughness Rncri
does not
appear to be a constant but a variable that depends on sand type. The results of
interface test by Uesugi and Kishida (1986b) showed that the Rncri
for Toyoura sand,
Fujigawa sand and Seto sand was roughly 0.15, 0.1 and 0.07 respectively. Hu and Pu
(2004) proposed 0.1 as the Rncri
for Yongdinghe sand. The difference in Rncri
of
difference type of sands may be attributed to the difference in roughness, angularity
and mineralogy of sand particles.
Although the Rncri
for the sands used in these experiments was unknown, but
from the limited past experiences, the Rncri
seems to be within the range of 0.07 – 0.15.
Thus, the nails with C surface and F surface with Rn ≥ 0.15 can be reasonably
categorized as rough nail; while, the nails with P surface and U surface with Rn ≤ 0.03
can be categorized as smooth nail.
2.7 Sand
The sand medium of these experiments were formed by poorly graded clean
dry sand. The basic properties (particle size distribution, maximum density and
minimum density) and friction angle of these sands were obtained by standard
laboratory tests.
2.7.1 Basic Properties
The particle distribution curves of both sands used in these experiments,
termed as coarse sand and fine sand, are plotted in Figure 2.22. Both of these sands
can be categorized as poorly graded sand because their particle size distribution
curves were obviously concentrated within a narrow range only. The D50 of coarse
sand and fine sand was 0.7 mm and 0.12 mm respectively.
The maximum density of sands was determined by the vibrating table method
suggested by ASTM D 4253. In this method, a standard mold filled up with sand
sample (~ 2830 cm3 in volume) is subjected to a vibration of 0.5 mm in double
amplitude at 50 Hz for 12 minutes while surcharge pressure of 13.8 kPa is loading on
the surface of sand sample. The final sand density after the vibration is taken as the
maximum density. The maximum density of coarse sand and fine sand was 1655
kg/m3 and 1720 kg/m
3 respectively.
The minimum density of sands was determined by the shaking method
suggested by ASTM D 4254. In this method, a 2 liters cylinder filled with 1 kg of
sand sample is shook up and down rapidly and the final sand density is taken as the
minimum density. The minimum density of coarse sand and fine sand was determined
as 1400 kg/m3 and 1430 kg/m
3 respectively.
2.7.2 Direct Shear Test
The friction angles of sand and sand – nail interface were determined by
conventional 100 mm x 100 mm direct shear test. For direct shear test on sand – nail
interface, the lower halve of direct shear box was replaced by an aluminium block
with surface that has been treated by the same method used to form the nail surface as
described before.
Although soil stresses along the shear plane of direct shear test is likely to be
non-uniform due to the influence of rigid boundary, Potts et.al. (1987) demonstrated
by finite element analysis that these stresses are actually fairly uniform at the stage of
peak shear stress. Uesugi and Kishida (1986b) compared the results of simple shear
test and direct shear test on sand steel interface and showed that the results of both
tests, especially in terms of peak and residual interface friction angles, were quite
close to each other. Therefore, direct shear test was adopted to determine the friction
angle of sand and sand – nail interface of these experiments.
The sand sample of direct shear tests was prepared by air pluviation method,
the same method used to prepare the sand medium of pullout test. The details of the
preparation procedures will be discussed later in Section 2.7.3.
Table 2.2 shows the details of each series of direct shear tests. In each series of
direct shear tests, three levels of normal stress, 17 kPa, 32 kPa and 57 kPa, were
considered. For the convenience of discussion, a code is assigned to each series of
direct shear tests as shown in Table 2.2. The code consists of two terms. The first term
describes the sand properties. The second term describes the surface type for direct
shear interface test, or the sand properties for direct shear sand – sand test. As an
example, the DCs-F test stands for the direct shear interface test between dense course
sand and surface sand glued by fine sand. While, the DCs-DCs test stands for the
direct shear sand – sand test on dense coarse sand. The details of this coding system
are given as the footnote in Table 2.2.
Figure 2.23 plots the curves of peak and residual shear stress vs. normal stress
of every series of direct shear tests. From this figure, the peak friction angle and
residual friction angle of every series of direct shear tests were deduced and given in
Table 2.2.
Figure 2.24 compares the direct shear test results (the curves of shear stress vs.
horizontal displacement and the vertical displacement vs. horizontal displacement) of
tests with dense coarse sand medium. Figure 2.25 compares the direct shear test
results of MCs-C test to DCs-C test to examine the influence of sand density. Figure
2.26 compares the direct shear test results of tests with dense fine sand medium. The
normal stress of tests plotted in Figure 2.24, 2.25 and 2.26 was 32 kPa. From the plots
of vertical displacement vs. horizontal displacement in Figure 2.24 to Figure 2.26, the
maximum dilatancy angle ψ of every direct shear tests were deduced and given in
Table 2.2.
From Figure 2.24 and Table 2.2, the peak and residual friction angle of DCs-
DCs test, DCs-C test and DCs-F test appears to be nearly identical. This observation
is reasonable since C surface (sand glued by coarse sand) and F surface (sand glued
by fine sand) are both categorized as rough surface by their normalized roughness Rn.
It has been discussed in Section 2.6.2.2 that the interface strength of rough surface is
limited by the shear strength of adjacent soil mass because the failure plane is likely
to be formed within the adjacent soil mass. From Figure 2.24, it is also seen that the
horizontal displacement required to achieve the peak shear stress of DCs-DCs test was
twice of those required by DCs-C test and DCs-F test. This observation seems to
suggest that the thickness of shear zone in DCs-DCs test was almost twice the
thickness of shear zone in DCs-C test and DCs-F test.
In term of dilatancy, Figure 2.24 shows that the maximum vertical
displacement achieved by DCs-DCs test was almost twice the maximum vertical
displacement achieved by DCs-C test and DCs-F test. This observation again suggests
the thickness of shear zone of DCs-DCs test was almost twice the thickness of shear
zone of DCs-C test and DCs-F test. Although the DCs-F test seems less dilative when
compared to DCs-C test, the difference was unclear concerning the error involved in
the measurement of vertical displacement as the top cap was rotating in direct shear
test due to non uniform distribution of soil stresses (Jewell, 1989). It has to be stressed
that the accuracy of dilatancy angle deduced by the vertical displacement of direct
shear test is inaccurate as had been illustrated by Palmeira (1987) that the dilatancy
angle deduced by this method is likely to be underestimated by as high as 6o.
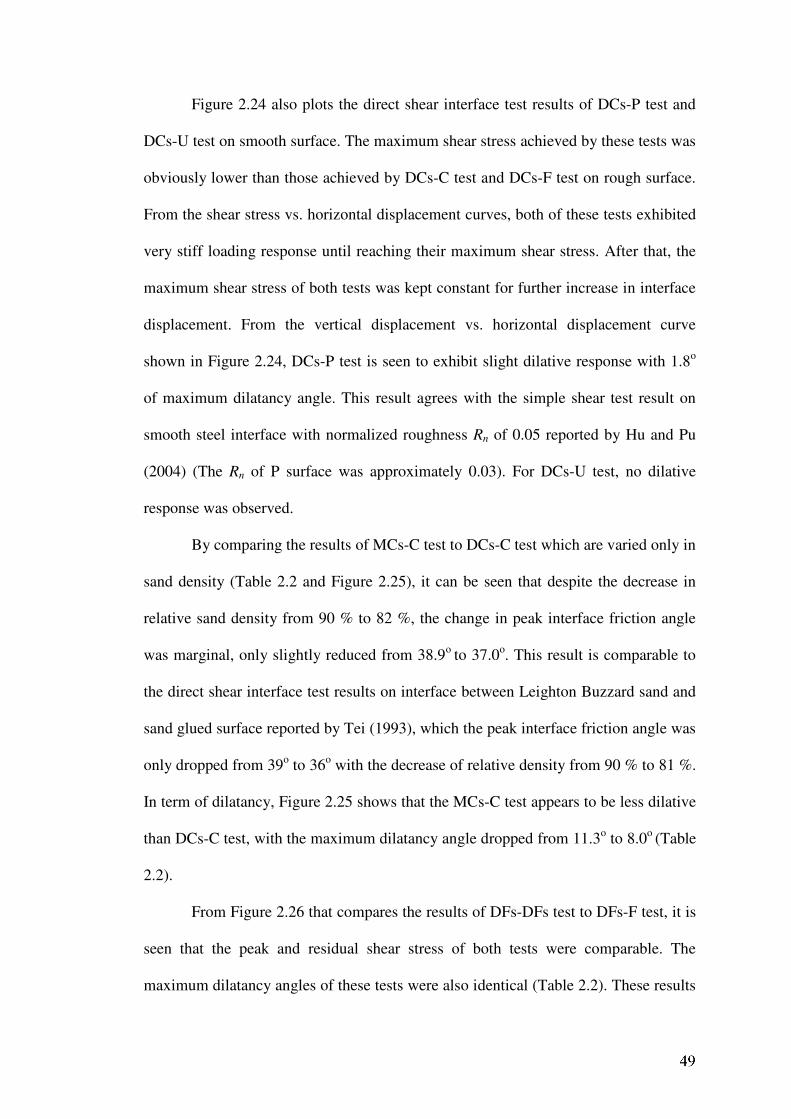
Figure 2.24 also plots the direct shear interface test results of DCs-P test and
DCs-U test on smooth surface. The maximum shear stress achieved by these tests was
obviously lower than those achieved by DCs-C test and DCs-F test on rough surface.
From the shear stress vs. horizontal displacement curves, both of these tests exhibited
very stiff loading response until reaching their maximum shear stress. After that, the
maximum shear stress of both tests was kept constant for further increase in interface
displacement. From the vertical displacement vs. horizontal displacement curve
shown in Figure 2.24, DCs-P test is seen to exhibit slight dilative response with 1.8o
of maximum dilatancy angle. This result agrees with the simple shear test result on
smooth steel interface with normalized roughness Rn of 0.05 reported by Hu and Pu
(2004) (The Rn of P surface was approximately 0.03). For DCs-U test, no dilative
response was observed.
By comparing the results of MCs-C test to DCs-C test which are varied only in
sand density (Table 2.2 and Figure 2.25), it can be seen that despite the decrease in
relative sand density from 90 % to 82 %, the change in peak interface friction angle
was marginal, only slightly reduced from 38.9o
to 37.0o. This result is comparable to
the direct shear interface test results on interface between Leighton Buzzard sand and
sand glued surface reported by Tei (1993), which the peak interface friction angle was
only dropped from 39o to 36
o with the decrease of relative density from 90 % to 81 %.
In term of dilatancy, Figure 2.25 shows that the MCs-C test appears to be less dilative
than DCs-C test, with the maximum dilatancy angle dropped from 11.3o to 8.0
o (Table
2.2).
From Figure 2.26 that compares the results of DFs-DFs test to DFs-F test, it is
seen that the peak and residual shear stress of both tests were comparable. The
maximum dilatancy angles of these tests were also identical (Table 2.2). These results
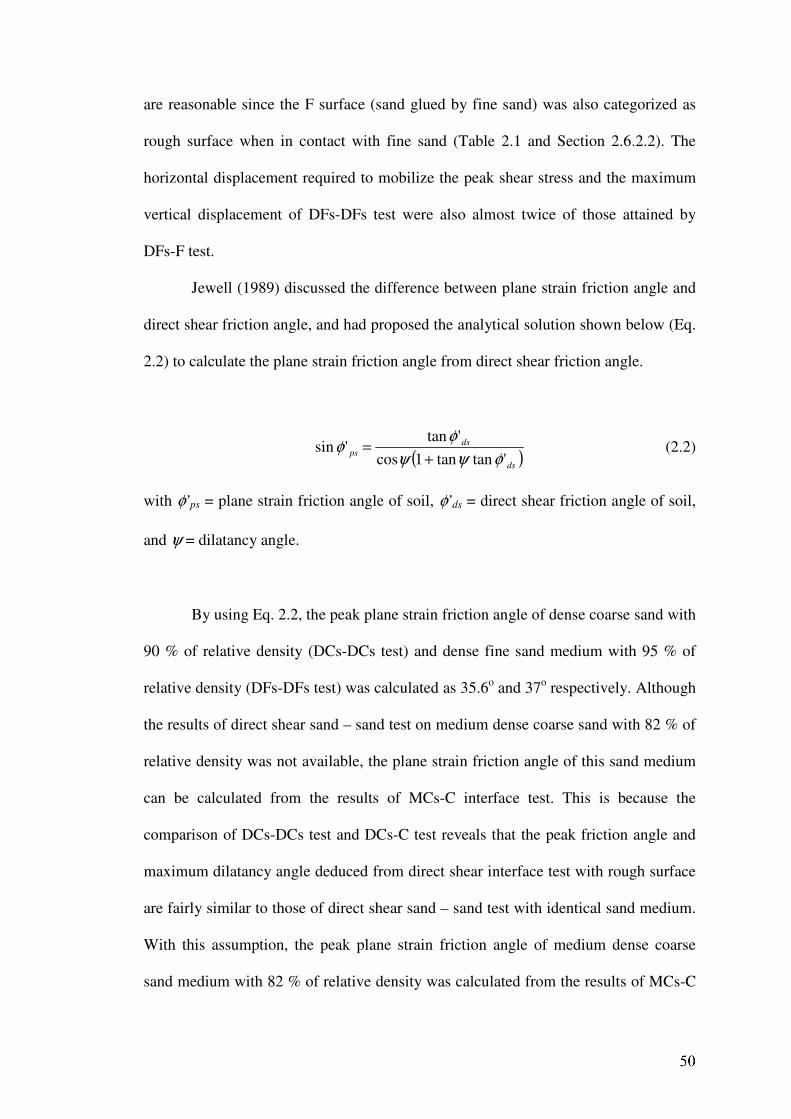
are reasonable since the F surface (sand glued by fine sand) was also categorized as
rough surface when in contact with fine sand (Table 2.1 and Section 2.6.2.2). The
horizontal displacement required to mobilize the peak shear stress and the maximum
vertical displacement of DFs-DFs test were also almost twice of those attained by
DFs-F test.
Jewell (1989) discussed the difference between plane strain friction angle and
direct shear friction angle, and had proposed the analytical solution shown below (Eq.
2.2) to calculate the plane strain friction angle from direct shear friction angle.
( )ds
ds
ps'tantan1cos
'tan'sin
φψψ
φφ
+= (2.2)
with φ’ps = plane strain friction angle of soil, φ’ds = direct shear friction angle of soil,
and ψ = dilatancy angle.
By using Eq. 2.2, the peak plane strain friction angle of dense coarse sand with
90 % of relative density (DCs-DCs test) and dense fine sand medium with 95 % of
relative density (DFs-DFs test) was calculated as 35.6o and 37
o respectively. Although
the results of direct shear sand – sand test on medium dense coarse sand with 82 % of
relative density was not available, the plane strain friction angle of this sand medium
can be calculated from the results of MCs-C interface test. This is because the
comparison of DCs-DCs test and DCs-C test reveals that the peak friction angle and
maximum dilatancy angle deduced from direct shear interface test with rough surface
are fairly similar to those of direct shear sand – sand test with identical sand medium.
With this assumption, the peak plane strain friction angle of medium dense coarse
sand medium with 82 % of relative density was calculated from the results of MCs-C
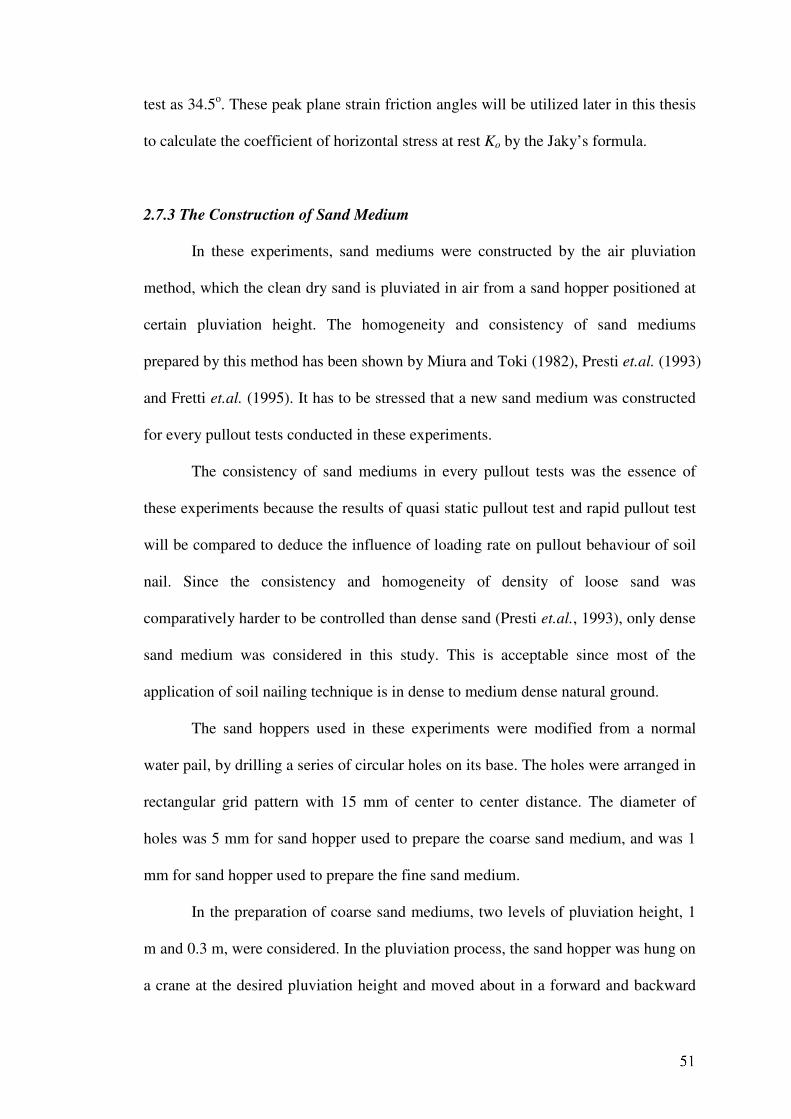
test as 34.5o. These peak plane strain friction angles will be utilized later in this thesis
to calculate the coefficient of horizontal stress at rest Ko by the Jaky’s formula.
2.7.3 The Construction of Sand Medium
In these experiments, sand mediums were constructed by the air pluviation
method, which the clean dry sand is pluviated in air from a sand hopper positioned at
certain pluviation height. The homogeneity and consistency of sand mediums
prepared by this method has been shown by Miura and Toki (1982), Presti et.al. (1993)
and Fretti et.al. (1995). It has to be stressed that a new sand medium was constructed
for every pullout tests conducted in these experiments.
The consistency of sand mediums in every pullout tests was the essence of
these experiments because the results of quasi static pullout test and rapid pullout test
will be compared to deduce the influence of loading rate on pullout behaviour of soil
nail. Since the consistency and homogeneity of density of loose sand was
comparatively harder to be controlled than dense sand (Presti et.al., 1993), only dense
sand medium was considered in this study. This is acceptable since most of the
application of soil nailing technique is in dense to medium dense natural ground.
The sand hoppers used in these experiments were modified from a normal
water pail, by drilling a series of circular holes on its base. The holes were arranged in
rectangular grid pattern with 15 mm of center to center distance. The diameter of
holes was 5 mm for sand hopper used to prepare the coarse sand medium, and was 1
mm for sand hopper used to prepare the fine sand medium.
In the preparation of coarse sand mediums, two levels of pluviation height, 1
m and 0.3 m, were considered. In the pluviation process, the sand hopper was hung on
a crane at the desired pluviation height and moved about in a forward and backward
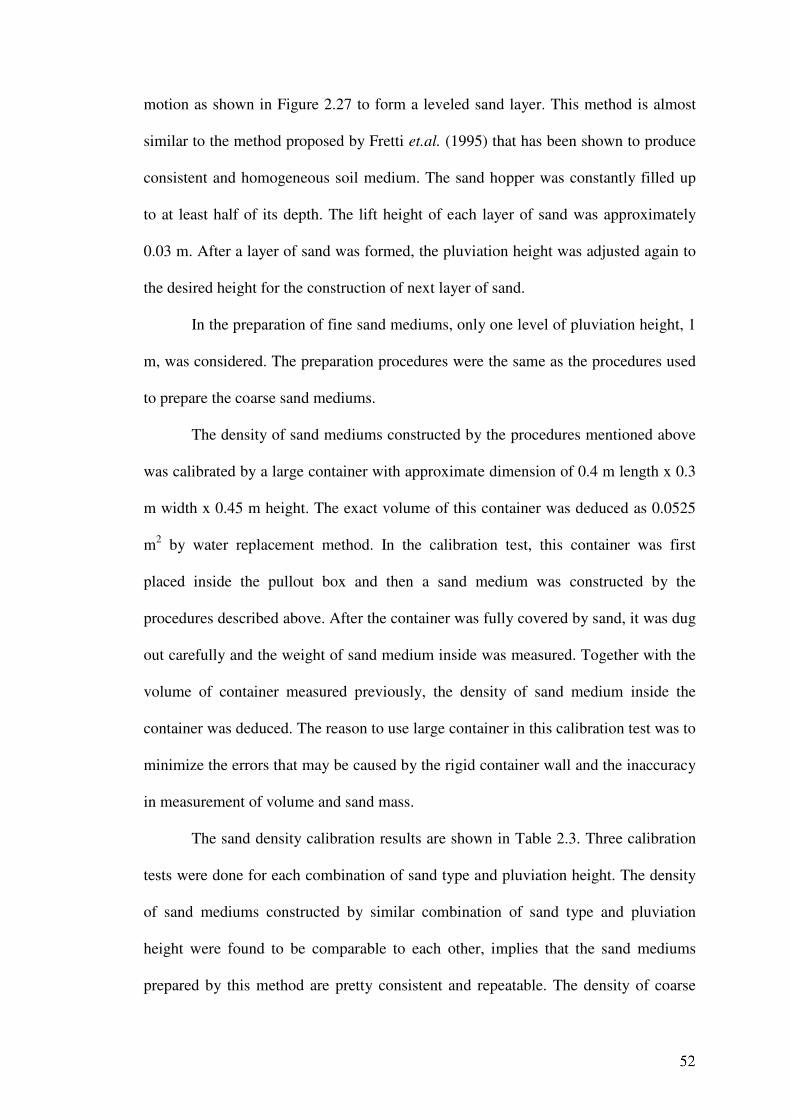
motion as shown in Figure 2.27 to form a leveled sand layer. This method is almost
similar to the method proposed by Fretti et.al. (1995) that has been shown to produce
consistent and homogeneous soil medium. The sand hopper was constantly filled up
to at least half of its depth. The lift height of each layer of sand was approximately
0.03 m. After a layer of sand was formed, the pluviation height was adjusted again to
the desired height for the construction of next layer of sand.
In the preparation of fine sand mediums, only one level of pluviation height, 1
m, was considered. The preparation procedures were the same as the procedures used
to prepare the coarse sand mediums.
The density of sand mediums constructed by the procedures mentioned above
was calibrated by a large container with approximate dimension of 0.4 m length x 0.3
m width x 0.45 m height. The exact volume of this container was deduced as 0.0525
m2 by water replacement method. In the calibration test, this container was first
placed inside the pullout box and then a sand medium was constructed by the
procedures described above. After the container was fully covered by sand, it was dug
out carefully and the weight of sand medium inside was measured. Together with the
volume of container measured previously, the density of sand medium inside the
container was deduced. The reason to use large container in this calibration test was to
minimize the errors that may be caused by the rigid container wall and the inaccuracy
in measurement of volume and sand mass.
The sand density calibration results are shown in Table 2.3. Three calibration
tests were done for each combination of sand type and pluviation height. The density
of sand mediums constructed by similar combination of sand type and pluviation
height were found to be comparable to each other, implies that the sand mediums
prepared by this method are pretty consistent and repeatable. The density of coarse
sand medium constructed with 1 m and 0.3 m of pluviation height was approximately
1625 kg/m3
and 1602 kg/m3 respectively, corresponding to 90 % and 82 % of relative
density. For fine sand medium constructed with 0.1 m of pluviation height, the density
was approximately 1700 kg/m3, corresponding to 95 % of relative density.
In Table 2.3, the void ratio e and small strain shear wave velocity Vs of sand
mediums are given as well. The void ratio was calculated by Eq. 2.3, while the small
strain shear wave velocity was calculated by the empirical equation (Eq. 2.4)
proposed by Hardin and Richart (1963) for dry clean sand.
1−
=
s
ge
ρ
ρ (2.3)
with ρg = density of sand particles, assumed as 2650 kg/m3; and ρs = dry density of
sand medium.
( )3.0
'35.536.11 oo eG σ−= (2.4)
with σ’o = mean effective confining stress, calculated as [(1+Ko)/2]σ’v, with Ko = 1-
sinφ’ps (Jacky’s formula) and σ’v = effective overburden stress.
It has to be noted that in these experiments, nail was fixed in-place before the
construction of sand medium. Although the existence of nail may cause the ‘shading
effect’ that affects the density of sand medium constructed below the nail, this
procedure is still preferred than installing the nail after the sand medium has been
constructed up to the nail level. It is because disturbance on sand medium below and
adjacent to the nail level is virtually inevitable in the nail installation process if sand
medium is constructed up to the nail level beforehand. Besides, this disturbance is
likely to be a random error that may differ from test to test, unlike the error caused the
‘shading’ effect that would most likely be a systematic error that is consistent in every
tests.
In the laboratory soil nail pullout tests conducted by Tei (1993), the nail was
mentioned to be installed after the sand medium had been constructed up to a ‘certain
level’, but no clear definition on ‘certain level’ was given. However, it is postulated
that the sand level must be at some distance below the nail level to avoid the
disturbance of nail installation. Thus, the ‘shading’ effect may still exist on sand
medium adjacent to and below the nail that was constructed after the nail had been
installed in place. Since the sand medium adjacent to nail is the most influential
medium to pullout response, the error of installing the nail after sand medium has
been constructed up to a ‘certain level’ or before the construction of sand medium
might be similar.
2.8 Experimental Program
Table 2.4 shows the detailed descriptions of all series of pullout tests
conducted in these experiments. In this table, a code is assigned to each test series to
ease the presentation and discussion of experimental results in this thesis. The code
consists of two terms. The first term describes the properties of sand medium. The
second term describes the properties of nail. By taking the DCs-S25C test series as an
example, the first term DCs indicates the sand medium of this test series was dense
coarse sand; while the second term S25C indicates the nail of this test series was 0.75
m in effective length (short), 25 mm in diameter and the nail surface was sand glued
by coarse sand. The details of this coding system are given as the footnote of Table
2.4.
The varying parameters that were considered in these experiments were as
below:
1) Nail Surface
Four types of nail surfaces, termed as C surface (sand glued by coarse sand), F
surface (sand glued by fine sand), P surface (roughened by sand paper) and U
surface (untreated smooth stainless steel surface) were considered to investigate
the influence of surface roughness on both quasi static and rapid pullout tests.
2) Nail Diameter, d
Two diameter sizes, 25 mm and 45 mm, were considered for nails with C
surface and F surface to examine the influence of nail diameter on pullout
behaviour, especially its influence on restrained dilatancy effect and radiation
damping effect.
3) Effective Nail Length, Le
Effective nail length is defined as the length of nail in contact with
surrounding soil medium that contributes to total shaft resistance. The effective
nail length of all series of tests was 0.75 m, except for DCs-L25F test series
(Table 2.4) where the effective nail length was increased to 1.65 m. The main
purpose to have a test with longer effective nail length was to study the influence
of effective nail length on the characteristic of axial body load distribution along
the nail under both quasi static and rapid loading conditions, which may indirectly
indicate the existence of any rigid front wall effect and reveal the influence of
effective nail length on the mobilization characteristic of damping resistance. It
has to be noted that both nails with 0.75 m and 1.65 m of effective nail length
behaved as rigid body in these experiments as can be seen later by the pullout test
results due to relatively rigid nail body and low overburden pressure (and hence
low interfacial resistance).
4) Particle Size
In these experiments, coarse sand medium was used for most series of tests.
With the D50 of coarse sand as 0.7 mm, the minimum ratio of nail diameter d to
mean particle size of sand D50 was around 36, which had exceeded the minimum
requirement of 30 suggested by Ovensen (1979) to avoid the particle size effect.
However, Foray et.al. (1998) with their results on tension pile tests suggested that
the ratio of d/D50 should exceed 200 in order to effectively eliminate the particle
size effect. But detailed examination of their discussion reveals that the particle
size effect referred by them was actually the restrained dilatancy effect which was
not intended to be eliminated in these experiments. Thus their results were be
irrelevant to these experiments.
However, as a measure of precaution to ensure the minimal influence of
particle size effect on the observations made in these experiments, DFs-S25F test
series was created (Table 2.4). In this test series, the sand medium was formed by
fine sand with D50 = 0.12 mm. The d/D50 ratio of this test series was as high as
208, slightly exceeded the minimum value suggested by Foray et.al. (1998). The
pullout results of this test series, especially on the influence of loading rate on
pullout response, will then be compared qualitatively to the results of DCs-S25F
test series, to identify any significant variation in influence of loading rate
between these test series. The DCs-S25F test series had test conditions that were

similar to DFs-S25F test series except the mean particle size of sand medium and
hence the d/D50 ratio. The d/D50 ratio of DCs-S25F test series was 36.
5) Relative Density, Id
For tests with nail embedded in coarse sand, sand medium with relative
density of 82 % (MCs-S25C test series) and 90 % (DCs-S25C test series) were
considered. The purpose of this variation was to indirectly examine the
characteristic of restrained dilatancy effect under both quasi static and rapid
loading condition because the restrained dilatancy effect is highly affected by the
density of surrounding sand medium.
The overburden pressure on the center line of nail was kept constant at
approximately 7.3 kN/m2
for all series of tests. The overburden pressure was induced
by the dead weight of sand fill only. The height of sand fill depended on the unit
weight (the density) of sand medium that have been determined in Section 2.7.3.
Table 2.5 shows the pullout mode of every pullout tests that were conducted
under each test series. From this table, it can be seen that under each test series, at
least two quasi static pullout tests and two high energy rapid pullouts were conducted.
One low energy rapid pullout test was also conducted for every test series except the
DCs-S45C test series, the DCs-S25P test series and the DCs-S22U test series. The
term ‘high energy’ and ‘low energy’ mentioned in this thesis was a relative term that
represents the energy level of impulse load compared to the pullout strength of nail. In
high energy rapid pullout test, the nail was loaded to complete pullout failure; while
in low energy rapid pullout test, the peak impulse load was well below the peak
pullout strength of nail and thus complete pullout failure did not occurred in this test.

Before a rapid pullout test, type of the test (‘high energy’ or ‘low energy’) can be
roughly determined by setting the input energy to be higher or lower than the
threshold energy needed to attained the estimated peak rapid pullout strength Psp. The
threshold energy can be approximately assessed by energy principle as 1/2Pspu
p(s) with
Psp the estimated peak rapid pullout strength and u
p(s) the pullout displacement
required to achieve the peak rapid pullout strength.
The compressed length of spring ‘A’ in millimeter that stored the spring
potential energy for rapid pullout test was also shown in Table 2.5.
The sequence of a pullout tests was conducted under each test series followed
exactly the sequence shown in Table 2.5. Under each test series, both of the quasi
static pullout tests were purposely arranged to be the first and the last pullout test. The
purpose of this arrangement was for the possibility to indirectly evaluate the variation
of nail surface throughout a series of tests. If the condition of nail surface was not
severely altered throughout a series of tests, the results of the first and the last quasi
static pullout tests should be fairly identical to each other. It has to be noted that this
deduction is only true if the condition of sand medium was constant for both of the
quasi static pullout tests, which was likely true for these experiments as has been
discussed in Section 2.7.3 that the density of sand medium constructed by the air
pluviation procedures is highly consistent and repeatable.
Similar to test series, a code is also assigned to each pullout test to ease the
discussion in the following section of this thesis (Table 2.5). The code for pullout test
is basically an extension to the code for test series by adding another two terms at its
end. These additional terms indicates the sequence of the pullout test be conducted
under its test series and the mode of pullout test. As an example, the DCs-S25C-2-RH
test stands for the second pullout test that was conducted under the DCs-S25C test

series and this pullout test was a high energy rapid pullout test. The details of this
coding system are given as the footnote of Table 2.5.
Quasi static reload tests were directly conducted after each quasi static pullout
tests and rapid pullout tests. In this thesis, reload tests will be referred by adding a ‘-r’
at the end of code for their preceding pullout tests. As an example, the reload test that
was conducted after the DCs-S25C-1-S test will be referred as DCs-S25C-1-S-r test.
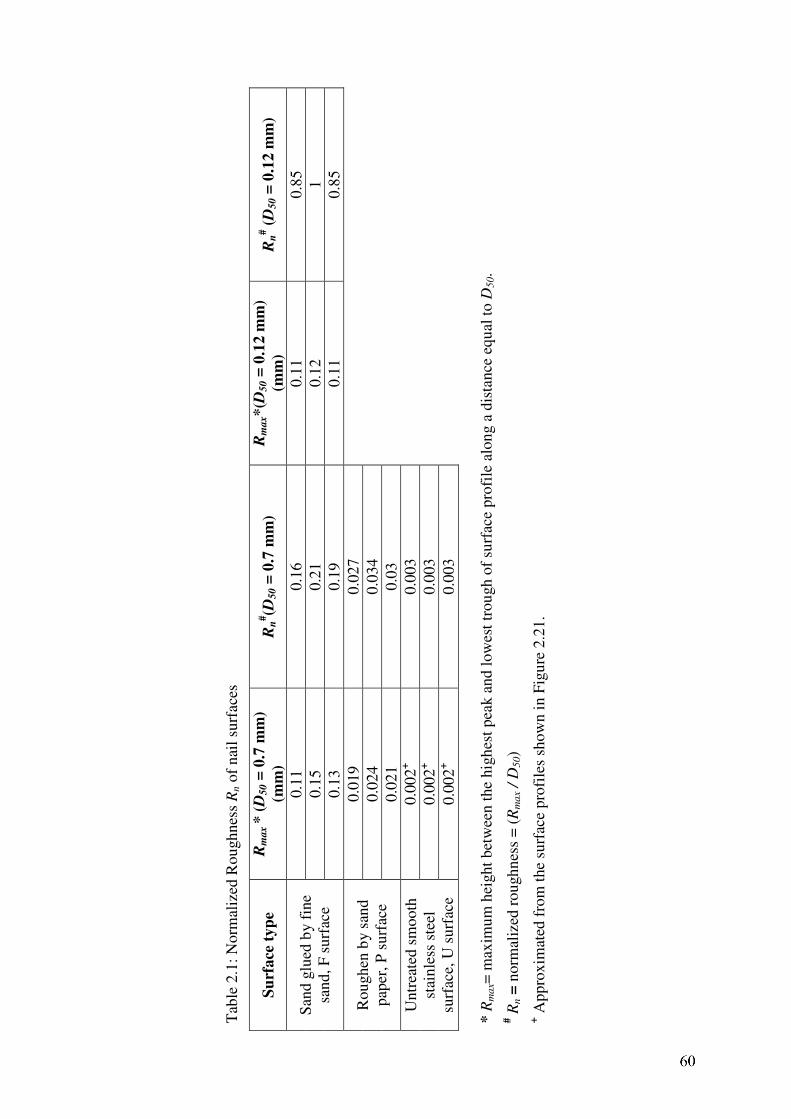
Tab
le 2
.1:
No
rmal
ized
Ro
ugh
nes
s R
n o
f nai
l su
rfac
es
Su
rface
ty
pe
Rm
ax
* (
D50 =
0.7
mm
)
(mm
) R
n#(D
50 =
0.7
mm
)
Rm
ax*(D
50 =
0.1
2 m
m)
(mm
) R
n# (
D50 =
0.1
2 m
m)
0.1
1
0.1
6
0.1
1
0.8
5
0.1
5
0.2
1
0.1
2
1
San
d g
lued
by f
ine
sand,
F s
urf
ace
0.1
3
0.1
9
0.1
1
0.8
5
0.0
19
0.0
27
0.0
24
0.0
34
Roughen
by s
and
pap
er,
P s
urf
ace
0
.021
0.0
3
0.0
02
+
0.0
03
0.0
02
+
0.0
03
Untr
eate
d s
mo
oth
stai
nle
ss s
teel
surf
ace,
U s
urf
ace
0.0
02
+
0.0
03
* R
ma
x=
max
imu
m h
eigh
t b
etw
een
th
e hig
hes
t pea
k a
nd l
ow
est
trou
gh o
f su
rfac
e pro
file
alo
ng a
dis
tance
equ
al t
o D
50.
# R
n =
norm
aliz
ed r
ou
gh
nes
s =
(R
ma
x /
D5
0)
+ A
ppro
xim
ated
fro
m t
he
surf
ace
pro
file
s sh
ow
n i
n F
igu
re 2
.21.
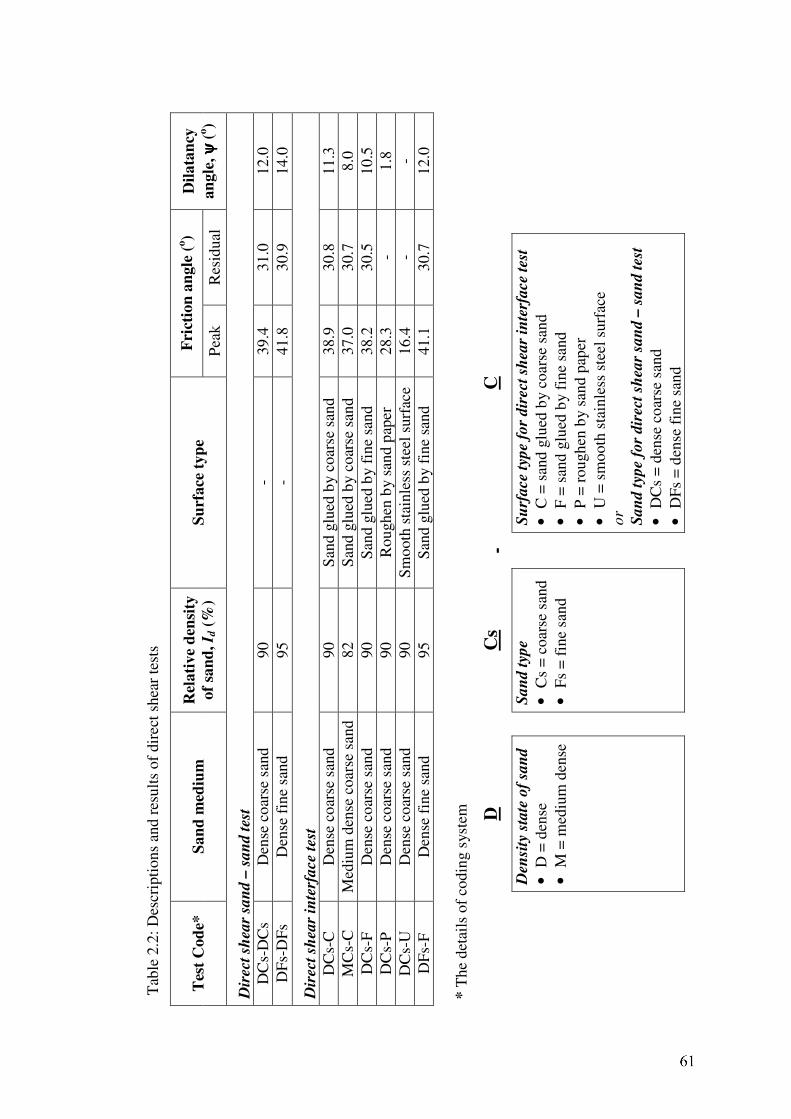
T
able
2.2
: D
escr
ipti
on
s an
d r
esu
lts
of
dir
ect
shea
r te
sts
Fri
ctio
n a
ngle
(o)
Tes
t C
od
e*
Sa
nd
med
ium
R
elati
ve
den
sity
of
san
d, I d
(%
) S
urf
ace
typ
e P
eak
Res
idual
Dil
ata
ncy
an
gle
, ψ ψψψ
(o)
Dir
ect
shea
r sa
nd
– s
an
d t
est
DC
s-D
Cs
Den
se c
oar
se s
and
90
- 39.4
31.0
12.0
DF
s-D
Fs
Den
se f
ine
sand
95
- 41.8
30.9
14.0
Dir
ect
shea
r in
terf
ace t
est
DC
s-C
D
ense
co
arse
san
d
90
San
d g
lued
by c
oar
se s
and
38.9
30.8
11.3
MC
s-C
M
ediu
m d
ense
co
arse
san
d
82
San
d g
lued
by c
oar
se s
and
37.0
30.7
8.0
DC
s-F
D
ense
co
arse
san
d
90
San
d g
lued
by f
ine
sand
38.2
30.5
10.5
DC
s-P
D
ense
co
arse
san
d
90
Roughen
by s
and p
aper
28.3
-
1.8
DC
s-U
D
ense
co
arse
san
d
90
Sm
ooth
sta
inle
ss s
teel
surf
ace
16.4
-
-
DF
s-F
D
ense
fin
e sa
nd
95
San
d g
lued
by f
ine
sand
41.1
30.7
12.0
* T
he
det
ails
of
cod
ing s
yst
em
D
C
s -
C
Den
sity
sta
te o
f sa
nd
•
D =
den
se
•
M =
med
ium
den
se
S
an
d t
ype
•
Cs
= c
oar
se s
and
•
Fs
= f
ine
sand
Su
rface t
ype f
or
dir
ect
shear
inte
rface t
est
•
C =
san
d g
lued
by c
oar
se s
and
•
F =
san
d g
lued
by f
ine
sand
•
P =
rough
en b
y s
and p
aper
•
U =
sm
ooth
sta
inle
ss s
teel
surf
ace
or
San
d t
ype f
or
dir
ect
shear
san
d –
san
d t
est
•
DC
s =
den
se c
oar
se s
and
•
DF
s =
den
se f
ine
sand
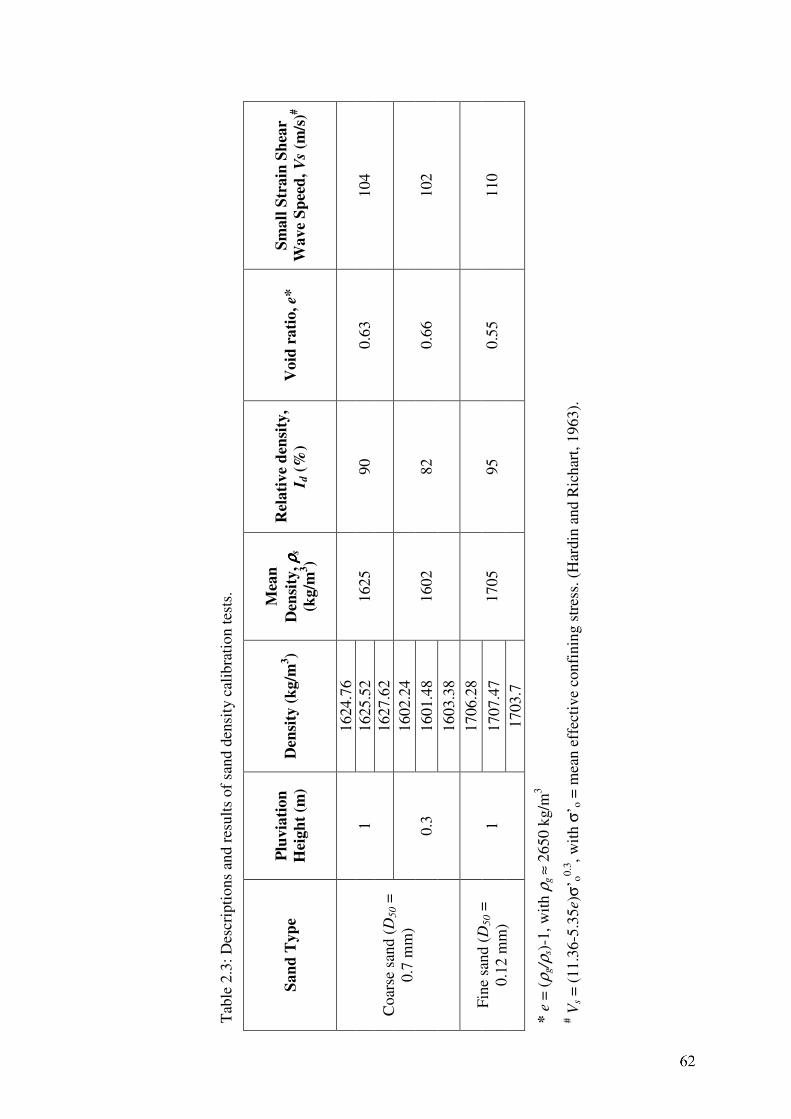
Tab
le 2
.3:
Des
crip
tio
ns
and
res
ult
s o
f sa
nd d
ensi
ty c
alib
rati
on t
ests
.
San
d T
yp
e P
luv
iati
on
Hei
gh
t (m
) D
ensi
ty (
kg/m
3)
Mea
n
Den
sity
, ρ ρρρ
s
(kg/m
3)
Rel
ati
ve
den
sity
,
I d (
%)
Void
rati
o, e*
Sm
all
Str
ain
Sh
ear
Wave
Sp
eed
, V
s (m
/s)#
1624.7
6
1625.5
2
1
1627.6
2
1625
90
0.6
3
104
1602.2
4
1601.4
8
Coar
se s
and
(D
50 =
0.7
mm
)
0.3
1603.3
8
1602
82
0.6
6
102
1706.2
8
1707.4
7
Fin
e sa
nd
(D
50 =
0.1
2 m
m)
1
1703.7
1705
95
0.5
5
110
* e
= (
ρg/ρ
s)-1
, w
ith
ρg
≈ 2
65
0 k
g/m
3
# V
s =
(11.3
6-5
.35e)
σ’ o
0.3, w
ith
σ’ o
= m
ean e
ffec
tive
confi
nin
g s
tres
s. (
Har
din
and R
ichar
t, 1
963).
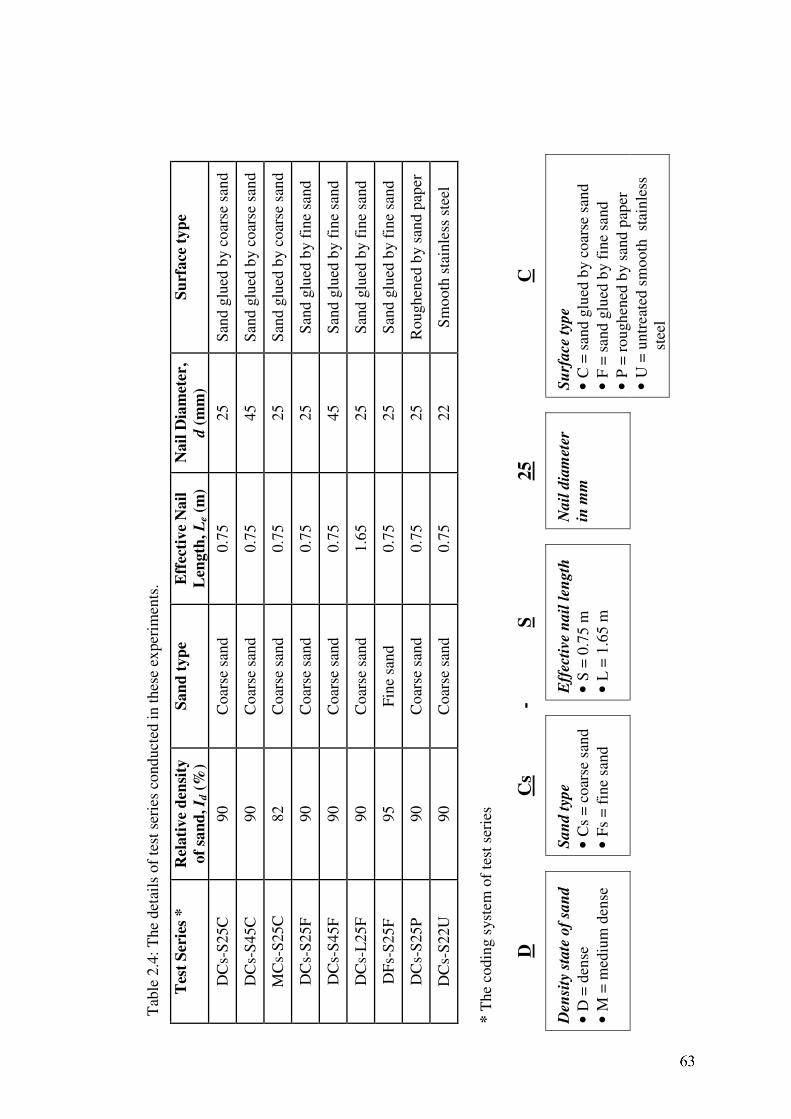
Tab
le 2
.4:
Th
e d
etai
ls o
f te
st s
erie
s co
nduct
ed i
n t
hes
e ex
per
imen
ts.
Tes
t S
erie
s *
R
ela
tiv
e d
ensi
ty
of
san
d, I d
(%
)
San
d t
yp
e
Eff
ecti
ve
Nail
Len
gth
, L
e (
m)
Nail
Dia
met
er,
d (
mm
)
Su
rface
typ
e
DC
s-S
25
C
90
C
oar
se s
and
0.7
5
25
San
d g
lued
by c
oar
se s
and
DC
s-S
45
C
90
C
oar
se s
and
0.7
5
45
San
d g
lued
by c
oar
se s
and
MC
s-S
25
C
82
C
oar
se s
and
0.7
5
25
San
d g
lued
by c
oar
se s
and
DC
s-S
25
F
90
C
oar
se s
and
0.7
5
25
San
d g
lued
by f
ine
sand
DC
s-S
45
F
90
C
oar
se s
and
0.7
5
45
San
d g
lued
by f
ine
sand
DC
s-L
25
F
90
C
oar
se s
and
1.6
5
25
San
d g
lued
by f
ine
sand
DF
s-S
25
F
95
F
ine
sand
0.7
5
25
San
d g
lued
by f
ine
sand
DC
s-S
25
P
90
C
oar
se s
and
0.7
5
25
Roughen
ed b
y s
and p
aper
DC
s-S
22
U
90
C
oar
se s
and
0.7
5
22
Sm
ooth
sta
inle
ss s
teel
* T
he
codin
g s
yst
em o
f te
st s
erie
s
D
C
s -
S
2
5
C
Den
sity
sta
te o
f sa
nd
• D
= d
ense
• M
= m
ediu
m d
ense
Sa
nd
typ
e
• C
s =
co
arse
san
d
• F
s =
fin
e sa
nd
Eff
ecti
ve n
ail
len
gth
• S
= 0
.75 m
• L
= 1
.65 m
Nail
dia
mete
r
in m
m
S
urf
ace t
ype
• C
= s
and g
lued
by c
oar
se s
and
• F
= s
and g
lued
by f
ine
sand
• P
= r
ough
ened
by s
and p
aper
• U
= u
ntr
eate
d s
mooth
st
ainle
ss
st
eel

Tab
le 2
.5:
Th
e d
etai
ls o
f p
ull
ou
t te
sts
conduct
ed u
nder
eac
h t
est
seri
es.
Tes
t S
erie
s *
P
ull
ou
t T
est
#
Mod
e of
Pu
llou
t T
est
Co
mp
ress
ed l
ength
of
spri
ng ‘
A’
(mm
)
DC
s-S
25C
-1-S
Q
uas
i S
tati
c
-
DC
s-S
25C
-2-R
H0
Hig
h E
ner
gy R
apid
45
DC
s-S
25C
-3-R
L
Low
En
erg
y R
apid
15,3
0♦
DC
s-S
25C
-4-R
H
Hig
h E
ner
gy R
apid
45
DC
s-S
25
C
DC
s-S
25C
-5-S
Q
uas
i S
tati
c
-
DC
s-S
45C
-1-S
Q
uas
i S
tati
c
-
DC
s-S
45C
-2-R
H
Hig
h E
ner
gy R
apid
70
DC
s-S
45C
-3-R
H
Hig
h E
ner
gy R
apid
70
DC
s-S
45
C
DC
s-S
45C
-4-S
Q
uas
i S
tati
c
-
MC
s-S
25C
-1-S
Q
uas
i S
tati
c
-
MC
s-S
25C
-2-R
H
Hig
h E
ner
gy R
apid
45
MC
s-S
25C
-3-R
H
Hig
h E
ner
gy R
apid
45
MC
s-S
25
C
MC
s-S
25C
-4-S
Q
uas
i S
tati
c
-
DC
s-S
25F
-1-S
Q
uas
i S
tati
c
-
DC
s-S
25F
-2-R
H
Hig
h E
ner
gy R
apid
45
DC
s-S
25F
-3-R
L
Low
En
erg
y R
apid
30
DC
s-S
25F
-4-R
H
Hig
h E
ner
gy R
apid
45
DC
s-S
25
F
DC
s-S
25F
-5-S
Q
uas
i S
tati
c
-
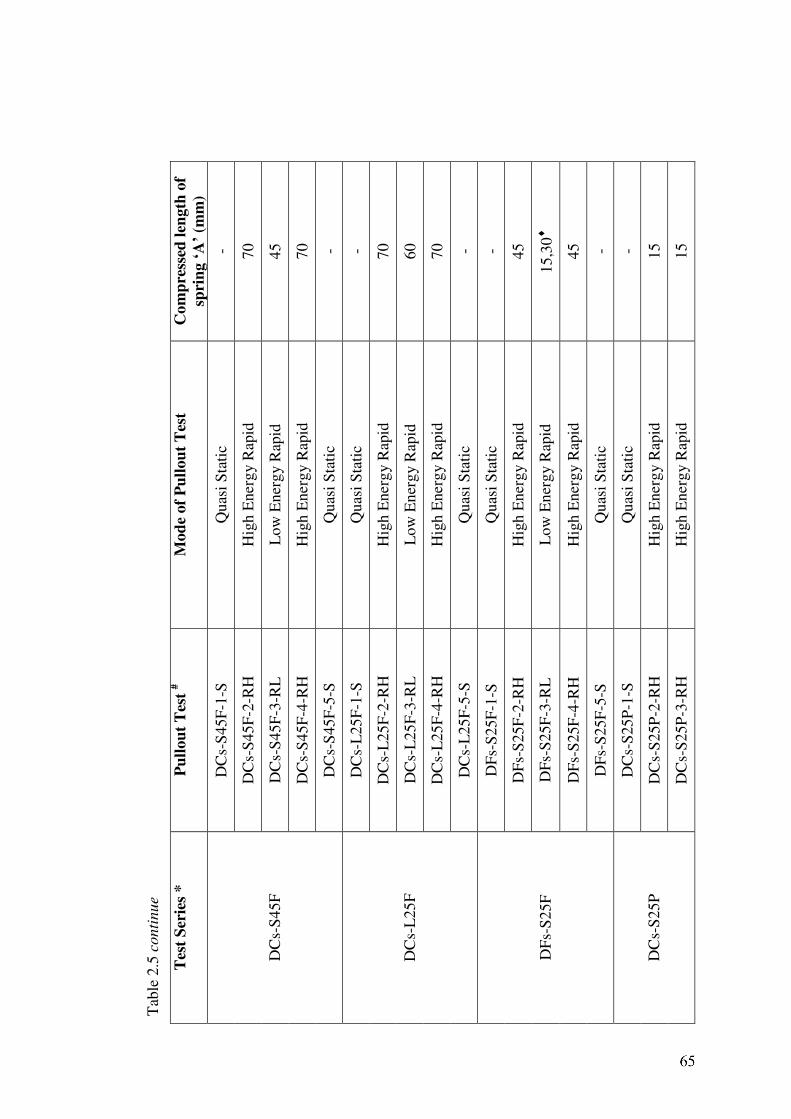
Tab
le 2
.5 c
on
tin
ue
Tes
t S
erie
s *
P
ull
ou
t T
est
#
Mod
e of
Pu
llou
t T
est
Co
mp
ress
ed l
ength
of
spri
ng ‘
A’
(mm
)
DC
s-S
45F
-1-S
Q
uas
i S
tati
c
-
DC
s-S
45F
-2-R
H
Hig
h E
ner
gy R
apid
70
DC
s-S
45F
-3-R
L
Low
En
erg
y R
apid
45
DC
s-S
45F
-4-R
H
Hig
h E
ner
gy R
apid
70
DC
s-S
45
F
DC
s-S
45F
-5-S
Q
uas
i S
tati
c
-
DC
s-L
25
F-1
-S
Quas
i S
tati
c
-
DC
s-L
25
F-2
-RH
H
igh E
ner
gy R
apid
70
DC
s-L
25
F-3
-RL
L
ow
En
erg
y R
apid
60
DC
s-L
25
F-4
-RH
H
igh E
ner
gy R
apid
70
DC
s-L
25
F
DC
s-L
25
F-5
-S
Quas
i S
tati
c
-
DF
s-S
25F
-1-S
Q
uas
i S
tati
c
-
DF
s-S
25F
-2-R
H
Hig
h E
ner
gy R
apid
45
DF
s-S
25F
-3-R
L
Low
En
erg
y R
apid
15,3
0♦
DF
s-S
25F
-4-R
H
Hig
h E
ner
gy R
apid
45
DF
s-S
25
F
DF
s-S
25F
-5-S
Q
uas
i S
tati
c
-
DC
s-S
25P
-1-S
Q
uas
i S
tati
c
-
DC
s-S
25P
-2-R
H
Hig
h E
ner
gy R
apid
15
DC
s-S
25
P
DC
s-S
25P
-3-R
H
Hig
h E
ner
gy R
apid
15
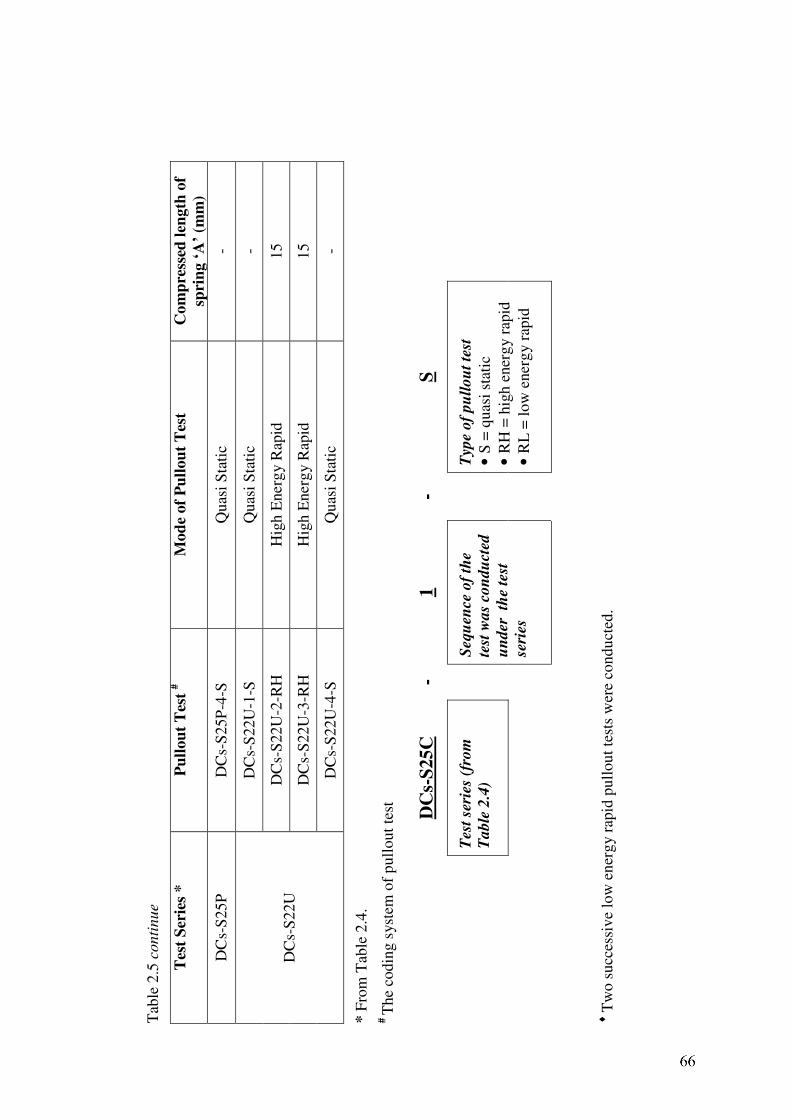
Tab
le 2
.5 c
on
tin
ue
Tes
t S
erie
s *
P
ull
ou
t T
est
#
Mod
e of
Pu
llou
t T
est
C
om
pre
ssed
len
gth
of
spri
ng ‘
A’
(mm
)
DC
s-S
25
P
DC
s-S
25P
-4-S
Q
uas
i S
tati
c
-
DC
s-S
22U
-1-S
Q
uas
i S
tati
c
-
DC
s-S
22U
-2-R
H
Hig
h E
ner
gy R
apid
15
DC
s-S
22U
-3-R
H
Hig
h E
ner
gy R
apid
15
DC
s-S
22
U
DC
s-S
22U
-4-S
Q
uas
i S
tati
c
-
* F
rom
Tab
le 2
.4.
# T
he
codin
g s
yst
em o
f p
ull
ou
t te
st
DC
s-S
25
C
- 1
-
S
Test
seri
es
(fro
m
Ta
ble
2.4
)
Sequ
en
ce o
f th
e
test
was
con
du
cte
d
un
der
th
e t
est
seri
es
Type o
f pu
llou
t te
st
• S
= q
uas
i st
atic
• R
H =
hig
h e
ner
gy r
apid
• R
L =
low
ener
gy r
apid
♦ T
wo s
ucc
essi
ve
low
en
erg
y r
apid
pu
llout
test
s w
ere
condu
cted
.
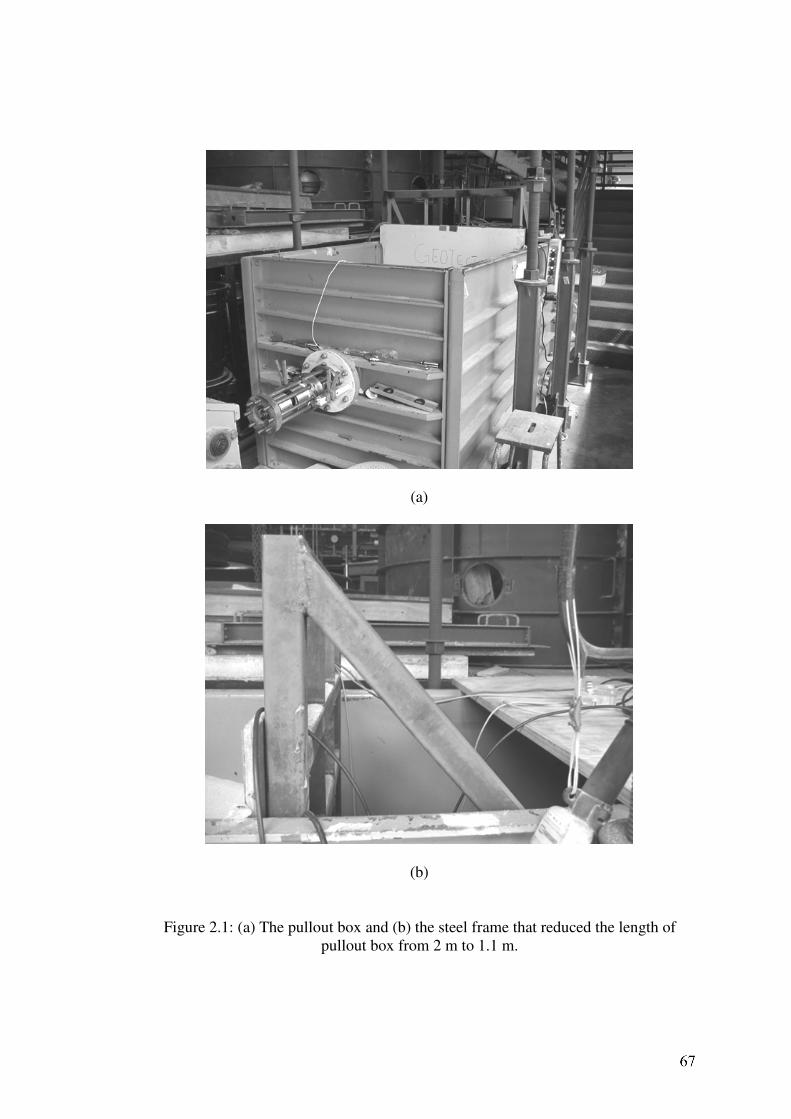
(a)
(b)
Figure 2.1: (a) The pullout box and (b) the steel frame that reduced the length of
pullout box from 2 m to 1.1 m.
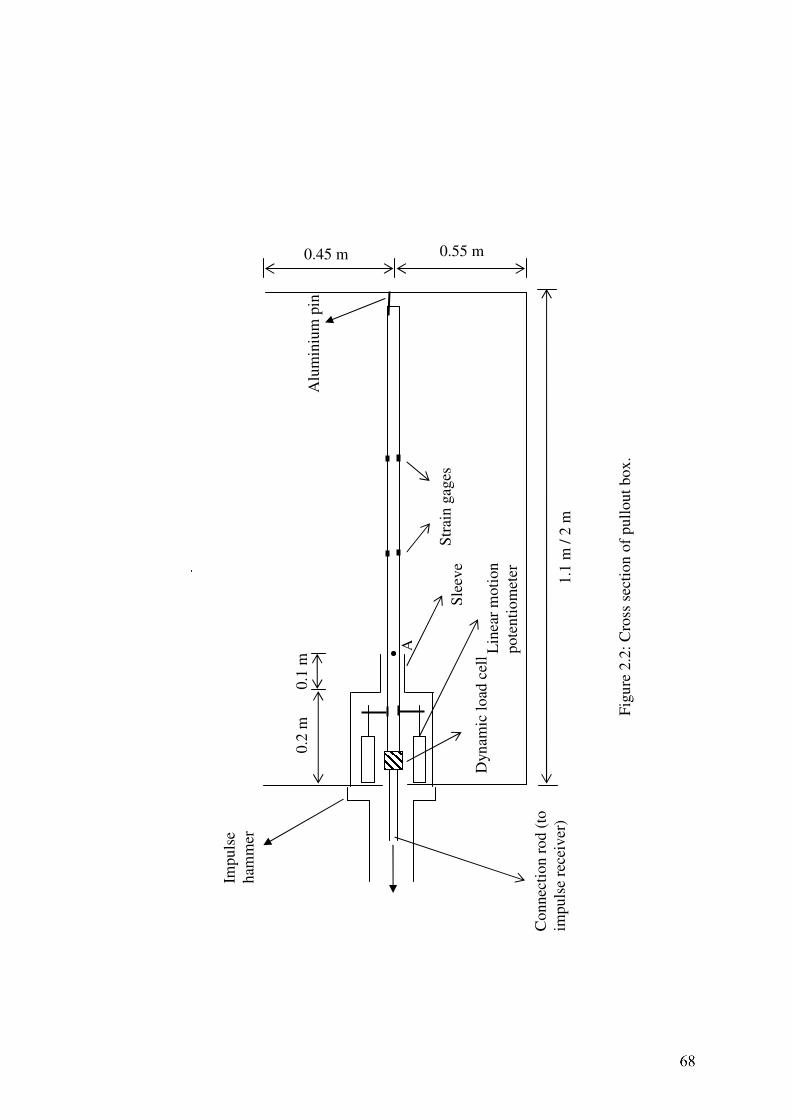
Fig
ure
2.2
: S
ide
vie
w o
f pull
out
box
.
Str
ain g
ages
Dyn
amic
load
cel
l Lin
ear
moti
on
pote
nti
om
eter
Sle
eve
0.2
m
0.1
m
1.1
m /
2 m
Co
nn
ecti
on
ro
d (
to
imp
uls
e re
ceiv
er)
0.55 m 0.45 m
A
Imp
uls
e
ham
mer
Alu
min
ium
pin
Fig
ure
2.2
: C
ross
sec
tion
of
pull
out
box
.
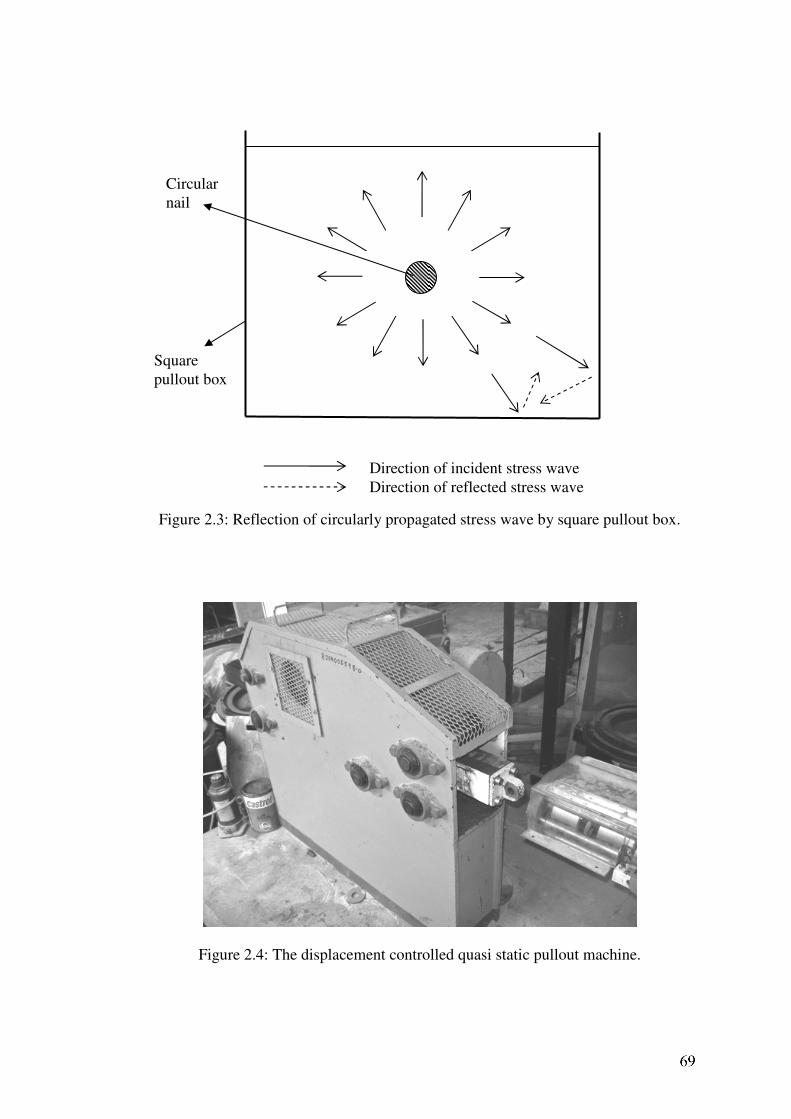
Figure 2.3: Reflection of circularly propagated stress wave by square pullout box.
Figure 2.4: The displacement controlled quasi static pullout machine.
Direction of incident stress wave
Direction of reflected stress wave
Square
pullout box
Circular
nail
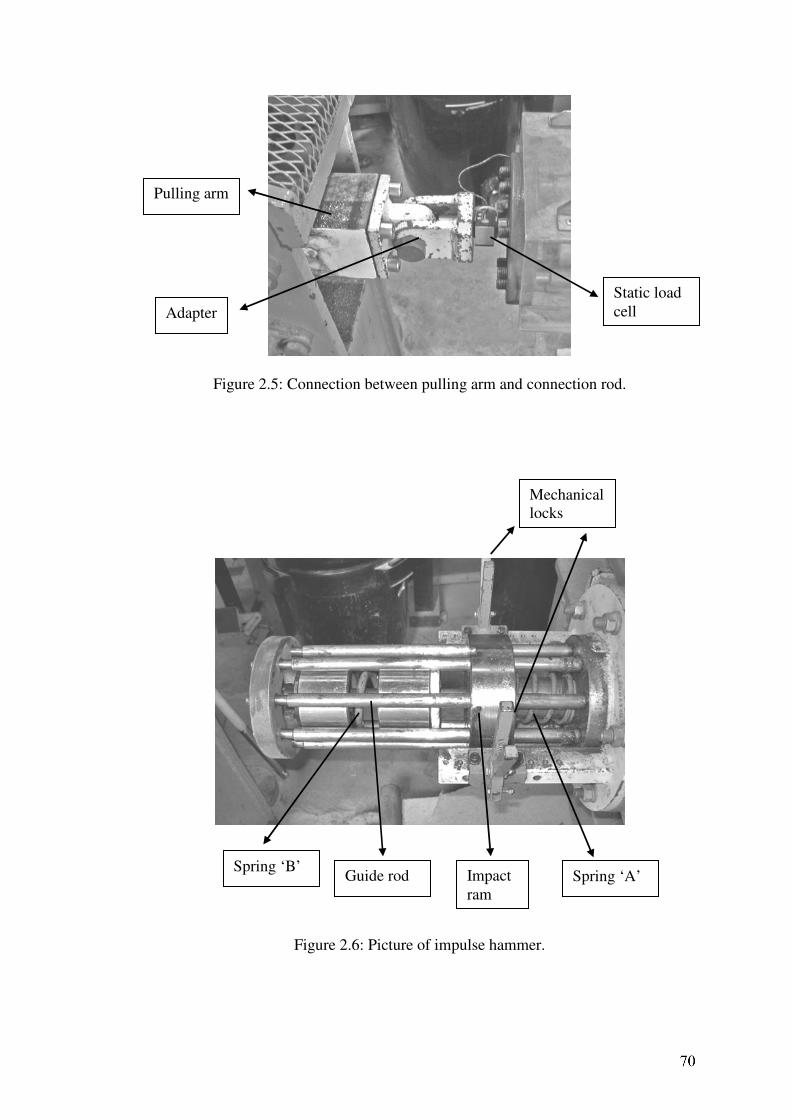
Figure 2.5: Connection between pulling arm and connection rod.
Figure 2.6: Picture of impulse hammer.
Static load
cell
Pulling arm
Adapter
Guide rod Impact
ram
Spring ‘A’ Spring ‘B’
Mechanical
locks
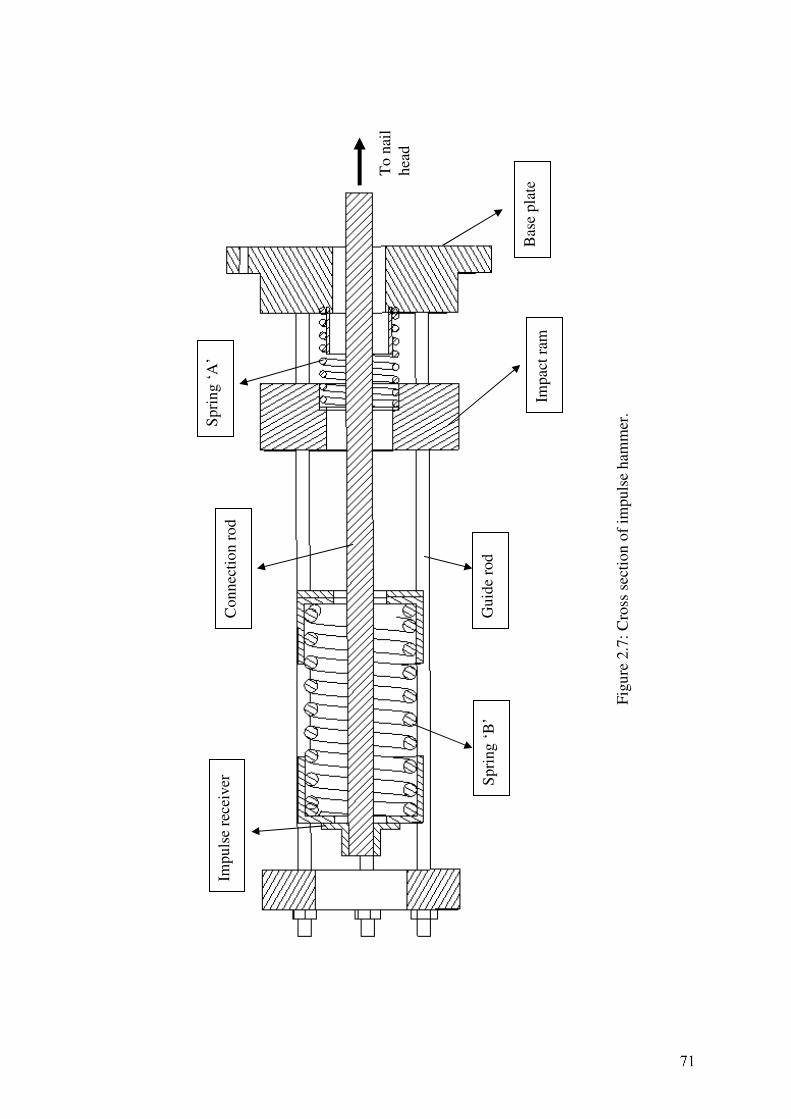
Fig
ure
2.7
: C
ross
sec
tion
of
impuls
e ham
mer
.
Imp
uls
e re
ceiv
er
Connec
tion r
od
Spri
ng ‘
A’
Spri
ng ‘
B’
Guid
e ro
d
Impac
t ra
m
Bas
e pla
te T
o n
ail
hea
d
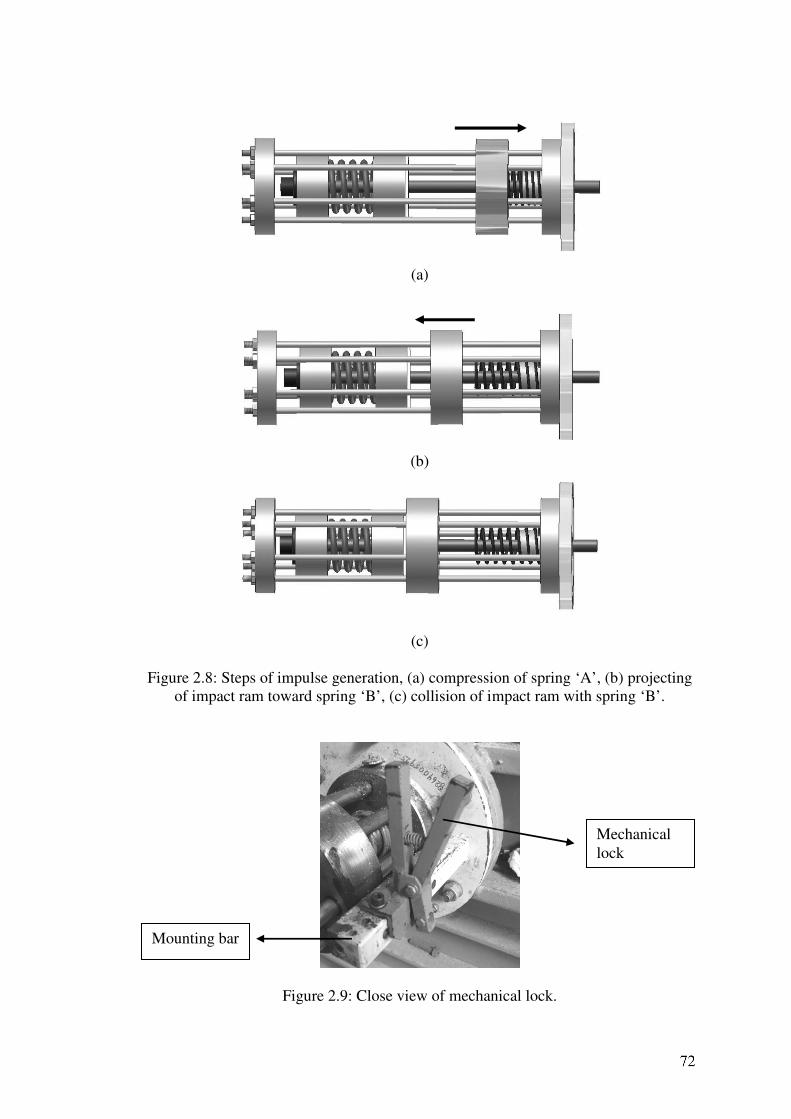
(a)
(b)
(c)
Figure 2.8: Steps of impulse generation, (a) compression of spring ‘A’, (b) projecting
of impact ram toward spring ‘B’, (c) collision of impact ram with spring ‘B’.
Figure 2.9: Close view of mechanical lock.
Mechanical
lock
Mounting bar
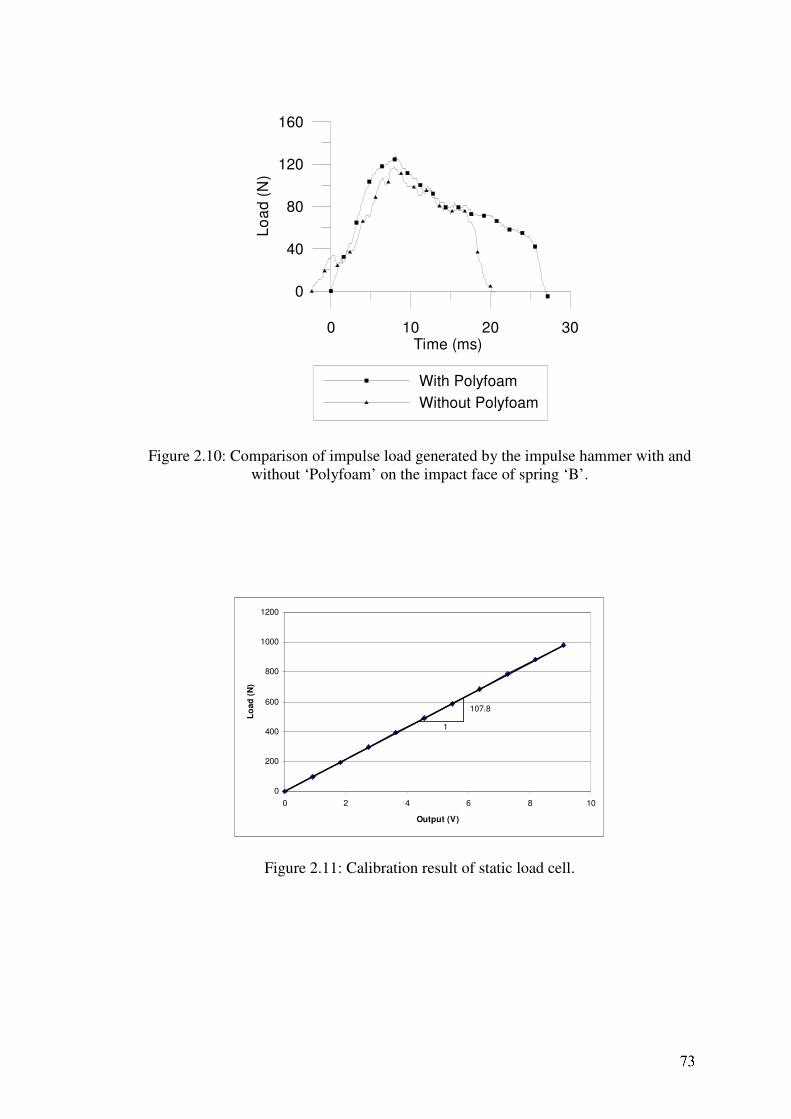
0 10 20 30Time (ms)
0
40
80
120
160
Lo
ad
(N
)
With Polyfoam
Without Polyfoam
Figure 2.10: Comparison of impulse load generated by the impulse hammer with and
without ‘Polyfoam’ on the impact face of spring ‘B’.
0
200
400
600
800
1000
1200
0 2 4 6 8 10
Output (V)
Lo
ad
(N
)
107.8
1
Figure 2.11: Calibration result of static load cell.
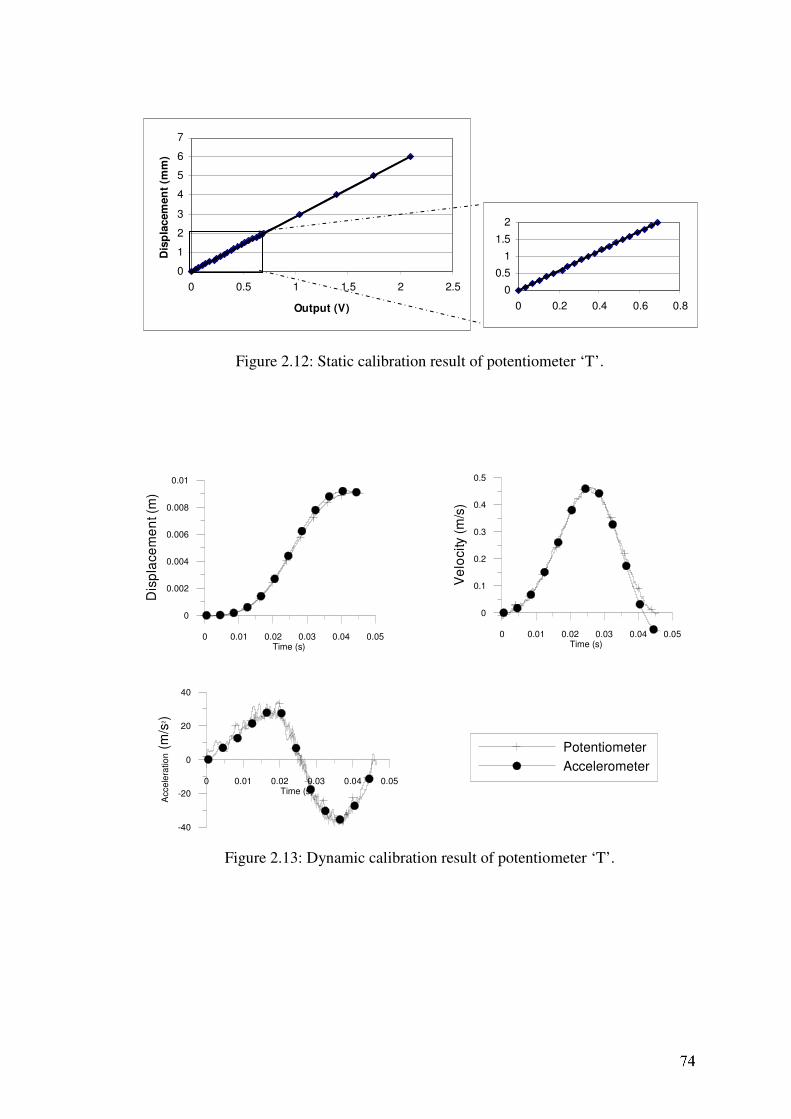
Figure 2.12: Static calibration result of potentiometer ‘T’.
0 0.01 0.02 0.03 0.04 0.05Time (s)
0
0.002
0.004
0.006
0.008
0.01
Dis
pla
ce
me
nt (m
)
0 0.01 0.02 0.03 0.04 0.05Time (s)
0
0.1
0.2
0.3
0.4
0.5
Ve
locity (
m/s
)
0 0.01 0.02 0.03 0.04 0.05Time (s)
-40
-20
0
20
40
Accele
ratio
n (
m/s
2)
Potentiometer
Accelerometer
Figure 2.13: Dynamic calibration result of potentiometer ‘T’.
0
1
2
3
4
5
6
7
0 0.5 1 1.5 2 2.5
Output (V)
Dis
pla
cem
en
t (m
m)
0
0.5
1
1.5
2
0 0.2 0.4 0.6 0.8
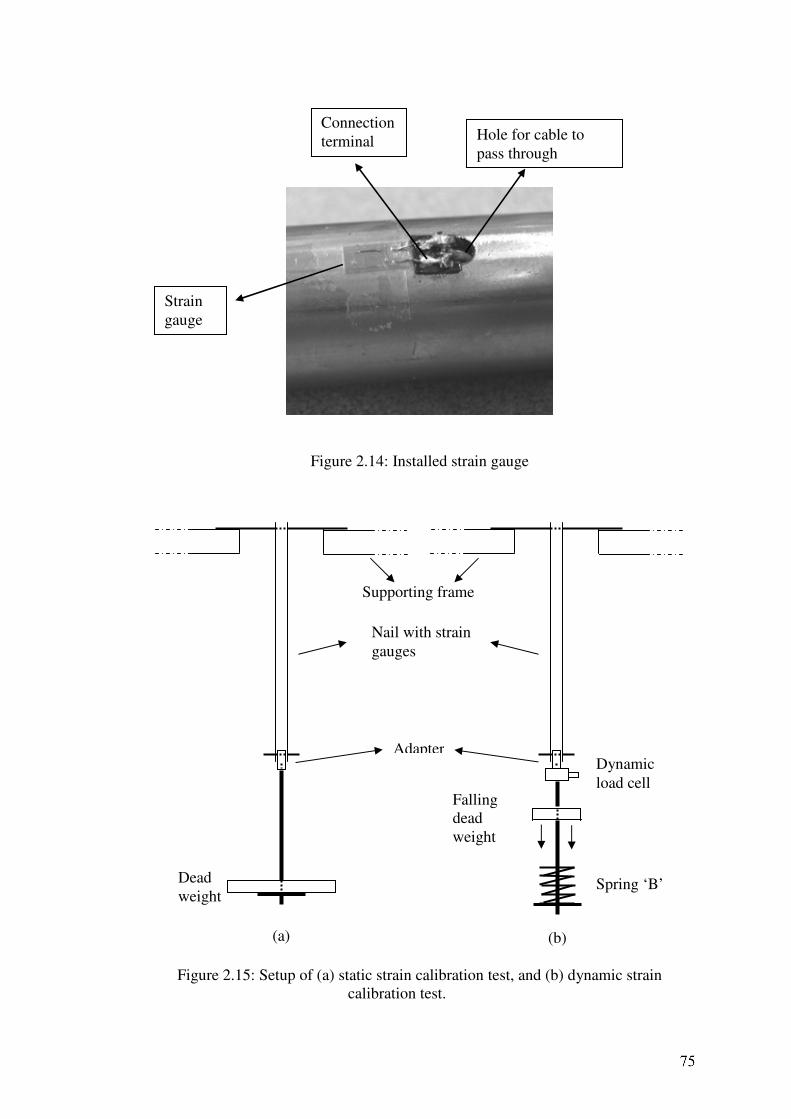
Figure 2.14: Installed strain gauge
Figure 2.15: Setup of (a) static strain calibration test, and (b) dynamic strain
calibration test.
Supporting frame
Nail with strain
gauges
Dynamic
load cell
Adapter
Spring ‘B’ Dead
weight
Falling
dead
weight
Strain
gauge
Connection
terminal Hole for cable to
pass through
(a) (b)
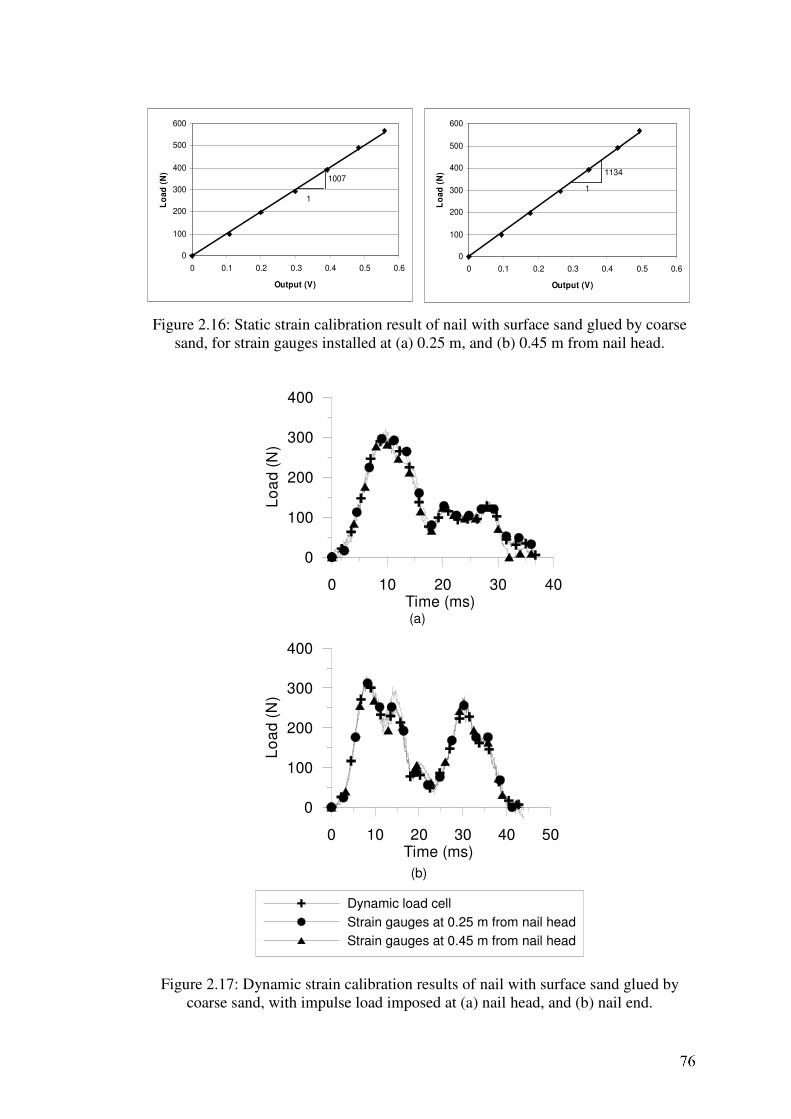
Figure 2.16: Static strain calibration result of nail with surface sand glued by coarse
sand, for strain gauges installed at (a) 0.25 m, and (b) 0.45 m from nail head.
0 10 20 30 40Time (ms)
0
100
200
300
400
Lo
ad
(N
)
0 10 20 30 40 50Time (ms)
0
100
200
300
400
Lo
ad
(N
)
Dynamic load cell
Strain gauges at 0.25 m from nail head
Strain gauges at 0.45 m from nail head
(a)
(b)
Figure 2.17: Dynamic strain calibration results of nail with surface sand glued by
coarse sand, with impulse load imposed at (a) nail head, and (b) nail end.
0
100
200
300
400
500
600
0 0.1 0.2 0.3 0.4 0.5 0.6
Output (V)
Lo
ad
(N
)
1007
1
0
100
200
300
400
500
600
0 0.1 0.2 0.3 0.4 0.5 0.6
Output (V)
Lo
ad
(N
) 1134
1
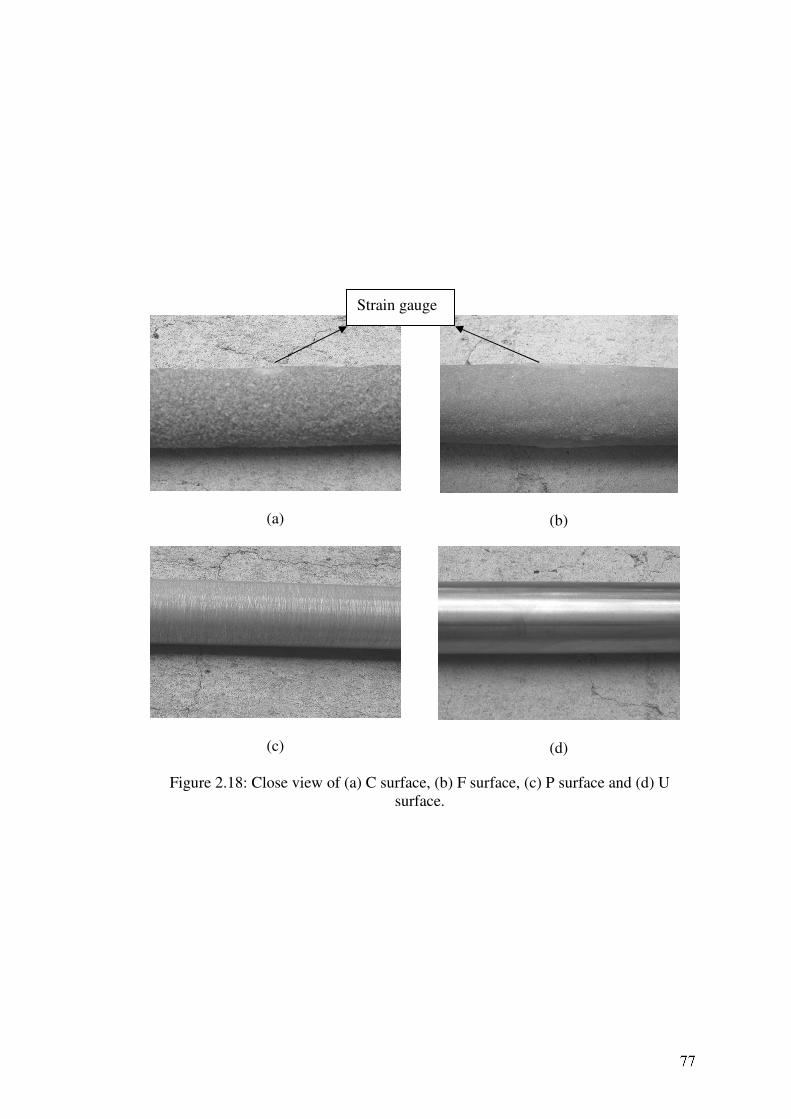
(a)
(b)
(c)
(d)
Figure 2.18: Close view of (a) C surface, (b) F surface, (c) P surface and (d) U
surface.
Strain gauge
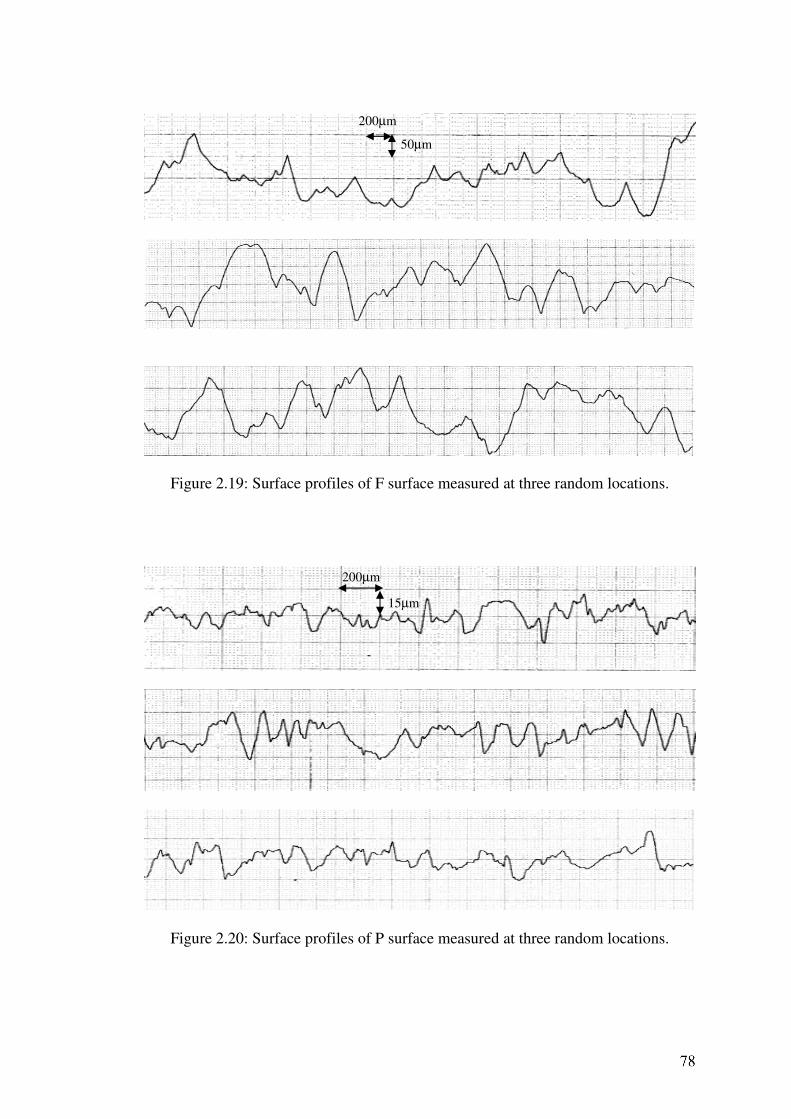
Figure 2.19: Surface profiles of F surface measured at three random locations.
Figure 2.20: Surface profiles of P surface measured at three random locations.
50µm
15µm
200µm
200µm
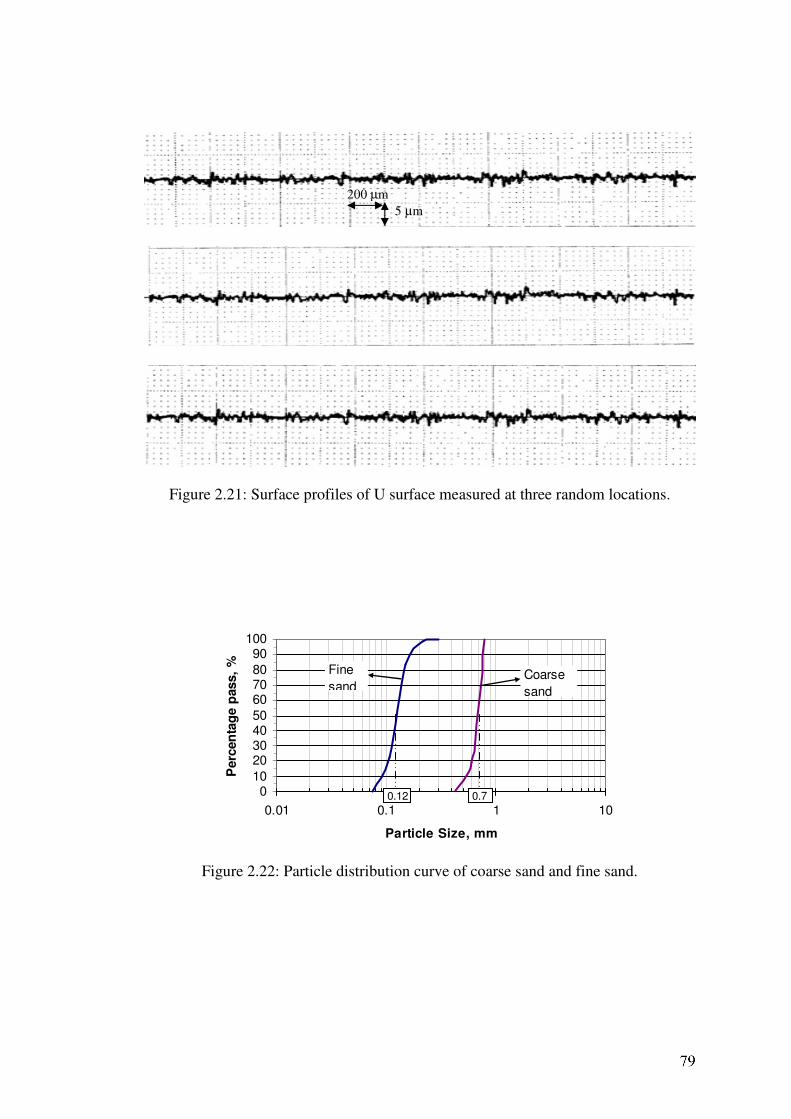
Figure 2.21: Surface profiles of U surface measured at three random locations.
0102030405060708090
100
0.01 0.1 1 10
Particle Size, mm
Perc
en
tag
e p
ass,
%
Coarse
sand
Fine
sand
0.12 0.7
Figure 2.22: Particle distribution curve of coarse sand and fine sand.
5 µm
200 µm
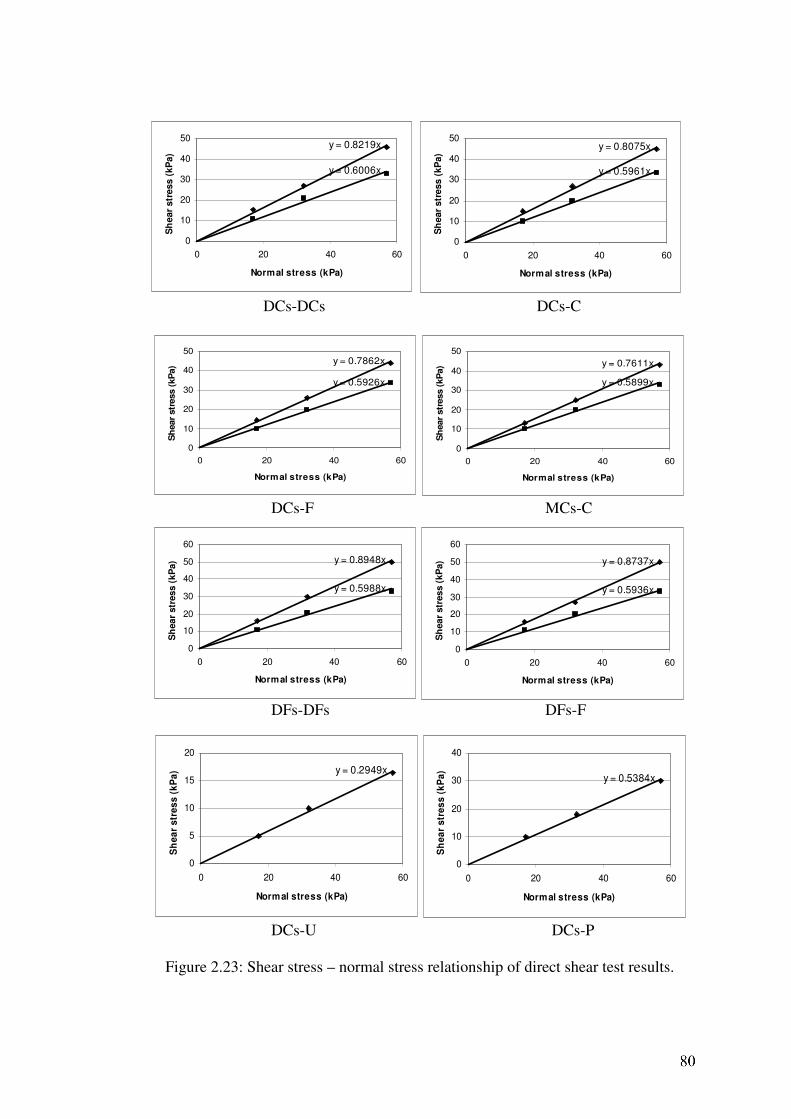
DCs-DCs DCs-C
DCs-F MCs-C
DFs-DFs DFs-F
DCs-U DCs-P
Figure 2.23: Shear stress – normal stress relationship of direct shear test results.
y = 0.6006x
y = 0.8219x
0
10
20
30
40
50
0 20 40 60
Normal stress (kPa)
Sh
ear
str
ess
(kP
a)
y = 0.5961x
y = 0.8075x
0
10
20
30
40
50
0 20 40 60
Normal stress (kPa)
Sh
ear
str
ess
(kP
a)
y = 0.5926x
y = 0.7862x
0
10
20
30
40
50
0 20 40 60
Normal stress (kPa)
Sh
ear
str
ess (
kP
a)
y = 0.5899x
y = 0.7611x
0
10
20
30
40
50
0 20 40 60
Normal stress (kPa)
Sh
ear
str
ess (
kP
a)
y = 0.2949x
0
5
10
15
20
0 20 40 60
Normal stress (kPa)
Sh
ea
r s
tre
ss
(k
Pa
)
y = 0.5384x
0
10
20
30
40
0 20 40 60
Normal stress (kPa)
Sh
ea
r s
tre
ss
(k
Pa
)
y = 0.5988x
y = 0.8948x
0
10
20
30
40
50
60
0 20 40 60
Normal stress (kPa)
Sh
ear
str
ess (
kP
a)
y = 0.5936x
y = 0.8737x
0
10
20
30
40
50
60
0 20 40 60
Normal stress (kPa)
Sh
ear
str
ess (
kP
a)
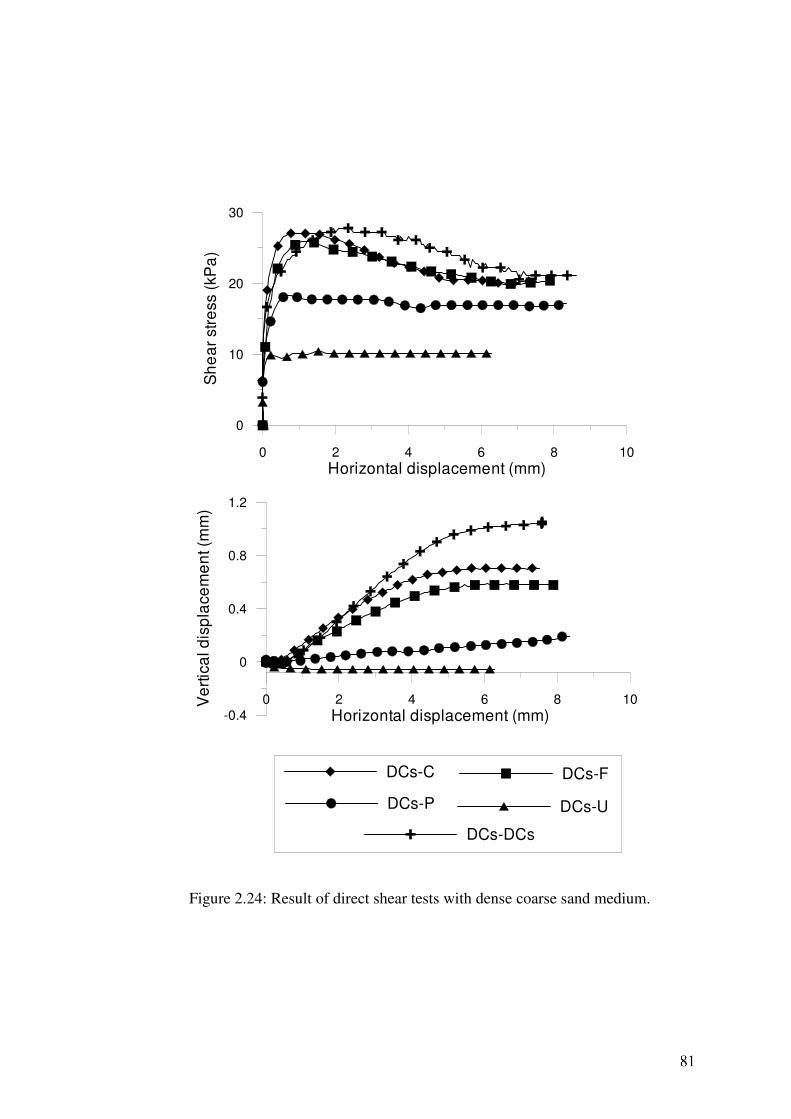
0 2 4 6 8 10
Horizontal displacement (mm)
0
10
20
30S
he
ar
stre
ss (
kPa
)
0 2 4 6 8 10
Horizontal displacement (mm)-0.4
0
0.4
0.8
1.2
Ve
rtic
al d
isp
lace
me
nt (
mm
)
DCs-C DCs-F
DCs-P DCs-U
DCs-DCs
Figure 2.24: Result of direct shear tests with dense coarse sand medium.
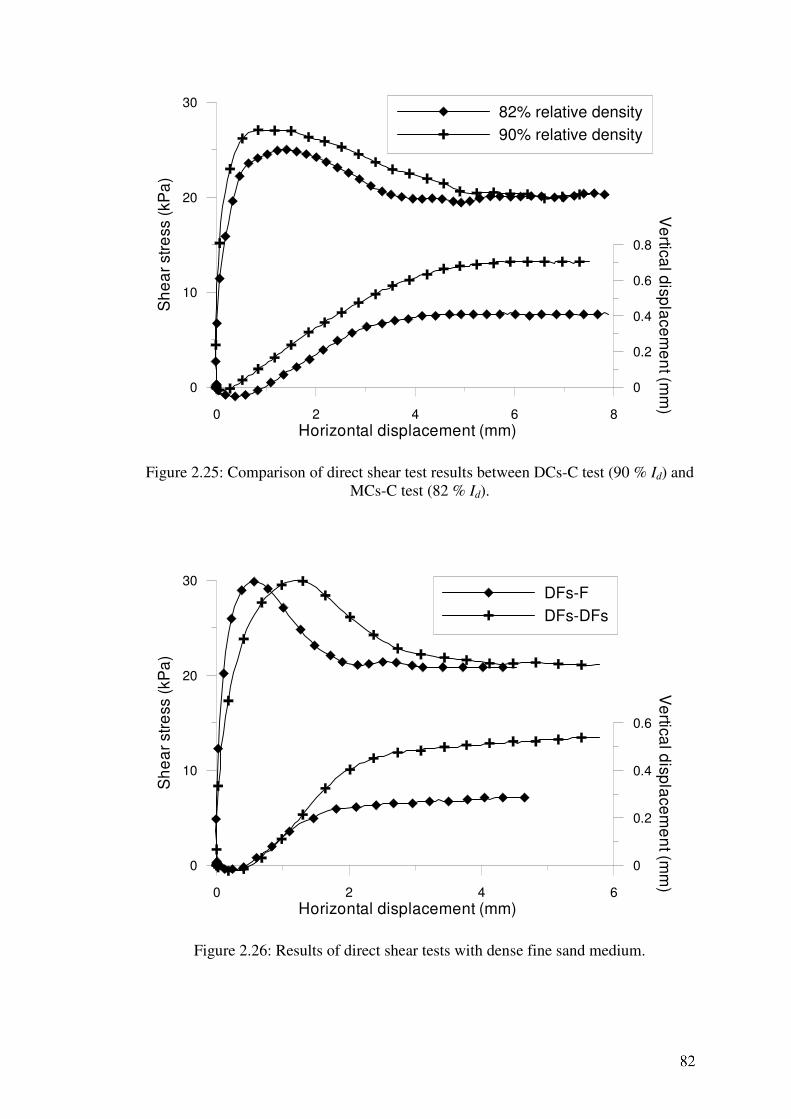
0 2 4 6 8
Horizontal displacement (mm)
0
10
20
30
Sh
ea
r st
ress
(kP
a)
0
0.2
0.4
0.6
0.8
Ve
rtical d
ispla
ce
me
nt (m
m)
82% relative density
90% relative density
Figure 2.25: Comparison of direct shear test results between DCs-C test (90 % Id) and
MCs-C test (82 % Id).
0 2 4 6
Horizontal displacement (mm)
0
10
20
30
Sh
ea
r st
ress
(kP
a)
0
0.2
0.4
0.6
Ve
rtical d
ispla
ce
me
nt (m
m)
DFs-F
DFs-DFs
Figure 2.26: Results of direct shear tests with dense fine sand medium.
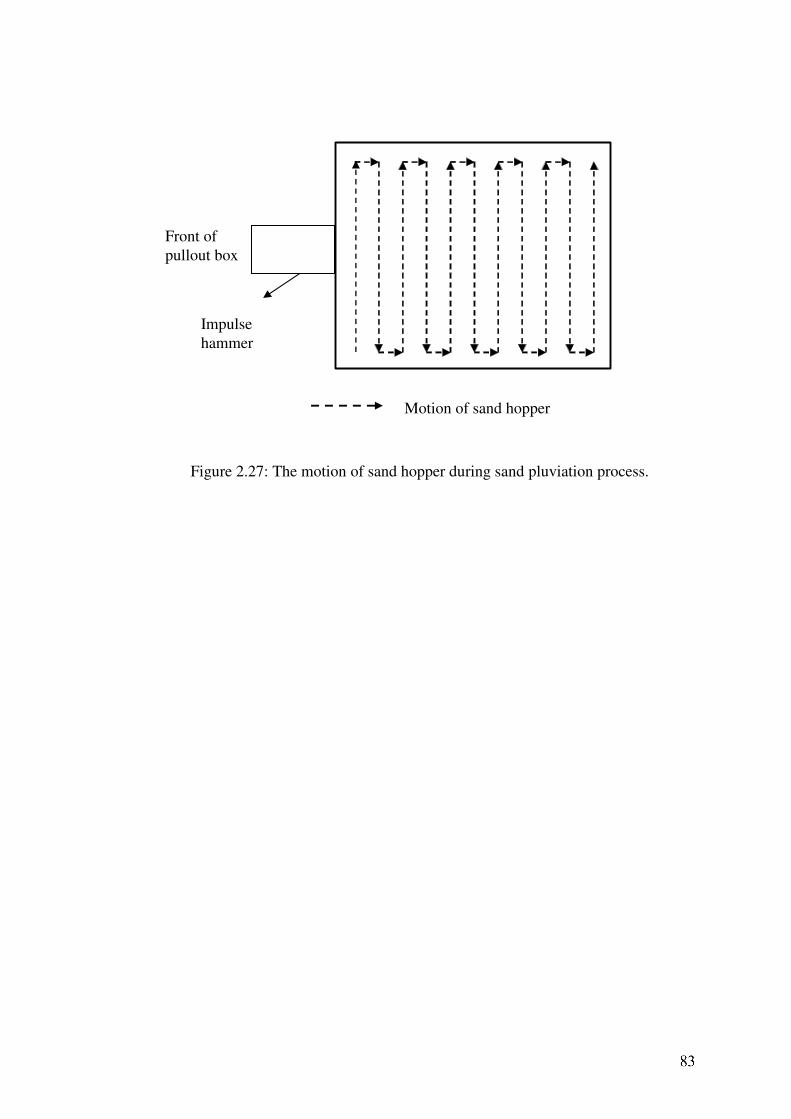
Figure 2.27: The motion of sand hopper during sand pluviation process.
Impulse
hammer
Front of
pullout box
Motion of sand hopper

Chapter 3: The Quasi Static Pullout Test
3.1 Introduction
A good understanding of the characteristic of quasi static pullout response will
greatly facilitate the interpretation of rapid pullout test results in the next chapter. In
this chapter, the quasi static pullout response of nails with different surface roughness
conditions will be examined in detail, focusing on load displacement characteristic,
peak pullout strength and the degree of restrained dilatancy effect.
In the discussion, the nails are categorized into ‘rough nail’ and ‘smooth nail’
according to the normalized roughness Rn of nail surface as pointed out in Section
2.6.2.2 of Chapter 2. The nails with C surface (sand glued by coarse sand) and F
surface (sand glued by fine sand) are categorized as rough nail while the nails with P
surface (roughened by sand paper) and U surface (untreated stainless steel surface) are
categorized as smooth nail.
3.2 The Plot of Load Displacement Curve
The quasi static load displacement curves of every test series are plotted as
plots (a) in Figure 3.1 to Figure 3.9. Both of the identical quasi static pullout tests that
were conducted under each test series are plotted together in the same figure for clear
examination of any variation in between tests. A new sand medium was prepared for
every pullout tests conducted in these experiments.
For pullout tests under DCs-S25C test series, MCs-S25C test series, DCs-
S25F test series, and DCs-S45F test series, measurements of axial body strains were
made along the nail by strain gauges at points 0.25 m and 0.45 m from nail head.
While for pullout tests under DCs-L25F test series with 1.65 m of effective nail length,
the strain measurements were made at points 0.4 m, 0.8 m and 1.2 m from nail head.
The strain measurement results, after being converted into axial body load by
multiplying the voltage output of strain gauges with the calibration factors determined
in Section 2.5.3, are also plotted together with their corresponding load displacement
curve (measurement at nail head by load cell).
The load displacement curves of quasi static reload tests that were conducted
directly after the primary quasi static pullout tests are plotted as plot (b) in Figure 3.1
to Figure 3.9. The scale of load axes (vertical axes) of plot (a) and plot (b) in these
figures were made identical for easier comparison of maximum reloading strength to
the corresponding peak and residual quasi static pullout strength.
3.2.1 Repeatability of Test Results
From Figure 3.1 to Figure 3.9, it can be seen that the load displacement curves
and the axial body load vs. pullout displacement curves of both quasi static pullout
tests under the same test series were well matched to each other with minor
differences. This observation indicates that the test conditions, including the
conditions of sand medium and nail surface, of these pullout tests were fairly identical
and repeatable.
The consistency of sand medium constructed by the air pluviation procedures
applied to these experiments has been shown by the results of sand density calibration
test presented in Section 2.7.3. These calibration tests showed that all sand samples
constructed by the same air pluviation procedures and conditions were consistent and
virtually identical to each other. The consistency of sand medium formed by air
pluviation method was also illustrated by several researchers such as Miura and Toki
(1982), Presti et.al. (1993) and Fretti et.al. (1995).
It has been mentioned in Section 2.8 of Chapter 2 that both of the quasi static
pullout tests were conducted as the first and the last pullout test under each test series
(Table 2.5). Thus, the consistency and the repeatability of these quasi static pullout
test results imply that the roughness condition of nail surface was not severely
degraded throughout the series of tests. This means that the condition of nail surface
was virtually consistent for all pullout tests under the same test series, including the
high energy and the low energy rapid pullout tests which were conducted in between
that two quasi static pullout tests (Table 2.5). This deduction is important because the
comparison between quasi static pullout test and rapid pullout test is only sensible if
the condition of nail surface is identical in both quasi static and rapid pullout tests.
3.3 Quasi Static Pullout Response
3.3.1 Rough Nail
The quasi static load displacement curves of all series of tests on rough nail
are presented in Figure 3.1 to Figure 3.7. It can be seen from these figures that the
shape of these load displacement curves were identical: with hyperbolic load
displacement response up to the peak pullout stage and then followed by softening
behaviour in the post peak region. Clear peak pullout strength was attained in all tests.
The shape of these load displacement curves is typical for rough nail embedded in
dense dilative soil (Schlosser and Elias, 1978, Franzen, 1998).
The pullout displacement up(s)
required to achieve the peak quasi static pullout
strength of all series of tests on rough nail are given in Table 3.1. For test series with
coarse sand medium (DCs-S25C test series, DCs-S45C test series, DCs-S25F test
series, DCs-S45Ftest series and MCs-S25C test series), the up(s)
were approximately
in the range of 2.5 mm to 3.5 mm. While for test series with fine sand medium (DFs-
S25F test series), the up(s)
was only 1.3 mm, significantly lower than the up(s)
of tests
with coarse sand medium. This result implies that the up(s)
for rough nails embedded in
dense sand is highly influenced by the mean particle size of sand medium.
Figure 3.10 compares the load displacement curves of DCs-S25C-1-S test,
DCs-S45C-1-S test, DCs-S25F-1-S test and DCs-S45F-1-S test. It is important to note
that the initial stiffness Ksi of these curves were in good agreement to each other, and
the curves only started to diverge when approaching their peak quasi static pullout
strength. It is interesting to observe that the load displacement curves of DCs-S25C-1-
S test and DCs-S45F-1-S test that had nearly identical peak quasi static pullout
strength were approximately matched to each other, despite the variation in surface
roughness and nail diameter. Besides, the point of peak quasi static pullout strength of
these tests can also be traced by a straight line from the origin, the stiffness of this
straight line, which can be termed as the secant stiffness at peak Ksp. The similar of
initial stiffness and secant stiffness at peak of these tests suggests that the pre peak
quasi static load displacement stiffness of rough nail embedded in the same dense
sand medium is mainly affected by the level of peak pullout strength but less
influenced by nail diameter. The high influence of peak pullout strength in turn
suggests the important role of restrained dilatancy effect because the difference in
peak quasi static pullout strength between the tests compared in Figure 3.10 is found
to be mainly contributed by the restrained dilatancy effect (Section 3.5). Similar
observation was also made from the soil nails pullout test results reported by Tei
(1993) and pile tension test results reported by Lehane et.al. (2005).
Figure 3.11 compares the load displacement curves of DCs-S25C-1-S test and
MCs-S25C-1-S test. It can be seen that both curves started to diverge from the
beginning of pullout response (in relative to the response of tests compared in Figure
3.10), and the point of peak pullout strength of both tests can not be joined by a
straight line from the origin. This means that the initial stiffness and secant stiffness at
peak of both tests are dissimilar despite the small variation in sand density.
Comparatively the initial stiffness and secant stiffness at peak of MCs-S25C-1-S test
were smaller than those of DCs-S25C-1-S test (Figure 3.11). This observation
suggests the significant influence of sand density on the pullout stiffness.
In Figure 3.1 to Figure 3.7, except Figure 3.2, the axial body load
measurements made along the nails by strain gauges are also plotted. From the curves
of axial body load versus pullout displacement of nail head, it is revealed that the
shape and the pullout displacement required to achieve the peak pullout stage of these
curves were very similar to those of corresponding load displacement curves
measured at nail head. These observations suggest that the nails, even for nail with
1.65 m of effective nail length (DCs-L25F test series), were stiff enough to behave as
rigid body in the pullout and the extensibility of the nails was relatively insignificant
to cause the lag (in terms of nail head pullout displacement) in mobilization of shaft
resistance along the nails (Gurung et.al., 1999).
Beyond the peak pullout stage, softening behaviour was observed. However,
residual pullout strength that is constant with the increase in pullout displacement was
not clearly achieved by these quasi static pullout tests as the post peak pullout
response was still in gentle decreasing trend at the end of these tests, even the post
peak pullout displacement was as high as 15 mm (DCs-S25C-5-S test in Figure 3.1).
Further increase in pullout displacement was not allowed in these experiments due to
the limited measuring range of potentiometers. This response agrees with the post
peak pullout behaviour of ribbed steel bar embedded in dense sand observed by
Schlosser and Elias (1978) and the tension pullout response of 40 mm diameter rough
model pile embedded in dense sand observed by Alawneh et.al. (1999).
3.3.2 Smooth Nail
The quasi static load displacement curves of test series with smooth nail
surface, the DCs-S22U test series (U surface, untreated smooth stainless steel) and the
DCs-S25P test series (P surface, roughened by sand paper) are plotted in Figure 3.8
and Figure 3.9 respectively. From these figures, the load displacement behaviour of
smooth nails is observed to be totally different from the load displacement behaviour
of rough nails. Clear peak pullout stage and post peak softening behaviour which were
common for tests on rough nail surface were not observed at all in the results of tests
on smooth nail.
The pullout displacement required to achieve the maximum pullout strength of
DCs-S22U test series was very small, only approximately 0.5 mm (Figure 3.8), which
was much smaller than the pullout displacement required to achieve the peak pullout
strength of rough nail embedded in similar sand medium. After reaching the
maximum pullout strength, the load displacement curve of DCs-S22U test series
became a plateau with constant pullout strength. This behaviour is opposite to the
softening behaviour observed in tests on rough nail (Figure 3.1 to Figure 3.7), but
agrees well with the results of direct shear test on U surface (Section 2.7.2).
For DCs-S25P test series with P surface (Figure 3.9), the quasi static load
displacement behaviour at small pullout displacement (< 0.5 mm) was quite similar to
the behaviour of DCs-S22U test series. However, after approximately 1 mm of pullout
displacement, the load displacement behaviour of DCs-S25P test series had turned
into hardening behaviour with its pullout strength continually increased with the
increase in pullout displacement. The hardening rate (in terms of pullout displacement)
was fairly constant up to 11 mm of pullout displacement, the end of the test.
3.4 Quasi Static Load Distribution Curve
The load distribution curves of axial body load measured along the nail are
extracted from Figure 3.1 to Figure 3.7 (except Figure 3.2) and plotted in Figure 3.12
for pullout stages corresponding to 50 % and 100 % of peak quasi static pullout
strength. These plots clearly show that the load distribution curves of all series of tests
were fairly linear even for test series with 1.65 m of effective nail length (DCs-L25F
test series). The linearity of these load distribution curves again suggests that all nails
considered in these experiments behaved as rigid body in pullout tests.
Besides, the linearity of load distribution curve also indicates minimal
influence of rigid front wall on the pullout response because it indirectly shows the
uniform distribution of unit shaft resistance along the nails irregardless of distance
from the rigid wall in front (Farrag et.al., 1993).
3.5 Peak Quasi Static Pullout Strength and Restrained Dilatancy Effect
The peak or maximum quasi static pullout strength, the apparent ratio of
friction coefficient f and the ratio of friction coefficient µ. of all series of tests are
given in Table 3.1. The f and µ were defined by Eq. 3.1 to Eq. 3.3 (Milligan and Tei,
1998). Since the peak or maximum pullout strength of both quasi static pullout tests
conducted under the same test series were nearly identical, only the average peak
pullout strength of both tests is given in Table 3.1. For DCs-S25P test series, the
maximum pullout strength was taken as the pullout load mobilized at maximum
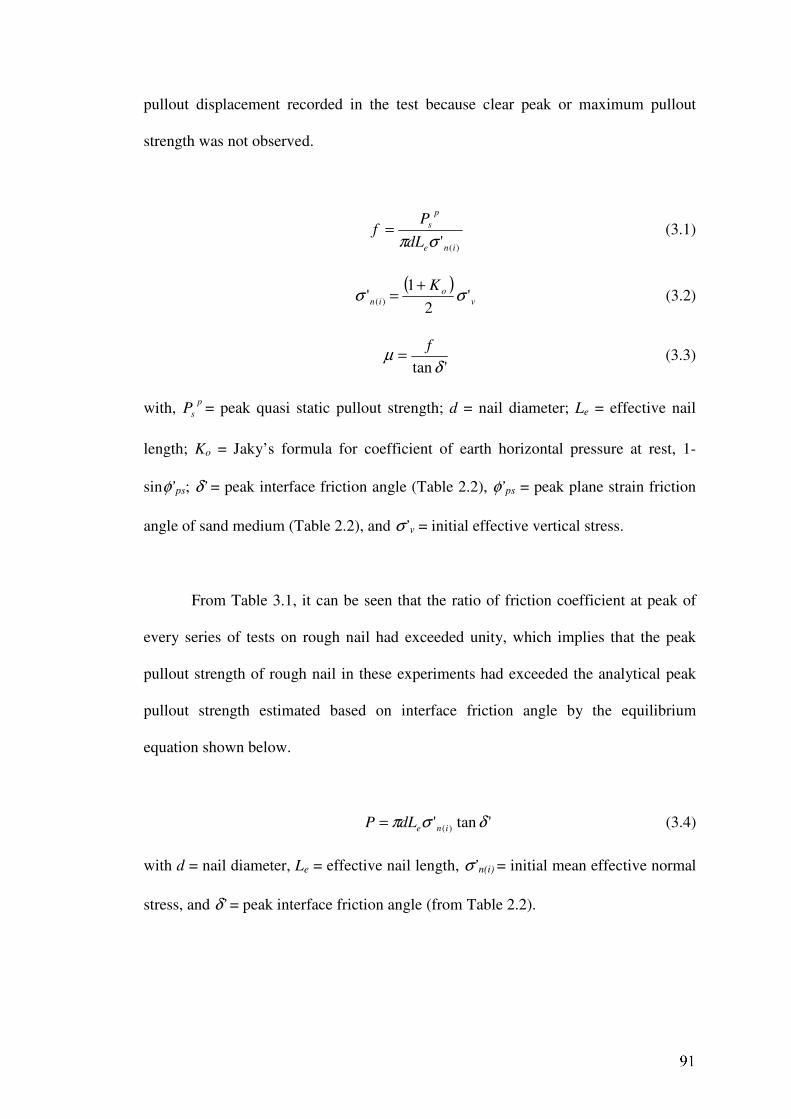
pullout displacement recorded in the test because clear peak or maximum pullout
strength was not observed.
)(' ine
p
s
dL
Pf
σπ= (3.1)
( )v
o
in
K'
2
1' )( σσ
+= (3.2)
'tanδµ
f= (3.3)
with, p
sP = peak quasi static pullout strength; d = nail diameter; Le = effective nail
length; Ko = Jaky’s formula for coefficient of earth horizontal pressure at rest, 1-
sinφ’ps; δ’ = peak interface friction angle (Table 2.2), φ’ps = peak plane strain friction
angle of sand medium (Table 2.2), and σ’v = initial effective vertical stress.
From Table 3.1, it can be seen that the ratio of friction coefficient at peak of
every series of tests on rough nail had exceeded unity, which implies that the peak
pullout strength of rough nail in these experiments had exceeded the analytical peak
pullout strength estimated based on interface friction angle by the equilibrium
equation shown below.
'tan' )( δσπ inedLP = (3.4)
with d = nail diameter, Le = effective nail length, σ’n(i) = initial mean effective normal
stress, and δ’ = peak interface friction angle (from Table 2.2).
The ratio of friction coefficient at peak that is larger than unity was also
observed by Schlosser and Elias (1978), Guilloux et.al. (1979), Cartier and Gigan
(1983), Ignold (1983), Heymann (1993) and Milligan and Tei (1998) on the pullout
response of planar reinforcement or soil nail embedded in dense dilative soil. This
phenomenon was also observed by Horvath and Kenney (1980), Stewart and Kulhawy
(1981) and Jardine and Chow (1996) on the interfacial shaft resistance of pile.
Schlosser (1982) attributed this phenomenon to the restrained dilatancy effect.
Restrained dilatancy effect is generated by the restraining effect of relatively
undisturbed outer field soil medium on the dilative response of high strain weaken
zone adjacent to interface. This restraining effect enhances the normal stress acting on
interface and subsequently enhances the interfacial resistance. This hypothesis is
supported by the direct physical measurements on enhancement of interfacial
effective normal stress in pullout, reported by the French National Research Project
Clouterre (1991) on soil nail and ground anchor, Johnston and Romstad (1989) on
Geogrids and Stewart and Kulhawy (1981) on uplift drilled shaft.
The enhancement in normal stress caused by restrained dilatancy effect was
also observed by Guilloux et.al. (1979), Sobolevsky (1995), and Evgin and Fakharian
(1996) on laboratory direct or simple shear tests with constant normal stiffness.
Guilloux et.al. (1979) recorded an increase in normal stress up to 14 times of the
initial normal stress when the normal displacement of a direct shear test was fully
restrained. Sobolevsky (1995) studied this phenomenon by the dilatometer, a device
that similar to direct shear test but with controllable normal stiffness. Sobolevsky
(1995) demonstrated that the enhancement in normal stress was increasing with the
increase in normal stiffness. Similar observation was also made by Evgin and
Fakharian (1996) on constant stiffness simple shear interface tests for surface with
0.05 in normalized roughness Rn.
From Table 3.1, it is seen that the ratio of friction coefficient at peak, which is
an indicator to the degree of restrained dilatancy effect, was affected by the surface
roughness. This can be seen by comparing the ratio of friction coefficient at peak of
DCs-S25C test series, DCs-S25F test series, DCs-S25P test series and DCs-S22U test
series, which indicates the progressive decrease in ratio of friction coefficient at peak
from 3.76 to 1.1 with the decrease in normalized roughness of nail surface from 1 to
0.003. The high ratio of friction coefficient at peak of DCs-S25C test series and DCs-
S25F test series is reasonably due to the dilative behaviour of C surface and F surface
as has been demonstrated by the direct shear interface test results (DCs-C test and
DCs-F test) reported in Figure 2.24.
The ratio of friction coefficient at peak of DCs-S22U test series that was close
to unity indicates minimal influence of restrained dilatancy effect on the pullout
response of this smooth nail. This is reasonable since the results of direct shear test
with U surface (DCs-U test) shown in Figure 2.24 showed non-dilative behaviour.
For DCs-S25P test series, the ratio of friction coefficient at peak was 1.71.
This result indicates that restrained dilatancy effect was also mobilized in the quasi
static pullout tests of nail with P surface although P surface was categorized as
smooth surface by its normalized roughness (Rn = 0.03). This observation is supported
by the results of direct shear interface test on P surface (DCs-P test) in Figure 2.24,
which indicates small dilative behaviour of P surface with 1.8o of maximum dilatancy
angle.
It has to be noted that the mobilization of restrained dilatancy effect is
progressive in nature because the dilative response of interface is progressively
mobilized with the increase in pullout displacement (shear strain). Therefore, the
enhancement in mean effective normal stress on nail shaft caused by restrained
dilatancy effect is also progressive in nature. This may consequently lead to gradually
increasing of pullout strength with the increase in pullout displacement although the
basic interfacial strength under constant normal stress is constant or with gentle
softening response, which is the case for interface between dense course sand and P
surface (DCs-P test, Figure 2.24). Hence, the hardening response of DCs-S25P test
series may be mainly attributed to restrained dilatancy effect. It needs to be mentioned
that the hardening response of DCs-S25P test series should not be attributed to
densification effect of surrounding soil in the pullout process as the sand medium was
initially in dense state with relative density as high as 90 %.
This deduction can be supported by the results of simple shear interface tests
on steel surface with Rn = 0.05 reported by Evgin and Fakharian (1996). Their results
showed that when free vertical displacement was allowed in the simple shear interface
test (without restrained dilatancy effect), the response of this interface test displayed
clear peak shear strength and continued by gentle softening behaviour. However,
when the vertical displacement was partially or fully restricted (with restrained
dilatancy effect), the response of this interface became hardening behaviour without
peak shear strength and the final shear strength achieved in this interface test was
significantly higher than the peak shear strength achieved by the test with allowance
of free vertical displacement.
The comparison of ratio of friction coefficient at peak between DCs-S25C test
series and MCs-S25C test series in Table 3.1 also reveals that the ratio of friction
coefficient at peak was also influenced by the density of sand medium, as the ratio of
friction coefficient has decreased from 3.76 (DCs-S25C test series) to 3.00 (MCs-
S25C test series) with the small decrease in relative sand density from 90 % to 82 %.
This is reasonable since the interface behaviour between medium dense course sand
(Id = 82 %) and C surface is shown to be less dilative than the interface behaviour
between dense course sand (Id = 90 %) and C surface (Figure 2.25 and Table 2.2).
The ratio of friction coefficient at peak of DCs-L25F test series with 1.65 m of
effective nail length is also observed to be nearly identical to the ratio of friction
coefficient at peak of DCs-S25F test series with 0.75 m of effective nail length (Table
3.1). This result indicates the independence of ratio of friction coefficient on effective
nail length, which implies that the enhancement in normal stress (and hence the shaft
resistance) is evenly distributed along the nail. Besides, the independence of ratio of
friction coefficient on effective nail length also implicitly implies the minimal
influence of rigid front wall effect on the measured pullout response, as described by
Palmeira and Milligan (1989).
By comparing the ratio of friction coefficient at peak of DCs-S25C test series
to DCs-S45C test series and DCs-S25F test series to DCs-S45F test series in Table 3.1.
It is revealed that the ratio of friction coefficient at peak was decreasing with the
increase in nail diameter. As an example, the increase in nail diameter from 25 mm
for DCs-S25C test series to 45 mm for DCs-S45C test series caused the decrease of
ratio of friction coefficient at peak from 3.76 to 2.60. This observation accords with
the results of Milligan and Tei (1998) on laboratory soil nail pullout tests. Besides,
similar observation was also made by Stewart and Kulhawy (1981) and Jardine and
Chow (1994) on interfacial shaft resistance of pile embedded in dense dilative sand.
The relationship between nail diameter and ratio of friction coefficient at peak
observed in these experiments can also be described by the empirical solution
proposed by Jardine and Chow (1996) and the analytical solution proposed by Luo
(2001). From their solutions, the relationship between ratio of friction coefficient µ
and nail radius r is found to be (µ -1)∝ 1/r. The points of (µ-1) at peak of DCs-S25C
test series, DCs-S45C test series, DCs-S25F test series and DCs-S45F test series are
plotted in Figure 3.13a and Figure 3.13b versus nail diameter, together with the line of
(µ -1)∝ 1/r. It is seen that the relationship between ratio of friction coefficient at peak
and nail diameter of these experiments seems to obey the 1/r rule proposed by Jardine
and Chow (1996) and Luo (2001).
3.6 Quasi Static Reload Test
The load displacement curves of quasi static reload tests which were
conducted directly after the primary quasi static pullout tests are plotted as plot (b) in
Figure 3.1 to Figure 3.9 for each test series. In the plots for DCs-S25C test series,
MCs-S25C test series, DCs-S25F test series, DCs-S45F test series and DCs-L25F test
series which were instrumented with strain gauges, the axial body load measurements
made along the nail are also plotted.
For all test series on rough nail (Figure 3.1 to Figure 3.7), the load
displacement curves of reload tests displayed stiffer load displacement response when
compared to the load displacement curves of their preceding quasi static pullout tests.
The pullout displacement required to mobilize the maximum reloading pullout
strength was only in the range of 0.5 mm. After reaching the maximum reloading
pullout strength, the reloading pullout response became a plateau with constant
pullout strength.
From Figure 3.1 to Figure 3.7, it can be seen that although the maximum
reloading pullout strength of a reload test was slightly lower than the least post peak
pullout strength attained by its preceding quasi static pullout test, this difference is
marginal. This small difference in pullout strength may be caused by the situation that
residual pullout stage was not sufficiently achieved by the preceding quasi static
pullout test due to the limited pullout displacement allowed in these experiments.
However, it may be postulated that the maximum reloading pullout strength would
eventually be achieved by the preceding quasi static pullout test if longer pullout
displacement is allowed. In fact, the least post peak pullout strength attained by DCs-
S25C-5-S test with 15 mm of post peak pullout displacement was already fairly close
to the maximum pullout strength attained by its succeeding reload test (Figure 3.1). It
is interesting to note that the reloading behaviour was not severely affected by the
level of post peak pullout displacement experienced by the preceding quasi static
pullout test. This can be seen from Figure 3.1 that the maximum reloading pullout
strength as well as the reloading load displacement response of reload tests conducted
after the DCs-S25C-1-S test and the DCs-S25C-5-S test were nearly identical, though
the maximum post peak pullout displacement experienced by their preceding quasi
static pullout tests were 5 mm and 15 mm respectively. But this could only be true if
the peak pullout stage has been sufficiently exceeded.
For DCs-S22U test series (Figure 3.8), the initial reloading pullout response is
seen to be very stiff with virtually negligible pullout displacement until the maximum
reloading pullout strength was attained. The reloading response then became plateau
with constant maximum pullout strength. The maximum reloading pullout strength of
these reload tests were virtually equal to the maximum pullout strength attained by
their preceding quasi static pullout tests.
For DCs-S25P test series (Figure 3.9), the initial reloading pullout response
was also very stiff with virtually negligible pullout displacement. However, after the
reloading strength had exceeded the maximum pullout strength attained by its

preceding quasi static pullout test, the reloading response turned into hardening
behaviour with hardening rate that was similar to the hardening rate of its preceding
quasi static pullout test.
3.7 Concluding Remarks
The quasi static pullout response of soil nails is observed to be highly
influenced by the roughness of nail surface. For nail with C surface (sand glued by
course sand) and F surface (sand glued by fine sand), which were both categorized as
rough nail by their normalized roughness Rn, the quasi static pullout response
exhibited non linear load displacement response until the peak pullout stage and then
followed by post peak softening response. For nail with U surface, the initial quasi
static pullout response was very stiff until reaching its maximum pullout strength, and
then the load displacement response became a plateau with constant pullout strength.
For nail with P surface, the pullout response is seen to attain the hardening behaviour
after approximately 0.5 mm of stiff initial pullout response.
The quasi static pullout response of rough nail and sand papered nail are found
to be influenced by restrained dilatancy effect. The restrained dilatancy effect
enhanced the pullout strength by as high as 3.76 times (DCs-S25C test series) in these
experiments.
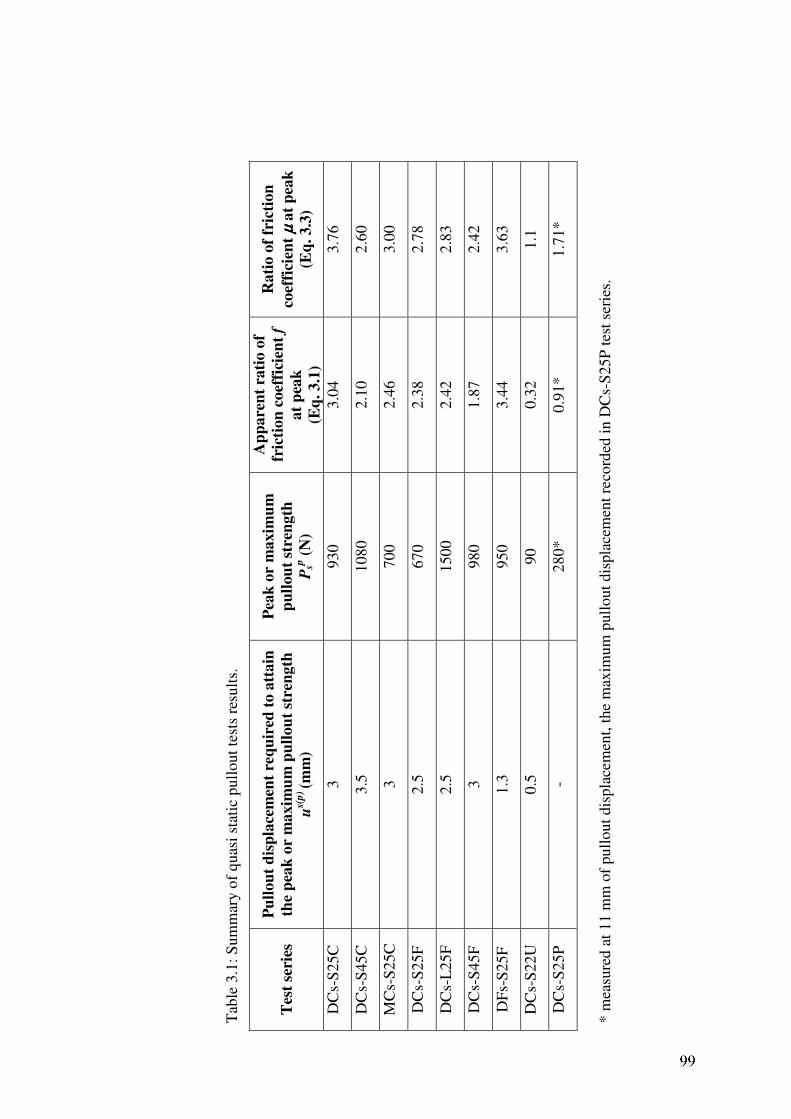
Tab
le 3
.1:
Su
mm
ary o
f q
uas
i st
atic
pu
llout
test
s re
sult
s.
Tes
t se
ries
Pu
llo
ut
dis
pla
cem
ent
req
uir
ed t
o a
ttain
the
pea
k o
r m
ax
imu
m p
ull
ou
t st
ren
gth
us(
p) (
mm
)
Pea
k o
r m
axim
um
pu
llou
t st
ren
gth
Psp
(N
)
Ap
pare
nt
rati
o o
f
fric
tion
coef
fici
ent
f
at
pea
k
(Eq
. 3.1
)
Rati
o o
f fr
icti
on
coef
fici
ent
µ µµµ a
t p
eak
(Eq
. 3.3
)
DC
s-S
25C
3
930
3.0
4
3.7
6
DC
s-S
45C
3
.5
1080
2.1
0
2.6
0
MC
s-S
25C
3
700
2.4
6
3.0
0
DC
s-S
25F
2
.5
670
2.3
8
2.7
8
DC
s-L
25
F
2.5
1500
2.4
2
2.8
3
DC
s-S
45F
3
980
1.8
7
2.4
2
DF
s-S
25F
1
.3
950
3.4
4
3.6
3
DC
s-S
22U
0
.5
90
0.3
2
1.1
DC
s-S
25P
-
280*
0.9
1*
1.7
1*
* m
easu
red a
t 1
1 m
m o
f p
ull
ou
t d
isp
lace
men
t, t
he
max
imum
pull
out
dis
pla
cem
ent
reco
rded
in D
Cs-
S25P
tes
t se
ries
.
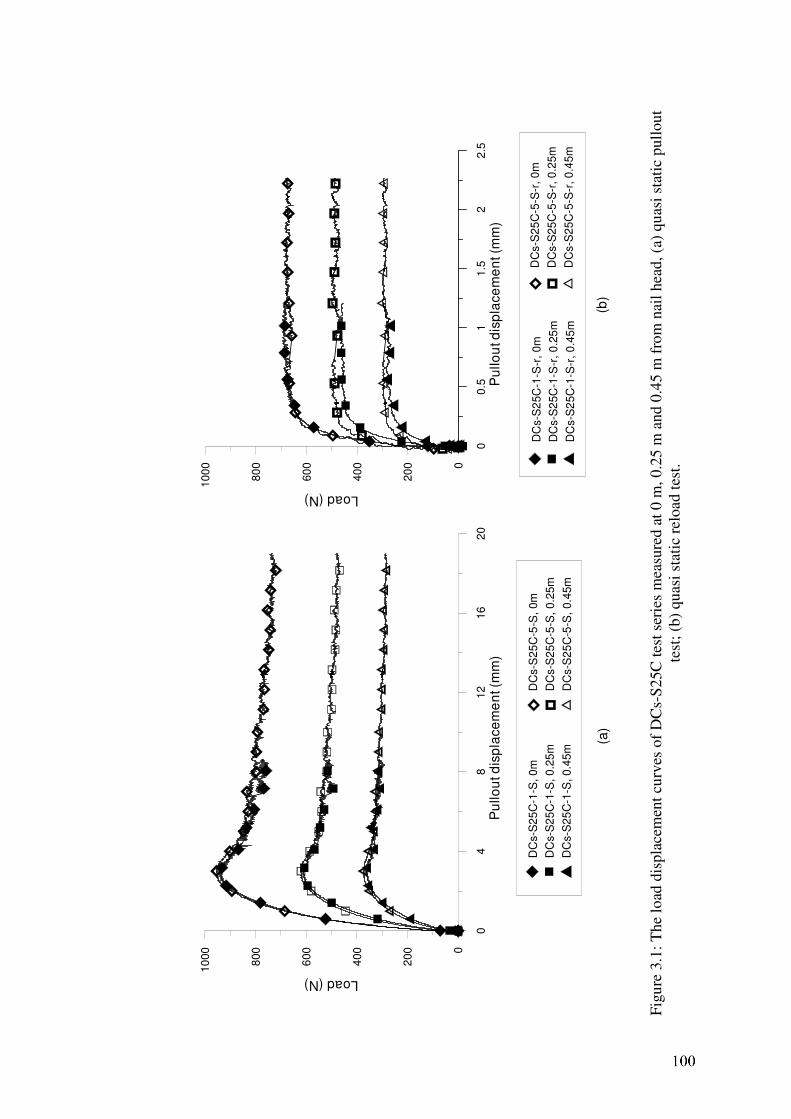
04
812
16
20
Pu
llo
ut d
isp
lace
me
nt (
mm
)
0
200
400
600
800
10
00
Load (N)
00
.51
1.5
22.5
Pu
llo
ut d
isp
lace
me
nt (m
m)
0
20
0
40
0
60
0
80
0
100
0
Load (N)(a
)(b
)
DC
s-S
25
C-1
-S, 0
m
DC
s-S
25
C-1
-S, 0
.25
m
DC
s-S
25
C-1
-S, 0
.45
m
DC
s-S
25
C-5
-S,
0m
DC
s-S
25
C-5
-S,
0.2
5m
DC
s-S
25
C-5
-S,
0.4
5m
DC
s-S
25C
-1-S
-r,
0m
DC
s-S
25C
-1-S
-r,
0.2
5m
DC
s-S
25C
-1-S
-r,
0.4
5m
DC
s-S
25
C-5
-S-r
, 0
m
DC
s-S
25
C-5
-S-r
, 0
.25m
DC
s-S
25
C-5
-S-r
, 0
.45m
Fig
ure
3.1
: T
he
load
dis
pla
cem
ent
curv
es o
f D
Cs-
S25C
tes
t se
ries
mea
sure
d a
t 0 m
, 0.2
5 m
and 0
.45 m
fro
m n
ail
hea
d,
(a)
qu
asi
stat
ic p
ull
out
test
; (b
) quas
i st
atic
rel
oad
tes
t.
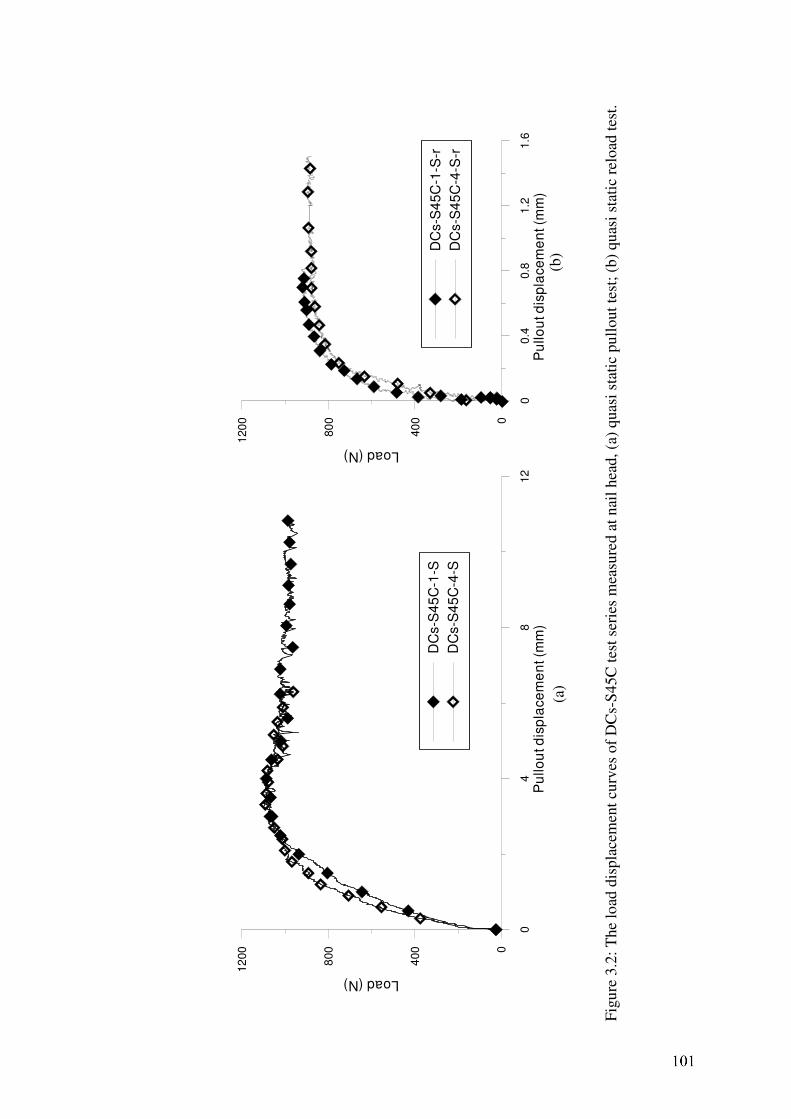
04
812
Pu
llo
ut d
isp
lace
me
nt (m
m)
0
400
800
12
00
Load (N)
00
.40.8
1.2
1.6
Pu
llo
ut d
isp
lace
me
nt (m
m)
0
40
0
80
0
120
0
Load (N)
DC
s-S
45
C-1
-S
DC
s-S
45
C-4
-S
DC
s-S
45C
-1-S
-r
DC
s-S
45C
-4-S
-r
Fig
ure
3.2
: T
he
load
dis
pla
cem
ent
curv
es o
f D
Cs-
S45C
tes
t se
ries
mea
sure
d a
t nai
l hea
d, (a
) quas
i st
atic
pull
out
test
; (b
) quas
i st
atic
rel
oad
tes
t.
(a)
(b)
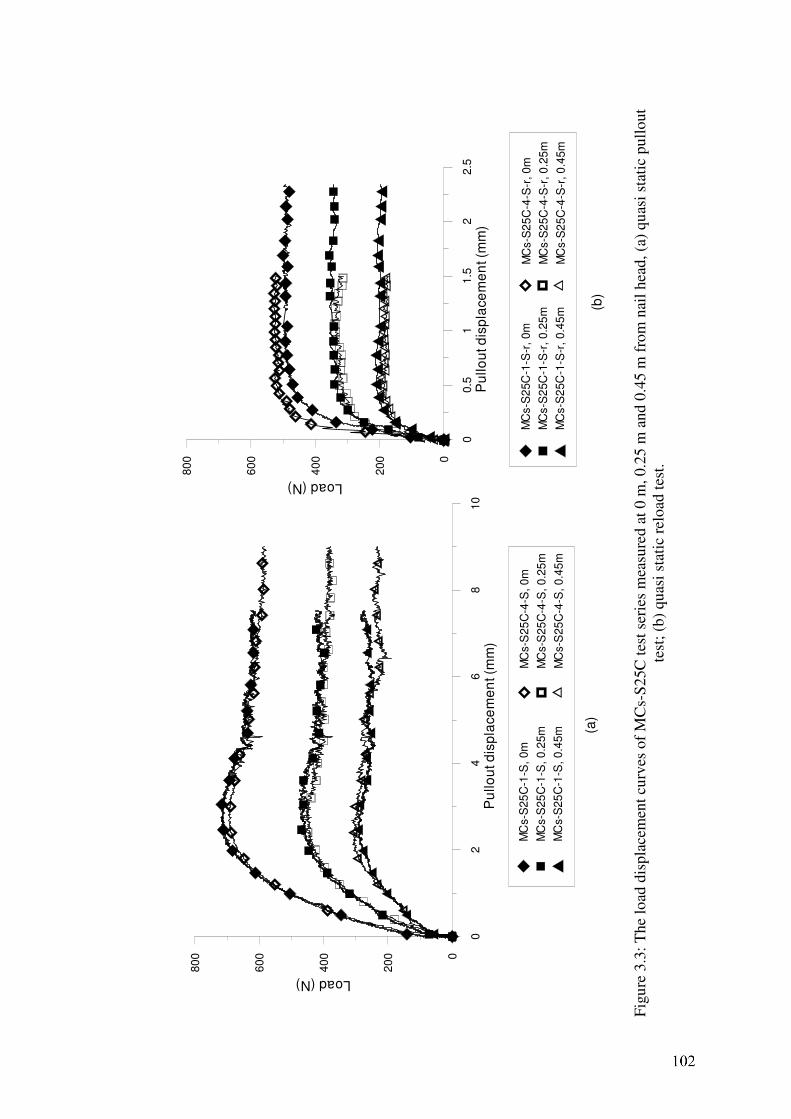
02
46
81
0
Pu
llo
ut d
isp
lace
me
nt (
mm
)
0
20
0
40
0
60
0
80
0
Load (N)
00
.51
1.5
22
.5
Pu
llo
ut d
isp
lace
me
nt (
mm
)
0
20
0
40
0
60
0
80
0
Load (N)
(a)
(b)
MC
s-S
25
C-4
-S-r
, 0
m
MC
s-S
25
C-4
-S-r
, 0
.25
m
MC
s-S
25
C-4
-S-r
, 0
.45
m
MC
s-S
25C
-1-S
-r,
0m
MC
s-S
25C
-1-S
-r,
0.2
5m
MC
s-S
25C
-1-S
-r,
0.4
5m
MC
s-S
25
C-4
-S,
0m
MC
s-S
25
C-4
-S,
0.2
5m
MC
s-S
25
C-4
-S,
0.4
5m
MC
s-S
25
C-1
-S,
0m
MC
s-S
25
C-1
-S,
0.2
5m
MC
s-S
25
C-1
-S,
0.4
5m
F
igu
re 3
.3:
Th
e lo
ad d
isp
lace
men
t cu
rves
of
MC
s-S
25C
tes
t se
ries
mea
sure
d a
t 0 m
, 0.2
5 m
and 0
.45 m
fro
m n
ail
hea
d,
(a)
qu
asi
stat
ic p
ull
out
test
; (b
) quas
i st
atic
rel
oad
tes
t.
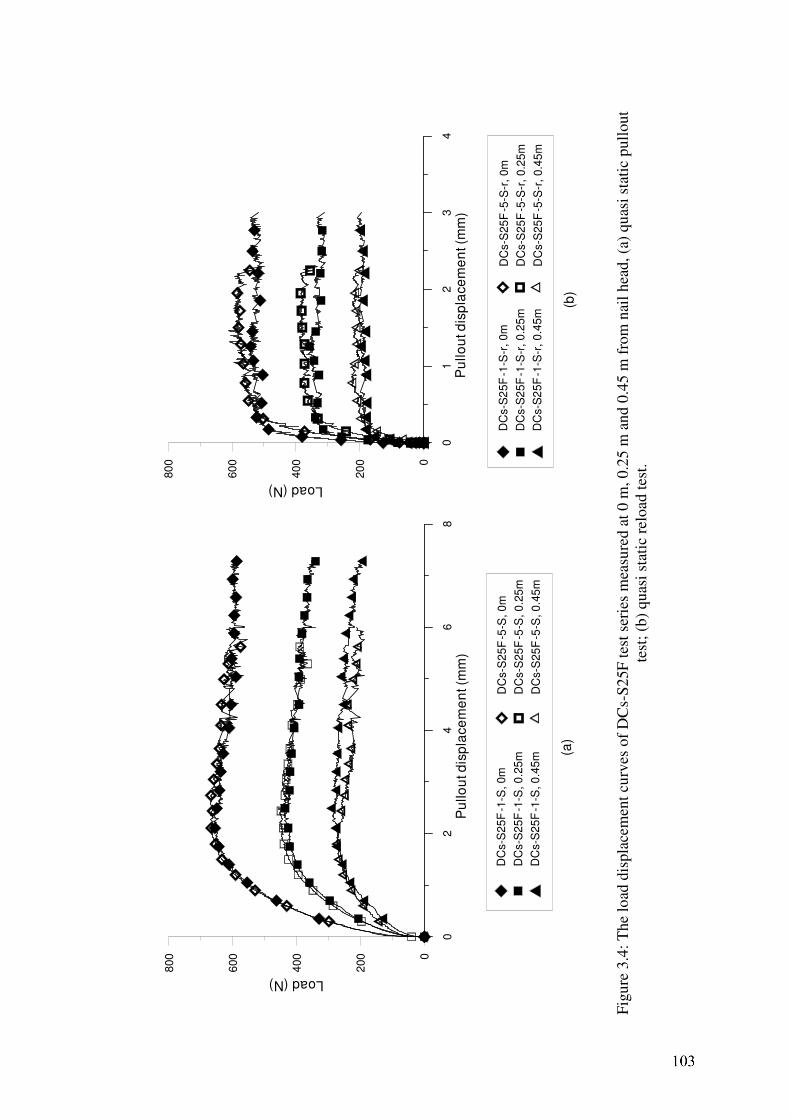
02
46
8
Pu
llo
ut d
isp
lace
me
nt (m
m)
0
200
400
600
800
Load (N)
01
23
4
Pu
llo
ut d
isp
lace
me
nt (m
m)
0
20
0
40
0
60
0
80
0
Load (N)
(a)
(b)
DC
s-S
25
F-5
-S-r
, 0
m
DC
s-S
25
F-5
-S-r
, 0
.25
m
DC
s-S
25
F-5
-S-r
, 0
.45
m
DC
s-S
25
F-1
-S-r
, 0
m
DC
s-S
25
F-1
-S-r
, 0
.25
m
DC
s-S
25
F-1
-S-r
, 0
.45
m
DC
s-S
25
F-5
-S, 0
m
DC
s-S
25
F-5
-S, 0
.25
m
DC
s-S
25
F-5
-S, 0
.45
m
DC
s-S
25
F-1
-S, 0
m
DC
s-S
25
F-1
-S, 0
.25
m
DC
s-S
25
F-1
-S, 0
.45
m
Fig
ure
3.4
: T
he
load
dis
pla
cem
ent
curv
es o
f D
Cs-
S25F
tes
t se
ries
mea
sure
d a
t 0 m
, 0.2
5 m
and 0
.45 m
fro
m n
ail
hea
d,
(a)
qu
asi
stat
ic p
ull
out
test
; (b
) quas
i st
atic
rel
oad
tes
t.
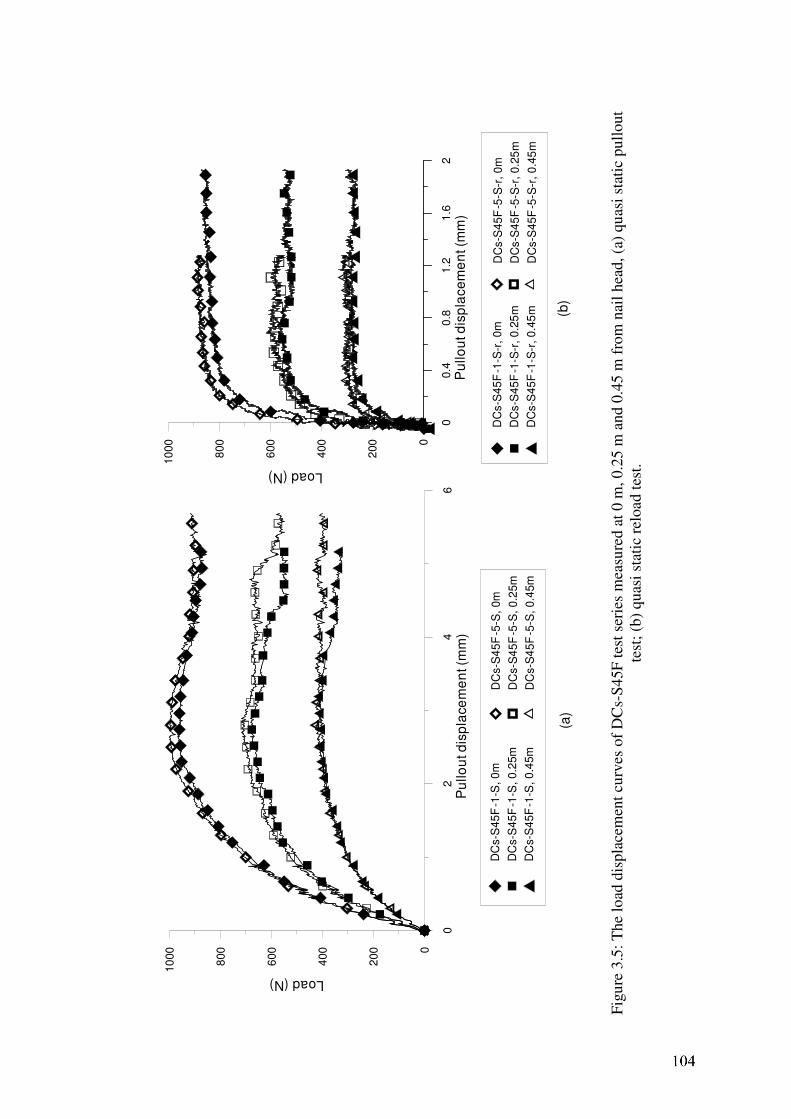
02
46
Pu
llo
ut d
isp
lace
me
nt (
mm
)
0
200
400
600
800
10
00
Load (N)
00.4
0.8
1.2
1.6
2
Pu
llo
ut d
isp
lace
me
nt (m
m)
0
200
400
600
800
10
00
Load (N)
(a)
(b)
DC
s-S
45
F-5
-S,
0m
DC
s-S
45
F-5
-S,
0.2
5m
DC
s-S
45
F-5
-S,
0.4
5m
DC
s-S
45
F-1
-S, 0
m
DC
s-S
45
F-1
-S, 0
.25m
DC
s-S
45
F-1
-S, 0
.45m
DC
s-S
45
F-5
-S-r
, 0
m
DC
s-S
45
F-5
-S-r
, 0
.25
m
DC
s-S
45
F-5
-S-r
, 0
.45
m
DC
s-S
45
F-1
-S-r
, 0
m
DC
s-S
45
F-1
-S-r
, 0
.25
m
DC
s-S
45
F-1
-S-r
, 0
.45
m
Fig
ure
3.5
: T
he
load
dis
pla
cem
ent
curv
es o
f D
Cs-
S45F
tes
t se
ries
mea
sure
d a
t 0 m
, 0.2
5 m
and 0
.45 m
fro
m n
ail
hea
d,
(a)
qu
asi
stat
ic p
ull
out
test
; (b
) quas
i st
atic
rel
oad
tes
t.
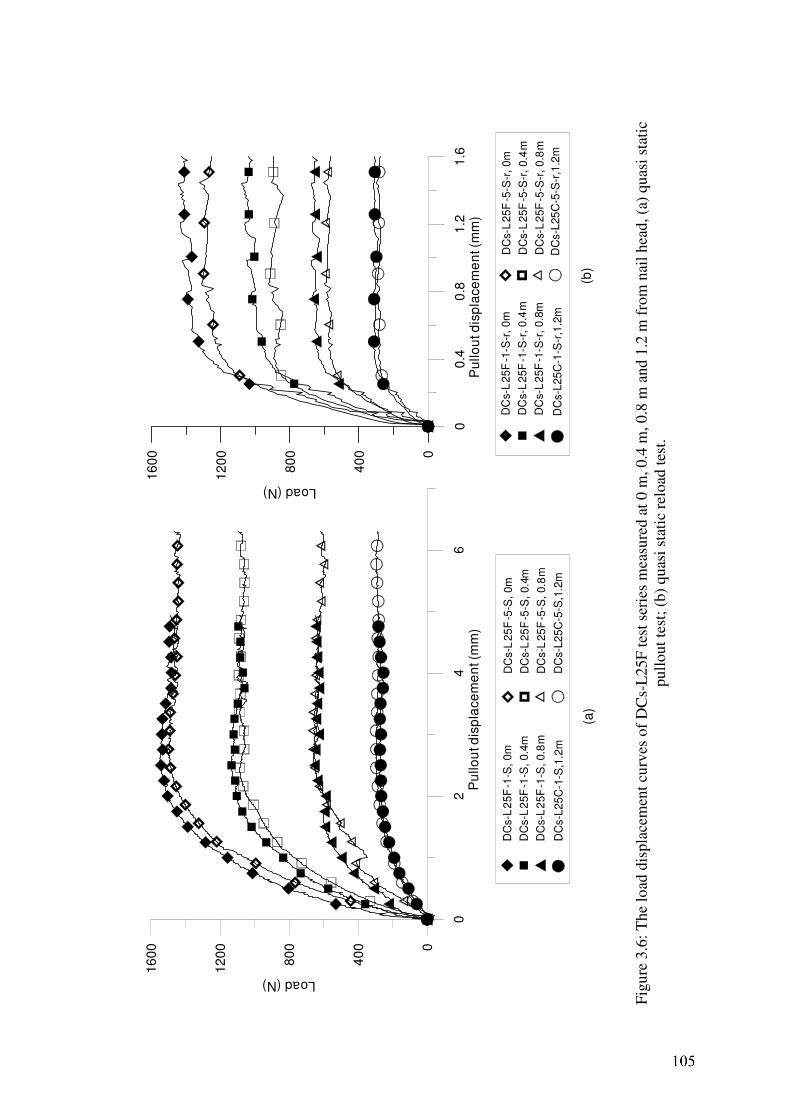
02
46
Pu
llo
ut d
isp
lace
me
nt (m
m)
0
40
0
80
0
12
00
16
00
Load (N)
00
.40
.81
.21
.6P
ullo
ut d
isp
lace
me
nt (
mm
)
0
40
0
80
0
12
00
16
00
Load (N)
(a)
(b)
DC
s-L
25
F-5
-S,
0m
DC
s-L
25
F-5
-S,
0.4
m
DC
s-L
25
F-5
-S,
0.8
m
DC
s-L
25
F-1
-S,
0m
DC
s-L
25
F-1
-S,
0.4
m
DC
s-L
25
F-1
-S,
0.8
m
DC
s-L
25
C-1
-S,1
.2m
DC
s-L
25
C-5
-S,1
.2m
DC
s-L
25
F-5
-S-r
, 0
m
DC
s-L
25
F-5
-S-r
, 0
.4m
DC
s-L
25
F-5
-S-r
, 0
.8m
DC
s-L
25
F-1
-S-r
, 0
m
DC
s-L
25
F-1
-S-r
, 0
.4m
DC
s-L
25
F-1
-S-r
, 0
.8m
DC
s-L
25
C-1
-S-r
,1.2
mD
Cs-L
25
C-5
-S-r
,1.2
m
Fig
ure
3.6
: T
he
load
dis
pla
cem
ent
curv
es o
f D
Cs-
L25F
tes
t se
ries
mea
sure
d a
t 0 m
, 0.4
m,
0.8
m a
nd 1
.2 m
fro
m n
ail
hea
d,
(a)
quas
i st
atic
pull
out
test
; (b
) quas
i st
atic
rel
oad
tes
t.
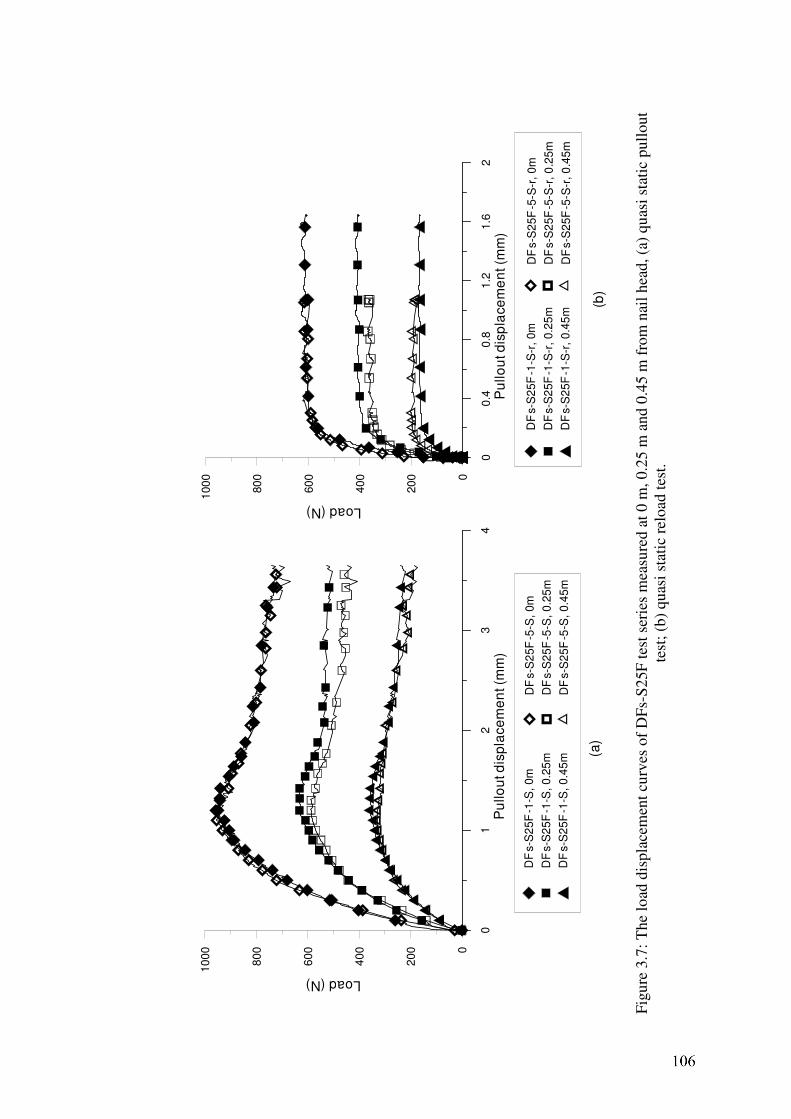
01
23
4
Pu
llou
t dis
pla
ce
me
nt (
mm
)
0
20
0
40
0
60
0
80
0
10
00
Load (N)
00
.40
.81
.21
.62
Pu
llo
ut d
isp
lace
me
nt (m
m)
0
20
0
40
0
60
0
80
0
100
0
Load (N)(b
)(a
)
DF
s-S
25
F-5
-S,
0m
DF
s-S
25
F-5
-S,
0.2
5m
DF
s-S
25
F-5
-S,
0.4
5m
DF
s-S
25
F-1
-S,
0m
DF
s-S
25
F-1
-S,
0.2
5m
DF
s-S
25
F-1
-S,
0.4
5m
DF
s-S
25
F-5
-S-r
, 0
m
DF
s-S
25
F-5
-S-r
, 0
.25
m
DF
s-S
25
F-5
-S-r
, 0
.45
m
DF
s-S
25
F-1
-S-r
, 0
m
DF
s-S
25
F-1
-S-r
, 0
.25
m
DF
s-S
25
F-1
-S-r
, 0
.45
m
Fig
ure
3.7
: T
he
load
dis
pla
cem
ent
curv
es o
f D
Fs-
S25F
tes
t se
ries
mea
sure
d a
t 0 m
, 0.2
5 m
and 0
.45 m
fro
m n
ail
hea
d,
(a)
qu
asi
stat
ic p
ull
out
test
; (b
) quas
i st
atic
rel
oad
tes
t.
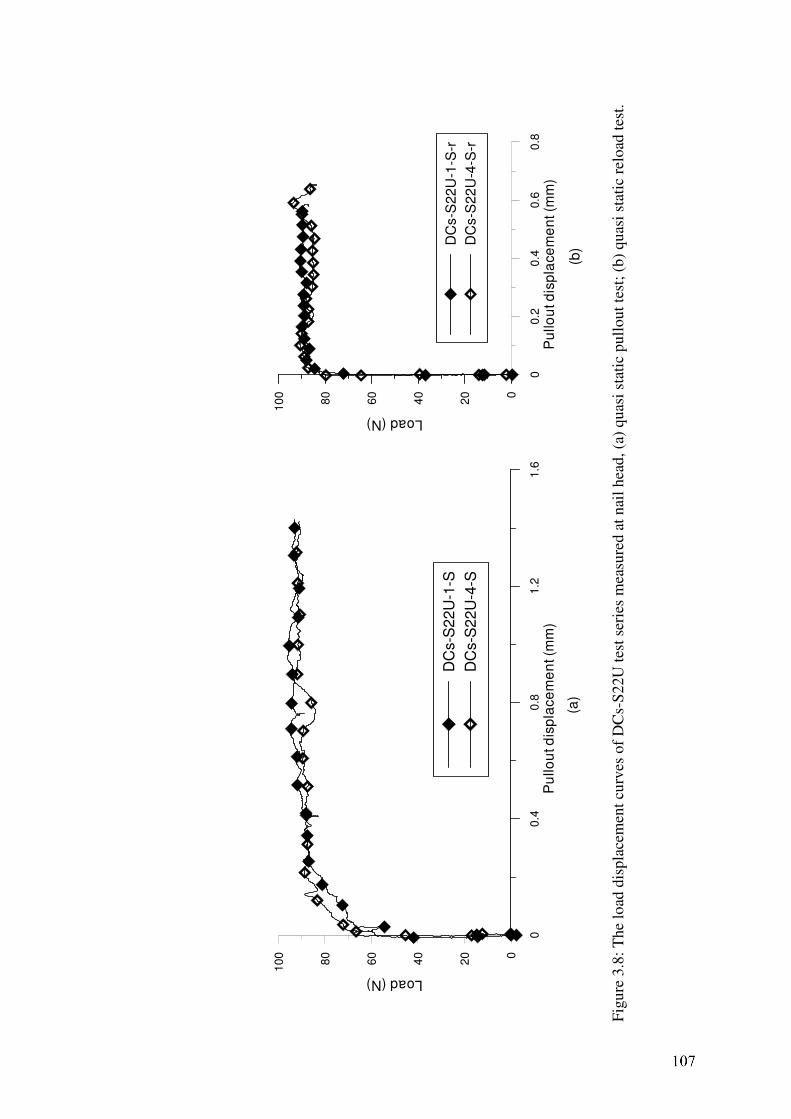
00
.40
.81
.21
.6
Pu
llo
ut d
isp
lace
me
nt (m
m)
0
20
40
60
80
10
0
Load (N)
DC
s-S
22
U-1
-S
DC
s-S
22
U-4
-S
00.2
0.4
0.6
0.8
Pu
llou
t d
isp
lace
me
nt (m
m)
0
20
40
60
80
10
0
Load (N)
DC
s-S
22
U-1
-S-r
DC
s-S
22
U-4
-S-r
(a)
(b)
F
igu
re 3
.8:
Th
e lo
ad d
isp
lace
men
t cu
rves
of
DC
s-S
22U
tes
t se
ries
mea
sure
d a
t nai
l hea
d, (a
) quas
i st
atic
pull
out
test
; (b
) quas
i st
atic
rel
oad
tes
t.
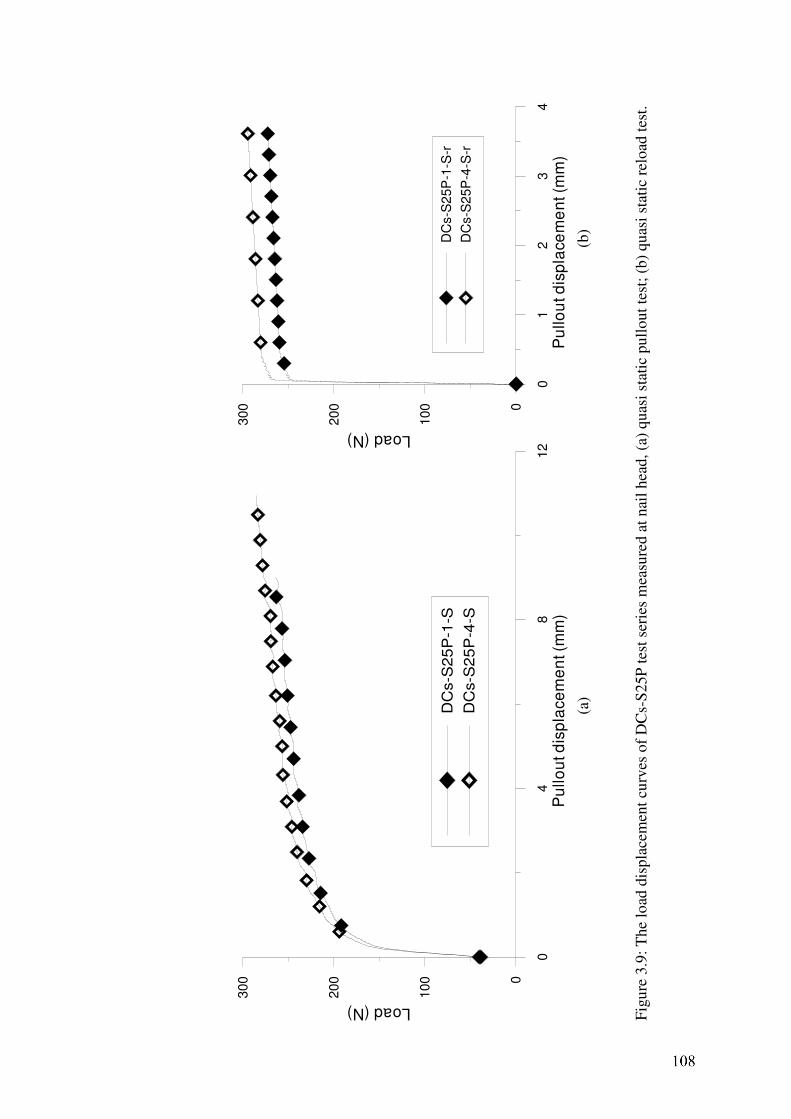
04
812
Pu
llo
ut d
isp
lace
me
nt (
mm
)
0
100
200
300
Load (N)
DC
s-S
25
P-1
-S
DC
s-S
25
P-4
-S
01
23
4
Pu
llo
ut d
isp
lace
me
nt (m
m)
0
100
200
300
Load (N)
DC
s-S
25P
-1-S
-r
DC
s-S
25P
-4-S
-r
F
igu
re 3
.9:
Th
e lo
ad d
isp
lace
men
t cu
rves
of
DC
s-S
25P
tes
t se
ries
mea
sure
d a
t nai
l hea
d, (a
) quas
i st
atic
pull
out
test
; (b
) quas
i st
atic
rel
oad
tes
t.
(a)
(b)
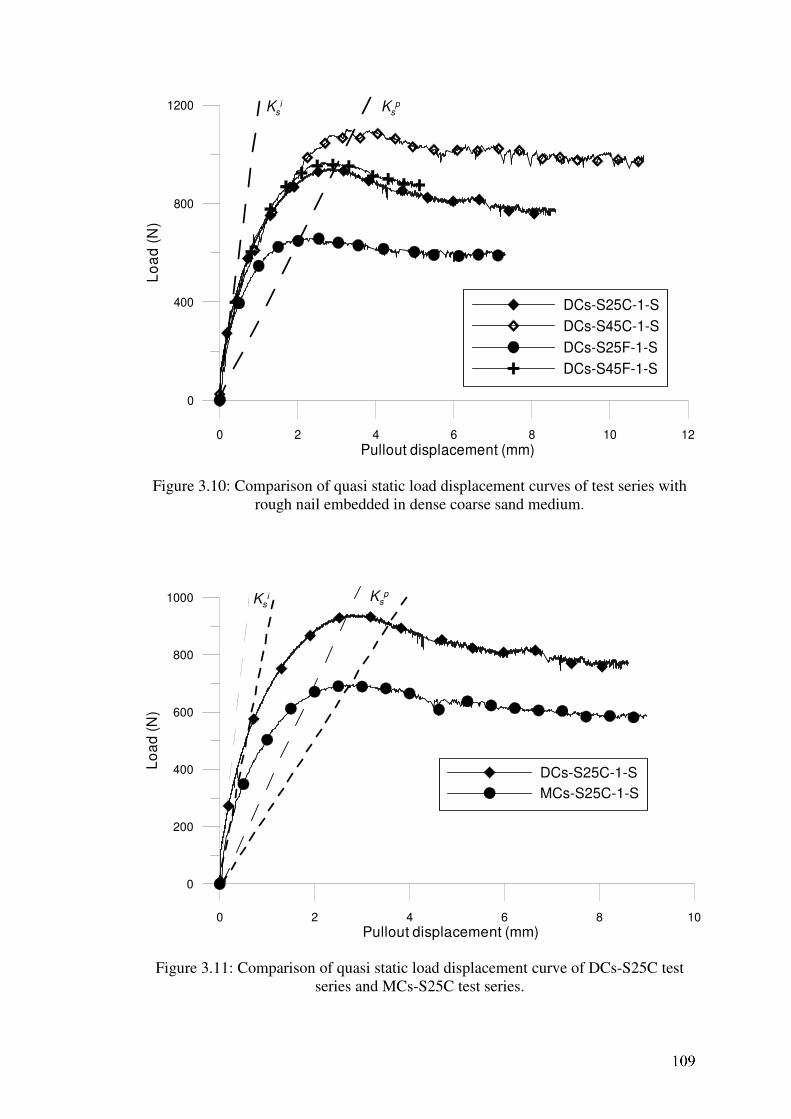
0 2 4 6 8 10 12
Pullout displacement (mm)
0
400
800
1200
Lo
ad
(N
)
DCs-S25C-1-S
DCs-S45C-1-S
DCs-S25F-1-S
DCs-S45F-1-S
Ksi Ks
p
Figure 3.10: Comparison of quasi static load displacement curves of test series with
rough nail embedded in dense coarse sand medium.
0 2 4 6 8 10
Pullout displacement (mm)
0
200
400
600
800
1000
Lo
ad
(N
)
DCs-S25C-1-S
MCs-S25C-1-S
Ksi Ks
p
Figure 3.11: Comparison of quasi static load displacement curve of DCs-S25C test
series and MCs-S25C test series.
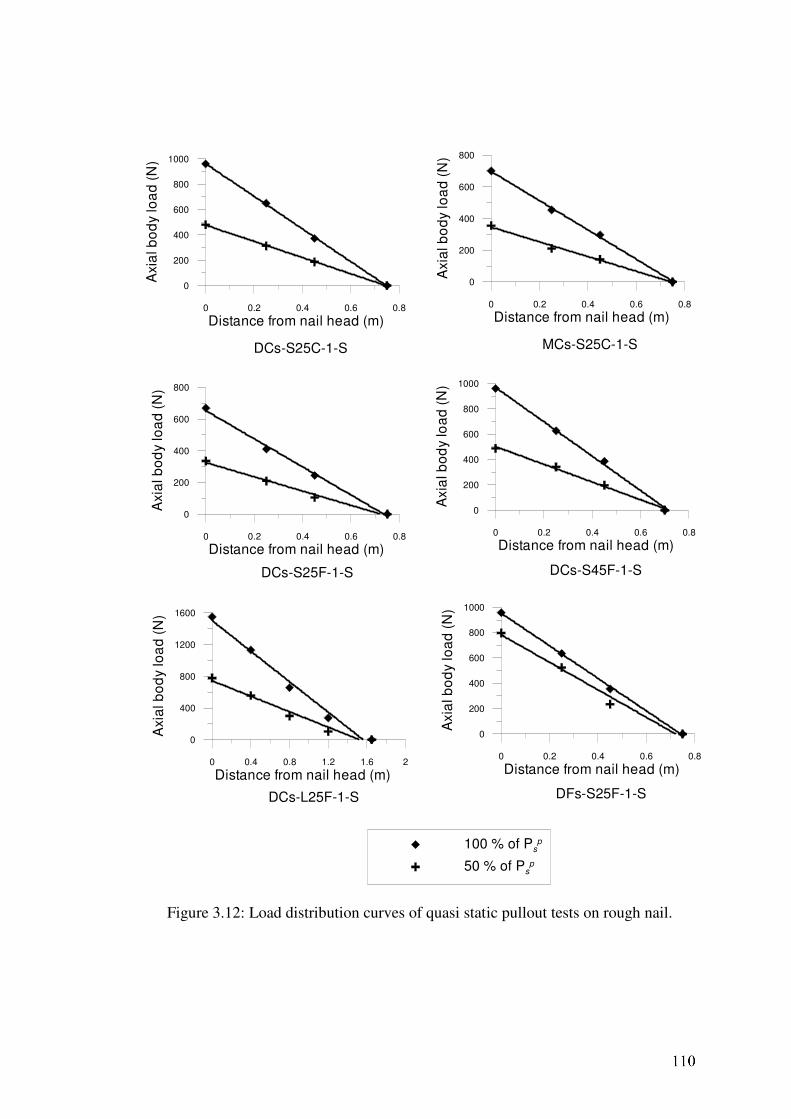
0 0.2 0.4 0.6 0.8
Distance from nail head (m)
0
200
400
600
800
1000A
xia
l b
od
y lo
ad
(N
)
0 0.2 0.4 0.6 0.8
Distance from nail head (m)
0
200
400
600
800
Axia
l b
od
y lo
ad
(N
)
0 0.2 0.4 0.6 0.8
Distance from nail head (m)
0
200
400
600
800
1000
Axia
l b
od
y lo
ad
(N
)
0 0.2 0.4 0.6 0.8
Distance from nail head (m)
0
200
400
600
800
Axia
l b
od
y lo
ad
(N
)
0 0.2 0.4 0.6 0.8
Distance from nail head (m)
0
200
400
600
800
1000
Axia
l b
od
y lo
ad
(N
)
0 0.4 0.8 1.2 1.6 2
Distance from nail head (m)
0
400
800
1200
1600
Axia
l b
od
y lo
ad
(N
)
DCs-S25C-1-S
DCs-S25F-1-S
MCs-S25C-1-S
DCs-L25F-1-S DFs-S25F-1-S
DCs-S45F-1-S
100 % of Psp
50 % of Psp
Figure 3.12: Load distribution curves of quasi static pullout tests on rough nail.
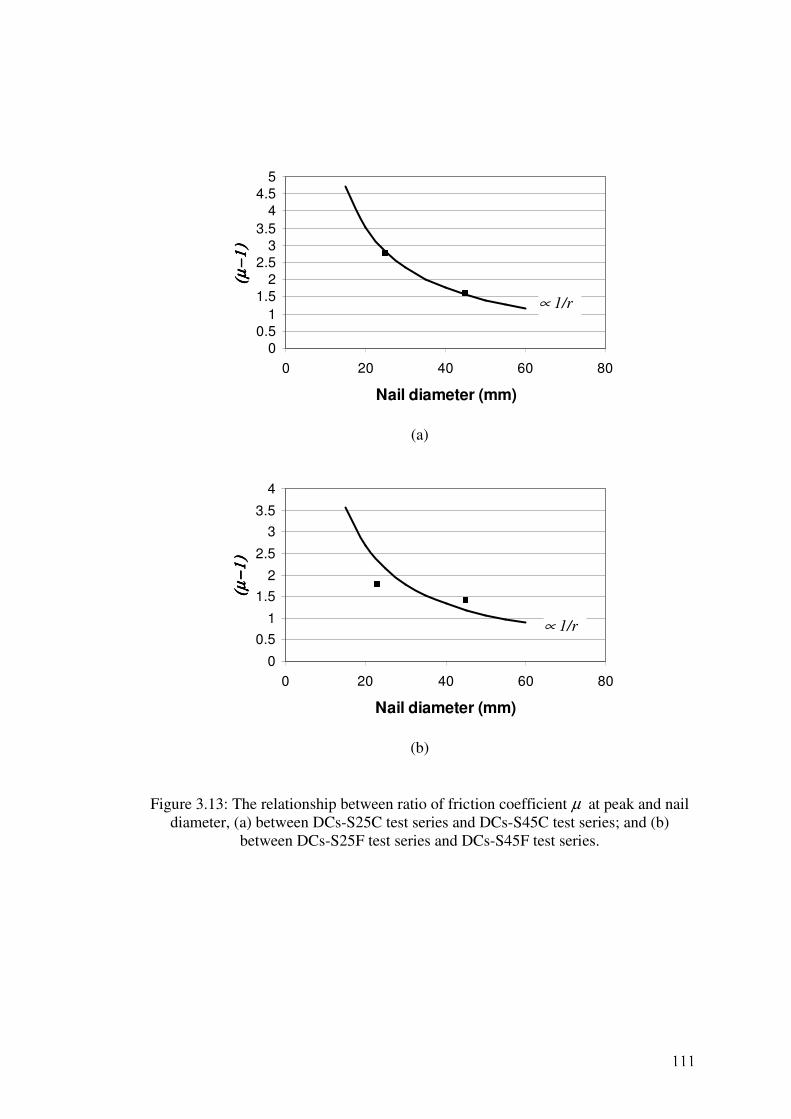
00.5
1
1.52
2.53
3.5
44.5
5
0 20 40 60 80
Nail diameter (mm)
(µ−
1)
(µ−
1)
(µ−
1)
(µ−
1)
(a)
0
0.5
1
1.5
2
2.5
3
3.5
4
0 20 40 60 80
Nail diameter (mm)
(µ−
1)
(µ−
1)
(µ−
1)
(µ−
1)
(b)
Figure 3.13: The relationship between ratio of friction coefficient µ at peak and nail
diameter, (a) between DCs-S25C test series and DCs-S45C test series; and (b)
between DCs-S25F test series and DCs-S45F test series.
∝ 1/r
∝ 1/r
Chapter 4: High Energy Rapid Pullout Test
4.1 Introduction
In this chapter, the results of high energy rapid pullout tests are presented and
discussed in detail. The loading rate effect on pullout response of soil nail is assessed
by comparing the rapid pullout test results with the corresponding quasi static pullout
test results presented in Chapter 3. The mobilization characteristic of radiation
damping effect in rapid pullout test is also addressed. The term ‘high energy’ in this
thesis is referred to the condition which the imposed tensile impulse load was high
enough to exceed the pullout strength of the nail and cause complete pullout failure.
The results of quasi static reload test conducted after the high energy rapid
pullout test are also presented in this chapter to assess the influence of preceding rapid
pullout test on quasi static reloading behaviour.
The traces of impulse load, rapid axial body load, displacement, velocity and
acceleration in time domain of all high energy rapid pullout tests are plotted in
Appendix A. As has been discussed in Section 2.4.2 of Chapter 2, loading duration of
impulse load applied to every rapid pullout tests in these experiments was around 27
ms, with approximately 8 ms of rise time and 19 ms of fall time (although these
parameters slightly differ from test to test, the differences were marginal). The
dominant loading frequency was approximately 35 Hz by FFT analysis. The
corresponding relative wave length defined by Eq. 1.1 was 90 and 41 respectively for
tests with 0.75 m and 1.65 m of effective nail length. These relative wave lengths are
significantly larger than the lower boundary value of 10 proposed by Holeyman (1992)
for the validity of rapid loading condition.
4.2 The Plot of Load Displacement Curve
The load displacement curves of all high energy rapid pullout tests conducted
are plotted in Figure 4.1 to Figure 4.9 according to test series. Rapid load
displacement curves plotted in these figures are the curve of ‘net’ rapid soil response,
with inertia effect had been subtracted by Eq. 4.1 below. In Eq. 4.1, the pullout
acceleration of nail head is taken to represent the acceleration of whole nail. This
assumption is valid only if the nail behaves as rigid body in pullout, which is true for
these experiments as has been demonstrated by the results of quasi static pullout tests
in Chapter 3. The inertia effect involved in these experiments was found to be
relatively insignificant for tests on rough nail (C surface and F surface) because the
pullout strength of rough nail was a lot higher than the additional resistance caused by
inertia effect. However, inertia effect was quite significant for tests on smooth nail (U
surface and P surface) with low pullout strength, as illustrated in Figure 4.10.
MaPP dr −= (4.1)
with Pr = ‘net’ rapid soil response, Pd = dynamic impulse load, M = total mass of nail
body plus any connection accessories that existed after the force measurement point,
and a = acceleration of nail head.
Similar to the presentation of quasi static pullout test results, the results of
both high energy rapid pullout tests under the same test series are plotted together to
examine the repeatability and consistency of rapid pullout tests. It has to be reminded
that new sand medium was prepared for every pullout tests (except the reload tests).
As observed from Figure 4.1 to Figure 4.9, the load displacement curves of both high
energy rapid pullout tests under the same test series are well matched to each other.
This observation together with the repeatability and consistency of quasi static pullout
tests reported in Section 3.2.1 of Chapter 3 leads to the conclusion that the condition
of nail surface was rather consistent throughout each series of test.
For better examination of the influence of loading rate on pullout behaviour,
the results of quasi static pullout tests presented in Chapter 3 are also re-plotted in
Figure 4.1 to Figure 4.9 together with their corresponding rapid pullout test results.
Since the results of both quasi static pullout tests under a test series were highly
identical, only one quasi static pullout test result is plotted here for each test series.
The axial body load measurements made by strain gauges along the nail of
DCs-S25C test series, MCs-S25C test series, DFs-S25F test series, DFs-S45F test
series and DFs-L25F test series are also plotted in Figure 4.1 – Figure 4.7 (except
Figure 4.2) together with corresponding rapid load displacement curve measured at
nail head. Similar to the plots of rapid load displacement curve, the plotted curves of
rapid axial body load vs. nail head pullout displacement in Figure 4.1 to Figure 4.7
(except Figure 4.2) are the curve of ‘net’ rapid soil response calculated by Eq. 4.1, by
taking the Pd in Eq. 4.1 as the axial body load measured by strain gauges in rapid
pullout tests and M as the total mass of nail body after the point of strain measurement.
From these figures, it is seen that the shape of axial body load vs. nail head pullout
displacement curves was almost identical to the shape of corresponding load
displacement curve measured at nail head. This observation implies that the nails also
behaved as rigid body in rapid pullout tests as no lag (in terms of nail head pullout
displacement) in mobilization of rapid axial body load along the nail was observed.
4.3 Pre Peak Rapid Pullout Response of Rough Nail
4.3.1 Pre Peak Rapid Pullout Stiffness
From Figure 4.1 to Figure 4.7, it is clearly observed that although the shape of
pre peak rapid load displacement curves was approximately similar to that of
corresponding quasi static load displacement curves, the pre peak pullout stiffness
rapid pullout tests was obviously higher than that of corresponding quasi static pullout
test. The pullout displacement required to mobilize the peak rapid pullout strength
(up(r)
) also seemed smaller than that required to mobilize the peak quasi static pullout
strength (up(s)
). As an example, the pullout displacement required to mobilize the peak
rapid pullout strength of DCs-S25C-2-RH test was approximately 2 mm, while the
pullout displacement required to achieve the peak quasi static pullout strength of
corresponding DCs-S25C-1-S test was around 3 mm (Figure 4.1). It has to be noted
that despite the difference in between up(r)
and up(s)
, the quasi static pullout load
mobilized at up(r)
was in fact rather close to the corresponding peak quasi static pullout
strength with less than 5 % in variation (Figure 4.1 to Figure 4.7). This is because the
variation in quasi static pullout load was quite minimal in vicinity of the point of peak
quasi static pullout strength.
The stiffer pre peak load displacement behaviour of rapid pullout tests was not
only observed on the load measurement made at nail head but also on the axial body
load measurement made along the nail (Figure 4.1 to Figure 4.7 except Figure 4.2).
This observation implies that the stiffer pre peak behaviour of rapid pullout tests is a
characteristic contributed by the mobilization of shaft resistance along the nail under
rapid loading condition. Besides, this phenomenon appears not to be influenced by the
particle size effect (d/D50) as the same phenomenon is also observed on DFs-S25F test
series (Figure 4.7) with d/D50 ratio as high as 208, slightly exceeds the highest
minimum d/D50 ratio that had ever been suggested to eliminate of particle size effect
(Randolph and House, 2001).
By comparing the results of test series with different nail diameter, such as
between DCs-S45C test series (Figure 4.2) and DCs-S25C test series (Figure 4.1) or
between DCs-S45F test series (Figure 4.5) and DCs-S25F test series (Figure 4.4), it
can be seen that the enhancement in pre peak rapid pullout stiffness became more
pronounced with the increase in nail diameter, suggesting the remarkable influence of
nail diameter on rapid pullout behaviour. However, the influences of other parameters
such as the roughness of nail surface, effective nail length and sand density on rapid
pullout behaviour are not clearly shown in the plot of load displacement curve in these
figures but the influences of these parameters will be assessed later in this chapter.
4.3.2 Peak Rapid Pullout Strength
From Figure 4.1 to Figure 4.7, it is clear that the peak rapid pullout strength
was higher than the corresponding peak quasi static pullout strength especially for
tests with larger nail diameter. Same as the enhancement in pre peak pullout stiffness,
the improvement in peak rapid pullout strength was not only observed on load
measurement made at nail head but also on the axial body load measurements made
along the nail by strain gauges. This observation again indicates that this
improvement in peak rapid pullout strength should be a basic characteristic of shaft
resistance of rough interface under rapid loading condition. This phenomenon is also
observed on DFs-S25F test series with d/D50 ratio as high as 208, implies that this
phenomenon should not be caused by the particle size effect.
The improvement in peak rapid pullout strength observed in these experiments
appears to be controversial when compared with the experimental results reported by

Dayal and Allen (1975), Heerema (1979) and Lepert et.al. (1988) who showed that
the shaft resistance of pile shaft in contact with clean dry sand was independent of
loading rate. However, detailed examination on their experiments revealed that the
surface of model pile shaft used by them was smooth steel surface. Thus, their
experimental results cannot be compared directly with the results on rough surface of
these experiments. This is because the mobilization characteristic of interfacial
resistance of rough surface and smooth surface has significant difference, as has been
shown by the results of interface tests reported by Yoshimi and Kishida (1981),
Uesugi and Kishida (1986) and Hu and Pu (2004). It will be shown later in Section
4.6 of this chapter that the maximum pullout strength of nails with smooth surface (P
surface and U surface) was independent of loading rate, which is in good agreement
with the results of Dayal and Allen (1975) and Heerema (1979) because the surface
conditions of smooth P surface and U surface were more closer to the surface
condition of smooth steel surface considered by Dayal and Allen (1975), Herrema
(1979) and Lepert et.al. (1988)) in their experiments.
Table 4.1 lists the peak rapid pullout strength Prp
of all test series on rough
nails. As the peak rapid pullout strength of both high energy rapid pullout tests under
the same test series was fairly identical, only the average value of both tests is given
in Table 4.1. The peak quasi static pullout strength Psp
given in Table 3.1 is also
reproduced in Table 4.1 for clearer comparison. The ratio of peak rapid pullout
strength to peak quasi static peak pullout strength αp is also calculated for each series
of tests in Table 4.1. It has to be noted that the pullout velocity at the point of peak
rapid pullout strength of all test series considered in Table 4.1 was fairly identical to
each other, with the range lied in between 0.4 m/s to 0.5 m/s only. Therefore, direct
comparison of peak rapid pullout strength between these test series is valid because
any error caused by the variation in pullout velocity would be very minimal.
From the αp ratio given in Table 4.1, it is observed that the percentage of
improvement in peak rapid pullout strength was unaffected by surface roughness
(within the range of rough surface), effective nail length, sand density and sand type
but was significantly affected by nail diameter. The αp ratio of test series with 25 mm
of nail diameter (DCs-S25C series, DCs-S25F test series, MCs-S25C test series, DCs-
L25F test series and DFs-S25F test series) was within the range of 1.09 - 1.12, while
the αp ratio of test series with 45 mm of nail diameter (DCs-S45C test series and DCs-
S45F test series) was within the range of 1.2 - 1.22. These results indicate that the
percentage of improvement in peak rapid pullout strength is nearly in direct
proportion to nail diameter.
The similar of αp ratio of DCs-S25C test series, DCs-S25F test series, MCs-
S25C test series and DFs-S25F test series shown in Table 4.1 also indirectly and
broadly suggests that the influence of restrained dilatancy effect on rapid pullout
response is fairly similar to that on quasi static pullout response. This context is best
illustrated by the bar chart shown in Figure 4.11 that compares the peak quasi static
pullout strength Psp, the peak rapid pullout strength Pr
p and the ‘analytical’ peak
pullout strength estimated by Eq. 3.4 based on interface friction angle (without
restrained dilatancy effect) side by side for these test series. From Figure 4.11, it is
seen that the variation in ‘analytical’ peak pullout strength between these test series
was marginal. This is because the peak interface friction angle of nail – sand interface
of these test series was quite similar to each other as can be seen from the direct shear
interface test results shown in Table 2.2. The obvious variation in peak quasi static
pullout strength of these test series has been discussed to be mainly contributed by the

difference in degree of restrained dilatancy effect (Section 3.5 in Chapter 3).
Therefore, the obvious variation in peak rapid pullout strength between these test
series that followed closely the trend of variation in peak quasi static pullout strength
broadly suggests that the influence of restrained dilatancy effect on both quasi static
pullout test and rapid pullout test would be quite identical.
The possibility of minor variation in restrained dilatancy effect between quasi
static pullout test and rapid pullout test that appears as a possible cause to the
enhancement in pre peak rapid pullout stiffness and improvement in peak rapid
pullout strength will be discussed in next section.
4.3.3 The Causes of Improvements in Pre Peak Rapid Pullout Response
In the author’s opinion, there are three possible causes that may contribute to
the improvements in pre peak rapid pullout stiffness and peak rapid pullout strength
of rough nails that were observed in these experiments: (a) the improvement in
interfacial friction properties, (b) the improvement in restrained dilatancy effect and (c)
the mobilization of damping resistance. All of these possible causes will be examined
here to identify the most likely cause or causes.
In the discussion below, the improvements in pre peak rapid pullout stiffness
and peak rapid pullout strength of test series with varying nail diameters will be
compared qualitatively without considering the variation in pullout velocity between
these tests. This is reasonable as has been mentioned before that the pullout velocity
experienced by these tests before the peak rapid pullout stage were fairly identical to
each other (Appendix A). Therefore, the influence of variation in pullout velocity on
the validity of this comparison is minor.
(a) Improvement in Interface Friction Properties
The only past experiences that studied the behaviour of rapid or dynamic
interfacial shaft resistance for shaft embedded in clean dry sand are the experiments
by Dayal and Allen (1975), Hereema (1979) and Lepert et.al. (1988), but their results
cannot be compared to the results of rough nails of these experiments due to the
difference in basic mobilization characteristic between rough surface and smooth
surface (Uesugi et.al., 1988). However, since the failure of rough surface is likely to
be formed within the adjacent soil mass and the interface strength of rough surface is
bounded and equal to the shear strength of adjacent soil mass (Jewell, 1980, Uesugi
and Kishida, 1986), the experiences on rapid soil test may be applied to approximate
the behaviour of rough interface under rapid loading condition. As the sand medium
considered in these experiments consists of dry dense sands, only the experiences of
rapid test on dry dense sands are discussed here.
Casagrande and Shannon (1949) appears to be the first to study the rapid shear
strength of dry dense sand. Their results showed that the increase in loading rate
caused approximately 10 % of increase in peak shear strength. However, Whitman
and Healy (1962) with huge numbers of results on rapid Triaxial tests on Ottawa sand
indicated that the influence of loading rate on peak shear strength of dry dense sand
was quite minimal, with less than 1o of variation in peak friction angle. Whitman and
Healy (1962) attributed the increase in peak shear strength observed by Casagrande
and Shannon (1949) to the inaccuracy of load measurement device under rapid
loading condition. Schimming et.al. (1966) conducted a study on the friction angle of
soil under rapid loading condition with a modified direct shear setup. Their results
also showed that the influence of loading rate on peak and residual friction angle of
dry dense sand was virtually negligible. The loading rate independence of residual
friction angle of dry sand was also observed by Hungr and Morgenstern (1984) on
high velocity ring shear tests.
From these limited past experiences, the influence of loading rate on rapid
shear strength of dry dense sand seems quite minimal. Since the interface strength of
rough surface is bounded and equal to the shear strength of its adjacent soil mass, the
minimal influence of loading rate on shear strength of dry dense sand lead to the
conclusion that the influence of loading rate on interface strength of rough nails is
also quite minimal.
Besides, from the analytical equilibrium equation for peak pullout strength
(P=πdLeσ’n(p)tanδ’), the ratio of peak rapid pullout strength to peak quasi static
pullout strength (the αp ratio in Table 4.1) can be written as below:
s
r
spne
rpne
pdL
dL
'tan
'tan
'tan'
'tan'
)(
)(
δ
δ
δσπ
δσπα == (4.2)
with σ’n(p) = mean effective normal stress on nail shaft at peak pullout stage, r'δ =
rapid interface friction angle, and s'δ = static interface friction angle
From Eq. 4.2, it is observed that the αp ratio should be constant and
irregardless of nail diameter if the improvement in peak rapid pullout strength is
caused by the improvement in interface friction angle only. However, from the
comparison of αp ratio of DCs-S25C test series to DCs-S45C test series and DCs-
S25F test series to DCs-S45F test series (Table 4.1), it is clearly seen that the αp ratio
was significantly higher for test series with 45 mm of nail diameter (DCs-S45C test
series and DCs-S45F test series) when compared to those of test series with 25 mm of
nail diameter (DCs-S25C test series and DCs-S25F test series). In addition, the degree
of improvement in pre peak rapid pullout stiffness was also noticed to be more
pronounced for test series with 45 mm of nail diameter (compare Figure 4.2 to Figure
4.1 and Figure 4.5 to Figure 4.4).
Therefore, the improvement in interface friction properties under rapid loading
condition appears not to be the main cause for the improvement in pre peak pullout
stiffness and peak pullout strength observed in these experiments for tests on rough
nails.
(b) Improvement in Restrained Dilatancy Effect
Restrained dilatancy effect is a mechanism that causes the enhancement of
normal stress on dilative interface which eventually results in enhancement of
interfacial strength (Schlosser, 1982). Detailed explanations of this effect are given in
Section 3.5 of Chapter 3.
From the description of restrained dilatancy effect by Schlosser (1982), it is
clear that the main factor controlling the degree of restrained dilatancy effect is the
dilative behaviour of interface. Therefore, the discussion on the similarity of
restrained dilatancy effect under rapid and quasi static loading condition should be
based on the loading rate dependency of the dilative behaviour of interface. Since the
dilative behaviour of rough interface is mainly caused by the dilative behaviour of
high strain weaken zone adjacent to interface, the loading rate dependency of dilative
behaviour of rough interface can be deduced from the loading dependency of dilative
behaviour of soil.
However, results on loading rate dependency of dilative or volume change
behaviour of sand are very rare probably due to the difficulty and inaccuracy of
dilatancy or volume change measurement under rapid loading condition. The only
data available to the author is the results by Whitman and Healy (1962). In their paper,
the excess pore pressure generated in undrained Triaxial test of dense sand under
static and rapid test condition was found to be nearly identical, indicated that the
dilatancy behaviour of dense sand would be independent on loading rate.
The independence of dilatancy behaviour of dense sand on loading rate may
also be indirectly deduced from the results of rapid shear strength which appears
easier and more accurate to be measured. Theoretically, the peak shear strength of
dense sand is contributed by the basic inter-particle friction properties and the
dilatancy behaviour of the sand bulk. Therefore, the independence of shear strength of
dense sand on loading rate shown by Whitman and Healy (1962) and Schimming et.al.
(1966) also implicitly indicated the independence of dilatancy behaviour of sand bulk
on loading rate, provided the inter-particle friction angle is constant with loading rate,
which is shown to be true by Horn and Deere (1962).
Hence, from these limited available information, the dilatancy behaviour of
rough interface also seems to be unaffected by the loading rate. Consequently, it
appears that the degree of restrained dilatancy effect mobilized in quasi static and
rapid pullout test would be fairly similar, and suggests that this is not a likely cause
for the stiffer pre peak pullout stiffness and higher peak pullout strength of rapid
pullout response.
The irrelevance of restrained dilatancy effect to the improvements in pre peak
rapid pullout stiffness and peak rapid pullout strength may also be seen from the
proportionality of these improvements with nail diameter. The influence of restrained
dilatancy effect has been widely found to be inversely proportional to nail diameter by
experimental study (Tei, 1993), and analytical study (Luo, 2001) as well as by the
results of quasi static pullout test conducted in these experiments (Chapter 3). Thus, if
the improvements in pre peak rapid pullout stiffness and peak rapid pullout strength is
caused by the enhancement in degree of restrained dilatancy effect, the degree of
these improvements would be less pronounced for tests with larger nail diameter.
However, the results of these experiments show that the improvement in peak rapid
pullout strength was obviously more pronounced for tests with larger nail diameter.
From Table 4.1, the αp ratio of test series with 45 mm nail diameter (DCs-S45C test
series and DCs-S45F test series) was almost twice the αp ratio of test series with 25
mm nail diameter (DCs-S25C test series and DCs-S25F test series). Besides, the
improvement in pre peak rapid pullout stiffness was also seen to be more pronounced
for tests with larger nail diameter (compares Figure 4.2 to Figure 4.1 and Figure 4.5 to
Figure 4.4).
(c) Mobilization of Damping Effect
There are mainly two types of damping effects: viscous damping effect and
radiation damping effect. Viscosity damping effect is caused by the viscosity
properties of surrounding soil, which appears irrelevant to these experiments since the
soil mediums considered in these experiments were dry dense sands with minimal
viscosity properties. Radiation damping is caused by the radiation of stress wave from
the loading source. The radiation damping effect is always present and is identified as
the main damping source for a pile dynamic event (Smith and Chow, 1982).
Therefore, it is reasonable to deduce that radiation damping effect should also be
present in the rapid pullout response of these experiments.
From the analytical solution of radiation damping coefficient suggested by
Novak et.al. (1978), damping coefficient of radiation damping resistance is
proportional to shaft diameter. This characteristic of radiation damping appears to
agree well with the characteristic of improvements in pre peak rapid pullout stiffness
and peak rapid pullout strength which were fairly proportional to nail diameter. The
proportionality of improvement in peak rapid pullout strength to nail diameter can be
seen from the αp ratio given in Table 4.1, which shows that the αp ratio of test series
with 45 mm of nail diameter (DCs-S45C test series and DCs-S45F test series) was
almost twice the αp ratio of test series with 25 mm of nail diameter (DCs-S25C test
series and DCs-S25F test series). The direct proportionality of improvement in pre
peak pullout stiffness will be shown later in Section 4.4 of this chapter.
From the discussion above, it seems reasonable to deduce that the
improvements in pre peak rapid pullout stiffness and peak rapid pullout strength are
mainly caused by the mobilization of radiation damping effect. The influences of
variation in interface friction properties and restrained dilatancy effect are found to be
minimal. The influence of radiation damping effect has been widely suggested and
accepted by the industry of dynamic pile load test as the main damping source that
enhances the dynamic pile resistance (Smith and Chow, 1982), especially for cases
with non-viscous soil medium.
Since the failure of rough interface is mainly caused by the shear failure of soil
mass adjacent to the interface, the deduction that the improvement in peak rapid
pullout strength of rough nail is caused by the mobilization of radiation damping
resistance seems reasonable because the shear failure of soil is mainly controlled by
the amount of shear strain experienced. Hence, at the moment the limiting shear strain
of the adjacent soil mass is attained, the total resistance that experienced by the
interface should be the sum of the displacement dependent stiffness resistance (strain
effect) and the velocity dependent damping resistance (strain rate effect).
The influence of radiation damping effect on shaft resistance was also
considered by Wong (1988) in his formulation of dynamic shaft model for pile. In the
modeling of dynamic shaft resistance by spring and dashpot analogy, Wong (1988)
suggested that the failure of shaft resistance should be limited by the stiffness
resistance (spring) alone instead of by the sum of stiffness and damping resistance.
With this arrangement, the possibility for total dynamic shaft resistance to exceed the
limiting static shaft resistance is allowed by this model even the limiting shaft
resistance is equal for both dynamic and static cases.
4.3.4 Rapid Load Distribution Curve
The rapid load distribution curves of rough nails (after subtraction of inertia
effect by Eq. 4.1) are plotted in Figure 4.12 at pullout stages corresponding to 50 %
and 100 % of peak rapid pullout strength. To assess the difference in between the
rapid load distribution curves and quasi static load distribution curves, the quasi static
load distribution curves mobilized at similar level of pullout displacement are also
plotted in Figure 4.12.
From Figure 4.12, the rapid load distribution curve is found to be fairly a
straight line, similar to the characteristic of quasi static load distribution curve. This
observation shows the insignificant influence of stress wave propagation on rapid
pullout tests of these experiments. Chow (1999) illustrated that the shape of rapid load
distribution curve is only similar to the shape of static load distribution curve if the
influence of stress wave propagation is minimal. This observation was expected since
the relative wave length of rapid pullout tests conducted in these experiments is at
least 41 (Section 2.4.2), well beyond 10, the lower boundary value suggested by
Holeyman (1992) for the elimination of stress wave propagation phenomenon.
Besides, the linearity of rapid load distribution curve also suggests the rigid body
behaviour of nails in rapid pullout tests, even for tests with 1.65 m of effective nail
length.
Although the shape of both quasi static and rapid load distribution curves was
similar to each other, the rapid load distribution curve was obviously steeper than the
quasi static load distribution curve. This is reasonable due to the additional
contribution by radiation damping resistance to the shaft resistance of rapid pullout
tests. The difference in terms of load between both rapid and quasi static load
distribution curves is seen to linearly decrease with distance from nail head,
suggesting that the unit damping resistance mobilized in rapid pullout test was
uniformly distributed along the nail. The uniformity of unit damping resistance
deduced here also implicitly indicates the minimal influence of rigid chamber wall
presence at 100 mm in front of the nail head (the front end of nail in contact with
surrounding soil) on the mobilization of damping resistance. It is because the unit
damping resistance of front part of nail would be different from the unit damping
resistance of rear part of nail if significant influence of rigid front wall effect is
present.
4.4 The ‘Actual’ Damping Coefficient
The improvements in pre peak rapid pullout stiffness and peak rapid pullout
strength of rough nails has been discussed to be most likely induced by the
mobilization of radiation damping resistance. In order to quantify the radiation
damping resistance that was mobilized in each rapid pullout test on rough nails of
these experiments, the ‘actual’ damping coefficient defined by Eq. 4.3 was calculated.
The ‘actual’ damping coefficient is defined as the product of difference between rapid

pullout load and quasi static pullout load mobilized at similar pullout displacement, in
terms of per unit length, divided by the pullout velocity of nail head.
e
i
i
s
i
r
Lv
PPc
−=* (4.3)
with c* = ‘actual’ damping coefficient (per unit length); Pri = rapid load at point i; Ps
i
= quasi static load at point i; and vi = pullout velocity at point i; Le = effective nail
length.
In the calculation of ‘actual’ damping coefficient by Eq. 4.3, the displacement
dependent stiffness coefficient of rapid pullout response is assumed to be identical to
that of corresponding quasi static pullout response. This assumption may be supported
by the results of low energy rapid pullout tests that will be presented and discussed in
Chapter 5 later. The unloading point of low energy rapid pullout response with zero
velocity (and hence mobilized only the displacement dependent stiffness resistance at
that point) is observed to approximately fall on the corresponding quasi static pullout
response (Figure 5.1 – Figure 5.5), infers the virtually identical of stiffness coefficient
of both rapid and quasi static pullout tests.
Figure 4.13 – Figure 4.19 plot the curves of ‘actual’ damping coefficient
versus pullout displacement for all high energy rapid pullout tests on rough nail of
these experiments. It has been widely accepted that the existence of high strain
weaken zone adjacent to nail shaft will reduce the radiation damping effect (Novak
and Sheta, 1980). The evolution of high strain weaken zone is progressive in nature
that evolves with the increase in shear strain level of weaken zone (and hence the
pullout displacement in the context of pullout test). Hence, it is anticipated that
‘actual’ damping coefficient calculated by Eq. 4.3 which is mainly governed by
radiation damping effect will exhibit certain relationship with pullout displacement.
‘Actual’ damping coefficient was also calculated from axial body load to
examine the distribution of damping effect along the nail. In the calculation of ‘actual’
damping coefficient from axial body load, Le in Eq. 4.3 was taken as the length of nail
after the axial body load measurement point.
The axis of pullout displacement (x - axis) of Figure 4.13 – Figure 4.19 is only
limited to peak rapid pullout stage because after that, the pullout response has turned
into drastic softening behaviour that mostly involves the mechanism of shear band
evolution, a mechanism that is totally different from the radiation damping effect.
From Figure 4.13 – Figure 4.19, it is seen that although the curves of ‘actual’
damping coefficient calculated from the load measurement made at nail head and
several strain measurement points along the nail appears to be quite scattered, they
seem to fall in a band with finite thickness. This observation implies the uniformity of
unit damping resistance distributed along the nail. It has to be noted that there is no
clear relationship between the position of an ‘actual’ damping coefficient curve with
its load measurement location. As an example, from Figure 4.13, the highest ‘actual’
damping coefficient curve of DCs-S25C-2-RH test was the curve deduced from
pullout load measured at nail head (DCs-S25C-2-RH, 0 m); while the highest ‘actual’
damping coefficient curve for of DCs-S25C-4-RH test was the curve deduced from
axial body load measured at 0.45 m from nail head (DCs-S25C-4-RH, 0.45 m). The
rather scattered appearance of ‘actual’ damping coefficient curve may be attributed to
the nature of Eq. 4.3 that would exaggerate the small error in rapid and quasi static
load measurement and the small error in velocity differentiated from displacement
trace. It is also noted that the distribution of ‘actual’ damping coefficient at small
pullout displacement (< 0.4 mm) seems severely scattered and unreliable, most
probably caused by the relatively low pullout load of this region that reduce the
sensitivity of load cell or strain gauges in capturing the real variation between rapid
pullout load and quasi static pullout load.
From Figure 4.13 – Figure 4.19, the curves of ‘actual’ damping coefficient is
decreasing with the increase in pullout displacement. This result agrees with the
observations made by Ealy and Justason (2000) on rapid load test results of pile
groups. As has been mentioned before, this characteristic of ‘actual’ damping
coefficient is mainly attributed to the progressive evolution of high strain weaken
zone around nail shaft due to strong non linearity of soil behaviour. The existence of
high strain weaken zone which is less stiff than the relatively undisturbed outer field
soil medium may cause relative velocity between nail shaft and outer field soil
medium. From the suggestions by Novak and Sheta (1980), El-Naggar and Novak
(1992) and Khaled (2000), the outer field soil medium is the main soil medium that
contributes to the total radiation damping resistance because the mass of thin weaken
zone is comparatively minimal when compared to the mass of outer field soil medium.
However, in common setup of rapid pullout test such as in these experiments, the only
measurable velocity is the velocity of nail shaft. Hence, the ‘actual’ damping
coefficient calculated by using the velocity of nail shaft (Eq. 4.3) is not the basic
damping properties of soil but the ‘apparent’ damping properties taking into account
the variation between the velocity of nail shaft and the velocity experienced by outer
field soil medium. The reduction in shear modulus of high strain weaken zone will
increase the extent of relative velocity between nail shaft and outer field soil medium
and finally lead to the decrease in ‘actual’ damping coefficient.
It is well understood that the development of high strain weaken zone is in a
progressive manner that can be fitted by a hyperbolic curve. Therefore, the relative
velocity between nail shaft and outer field soil medium grows with the increase in
pullout displacement and consequently causes the progressive decrease in ‘actual’
damping coefficient.
From the results of these experiments, ‘actual’ damping coefficient is also
found to correlate reasonably well with the tangent stiffness of corresponding quasi
static load displacement curve by the following equation:
t
skdc β=* (4.4)
with β = correlation factor, d = shaft diameter, kst = tangent stiffness of corresponding
quasi static load displacement curve (per unit length).
The curves of ‘actual’ damping coefficient calculated by the above equation
are also plotted in Figure 4.13 – Figure 4.19, together with their corresponding
experimental results. It is observed that the trend of these calculated curves agrees
reasonably well with the experimental results. The close correlation between
equivalent quasi static tangent stiffness and ‘actual’ damping coefficient implicitly
verifies the anticipation that non constant characteristic of ‘actual’ damping
coefficient is mainly induced by the development of high strain weaken zone, which
is also the main contributor to the non linear hyperbolic behaviour of quasi static load
displacement response. The correlation factor β is also found to fall within a narrow
range of 35 to 42 for test series with dense coarse sand medium (DCs-S25C test series
– Figure 4.13, DCs-S45C test series – Figure 4.14, DCs-S25F test series – Figure 4.16,
DCs-S45F test series – Figure 4.17 and DCs-L25F test series – Figure 4.18), 25 for
test series with medium dense coarse sand medium (MCs-S25C test series – Figure
4.15) and 45 for test series with dense fine sand medium (DFs-S25F test series –
Figure 4.19). However, more results are needed before general conclusion and
recommendation on this correlation factor β can be drawn.
It has to be stressed that the conclusion of ‘actual’ damping coefficient is
decreasing with pullout displacement does not violate the basic velocity dependent
principle of damping resistance. It is because in the calculation of ‘actual’ damping
coefficient by Eq. 4.3, velocity has been considered as a denominator in this equation.
The resultant ‘actual’ damping coefficient should be a constant if damping resistance
mobilized in a rapid pullout test of soil nail is purely dependent on velocity alone.
In Figure 4.20, the band of ‘actual’ damping coefficient of DCs-S25C test
series is compared to that of DCs-S25F test series, and both of these bands are seen to
match with each other quite well. Although the band of ‘actual’ damping coefficient
of DCs-S25F test series seemed slightly lower than that of DCs-S25C test series, the
difference was uncertain and quite negligible if compared to the thickness of the error
band. This observation seems reasonable since both nails with C surface (sand glued
by coarse sand) and F surface (sand glued by fine sand) are categorized as rough nail
with their pullout response be mainly determined by the properties of surrounding soil
medium. This can be seen from the equal of initial pullout stiffness and secant pullout
stiffness at peak of quasi static pullout response of both test series (Figure 3.10).
While, Figure 4.21 compares the band of ‘actual’ damping coefficient of MCs-
S25C test series to that of DCs-S25C test series. This figure reveals that the band of
‘actual’ damping coefficient of MCs-S25C test series was more obviously lower than
the band of DCs-S25C test series. This result seems logical since the density of sand
medium in MCs-S25C test series (Id = 82 %) was lower than the density of sand
medium in DCs-S25C test series (Id = 90 %). The lower sand density of MCs-S25C
test series may reduce the stiffness of weaken zone. This can be indirectly seen from
the lower initial pullout stiffness and secant pullout stiffness at peak of MCs-S25C
test series when compared to those of DCs-S25C test series (Figure 3.11). The lower
stiffness of weaken zone may increase the relative velocity between nail shaft and far
field soil medium and consequently decrease the ‘actual’ damping coefficient
calculated by Eq. 4.3.
Figure 4.22 compares the bands of ‘actual’ damping coefficient of DCs-S25F
test series and DCs-L25F test series. It is seen that the ‘actual’ damping coefficient of
DCs-L25F test series was approximately matched with the band of DCs-S25F test
series. This observation again suggests the uniformity of unit damping resistance
distributed along the nail.
Figure 4.23 to Figure 4.24 plot the comparison of ‘actual’ damping coefficient
of DCs-S25C test series to DCs-S45C test series and DCs-S25F test series to DCs-
S45F test series. In these figures, the ‘actual’ damping coefficients of test series with
45 mm nail diameter (DCs-S45C test series and DCs-S45F test series) are normalized
to 25 mm nail diameter. It is clearly seen that after the normalization, the ‘actual’
damping coefficients of test series with different nail diameter appear to fall in the
same band, suggesting the direct proportional relationship between nail diameter and
‘actual’ damping coefficient. This result agrees with the analytical solution by Novak
et al. (1978) which suggested the direct proportion of radiation damping coefficient to
shaft diameter. This observation also to some extent justifies the deduction that the
stiffer pre peak rapid pullout stiffness and higher peak rapid pullout strength are
mainly caused by radiation damping effect.

4.5 Post Peak Softening Behaviour of Rough Nail
Similar to the post peak behaviour of quasi static pullout tests, the post peak
behaviour of rapid pullout tests also exhibited softening behaviour with pullout load
decreasing with the increase in post peak pullout displacement. However, the
softening rate (in terms of pullout displacement) of post peak rapid pullout response
was obviously much steeper than the softening rate of post peak quasi static pullout
response. As can be seen from Figure 4.1 to Figure 4.7, the post peak rapid pullout
response generally attained the well defined residual pullout stage after approximately
2 mm of post peak pullout displacement irregardless of nail diameter, effective nail
length, surface roughness (rough surface only) and sand density. In contrary, well
defined residual pullout stages was not clearly attained by the quasi static pullout tests
even the post peak pullout displacement was as high as 15 mm (DCs-S25C-5-S,
Figure 3.1).
It has to be noted that the variation in post peak pullout behaviour between
rapid pullout test and quasi static pullout test appears to be an intrinsic characteristic
of interfacial shaft resistance under different loading rates as this variation was not
only observed on pullout load measured at nail head but also on axial body load
measured along the nail body by strain gauges. Besides, the distribution of residual
rapid pullout strength along the nail was also fairly linear as shown in Figure 4.25,
implies that the distribution of residual rapid pullout strength along the nail body is
fairly uniform.
Besides, this variation in post peak pullout behaviour also should not be
influenced by the particle size effect. It is because this characteristic was also
observed on DFs-S25F test series (Figure 4.7) with d/D50 ratio as high as 208, slightly

exceeded the highest d/D50 ratio that has ever been proposed to eliminate the particle
size effect (Randolph and House, 2001).
From the comparison of load displacement curves and velocity displacement
curves plotted in Figure 4.26 to Figure 4.32 for all series of tests on rough nails,
sudden rise in pullout velocity (the point circled in these figures) was generally
observed in vicinity of the sharp turning point on the rapid load displacement curve
where residual rapid pullout stage was first achieved (though it was rather unclear for
MCs-S25C test series (Figure 4.28) and DCs-S25F test series (Figure 4.29)). This
sudden rise in pullout velocity suggests the abrupt ‘detachment’ of nail from
surrounding sand medium once the residual rapid pullout stage has been achieved.
From the comparison of load displacement curve and velocity displacement
curve (Figure 4.26 to Figure 4.32), the residual rapid pullout strength is also seen to
be unaffected by the substantial change in pullout velocity after the sharp turning
point, implies that the effect of damping resistance is virtually ceased in the residual
rapid pullout stage. Therefore, the residual rapid pullout strength may be merely
contributed by the residual friction angle of nail – sand interface. This observation
again suggest the total de-coupling of the motion of nail from the surrounding soil
medium after the residual rapid pullout stage has been attained.
Table 4.1 listed the residual rapid pullout strength Prres
attained by all series of
tests on rough nails. The ratio of friction coefficient at residual rapid pullout stage was
also calculated and given in Table 4.1. The ratio of friction coefficient at residual
rapid pullout stage was calculated by Eq. 3.1 – Eq. 3.3, by replacing the Psp in Eq. 3.1
to Prres
and equating the interface friction angle δ’ in Eq. 3.2 to the residual interface
friction angle of corresponding interface test (Table 2.2). The use of static residual
interface friction angle to represent the rapid residual interface friction angle is
reasonable since Schimming et.al. (1966) and Hungr and Morgenstern (1984) have
shown that the residual friction angle of dry dense sand was independent of loading
rate.
In Table 4.1, the ratio of friction coefficient at peak of quasi static pullout tests
given in Table 3.1 is also reproduced for comparison. From the comparison, it is
interesting to reveal that the ratio of friction coefficient at residual rapid pullout stage
was fairly identical to the ratio of friction coefficient at peak of corresponding quasi
static pullout tests with variation less than 10 %. This observation implies that the
evolution of rapid pullout stage from peak to residual is mainly contributed by the
evolution of interface friction angle, and the increase in mean effective normal stress
caused by restrained dilatancy effect is minimal between the peak and residual rapid
pullout stages. This statement was made under the assumption that the ratio of friction
coefficient at peak of rapid pullout test can be approximated by the ratio of friction
coefficient at peak of corresponding quasi static pullout test. This assumption seems
valid since the improvements in pre peak rapid pullout response has been discussed to
be most probably contributed by the radiation damping effect, and the quasi static
pullout load mobilized at the point of peak rapid pullout strength (at similar pullout
displacement) was quite close to the corresponding peak quasi static pullout strength
with less than 5 % in variation (Figure 4.1 – Figure 4.7).
The maximum reloading pullout strength Psreload
attained by the quasi static
reload tests presented in Section 3.6 is also re-produced in Table 4.1. It is worth to
note that the residual rapid pullout strength was fairly identical to the maximum
reloading pullout strength, with variation less than 11 %. Since it was anticipated in
Chapter 3 that the maximum reloading pullout strength may be eventually attained by
the primary quasi static pullout test if longer pullout displacement was allowed in the
test, the residual rapid pullout strength may be taken as an approximation to the
residual quasi static pullout strength that will be mobilized at large pullout
displacement.
In the author’s opinion, the difference in post peak softening behaviour of
rapid and quasi static pullout response is postulated to be caused by the difference in
nature of shear band evolution under rapid and quasi static loading conditions.
The evolution of shear band in rough interface tests was observed by Yoshimi
and Kishida (1981), Uesugi et.al. (1988) and Hu and Pu (2004). Their observations
showed that the form of obvious shear band was only initiated after the point of peak
shear strength. After that, the deformation of adjacent sand medium was observed to
concentrate within a thin shear band with finite thickness. The form of shear band
around rough reinforcement in quasi static pullout tests was also observed by Jewell
(1980), Tei (1993) and Otani et.al. (2001). Jewell (1980) and Otani et.al. (2001)
demonstrated that the form of shear band was dominantly initiated after the stage of
peak pullout strength. The thickness of shear band formed around the rough planar
reinforcement with sand glued surface was measured as approximately 20 times of
D50, the mean particle size of sand by Jewell (1980) and Tei (1993).
Oda and Kazama (1998) proposed a model as shown in Figure 4.33 to describe
the evolution of shear band under static load. According to this model, the post peak
softening behaviour is mainly contributed by the buckling of sand particle columns.
The progressive buckling of particle columns may gradually reduce the axial capacity
of these columns and eventually the shear capacity of shear band. At last, once the
limiting rotational resistance across particle contacts required to hold the highly bent
column structure in stable has been exceeded, the particle columns may collapse to
enter the residual shear stage. The rotational resistance across particle contacts was
identified by Oda and Kazama (1998) as the main key controlling the evolution of
shear band and hence the post peak softening behaviour. Although this model was
created to describe the evolution of shear band in Triaxial sand sample, it should be
applicable to describe the evolution of shear band along rough interface since the
failure plane of rough interface is likely to be formed within the adjacent sand mass.
By referring to this model, the evolution of shear band along the nail – sand
rough interface under quasi static load is visualized as Figure 4.34a. Initially the
particle column is assumed to tilt at 45o from the nail – sand interface, in direction
parallel to the direction of major principle stress of soil adjacent to reinforcement
suggested by Luo (2001). The thickness of shear band is chosen as 20 sand particles
according to the observation by Jewell (1980) and Tei (1993). With the increase in
post peak pullout displacement, the particle column is visualized to gradually buckle
and bend, and at last collapse once the limiting rotational resistance across particle
contacts is exceeded (Figure 4.34a).
However, it is postulated that the fully buckling of particle columns in quasi
static test (Figure 4.34a) may not happen in rapid test due to the additional inertia
resistance of sand particles. The presence of inertia resistance may increase the
resistance of particle columns to buckling. Thus, higher rotational moment propagated
from the nail – soil interface is needed in order to buckle the column structure.
However, the limiting rotational moment that can be propagated across adjacent
particles is controlled by the limiting rotational resistance across the particle contacts,
which is independent of loading rate (Horn and Deere, 1962). Therefore, the column
structures has a tendency to collapse due to the lack of limiting rotational resistance
across particle contacts before the fully buckling structure similar to quasi static test
(Figure 4.34a) is formed. Hence, the height of buckled particle column of rapid test
may be significantly shorter than that of quasi static test. Figure 4.34b visualized the
postulation of shear band evolution in rapid test. From Figure 4.34, it is clear that
shorter height of buckled particle column results in smaller relative displacement
required to cause the collapse of column structure, and hence smaller relative
displacement required to achieve residual stage.
4.6 Rapid Pullout Response of Smooth Nail
The rapid load displacement curves (‘net’ rapid soil response with inertia
effect has been subtracted by Eq. 4.1) of tests series on smooth nails, the DCs-S22U
test series (untreated smooth stainless steel surface) and the DCs-S25P test series
(surface roughened by sand paper), are plotted in Figure 4.8 and Figure 4.9, together
with the corresponding quasi static load displacement curves reproduced from Figure
3.8 and Figure 3.9.
From Figure 4.8 and Figure 4.9, it is seen that the rapid load displacement
response of smooth nails was well matched with the corresponding quasi static load
displacement response. This observation implies that the influence of radiation
damping effect on rapid pullout response of smooth nails was minimal and negligible.
This phenomenon may be explained by the characteristic of smooth surface pointed
out by Yoshimi and Kishida (1980), Uesugi et.al. (1988) and Hu and Pu (2004). From
their observation, the shear deformation of soil mass in contact with smooth surface is
very minimal and the sliding displacement along the interface appears to be the
dominant contributor to the total interface displacement. The failure of smooth surface
is also most likely to occur along the interface as opposed to within the adjacent soil
mass for rough surface. In other words, there is large discontinuity in between the
motion of smooth surface and the adjacent soil medium. Since the radiation damping
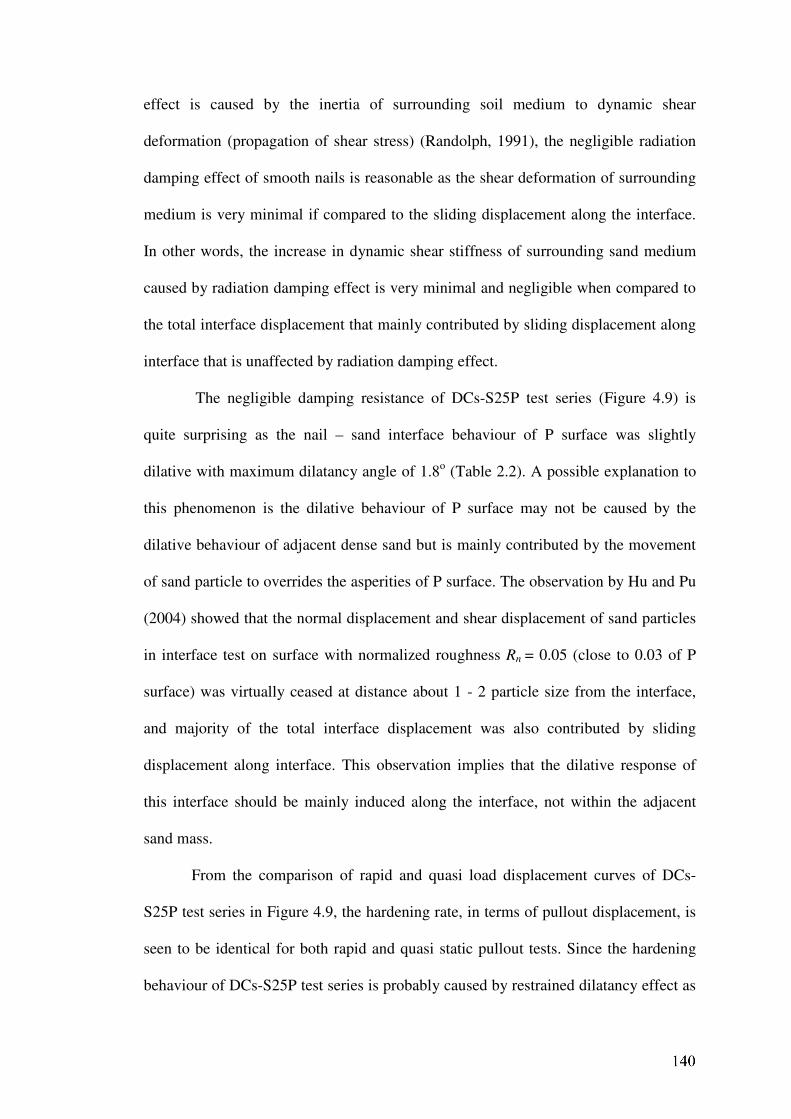
effect is caused by the inertia of surrounding soil medium to dynamic shear
deformation (propagation of shear stress) (Randolph, 1991), the negligible radiation
damping effect of smooth nails is reasonable as the shear deformation of surrounding
medium is very minimal if compared to the sliding displacement along the interface.
In other words, the increase in dynamic shear stiffness of surrounding sand medium
caused by radiation damping effect is very minimal and negligible when compared to
the total interface displacement that mainly contributed by sliding displacement along
interface that is unaffected by radiation damping effect.
The negligible damping resistance of DCs-S25P test series (Figure 4.9) is
quite surprising as the nail – sand interface behaviour of P surface was slightly
dilative with maximum dilatancy angle of 1.8o (Table 2.2). A possible explanation to
this phenomenon is the dilative behaviour of P surface may not be caused by the
dilative behaviour of adjacent dense sand but is mainly contributed by the movement
of sand particle to overrides the asperities of P surface. The observation by Hu and Pu
(2004) showed that the normal displacement and shear displacement of sand particles
in interface test on surface with normalized roughness Rn = 0.05 (close to 0.03 of P
surface) was virtually ceased at distance about 1 - 2 particle size from the interface,
and majority of the total interface displacement was also contributed by sliding
displacement along interface. This observation implies that the dilative response of
this interface should be mainly induced along the interface, not within the adjacent
sand mass.
From the comparison of rapid and quasi load displacement curves of DCs-
S25P test series in Figure 4.9, the hardening rate, in terms of pullout displacement, is
seen to be identical for both rapid and quasi static pullout tests. Since the hardening
behaviour of DCs-S25P test series is probably caused by restrained dilatancy effect as
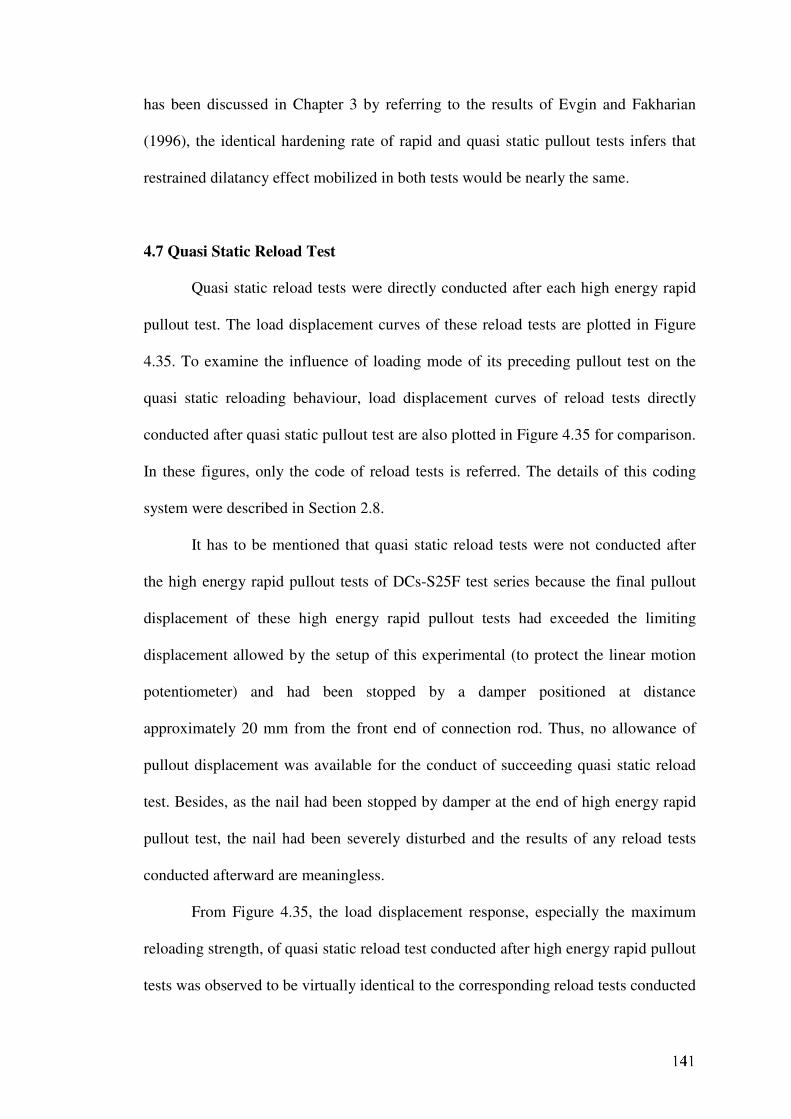
has been discussed in Chapter 3 by referring to the results of Evgin and Fakharian
(1996), the identical hardening rate of rapid and quasi static pullout tests infers that
restrained dilatancy effect mobilized in both tests would be nearly the same.
4.7 Quasi Static Reload Test
Quasi static reload tests were directly conducted after each high energy rapid
pullout test. The load displacement curves of these reload tests are plotted in Figure
4.35. To examine the influence of loading mode of its preceding pullout test on the
quasi static reloading behaviour, load displacement curves of reload tests directly
conducted after quasi static pullout test are also plotted in Figure 4.35 for comparison.
In these figures, only the code of reload tests is referred. The details of this coding
system were described in Section 2.8.
It has to be mentioned that quasi static reload tests were not conducted after
the high energy rapid pullout tests of DCs-S25F test series because the final pullout
displacement of these high energy rapid pullout tests had exceeded the limiting
displacement allowed by the setup of this experimental (to protect the linear motion
potentiometer) and had been stopped by a damper positioned at distance
approximately 20 mm from the front end of connection rod. Thus, no allowance of
pullout displacement was available for the conduct of succeeding quasi static reload
test. Besides, as the nail had been stopped by damper at the end of high energy rapid
pullout test, the nail had been severely disturbed and the results of any reload tests
conducted afterward are meaningless.
From Figure 4.35, the load displacement response, especially the maximum
reloading strength, of quasi static reload test conducted after high energy rapid pullout
tests was observed to be virtually identical to the corresponding reload tests conducted
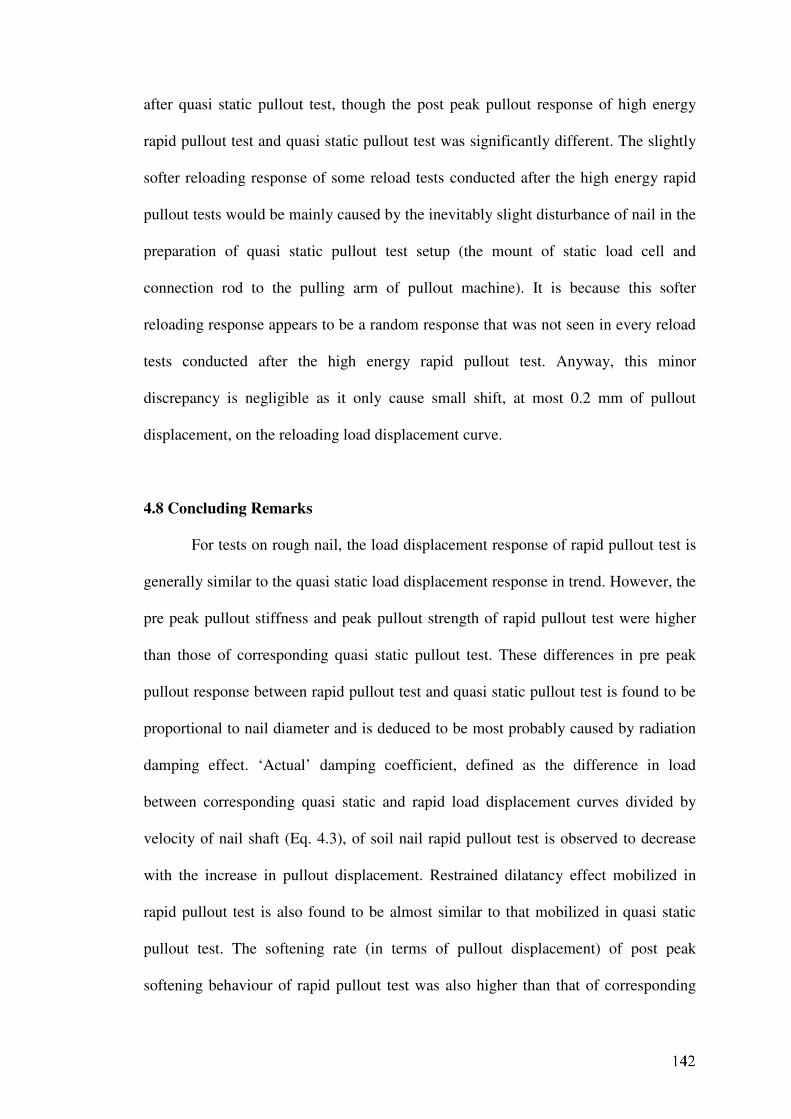
after quasi static pullout test, though the post peak pullout response of high energy
rapid pullout test and quasi static pullout test was significantly different. The slightly
softer reloading response of some reload tests conducted after the high energy rapid
pullout tests would be mainly caused by the inevitably slight disturbance of nail in the
preparation of quasi static pullout test setup (the mount of static load cell and
connection rod to the pulling arm of pullout machine). It is because this softer
reloading response appears to be a random response that was not seen in every reload
tests conducted after the high energy rapid pullout test. Anyway, this minor
discrepancy is negligible as it only cause small shift, at most 0.2 mm of pullout
displacement, on the reloading load displacement curve.
4.8 Concluding Remarks
For tests on rough nail, the load displacement response of rapid pullout test is
generally similar to the quasi static load displacement response in trend. However, the
pre peak pullout stiffness and peak pullout strength of rapid pullout test were higher
than those of corresponding quasi static pullout test. These differences in pre peak
pullout response between rapid pullout test and quasi static pullout test is found to be
proportional to nail diameter and is deduced to be most probably caused by radiation
damping effect. ‘Actual’ damping coefficient, defined as the difference in load
between corresponding quasi static and rapid load displacement curves divided by
velocity of nail shaft (Eq. 4.3), of soil nail rapid pullout test is observed to decrease
with the increase in pullout displacement. Restrained dilatancy effect mobilized in
rapid pullout test is also found to be almost similar to that mobilized in quasi static
pullout test. The softening rate (in terms of pullout displacement) of post peak
softening behaviour of rapid pullout test was also higher than that of corresponding

quasi static pullout test. This variation is postulated to be caused by the basic
difference in shear band evolution under both rapid and quasi static loading conditions.
In contrary, the rapid pullout response of smooth nail was virtually identical to
the corresponding quasi static pullout response with minimal damping effect.
Therefore, the results of high energy rapid pullout test of smooth nail can be
directly taken as a good estimation to the equivalent quasi static pullout response
without any treatment. While, the results of high energy rapid pullout test of rough
nail may need certain treatment to subtract the contribution of damping resistance
from the rapid pullout test results and to achieve a reasonable estimate of equivalent
quasi static pullout response. A possible interpretation method for these purposes is
back analysis by simple spring and dashpot model.
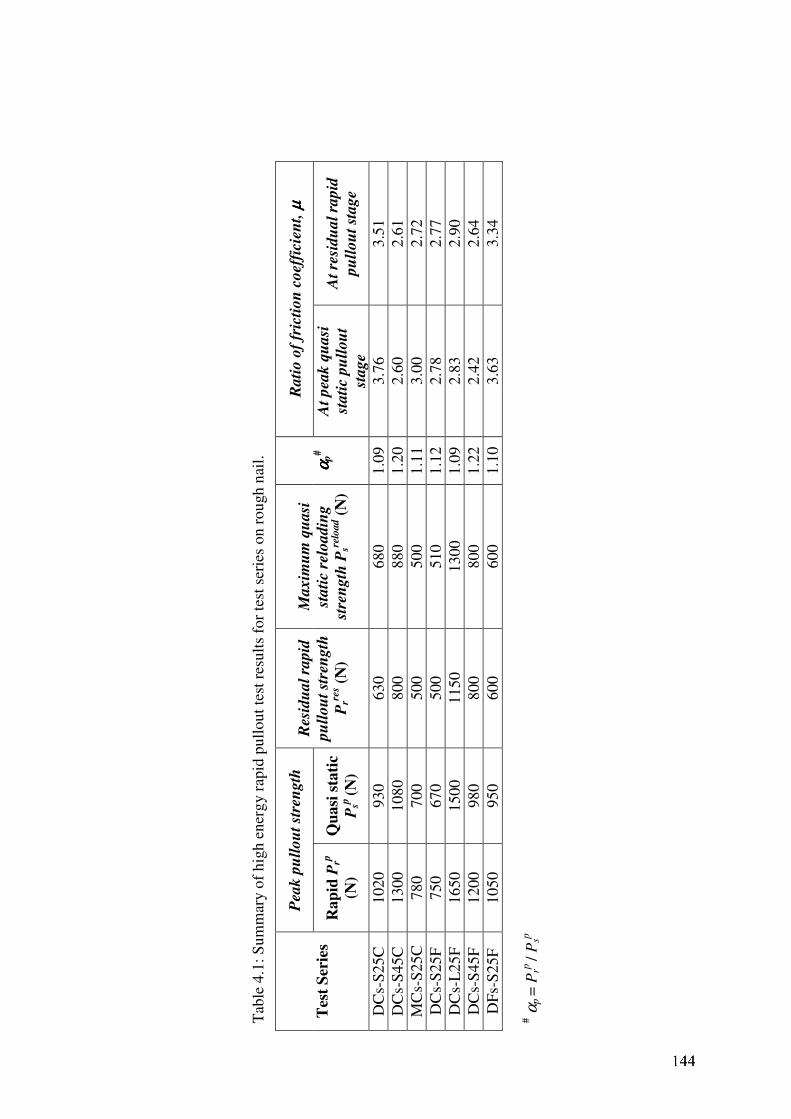
Tab
le 4
.1:
Su
mm
ary o
f h
igh
en
erg
y r
apid
pull
out
test
res
ult
s fo
r te
st s
erie
s on r
ough n
ail.
Pea
k p
ull
ou
t st
ren
gth
R
ati
o o
f fr
icti
on
coeff
icie
nt,
µ µµµ
Tes
t S
erie
s R
ap
id P
rp
(N)
Qu
asi
sta
tic
Psp
(N)
Resi
du
al
rapid
pu
llou
t st
ren
gth
Prre
s (N
)
Maxim
um
qu
asi
stati
c r
elo
adin
g
stre
ngth
Psre
load (
N)
α αααp
#
At
peak q
uasi
stati
c p
ull
ou
t
stage
At
resi
du
al
rapid
pu
llou
t st
age
DC
s-S
25C
1
02
0
93
0
630
680
1.0
9
3.7
6
3.5
1
DC
s-S
45C
1
30
0
10
80
800
880
1.2
0
2.6
0
2.6
1
MC
s-S
25C
7
80
7
00
500
500
1.1
1
3.0
0
2.7
2
DC
s-S
25F
7
50
6
70
500
510
1.1
2
2.7
8
2.7
7
DC
s-L
25
F
16
50
1
50
0
1150
1300
1.0
9
2.8
3
2.9
0
DC
s-S
45F
1
20
0
98
0
800
800
1.2
2
2.4
2
2.6
4
DF
s-S
25F
1
05
0
95
0
600
600
1.1
0
3.6
3
3.3
4
# α
p =
Prp
/ P
sp
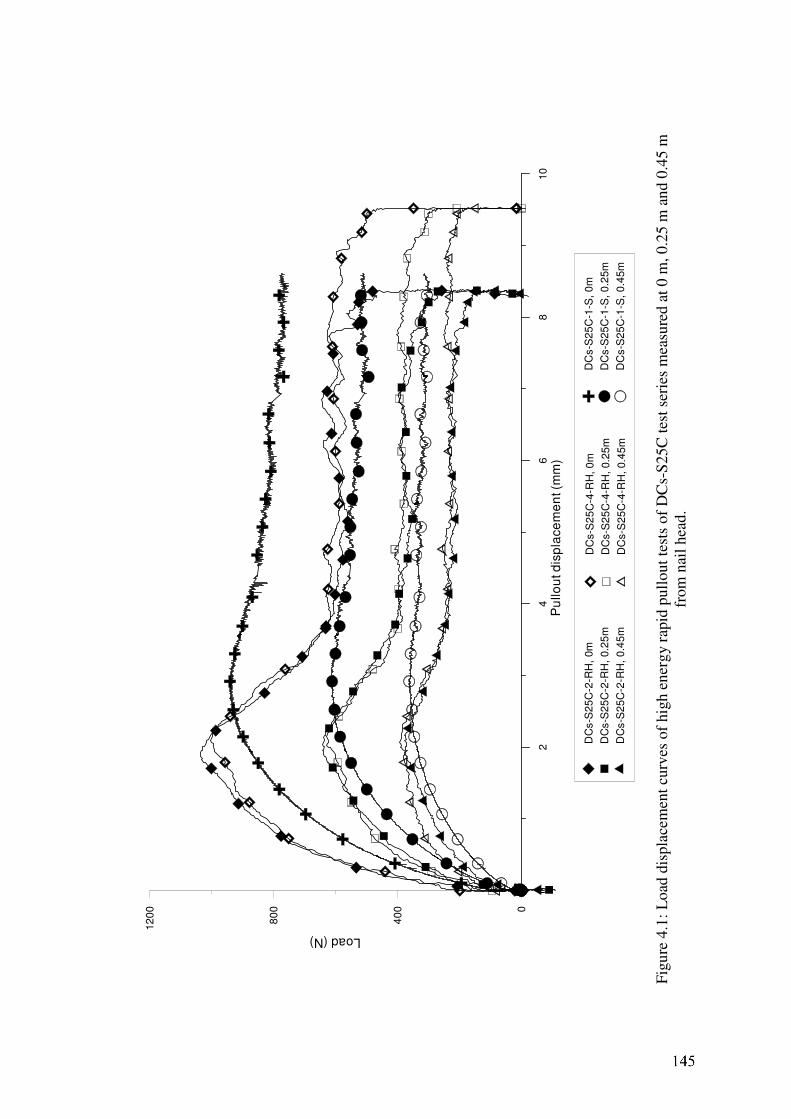
02
46
810
Pu
llo
ut d
isp
lace
me
nt (m
m)
0
40
0
80
0
12
00
Load (N)
DC
s-S
25
C-2
-RH
, 0m
DC
s-S
25
C-2
-RH
, 0.2
5m
DC
s-S
25
C-2
-RH
, 0.4
5m
DC
s-S
25
C-1
-S, 0
m
DC
s-S
25
C-1
-S, 0
.25m
DC
s-S
25
C-1
-S, 0
.45m
DC
s-S
25
C-4
-R,
0m
DC
s-S
25
C-4
-RH
, 0.2
5m
DC
s-S
25
C-4
-RH
, 0.4
5m
H
Fig
ure
4.1
: L
oad
dis
pla
cem
ent
curv
es o
f hig
h e
ner
gy r
apid
pull
out
test
s of
DC
s-S
25C
tes
t se
ries
mea
sure
d a
t 0 m
, 0.2
5 m
an
d 0
.45 m
from
nai
l hea
d.
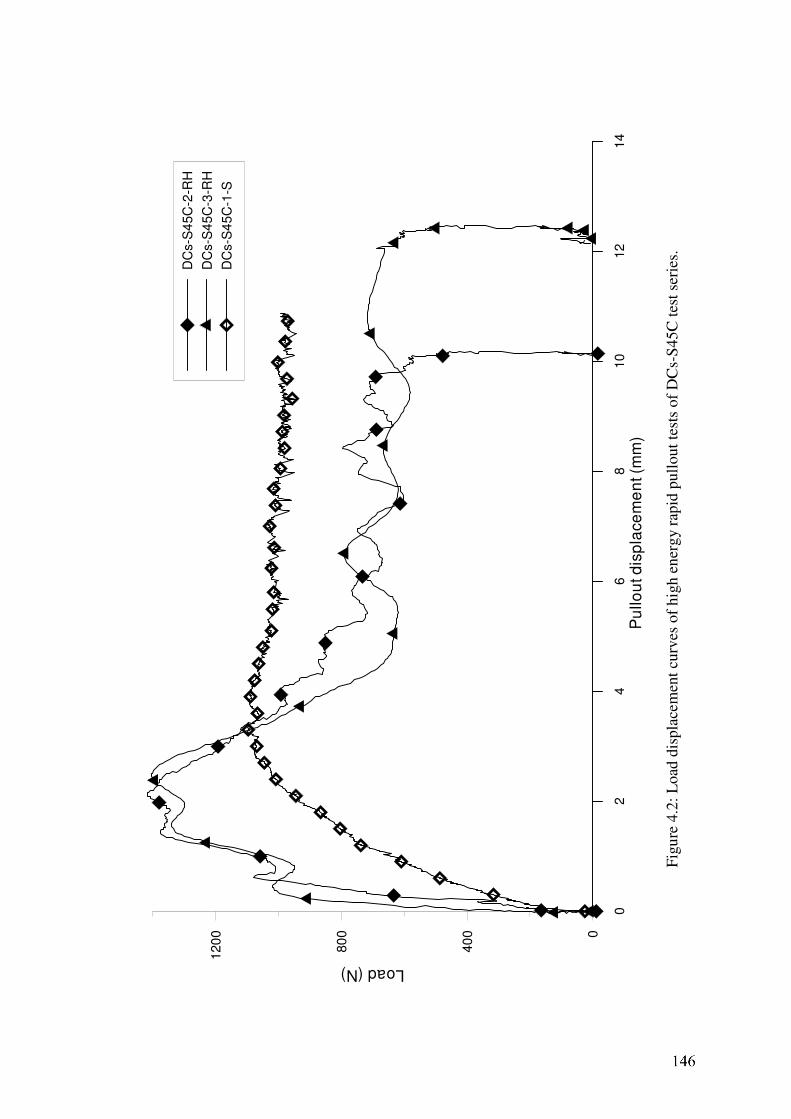
02
46
810
12
14
Pu
llo
ut d
isp
lace
me
nt (m
m)
0
40
0
80
0
120
0
Load (N)
DC
s-S
45C
-2-R
H
DC
s-S
45C
-3-R
H
DC
s-S
45C
-1-S
Fig
ure
4.2
: L
oad
dis
pla
cem
ent
curv
es o
f hig
h e
ner
gy r
apid
pull
out
test
s of
DC
s-S
45C
tes
t se
ries
.
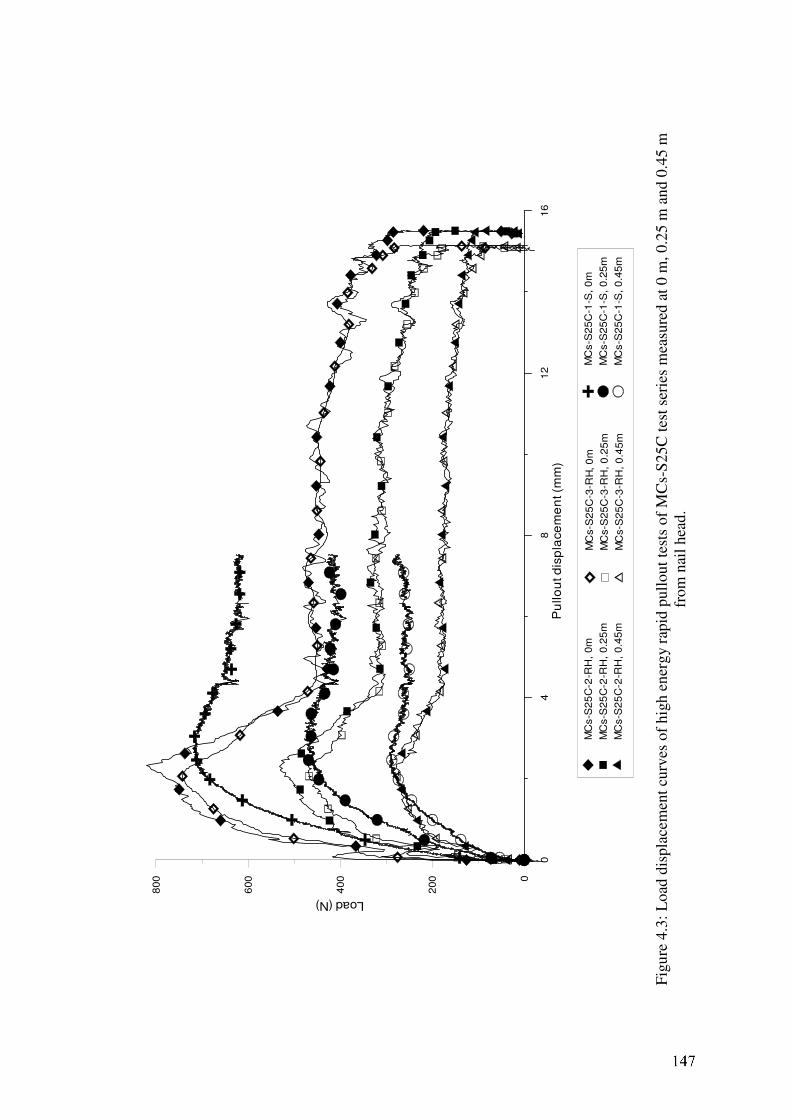
04
81
216
Pu
llo
ut d
isp
lace
me
nt (m
m)
0
200
400
600
800
Load (N)
MC
s-S
25
C-2
-RH
, 0m
MC
s-S
25
C-2
-RH
, 0.2
5m
MC
s-S
25
C-2
-RH
, 0.4
5m
MC
s-S
25
C-1
-S,
0m
MC
s-S
25
C-1
-S,
0.2
5m
MC
s-S
25
C-1
-S,
0.4
5m
MC
s-S
25
C-3
-R, 0
m
MC
s-S
25
C-3
-RH
, 0
.25
m
MC
s-S
25
C-3
-RH
, 0
.45
m
H
Fig
ure
4.3
: L
oad
dis
pla
cem
ent
curv
es o
f hig
h e
ner
gy r
apid
pull
out
test
s of
MC
s-S
25C
tes
t se
ries
mea
sure
d a
t 0 m
, 0.2
5 m
an
d 0
.45 m
from
nai
l hea
d.
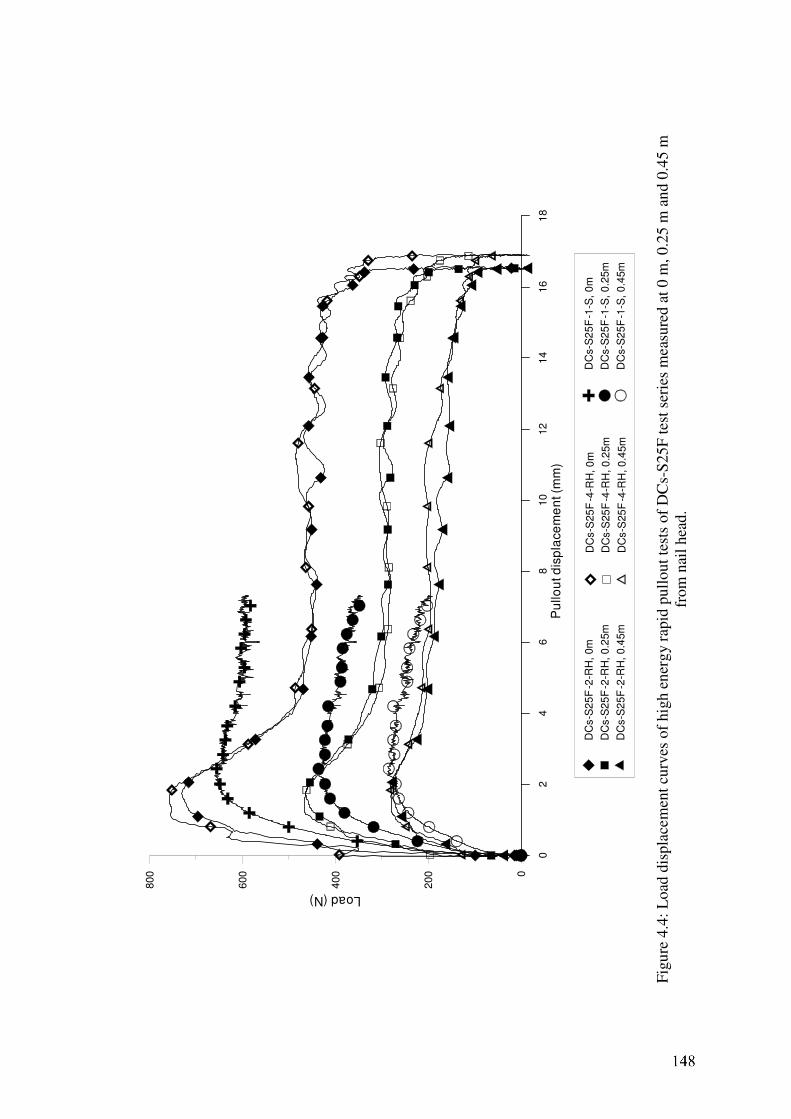
02
46
810
12
14
16
18
Pu
llou
t d
isp
lace
me
nt (
mm
)
0
200
400
600
800
Load (N)
DC
s-S
25
F-2
-RH
, 0m
DC
s-S
25
F-2
-RH
, 0.2
5m
DC
s-S
25
F-2
-RH
, 0.4
5m
DC
s-S
25
F-1
-S, 0
m
DC
s-S
25
F-1
-S, 0
.25m
DC
s-S
25
F-1
-S, 0
.45m
DC
s-S
25
F-4
-R, 0
m
DC
s-S
25
F-4
-RH
, 0
.25m
DC
s-S
25
F-4
-RH
, 0
.45m
H
Fig
ure
4.4
: L
oad
dis
pla
cem
ent
curv
es o
f hig
h e
ner
gy r
apid
pull
out
test
s of
DC
s-S
25F
tes
t se
ries
mea
sure
d a
t 0 m
, 0.2
5 m
an
d 0
.45 m
from
nai
l hea
d.
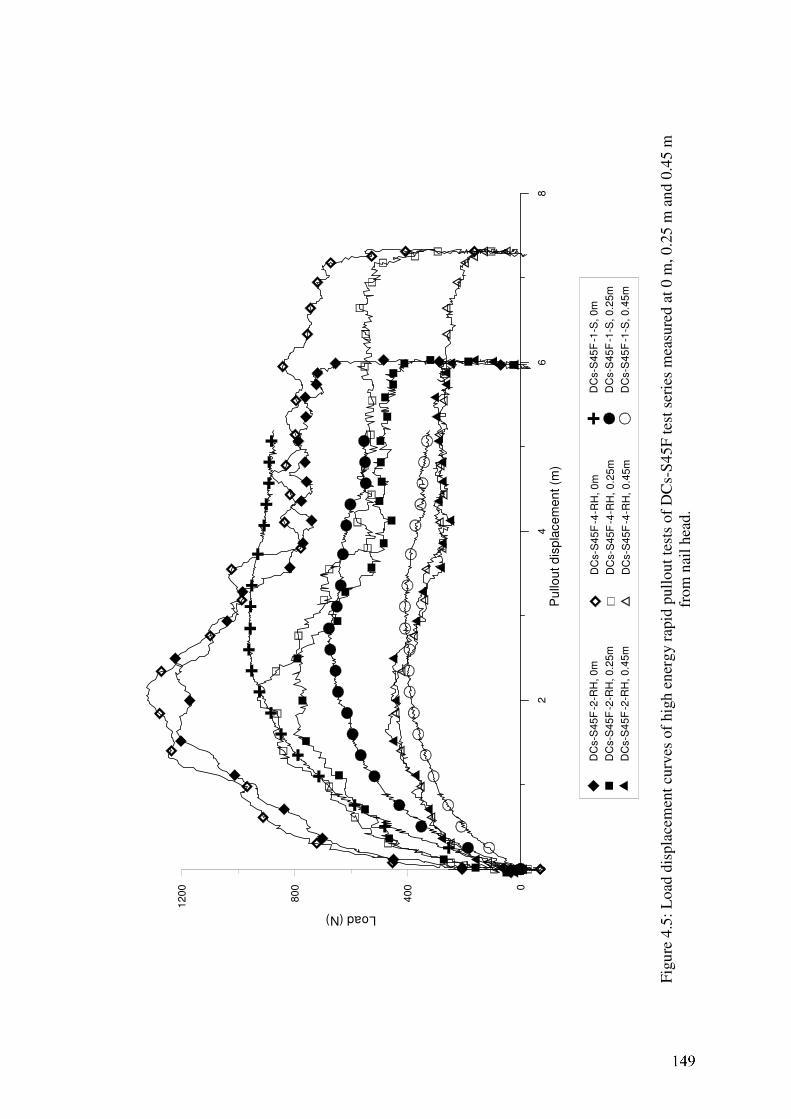
02
46
8
Pu
llou
t d
isp
lacem
en
t (m
)
0
40
0
80
0
12
00
Load (N)
DC
s-S
45
F-2
-RH
, 0
m
DC
s-S
45
F-2
-RH
, 0
.25
m
DC
s-S
45
F-2
-RH
, 0
.45
m
DC
s-S
45
F-1
-S,
0m
DC
s-S
45
F-1
-S,
0.2
5m
DC
s-S
45
F-1
-S,
0.4
5m
DC
s-S
45
F-4
-R,
0m
DC
s-S
45
F-4
-RH
, 0
.25
m
DC
s-S
45
F-4
-RH
, 0
.45
m
H
Fig
ure
4.5
: L
oad
dis
pla
cem
ent
curv
es o
f hig
h e
ner
gy r
apid
pull
out
test
s of
DC
s-S
45F
tes
t se
ries
mea
sure
d a
t 0 m
, 0.2
5 m
an
d 0
.45 m
from
nai
l hea
d.
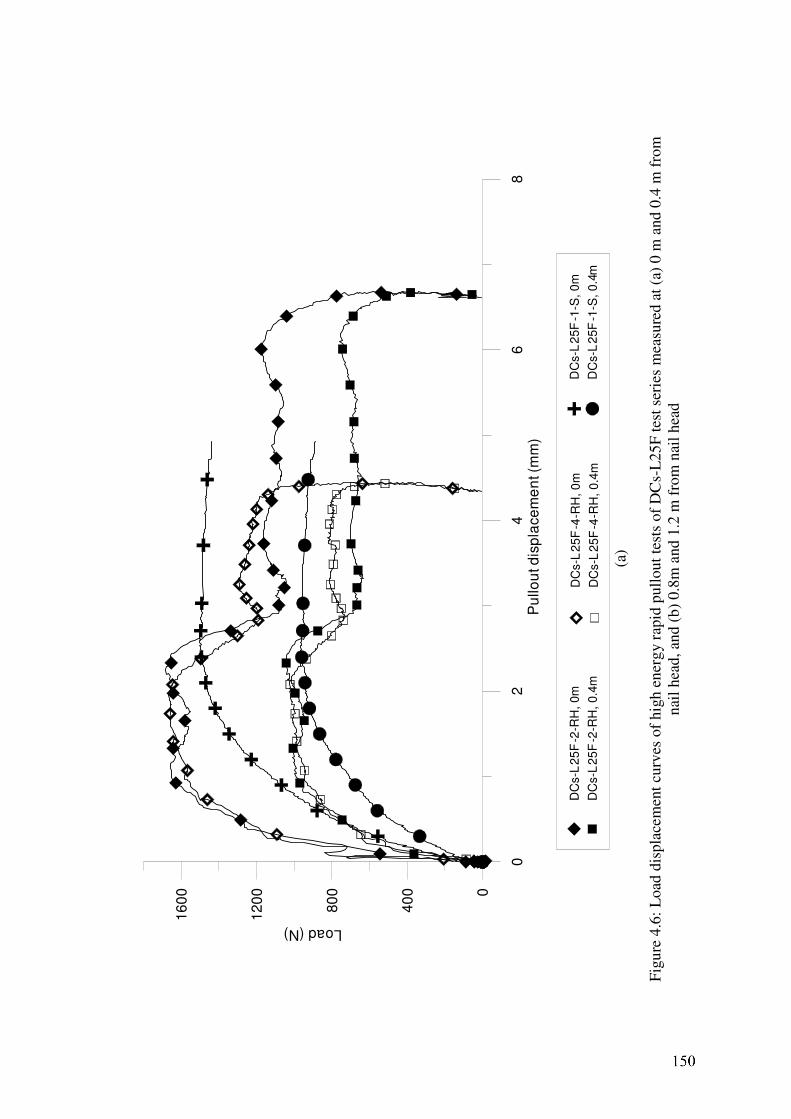
02
46
8P
ullo
ut d
isp
lace
me
nt (
mm
)
0
40
0
80
0
12
00
16
00
Load (N)
DC
s-L
25
F-2
-RH
, 0m
DC
s-L
25
F-2
-RH
, 0.4
m
DC
s-L
25F
-1-S
, 0
m
DC
s-L
25F
-1-S
, 0
.4m
DC
s-L
25
F-4
-R, 0
m
DC
s-L
25
F-4
-RH
, 0.4
m
H
Fig
ure
4.6
: L
oad
dis
pla
cem
ent
curv
es o
f hig
h e
ner
gy r
apid
pull
out
test
s of
DC
s-L
25
F t
est
seri
es m
easu
red a
t (a
) 0 m
and 0
.4 m
fro
m
nai
l hea
d, an
d (
b)
0.8
m a
nd 1
.2 m
fro
m n
ail
hea
d
(a)
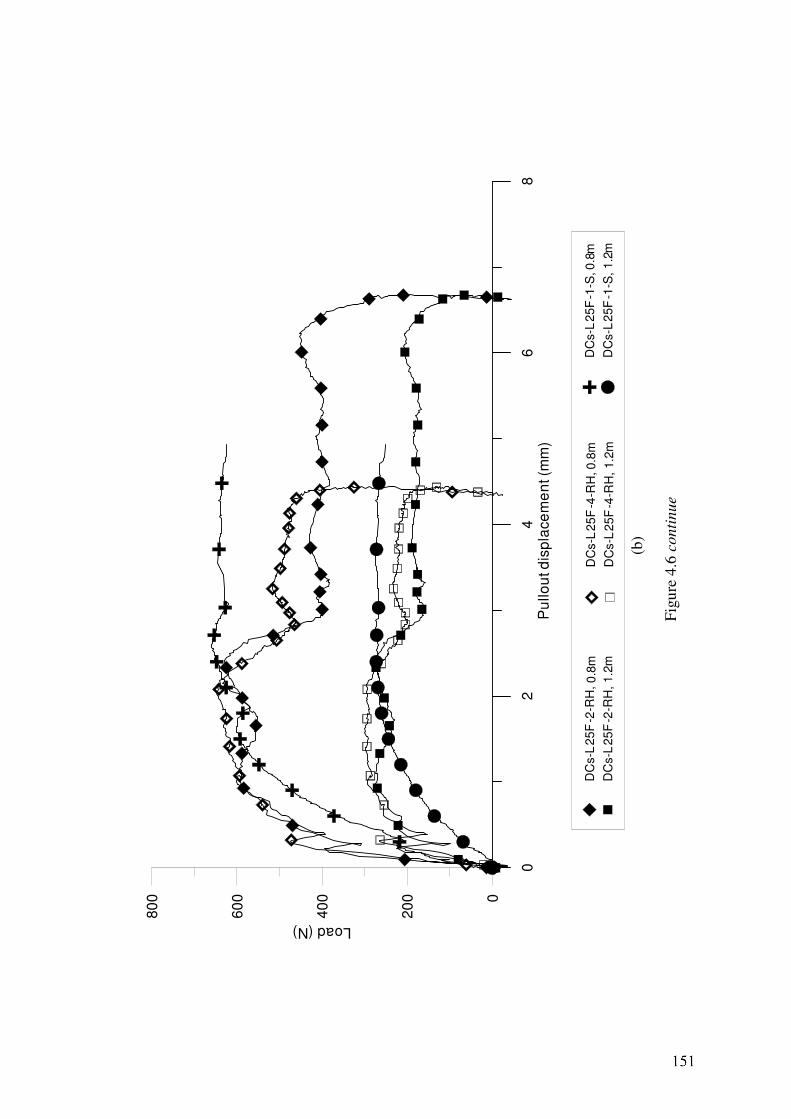
02
46
8P
ullo
ut d
isp
lace
me
nt (m
m)
0
20
0
40
0
60
0
80
0
Load (N)
DC
s-L
25
F-2
-RH
,
DC
s-L
25
F-2
-RH
, 1.2
m
DC
s-L
25
F-1
-S,
DC
s-L
25
F-1
-S,
1.2
m
DC
s-L
25
F-4
-R,
DC
s-L
25
F-4
-RH
, 1.2
m
H0
.8m
0.8
m 0
.8m
Fig
ure
4.6
conti
nue
(b)
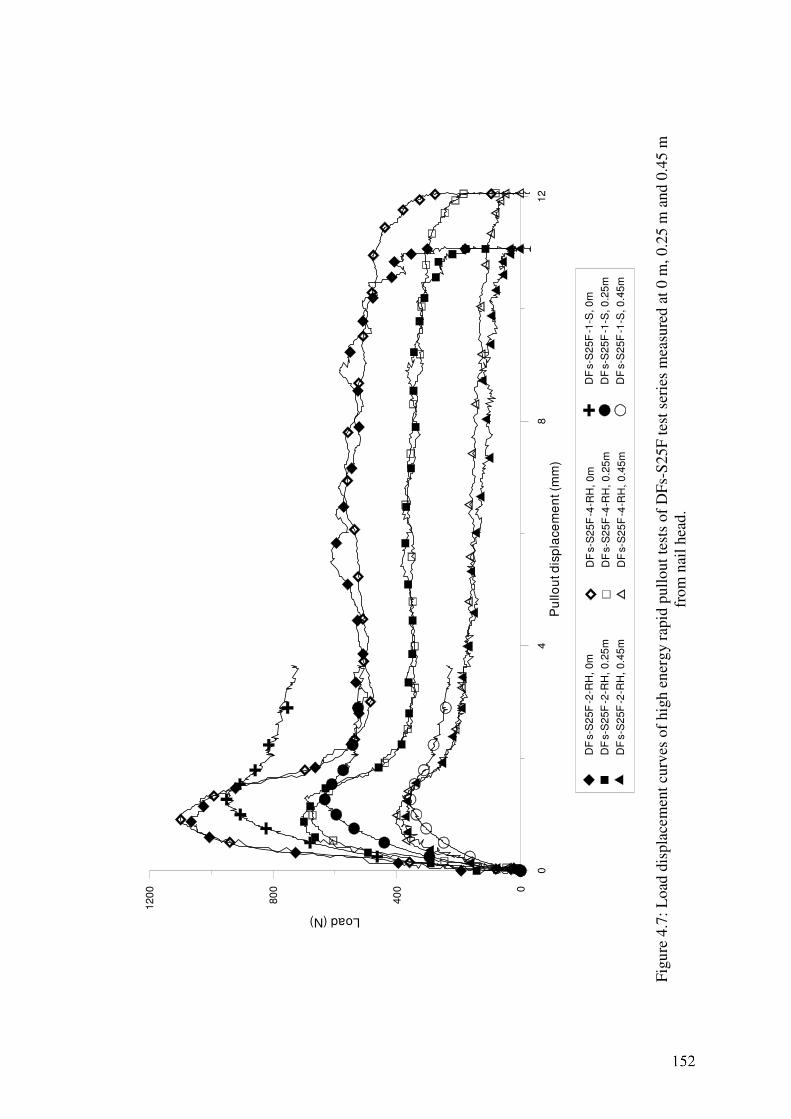
04
812
Pu
llo
ut d
isp
lace
me
nt (m
m)
0
40
0
80
0
120
0
Load (N)
DF
s-S
25F
-2-R
H,
0m
DF
s-S
25F
-2-R
H,
0.2
5m
DF
s-S
25F
-2-R
H,
0.4
5m
DF
s-S
25F
-1-S
, 0
m
DF
s-S
25F
-1-S
, 0
.25m
DF
s-S
25F
-1-S
, 0
.45m
DF
s-S
25
F-4
-R, 0
m
DF
s-S
25
F-4
-RH
, 0.2
5m
DF
s-S
25
F-4
-RH
, 0.4
5m
H
Fig
ure
4.7
: L
oad
dis
pla
cem
ent
curv
es o
f hig
h e
ner
gy r
apid
pull
out
test
s of
DF
s-S
25F
tes
t se
ries
mea
sure
d a
t 0 m
, 0.2
5 m
and 0
.45 m
from
nai
l hea
d.
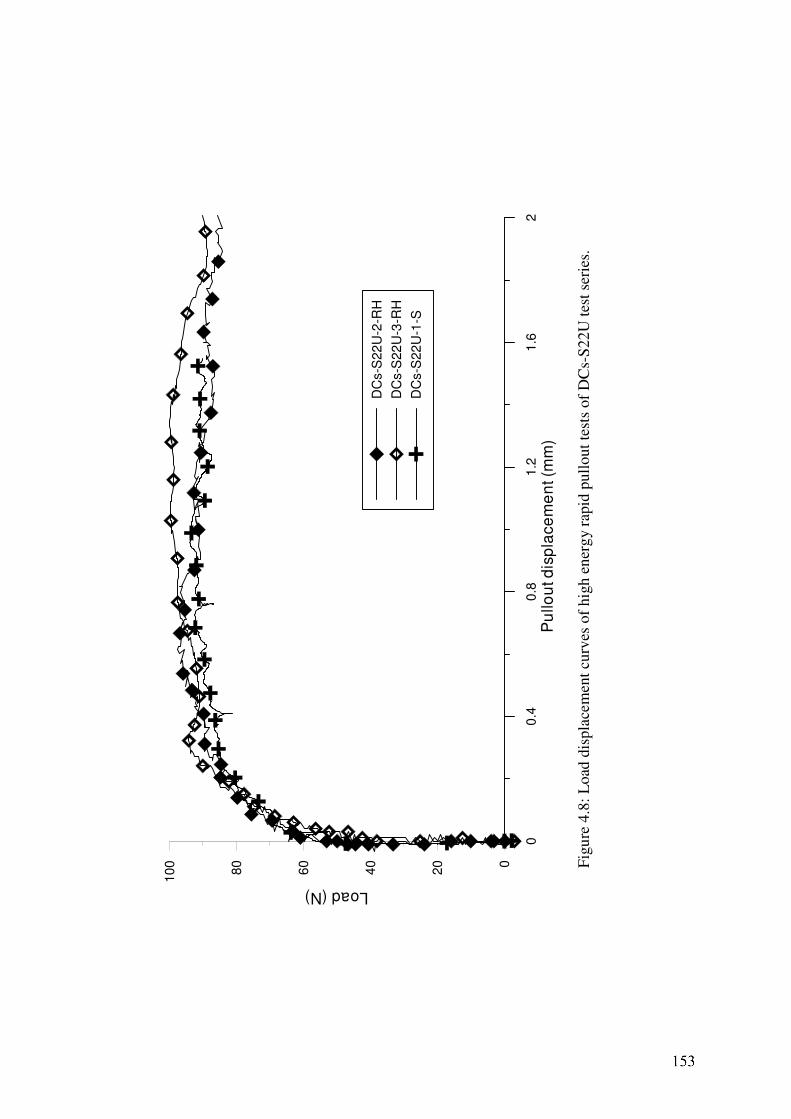
00
.40
.81.2
1.6
2
Pu
llou
t d
isp
lace
me
nt (m
m)
0
20
40
60
80
100
Load (N)
DC
s-S
22
U-2
-RH
DC
s-S
22
U-3
-RH
DC
s-S
22
U-1
-S
Fig
ure
4.8
: L
oad
dis
pla
cem
ent
curv
es o
f hig
h e
ner
gy r
apid
pull
out
test
s of
DC
s-S
22U
tes
t se
ries
.
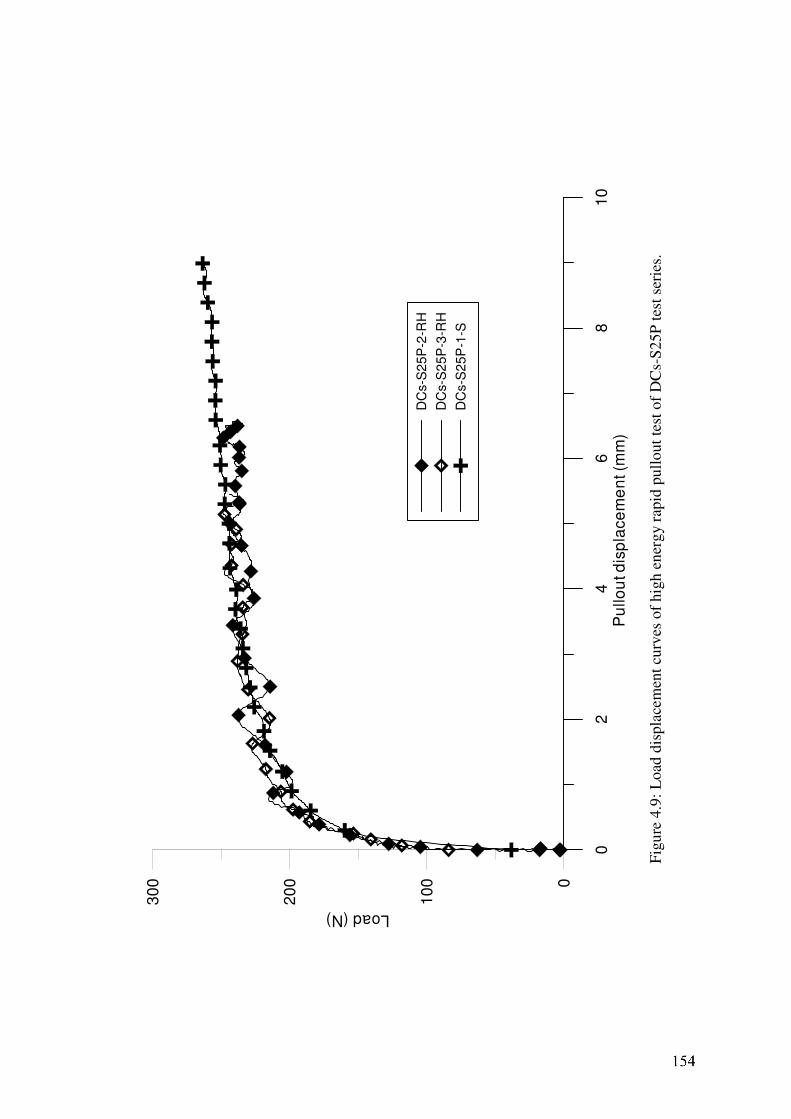
02
46
81
0P
ullo
ut d
isp
lace
me
nt (m
m)
0
10
0
20
0
30
0
Load (N)
DC
s-S
25P
-2-R
H
DC
s-S
25P
-3-R
H
DC
s-S
25P
-1-S
Fig
ure
4.9
: L
oad
dis
pla
cem
ent
curv
es o
f hig
h e
ner
gy r
apid
pull
out
test
of
DC
s-S
25P
tes
t se
ries
.
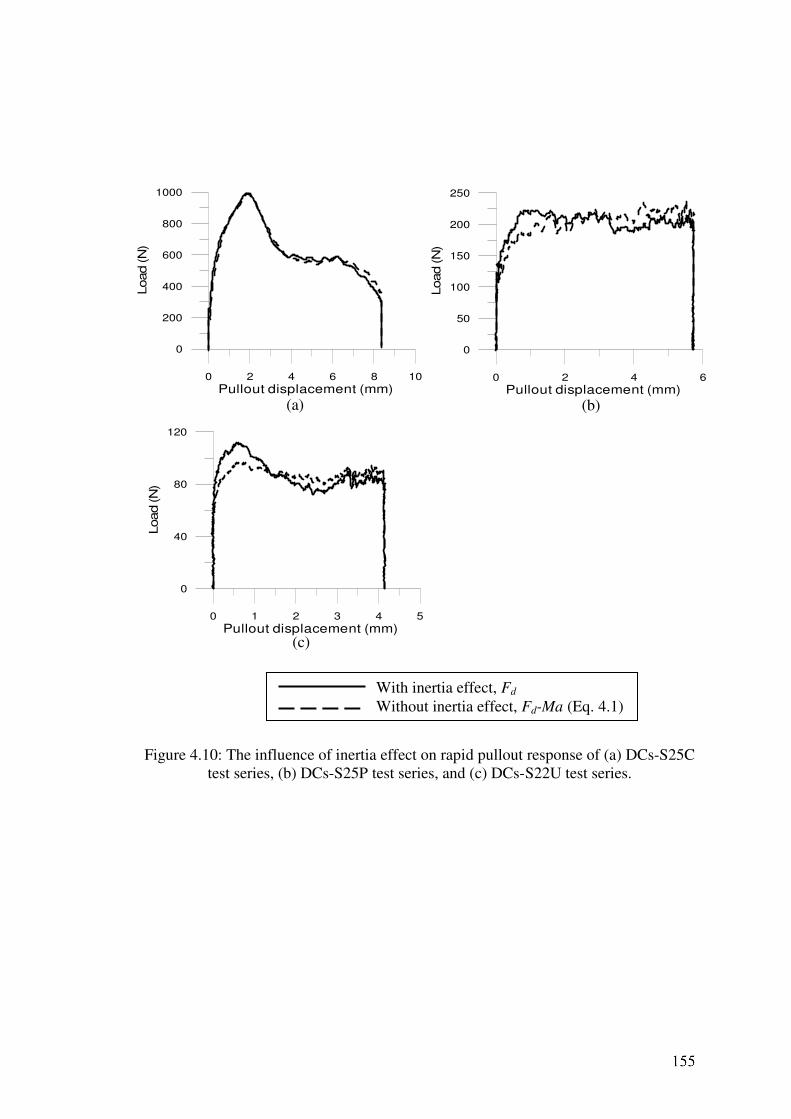
0 2 4 6 8 10
Pullout displacement (mm)
0
200
400
600
800
1000
Load (N
)
0 2 4 6
Pullout displacement (mm)
0
50
100
150
200
250
Load (N
)
0 1 2 3 4 5
Pullout displacement (mm)
0
40
80
120
Load (N
)
with inertia
without inertia
Figure 4.10: The influence of inertia effect on rapid pullout response of (a) DCs-S25C
test series, (b) DCs-S25P test series, and (c) DCs-S22U test series.
(a) (b)
(c)
With inertia effect, Fd
Without inertia effect, Fd-Ma (Eq. 4.1)
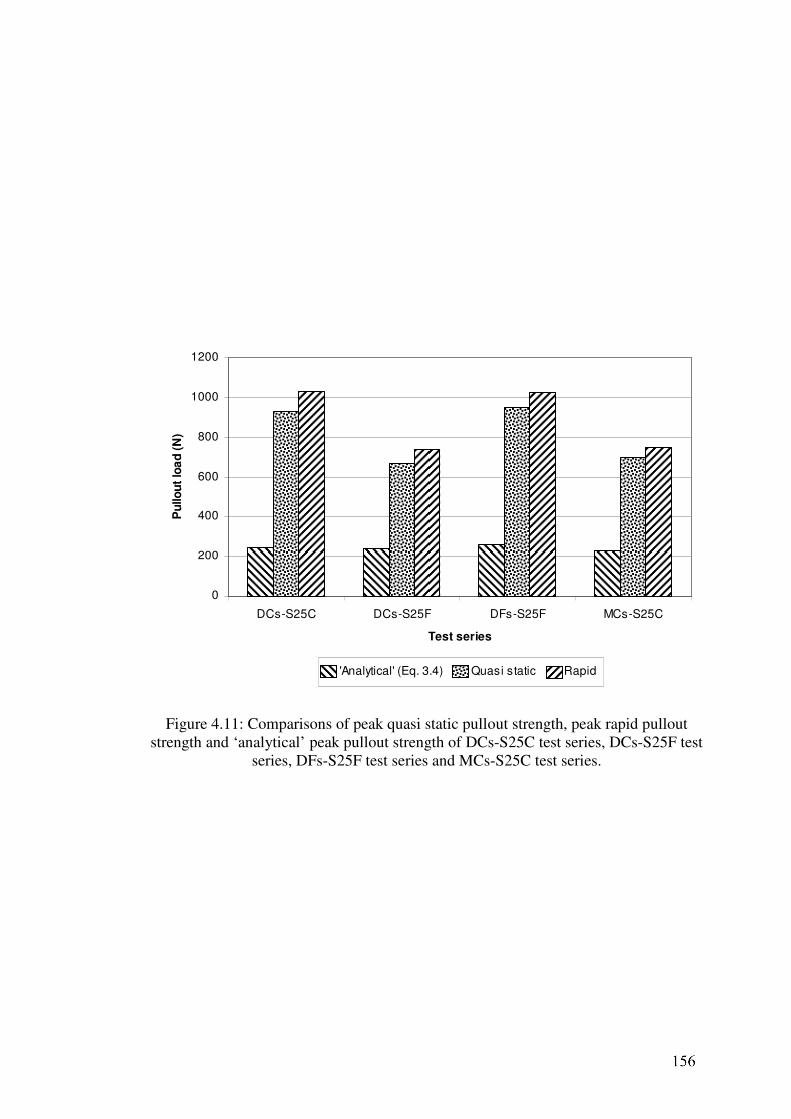
0
200
400
600
800
1000
1200
DCs-S25C DCs-S25F DFs-S25F MCs-S25C
Test series
Pu
llo
ut
loa
d (
N)
'Analytical' (Eq. 3.4) Quasi static Rapid
Figure 4.11: Comparisons of peak quasi static pullout strength, peak rapid pullout
strength and ‘analytical’ peak pullout strength of DCs-S25C test series, DCs-S25F test
series, DFs-S25F test series and MCs-S25C test series.
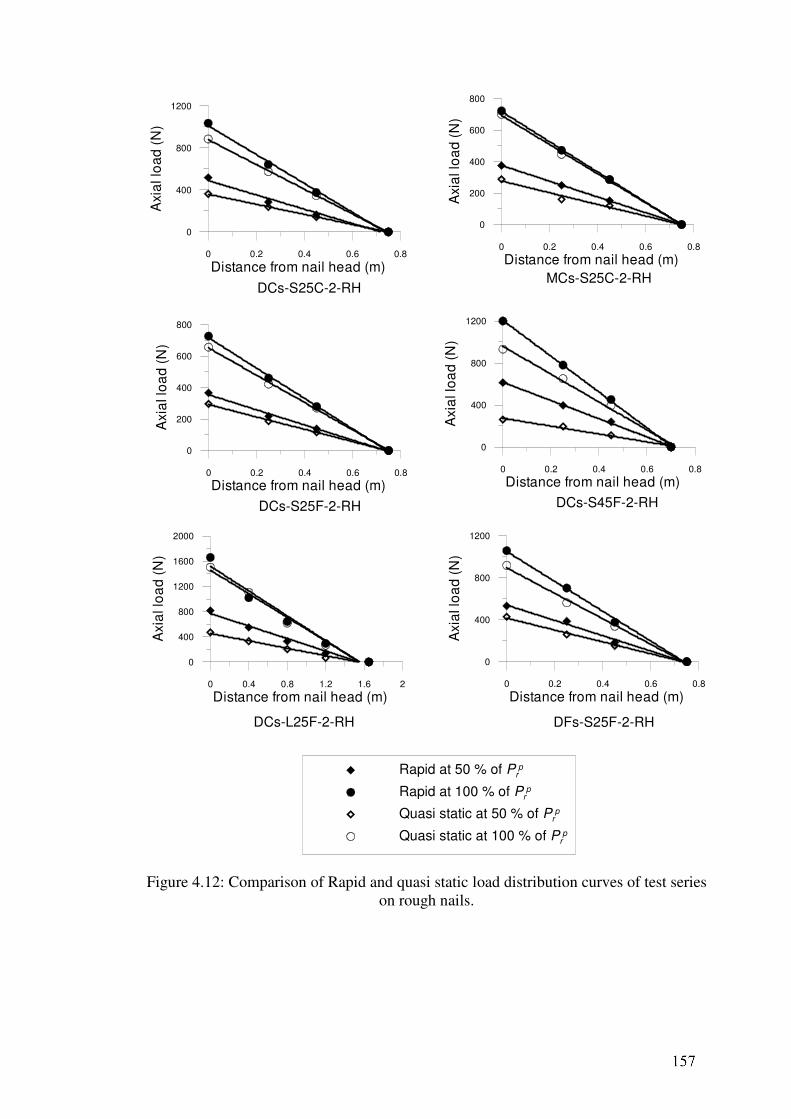
0 0.2 0.4 0.6 0.8
Distance from nail head (m)
0
400
800
1200
Axi
al lo
ad
(N
)
0 0.2 0.4 0.6 0.8
Distance from nail head (m)
0
200
400
600
800
Axia
l lo
ad
(N
)
0 0.2 0.4 0.6 0.8
Distance from nail head (m)
0
400
800
1200
Axia
l lo
ad
(N
)
0 0.2 0.4 0.6 0.8
Distance from nail head (m)
0
200
400
600
800
Axi
al lo
ad
(N
)0 0.2 0.4 0.6 0.8
Distance from nail head (m)
0
400
800
1200
Axia
l lo
ad
(N
)
Rapid at 50 % of Prp
Rapid at 100 % of Prp
Quasi static at 50 % of Prp
Quasi static at 100 % of Prp
0 0.4 0.8 1.2 1.6 2
Distance from nail head (m)
0
400
800
1200
1600
2000
Axia
l lo
ad
(N
)
DCs-S25C-2-RH
DCs-S45F-2-RH
DCs-L25F-2-RH
MCs-S25C-2-RH
DCs-S25F-2-RH
DFs-S25F-2-RH
Figure 4.12: Comparison of Rapid and quasi static load distribution curves of test series
on rough nails.
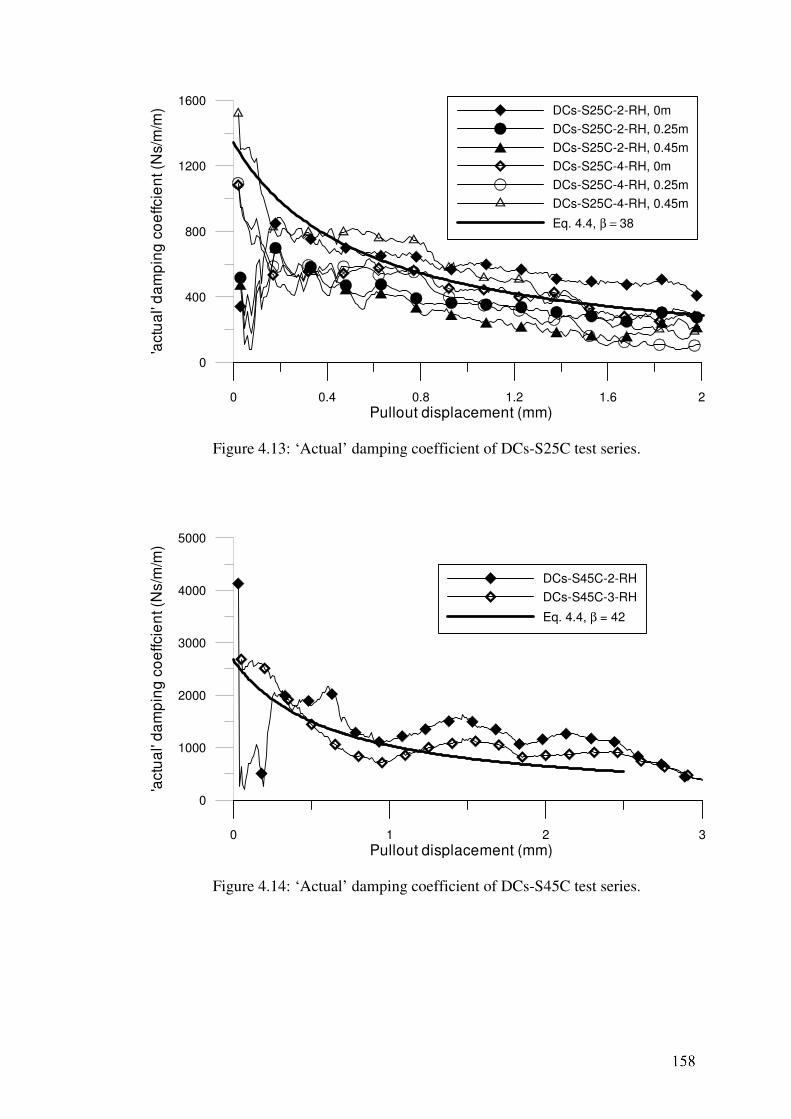
0 0.4 0.8 1.2 1.6 2
Pullout displacement (mm)
0
400
800
1200
1600
'actu
al'
da
mp
ing
co
effc
ien
t (N
s/m
/m) DCs-S25C-2-RH, 0m
DCs-S25C-2-RH, 0.25m
DCs-S25C-2-RH, 0.45m
DCs-S25C-4-RH, 0m
DCs-S25C-4-RH, 0.25m
DCs-S25C-4-RH, 0.45m
Eq. 4.4, β = 38
Figure 4.13: ‘Actual’ damping coefficient of DCs-S25C test series.
0 1 2 3
Pullout displacement (mm)
0
1000
2000
3000
4000
5000
'actu
al'
da
mp
ing
co
effcie
nt (
Ns/m
/m)
DCs-S45C-2-RH
DCs-S45C-3-RH
Eq. 4.4, β = 42
Figure 4.14: ‘Actual’ damping coefficient of DCs-S45C test series.
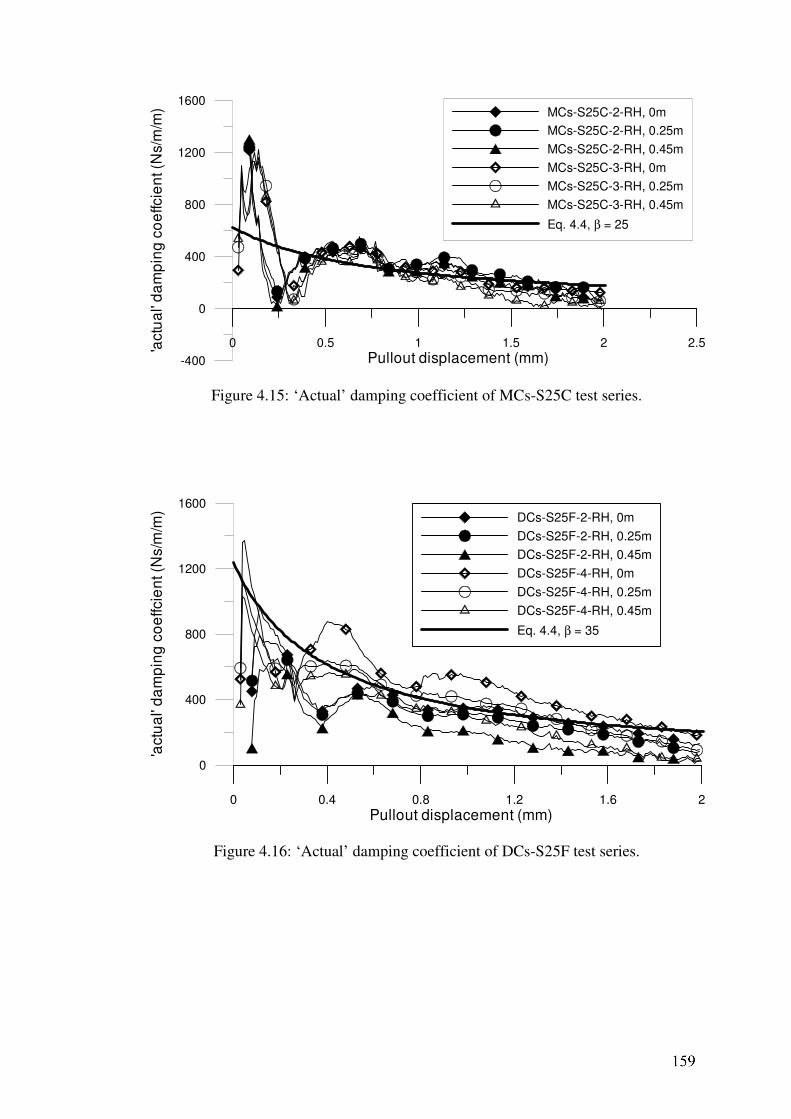
0 0.5 1 1.5 2 2.5
Pullout displacement (mm)-400
0
400
800
1200
1600
'actu
al'
da
mp
ing
co
effc
ien
t (N
s/m
/m) MCs-S25C-2-RH, 0m
MCs-S25C-2-RH, 0.25m
MCs-S25C-2-RH, 0.45m
MCs-S25C-3-RH, 0m
MCs-S25C-3-RH, 0.25m
MCs-S25C-3-RH, 0.45m
Eq. 4.4, β = 25
Figure 4.15: ‘Actual’ damping coefficient of MCs-S25C test series.
0 0.4 0.8 1.2 1.6 2
Pullout displacement (mm)
0
400
800
1200
1600
'act
ua
l' d
am
pin
g c
oe
ffcie
nt (
Ns/m
/m) DCs-S25F-2-RH, 0m
DCs-S25F-2-RH, 0.25m
DCs-S25F-2-RH, 0.45m
DCs-S25F-4-RH, 0m
DCs-S25F-4-RH, 0.25m
DCs-S25F-4-RH, 0.45m
Eq. 4.4, β = 35
Figure 4.16: ‘Actual’ damping coefficient of DCs-S25F test series.
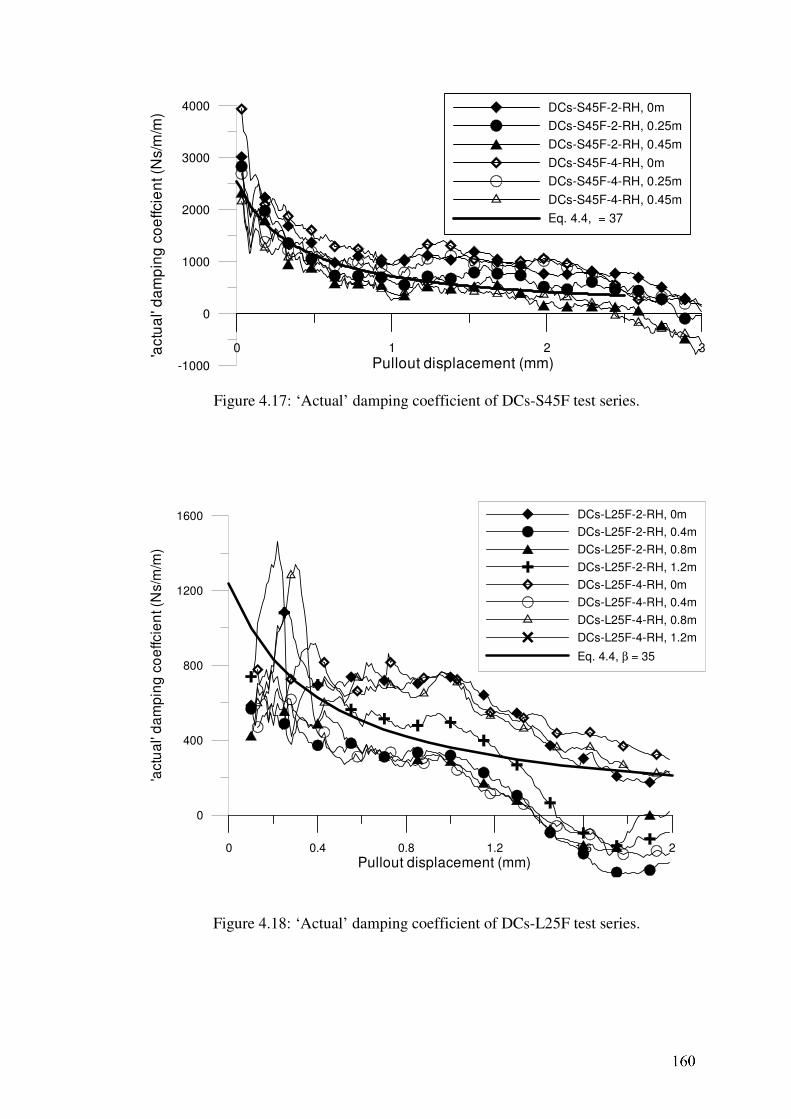
0 1 2 3
Pullout displacement (mm)-1000
0
1000
2000
3000
4000
'actu
al'
da
mp
ing
co
effcie
nt (N
s/m
/m) DCs-S45F-2-RH, 0m
DCs-S45F-2-RH, 0.25m
DCs-S45F-2-RH, 0.45m
DCs-S45F-4-RH, 0m
DCs-S45F-4-RH, 0.25m
DCs-S45F-4-RH, 0.45m
Eq. 4.4, = 37
Figure 4.17: ‘Actual’ damping coefficient of DCs-S45F test series.
0 0.4 0.8 1.2 1.6 2
Pullout displacement (mm)
0
400
800
1200
1600
'actu
al'
da
mp
ing
co
effc
ien
t (N
s/m
/m)
DCs-L25F-2-RH, 0m
DCs-L25F-2-RH, 0.4m
DCs-L25F-2-RH, 0.8m
DCs-L25F-2-RH, 1.2m
DCs-L25F-4-RH, 0m
DCs-L25F-4-RH, 0.4m
DCs-L25F-4-RH, 0.8m
DCs-L25F-4-RH, 1.2m
Eq. 4.4, β = 35
Figure 4.18: ‘Actual’ damping coefficient of DCs-L25F test series.
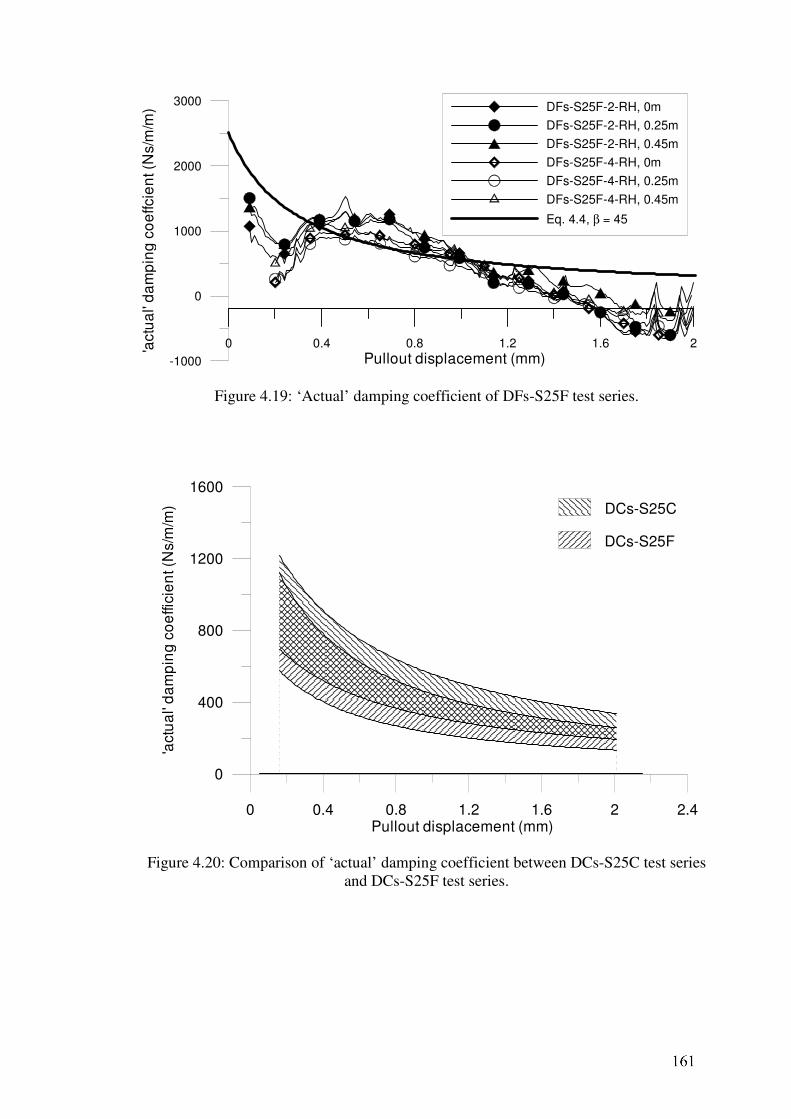
0 0.4 0.8 1.2 1.6 2
Pullout displacement (mm)-1000
0
1000
2000
3000
'actu
al'
da
mp
ing
co
effcie
nt (N
s/m
/m) DFs-S25F-2-RH, 0m
DFs-S25F-2-RH, 0.25m
DFs-S25F-2-RH, 0.45m
DFs-S25F-4-RH, 0m
DFs-S25F-4-RH, 0.25m
DFs-S25F-4-RH, 0.45m
Eq. 4.4, β = 45
Figure 4.19: ‘Actual’ damping coefficient of DFs-S25F test series.
0 0.4 0.8 1.2 1.6 2 2.4Pullout displacement (mm)
0
400
800
1200
1600
'act
ua
l' d
am
pin
g c
oe
ffici
en
t (N
s/m
/m) DCs-S25C
DCs-S25F
Figure 4.20: Comparison of ‘actual’ damping coefficient between DCs-S25C test series
and DCs-S25F test series.
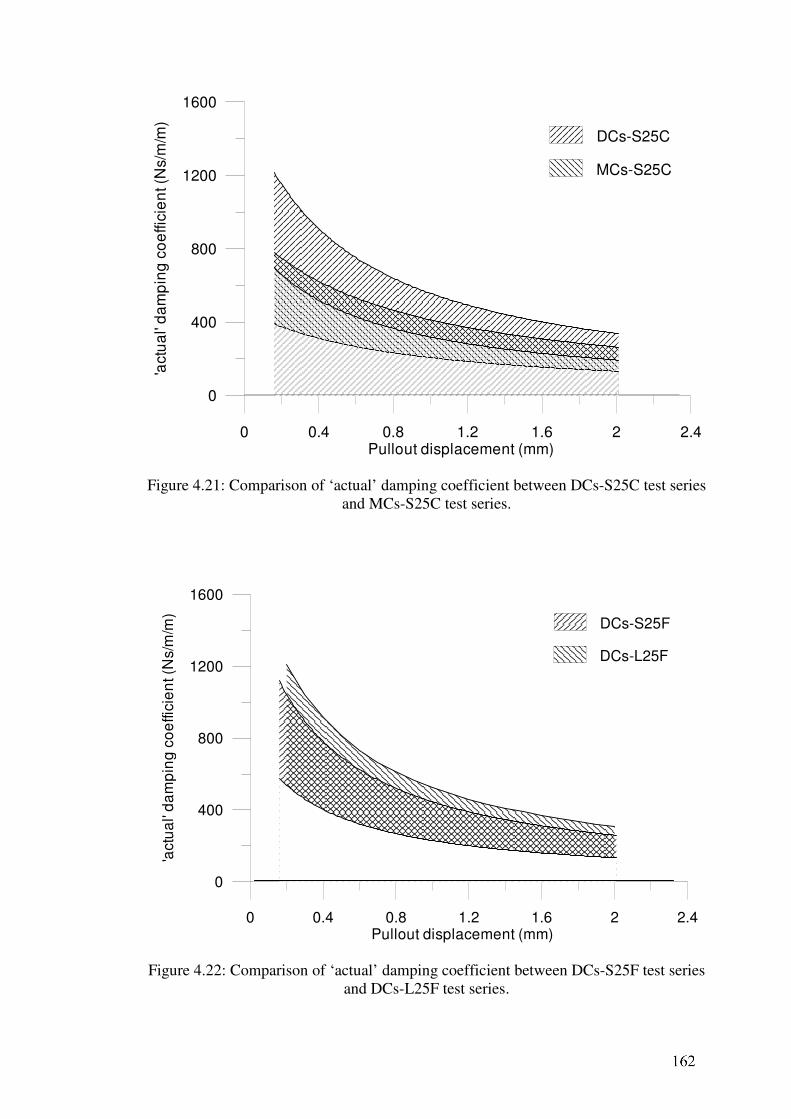
0 0.4 0.8 1.2 1.6 2 2.4Pullout displacement (mm)
0
400
800
1200
1600
'act
ua
l' d
am
pin
g c
oe
ffic
ien
t (N
s/m
/m)
DCs-S25C
MCs-S25C
Figure 4.21: Comparison of ‘actual’ damping coefficient between DCs-S25C test series
and MCs-S25C test series.
0 0.4 0.8 1.2 1.6 2 2.4Pullout displacement (mm)
0
400
800
1200
1600
'act
ua
l' d
am
pin
g c
oe
ffici
en
t (N
s/m
/m)
DCs-S25F
DCs-L25F
Figure 4.22: Comparison of ‘actual’ damping coefficient between DCs-S25F test series
and DCs-L25F test series.
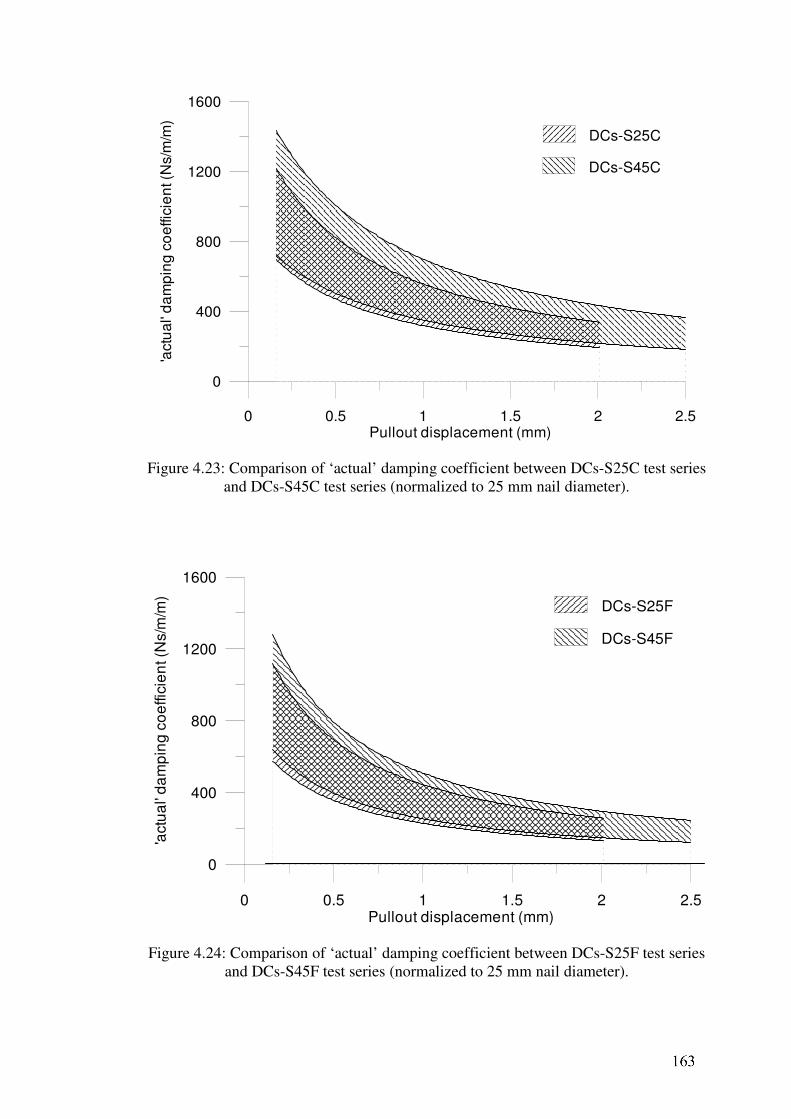
0 0.5 1 1.5 2 2.5Pullout displacement (mm)
0
400
800
1200
1600
'actu
al'
da
mp
ing
co
effic
ien
t (N
s/m
/m)
DCs-S25C
DCs-S45C
Figure 4.23: Comparison of ‘actual’ damping coefficient between DCs-S25C test series
and DCs-S45C test series (normalized to 25 mm nail diameter).
0 0.5 1 1.5 2 2.5Pullout displacement (mm)
0
400
800
1200
1600
'act
ua
l' d
am
pin
g c
oe
ffici
en
t (N
s/m
/m)
DCs-S25F
DCs-S45F
Figure 4.24: Comparison of ‘actual’ damping coefficient between DCs-S25F test series
and DCs-S45F test series (normalized to 25 mm nail diameter).
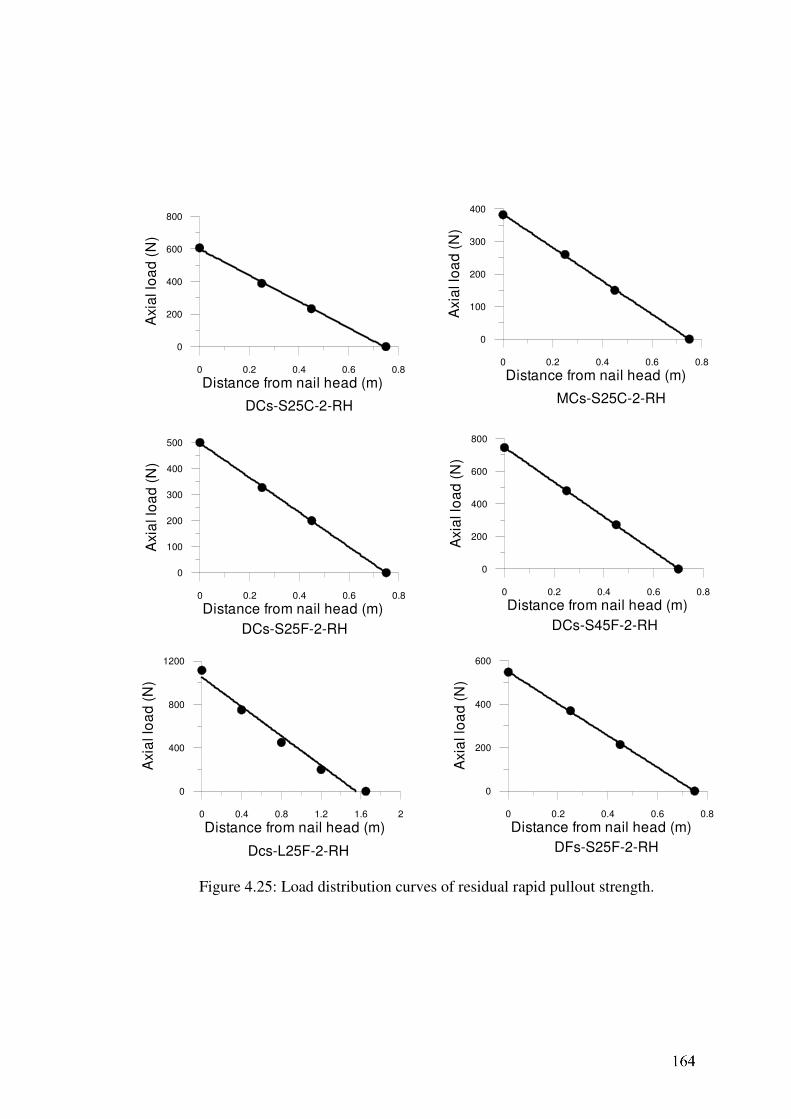
0 0.2 0.4 0.6 0.8
Distance from nail head (m)
0
200
400
600
800
Axia
l lo
ad
(N
)
0 0.2 0.4 0.6 0.8
Distance from nail head (m)
0
100
200
300
400
500
Axia
l lo
ad
(N
)
0 0.2 0.4 0.6 0.8
Distance from nail head (m)
0
200
400
600
Axia
l lo
ad
(N
)
0 0.2 0.4 0.6 0.8
Distance from nail head (m)
0
100
200
300
400
Axia
l lo
ad
(N
)
0 0.2 0.4 0.6 0.8
Distance from nail head (m)
0
200
400
600
800
Axia
l lo
ad
(N
)
0 0.4 0.8 1.2 1.6 2
Distance from nail head (m)
0
400
800
1200
Axia
l lo
ad
(N
)
DCs-S25C-2-RH
DCs-S45F-2-RH
Dcs-L25F-2-RH
MCs-S25C-2-RH
DCs-S25F-2-RH
DFs-S25F-2-RH
Figure 4.25: Load distribution curves of residual rapid pullout strength.
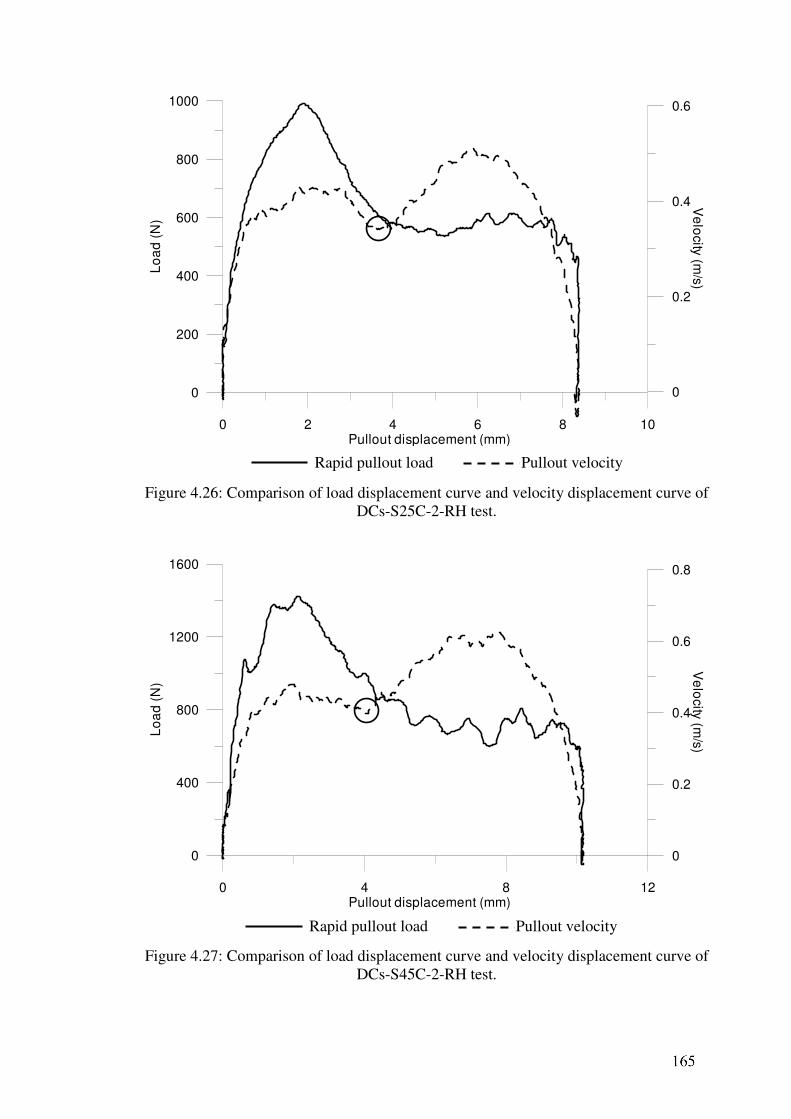
0 2 4 6 8 10Pullout displacement (mm)
0
200
400
600
800
1000
Lo
ad
(N
)
0
0.2
0.4
0.6V
elo
city (m
/s)
Figure 4.26: Comparison of load displacement curve and velocity displacement curve of
DCs-S25C-2-RH test.
0 4 8 12Pullout displacement (mm)
0
400
800
1200
1600
Lo
ad
(N
)
0
0.2
0.4
0.6
0.8
Ve
locity
(m/s
)
Figure 4.27: Comparison of load displacement curve and velocity displacement curve of
DCs-S45C-2-RH test.
Rapid pullout load Pullout velocity
Rapid pullout load Pullout velocity
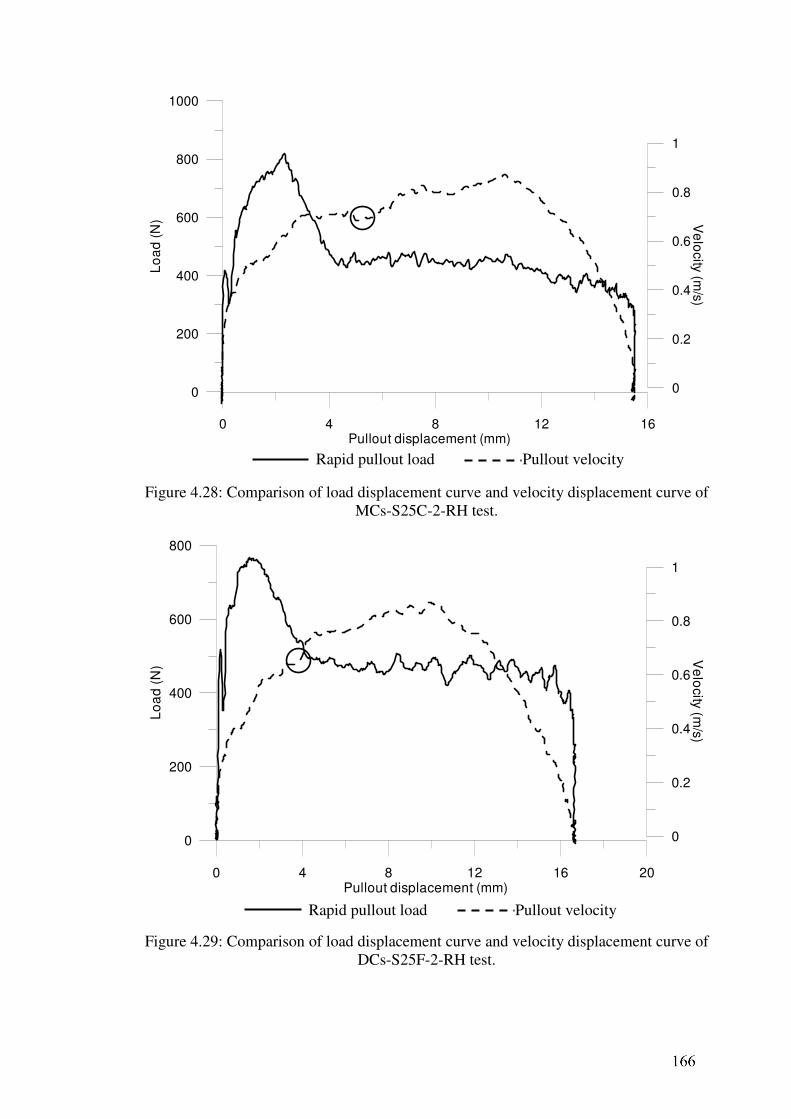
0 4 8 12 16Pullout displacement (mm)
0
200
400
600
800
1000
Lo
ad
(N
)
0
0.2
0.4
0.6
0.8
1
Ve
locity
(m/s
)
Figure 4.28: Comparison of load displacement curve and velocity displacement curve of
MCs-S25C-2-RH test.
0 4 8 12 16 20Pullout displacement (mm)
0
200
400
600
800
Lo
ad
(N
)
0
0.2
0.4
0.6
0.8
1
Ve
locity (m
/s)
Figure 4.29: Comparison of load displacement curve and velocity displacement curve of
DCs-S25F-2-RH test.
Rapid pullout load Pullout velocity
Rapid pullout load Pullout velocity
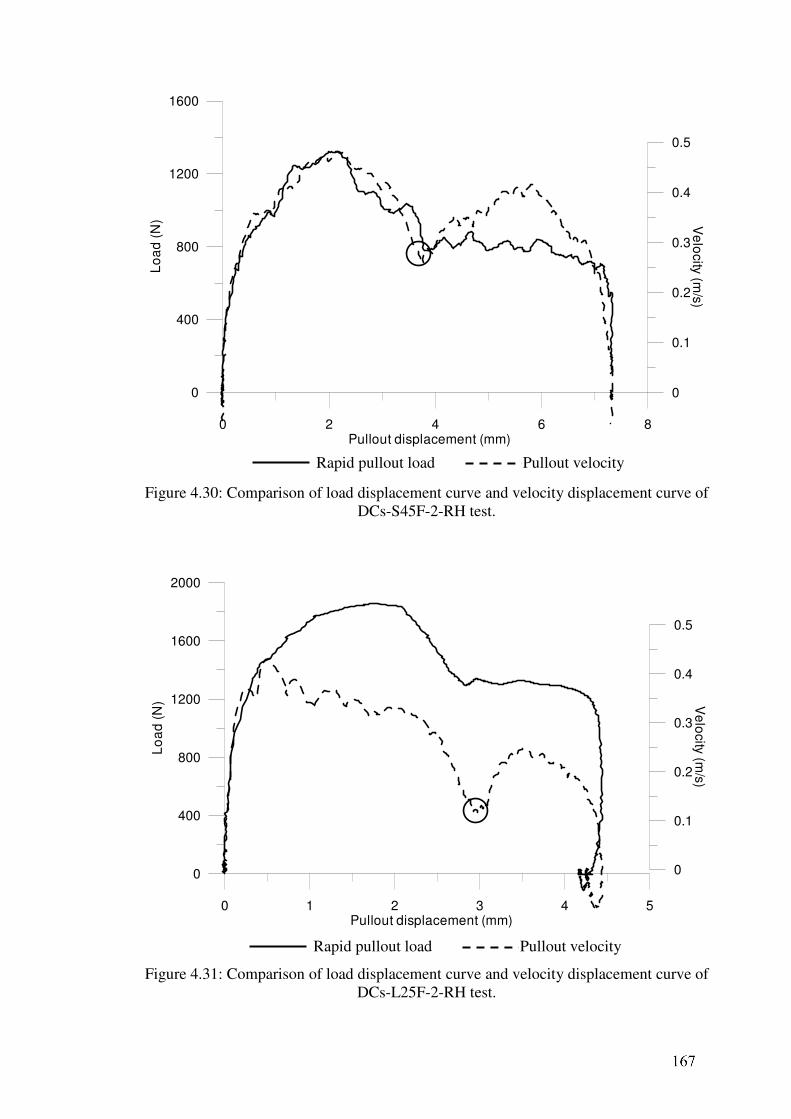
0 2 4 6 8Pullout displacement (mm)
0
400
800
1200
1600
Lo
ad
(N
)
0
0.1
0.2
0.3
0.4
0.5
Ve
locity
(m/s
)
Figure 4.30: Comparison of load displacement curve and velocity displacement curve of
DCs-S45F-2-RH test.
0 1 2 3 4 5
Pullout displacement (mm)
0
400
800
1200
1600
2000
Lo
ad
(N
)
0
0.1
0.2
0.3
0.4
0.5
Ve
locity
(m/s
)
Figure 4.31: Comparison of load displacement curve and velocity displacement curve of
DCs-L25F-2-RH test.
Rapid pullout load Pullout velocity
Rapid pullout load Pullout velocity
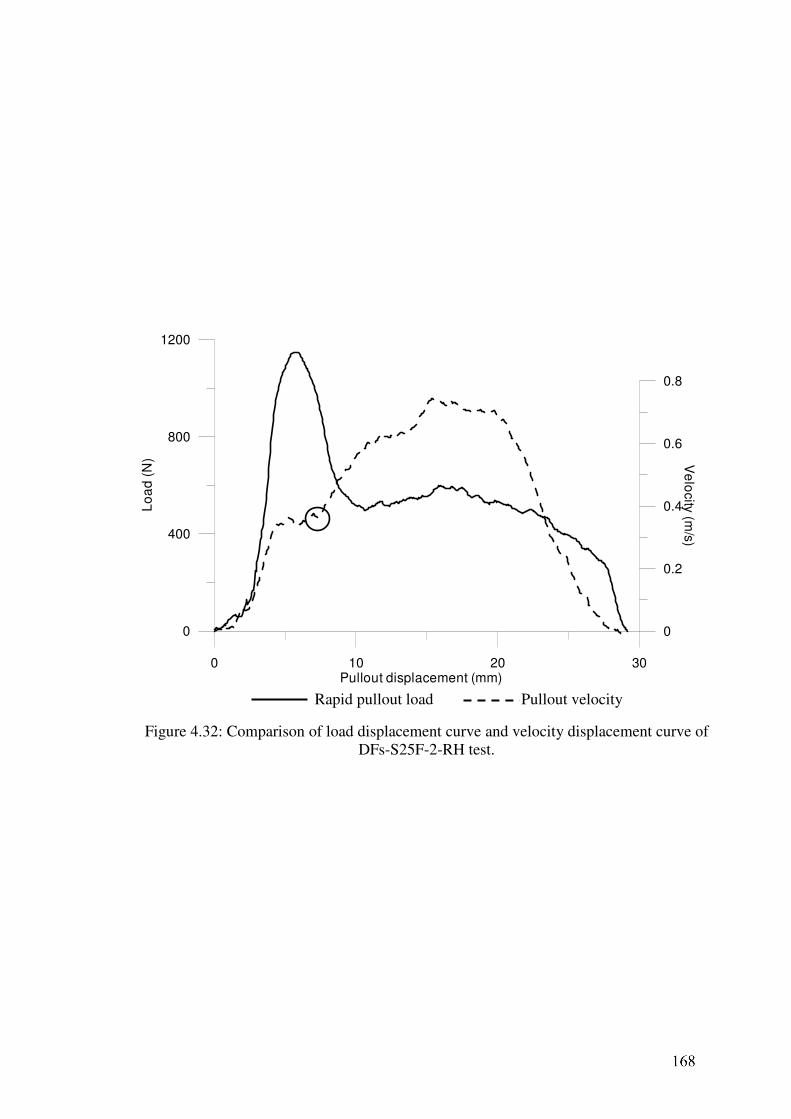
0 10 20 30Pullout displacement (mm)
0
400
800
1200
Lo
ad
(N
)
0
0.2
0.4
0.6
0.8
Ve
locity
(m/s
)
Figure 4.32: Comparison of load displacement curve and velocity displacement curve of
DFs-S25F-2-RH test.
Rapid pullout load Pullout velocity
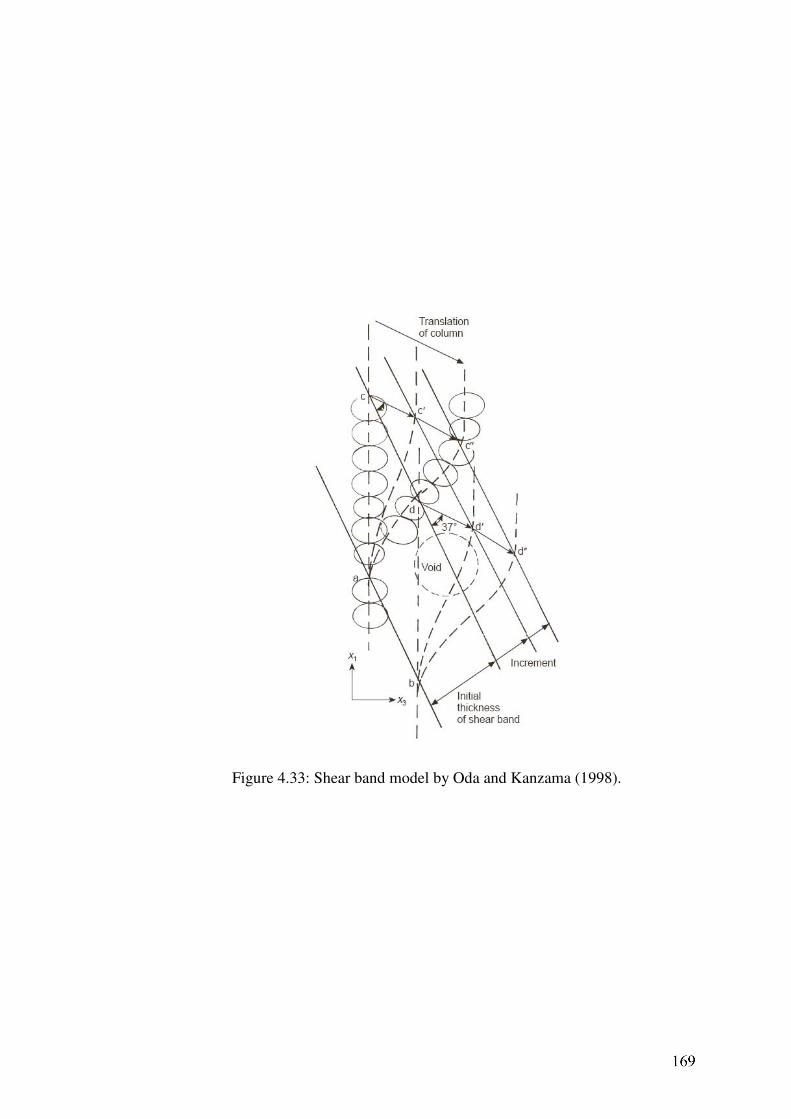
Figure 4.33: Shear band model by Oda and Kanzama (1998).
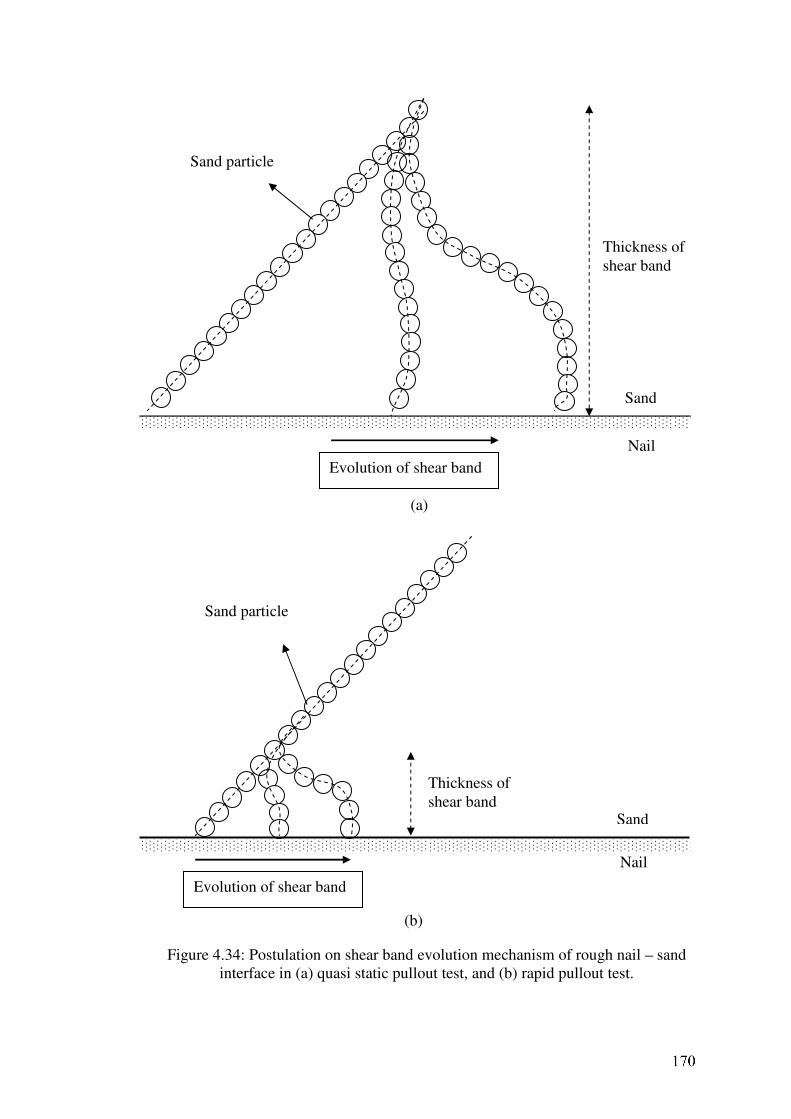
Figure 4.34: Postulation on shear band evolution mechanism of rough nail – sand
interface in (a) quasi static pullout test, and (b) rapid pullout test.
Thickness of
shear band
Nail
Evolution of shear band
Sand particle
Sand
(a)
Thickness of
shear band
Nail
Evolution of shear band
Sand particle
Sand
(b)
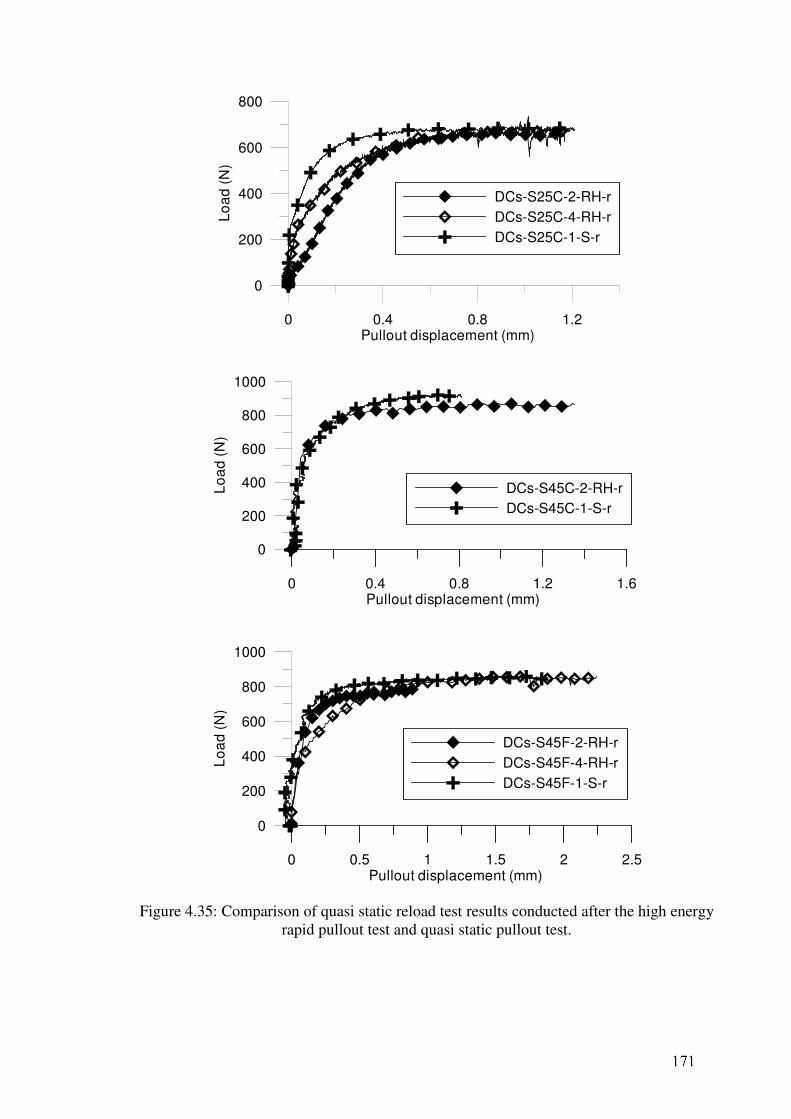
0 0.4 0.8 1.2Pullout displacement (mm)
0
200
400
600
800
Lo
ad
(N
)
DCs-S25C-2-RH-r
DCs-S25C-4-RH-r
DCs-S25C-1-S-r
DCs-S45C-2-RH-r
DCs-S45C-1-S-r
0 0.4 0.8 1.2 1.6Pullout displacement (mm)
0
200
400
600
800
1000
Lo
ad
(N
)
DCs-S45F-2-RH-r
DCs-S45F-4-RH-r
DCs-S45F-1-S-r
0 0.5 1 1.5 2 2.5Pullout displacement (mm)
0
200
400
600
800
1000
Lo
ad
(N
)
Figure 4.35: Comparison of quasi static reload test results conducted after the high energy
rapid pullout test and quasi static pullout test.
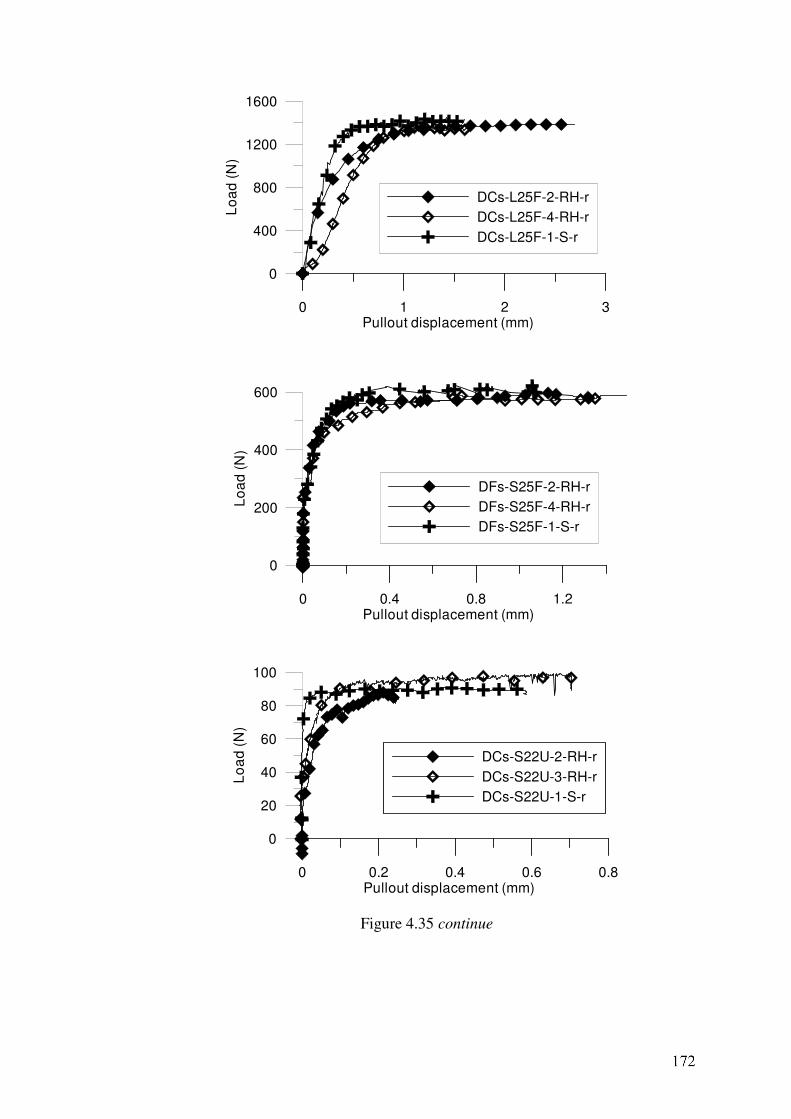
0 0.2 0.4 0.6 0.8Pullout displacement (mm)
0
20
40
60
80
100
Lo
ad
(N
)
DCs-S22U-2-RH-r
DCs-S22U-3-RH-r
DCs-S22U-1-S-r
0 0.4 0.8 1.2Pullout displacement (mm)
0
200
400
600
Lo
ad
(N
)
0 1 2 3Pullout displacement (mm)
0
400
800
1200
1600
Lo
ad
(N
)
DFs-S25F-2-RH-r
DFs-S25F-4-RH-r
DFs-S25F-1-S-r
DCs-L25F-2-RH-r
DCs-L25F-4-RH-r
DCs-L25F-1-S-r
Figure 4.35 continue
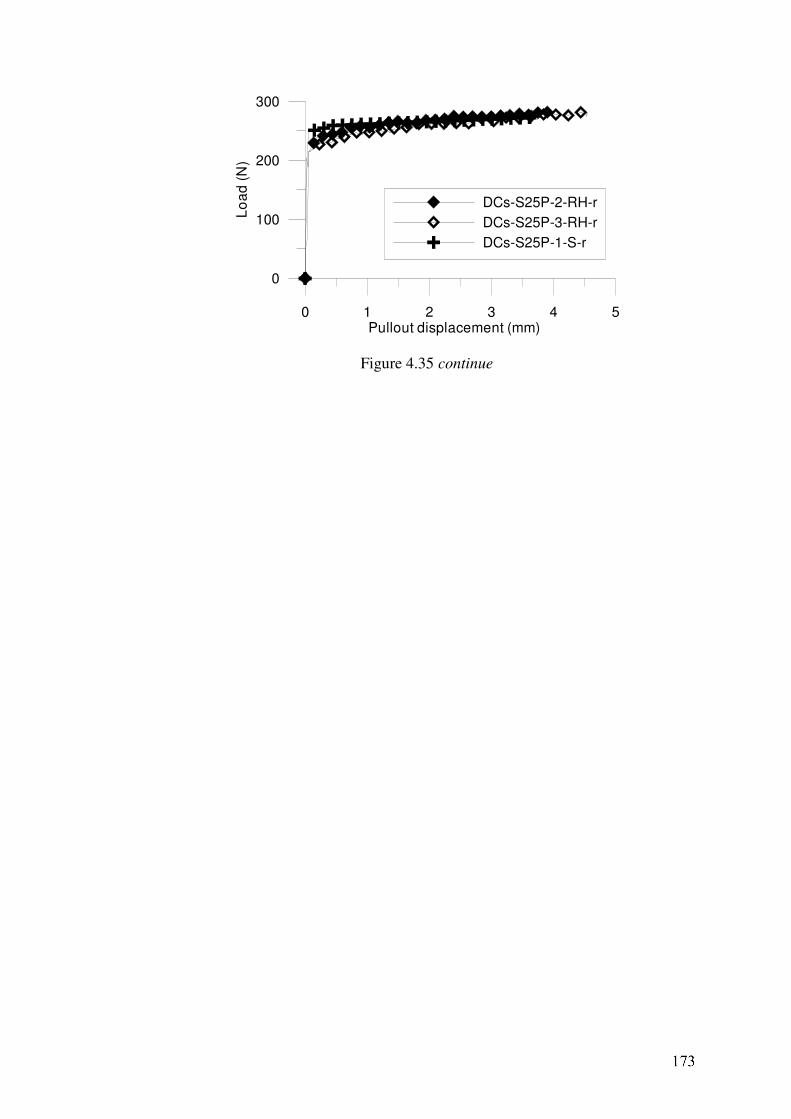
0 1 2 3 4 5Pullout displacement (mm)
0
100
200
300
Lo
ad
(N
)
DCs-S25P-2-RH-r
DCs-S25P-3-RH-r
DCs-S25P-1-S-r
Figure 4.35 continue

Chapter 5: Low Energy Rapid Pullout Test
5.1 Introduction
In high energy rapid pullout tests presented in Chapter 4, nails were loaded to
complete pullout failure to mobilize the full rapid pullout response including the pre
peak and the post peak pullout stages. However, in the field, the condition of
complete pullout failure may not be achieved due to the limited capacity of impulse
hammer to impose adequate pullout energy. Occasionally, the condition of complete
pullout failure may be even undesirable if the planned pullout test is an inspection test.
Therefore, there is a need to study the pullout response of nails when loaded by lower
energy level that less than adequate to cause complete pullout failure.
In these experiments, low energy rapid pullout tests were performed on rough
nail only because the minimum energy level of the impulse hammer used in these
experiments was still too high to avoid the complete failure of smooth nail. Anyway,
since it has been shown by the results of high energy rapid pullout test that the rapid
pullout response of smooth nail was virtually identical to its quasi static pullout
response with minimal damping effect, it is reasonable to say that the low energy
rapid pullout response of smooth nail would also be equal to its corresponding quasi
static pullout response.
As usual, only the code of test series and pullout tests will be quoted in this
chapter. The details of the coding system are given in Table 2.4 and Table 2.5. For
pullout tests that consists of two successive low energy rapid pullout tests, the first
and the second low energy rapid pullout tests will be distinguished by adding ‘1’ and
‘2’ at the end of test code. As an example, the first and second rapid pullout tests of
DCs-S25C-3-RL test are termed as DCs-S25C-3-RL1 test and DCs-S25C-3-RL2 test
respectively.
The traces of impulse load, rapid axial body load, displacement, velocity and
acceleration in time domain of all low energy rapid pullout tests are plotted in
Appendix B. As has been discussed in Section 2.4.2 of Chapter 2, loading duration of
impulse load applied to every rapid pullout tests in these experiments was around 27
ms, with approximately 8 ms of rise time and 19 ms of fall time (although these
parameters slightly differ from test to test, the differences were marginal). The
dominant loading frequency was approximately 35 Hz by FFT analysis. The
corresponding relative wave length defined by Eq. 1.1 was 90 and 41 respectively for
tests with 0.75 m and 1.65 m of effective nail length. These relative wave lengths are
significantly larger than the lower boundary value of 10 proposed by Holeyman (1992)
for the validity of rapid loading condition.
5.2 The Plot of Load Displacement Curve
The low energy rapid load displacement curves of all test series on rough nails
(except the DCs-S45C test series) are plotted in Figure 5.1 to Figure 5.5. For DCs-
S25C test series and DFs-S25F test series which consist of two successive low energy
rapid pullout tests with increasing energy level, the results of these successive low
energy rapid pullout tests are plotted in the same figure. As before, the plotted load
displacement curves are the curves of ‘net’ rapid soil response after the subtraction of
inertia effect by Eq. 4.1.
In Figure 5.1 to Figure 5.5, the load displacement curve of succeeding quasi
static pullout tests conducted after the low energy rapid pullout tests are also plotted

to examine the influence of low energy rapid pullout test on the behaviour of quasi
static pullout tests conducted afterward.
Besides, the load displacement curves of quasi static pullout tests presented in
Chapter 3 are also reproduced in Figure 5.1 to Figure 5.5 for each test series. As usual,
although there were two quasi static pullout tests conducted under each test series,
only one is plotted here because the results of both quasi static pullout tests were
nearly identical.
5.3 Pullout Response of Low Energy Rapid Pullout Test
From the load displacement curve of low energy rapid pullout tests plotted in
Figure 5.1 to Figure 5.5, it can be seen that the load displacement path of low energy
rapid pullout tests was generally following the load displacement path of
corresponding quasi static pullout test, though the rapid pullout response was always
stiffer than the quasi static pullout response. The stiffer rapid pullout response can be
attributed to the mobilization of damping resistance, as has been discussed in the
previous chapter with the results of high energy rapid pullout test. In fact, for tests
with very low pullout energy such as DCs-S25C-3-RL1 test (Figure 5.1) and DFs-
S25F-3-RL1 test (Figure 5.5), the loading response of these low energy rapid pullout
tests were approximately matched with their corresponding quasi static load
displacement curves with minimal damping effect. It is because the maximum pullout
velocity of these tests was very small, less than 0.05 m/s.
The ‘actual’ damping coefficient of pre peak pullout response of low energy
rapid pullout tests (DCs-S25F-3-RL, DCs-S45F-3-RL and DCs-L25F-3-RL) was also
calculated by Eq. 4.3 and plotted in Figure 5.6 to Figure 5.8. In these figures, the
‘actual’ damping coefficient of corresponding high energy rapid pullout tests was also

plotted for comparison. It is seen that the ‘actual’ damping coefficient of low energy
rapid pullout tests was generally fall within the ‘actual’ damping coefficient of
corresponding high energy rapid pullout tests, despite the clear difference in pullout
velocity between low energy and high energy rapid pullout tests (Compares between
Appendix A and Appendix B). This observation indicates that the damping effect
mobilized in both low energy and high energy rapid pullout tests is nearly identical
and supports the hypothesis that the difference in pre peak pullout response between
rapid pullout test and quasi static pullout test is mainly contributed by the velocity
dependent damping resistance.
After the point of peak rapid pullout load, the rapid load displacement
response started to decrease in load while the pullout displacement is still increasing
until the unloading point. The unloading point is defined as the point on rapid load
displacement curve where maximum pullout displacement is first attained. From the
comparison of displacement trace and velocity trace in Figure B1 – Figure B5
(Appendix B), the unloading point is also seen to approximately coincide with the
point of zero velocity. This characteristic of the unloading point is essential because at
this point, only the displacement dependent stiffness resistance is mobilized as the
velocity dependent damping resistance is negligible due to zero pullout velocity.
From Figure 5.1 to Figure 5.5, the unloading point is seen to approximately
fall on the quasi static load displacement curve irregardless of nail diameter and
effective nail length. This observation suggests the possibility to utilize this unloading
point for the prediction of equivalent quasi static pullout response from low energy
rapid pullout test result. Besides, the coincidence of the unloading point with quasi
static load displacement curve also implicitly indicates the stiffness coefficient of
rapid pullout tests was nearly identical to that of quasi static pullout tests, which leads
to the deduction that the characteristics of restrained dilatancy effect and interfacial
shaft resistance that dominantly influenced the stiffness coefficient are virtually
unaffected by the variation in loading rate between quasi static and rapid tests. The
coincidence of unloading point with quasi static load displacement curve was also
observed on the response of rapid test on pile (Middendorp et.al., 1992).
After the unloading point, it is seen that the load displacement curve had
turned into a very stiff unloading response with virtually zero unloading displacement
for the first two third of decrease in pullout load (Figure 5.1 – Figure 5.5). Most of the
unloading displacement only occurred after the nail had been fully unloaded. This
very stiff unloading response caused the existence of a plateau with virtually constant
maximum pullout displacement on displacement trace (Figure B1 – Figure B5,
Appendix B). It has to be stressed that the unloading point must be taken as the first
point where the maximum pullout displacement is first met. The use of other points
along the plateau of maximum pullout displacement is unreasonable because these
points are mainly influenced by the unloading response.
5.4 Successive Low Energy Rapid Pullout Tests
For DCs-S25C-3-RL test and DFs-S25F-3-RL test, two successive low energy
rapid pullout tests with increasing pullout energy were conducted. The load
displacement curves of these tests are plotted in Figure 5.1 for DCs-S25C-3-RL test
and in Figure 5.5 for DFs-S25F-3-RL test.
From Figure 5.1 and Figure 5.5, it can be seen that after the rapid pullout load
of a succeeding rapid pullout test exceeded the maximum rapid pullout load
experienced by its preceding rapid pullout test, the load displacement curve of this
succeeding rapid pullout test turned smoothly to retrace and continue the rapid load
displacement path left behind by its preceding rapid pullout test. Both of these
successive low energy rapid pullout tests formed a complete unloading – reloading
loop that is similar to the unloading – reloading characteristic of quasi static pullout
test. Therefore, in future, the low energy rapid pullout test may be utilized to examine
the unloading - reloading characteristic of installed nail such as those expected to
resist cyclic loading.
5.5 Succeeding Quasi Static Pullout Test
The load displacement curve of succeeding quasi static pullout tests that were
conducted after the low energy rapid pullout tests are also plotted in Figure 5.1 to
Figure 5.5 for each test series.
From these figures, it is seen that the load displacement curve of these
succeeding quasi static pullout tests gradually curved to retrace the path of quasi static
load displacement curve reproduced from Chapter 3, and both were well matched to
each other after the pullout load at the unloading point of preceding low energy rapid
pullout tests had been exceeded. These characteristics seemed unaffected by the level
of rapid pullout load at the unloading point of their preceding low energy rapid
pullout tests as long as the rapid pullout load at the unloading point was well below
the corresponding peak quasi static pullout strength. As an example, these
characteristics were also observed in DCs-L25F-3-RL test (Figure 5.4) although the
rapid pullout load at the unloading point of this low energy rapid pullout test was
1450 N, only slightly lower than 1500 N, the peak quasi static pullout strength of this
test.
These results on succeeding quasi static pullout tests suggest that quasi static
pullout response of a nail is not adversely affected by the conduct of preceding low

energy rapid pullout tests. Therefore, the technique of low energy rapid pullout test
could be implemented as an inspection test method to evaluate the pullout response of
a working nail without adversely affecting its working performance.
5.6 Modified Unloading Point Method
In previous section, the low energy rapid pullout curve has been shown to
approximately coincide with the quasi static load displacement curve at its unloading
point. This unique characteristic of the unloading point shed a light on the possibility
to predict the equivalent quasi static pullout response of a nail from its low energy
rapid pullout response through a simple iterative procedure.
This unique characteristic of the unloading point has been widely utilized to
predict the equivalent static response of pile from the result of rapid test on pile by
using the ‘Unloading Point Method’ proposed and described by Horvath et.al. (1995)
and Kusakabe and Matsumoto (1995). In these ‘Unloading Point Method’, the
difference in rapid load (after subtraction of inertia effect) between the unloading
point and the point of maximum rapid load is assumed to be fully contributed by
damping resistance. With this assumption, a damping coefficient is calculated and is
usually assumed to be constant throughout the rapid test to deduce the equivalent
static response (Section 1.2.1.3, Chapter 1).
However, the assumption of constant damping coefficient appears improper
for the interpretation of soil nail rapid pullout test result since ‘actual’ damping
coefficient as defined by Eq. 4.3 of a soil nail rapid pullout test has been shown to be
a variable that decreases with the increase in pullout displacements (Section 4.4). In
addition, the assumption of equal static load mobilized at both the unloading point and
the point of maximum rapid load is also invalid for low energy rapid pullout tests.
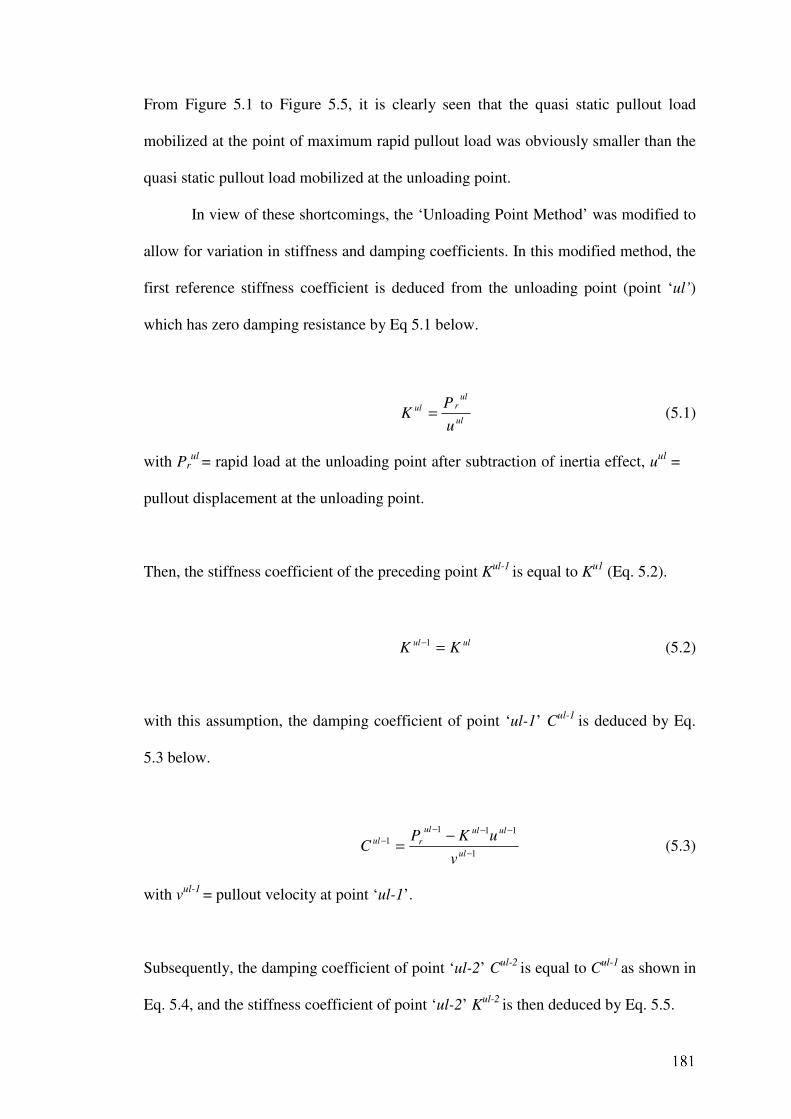
From Figure 5.1 to Figure 5.5, it is clearly seen that the quasi static pullout load
mobilized at the point of maximum rapid pullout load was obviously smaller than the
quasi static pullout load mobilized at the unloading point.
In view of these shortcomings, the ‘Unloading Point Method’ was modified to
allow for variation in stiffness and damping coefficients. In this modified method, the
first reference stiffness coefficient is deduced from the unloading point (point ‘ul’)
which has zero damping resistance by Eq 5.1 below.
ul
ulrul
u
PK = (5.1)
with Prul
= rapid load at the unloading point after subtraction of inertia effect, uul
=
pullout displacement at the unloading point.
Then, the stiffness coefficient of the preceding point Kul-1
is equal to Ku1
(Eq. 5.2).
ulul KK =−1 (5.2)
with this assumption, the damping coefficient of point ‘ul-1’ Cul-1
is deduced by Eq.
5.3 below.
1
111
1
−
−−−
− −=
ul
ululul
rul
v
uKPC (5.3)
with vul-1
= pullout velocity at point ‘ul-1’.
Subsequently, the damping coefficient of point ‘ul-2’ Cul-2
is equal to Cul-1
as shown in
Eq. 5.4, and the stiffness coefficient of point ‘ul-2’ Kul-2
is then deduced by Eq. 5.5.
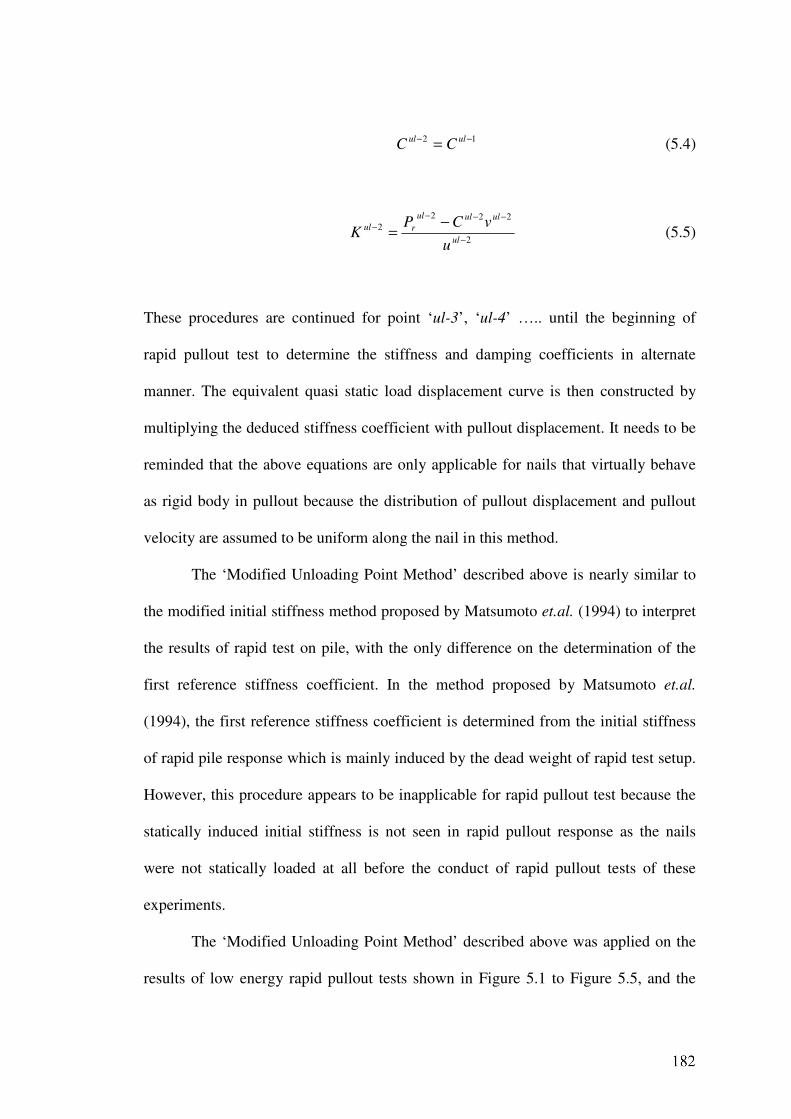
12 −−=
ululCC (5.4)
2
222
2
−
−−−
− −=
ul
ululul
rul
u
vCPK (5.5)
These procedures are continued for point ‘ul-3’, ‘ul-4’ ….. until the beginning of
rapid pullout test to determine the stiffness and damping coefficients in alternate
manner. The equivalent quasi static load displacement curve is then constructed by
multiplying the deduced stiffness coefficient with pullout displacement. It needs to be
reminded that the above equations are only applicable for nails that virtually behave
as rigid body in pullout because the distribution of pullout displacement and pullout
velocity are assumed to be uniform along the nail in this method.
The ‘Modified Unloading Point Method’ described above is nearly similar to
the modified initial stiffness method proposed by Matsumoto et.al. (1994) to interpret
the results of rapid test on pile, with the only difference on the determination of the
first reference stiffness coefficient. In the method proposed by Matsumoto et.al.
(1994), the first reference stiffness coefficient is determined from the initial stiffness
of rapid pile response which is mainly induced by the dead weight of rapid test setup.
However, this procedure appears to be inapplicable for rapid pullout test because the
statically induced initial stiffness is not seen in rapid pullout response as the nails
were not statically loaded at all before the conduct of rapid pullout tests of these
experiments.
The ‘Modified Unloading Point Method’ described above was applied on the
results of low energy rapid pullout tests shown in Figure 5.1 to Figure 5.5, and the
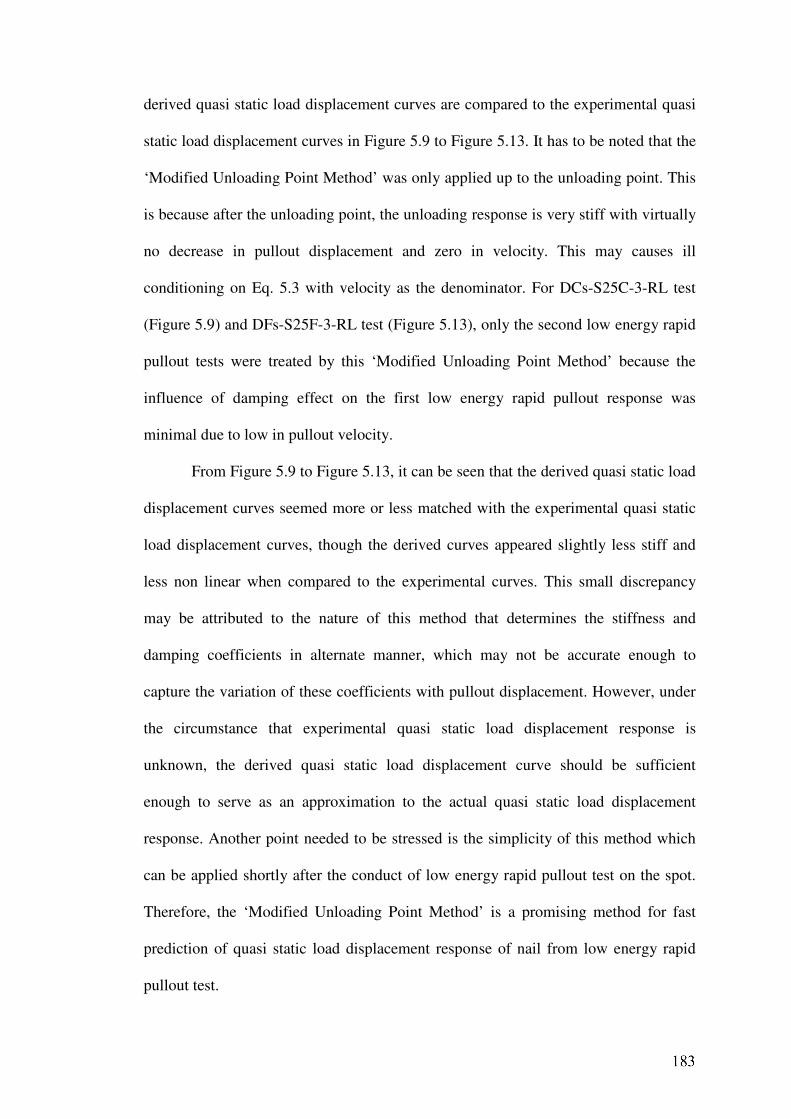
derived quasi static load displacement curves are compared to the experimental quasi
static load displacement curves in Figure 5.9 to Figure 5.13. It has to be noted that the
‘Modified Unloading Point Method’ was only applied up to the unloading point. This
is because after the unloading point, the unloading response is very stiff with virtually
no decrease in pullout displacement and zero in velocity. This may causes ill
conditioning on Eq. 5.3 with velocity as the denominator. For DCs-S25C-3-RL test
(Figure 5.9) and DFs-S25F-3-RL test (Figure 5.13), only the second low energy rapid
pullout tests were treated by this ‘Modified Unloading Point Method’ because the
influence of damping effect on the first low energy rapid pullout response was
minimal due to low in pullout velocity.
From Figure 5.9 to Figure 5.13, it can be seen that the derived quasi static load
displacement curves seemed more or less matched with the experimental quasi static
load displacement curves, though the derived curves appeared slightly less stiff and
less non linear when compared to the experimental curves. This small discrepancy
may be attributed to the nature of this method that determines the stiffness and
damping coefficients in alternate manner, which may not be accurate enough to
capture the variation of these coefficients with pullout displacement. However, under
the circumstance that experimental quasi static load displacement response is
unknown, the derived quasi static load displacement curve should be sufficient
enough to serve as an approximation to the actual quasi static load displacement
response. Another point needed to be stressed is the simplicity of this method which
can be applied shortly after the conduct of low energy rapid pullout test on the spot.
Therefore, the ‘Modified Unloading Point Method’ is a promising method for fast
prediction of quasi static load displacement response of nail from low energy rapid
pullout test.

5.7 Concluding Remarks
The most important characteristic of low energy rapid pullout response is the
coincidence of low energy rapid load displacement curve with its corresponding quasi
static load displacement curve at the unloading point. With this unique characteristic
of the unloading point, a ‘Modified Unloading Point Method’ was proposed to predict
the equivalent quasi static load displacement curve of a nail from its low energy rapid
pullout test result with simple procedures. This method is found to work well on the
results of low energy rapid pullout test of these experiments.
Besides, the basic characteristics of quasi static pullout response are seen not
to be adversely affected by the preceding low energy rapid pullout tests. This
observation suggests that low energy rapid pullout test can be applied as an inspection
test method to examine the pullout response of a working nail without adversely
affecting its working performance.
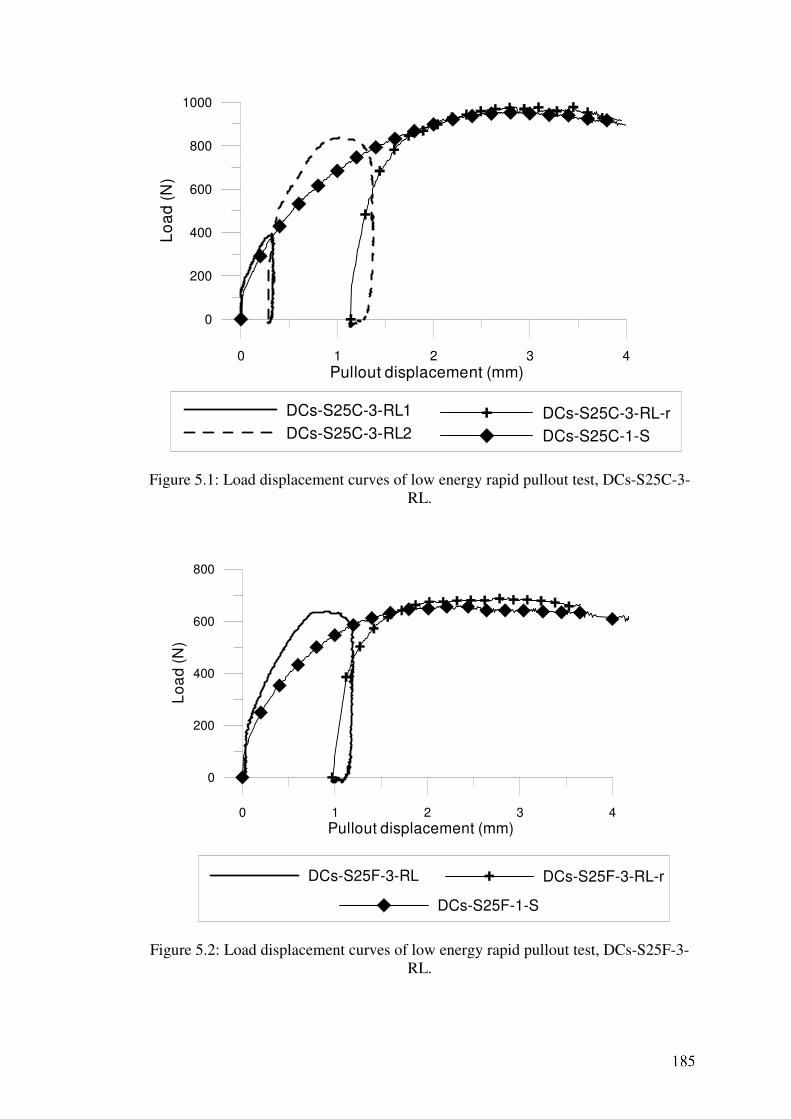
0 1 2 3 4
Pullout displacement (mm)
0
200
400
600
800
1000
Lo
ad
(N
)
DCs-S25C-3-RL1
DCs-S25C-3-RL2DCs-S25C-3-RL-r
DCs-S25C-1-S
Figure 5.1: Load displacement curves of low energy rapid pullout test, DCs-S25C-3-
RL.
0 1 2 3 4
Pullout displacement (mm)
0
200
400
600
800
Lo
ad
(N
)
DCs-S25F-3-RL DCs-S25F-3-RL-r
DCs-S25F-1-S
Figure 5.2: Load displacement curves of low energy rapid pullout test, DCs-S25F-3-
RL.
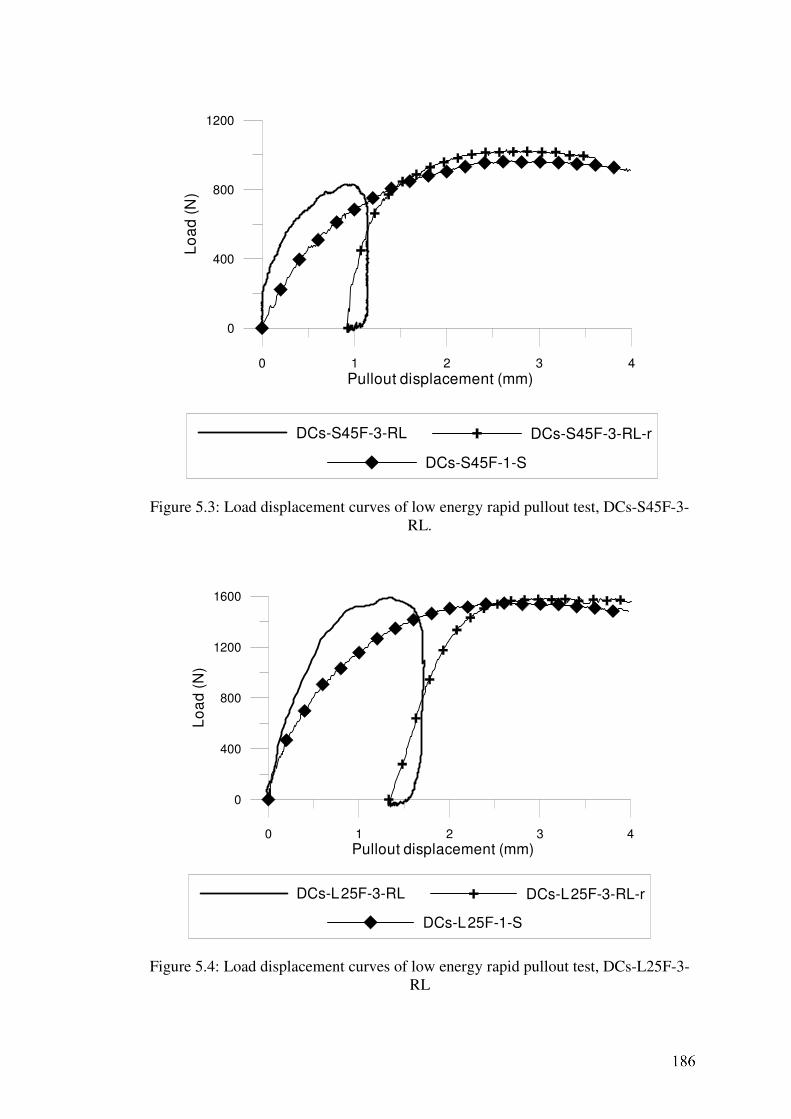
0 1 2 3 4
Pullout displacement (mm)
0
400
800
1200
Lo
ad
(N
)
DCs-S45F-3-RL DCs-S45F-3-RL-r
DCs-S45F-1-S
Figure 5.3: Load displacement curves of low energy rapid pullout test, DCs-S45F-3-
RL.
0 1 2 3 4
Pullout displacement (mm)
0
400
800
1200
1600
Lo
ad
(N
)
DCs-L25F-3-RL DCs-L25F-3-RL-r
DCs-L25F-1-S
Figure 5.4: Load displacement curves of low energy rapid pullout test, DCs-L25F-3-
RL
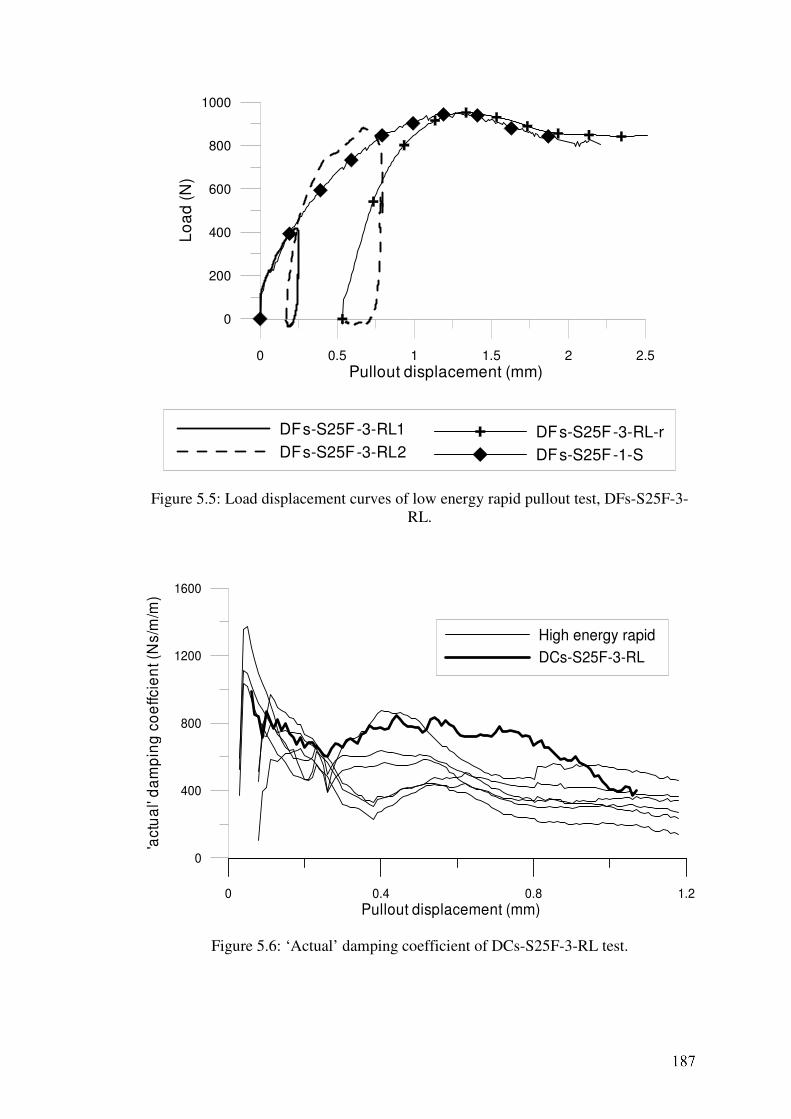
0 0.5 1 1.5 2 2.5
Pullout displacement (mm)
0
200
400
600
800
1000
Lo
ad
(N
)
DFs-S25F-3-RL1
DFs-S25F-3-RL2
DFs-S25F-3-RL-r
DFs-S25F-1-S
Figure 5.5: Load displacement curves of low energy rapid pullout test, DFs-S25F-3-
RL.
0 0.4 0.8 1.2
Pullout displacement (mm)
0
400
800
1200
1600
'actu
al'
da
mp
ing
co
effcie
nt (N
s/m
/m)
High energy rapid
DCs-S25F-3-RL
Figure 5.6: ‘Actual’ damping coefficient of DCs-S25F-3-RL test.
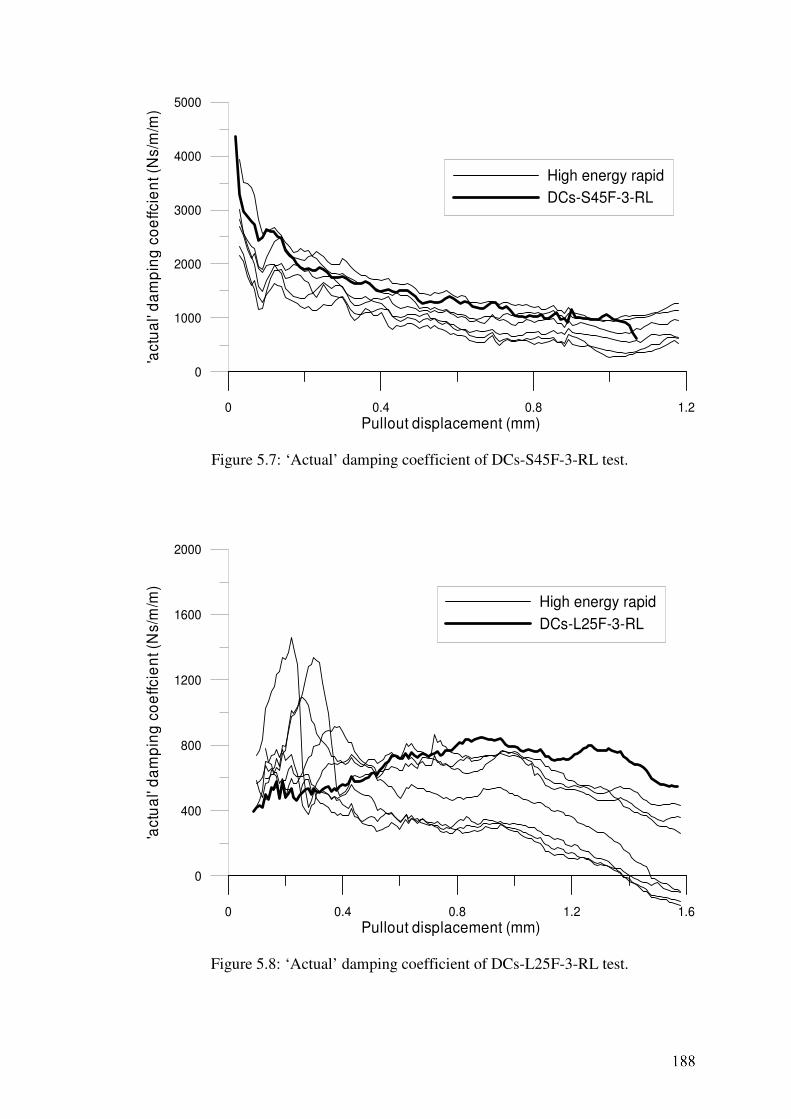
0 0.4 0.8 1.2
Pullout displacement (mm)
0
1000
2000
3000
4000
5000
'actu
al'
da
mp
ing
co
effcie
nt (N
s/m
/m)
High energy rapid
DCs-S45F-3-RL
Figure 5.7: ‘Actual’ damping coefficient of DCs-S45F-3-RL test.
0 0.4 0.8 1.2 1.6
Pullout displacement (mm)
0
400
800
1200
1600
2000
'actu
al'
da
mp
ing
co
effcie
nt (
Ns/
m/m
)
High energy rapid
DCs-L25F-3-RL
Figure 5.8: ‘Actual’ damping coefficient of DCs-L25F-3-RL test.
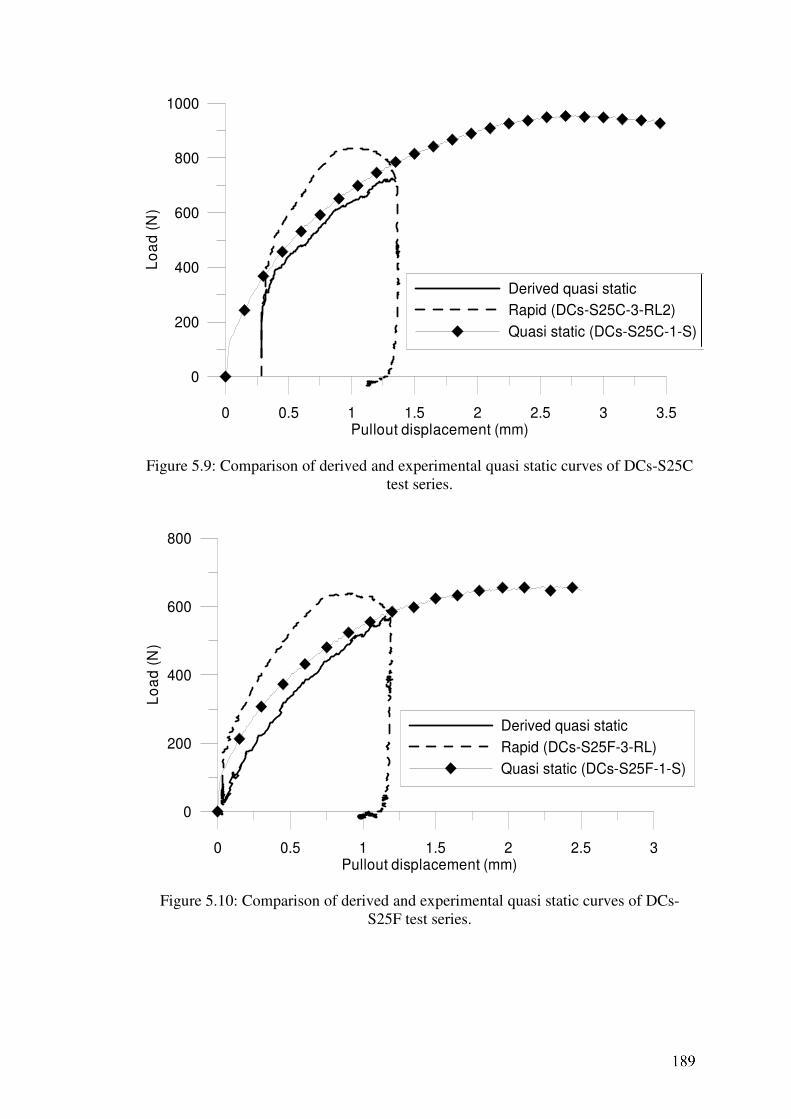
0 0.5 1 1.5 2 2.5 3 3.5Pullout displacement (mm)
0
200
400
600
800
1000
Lo
ad
(N
)
Derived quasi static
Rapid (DCs-S25C-3-RL2)
Quasi static (DCs-S25C-1-S)
Figure 5.9: Comparison of derived and experimental quasi static curves of DCs-S25C
test series.
0 0.5 1 1.5 2 2.5 3Pullout displacement (mm)
0
200
400
600
800
Lo
ad
(N
)
Derived quasi static
Rapid (DCs-S25F-3-RL)
Quasi static (DCs-S25F-1-S)
Figure 5.10: Comparison of derived and experimental quasi static curves of DCs-
S25F test series.
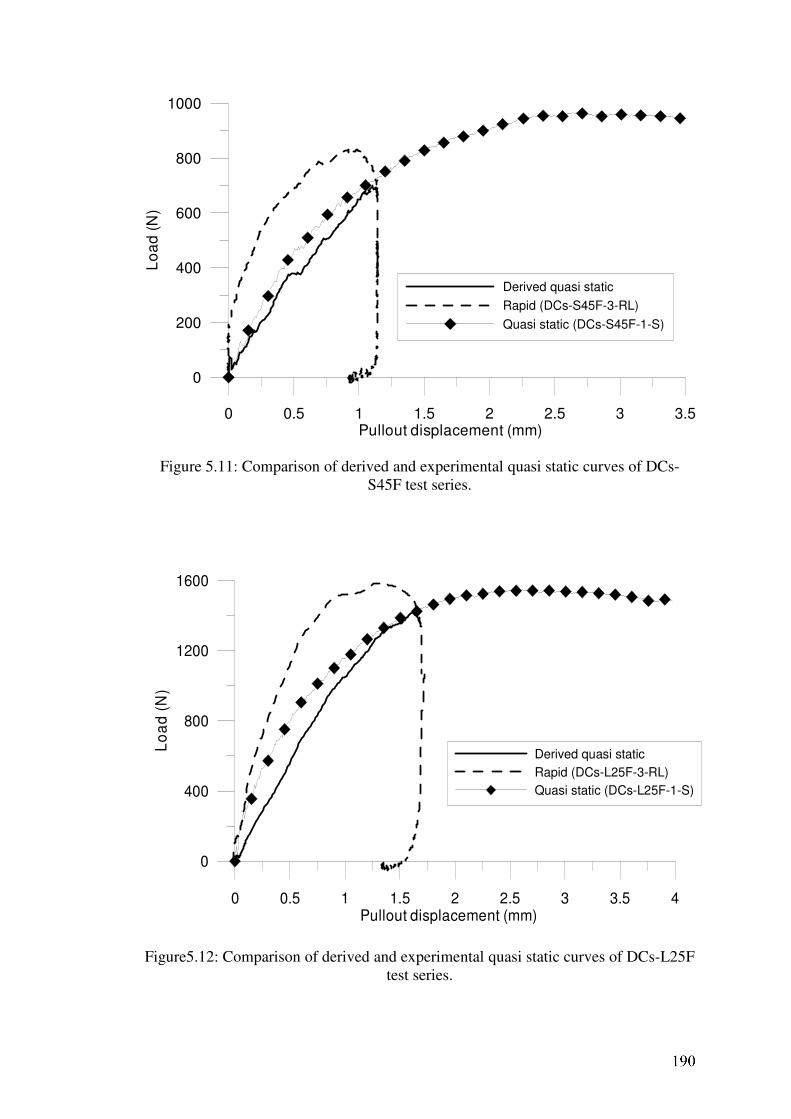
0 0.5 1 1.5 2 2.5 3 3.5Pullout displacement (mm)
0
200
400
600
800
1000
Lo
ad
(N
)
Derived quasi static
Rapid (DCs-S45F-3-RL)
Quasi static (DCs-S45F-1-S)
Figure 5.11: Comparison of derived and experimental quasi static curves of DCs-
S45F test series.
Figure5.12: Comparison of derived and experimental quasi static curves of DCs-L25F
test series.
0 0.5 1 1.5 2 2.5 3 3.5 4Pullout displacement (mm)
0
400
800
1200
1600
Lo
ad
(N
)
Derived quasi static
Rapid (LSF-3-RL)
Quasi static (LSF-1-S)
Derived quasi static
Rapid (DCs-L25F-3-RL)
Quasi static (DCs-L25F-1-S)
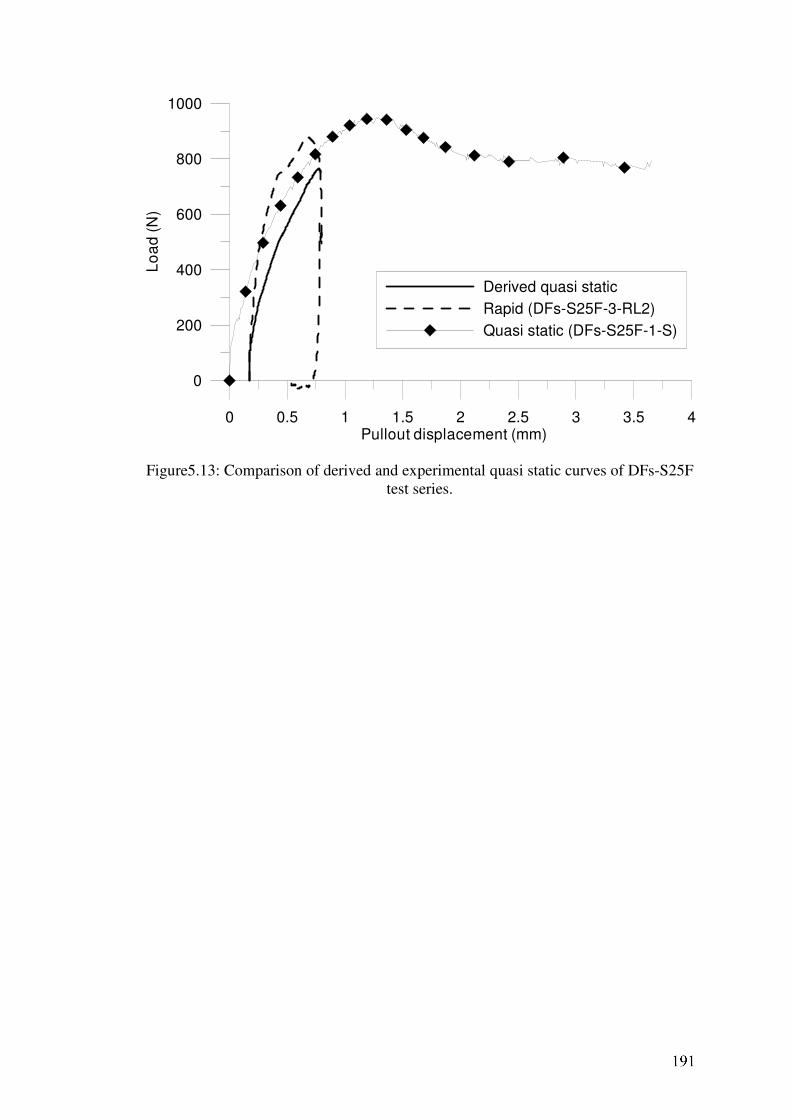
0 0.5 1 1.5 2 2.5 3 3.5 4Pullout displacement (mm)
0
200
400
600
800
1000
Lo
ad
(N
)
Derived quasi static
Rapid (DFs-S25F-3-RL2)
Quasi static (DFs-S25F-1-S)
Figure5.13: Comparison of derived and experimental quasi static curves of DFs-S25F
test series.
Chapter 6: Discussion on Spring and Dashpot Model
6.1 Introduction
In this chapter, modelling of rapid pullout response of rough nail by spring and
dashpot model is discussed. As has been mentioned in Chapter 4, back simulation of
high energy rapid pullout test results of rough nail is needed to subtract damping
resistance and derive the equivalent quasi static pullout response. Spring and dashpot
model appears to be a possible approach for this purpose.
At the beginning of this chapter, a brief review on the development of spring
and dashpot model for dynamic pile shaft resistance is presented. Experiences and
concepts applied to these shaft models will provide some valuable guidelines on
proper modelling of rapid pullout response of rough nail, which previous experiences
are apparently lacking.
In this chapter, only modelling of pre peak pullout response was considered. It
is because post peak pullout response is mainly affected by the evolution of shear
band (Section 4.5) that obviously differs from the mechanism of damping resistance.
6.2 Reviews on Available Shaft Models Applied to Pile
Figure 6.1a shows the first dynamic shaft model proposed by Smith (1960) for
pile. This model simulates the displacement dependent stiffness resistance and
velocity dependent damping resistance by a pair of parallel spring and dashpot. The
limiting static shaft resistance is modeled by a plastic slider in series with the spring.
Smith (1960) suggested the dynamic shaft resistance pd can be approximated as
( )vJpp ssd += 1 (6.1)
with pd = dynamic shaft resistance, ps = static shaft resistance, Js = Smith’s damping
factor, and v = shaft velocity.
Implicitly, Smith (1960) correlated the damping coefficient to stiffness
coefficient by an empirical factor of Js. Rausche et.al. (1994) suggested the Smith’s
damping factor Js of shaft resistance to be 0.164 s/m for sand and 0.656 s/m for clay.
The Smith’s model suffers from several limitations (Randolph, 1991). Firstly,
the damping modelling in Smith’s model does not explicitly consider the radiation
damping effect which has been well accepted as the main damping source in pile
dynamic event (Smith and Chow, 1982). Secondly, the determination of Smith’s
damping factor is fully empirical without any rational link to conventional soil
properties. In view of this, revised shaft models incorporating the plane strain
analytical solution of radiation damping for vertical shaft embedded in radially
homogeneous elastic soil medium (Novak et.al., 1978) were proposed by Randolph
and Simon (1986) and Lee et.al. (1988). In these models, spring coefficient k and
damping coefficient c (in terms of per unit length) are related to conventional soil
properties by equations shown below:
sGk 75.2= (6.2)
ssGrc ρπ2= (6.3)
with Gs = shear modulus of soil. r = shaft radius, and ρs = density of soil.
The main difference between the R-S model (Randolph and Simon, 1986) and
the NUS model (Lee et.al., 1988) lies in the definition of limiting shaft resistance. In
the R-S model, limiting shaft resistance is defined by the sum of spring and dashpot
resistance by placing the plastic slider in between the lumped mass and the pair of
spring and dashpot (Figure 6.1b). While, the NUS model defines the limiting shaft
resistance by the spring resistance alone by placing the plastic slider in line with
spring (Figure 6.1a). Lee et.al. (1988) claimed that definition of limiting shaft
resistance of the NUS model is more logical since limiting shaft resistance is mainly
controlled by the level of shear strain experienced by the adjacent soil alone. Lee et.al.
(1988) also mentioned that once the limiting shaft resistance is achieved by the spring,
dashpot in the NUS model will be numerically disconnected to simulate the ceasing of
radiation damping effect.
The influence of loading rate on limiting shaft resistance is explicitly
considered in the NUS model by the power function suggested by Coyle and Gibson
(1970) (Eq. 6.4). Loading rate effect is also simulated by the R-S model by a power
function that is almost similar to Eq. 6.4 with the only difference being the
replacement of shaft velocity v in Eq. 6.4 by the relative velocity between shaft and
adjacent soil ∆v. The loading rate effect was proposed by Randolph and Simon (1986)
to be visualized as an additional viscous dashpot placed in parallel with the plastic
slider as shown in Figure 6.1b.
( )N
usud vJpp*
)()( 1+= (6.4)
with pd(u) = limiting dynamic shaft resistance, ps(u) = limiting static shaft resistance, J*
= loading rate factor, and v = shaft velocity, N = 0.2.
However, the existence of high strain weaken zone adjacent to shaft is not
considered in all of the abovementioned models. The shear modulus of this weaken
zone is significantly lower than the shear modulus of relatively undisturbed outer field
soil medium due to the strong non linearity of soil behaviour. The neglect of weaken
zone is likely to lead to overestimation of radiation damping effect (Mitwally and
Novak, 1988). To cope with this discrepancy, Mitwally and Novak (1988) proposed
to determine the spring and dashpot coefficients by the plane strain analytical solution
of radiation damping for vertical shaft embedded in radially inhomogeneous soil
medium (Novak and Sheta, 1980). In this analytical solution, the existence of high
strain weaken zone adjacent to shaft is simulated by a finite radius weaken zone in
between shaft and outer elastic soil medium. In their paper, Mitwally and Novak
(1988) considered two definitions of limiting shaft resistance, by placing the plastic
slider in line with spring similar to the NUS model (Figure 6.1a), and by placing the
plastic slider in between the lumped mass and the pair of spring and dashpot similar to
the R-S model (Figure 6.1b). Both definitions were shown to work equally well in the
modelling of dynamic and rapid pile load test result in their paper.
The major discrepancy of the M-N model (Mitwally and Novak model) is on
the need to pre-determine a constant Gm/Gs ratio (Gm = shear modulus of weaken zone,
Gs = shear modulus of outer field soil medium) in the simulation. The pre-
determination of a constant Gm/Gs ratio is illogical since the weakening of soil within
the weaken zone is progressive in manner and is evolving throughout the loading
process.
In view of this, El-Naggar and Novak (1994) proposed another shaft model
(the E-N model) that is capable of simulating the progressive evolution of high strain
weaken zone. In this model, the surrounding soil medium is divided into weaken zone
and outer field soil medium (Figure 6.1c). The progressive weakening of weaken zone
is modeled by a non linear spring defined by the hyperbolic relationship shown as Eq.
6.5 below. The initial shear modulus of weaken zone Gmi in Eq. 6.5 is equated to shear
modulus of outer field soil medium Gs. A viscous dashpot is also proposed to be
placed in parallel with the non linear spring to model the rate effect. A plastic slider
defining the limiting shaft resistance is placed in between shaft node and weaken zone.
p =
−
−
o
o
i
m
r
r
G
η
η
π
1ln
2
1
u
with p = shaft resistance, Gmi = initial shear modulus of weaken zone, r1 = radius of
weaken zone, r = radius of shaft, u = shaft displacement, ηo = τo/τf, τo = shear stress
of soil adjacent to shaft, and τf = ultimate shear stress.
The outer field soil medium of this model is assumed relatively undisturbed
and remained elastic and homogeneous. The stiffness and damping coefficients of this
medium are determined by Eq. 6.2 and Eq. 6.3 respectively. The limiting shaft
resistance of this model is accounted for by a plastic slider placed between lumped
mass and weaken zone (Figure 6.1c). The loading rate effect is also explicitly
considered by Eq. 6.4.
Although all of the abovementioned dynamic shaft models are originally
proposed to model pile shaft response in high strain dynamic pile load test (usually
known as PDA test), attempts to apply these shaft model to simulate rapid pile load
test response have been explored by several researchers either in the form of full wave
equation model (El Naggar and Novak, 1992, Ochiai et.al., 1996, Asai et.al., 1997,
Nishimura et.al., 1998) or in the form of simplified single lumped mass model (Kato
(6.5)
et.al., 1998). These limited published experiences generally reported that these
dynamic shaft models are also reasonably good in simulating the shaft resistance of
rapid pile load test.
6.3 Modelling of Rapid Pullout Response of Rough Nail
From the reviews on dynamic pile shaft models presented above, an
approximate picture of spring and dashpot model capable of modelling the rapid
pullout response of rough nail can be drawn. It should consists of a lumped mass that
simulates the mass of nail, a pair of parallel spring and dashpot that respectively
simulates the displacement dependent stiffness resistance and velocity dependent
damping resistance (radiation damping) of soil, and a plastic slider that simulates the
limiting shaft resistance. The need to incorporate an additional spring between the
pair of parallel spring and dashpot and shaft node to simulate the existence of high
strain weaken zone will be assessed later. The modelling of rate effect by the power
function (Eq. 6.4) can be reasonably ignored here because viscous damping is
insignificant in these experiments with nail embedded in non viscous clean dry sand.
To simulate the pullout test results of these experiments, single element
lumped mass model is found adequate. This is because all nails used in these
experiments are very rigid with insignificant extensibility effect. The negligible
influence of extensibility effect in these experiments can be seen from the virtually
identical in shape of pullout load and axial body load (versus nail head displacement)
measured along the nail (Figure 4.1 to Figure 4.7) and the linearity of axial load
distribution curves (Figure 4.11). These characteristics imply that shaft resistance was
mobilized simultaneously along the nail in the pullout, which is a clear indication of
negligible extensibility effect (Gurung et.al., 1999). Progressive failure of shaft
resistance caused by extensibility effect does not apply to these experiments.
The very rigid behaviour of nails in these experiments can also be seen from
the fact that maximum elastic elongation of the model nails ∆e is only 0.3 mm when
subjected to their corresponding peak pullout strength exerted in these experiments,
under the most extreme condition of one-end-fixed. Actual elastic elongation of nail
in pullout will be lower due to dissipation of pullout load to surrounding soil medium
through shaft resistance. But even under this extreme one-end-fixed condition, the 0.3
mm elastic elongation of nail is still relatively insignificant when compared to the
pullout displacement needed to mobilize the peak pullout strength of rough nail in
these experiments.
Influence of stress wave propagation phenomenon was also minimal in these
experiments because the relative wave length Λ of all rapid pullout tests was larger
than 10 (Section 2.4.2), the lower boundary value proposed by Holeyman (1992) for
the validity of rapid loading condition. Hence, progressive mobilization and failure of
shaft resistance caused by stress wave propagation does not apply to these
experiments.
The correctness of using single element lumped mass model to simulate the
rapid pullout test results of these experiments can be seen from Figure 6.2. This figure
shows that load displacement curves of DCs-S25C test series simulated by both single
element lumped mass model and multiple elements wave equation model are well
matched to each other under both static and rapid loading conditions. In these
simulations, shaft model with constant pre failure stiffness and plastic slider in line
with spring (Figure 6.1a) was applied. The nail was discretized into 75 nail elements
in the multiple elements wave equation model. Input parameters of shaft model

applied to these simulations are the same as the parameters applied to produce the
‘best matched’ simulated curve in Figure 6.4 that will be discussed in Section 6.3.1
below.
Hence, the use of single element lumped mass model to simulate the pullout
response of rough nail considered in these experiments is reasonable.
6.3.1 Model with Constant Pre Failure Stiffness
In the review of dynamic pile shaft models presented above, models with
constant pre failure stiffness (Figure 6.1a and 1b), such as the Smith model (Smith,
1960), the R-S model (Randolph and Simon, 1986) and the NUS model (Lee et.al.,
1988) are commonly applied. However, intuitively the use of this concept is
inappropriate for pullout response of rough nail because of the highly non-linear
hyperbolic load displacement response of rough nail as observed in these experiments
(Figure 3.1 to Figure 3.7) and reported by other researchers (Schlosser and Elias, 1978
and Heymann, 1992). As illustrated in Figure 6.3, the value of this constant pre failure
stiffness can only represent the secant stiffness of particular pullout stage such as the
initial pullout stage (kini), the pullout stage at 50 % of peak pullout strength (k50), the
pullout stage at 75 % of peak pullout strength (k75), the pullout stage at peak pullout
strength (k100) and etc.
Figure 6.4 plots the simulation results of DCs-S25C test series by the constant
pre failure stiffness model. The simulated rapid load displacement curve (after
subtraction of inertia effect) was produced by adjusting the stiffness coefficient of this
model until the best matched with corresponding experimental result had achieved. In
this model, damping coefficient was calculated from stiffness coefficient by Eq. 6.6
below. Eq. 6.6 is derived from the analytical solution of stiffness coefficient (Eq. 6.2)
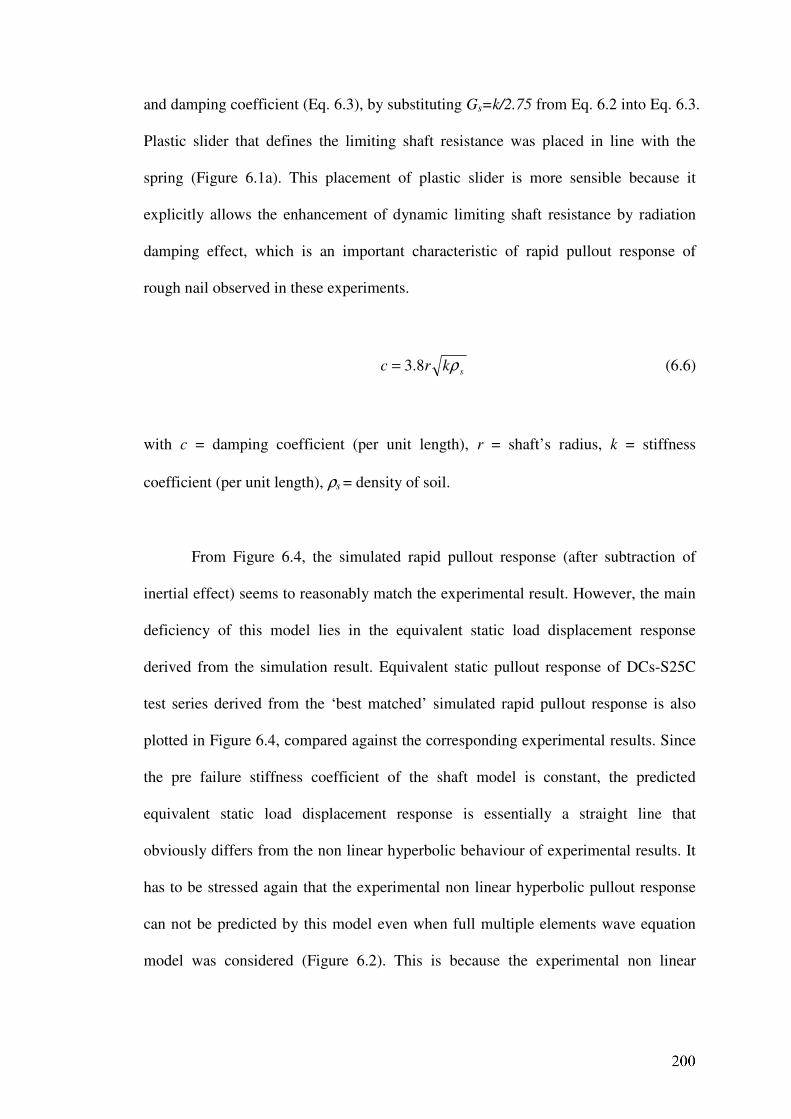
and damping coefficient (Eq. 6.3), by substituting Gs=k/2.75 from Eq. 6.2 into Eq. 6.3.
Plastic slider that defines the limiting shaft resistance was placed in line with the
spring (Figure 6.1a). This placement of plastic slider is more sensible because it
explicitly allows the enhancement of dynamic limiting shaft resistance by radiation
damping effect, which is an important characteristic of rapid pullout response of
rough nail observed in these experiments.
skrc ρ8.3= (6.6)
with c = damping coefficient (per unit length), r = shaft’s radius, k = stiffness
coefficient (per unit length), ρs = density of soil.
From Figure 6.4, the simulated rapid pullout response (after subtraction of
inertial effect) seems to reasonably match the experimental result. However, the main
deficiency of this model lies in the equivalent static load displacement response
derived from the simulation result. Equivalent static pullout response of DCs-S25C
test series derived from the ‘best matched’ simulated rapid pullout response is also
plotted in Figure 6.4, compared against the corresponding experimental results. Since
the pre failure stiffness coefficient of the shaft model is constant, the predicted
equivalent static load displacement response is essentially a straight line that
obviously differs from the non linear hyperbolic behaviour of experimental results. It
has to be stressed again that the experimental non linear hyperbolic pullout response
can not be predicted by this model even when full multiple elements wave equation
model was considered (Figure 6.2). This is because the experimental non linear
hyperbolic behaviour is the intrinsic behaviour of shaft resistance and not the
consequence of extensibility effect or progressive shaft resistance failure.
From Figure 6.4, it is clearly shown that the peak static pullout strength
predicted by the simulation result is lower than the actual peak static pullout strength
achieved in the experiments. The main explanation for this error is that Eq. 6.3 (and
hence Eq. 6.6) tends to overestimate the damping coefficient. Figure 6.5 compares the
constant damping coefficient calculated by Eq. 6.6 with the experimental ‘actual’
damping coefficient (Eq. 4.3) of DCs-S25C test series. This figure obviously shows
that the calculated damping coefficient is consistently larger than the band of
experimental ‘actual’ damping coefficient, and the error become more serious with
the increase in pullout displacement because the decrease in damping coefficient with
pullout displacement is also not predicted at all by this model. The reason for this
discrepancy in damping coefficient prediction is mainly due to the fact that the
existence of high strain weaken zone adjacent to shaft is not considered in the
formulation of Eq. 6.3, which has been widely recognized by researchers in pile
dynamic modelling such as Novak and Sheta (1980), Mitwally and Novak (1988) and
El-Naggar (2001).
6.3.2 Model with Weaken Zone Hyperbolic Spring
The main setbacks of model with constant pre failure stiffness presented above
are the neglect of non linear hyperbolic characteristic of shaft resistance and high
strain weaken zone formed adjacent to shaft. Both of these setbacks may be solved by
adopting the approach proposed by El-Naggar and Novak (1994) in the E-N model
(Figure 6.1c), where an additional spring with non linear hyperbolic behaviour is
inserted in between shaft node and outer field soil medium. In this model, the stiffness
and damping coefficients of outer field soil medium are calculated by Eq. 6.2 and Eq.
6.3 respectively assuming this soil medium is relatively undisturbed and remained in
elastic region throughout the mobilization of shaft resistance. The hyperbolic
behaviour of weaken zone spring is related to the shear modulus of outer zone by Eq.
6.5. This model has been used to simulate rapid pile load test response by El-Naggar
and Novak (1994) and was reported to achieve reasonable agreement with measured
field test results.
Figure 6.6 plots the simulation results of DCs-S25C test series by this model.
The simulated rapid load displacement curves (after subtraction of inertia effect) in
Figure 6.6 are produced by assuming r1/ro in Eq. 6.5 as 2, a reasonable value
suggested by Nogami and Chen (1995), and by changing the shear modulus Gs in Eq.
6.5 until the best matched with experimental rapid load displacement curve was
achieved. The simulated rapid pullout response is seen to reasonably well match with
the experimental result.
Equivalent static pullout response derived from this ‘best-matched’ simulated
rapid pullout response is also shown in Figure 6.6. This figure indicates that the
derived static pullout response agrees reasonably well with the experimental results,
although the whole matching process was purely achieved by matching the rapid load
displacement response only. The advantages of this model lie in its more sensible
modelling of high strain weaken zone, by simulating the weaken zone as a non linear
hyperbolic spring. This method not only enable the model to capture the non linear
hyperbolic static load displacement response but also enable the model to implicitly
capture the non linear decrease of ‘actual’ damping coefficient with shaft
displacement. ‘Actual’ damping coefficient is the damping coefficient experienced by
the shaft, defined as the difference in load between equivalent rapid and quasi static
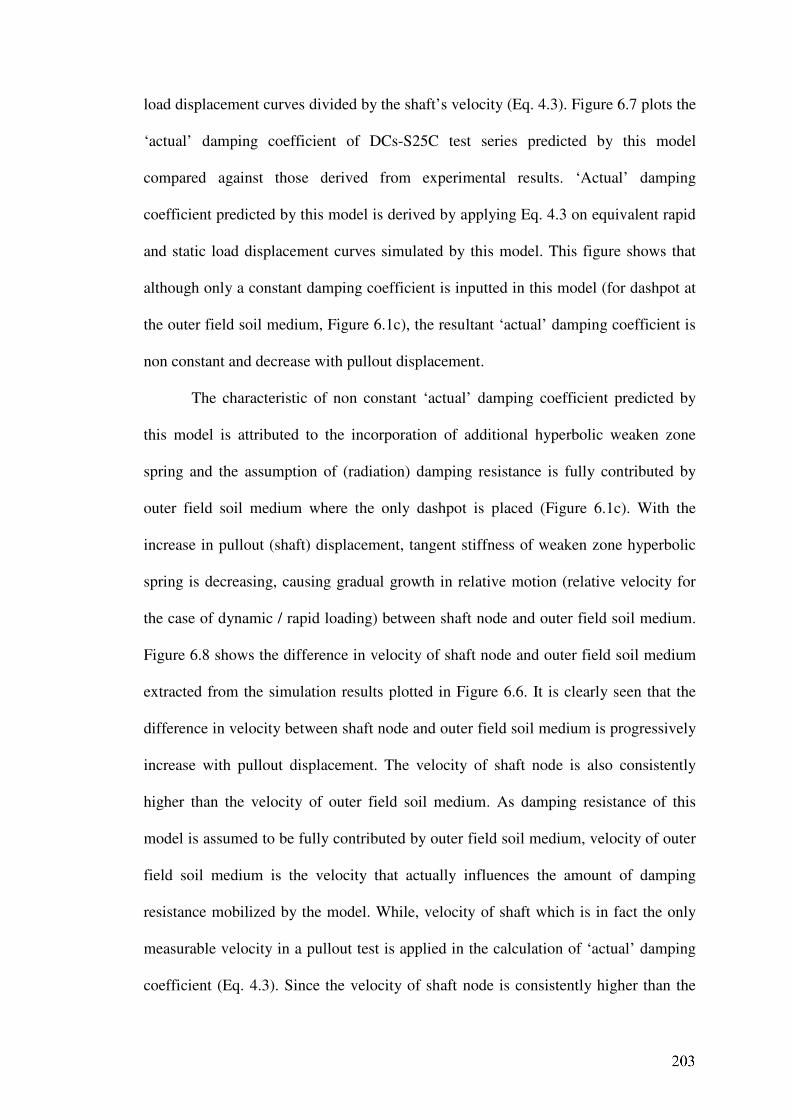
load displacement curves divided by the shaft’s velocity (Eq. 4.3). Figure 6.7 plots the
‘actual’ damping coefficient of DCs-S25C test series predicted by this model
compared against those derived from experimental results. ‘Actual’ damping
coefficient predicted by this model is derived by applying Eq. 4.3 on equivalent rapid
and static load displacement curves simulated by this model. This figure shows that
although only a constant damping coefficient is inputted in this model (for dashpot at
the outer field soil medium, Figure 6.1c), the resultant ‘actual’ damping coefficient is
non constant and decrease with pullout displacement.
The characteristic of non constant ‘actual’ damping coefficient predicted by
this model is attributed to the incorporation of additional hyperbolic weaken zone
spring and the assumption of (radiation) damping resistance is fully contributed by
outer field soil medium where the only dashpot is placed (Figure 6.1c). With the
increase in pullout (shaft) displacement, tangent stiffness of weaken zone hyperbolic
spring is decreasing, causing gradual growth in relative motion (relative velocity for
the case of dynamic / rapid loading) between shaft node and outer field soil medium.
Figure 6.8 shows the difference in velocity of shaft node and outer field soil medium
extracted from the simulation results plotted in Figure 6.6. It is clearly seen that the
difference in velocity between shaft node and outer field soil medium is progressively
increase with pullout displacement. The velocity of shaft node is also consistently
higher than the velocity of outer field soil medium. As damping resistance of this
model is assumed to be fully contributed by outer field soil medium, velocity of outer
field soil medium is the velocity that actually influences the amount of damping
resistance mobilized by the model. While, velocity of shaft which is in fact the only
measurable velocity in a pullout test is applied in the calculation of ‘actual’ damping
coefficient (Eq. 4.3). Since the velocity of shaft node is consistently higher than the
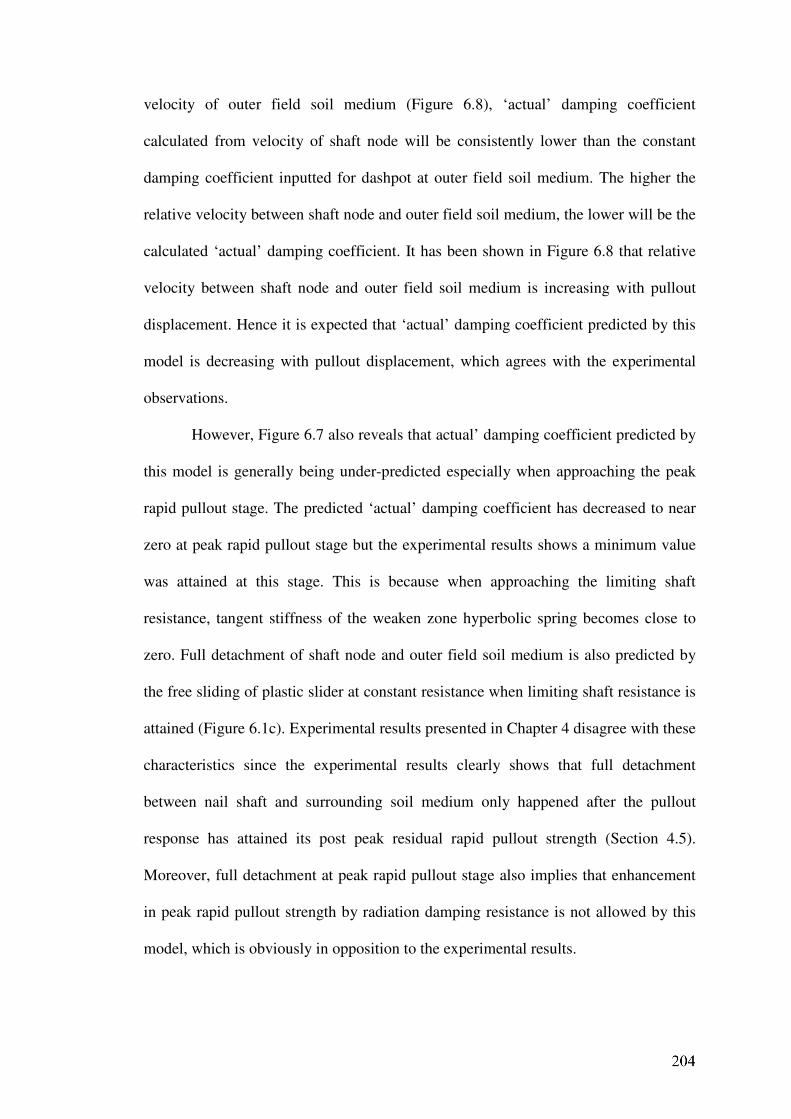
velocity of outer field soil medium (Figure 6.8), ‘actual’ damping coefficient
calculated from velocity of shaft node will be consistently lower than the constant
damping coefficient inputted for dashpot at outer field soil medium. The higher the
relative velocity between shaft node and outer field soil medium, the lower will be the
calculated ‘actual’ damping coefficient. It has been shown in Figure 6.8 that relative
velocity between shaft node and outer field soil medium is increasing with pullout
displacement. Hence it is expected that ‘actual’ damping coefficient predicted by this
model is decreasing with pullout displacement, which agrees with the experimental
observations.
However, Figure 6.7 also reveals that actual’ damping coefficient predicted by
this model is generally being under-predicted especially when approaching the peak
rapid pullout stage. The predicted ‘actual’ damping coefficient has decreased to near
zero at peak rapid pullout stage but the experimental results shows a minimum value
was attained at this stage. This is because when approaching the limiting shaft
resistance, tangent stiffness of the weaken zone hyperbolic spring becomes close to
zero. Full detachment of shaft node and outer field soil medium is also predicted by
the free sliding of plastic slider at constant resistance when limiting shaft resistance is
attained (Figure 6.1c). Experimental results presented in Chapter 4 disagree with these
characteristics since the experimental results clearly shows that full detachment
between nail shaft and surrounding soil medium only happened after the pullout
response has attained its post peak residual rapid pullout strength (Section 4.5).
Moreover, full detachment at peak rapid pullout stage also implies that enhancement
in peak rapid pullout strength by radiation damping resistance is not allowed by this
model, which is obviously in opposition to the experimental results.
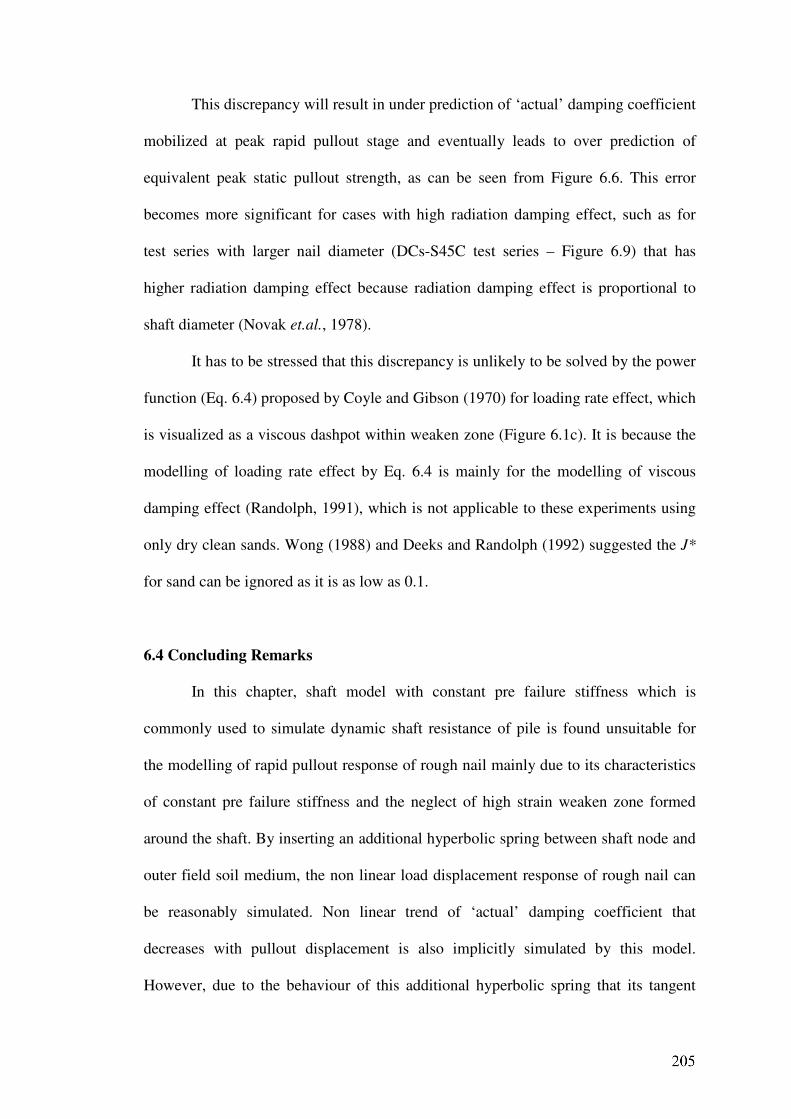
This discrepancy will result in under prediction of ‘actual’ damping coefficient
mobilized at peak rapid pullout stage and eventually leads to over prediction of
equivalent peak static pullout strength, as can be seen from Figure 6.6. This error
becomes more significant for cases with high radiation damping effect, such as for
test series with larger nail diameter (DCs-S45C test series – Figure 6.9) that has
higher radiation damping effect because radiation damping effect is proportional to
shaft diameter (Novak et.al., 1978).
It has to be stressed that this discrepancy is unlikely to be solved by the power
function (Eq. 6.4) proposed by Coyle and Gibson (1970) for loading rate effect, which
is visualized as a viscous dashpot within weaken zone (Figure 6.1c). It is because the
modelling of loading rate effect by Eq. 6.4 is mainly for the modelling of viscous
damping effect (Randolph, 1991), which is not applicable to these experiments using
only dry clean sands. Wong (1988) and Deeks and Randolph (1992) suggested the J*
for sand can be ignored as it is as low as 0.1.
6.4 Concluding Remarks
In this chapter, shaft model with constant pre failure stiffness which is
commonly used to simulate dynamic shaft resistance of pile is found unsuitable for
the modelling of rapid pullout response of rough nail mainly due to its characteristics
of constant pre failure stiffness and the neglect of high strain weaken zone formed
around the shaft. By inserting an additional hyperbolic spring between shaft node and
outer field soil medium, the non linear load displacement response of rough nail can
be reasonably simulated. Non linear trend of ‘actual’ damping coefficient that
decreases with pullout displacement is also implicitly simulated by this model.
However, due to the behaviour of this additional hyperbolic spring that its tangent

stiffness is approaching zero when close to the limiting shaft resistance, ‘actual’
damping coefficient is generally under predicted by this model. This discrepancy will
leads to over prediction of equivalent peak static pullout strength.
Hence, generally, more research works are needed for accurate modelling of
rapid pullout response of rough nail by spring and dashpot model before the model
can be conveniently used in routine interpretation of field rapid pullout test results in
future.
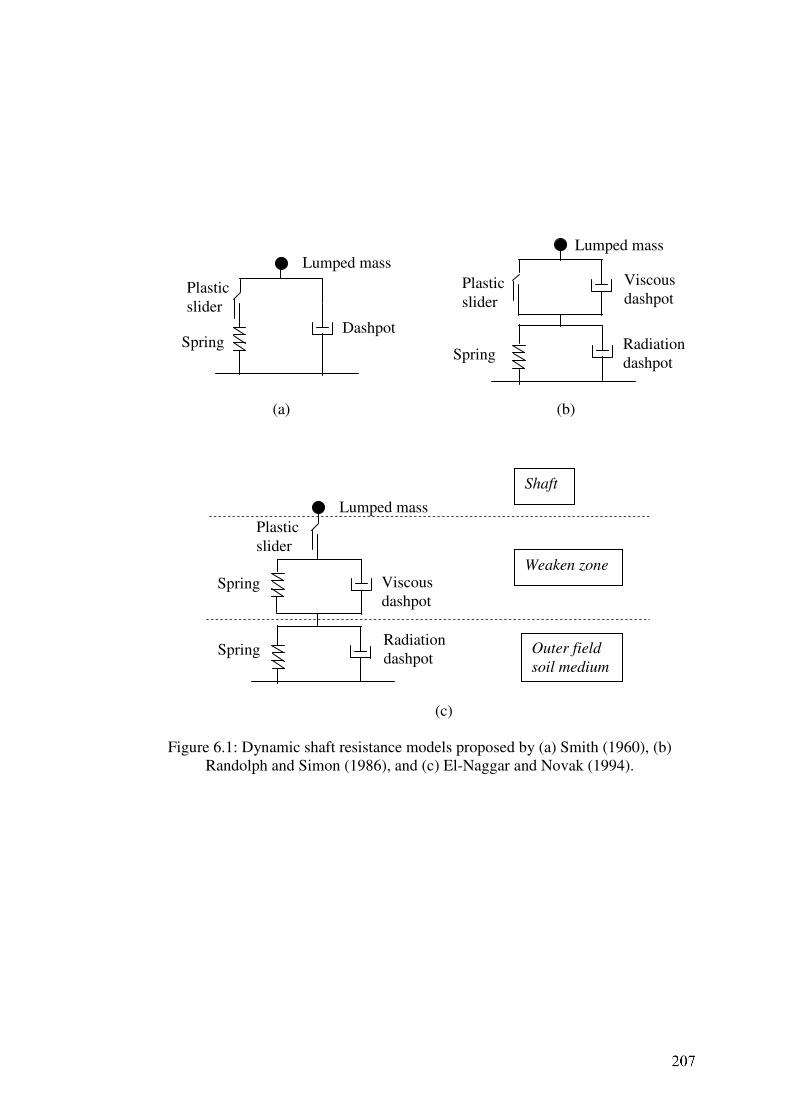
Figure 6.1: Dynamic shaft resistance models proposed by (a) Smith (1960), (b)
Randolph and Simon (1986), and (c) El-Naggar and Novak (1994).
Dashpot Spring
Plastic
slider
Lumped mass
Radiation
dashpot Spring
Plastic
slider
Lumped mass
Viscous
dashpot
(a) (b)
Radiation
dashpot
Spring
Plastic
slider
Lumped mass
Viscous
dashpot
Spring Outer field
soil medium
Weaken zone
Shaft
(c)
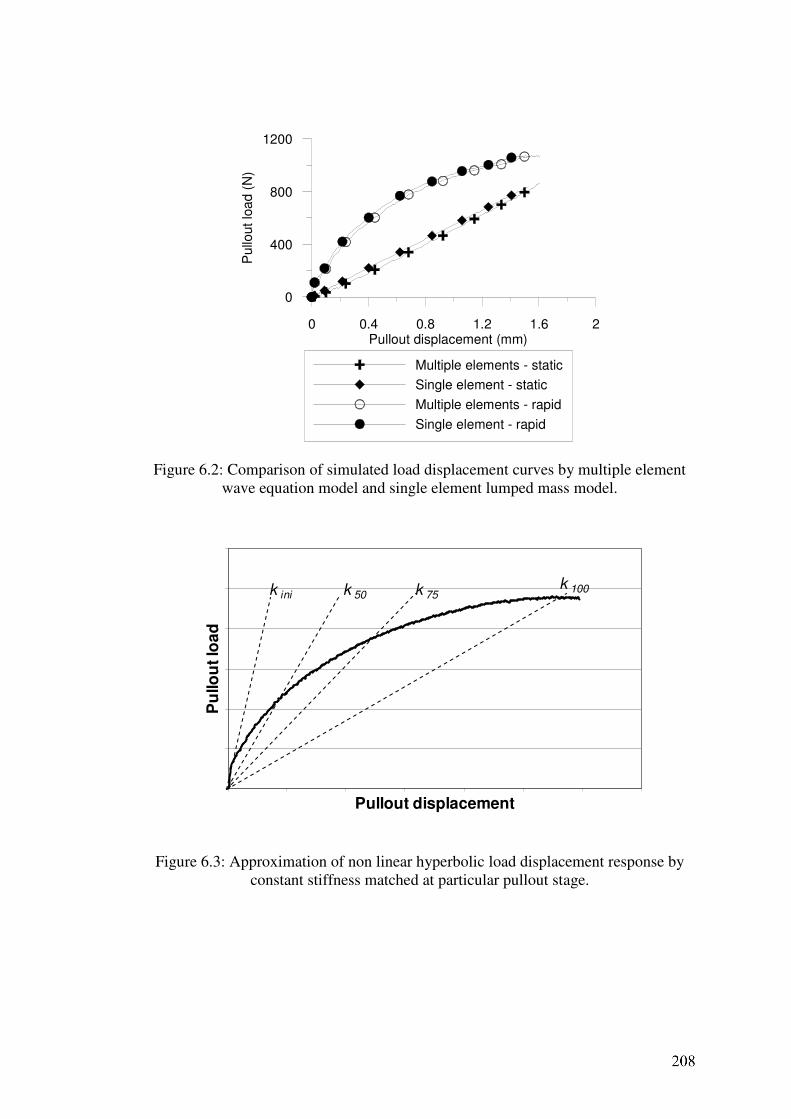
0 0.4 0.8 1.2 1.6 2Pullout displacement (mm)
0
400
800
1200
Pu
llout
loa
d (
N)
Multiple elements - static
Single element - static
Multiple elements - rapid
Single element - rapid
Figure 6.2: Comparison of simulated load displacement curves by multiple element
wave equation model and single element lumped mass model.
Pullout displacement
Pu
llo
ut
loa
d
k ini k 50k 100k 75
Figure 6.3: Approximation of non linear hyperbolic load displacement response by
constant stiffness matched at particular pullout stage.
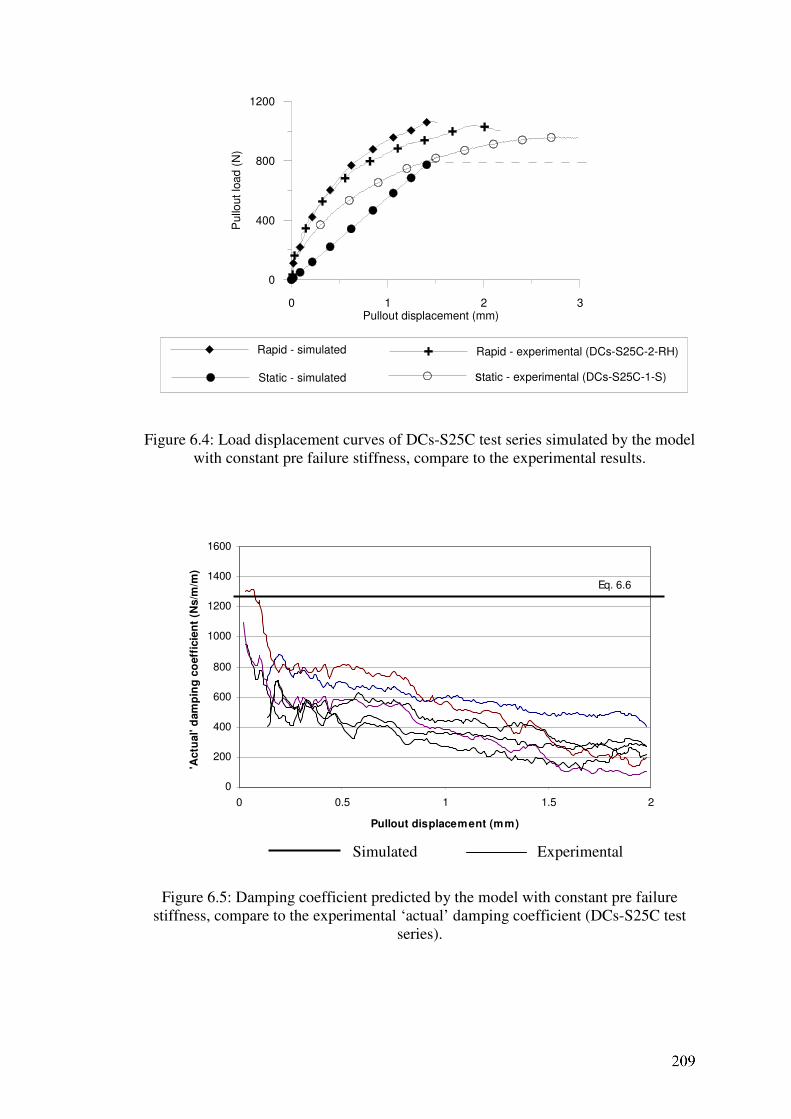
0 1 2 3Pullout displacement (mm)
0
400
800
1200
Pu
llou
t lo
ad
(N
)
Rapid - experimental (DCs-S25C-2-RH)Rapid - simulated
static - experimental (DCs-S25C-1-S)Static - simulated
Figure 6.4: Load displacement curves of DCs-S25C test series simulated by the model
with constant pre failure stiffness, compare to the experimental results.
0
200
400
600
800
1000
1200
1400
1600
0 0.5 1 1.5 2
Pullout displacement (mm)
'Actu
al' d
am
pin
g c
oeff
icie
nt
(Ns/m
/m)
Eq. 6.6
Figure 6.5: Damping coefficient predicted by the model with constant pre failure
stiffness, compare to the experimental ‘actual’ damping coefficient (DCs-S25C test
series).
Simulated Experimental
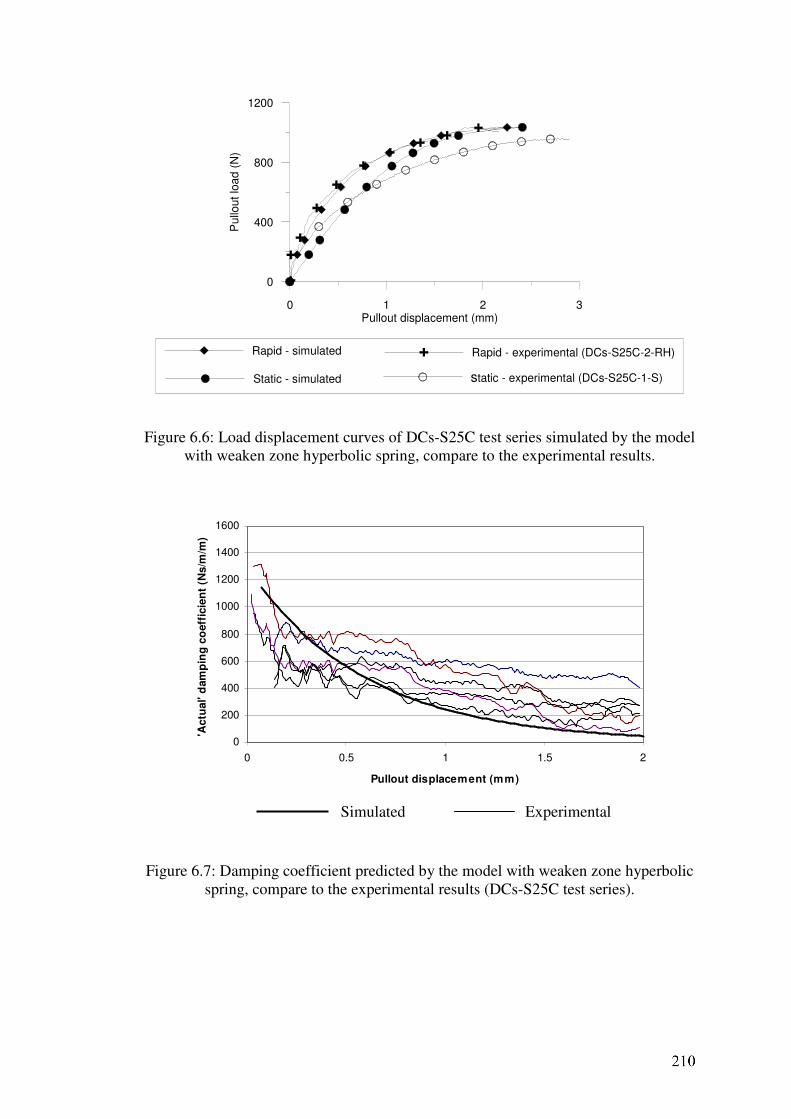
0 1 2 3Pullout displacement (mm)
0
400
800
1200
Pu
llou
t lo
ad
(N
)
Rapid - experimental (DCs-S25C-2-RH)Rapid - simulated
static - experimental (DCs-S25C-1-S)Static - simulated
Figure 6.6: Load displacement curves of DCs-S25C test series simulated by the model
with weaken zone hyperbolic spring, compare to the experimental results.
0
200
400
600
800
1000
1200
1400
1600
0 0.5 1 1.5 2
Pullout displacement (mm)
'Actu
al' d
am
pin
g c
oeff
icie
nt
(Ns/m
/m)
Figure 6.7: Damping coefficient predicted by the model with weaken zone hyperbolic
spring, compare to the experimental results (DCs-S25C test series).
Simulated Experimental
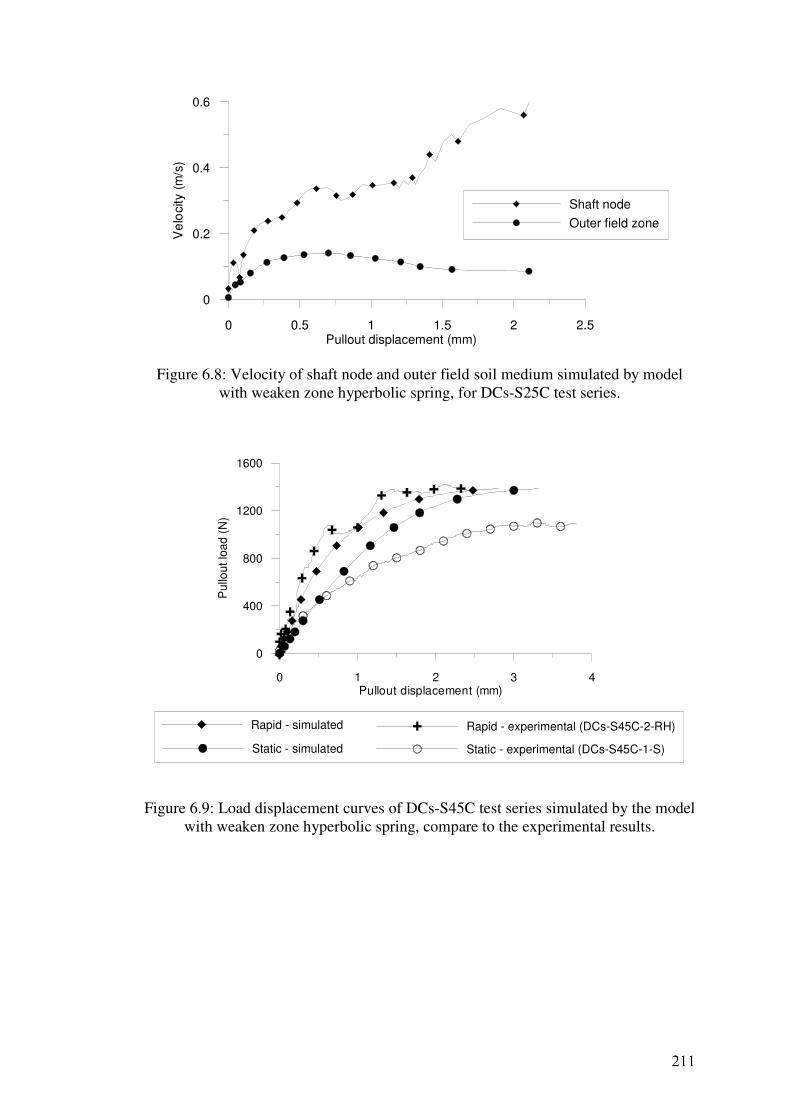
0 0.5 1 1.5 2 2.5Pullout displacement (mm)
0
0.2
0.4
0.6
Ve
locity (
m/s
)
Shaft node
Outer field zone
Figure 6.8: Velocity of shaft node and outer field soil medium simulated by model
with weaken zone hyperbolic spring, for DCs-S25C test series.
0 1 2 3 4Pullout displacement (mm)
0
400
800
1200
1600
Pullo
ut lo
ad
(N
)
Rapid - simulated Rapid - experimental (DCs-S45C-2-RH)
Static - simulated Static - experimental (DCs-S45C-1-S)
Figure 6.9: Load displacement curves of DCs-S45C test series simulated by the model
with weaken zone hyperbolic spring, compare to the experimental results.
Chapter 7: Conclusions
7.1 Introduction
The experimental works presented in this thesis aimed to provide information
on the pullout response of soil nail subjected to rapid loading condition. The
relationship between rapid pullout response and the corresponding quasi static pullout
response was studied. This information is valuable for the evaluation of the potential
of rapid pullout test as a supplementary pullout test method to assess the quasi static
pullout response of soil nails, which eventually aims to reduce the numbers of
conventional quasi static pullout test needed for a particular site and hence save the
construction time. Interpretation procedures capable of deriving the equivalent quasi
static pullout response from rapid pullout test result was also discussed at the end of
this thesis based on the results of these experiments.
7.2 Findings of this Study
Firstly, it is observed from the experimental results that the influence of
loading rate on pullout response is highly dependent on the roughness condition of
nail surface. For rough nail, although the rapid load displacement response was fairly
similar to the quasi static load displacement response in trend, the pre peak pullout
stiffness and peak pullout strength of rapid pullout test (after subtraction of inertia
effect) was stiffer and stronger than those of corresponding quasi static pullout test.
The reasons for these enhancement in rapid pullout response was identified as the
mobilization of damping resistance, which is mainly the radiation damping resistance
for these experiments with non viscous dry dense sand. ‘Actual’ damping coefficient,
defined as the difference in load between equivalent pre peak quasi static and rapid

pullout response at the same pullout displacement divided by pullout velocity (Eq.
4.3), was observed to decrease with the increase in pullout displacement. This
characteristic is most probably caused by the progressive weakening of high strain
weaken zone adjacent to nail shaft. ‘Actual’ damping coefficient was observed in
direct proportion with nail diameter and effective nail length but less influenced by
the variation in surface roughness within the vicinity of ‘rough surface’.
For smooth nail, the influence of loading rate on pullout response was very
minimal as the load displacement curves of rapid pullout test (after subtraction of
inertia effect) and quasi static pullout test of smooth nail were virtually identical. This
behaviour is logical because the shear deformation of surrounding soil mass for
smooth interface has been observed to be relatively minimal when compared to the
sliding displacement along shaft interface. Therefore, the enhancement in shear
stiffness of surrounding soil medium caused by radiation damping effect is
insignificant when compared to the total interface displacement that is dominantly
contributed by the sliding displacement along interface.
It is also observed that for rough nail, the post peak pullout response of rapid
pullout test showed drastic softening behaviour with softening rate (in terms of
pullout displacement) that was significantly higher than the softening rate of
corresponding quasi static pullout test. This phenomenon was postulated to be caused
by the variation in evolution of shear band between rapid pullout test and quasi static
pullout test. Once the post peak rapid pullout response of rough nail achieved the
residual pullout stage, abrupt ‘detachment’ of nail from surrounding soil medium had
occurred as can be seen from the sudden rise in pullout velocity. After that, the rapid
pullout response was virtually unaffected by the variation in pullout velocity, which
means that radiation damping effect virtually ceased in residual rapid pullout stage.

The residual rapid pullout strength also seemed to be comparable with the maximum
reloading pullout strength of quasi static reload test conducted after the quasi static
pullout test or high energy rapid pullout test.
For low energy rapid pullout tests with energy level lower than that required to
cause complete pullout failure of nail, the unloading point of rapid pullout response
(after subtraction of inertia effect) with maximum pullout displacement and zero
pullout velocity was coincident with the corresponding quasi static load displacement
curve. This characteristic is in accordance with the characteristic of the unloading
point of rapid compression test of pile. From this characteristic of the unloading point,
the “Modified Unloading Point Method’ capable of deriving equivalent quasi static
load displacement curve from a low energy rapid pullout test result with simple and
straightforward interpretation procedures was proposed in this thesis. The unloading –
reloading loop formed by successive low energy rapid pullout tests with increasing
pullout energy was also quite identical to the unloading - reloading loop of quasi static
pullout test, which implies that low energy rapid pullout test may also be applied to
cyclic pullout test. The quasi static pullout response is also observed to be not
adversely affected by the conduct of preceding low energy rapid pullout test. This
suggests that the use of low energy rapid pullout test as an inspection test method for
working nails is feasible.
From the results of these experiments, the variation in loading rate between
rapid and quasi static pullout tests seems does not result in significant variation of
mobilized restrained dilatancy effect. Restrained dilatancy effect is a mechanism that
leads to the enhancement of normal stress on dilative shaft interface, caused by the
restraint of relative undisturbed surrounding medium to the dilative tendency of
interface, which eventually results in enhancement of interface strength. The fairly

identical of restrained dilatancy effect in both quasi static and rapid pullout tests can
broadly be seen from the fairly similar levels of peak rapid pullout strength (after
subtraction of inertia effect) and peak quasi static pullout strength achieved by each
series of tests on rough nail. The quasi static pullout response of rough nail was highly
influenced by restrained dilatancy effect which is estimated to enhance the peak quasi
static pullout strength of rough nail by as much as 3.76 times in these experiments.
Therefore, the fairly similar levels of peak pullout strength of rapid pullout and quasi
static pullout test are only possible if the rapid pullout response was also influenced
by nearly similar degree of restrained dilatancy effect. The enhancement in pre peak
rapid pullout stiffness and peak rapid pullout strength has also been discussed in this
thesis to be unlikely caused by the variation in restrained dilatancy effect. These
improvements in rapid pullout response were observed to be in direct proportion to
nail diameter while the retrained dilatancy effect has been widely proven either
experimentally or analytically to be in inverse proportion to nail diameter.
Furthermore, the unloading point of low energy rapid pullout test which was the point
with zero damping resistance was coincident with the corresponding quasi static load
displacement curve. This suggests that the stiffness coefficient of rapid pullout test
was virtually identical to that of quasi static pullout tests. Since the quasi static pullout
response of rough nail was highly influenced by restrained dilatancy effect, the
similarity in stiffness coefficient between rapid pullout test and quasi static pullout
test implicitly indicates that similar levels of restrained dilatancy effect were
mobilized in both tests. By combining all of those observations presented above, it
would be reasonable to say that the restrained dilatancy effect mobilized in rapid
pullout test is fairly similar to that in quasi static pullout test.
In the last part of this thesis, discussion on modeling of high energy rapid
pullout response of rough nail by spring and dashpot model was presented. Generally,
it is found that although current knowledge learned from dynamic pile shaft modelling
can simulate the rapid pullout response of rough nail reasonably well, equivalent
quasi static pullout response derived from the simulation results is generally disagree
with the experimental quasi static pullout response. Shaft model with constant pre
failure stiffness is found unsuitable to describe the quasi static pullout response of
rough nail. This is mainly due to its basic characteristic of constant pre failure
stiffness which clearly differs from the highly non linear hyperbolic behaviour
observed in these experiments. This discrepancy may be approximately addressed by
inserting an additional hyperbolic spring between shaft node and outer field soil
medium. The insertion of this additional hyperbolic spring is observed to not only
reasonably simulate the non linear behaviour of pre failure pullout stiffness, but also
approximately simulate the behaviour of non linear ‘actual’ damping coefficient that
decreased with pullout displacement. However, in comparison to the experimental
results, ‘actual’ damping coefficient simulated by this model was generally under-
predicted especially when approaching the limiting shaft resistance This discrepancy
will lead to over estimation of equivalent peak static pullout strength derived from a
rapid pullout test result.
7.3 Implications on the Development of Rapid Pullout Test of Soil Nail
Generally, the use of rapid pullout test to assess quasi static pullout response
of a soil nail is feasible provided the rapid pullout test result is correctly interpreted by
a suitable interpretation method.
For test on smooth nail, the equivalent quasi static pullout response can be
reasonably equated to the rapid pullout response after subtraction of inertia effect.
This is because the influence of radiation damping resistance is found to be quite
minimal for test with smooth nail.
For test on rough nail that is not loaded beyond the peak pullout strength (low
energy rapid pullout test), the equivalent pre peak quasi static pullout response can be
acceptably derived from the rapid pullout test result by the simple and straightforward
‘Modified Unloading Point Method’ proposed in this study. This method is modified
from the ‘Unloading Point Method’ that has been widely applied to interpret the rapid
compression or lateral load test result on piles.
While, for rough nail loaded to complete pullout failure (high energy rapid
pullout test), back simulation of rapid pullout response is needed to estimate and
subtract the contribution of damping resistance. Back simulation of rapid pullout
response by spring and dashpot model was discussed in Chapter 6 of this thesis. It is
generally found that more data are needed, especially on the modeling of non linear
‘actual’ damping coefficient observed in these experiments, before spring and dashpot
model can be used conveniently as a routine interpretation procedure for high energy
rapid pullout test results of rough nail. The use of the ‘Modified Unloading Point
Method’ on high energy rapid pullout test result is impossible due to the absence of
point with zero velocity along the pre peak rapid pullout response.
The results on rough nail of this study can be applied to in-situ grouted nail
and ribbed driven nail. The failure of these rough nails has been observed to occur
within the soil mass adjacent to nail shaft (Schlosser and Elias, 1978 and Jewell,
1980), which is in accordance to the behaviour of rough nail used in this study. It is
because the dominant surface asperities of these rough nail is usually much coarser

than the mean particle size of surrounding soil medium. Driven nail with smooth
material surface may behave as ‘rough’ nail or ‘smooth’ nail depends on the mean
particle size of surrounding soil medium (the crushed particle if particle crushing
effect caused by installation process is significant). The nail will behave as ‘rough
nail’ if mean particle size of surrounding soil medium is small in relative to asperities
of nail surface to results in normalized roughness Rn > Rncri
, with Rncrit
the critical
normalized roughness. On the other hand, the nail will behave as ‘smooth nail’ if
mean particle size of surrounding soil medium is large in relative to asperities of nail
surface to results in normalized roughness Rn < Rncri
. The categorization of roughness
condition by normalized roughness Rn was discussed in detailed in Section 2.6.2.2 of
this thesis.
In future field scale test, rapid pullout test can be designed to be a ‘high
energy’ test or ‘low energy’ test depends on the purpose of the test, by setting the
input energy higher or lower than the threshold energy needed to attained the
estimated peak rapid pullout strength. The threshold energy can be approximately
estimated by energy principle as 1/2Pspu
p(s), with Ps
p the estimated peak rapid pullout
strength and up(s)
the pullout displacement required to achieve the peak rapid pullout
strength. The correctness of this calculated threshold energy depends a lot on the
accuracy of estimated Psp and u
p(s). However, wrong estimation of test type does not
affect the usefulness of the test result. If a ‘low energy’ test is planned but the test
result turned out to be a ‘high energy’ test, this means the pullout capacity of the nail
has been overestimated. In another way, if a planned ‘high energy’ test ends up to be a
‘low energy’ test means that the pullout capacity of the nail has been underestimated.
Both cases will still provide valuable information on the pullout response of tested
nail.
It has to be stressed that the observations and conclusions made in this thesis
are only for nails embedded in soil with minimal viscosity effect, such as sandy soil or
low plasticity residual soil. For nails embedded in high plasticity clayey soil, the
contribution of viscous damping effects should be taken into account. One possible
way to cope with this problem is to incorporate the non linear equation proposed by
Wong (1988) that correlates the ultimate dynamic shaft resistance with velocity.
Besides, nails considered in these experiments were placed horizontally. In
practice, nails will be installed at certain angle, normally < 20o to the horizontal. This
small angle is anticipated to slightly increase the inertia effect in rapid pullout
response. Further research is needed on this subject.
Although the tensile impulse load applied to conduct the rapid pullout test of
these experiments was generated by the spring based impulse hammer, the tensile
impulse load can be generated by any mechanism as long as the generated tensile
impulse load is smooth and has relative wave length larger than 10 (Holeyman, 1992)
to achieve rapid loading condition with minimal stress wave propagation influence.
The problem of ‘rebound’ must also be taken into account in the design of impulse
hammer to ensure that only one impulse load is sent to the nail in every test.
Otherwise, the interpretation of result will become very complicated if multiple
impulse loads are sent into the nail.
7.4 Recommendations for Future Research
Several areas of future research are recommended as below:
1. Study the rapid pullout response of nail embedded in other soil medium such as
residual soil or clayey soil. The viscosity effect of clayey soil is postulated to
enhance the contribution of damping resistance even for test with smooth nail.

2. Study the effect of soil nail’s extensibility on rapid pullout response, especially on
the mobilization characteristic of damping effect. This study also has to aim for
determination of threshold boundary where rigid body assumption is valid.
3. Study the rapid pullout response of nail installed at an angle to the horizontal.
Inertia effect in rapid pullout response of the non horizontal nail is anticipated to
be higher.
4. Physical observation on the behaviour of surrounding soil medium in rapid pullout
test by X-ray or CT scan technique. These observations are helpful to validate the
explanation and postulation that have been made in this thesis for the rapid pullout
response of soil nail.
5. Study the analytical relationship between ‘actual’ damping coefficient and tangent
stiffness of corresponding non linear load displacement curve. This may be done
by adopting the analytical solution of radiation damping for inhomogeneous soil
medium reported by El-Naggar (2000) in the frequency domain.
6. Development and conduct of field scale rapid pullout test. The importance of this
study is to investigate and verify the characteristics of rapid pullout response of
nail embedded in natural ground condition that is much more complex than the
‘controlled’ ground of laboratory test.
References
Alawneh, A.S., Malkawi, A.I.H. and Al-Deeky, H. (1999), “Tension Tests on Smooth
and Rough Model Piles in Dry Sand”, Canadian Geotechnical Journal, vol. 36,
pp. 746-753.
Altae, A. and Fellenius, B.H. (1994), “Physical Modeling in Sand”, Canadian
Geotechnical Journal, vol. 31, pp. 420-431.
Asai, Y., Matsumoto, T., Hayashi, T. and Futatsuka, Y. (1997), “Behavior of Cast In-
situ Concrete Pile during Statnamic Load Test with Excessive Loading”, Proc.
of Regional Conference in Geotechnical Engineering (GEOTROPIKA), Johor
Bahru, Malaysia, pp. 383-394.
BenAmar, A., Lepert, P., Levacher, D. and Boisard, P. (1991), “Shaft Resistance
during Driving in Clay from Laboratory tests”, Proc. of 2nd
Int. Conf. on Recent
Advances in Geotechnical Earthquake Engineering and Soil Dynamics, St.
Louis, pp. 291-297.
Bermingham, P., Ealy, C.D. and White, J.K. (1994), “A Comparison of Statnamic and
Static Field Tests at Seven FHWA sites”, Proc. of Int. Conf. on Design and
Construction of Deep Foundation, Orlando, pp. 616-630.
Bermingham, P., Mullins, G. and Stokes, M. (2004), “Mobilization of capacity
During Rapid Axial Load testing”, Proc. of 7th
Int. Conf. on Application of
Stress Wave Theory on Piles, Kuala Lumpur, Malaysia, pp. 125 – 131.
Cartier, G. and Gigan, J.P. (1983), “Experiments and Observations on Soil Nailing
Structures”, Proc. of 8th
European Conference on Soil Mechanics and
Foundation Engineering, Helsinki, pp. 473-476.
221
Casagrande, A. and Shannon, W.L. (1949), “Strength of Soils Under Dynamic Loads”.
Trans. ASCE, Vol. 114, pp. 755-772.
Chang, D.T.T., Ting, Y.H. and Chang, J.Y. (2000). “Factors Influencing Georids
Pullout Tests”, Proc. 2nd
Asian Geosynthetics Conference, Kuala Lumpur,
Malaysia, pp. 285-290.
Chin, V.B.L. and Seidel, J.P. (2004), “An Experimental Study into the Viscous
Damping Response of Pile – Clay Interfaces”, Proc. of 7th
Int. Conf. on the
Application of Stress Wave Theory on Piles, Kuala Lumpur, pp. 435-446.
Chow, W.M. (1999), “Statnamic Load Testing on Piles”, Master Thesis, Department
of Civil Engineering, National University of Singapore.
Coyle, H.M. and Gibson, G.C. (1970), “Empirical Damping Constant for Sand and
Clays”. J. of Soil Mechanics and Foundation Division, vol. 96, pp. 949-965.
Dayal. U. and Allen, J.H. (1975), “The Effects of Penetration Rate on the Strength of
Remolded Clay and Sand Samples”, Canadian Geotechnical Journal, Vvol. 12,
pp. 336-348.
Deeks, A.J. and Randolph, M.F. (1992), “Accuracy in Numerical Analysis of Pile
Driving Dynamics”, Proc. of 4th
Int. Conf. Application of Stress Wave Theory to
Piles, the Hague, the Netherlands, pp. 85-90.
Duncan, J.M. and Chang, C.Y. (1970), “Non Linear Analysis of Stress and Strain in
Soils”, J. of Soil Mechanics and Foundations Division, ASCE, vol. 96, No. SM5,
pp. 1629-1653.
Ealy, C.D. and Justason, M.D. (2000), “Statnamic and Static Load Testing of a Model
Pile Group in Sand”, Proc. of 2nd
Int. Statnamic Seminar, Tokyo, Japan, pp.
169-178.
Ekstrom, J. (1989), “Behaviour of Piles with Enlarged Tip in Non-Cohesive Soil”.
PhD Thesis, Department of Geotechnical Engineering, Chalmas University of
Technology, Sweden.
El-Naggar, M.H. and Novak, M. (1992), “Analytical Model for an Innovative Pile
Test”, Canadian Geotechnical Journal, vol. 29, pp. 569-579.
El-Naggar, M.H. and Novak, M. (1994), “Non Linear Model for Dynamic Axial pile
Response”, J. of Geotechnical Engineering, ASCE, vol. 120, pp. 308-329.
El-Naggar, M.H. (2000), “Vertical and Torsional Soil Reactions for Radially
Inhomogeneous Soil Layer”, J. of Structural Engineering and Mechanics, vol. 10,
No. 4, pp. 299-312.
Evgin, E. and Fakharian, K (1996), “Effect of Stress Path on the Behaviour of Sand –
Steel Interfaces”, Canadian Geotechnical Journal, vol. 33, pp. 853-865.
Farrag, K., Acar, Y.B. and Juran, I. (1993), “Pullout Resistance of Geogrid
Reinforcement”, Geotextiles and Geomembranes, vol. 12, pp. 133-159.
Franzen, G. (1998), “Soil Nailing - A Laboratory and Field Study of Pullout
Capacity”, Doctoral Thesis, Department of geotechnical Engineering, Chalmers
University of Technology, Sweden.
French National Research Project Clouterre (1991), “Recommendations Clouterre”,
Presses de l’école Nationale des Ponts et Chaussées, Paris.
Foray, R., Balachowski, L. and Rault, G. (1998), “Scale effect in Shaft Friction due to
the Localisation of Deformation”, Proc. of Int. Conf. of Centrifuge 98, Tokyo,
pp. 211-216.
Fretti, C., Presti, D.C.F.L. and Pedroni, S. (1995), “A Pluvial Deposition Method to
reconstitute Well Graded Sand Specimens”, Geotechnical Testing Journal, vol.
18, no. 2, pp. 292-298.
Gassler, G. (1990), “State of the Art: In-Situ Technique of Reinforced Soil”, Proc. of
Int. Reinforced Soil Conference, Glasgow, United Kingdom, pp. 185-196.
Guilloux, A., Schlosser, F. and Long, N.T. (1979), “Laboratory Investigation of Sand-
Strips Friction”, Proc. of Int. Conf. of Soil Reinforcement, Paris, pp. 35-40.
Gurung, N., Iwao, Y. and Madhav, M.R. (1999), “Pullout Test Model for Extensible
Reinforcement”, Int. J. of Numerical and Analytical Methods in Geomechanics,
vol. 23, pp. 1337-1348.
Han, Y.C. and Sabin, G.C.W., (1995), “Impedances for Radially Inhomogeneous
Viscoelastic Soil Media”, J. of Engineering Mechanics, ASCE, vol. 121, no. 9,
pp. 939-947.
Hardin, B.O. and Richart, F.E.Jr. (1963), “Elastic Wave Velocities in Granular Soils”,
J. of Soil Mechanics and Foundations Division, ASCE, vol. 89, no. SM1, pp.
33-65.
Hayashi, M., Matsumoto, T., Asai, Y. and Kato, K. (1998), “Sensitivity to Soil
Parameters of a Wave Matching Analysis of a Statnamic Test”, Proc. of 2nd
Int.
Statnamic Seminar, Tokyo, Japan, pp. 321-326.
Heerema, E.P. (1979), “Relationship Between Wall Friction, Displacement Velocity
and Horizontal stress in Clay and in Sand”, Ground Engineering, vol. 12, pp.
55-60.
Heymann, G. (1993), “Soil nailing System as lateral Support for Surface excavation”,
Master Thesis, University of Pretoria.
Holeyman, A.E. (1992), “Keynote lecture: Technology of Pile Dynamic Testing”,
Proc. of 4th
Int. Conf. on Application of Stress Wave Theory to Piles, The Hague,
the Netherlands, pp. 195-215.
Holeyman, A.E., Maertens, J., Huybrechts, N. and Legrand, C. (2000), “Results of an
International Pile Dynamic Testing Prediction Event”, Proc. of 6th
Int. Conf.
Application of Stress Wave Theory to Piles, September, Sao Paulo, Brazil, pp.
725-732.
Horikoshi, K., Kato, K. and Matsumoto, T. (1998), “Finite Element Analysis of
Statnamic Loading Test of Pile”, Proc. of 2nd
Int. Statnamic Seminar, Tokyo,
Japan, pp. 295-302.
Horn, H.M. and Deere, D.U. (1962), “Friction Characteristics of Minerals”,
Geotechnique, vol. 12, no. 4, pp. 319-335.
Horvath, R.G. and Kenney, T.C. (1980), “Shaft Resistance of Rock – Socketed Drilled
Piles”, Symposium on Deep Foundation, ASCE, New York, pp. 182-214.
Horvath, R.G., Bermingham, P. and Middendorp, P. (1995), “The Equilibrium Point
Method of Analysis for the Statnamic Loading Test with Supporting Case
Histories”, Proc. of the Deep Foundation Conference, Pittsburgh, pp. 18-20.
Hu, L. and Pu, J. (2004). “Testing and Modeling of Soil-Structure Interface”, J. of
Geotechnical and Geoenvironmental Engineering, vol. 130, pp. 851-859.
Hungr, O. and Morgenstern, N.R. (1984), “High Velocity Ring Shear Tests on Sand”,
Geotechnique, vol. 34, no. 3, pp. 415-421.
Ignold, T.S. (1983), “Laboratory Pullout Testing of Grid Reinforcement in Sand”,
Geotechnical Testing Journal, vol. 6, no. 3, pp. 101-111.
Jardine, R.J. and Chow , F. (1996), “New Design Methods for Offshore Piles”. MTD
Publication 96/103, Marine Technology Directorate, London.
Jewell, R.A. (1980) “Some Effects of Reinforcement on the Mechanical Behaviour of
Soils”, Doctoral Thesis, University of Cambridge.
Jewell, R.A. and Wroth, C.P. (1987), “Direct Shear Tests on Reinforced Sand”,
Geotechnique, vol. 37, no. 1, pp. 53-68.
Jewell, R.A. (1989). “Direct Shear Tests on sand”, Geotechnique, vol. 39, no. 2, pp.
309-322.
Jewell, R.A. and Pedley, M.J. (1992), “Analysis for Soil Reinforcement with Bending
Stiffness”, J. of Geotechnical Engineering, ASCE. vol. 118, no. 10, pp. 1505-
1527.
Johnston, R.S. and Romstad, K.M. (1989), “Dilation and Boundary Effects in Large
Scale Pull-out tests”, Proc. of 12th
Int. Conf. on Soil Mechanics and Foundations
Engineering, Rio de Janeiro, Vol. 2, 1263-1266.
Juran, I., Baudrand, G., Farrag, K. and Elias, V. (1990), “Kinematical Limit Analysis
for Design of Soil Nailed Structures”, J. of Geotechnical Engineering ASCE, vol.
116, pp. 54-72.
Kato, K., Horikoshi, K. and Matsumoto, T. (1998), ‘Application of Single Mass Model
to Statnamic Loading Test of Pile”, Proc. of 2nd
Int. Statnamic Seminar, Tokyo,
Japan, pp. 273-278.
Kenny, M.J. and Kawai, Y. (1996), “The Effect of Bending Stiffness of Soil Nails on
Wall Deformation”, Proc. of Earth Reinforcement, Kyusu, Japan, pp. 771-779.
Khaled, M.S.U. (2002), “A Refined Soil Model for Pile Capacity Prediction from
Dynamic Load Test”, Master Thesis, Department of Civil Engineering, National
University of Singapore.
Klingberg, D.J. and Wong, K.Y. (1996), “Dynamic Tension Waves and Their Use for
the Determination of the Uplift Capacity of Piles using Stress Wave Analysis”,
Proc. of the 5th
Int. Conf. on Application of Stress Wave Theory to Piles, Florida,
pp. 290-298..
Kusakabe , O and Matsumoto, T. (1995), “Statnamic Tests on Shonan Test Program
with Review of Signal Interpretation”, Proc. of 1st Statnamic Seminar, Canada,
pp. 105-114.
Lee, S.L., Chow, Y.K., Karunaratne, G.P., Wong, K.Y. (1988), “Rational Wave
Equation Model for Pile Driving Analysis”, J. of geotechnical Engineering,
ASCE, vol. 114(3), pp. 306-325.
Lehane, B.M., Gaudin, C. and Schneider, J.A. (2005), “Scale Effect on Tension
Capacity for Rough Piles Buried in Dense Sand”, Geotechnique, vol. 55, no. 10,
pp. 709-719.
Lenke, L.R., Ronald, Y.S. and Ko, H.Y. (1991), “Boundary Effects in Modeling of
Foundations subjected to Vertical Excitation”, Proc. of Centrifuge 91, the
Netherlands, pp. 473-480.
Leprt, P., Corte, J.F., Goulois, A. and Meunier, J. (1988), “Shaft Resistance during
Driving, for Sand, from Laboratory tests”, Proc. of 3rd
Int. Conf. on the
application of Stress Wave Theory to Piles, Ottawa, pp. 431-440.
Litkouhi, S. and Poskiti, T.J. (1980), “Damping Constant for Pile Driveability
Calculation”, Geotechnique, vol. 30, no. 1, pp. 77-86.
Luo, S.Q. (2001), “Soil Nail Behaviour in Cohesionless Soil”, Doctoral Thesis,
Department of Civil Engineering, National University of Singapore.
Lysmer, J. and Richart, F.E. (1966), “Dynamic Response of Footing to Vertical
Loading”, J. of Soil Mechanics and Foundation Division, ASCE, vol. 92, pp. 65-
91.
Martel, D.W. and Klingberg, D.J. (2004), “Comparison of Dynamic and Static Testing
Methods for Tension Capacity of reinforced Concrete Piles”, Proc. of 7th
Int.
Conf. on Application of Stress Wave Theory to Piles’, Kuala Lumpur, Malaysia,
pp. 513-518.
Matsumoto, T., Tsuzuki, M. and Michi, Y. (1994), “Comparative Study of Static
Loading Test and Statnamic Test on a Steel Pipe Pile Driven in Soft Rock”, Proc.
of 5th
Int. Conf.e on Piling and Deep Foundation, Bruges, pp. 5.3.1-5.3.7.
Matsumoto, T., Michi, Y. and Hayashi, M. (1997), “Reliability of Dynamic Load
Testing on Steel Pipe Piles in Soft Rock”, Proc. of 14th
ICSMFE, Hamburg, pp.
1185-1188.
Matsumoto, T. (1998), “A FEM Analysis of a Statnamic Test on Open-ended Steel
Pipe Pile”, Proc. of 2nd
Int. Statnamic Seminar, Tokyo, Japan, pp. 287-294.
Matsumoto, T., Wakisaka, T., Wang, F.W., Takeda, K. and Yabuuchi, N. (2004),
“Development of a Rapid Pile Load Test Method Using a Falling Mass Attached
with Spring and Damper”, Proc. of Int. Conf. on Application of Stress Wave
Theory to Piles, Kuala Lumpur, Malaysia, pp. 351 – 358.
Middendorp, P. and Van Weele, A.F., (1986), “Application of Characteristic Stress
Wave Method in Offshore Practice”, Proc. 3rd
Int. Conf. on Numerical Methods
in Offshore Piling, Nantes, pp. 6-18.
Middendorp, P., Bermingham, P. and Kuiper, B. (1992), “Statnamic Load Testing of
Foundation Piles”, Proc. of 4th
Int. Conf. on Application of Stress Wave Theory
to Piles, the Hague, the Netherlands, pp. 581-588.
Middendorp, P. and Biefield, M.W. (1995), “Statnamic Load Testing and the
Influence of Stress Wave Phenomena”, Proc. of 1st Int. Statnamic Seminar,
Vancouver, Canada, pp. 207-220.
Milligan, G.W.E. and Tei, K. (1998), “The Pullout Resistance of Model Soil Nails”,
Soils and Foundations, vol. 38, no. 2, pp. 179-190.
Mitwally, H. and Novak, M. (1988), “Pile Driving Analysis Using Shaft Models and
FEM”, Proc. 3rd
Int. Conf. on Application of Stress Wave Equation Theory to
Piles, Ottawa, Ontario, pp. 455-466.
Miura, S. and Toki, S. (1982), “A Sample Preparation Method and Its Effect on Static
and Cyclic Deformation-Strength Properties of Sand”, Soils and Foundations,
vol. 22, no. 1 pp. 61-77.
Nishimura, S., Shibata, A., Yamashita, K., Kita, N., Ogita, N. and Ishida, M. (1998),
“One Dimensional Stress Wave Simulation Study of Statnamic Load Test”, Proc.
of 2nd
Statnamic seminar, Tokyo, Japan, pp. 337-344.
Nogami, T. and Chen, H.L. (1995), “Prediction of Non Linear Pile Foundation
response in Vertical Vibration”. Proc. of 3rd
Conference on Recent Advances in
Geotechnical Earthquake Engineering and Soil Dynamics, vol. 1, St. Louis, pp.
401-407.
Novak, M., Nogami, T. and Aboul-Ella, F. (1978), “Dynamic Soil Reactions for Plane
Strain Case”, J. of Engineering Mechanics Division, vol. 104, pp. 953-959.
Novak, M. and Sheta, M. (1980), “Approximate Approach to Contact Effects of Piles”,
Proc. of Session on Dynamic Response of Pile Foundation: Analytical Aspects,
ASCE, Hollywood, pp. 53-79.
Ochiai, H., Kusakabe, O., Sumi, K., Matsumoto, T. and Nishimura, S. (1996),
“Statnamic Test on Offshore Steel Pipe Piles for Foundations of Assess Bridge
for New Kita-Kyushu Airport Island”, Proc. of 5th
Int. Conf. on Application of
Stress Wave Theory to Piles, Orlando, Canada, pp. 997-1014.
Oda, M. and Kazama, H. (1998), “Microstructure of Shear Bands and its relation to
the Mechanism of Dilatancy and Failure of Dense Granular Sand”,
Geotechnique, vol. 48, no. 4, pp. 483-494.
Otani, J., Hirai, T., Miyamoto, K. and Mukunoki, T. (2001), “Visualization of
Interaction behaviour between Soil and reinforcement using X-ray CT”, Proc. of
the Landmarks in Earth Reinforcement, IS KYUSHU, Fukuoka, pp. 117-120.
Ovensen (1979), “Contribution to Discussion on The Use of Physical Models in
Design”, Proc. of 7th
European Conference on soil Mechanics and Foundation
Engineering, Brighton, pp. 319-323.
Palmeira, E.M. (1987), “The Study of Soil – Reinforcement Interaction by means of
Large scale Laboratory Tests”, Doctoral Thesis, Magdalen College, University
of Oxford.
Palmeira, E.M. and Milligan, G.W.E. (1989), “Scale and Other factors Affecting the
Results of Pullout Tests of Grids Buried in Sand”, Geotechnique, vol. 39, no. 3,
pp. 511-524.
Pedley, M.J. (1991), “The Performance of Soil Reinforcement in Bending and Shear”,
Doctoral Thesis, Magdalen College, University of Oxford.
Potts, D.M., Dounias, G.T. andVaughan, P.R. (1987), “Finite element Analysis of
Direct Shear Box Test”, Geotechnique, vol. 37, no.1, pp. 11-23.
Poulos, H.G. (1998), “Pile Testing – From the Designer’s Viewpoint”, Proc. of 2nd
Statnamic seminar, Tokyo, Japan, pp. 3-22.
Potyondy, J.G. (1961), “Skin Friction Between Various Soils and Construction
Materials”, Geotechnique, vol. 11, pp. 339-353.
Presti, D.C.F.L., Berardi, R., Pedroni, S. and Crippa, V. (1993), “A New Travelling
Sand Pluviator to Reconstitute Specimens of Well Graded Silty Sands”,
Geotechnical Testing Journal, vol. 16, no. 1, pp. 18-26.
Randolph, M.F. and Wroth, P. (1978), “Analysis of Deformation of Vertically Loaded
piles”, J. Geotechnical Engineering division, vol. 104, no. GT12, pp. 1465-1488.
Randolph, M.F. and Simon, H.A. (1986), “An Improved Soil Model for One
Dimensional Pile Driving Analysis”, Proc. of the 3rd
Int. Conf. on Numerical
Methods in Offshore Piling, Nantes, pp. 1-17.

Randolph, M.F. (1991), “Analysis of the Dynamic of Pile Driving”, Development in
Soil Mechanics IV: Advanced Geotechnical Analysis, Elsevier, Amsterdam, pp.
223-271.
Randolph, M.F. and Deeks, A.J. (1992), “Keynote Lecture: Dynamic and Static Soil
Models for axial Pile Response”, Proc. of Int. Conf. Application of Stress Wave
Theory to Piles, the Hague, the Netherlands, pp. 3-14.
Randolph, M.F. (2000), “Keynote Lecture: Pile soil Interaction for dynamic and static
Loading”, Proc. of 6th
Int. Conf. Application of Stress Wave Theory to Piles,
September, Sao Paulo, Brazil, pp. 3-11.
Randolph, M.F. and House, A.R. (2001), “The Complementary Roles of Physical and
Computational Modeling”, Int. J. of Physical Modeling in Geotechnics, vol. 1,
pp. 1-8.
Rausche, F., Goble, G., and Moses, F. (1972), “Soil Resistance Prediction from Pile
Dynamics”, J. of Soil Mechanics and Foundations Division, ASCE, vol. 98, pp.
917-937.
Rausche, F., Likins, G. and Shen, R.K. (1992), “Pile Integrity Testing and Analysis”,
Proc. of the 4th
Int. Conf. on the Application of Stress Wave Theory to Piles’,
The Hague, Netherlands, pp. 137-142.
Rausche, F., Goble, G., and Likins, G. (1994), “A Rational and Usable Wave
Equation Soil Model Based on Field Tests Correlation”, Proc. Int. Conf. on
Design and Construction of Deep Foundation, USA, pp. 1118-1132.
Schimming, B.B., Haas, H.J. and Saxe, H.C. (1966), “Study of Dynamic and Static
Failure Envelopes”, J. of Soil Mechanics and Foundations Division, ASCE, vol.
92, SM2, pp. 105-124.
Schlosser, F. and Elias, V (1978), “Friction in Reinforced Earth”, Proc. of
Symposium on Earth Reinforcement, ASCE, 1978, Pittsburgh. Pp. 735-761.
Schlosser, F. (1982), “Behavior and Design of Soil Nailing”, Proc. of Symposium on
Recent Development in Ground Improvement Techniques, Bangkok, pp. 399-
413.
Shen, C.K., Bang, S., Hermann, M. and Romstad, K.L. (1978) “A Reinforced Lateral
Earth Support System”. Proc. of Symp. on Earth Reinforcement, ASCE,
Pittsburgh, pp. 764-793.
Smith, E.A.L. (1960), “Pile Driving Analysis by the Wave Equation”, J. of Soil
Mechanics and Foundation Engineering Division, ASCE, vol. 86, pp. 35-61.
Smith, I.M. and Chow, Y.K. (1982), “Three Dimensional Analysis of Pile
Drivability”, Proc. 2nd
Int. Conf. on Numerical Methods in Offshore Piling,
Austin, pp. 1-20.
Sobolevsky, D.Y. (1995), “Strength of Dilating Soil and Load – Holding Capacity of
Deep Foundation – Introduction to Theory and Practical Application”,
Rotterdam: A.A.Balkema.
Stewart, J.P. and Kulhawy, F.H. (1981), “Experimental Investigation of the Uplift
Capacity of Drilled Shaft Foundation in Cohesionless Soil”, Geotechnical
engineering Report 81-2, Cornell University.
Stocker, M.F., Korber, G.W., Gassler, G. and Gudehus, G. (1979), “Soil Nailing”,
Proc. of Int. Conference on Soil Reinforcement, Paris, France, pp. 469-474.
Tei, K. (1993), “A Study of Soil nailing in Sand”, Doctoral Thesis, Magdalen College,
University of Oxford.
Turner, J.P. and Kulhawy, F.H. (1994), “Physical Modeling of Drilled Shaft
Resistance in Sand”, Geotechnical Testing Journal, vol. 17, pp. 282-289.
Uesugi, M. and Kishida, H. (1986a), “Influential Factors of Friction Between Steel
and Dry Sand”, Soils and Foundations, vol. 26, no. 2, pp. 33-46.
Uesugi, M. and Kishida, H. (1986b), “Friction resistance at Yield Between Dry sand
and Mild Steel”, Soils and Foundations, vol. 26, no. 4, pp. 139-149.
Uesugi, M., Kishida, H. and Tsubakihara, Y. (1988), “Behaviour of Sand particles in
Sand – Steel Friction”, Soils and Foundations, vol. 28, no. 1, pp. 107-118.
Whitman, R.V. and Healy, K.A. (1962), “Shear Strength of sands During Rapid
Loadings”, J. of Soil Mechanics and Foundations Division, ASCE, vol. 88, no.
SM2, pp. 99-133.
Wong, K.Y. (1988), “A Rational wave Equation Model for pile Driving Analysis”,
Doctoral Thesis. Department of Civil Engineering, National University of
Singapore.
Yoshimi, Y. and Kishida, T. (1981), “Friction Between sand and Metal Surface”,
Proc. of 10th
International Conference of Soil Mechanics and Foundation
Engineering, Vol. 1, pp. 831-834.

Appendix A: Results of High Energy Rapid Pullout Tests in Time
Domain
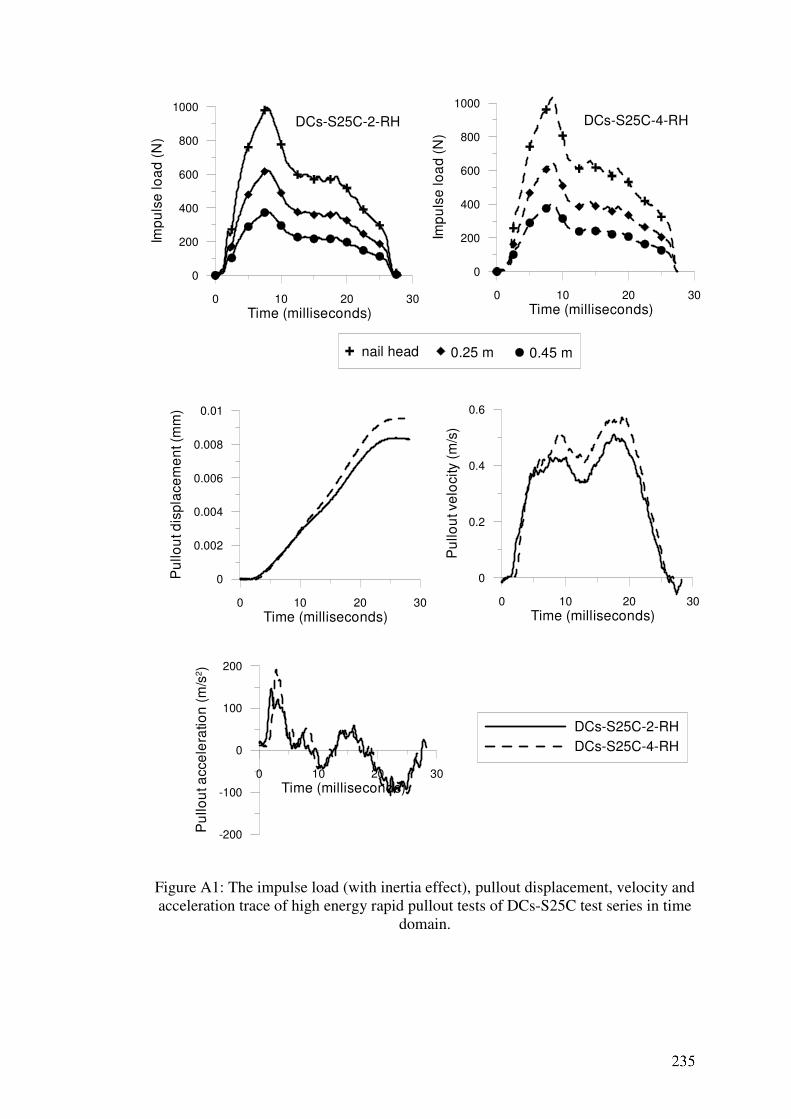
0 10 20 30
Time (milliseconds)
0
200
400
600
800
1000
Imp
uls
e lo
ad
(N
)
0 10 20 30
Time (milliseconds)
0
0.002
0.004
0.006
0.008
0.01
Pu
llo
ut d
isp
lace
me
nt (m
m)
0 10 20 30
Time (milliseconds)
0
0.2
0.4
0.6
Pu
llo
ut v
elo
city
(m
/s)
0 10 20 30
Time (milliseconds)
-200
-100
0
100
200
Pu
llo
ut a
cce
lera
tio
n (
m/s
2)
DCs-S25C-2-RH
DCs-S25C-4-RH
0 10 20 30
Time (milliseconds)
0
200
400
600
800
1000
Imp
uls
e lo
ad
(N
)
nail head 0.25 m 0.45 m
DCs-S25C-2-RH DCs-S25C-4-RH
Figure A1: The impulse load (with inertia effect), pullout displacement, velocity and
acceleration trace of high energy rapid pullout tests of DCs-S25C test series in time
domain.
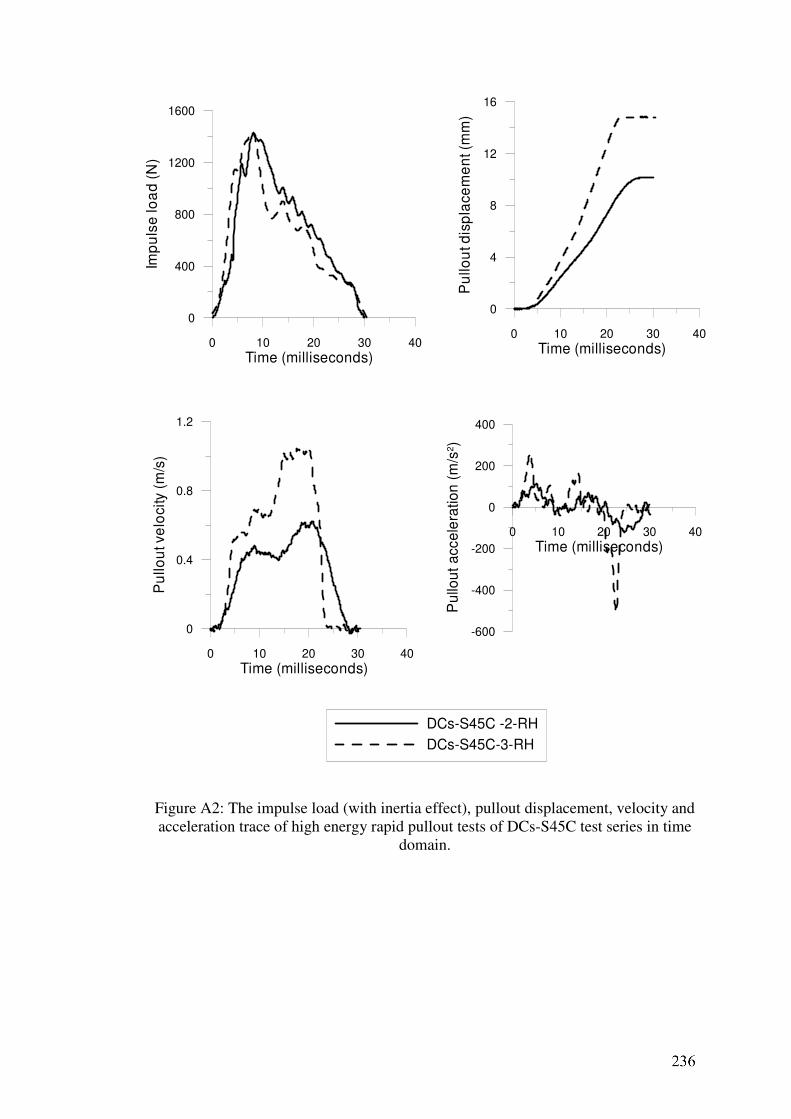
0 10 20 30 40
Time (milliseconds)
0
400
800
1200
1600
Imp
uls
e lo
ad
(N
)
0 10 20 30 40
Time (milliseconds)
0
4
8
12
16
Pu
llo
ut d
isp
lace
me
nt (m
m)
0 10 20 30 40
Time (milliseconds)
0
0.4
0.8
1.2
Pu
llo
ut ve
loci
ty (
m/s
)
0 10 20 30 40
Time (milliseconds)
-600
-400
-200
0
200
400
Pu
llou
t a
cce
lera
tion
(m
/s2)
DCs-S45C -2-RH
DCs-S45C-3-RH
Figure A2: The impulse load (with inertia effect), pullout displacement, velocity and
acceleration trace of high energy rapid pullout tests of DCs-S45C test series in time
domain.
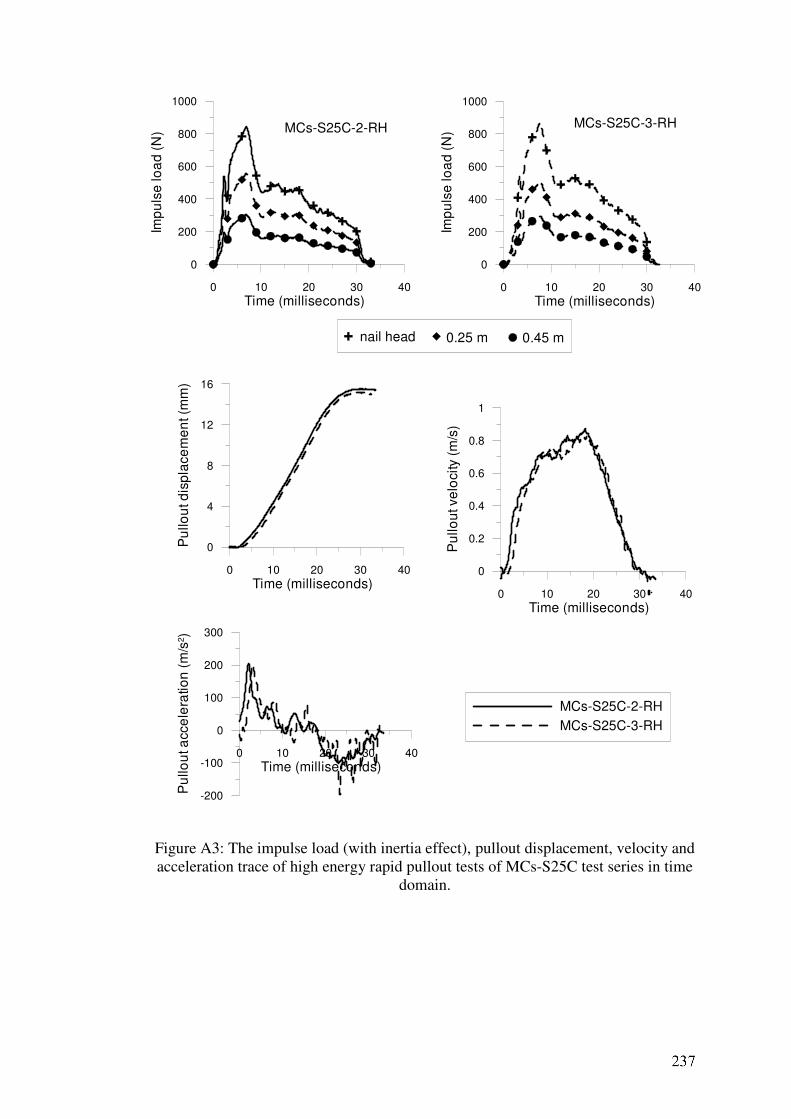
0 10 20 30 40
Time (milliseconds)
0
200
400
600
800
1000
Imp
uls
e lo
ad
(N
)
0 10 20 30 40
Time (milliseconds)
0
4
8
12
16
Pu
llou
t d
isp
lace
me
nt (m
m)
0 10 20 30 40
Time (milliseconds)
0
0.2
0.4
0.6
0.8
1
Pu
llo
ut ve
loci
ty (
m/s
)
0 10 20 30 40
Time (milliseconds)
-200
-100
0
100
200
300
Pu
llou
t acc
ele
ratio
n (
m/s
2)
MCs-S25C-2-RH
MCs-S25C-3-RH
0 10 20 30 40
Time (milliseconds)
0
200
400
600
800
1000
Imp
uls
e lo
ad
(N
)
nail head 0.25 m 0.45 m
MCs-S25C-2-RH MCs-S25C-3-RH
Figure A3: The impulse load (with inertia effect), pullout displacement, velocity and
acceleration trace of high energy rapid pullout tests of MCs-S25C test series in time
domain.
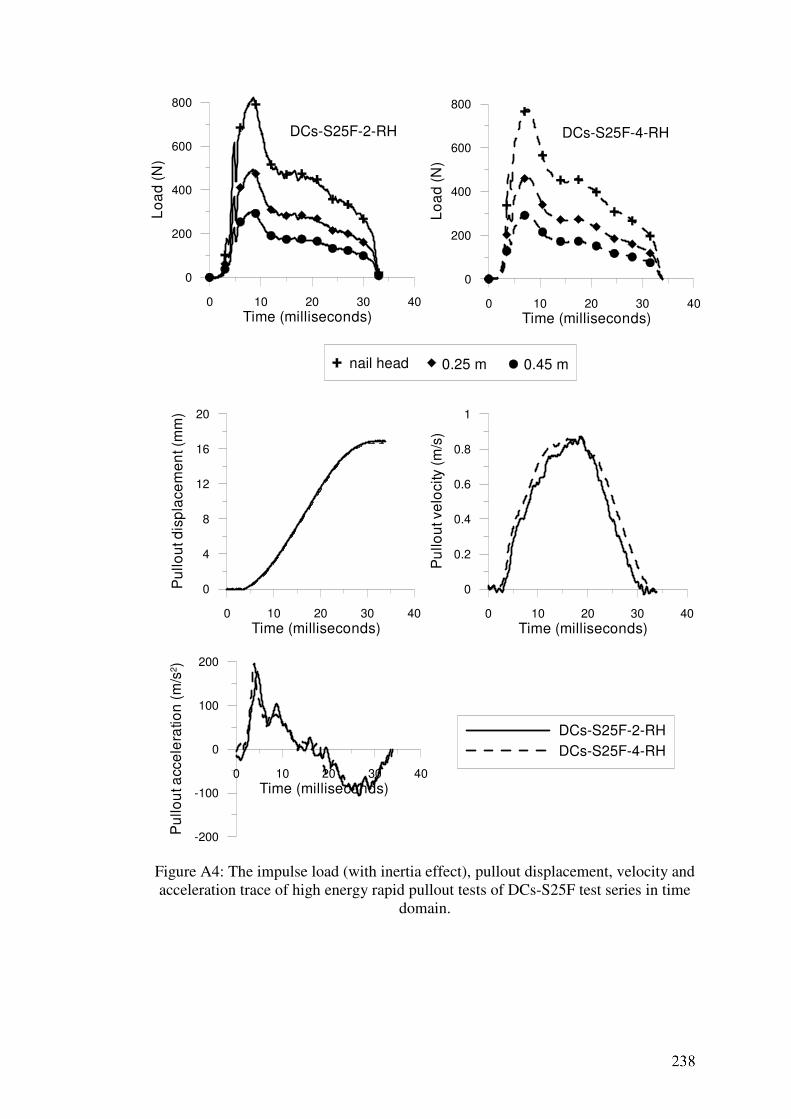
0 10 20 30 40
Time (milliseconds)
0
200
400
600
800
Lo
ad
(N
)
0 10 20 30 40
Time (milliseconds)
0
4
8
12
16
20
Pu
llo
ut d
isp
lace
me
nt (m
m)
0 10 20 30 40
Time (milliseconds)
0
0.2
0.4
0.6
0.8
1
Pu
llou
t ve
locity
(m
/s)
0 10 20 30 40
Time (milliseconds)
-200
-100
0
100
200
Pu
llo
ut a
cce
lera
tion
(m
/s2)
DCs-S25F-2-RH
DCs-S25F-4-RH
0 10 20 30 40
Time (milliseconds)
0
200
400
600
800
Lo
ad
(N
)
nail head 0.25 m 0.45 m
DCs-S25F-2-RH DCs-S25F-4-RH
Figure A4: The impulse load (with inertia effect), pullout displacement, velocity and
acceleration trace of high energy rapid pullout tests of DCs-S25F test series in time
domain.
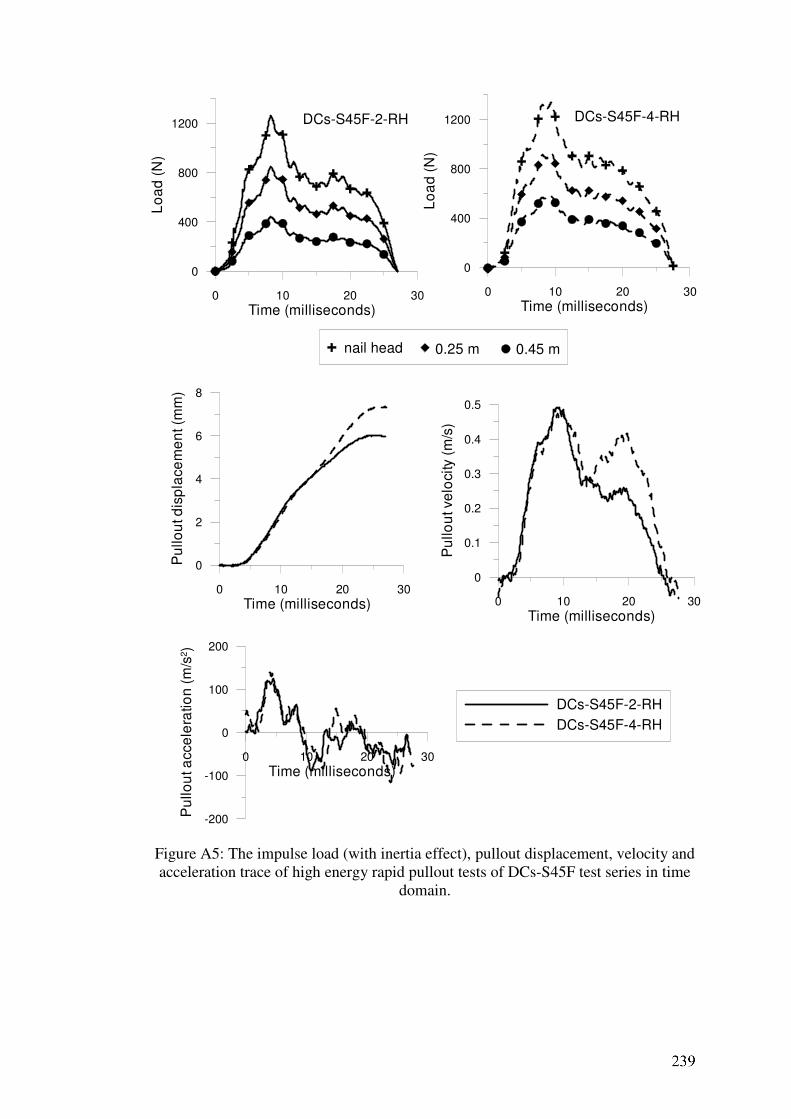
0 10 20 30
Time (milliseconds)
0
400
800
1200
Lo
ad
(N
)
0 10 20 30
Time (milliseconds)
0
2
4
6
8
Pu
llo
ut d
isp
lace
me
nt (m
m)
0 10 20 30
Time (milliseconds)
0
0.1
0.2
0.3
0.4
0.5
Pu
llo
ut ve
loci
ty (
m/s
)
0 10 20 30
Time (milliseconds)
-200
-100
0
100
200
Pu
llo
ut a
cce
lera
tio
n (
m/s
2)
DCs-S45F-2-RH
DCs-S45F-4-RH
0 10 20 30
Time (milliseconds)
0
400
800
1200
Lo
ad
(N
)
nail head 0.25 m 0.45 m
DCs-S45F-2-RH DCs-S45F-4-RH
Figure A5: The impulse load (with inertia effect), pullout displacement, velocity and
acceleration trace of high energy rapid pullout tests of DCs-S45F test series in time
domain.
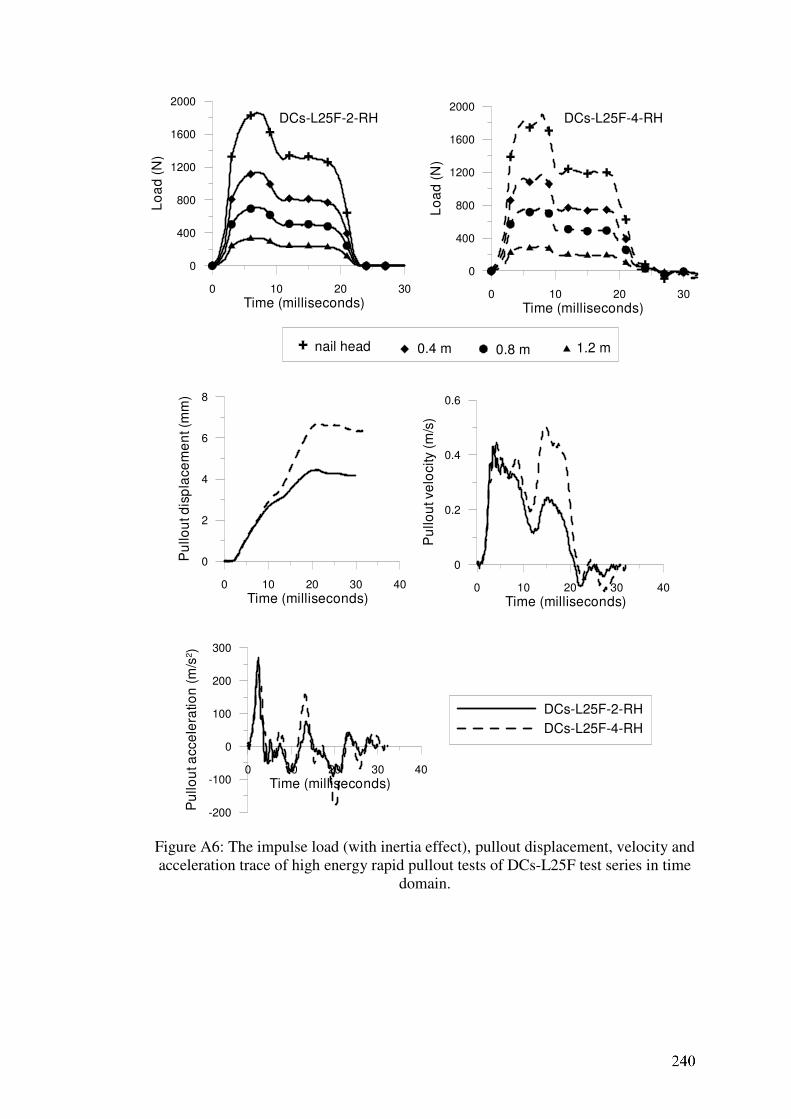
0 10 20 30
Time (milliseconds)
0
400
800
1200
1600
2000
Lo
ad
(N
)
0 10 20 30 40
Time (milliseconds)
0
2
4
6
8
Pu
llo
ut d
isp
lace
me
nt (m
m)
0 10 20 30 40
Time (milliseconds)
0
0.2
0.4
0.6
Pu
llo
ut ve
locity
(m/s
)
0 10 20 30 40
Time (milliseconds)
-200
-100
0
100
200
300
Pu
llo
ut a
cce
lera
tio
n (
m/s
2)
DCs-L25F-2-RH
DCs-L25F-4-RH
0 10 20 30
Time (milliseconds)
0
400
800
1200
1600
2000
Lo
ad
(N
)
nail head 0.4 m 0.8 m 1.2 m
DCs-L25F-2-RH DCs-L25F-4-RH
Figure A6: The impulse load (with inertia effect), pullout displacement, velocity and
acceleration trace of high energy rapid pullout tests of DCs-L25F test series in time
domain.
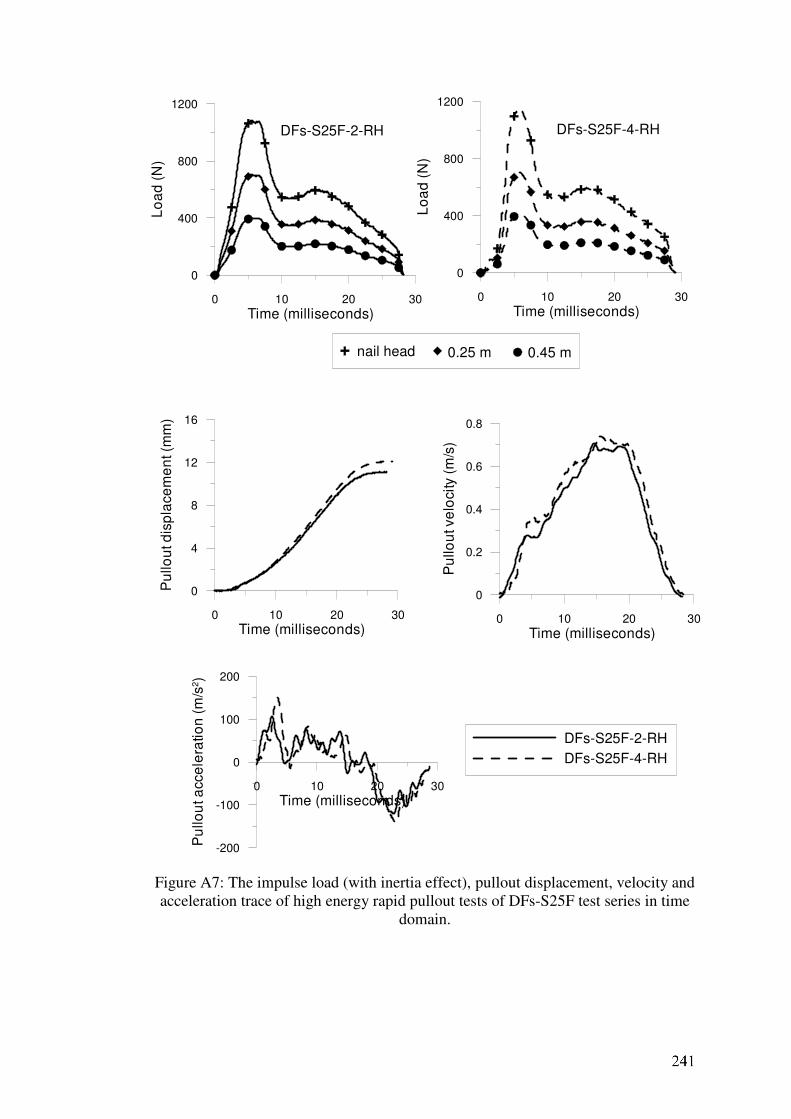
0 10 20 30
Time (milliseconds)
0
400
800
1200
Lo
ad
(N
)
0 10 20 30
Time (milliseconds)
0
4
8
12
16
Pu
llou
t d
isp
lace
me
nt (m
m)
0 10 20 30
Time (milliseconds)
0
0.2
0.4
0.6
0.8
Pu
llou
t ve
loci
ty (
m/s
)
0 10 20 30
Time (milliseconds)
-200
-100
0
100
200
Pu
llou
t a
cce
lera
tio
n (
m/s
2)
DFs-S25F-2-RH
DFs-S25F-4-RH
0 10 20 30
Time (milliseconds)
0
400
800
1200
Lo
ad
(N
)
nail head 0.25 m 0.45 m
DFs-S25F-2-RH DFs-S25F-4-RH
Figure A7: The impulse load (with inertia effect), pullout displacement, velocity and
acceleration trace of high energy rapid pullout tests of DFs-S25F test series in time
domain.
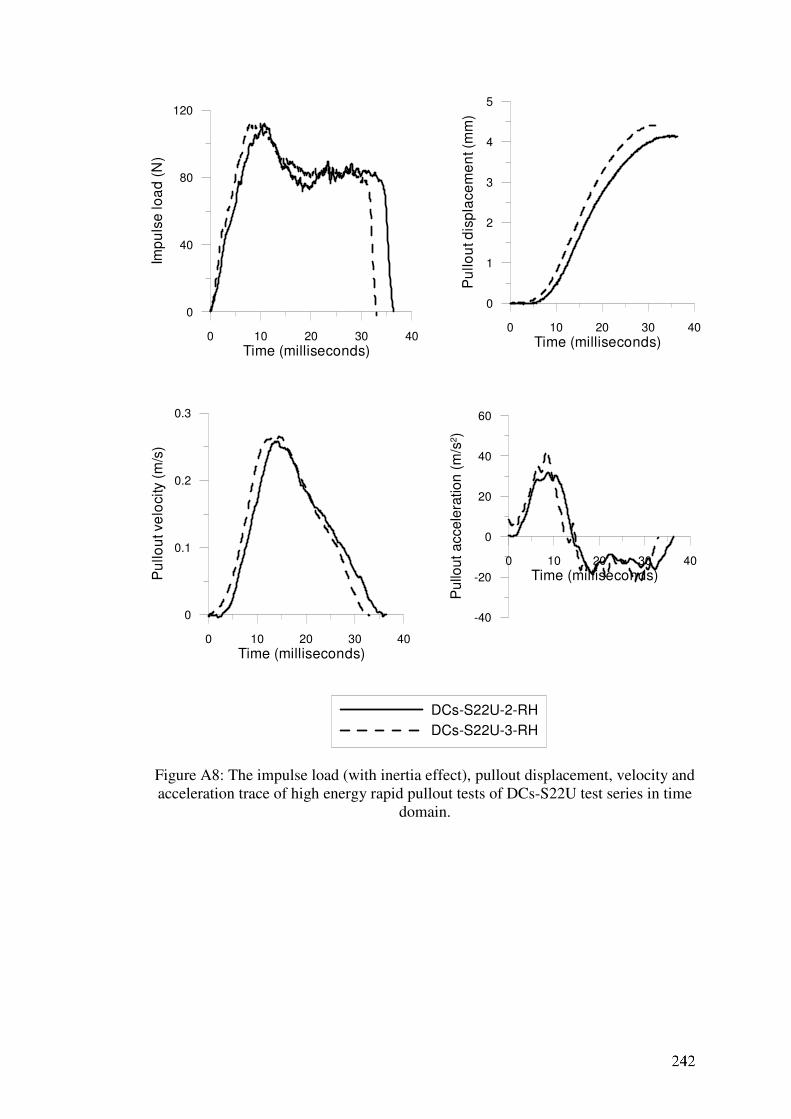
0 10 20 30 40
Time (milliseconds)
0
40
80
120
Imp
uls
e lo
ad
(N
)
0 10 20 30 40
Time (milliseconds)
0
1
2
3
4
5
Pu
llo
ut d
isp
lace
me
nt (m
m)
0 10 20 30 40
Time (milliseconds)
0
0.1
0.2
0.3
Pu
llo
ut ve
loci
ty (
m/s
)
0 10 20 30 40
Time (milliseconds)
-40
-20
0
20
40
60
Pu
llou
t a
cce
lera
tio
n (
m/s
2)
DCs-S22U-2-RH
DCs-S22U-3-RH
Figure A8: The impulse load (with inertia effect), pullout displacement, velocity and
acceleration trace of high energy rapid pullout tests of DCs-S22U test series in time
domain.
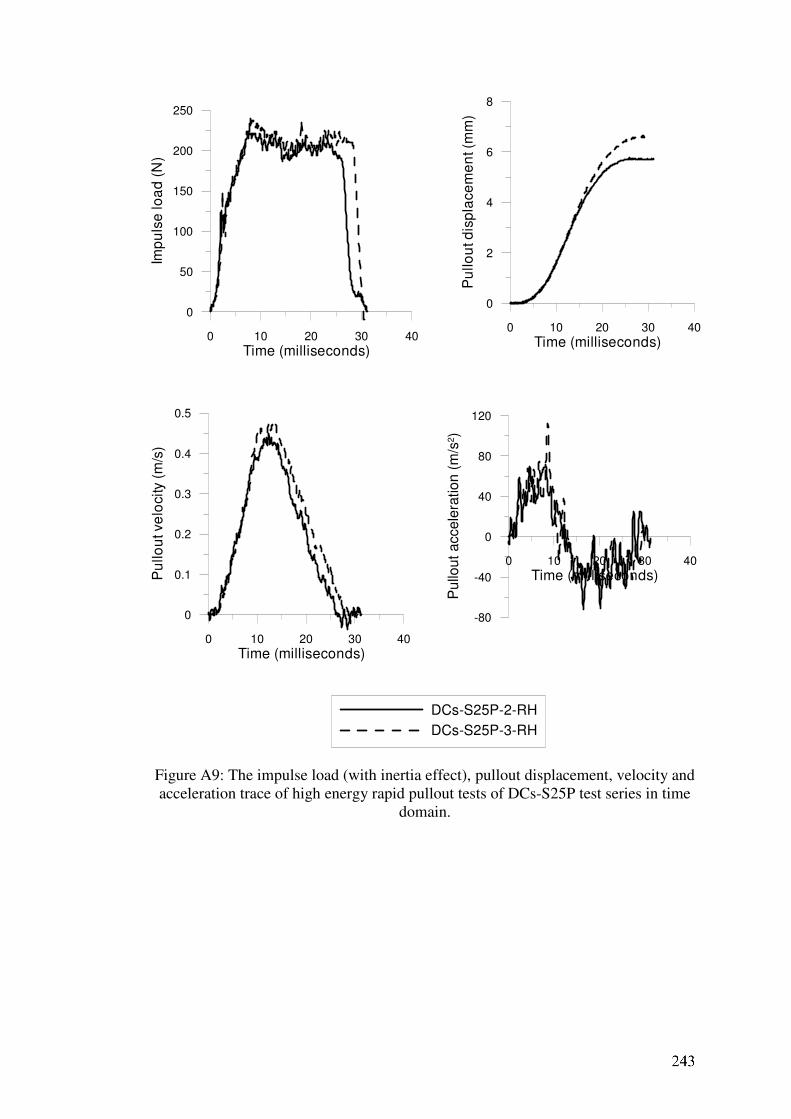
0 10 20 30 40
Time (milliseconds)
0
50
100
150
200
250
Imp
uls
e lo
ad
(N
)
0 10 20 30 40
Time (milliseconds)
0
2
4
6
8
Pu
llo
ut d
isp
lace
me
nt (m
m)
0 10 20 30 40
Time (milliseconds)
0
0.1
0.2
0.3
0.4
0.5
Pu
llo
ut ve
loci
ty (
m/s
)
0 10 20 30 40
Time (milliseconds)
-80
-40
0
40
80
120
Pu
llou
t a
cce
lera
tio
n (
m/s
2)
DCs-S25P-2-RH
DCs-S25P-3-RH
Figure A9: The impulse load (with inertia effect), pullout displacement, velocity and
acceleration trace of high energy rapid pullout tests of DCs-S25P test series in time
domain.

Appendix B: Results of Low Energy Rapid Pullout Tests in Time
Domain
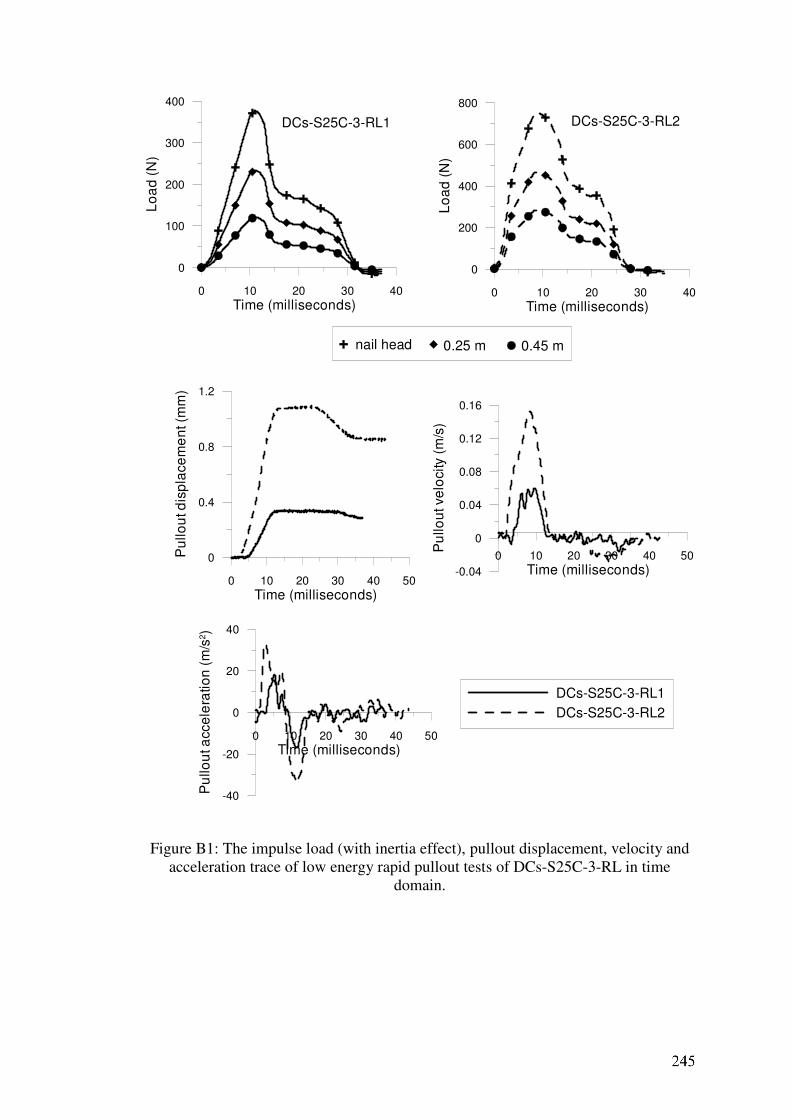
0 10 20 30 40
Time (milliseconds)
0
100
200
300
400
Lo
ad
(N
)
0 10 20 30 40 50
Time (milliseconds)
0
0.4
0.8
1.2
Pu
llo
ut d
isp
lace
me
nt (m
m)
0 10 20 30 40 50
Time (milliseconds)-0.04
0
0.04
0.08
0.12
0.16
Pu
llou
t ve
loci
ty (
m/s
)
0 10 20 30 40 50
Time (milliseconds)
-40
-20
0
20
40
Pu
llou
t acc
ele
ratio
n (
m/s
2)
DCs-S25C-3-RL1
DCs-S25C-3-RL2
0 10 20 30 40
Time (milliseconds)
0
200
400
600
800
Lo
ad
(N
)
nail head 0.25 m 0.45 m
DCs-S25C-3-RL1 DCs-S25C-3-RL2
Figure B1: The impulse load (with inertia effect), pullout displacement, velocity and
acceleration trace of low energy rapid pullout tests of DCs-S25C-3-RL in time
domain.
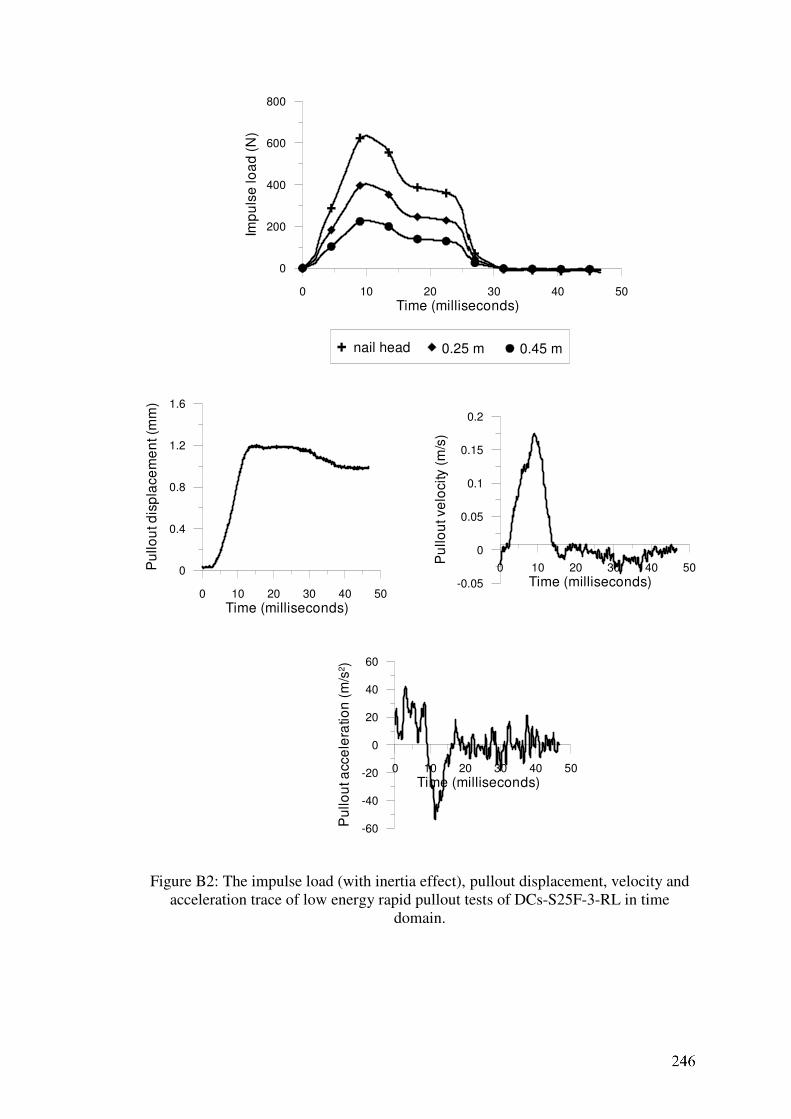
0 10 20 30 40 50
Time (milliseconds)
0
200
400
600
800
Imp
uls
e lo
ad
(N
)
0 10 20 30 40 50
Time (milliseconds)
0
0.4
0.8
1.2
1.6
Pu
llo
ut d
isp
lace
me
nt (m
m)
0 10 20 30 40 50
Time (milliseconds)-0.05
0
0.05
0.1
0.15
0.2
Pu
llo
ut ve
loci
ty (
m/s
)
0 10 20 30 40 50
Time (milliseconds)
-60
-40
-20
0
20
40
60
Pu
llo
ut a
cce
lera
tion
(m
/s2)
nail head 0.25 m 0.45 m
Figure B2: The impulse load (with inertia effect), pullout displacement, velocity and
acceleration trace of low energy rapid pullout tests of DCs-S25F-3-RL in time
domain.
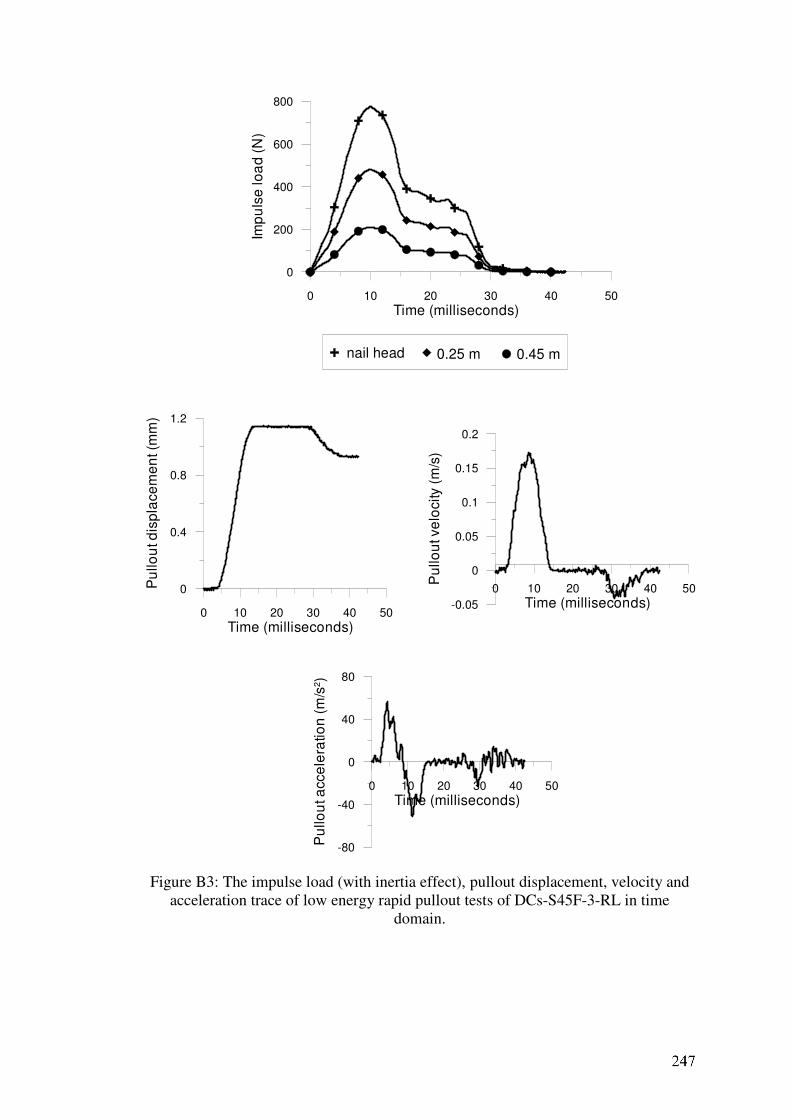
0 10 20 30 40 50
Time (milliseconds)
0
200
400
600
800
Imp
uls
e lo
ad
(N
)
0 10 20 30 40 50
Time (milliseconds)
0
0.4
0.8
1.2
Pu
llou
t dis
pla
ce
me
nt (m
m)
0 10 20 30 40 50
Time (milliseconds)-0.05
0
0.05
0.1
0.15
0.2P
ullo
ut v
elo
city
(m
/s)
0 10 20 30 40 50
Time (milliseconds)
-80
-40
0
40
80
Pu
llou
t acc
ele
ratio
n (
m/s
2)
nail head 0.25 m 0.45 m
Figure B3: The impulse load (with inertia effect), pullout displacement, velocity and
acceleration trace of low energy rapid pullout tests of DCs-S45F-3-RL in time
domain.
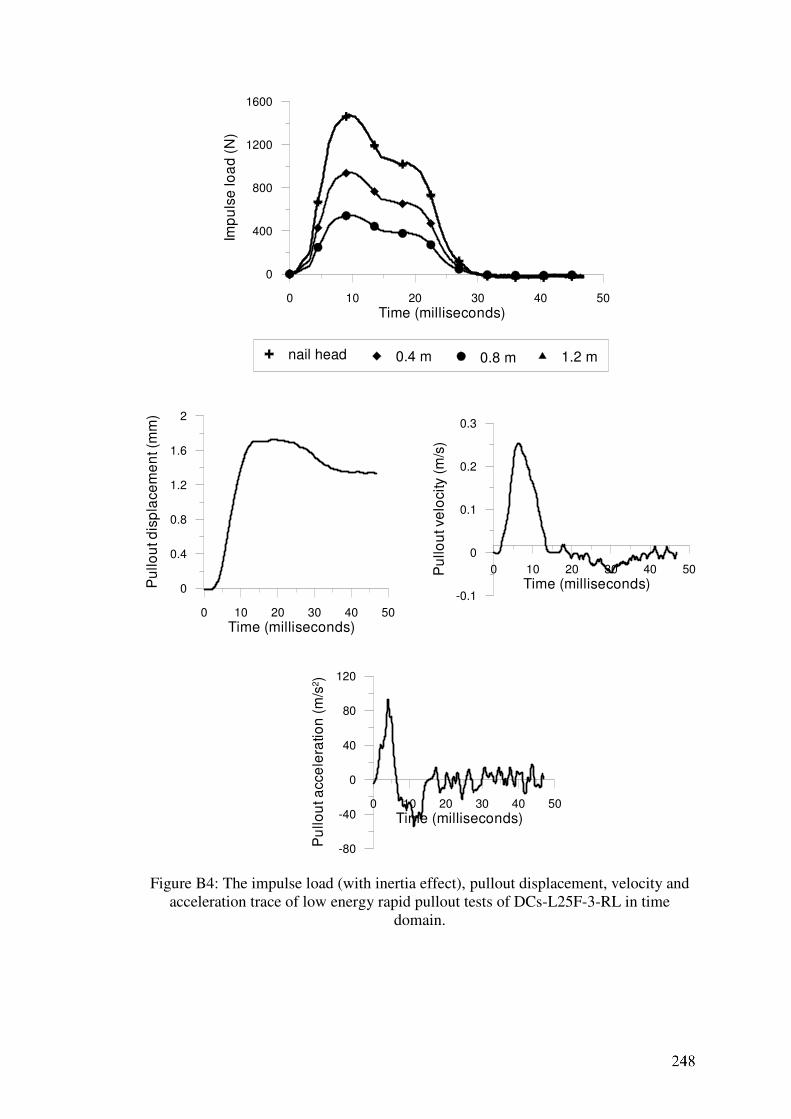
0 10 20 30 40 50
Time (milliseconds)
0
400
800
1200
1600
Imp
uls
e lo
ad
(N
)
0 10 20 30 40 50
Time (milliseconds)
0
0.4
0.8
1.2
1.6
2
Pu
llo
ut d
isp
lace
me
nt (m
m)
0 10 20 30 40 50
Time (milliseconds)-0.1
0
0.1
0.2
0.3
Pu
llo
ut ve
locity (
m/s
)
0 10 20 30 40 50
Time (milliseconds)
-80
-40
0
40
80
120
Pu
llo
ut a
cce
lera
tio
n (
m/s
2)
nail head 0.4 m 0.8 m 1.2 m
Figure B4: The impulse load (with inertia effect), pullout displacement, velocity and
acceleration trace of low energy rapid pullout tests of DCs-L25F-3-RL in time
domain.
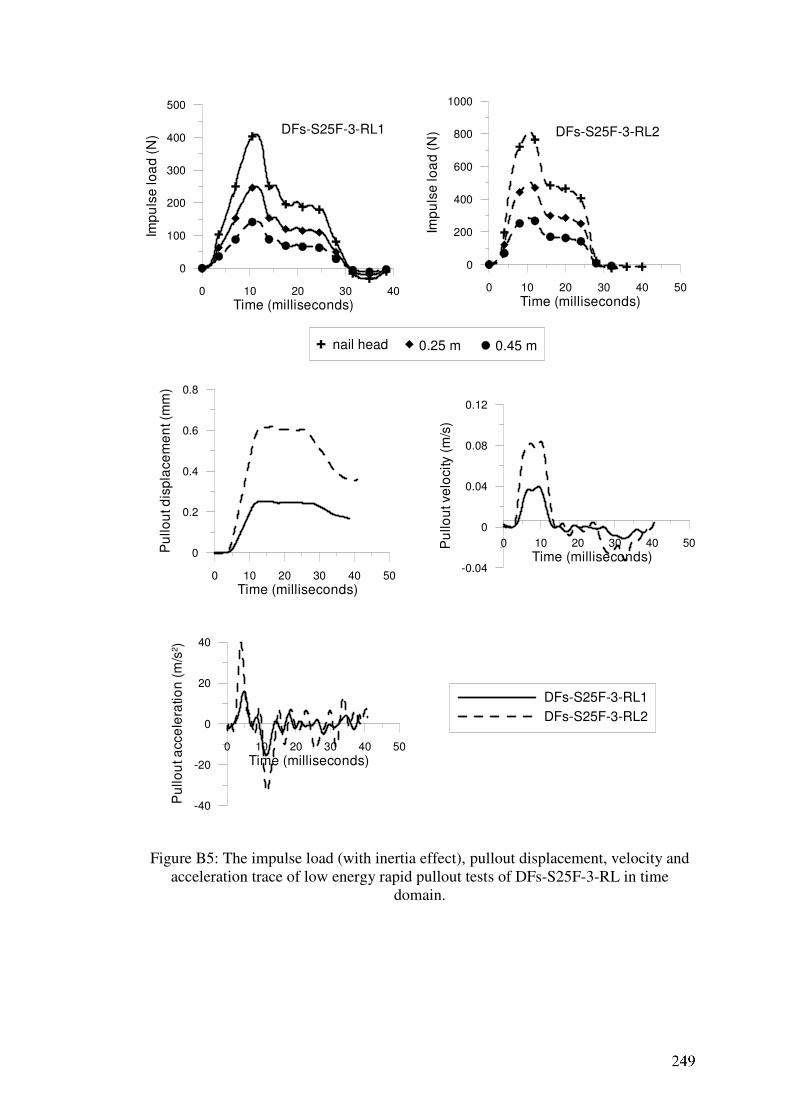
0 10 20 30 40
Time (milliseconds)
0
100
200
300
400
500
Imp
uls
e lo
ad
(N
)
0 10 20 30 40 50
Time (milliseconds)
0
0.2
0.4
0.6
0.8
Pu
llo
ut d
isp
lace
me
nt (m
m)
0 10 20 30 40 50
Time (milliseconds)-0.04
0
0.04
0.08
0.12
Pu
llou
t ve
loci
ty (
m/s
)
0 10 20 30 40 50
Time (milliseconds)
-40
-20
0
20
40
Pu
llo
ut a
cce
lera
tio
n (
m/s
2)
DFs-S25F-3-RL1
DFs-S25F-3-RL2
0 10 20 30 40 50
Time (milliseconds)
0
200
400
600
800
1000
Imp
uls
e lo
ad
(N
)
nail head 0.25 m 0.45 m
DFs-S25F-3-RL1 DFs-S25F-3-RL2
Figure B5: The impulse load (with inertia effect), pullout displacement, velocity and
acceleration trace of low energy rapid pullout tests of DFs-S25F-3-RL in time
domain.
Recommended


