© 2012 Erez et al, publisher and licensee Dove Medical Press Ltd. This is an Open Access article which permits unrestricted noncommercial use, provided the original work is properly cited.
International Journal of Women’s Health 2012:4 93–107
International Journal of Women’s Health
Remote prognosis after primary cesarean delivery: the association of VBACs and recurrent cesarean deliveries with maternal morbidity
Offer Erez1
Lena Novack2
Vered Kleitman-Meir1
Doron Dukler1
Idit Erez-Weiss3
Francesca Gotsch4
Moshe Mazor1
1Department of Obstetrics and Gynecology, Soroka University Medical Center, 2Department of Epidemiology, 3Department of Family Medicine, Faculty of Health Sciences, Ben-Gurion University of the Negev, Beer-Sheva, Israel; 4Obstetrics and Gynecology Departement, Policlinico GB Rossi Azienda Ospedaliera Universitaria Integrata Verona, Italy
Correspondence: Offer Erez Acting Director, Maternal Fetal Medicine Unit, Department of Obstetrics and Gynecology “B”, Soroka University Medical Center, PO Box 151, Beer Sheva 84101, Israel Tel +972 8 6403551 Fax +972 8 6403294 Email [email protected]
Purpose: To determine the effects of vaginal birth after cesarean (VBAC) versus repeated
cesarean sections (RCS) after a primary cesarean section (CS), on the rate of intraoperative
and postpartum maternal morbidity.
Patients and methods: This is a retrospective population-based cohort study. During the
study period (1988–2005) there were 200,012 deliveries by 76,985 women at our medical
center; 16,365 of them had a primary CS, of which 7429 women delivered a singleton infant
after the primary CS, met the inclusion criteria, were included in our study, and were followed
for four consecutive deliveries. Patients were divided into three study groups according to the
outcome of their consecutive delivery after the primary CS: VBAC (n = 3622), elective CS
(n = 1910), or an urgent CS (n = 1897). Survival analysis models were used to investigate the
effect of the urgency of CS and the numbers of pregnancy predating the primary CS on peri-
partum complications.
Results: Women who failed a trial of labor had a higher rate of uterine rupture than those who
had a VBAC. Patients who delivered by CS had a higher rate of endometritis than those giving
birth vaginally. The rate of cesarean hysterectomy and transfer to other departments increased
significantly at the fourth consecutive surgery (P = 0.02 and P = 0.003, respectively). VBAC
was associated with a 55% reduction in the risk of intrapartum complications in comparison
to a planned CS (hazard ratio [HR] 0.45; 95% confidence interval [CI]: 0.22–0.89. A greater
maternal parity at the time of primary CS was associated with lower intrapartum and postpartum
morbidities (HR 0.44; 95% CI: 0.24–0.79; HR 0.54; 95% CI: 0.47–0.62, respectively).
Conclusions: (1) A successful VBAC is associated with a reduction in the intrapartum com-
plications; and (2) maternal morbidity increases substantially from the fourth consecutive
cesarean delivery.
Keywords: trial of labor, uterine rupture, hysterectomy, blood transfusion, parity
IntroductionCesarean section (CS) is the most common surgery performed in the US and its rate
is progressively rising throughout the world.1 The major increase in the CS rate in
western societies was recorded between the 1970s and early 1980s. A transient decrease
in primary CS, along with an increase in vaginal birth after cesarean (VBAC), was
observed between 1989 and 1996;2 however, since 1996, the total cesarean rate has
been annually increasing reaching 27.6% in 20033 and 30.1% in 2006.4
Maternal morbidity associated with a CS is substantially higher than that of a
vaginal delivery.5–7 Therefore, VBAC had been regarded as an effective method to
reduce the rate of recurrent cesarean deliveries. However, recent studies demonstrated
higher maternal and fetal complications in patients undergoing a trial of labor after
Dovepress
submit your manuscript | www.dovepress.com
Dovepress 93
O R I G I N A L R E S E A R C H
open access to scientific and medical research
Open Access Full Text Article
http://dx.doi.org/10.2147/IJWH.S29626

International Journal of Women’s Health 2012:4
CS than in those electively delivered by an elective repeated
CS.8–10 Indeed, a symptomatic uterine rupture occurred in
0.5%–0.7% of women who underwent a trial of labor11 and
the rate of hypoxic–ischemic encephalopathy increases
among patients who attempt a trial of labor especially in
cases of uterine rupture during this process.11–14 Because
of that, the American College of Obstetrics and Gynecol-
ogy (ACOG), has recommended that a trial of labor after
cesarean delivery is to be done only in hospitals that have
facilities for emergency CS. The new guidelines say that
hospitals ill-equipped for immediate surgery should help
women find care elsewhere and have a plan to manage
uterine ruptures.15
Thus far, the data regarding maternal complications
of deliveries following a CS (either by VBAC or elective
repetitive CS), has mainly focused on the first birth after
the primary CS. In contrast, there is a paucity of infor-
mation concerning maternal morbidity associated with
either repeated VBAC or repeated CS (RCS). The aims of
this large population cohort study including women with
a prior CS were to: (1) compare the maternal morbid-
ity associated with elective repetitive CSs and repeated
VBACs; and (2) compare the maternal morbidity of an
elective repetitive CS with that of an emergency CS due
to failed trial of labor.
Materials and methodsStudy population and selection of patientsThis retrospective population-based cohort study included
7429 women with a singleton pregnancy who delivered sub-
sequently to a primary CS at the Soroka University Medical
Center, a regional tertiary medical center in Beer Sheva,
Israel, where all the births in the region take place. Cases
were identified by searching a computerized birth records
database. Women included in the study were followed up to
a maximum of four consecutive deliveries after their primary
CS in the univariate analyses.
Outcome variablesData concerning demographic characteristics, medical and
obstetric history, as well as pregnancy, delivery, and perinatal
outcome, were obtained from the computerized database.
The primary outcomes were the rate of intrapartum and
postpartum maternal complications during consecutive trials
of labor and the intraoperative and postoperative complica-
tions of patients with repetitive CS. The data were analyzed
by two methods: (1) the effect of recurrent CSs versus
repeated VBACs on intrapartum, operative, and postpartum
complications; and (2) the effect of a failure in trial of labor
on maternal morbidity.
For patients who attempted a VBAC, intrapartum
complications included failure to progress during the first
and second stages of labor, placental abruption, uterine rup-
ture, uterine scar dehiscence, instrumental delivery, blood
product transfusion, and the need for urgent CS. Postpartum
complications included postpartum fever, endometritis, uri-
nary tract infection, anemia, uterine rupture, blood product
transfusion, and transfer to other departments (ie, intensive
care unit).
For patients who underwent a CS, either elective or urgent,
intraoperative complications included infection, trauma to
adjacent organs, hysterectomy, blood products transfusion,
and transfer to another department after CS. Post-operative
complications included: reopening of cesarean scar, disrup-
tion of cesarean scar, and wound infection.
Statistical analysisMaternal demographic characteristics, peripartum com-
plications, and perinatal outcomes were compared with a
two-step analysis. First, we compared the rate of complica-
tions between patients who underwent repeated VBAC and
those who had RCSs. Subsequently, we compared the rate of
complications of elective and urgent CS in patients with RCS
and in those who failed a trial of VBAC. Student’s t-test was
used to compare means for normally distributed variables.
Chi-square and Fisher exact tests were used to compare cat-
egorical variables. Cox proportional hazard regression was
performed to investigate the association between repeated
VBAC, maternal parity at primary CS, and urgent versus
planned CS, to peripartum and postpartum complications.
A P value of ,0.05 was considered significant. Analysis
was done using SAS packages (version 9.1; SAS Institute,
Cary, NC).
ResultsDuring the study period (1988–2005) there were 200,012
deliveries by 76,985 women at our medical center; 16,365
of them had a primary CS, of which 7429 women delivered
a singleton infant after the primary CS, met the inclusion
criteria, and were included in our study (the indication and
perinatal complication leading to the primary CS are pre-
sented in Supplementary Table 1). The study population was
further divided according to the outcome of the subsequent
submit your manuscript | www.dovepress.com
Dovepress
Dovepress
94
Erez et al
International Journal of Women’s Health 2012:4
delivery after the primary CS: 48.8% (3622/7429) had a suc-
cessful trial of labor and were included in the VBAC group;
25.5% (1897/7429) had an urgent CS due to maternal or fetal
indication and comprised the urgent CS group; and 25.7%
(1910/7429) who had an elective CS and were included in
that group.
The rate of trial of labor after a primary CS was 74.3%
(5519/7429); of these 65.6% (3622/5516) succeeded and
had a VBAC. The distribution of repeated VBACs, elective
and urgent cesarean deliveries up to four consecutive deliver-
ies after the primary CS, are presented in Figure 1A–C. The
proportion of VBAC out of all the deliveries increases with
each additional consecutive birth, and women in the VBAC
group had a higher chance of having four consecutive deliver-
ies after the primary CS than women in the urgent CS (odds
ratio [OR], 2.13; 95%; confidence interval [CI]: 2.43–3.54)
or the elective CS (OR, 13; 95% CI: 9.16–18.55) groups.
Of interest is the finding that women included in the urgent
CS group had a higher chance of having four consecutive
deliveries after the primary CS than those included in the
elective CS group (OR, 4.44; 95% CI: 3.03–6.53) (Figure 2).
Demographic characteristics of the study groups are pre-
sented in Table 1.
The rate of pregnancy and peripartum complications of
the consecutive deliveries after the primary CS is presented in
Supplementary Table 2. Patients with RCS, compared to those
who had repeated VBACs, had a higher rate of pregnancy
complications. A leading indication for repeated urgent CS
after the primary CS was labor dystocia; this was the indica-
tion for 39.3% of the urgent CSs in the delivery following the
primary CS. Of interest, the rate of labor dystocia declined
to about 15% of the subsequent deliveries (Supplementary
Tables 3–5).
Patients with RCS were more likely to require blood
products transfusion than patients in the VBAC group. There
was no difference in the rate of uterine rupture between those
with RCS and those with consecutive VBACs. The rate of
these complications did not differ between urgent and elec-
tive CS (Table 2). In the first three subsequent deliveries
after the primary CS, patients with RCS had higher rates of
postpartum fever and endometritis than those with consecu-
tive VBACs (Table 3).
In patients undergoing repeated cesarean deliveries, the
rate of blood products transfusion, trauma to adjacent organs,
endometritis, postpartum fever, and urinary tract infections
did not significantly change with the increase in the number of
recurrent cesarean deliveries. However, the rate of cesarean
hysterectomy and transfer to other departments increased
significantly at the fourth consecutive surgery (P = 0.02 and
P = 0.003, respectively) (Figure 3). The major indications
for cesarean hysterectomy were uterine rupture and hemor-
rhage. The rate of placenta accrete differed among the study
group and was highest among the elective CS group 0.73%
(14/1910), followed by the urgent CS group 0.16% (3/1897),
and lowest among those who had VBAC 0.08% (3/3622;
P , 0.001).
The neonatal outcome of the study groups is presented in
Supplementary Tables 6–8. The rate of 1-minute Apgar score
,5 was higher among patients with recurrent CS than in those
with consecutive VBACs in all subsequent pregnancies fol-
lowing the primary CS. However, the rate of 5-minute Apgar
score ,7 did not differ significantly between the study groups
in all the subsequent deliveries after the primary CS. The total
perinatal mortality rate was higher among women who had a
VBAC in the first delivery after the primary CS than in those
with recurrent CS, mainly due to a higher rate of antepartum
death in the VBAC group. However, in the fourth delivery
after the primary CS, women with recurrent CS had a higher
rate of total perinatal mortality than those with repeated
VBACs, mainly due to a higher rate of postpartum death
(Supplementary Tables 7 and 8).
The contribution of a failure in a trial of labor to maternal
morbidity is a key question. In order to address it we further
analyzed our data including patients who had an urgent
cesarean delivery due to labor dystocia. In comparison to
women undergoing a nonurgent CS, those who failed a trial
of labor had a higher rate of CS complications in general
(P , 0.001), infections, and the need to transfer to another
department in the second and third delivery after the primary
CS (Table 4).
In comparison to those who had a successful VBAC,
those who failed in a trial of labor had a higher rate of uterine
rupture (P , 0.001). Of interest, the rate of uterine rupture
did not differ between those who had a nonurgent CS and
those who failed a trial of labor (Table 5).
To study the additive effect of RCS versus subsequent
VBACs we constructed a Cox proportional hazard model sep-
arately for intrapartum and postpartum maternal morbidity, in
which the outcome of nonurgent repeated morning CS served
as the reference point and was compared to the outcome
of VBAC and urgent CS at each consecutive delivery. The
number of deliveries after the primary CS served as the time
parameter. In the model for intrapartum complications, a
protective effect was given by any additional VBAC (HR,
submit your manuscript | www.dovepress.com
Dovepress
Dovepress
95
Remote prognosis of recurrent VBAC versus cesarean deliveries

International Journal of Women’s Health 2012:4
Figure 1 Mode of delivery in consecutive deliveries after the primary CS of patients who had a (A) VABC, (B) urgent CS, or (C) elective CS.Abbreviations: CS, cesarean section; VBAC, vaginal birth after cesarean.
Primary cesarean delivery(n = 7429)
VBACn = 3622
A
VBACn = 1721
Elective CSn = 186
Urgent CSn= 298
VBACn = 881
Elective CSn = 69
Urgent CSn = 112
VBACn = 1
Elective CSn = 43
Urgent CSn = 10
VBACn = 8
Elective CSn = 83
Urgent CSn = 42
VBAC(n = 506)
Elective CS(n = 27)
Urgent CS(n = 56)
VBAC(n = 2)
Elective CS(n = 15)
Urgent CS(n = 5)
VBAC(n = 1)
Elective CS(n = 4 )
Urgent CS(n = 2)
VBAC(n = 1)
Elective CS(n = 27)
Urgent CS(n = 4)
Urgent CSn = 1
Elective CS(n = 10)
Urgent CS(n = 5)
Elective CS(n = 1)
Urgent CS(n = 1)
Elective CS(n = 24)
Urgent CS(n = 10)
Elective CS(n = 16)
Urgent CS(n = 10)
1st delivery after primary CS2nd delivery after primary CS
3rd delivery after primary CS
4th delivery after primary CS
Primary cesarean delivery(n = 7429)
Elective CSn = 1910
B
VBACn = 13
Elective CSn = 423
Urgent CSn = 125
VBACn = 1
Elective CSn = 1
VBACn = 3
Elective CSn = 88
Urgent CSn = 15
VBACn = 2
Elective CSn = 29
Urgent CSn = 9
Urgent CS(n = 1)
Urgent CS(n = 1)
Elective CS(n = 18)
Urgent CS (n = 4)
Elective CS(n = 1)
Urgent CS(n = 1)
Elective CS(n = 4)
Urgent CS(n = 2)
Elective CS(n = 3)
Urgent CS(n = 1)
1st delivery after primary CS
2nd delivery after primary CS
3rd delivery after primary CS
4th delivery after primary CS
Primary cesarean delivery(n = 7429)
Urgent CS
C
n = 1897
VBACn = 31
Elective CSn = 577
Urgent CSn = 262
VBACn = 7
Elective CSn = 10
Urgent CSn = 6
VBACn = 2
Elective CSn = 192
Urgent CSn = 43
VBACn = 7
Elective CSn = 81
Urgent CSn = 47
VBAC(n = 4)
Urgent CS(n = 2)
Elective CSn = 4
Urgent CSn = 2
Elective CS(n = 2)
Urgent CS(n = 1)
Elective CS(n = 54)
Urgent CS(n = 13)
Elective CS(n = 13)
Urgent CS(n = 9)
Elective CS(n = 24)
Urgent CS(n = 8)
Elective CS(n = 8)
Urgent CS(n = 5)
Elective CS(n = 1)
1st delivery after primary CS
2nd delivery after primary CS
3rd delivery after primary CS
4th delivery after primary CS
Urgent CS(n = 1)
submit your manuscript | www.dovepress.com
Dovepress
Dovepress
96
Erez et al

International Journal of Women’s Health 2012:4
0.45; 95% CI: 0.22–0.9) and by maternal parity at primary CS
(HR, 0.44; 95% CI: 0.24–0.79) (Table 6a). Urgent CS was not
associated with a significant change in the risk of intrapartum
complications versus nonurgent repeated morning CS. In
the model for maternal postpartum morbidity, only maternal
parity at primary CS had a significant protective effect (HR,
0.54; 95% CI: 0.47–0.62) (Table 6a). The introduction of
maternal age and labor dystocia to the model did not affect
its results (Table 6b).
Discussion Principal findings of the studyA successful trial of labor after a primary CS is associated
with a higher future parity. In comparison to those who
delivered by RCS in all subsequent pregnancies, patients
who delivered consecutively by repeated VBACs had a
lower maternal morbidity, and a 51.9% reduction in the
risk of intrapartum complications for each successful trial
of labor. A failure in a trial of labor is a major cause of
maternal morbidity, mainly in the first delivery after the
primary CS.
What is the effect of repeated VBACs versus recurrent CSThe finding that repeated trials of labor ending in successful
VBACs are associated with lower maternal morbidity than
RCS is novel. This study is the first to compare the outcome of
consecutive VBAC to RCSs. Indeed, women who underwent
repeated vaginal deliveries after the primary CS had lower
rate of blood products transfusion and postpartum infections
than women who had repeated cesareans. The finding that
each additional VBAC, when compared to elective RCS, was
associated with a 55% reduction in the risk for intrapartu-
mand postpartum complication in comparison to elective CS,
is novel and further emphasizes the safety and the benefit of
a successful trial of labor.
Repeated VBACs were associated with an overall reduc-
tion in intrapartum and postpartum maternal morbidity with
0%
10%
20%
30%
40%
50%
60%
1 2 3 4
VBAC
Elective CS
Urgent CS
Number of subsequent delivery
Rat
e
Figure 2 The rate of VBAC, urgent CS and elective CS in the subsequent deliveries after the primary CS.Abbreviations: CS, cesarean section; VBAC, vaginal birth after cesarean.
Table 1 Demographic characteristics of patients at subsequent pregnancy after primary cesarean delivery according to the route of delivery
Measure VBAC (n = 3622) Elective CS (n = 1910) Urgent CS (1897) P-value
Jewish origin 43.4% (1572/3622) 70.6% (1348/1910) 48.2% (914/1897) ,0.001Age (years) Mean ± SD (n) 28.15 ± 5.42(3621) 31.34 ± 5.21(1906) 29.70 ± 5.56(1895) ,0.001Gravidity 2–5 76.4% (2764/3616) 74.1% (1416/1910) 74.5% (1413/1896) 0.1046 6+ 23.6% (852/3616) 25.9% (494/1910) 25.5% (483/1896)Parity 2–5 86.4% (2928/3387) 87.1% (1565/1796) 85.1% (1525/1793) 0.1760 6+ 13.6% (459/3387) 12.9% (231/1796) 14.9% (268/1793)Infertility treatments 6.9% (251/3622) 7.5% (143/1910) 7.2% (136/1897) 0.7444
Note: Data is presented in percentage (number).Abbreviations: VBAC, vaginal birth after cesarean; CS, cesarean section.
submit your manuscript | www.dovepress.com
Dovepress
Dovepress
97
Remote prognosis of recurrent VBAC versus cesarean deliveries

International Journal of Women’s Health 2012:4
every additional delivery. This is in accord with the findings
of Mercer et al,16 who reported that among 13,532 women
from 19 medical centers across the US, VBAC success
increased with increasing number of prior VBACs. The
rate of uterine rupture decreased after the first successful
VBAC and did not increase thereafter. The risk of uterine
dehiscence and other peripartum complications also declined
substantially after the first successful VBAC. In comparison
to the findings of this group, we had a lower rate of uterine
rupture in every additional VBAC, and a somewhat lower rate
of successful VBAC in each consecutive delivery. The main
explanation for this observation is that some of the centers
included in the study of Mercer et al16 allowed patients with
more than one CS to go into a trial of labor, while in our
center more than one CS is a contraindication for a trial of
labor. Collectively, our findings and those of others support
the protective and positive effect of recurrent VBAC on
maternal morbidity.
In contrast to the beneficial effect of recurrent VBAC,
repeated cesarean deliveries are associated with increased
maternal morbidity. We report herein that the rate of
uterine rupture, hysterectomy, blood and blood product
transfusion, and the need for transferring the patient to other
departments rises with the increasing number of cesarean
deliveries, especially after the fourth consecutive CS. This
is in accord with previous reports: Makoha et al17 noted
similar elevation maternal morbidity, including placenta
previa, placenta accreta, hysterectomy, adhesions, bladder
injury, postoperative hemoglobin deficit, and need for
blood transfusion with an increasing number of cesarean
deliveries; and Silver et al,18 for the National Institute of
Child Health and Human Development Maternal-Fetal
Medicine Units Network, reported that the risks of placenta
accreta, cystotomy, bowel injury, ureteral injury, and ileus,
the need for postoperative ventilation, intensive care unit
admission, hysterectomy, and blood transfusion requiring
four or more units, and the duration of operative time and
hospital stay, significantly increased with an increasing
number of cesarean deliveries. Similarly to our findings,
Silver et al18 reported that there was a substantial increase
in the risk for several morbidities, including placenta
accreta, cystotomy, and need for hysterectomy or intensive
care unit admission with the fourth or greater cesarean
delivery. Thus, although there is no strict cut off regarding
the number of consecutive CSs, it seems that the maternal
risk for serious intraoperative complications increases
substantially from the fourth RCS. This information should Tab
le 2
Del
iver
y re
late
d co
mpl
icat
ions
of p
atie
nts
with
con
secu
tive
VBA
C w
ithou
t C
S or
con
secu
tive
CS
with
out
VBA
C
Com
plic
atio
ns1s
t de
liver
y af
ter
in
dex
CS
2nd
deliv
ery
afte
r
inde
x C
S3r
d de
liver
y af
ter
in
dex
CS
4th
deliv
ery
afte
r
inde
x C
S
Urg
ent
CS
(n =
189
7) n
onur
gent
CS
(n
= 1
910)
VB
AC
(n
= 3
622)
Urg
ent
CS
(n =
387
) n
onur
gent
CS
(n =
100
0)V
BA
C
(n =
172
1)U
rgen
t C
S (n
= 1
14)
Non
urge
nt C
S
(n =
390
)V
BA
C
(n =
881
)U
rgen
t C
S (n
= 4
3) N
onur
gent
CS
(n =
125
)V
BA
C
(n =
506
)A
ny D
eliv
ery
com
plic
atio
ns3.
1 (5
8)3.
6 (6
8)0.
4 (1
3)**
2.8
(11)
3.5
(35)
0.1
(1)*
*6.
1 (7
)4.
6 (1
8)0.
1 (1
)9.
3 (4
)3.
2 (4
)0*
*
Ute
rine
sca
r de
hise
nce
2.1
(40)
3.0
(57)
0.2
(6)*
*1.
8 (7
)3.
2 (3
2)0*
*3.
5 (1
)3.
6 (1
4)1
(0.1
)**
7.0
(3)
1.6
(2)
0**
Ute
rine
rup
ture
0.3
(5)
0.3
(5)
0.1
(3)
0.3
(1)
0.2
(2)
0.1
(1)
00.
3 (1
)0
01.
6 (2
)0
Bloo
d pr
oduc
ts
tran
sfus
ion
0.8
(15)
0.4
(8)
0.1
(5)*
*0.
8 (3
)0.
2 (2
)0*
*2.
6 (3
)1.
0 (4
)0
4.7
(2)
0.8
(1)
0**
Not
es: D
ata
is p
rese
nted
in p
erce
ntag
e (n
). * ,
0.05
, **,
0.00
1.A
bbre
viat
ions
: CS,
ces
area
n se
ctio
n; V
BAC
, vag
inal
bir
th a
fter
cesa
rean
sec
tion.
submit your manuscript | www.dovepress.com
Dovepress
Dovepress
98
Erez et al

International Journal of Women’s Health 2012:4
be included while counseling patients regarding repeated
cesarean births.
An additional effect of repeated VBACs is the higher
number of subsequent deliveries after the primary CS in
comparison to those of women who had an elective or
urgent RCS. Of interest is the fact that a higher proportion
of those who underwent an urgent CS, immediately after the
primary CS, had four subsequent pregnancies in compari-
son to those who had an elective CS. This finding is novel,
and it may reflect the differences in the study population;
meaning that a higher proportion of patients who choose
to have an elective cesarean after the primary CS have a
tendency to smaller families than those who attempt a trial
of labor after the primary CS. Indeed, the sharp decline
in the number of deliveries in this group is after the third
cesarean. Guise et al19 proposed that a woman’s decision
to undergo a trial of labor after a primary CS is a complex
process that is affected by medical, cultural, behavioral,
and legal factors. The retrospective nature of our study
does not allow us a deeper and more thorough investigation
into these factors in relation to our population. A specially
designed prospective study will need to be conducted in
order to address the effect of these factors on the patient’s
decision to undergo a trial of labor versus elective CS;
nevertheless, educating women about their options early
enough in pregnancy for them to make an informed choice
is a key factor in this process.
What is the effect of labor dystocia on the success of a trial of labor?The success of a trial of labor is an end point of many
variables. Some of these parameters have been included
in different prediction models20–23 aiming to assess the
probability of a given patient to deliver vaginally after
a primary CS. According to our findings, labor dystocia
is a significant contributor to a failure of a trial of labor
mainly in the first delivery after a primary CS. Dystocia
was the indication for almost 40% of the urgent CS in the
delivery following the primary CS, yet in the subsequent
deliveries, its rate declined to about 15% of the urgent CS.
This finding further emphasizes previously published data
that women with a history of a labor dystocia which led to
their primary CS have a lower chance to succeed in a trial of
labor in the subsequent birth.24–27 In addition, our finding that
the rate of dystocia as an indication for urgent CS declines
in the following deliveries suggests that women who twice
failed a trial of labor probably deliver by elective CS in Tab
le 3
Pos
t-pa
rtum
rel
ated
com
plic
atio
ns o
f pat
ient
s w
ith c
onse
cutiv
e V
BAC
with
out
CS
or c
onse
cutiv
e C
S w
ithou
t V
BAC
Com
plic
atio
ns1s
t de
liver
y af
ter
inde
x C
S2n
d de
liver
y af
ter
in
dex
CS
3r
d de
liver
y af
ter
in
dex
CS
4th
deliv
ery
afte
r
inde
x C
S
Urg
ent
CS
(n =
189
7) N
onur
gent
CS
(n
= 1
910)
VB
AC
(n
= 3
622)
Urg
ent
CS
(n =
387
) N
onur
gent
CS
(n
= 1
000)
VB
AC
(n
= 1
721)
Urg
ent
CS
(n =
114
) N
onur
gent
CS
(n
= 3
90)
VB
AC
(n
= 8
81)
Urg
ent
CS
(n =
43)
Non
urge
nt C
S (n
= 1
25)
VB
AC
(n
= 5
06)
Endo
met
ritis
2.1
(40)
1.1
(20)
0.2
(7)*
*3.
4 (1
3)1.
1 (1
1)0.
3 (5
)**
0.9
(1)
2.3
(9)
0**
02.
9 (3
)0*
Post
- pa
rtum
fe
ver
2.5
(47)
1.7
(33)
0.6
(20)
**2.
1 (8
)1.
9 (1
9)0.
1 (6
)**
4.4
(5)
1.3
(5)
0.1(
1)**
00.
8 (1
)0
Uri
nary
tra
ct
infe
ctio
n1.
0 (1
9)0.
7 (1
3)0.
3 (1
1)*
1.6
(6)
0.7
(7)
0.1
(2)*
*0
0.5
(2)
00
1.6
(2)
0
Tra
nsfe
r to
oth
er
depa
rtm
ent
0.8
(15)
0.5
(10)
0.6
(20)
2.3
(9)
0.4
(4)
0.5
(8)*
2.6
(3)
1.0
(4)
0.7
(6)
4.7
(2)
2.4
(3)
0.2
(1)*
Not
es: D
ata
is p
rese
nted
in p
erce
ntag
e (n
). * ,
0.01
, **,
0.00
1.A
bbre
viat
ions
: CS,
ces
area
n se
ctio
n; V
BAC
, vag
inal
bir
th a
fter
cesa
rean
sec
tion.
submit your manuscript | www.dovepress.com
Dovepress
Dovepress
99
Remote prognosis of recurrent VBAC versus cesarean deliveries

International Journal of Women’s Health 2012:4
their subsequent pregnancies or stop delivering. Indeed, in
our cohort, only 45.9% of women who had an urgent CS
during the subsequent birth after the primary cesarean had
additional deliveries, mostly by elective CS. In contrast to
this group, 60.9% of women who had a successful VBAC
after the primary CS continued to deliver and only 8.4% of
them had an elective CS. Collectively the data presented
herein suggest that the success in vaginal delivery at
the subsequent birth after the primary CS has important
implication for maternals health and reproductive future.
Those who prevail in the trial of labor and have a VBAC
will have overall higher pregnancy rate and lower maternal
morbidity than those who failed a trial of labor and women
who chooses elective RCS.
Strength and limitation of the studyThe limitation of this study is its retrospective nature and
the fact that the data are derived from a database which has
inherited limitations. Moreover, in the analysis of the data
it seems that the inclination of the medical team is to go for
a RCS whenever the patient has an additional pregnancy
complication aside from the previous CS, which may lead to
a bias towards allowing a trial of labor only for the healthier
women. We could not ascertain this bias; nevertheless, the
large number of deliveries included in our study over such
a long period, as well as the fact that all the deliveries of
our region take place at our medical center, assure us that
the data presented herein is a representative sample of our
obstetric population.
3
3
1
0
Rat
e (%
)
2.5
1.5
Infection
CS * 2 (n = 3807) CS * 3 (n = 1387) CS * 4 (n = 504) CS * 5 (n = 168)
Trauma Hysterectomy Transfusion Transfer to otherdepartments
P = 0.8
P < 0.001
P < 0.0001
P = 0.02
P = 0.008
0.5
Figure 3 Intraoperative complications of patients with recurrent CS.Abbreviation: CS, cesarean section.
Table 4 Intraoperative complications of patients who failed a trial of labor and those who had a nonurgent CS
Complications 2nd delivery after index CS 3rd delivery after index CS
Failed TOL (n = 105)
Nonurgent CS (n = 1186)
P-value Failed TOL (n = 46)
Nonurgent CS (n = 596)
P-value
Any CS complications 3.8 (4) 1.8 (21) 0.139 6.5 (3) 2.4 (14) 0.115
Infection 1.9 (2) 0.7 (8) 0.192 2.2 (1) 0.8 (5) 0.361
Trauma to adjacent organs 0 0.3 (3) 1.000 2.2 (1) 0.3 (2) 0.200
Hysterectomy 1.0 (1) 0.5 (6) 0.449 4.4 (2) 0.7 (4) 0.063
Blood products transfusion 1.0 (1) 0.3 (4) 0.346 2.2 (1) 0.7 (4) 0.311
Transfer to other department 0 0.5 (6) 1.000 2.2 (1) 0.5 (3) 0.258
Notes: Data is presented in percentage (n). Failed TOL was defined as not-planned CS with labor dystocia. Nonurgent CS was defined as CS without indication for urgent CS when section is performed between 8am–3pm.Abbreviations: CS, cesarean section; TOL, trial of labor.
submit your manuscript | www.dovepress.com
Dovepress
Dovepress
100
Erez et al

International Journal of Women’s Health 2012:4
ConclusionIn summary, repeated VBACS are associated with a lower
intrapartum maternal morbidity than planned recurrent cesar-
ean deliveries. The recently published National Institute of
Child Health and Human Development (Bethesda, MD) con-
sensus regarding VBAC, states that about 30% of maternal
fetal medicine fellows do not consult patients with a previous
CS regarding the possibility of a trial of labor.2 The findings
of the current study and others may be used to reduce this
trend among obstetricians and increase the rate of trial of
labor. Moreover, the findings of this study further emphasize
the point that a woman who desires large families should be
offered a trial of labor after her primary cesarean delivery,
especially if she had vaginal deliveries prior to her CS.
Supplementary clinical definitionsParity groups were defined as follows: multipara (two to
five deliveries) and grand-multipara (six or more deliveries).
Hypertension was def ined in the presence of blood
pressure $140/90 mmHg recorded in two separate measure-
ments at least 4 hours apart. Mild hypertension was defined
as a diastolic blood pressure $90 mmHg and ,110 mmHg
and/or systolic blood pressure $140 mmHg and ,160 mmHg.
Severe hypertension was def ined in the presence of
diastolic blood pressure $110 mmHg and systolic blood
pressure $160 mmHg. Gestational hypertension was defined
in the presence of hypertension developed after 20 weeks of
gestation without proteinuria. Preeclampsia was diagnosed in
the presence of elevated blood pressure and proteinuria of at
least + 1 in dipstick; its severity was defined according to the
severity of hypertension and/or one of the following + 3 pro-
teinuria by dipstick, thrombocytopenia #100,000, elevated
liver enzymes, persistent headache and/or blurred vision.28
Gestational diabetes was diagnosed according to oral glucose
tolerance test and was classified according to White’s classi-
fication.29 Hydramnios (amniotic fluid index [AFI]) . 25 cm
or when a vertical pocket of at least 8 cm was measured or as
a subjective estimation of increased amniotic fluid volume.
Oligohydramnios (AFI) ,5 cm, a real-time scanner equipped
with a 3.5/5 MHz transducer of appropriate focal length esti-
mated amniotic fluid volume. Preterm delivery was defined
as delivery before completion of 37 weeks of gestation.
Newborns were classified according to their weight as:
small for gestational age (SGA), birthweight less than the
10th percentile; adequate for gestational age (AGA), birth-
weight from 10th–90th percentile; and large for gestational
age (LGA), birthweight .90th percentile according to
regional growth curves.30 Prelabor rupture of membranes
Table 6a Cox proportional hazard ratio for factors associated with intra-partum and post-partum complications
Variable Intra-partum complications Post-partum complications
Parameter Estimate
Hazard Ratio
95% Confidence interval
Parameter Estimate
Hazard Ratio
95% Confidence interval
VBAC -0.807 0.45 0.22; 0.90 -0.044 0.96 0.78; 1.18Unplanned cesarean delivery -0.110 0.90 0.44; 1.83 0.117 1.12 0.88; 1.43First CS 0.829 0.44 0.24; 0.79 -0.622 0.54 0.47; 0.62
Note: VBAC and unplanned cesarean delivery are compared to planned cesarean delivery.Abbreviations: First CS, the pregnancy number in which the patient undergoes cesarean delivery; CS, cesarean section; VBAC, vaginal birth after cesarean section.
Table 5 Delivery-related complications of patients who failed a trial of labor, those who had a nonurgent CS and those who had a VBAC
Complications 2nd delivery after index CS 3rd delivery after index CS
Failed TOL (n = 105)
Nonurgent CS (n = 1186)
VBAC (n = 1765)
P-value Failed TOL (n = 46)
Nonurgent CS (n = 596)
VBAC (n = 912)
P-value
Any delivery complications
4.8 (5) 3.6 (43) 0.1 (1) ,0.001 2.2 (1) 4.2 (25) 0.2 (2) ,0.001
Dehiscence 1.9 (2) 3.2 (38) 0 ,0.001 0 3.4 (20) 0.2 (2) ,0.001Blood products transfusion
1.0 (1) 0.3 (4) 0 0.010 2.2 (1) 0.7 (4) 0 0.008
Uterine rupture 2.9 (3) 0.2 (2) 0.1 (1) ,0.001 2.2 (1) 0.3 (2) 0 0.016
Notes: Data is presented in percentage. Failed TOL was defined as not-planned CS with labor dystocia; Nonurgent CS was defined as CS without indication for urgent CS when section is performed between 8am–3pm.Abbreviations: CS, cesarean section; TOL, trial of labor.
submit your manuscript | www.dovepress.com
Dovepress
Dovepress
101
Remote prognosis of recurrent VBAC versus cesarean deliveries

International Journal of Women’s Health 2012:4
(PROM) was defined as rupture of the chorioamniotic
membranes before the onset of labor. Uterine rupture was
defined as a complete tear of the uterine wall, including
the visceral peritoneum with establishment of a direct
communication between the uterine and abdominal cavi-
ties. Dehiscence was defined as an opening of the previous
cesarean scar with intact visceral peritoneum and no direct
communication between the uterine and abdominal cavi-
ties. Postpartum fever was defined as maternal temperature
$38°C, which developed at least 24 hours after delivery
recorded in two different measurements at least 4 hours apart
or one measurement of maternal temperature of $38.5°C
regardless of the time after delivery. Endometritis was
defined as postpartum maternal fever with clinical signs
of tenderness above the uterine fundus or during cervical
manipulation, foul vaginal discharge and positive endo-
metrial culture. Wound infection was defined according to
either clinical signs of infection or positive wound culture.
Wound dehiscence was defined as spontaneous opening of
CS wound including the abdominal fascia.
DisclosureThe authors report no conflicts of interest in this work and
the study was self-funded.
References 1. Martin JA, Hamilton BE, Sutton PD, Ventura SJ, Menacker F, Kirmeyer S.
Births: final data for 2004. Natl Vital Stat Rep. 2006;55(1):1–101. 2. Bangdiwala SI, Brown SS, Cunningham FG, et al. NIH Consensus
Development Conference Draft Statement on Vaginal Birth After Cesarean: New Insights. NIH Consens State Sci Statements. 2010 Mar 10;27(3). [Epub ahead of print.]
3. Menacker F. Trends in cesarean rates for first births and repeat cesarean rates for low-risk women: United States, 1990–2003. Natl Vital Stat Rep. 2005;54(4):1–8.
4. Martin JA, Hamilton BE, Sutton PD, et al; Centers for Disease Control and Prevention National Center for Health Statistics National Vital Statistics Sys-tem. Births: final data for 2005. Natl Vital Stat Rep. 2007;56(6):1–103.
5. Lydon-Rochelle MT, Gardella C, Cárdenas V, Easterling TR. Repeat cesarean delivery: what indications are recorded in the medical chart? Birth. 2006;33(1):4–11.
6. Allen VM, OConnell CM, Baskett TF. Maternal morbidity associated with cesarean delivery without labor compared with induction of labor at term. Obstet Gynecol. 2006;108(2):286–294.
7. Miller DA, Chollet JA, Goodwin TM. Clinical risk factors for placenta previa-placenta accreta. Am J Obstet Gynecol. 1997;177(1):210–214.
8. Flamm BL, Goings JR, Liu Y, Wolde-Tsadik G. Elective repeat cesarean delivery versus trial of labor: a prospective multicenter study. Obstet Gynecol. 1994;83(6):927–932.
9. Grobman WA, Gilbert S, Landon MB, et al. Outcomes of induction of labor after one prior cesarean. Obstet Gynecol. 2007;109(2 Pt 1):262–269.
10. McMahon MJ, Luther ER, Bowes WA Jr, Olshan AF. Comparison of a trial of labor with an elective second cesarean section. N Engl J Med. 1996;335(10):689–695.
11. Landon MB, Hauth JC, Leveno KJ, et al; National Institute of Child Health and Human Development Maternal-Fetal Medicine Units Network. Maternal and perinatal outcomes associated with a trial of labor after prior cesarean delivery. N Engl J Med. 2004;351(25):2581–2589.
12. Endres LK, Barnhart K. Spontaneous second trimester uterine rupture after classical cesarean. Obstet Gynecol. 2000;96(5 Pt 2):806–808.
13. Guise JM, McDonagh MS, Osterweil P, Nygren P, Chan BK, Helfand M. Systematic review of the incidence and consequences of uterine rupture in women with previous caesarean section. BMJ. 2004;329(7456):19–25.
14. Wen SW, Rusen ID, Walker M, et al; Maternal Health Study Group, Canadian Perinatal Surveillance System. Comparison of maternal mortality and morbidity between trial of labor and elective cesarean section among women with previous cesarean delivery. Am J Obstet Gynecol. 2004;191(4):1263–1269.
15. ACOG Practice bulletin no. 115: vaginal birth after previous cesarean delivery. Obstet Gynecol. 2010;116(2 Pt 1):450–463.
16. Mercer BM, Gilbert S, Landon MB, et al; National Institute of Child Health and Human Development Maternal-Fetal Medicine Units Network. Labor outcomes with increasing number of prior vaginal births after cesarean delivery. Obstet Gynecol. 2008;111(2 Pt 1):285–291.
17. Makoha FW, Felimban HM, Fathuddien MA, Roomi F, Ghabra T. Multiple cesarean section morbidity. Int J Gynaecol Obstet. 2004;87(3): 227–232.
18. Silver RM, Landon MB, Rouse DJ, et al; National Institute of Child Health and Human Development Maternal-Fetal Medicine Units Network. Maternal morbidity associated with multiple repeat cesarean deliveries. Obstet Gynecol. 2006;107(6):1226–1232.
19. Guise JM, Eden K, Emeis C, et al. Vaginal birth after cesarean: new insights. Evid Rep Technol Assess (Full Rep). 2010:1–397.
20. Costantine MM, Fox K, Byers BD, et al. Validation of the prediction model for success of vaginal birth after cesarean delivery. Obstet Gynecol. 2009;114(5):1029–1033.
Table 6b Cox proportional hazard ratio for factors associated with intra-partum and post-partum complications
Variable Intra-partum complications Post-partum complications
Parameter Estimate
Hazard Ratio
95% Confidence interval
Parameter Estimate
Hazard Ratio
95% Confidence interval
VBAC -0.85 0.43 0.21; 0.86 -0.07 0.93 0.75; 1.15Unplanned cesarean delivery
0.02 1.02 0.48; 2.17 0.07 1.07 0.82; 1.40
First CS -0.77 0.46 0.25; 0.83 -0.60 0.55 0.48; 0.63Labor dystocia -0.63 0.33 0.15; 1.89 -0.11 1.11 0.81; 1.54Maternal age -0.05 0.95 0.89; 1.01 -0.02 0.98 0.96; 0.996
Note: VBAC and unplanned cesarean delivery are compared to planned cesarean deliveryAbbreviations: CS, cesarean section; VBAC, vaginal birth after cesarean section; First CS, the pregnancy number in which the patient undergoes cesarean delivery.
submit your manuscript | www.dovepress.com
Dovepress
Dovepress
102
Erez et al

International Journal of Women’s Health 2012:4
21. Grobman WA, Lai Y, Landon MB, et al; National Institute of Child Health and Human Development (NICHD) Maternal-Fetal Medicine Units Network (MFMU). Development of a nomogram for pre-diction of vaginal birth after cesarean delivery. Obstet Gynecol. 2007;109(4):806–812.
22. Grobman WA, Lai Y, Landon MB, et al. Does information available at admission for delivery improve prediction of vaginal birth after cesarean? Am J Perinatol. 2009;26(10):693–701.
23. Grobman WA, Lai Y, Landon MB, et al; Eunice Kennedy Shriver National Institute of Child Health and Human Development Maternal-Fetal Medicine Units Network. Can a prediction model for vaginal birth after cesarean also predict the probability of morbidity related to a trial of labor? Am J Obstet Gynecol. 2009;200(1):56. e1–e6.
24. Peaceman AM, Gersnoviez R, Landon MB, et al; National Institute of Child Health and Human Development Maternal-Fetal Medicine Units Network. The MFMU Cesarean Registry: impact of fetal size on trial of labor success for patients with previous cesarean for dystocia. Am J Obstet Gynecol. 2006;195(4):1127–1131.
25. Landon MB, Leindecker S, Spong CY, et al; National Institute of Child Health and Human Development Maternal-Fetal Medicine Units Net-work. The MFMU Cesarean Registry: factors affecting the success of trial of labor after previous cesarean delivery. Am J Obstet Gynecol. 2005;193(3 Pt 2):1016–1023.
26. Bujold E, Gauthier RJ. Should we allow a trial of labor after a previous cesarean for dystocia in the second stage of labor? Obstet Gynecol. 2001;98(4):652–655.
27. Bais JM, van der Borden DM, Pel M, et al. Vaginal birth after caesarean section in a population with a low overall caesarean section rate. Eur J Obstet Gynecol Reprod Biol. 2001;96(2):158–162.
28. ACOG Committee on Practice Bulletins–Obstetrics. ACOG practice bulletin. Diagnosis and management of preeclampsia and eclampsia. Number 33, Jan 2002. Obstet Gynecol. 2002;99(1):159–167.
29. White P. Pregnancy complicating diabetes. Am J Med. 1949;7(5): 609–616.
30. Leiberman JR, Fraser D, Weitzman S, Glezerman M. Birthweight curves in southern Israel populations. Isr J Med Sci. 1993;29(4):198–203.
submit your manuscript | www.dovepress.com
Dovepress
Dovepress
103
Remote prognosis of recurrent VBAC versus cesarean deliveries
International Journal of Women’s Health 2012:4
Supplementary Table
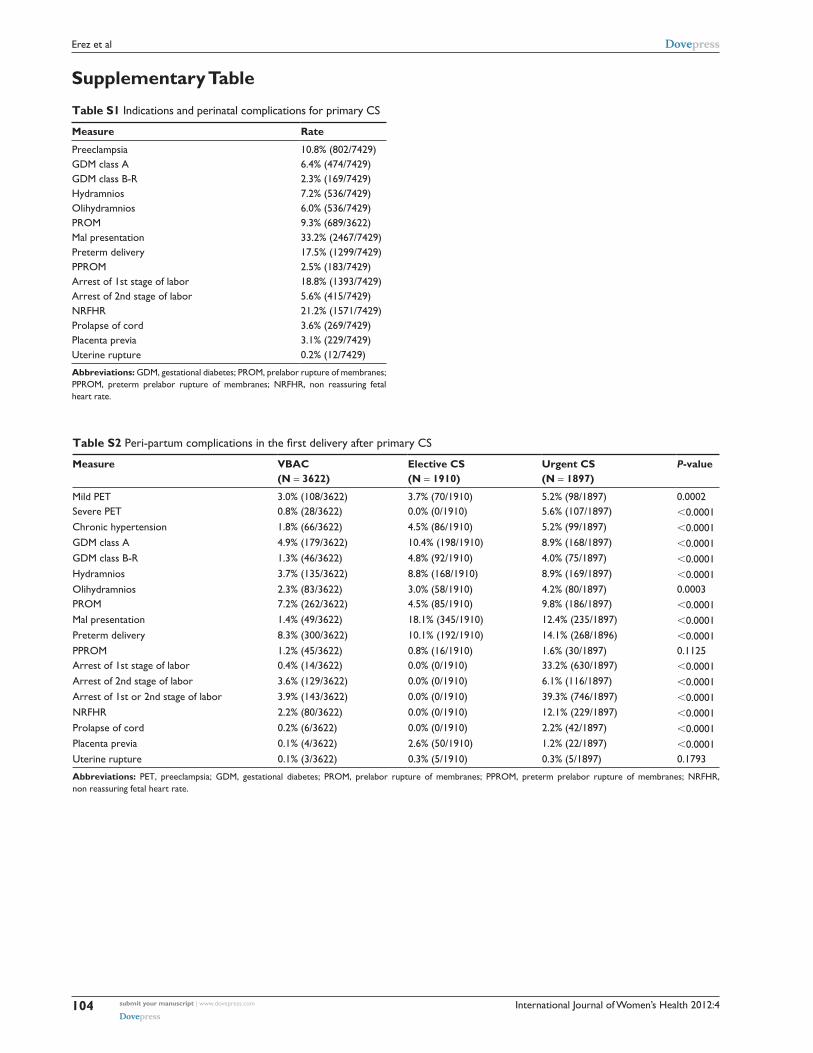
Table S1 Indications and perinatal complications for primary CS
Measure Rate
Preeclampsia 10.8% (802/7429)GDM class A 6.4% (474/7429)GDM class B-R 2.3% (169/7429)Hydramnios 7.2% (536/7429)Olihydramnios 6.0% (536/7429)PROM 9.3% (689/3622)Mal presentation 33.2% (2467/7429)Preterm delivery 17.5% (1299/7429)PPROM 2.5% (183/7429)Arrest of 1st stage of labor 18.8% (1393/7429)Arrest of 2nd stage of labor 5.6% (415/7429)NRFHR 21.2% (1571/7429)Prolapse of cord 3.6% (269/7429)Placenta previa 3.1% (229/7429)Uterine rupture 0.2% (12/7429)
Abbreviations: GDM, gestational diabetes; PROM, prelabor rupture of membranes; PPROM, preterm prelabor rupture of membranes; NRFHR, non reassuring fetal heart rate.
Table S2 Peri-partum complications in the first delivery after primary CS
Measure VBAC (N = 3622)
Elective CS (N = 1910)
Urgent CS (N = 1897)
P-value
Mild PET 3.0% (108/3622) 3.7% (70/1910) 5.2% (98/1897) 0.0002Severe PET 0.8% (28/3622) 0.0% (0/1910) 5.6% (107/1897) ,0.0001Chronic hypertension 1.8% (66/3622) 4.5% (86/1910) 5.2% (99/1897) ,0.0001GDM class A 4.9% (179/3622) 10.4% (198/1910) 8.9% (168/1897) ,0.0001GDM class B-R 1.3% (46/3622) 4.8% (92/1910) 4.0% (75/1897) ,0.0001Hydramnios 3.7% (135/3622) 8.8% (168/1910) 8.9% (169/1897) ,0.0001Olihydramnios 2.3% (83/3622) 3.0% (58/1910) 4.2% (80/1897) 0.0003PROM 7.2% (262/3622) 4.5% (85/1910) 9.8% (186/1897) ,0.0001Mal presentation 1.4% (49/3622) 18.1% (345/1910) 12.4% (235/1897) ,0.0001Preterm delivery 8.3% (300/3622) 10.1% (192/1910) 14.1% (268/1896) ,0.0001PPROM 1.2% (45/3622) 0.8% (16/1910) 1.6% (30/1897) 0.1125Arrest of 1st stage of labor 0.4% (14/3622) 0.0% (0/1910) 33.2% (630/1897) ,0.0001Arrest of 2nd stage of labor 3.6% (129/3622) 0.0% (0/1910) 6.1% (116/1897) ,0.0001Arrest of 1st or 2nd stage of labor 3.9% (143/3622) 0.0% (0/1910) 39.3% (746/1897) ,0.0001NRFHR 2.2% (80/3622) 0.0% (0/1910) 12.1% (229/1897) ,0.0001Prolapse of cord 0.2% (6/3622) 0.0% (0/1910) 2.2% (42/1897) ,0.0001Placenta previa 0.1% (4/3622) 2.6% (50/1910) 1.2% (22/1897) ,0.0001Uterine rupture 0.1% (3/3622) 0.3% (5/1910) 0.3% (5/1897) 0.1793
Abbreviations: PET, preeclampsia; GDM, gestational diabetes; PROM, prelabor rupture of membranes; PPROM, preterm prelabor rupture of membranes; NRFHR, non reassuring fetal heart rate.
submit your manuscript | www.dovepress.com
Dovepress
Dovepress
104
Erez et al

International Journal of Women’s Health 2012:4
Table S3 Peri-partum complications in the second delivery after primary CS
Measure VBAC (N = 1765)
Elective CS (N = 1186)
Urgent CS (N = 685)
P-value
Mild PET 2.4% (42/1765) 1.9% (23/1186) 2.8% (19/685) 0.4934Severe PET 0.6% (10/1765) 0.0% (0/1186) 7.2% (49/685) ,0.0001Chronic hypertension 1.8% (32/1765) 4.5% (53/1186) 5.7% (39/685) ,0.0001GDM class A 4.1% (72/1765) 8.9% (105/1186) 9.1% (62/685) ,0.0001GDM class B-R 1.2% (21/1765) 4.0% (48/1186) 3.6% (25/685) ,0.0001Hydramnios 3.6% (64/1765) 8.3% (99/1186) 7.9% (54/685) ,0.0001Olihydramnios 2.2% (39/1765) 2.2% (26/1186) 3.5% (24/685) 0.1393PROM 6.7% (118/1765) 1.5% (18/1186) 9.5% (65/685) ,0.0001Mal presentation 1.3% (23/1765) 11.8% (140/1186) 14.6% (100/685) ,0.0001Preterm delivery 7.6% (135/1765) 14.1% (167/1186) 26.0% (178/685) ,0.0001PPROM 1.1% (20/1765) 0.6% (7/1186) 3.2% (22/685) ,0.0001Arrest of 1st stage of labor 0.1% (2/1765) 0.0% (0/1186) 11.5% (79/685) ,0.0001Arrest of 2nd stage of labor 1.2% (21/1765) 0.0% (0/1186) 3.1% (21/685) ,0.0001Arrest of 1st or 2nd stage of labor 1.3% (23/1765) 0.0% (0/1186) 14.6% (100/685) ,0.0001NRFHR 1.4% (25/1765) 0.0% (0/1186) 8.5% (58/685) ,0.0001Prolapse of cord 0.2% (3/1765) 0.0% (0/1186) 2.2% (15/685) ,0.0001Placenta previa 0.0% (0/1765) 2.3% (27/1186) 1.3% (9/685) ,0.0001Uterine rupture 0.1% (1/1765) 0.2% (2/1186) 0.6% (4/685) 0.0274
Abbreviations: PET, preeclampsia; GDM, gestational diabetes; PROM, prelabor rupture of membranes; PPROM, preterm prelabor rupture of membranes; NRFHR, non reassuring fetal heart rate.
Table S4 Peri-partum complications in the third delivery after primary CS
Measure VBAC (N = 912)
Elective CS (N = 596)
Urgent CS (N = 284)
P-value
Mild PET 2.5% (23/912) 1.7% (10/596) 1.8% (5/284) 0.4848Severe PET 0.7% (6/912) 0.0% (0/596) 9.2% (26/284) ,0.0001Chronic hypertension 1.3% (12/912) 4.2% (25/596) 5.3% (15/284) 0.0002GDM class A 5.3% (48/912) 9.2% (55/596) 8.8% (25/284) 0.0069GDM class B-R 1.3% (12/912) 3.7% (22/596) 4.2% (12/284) 0.0027Hydramnios 4.4% (40/912) 7.6% (45/596) 8.8% (25/284) 0.0055Olihydramnios 2.4% (22/912) 2.0% (12/596) 3.5% (10/284) 0.3985PROM 4.2% (38/912) 2.9% (17/596) 4.9% (14/284) 0.2537Mal presentation 1.4% (13/912) 13.3% (79/596) 18.0% (51/284) ,0.0001Preterm delivery 5.0% (46/912) 18.5% (110/596) 30.3% (86/284) ,0.0001PPROM 0.2% (2/912) 0.8% (5/596) 1.4% (4/284) 0.0561Arrest of 1st stage of labor 0.0% (0/912) 0.0% (0/596) 14.1% (40/284) ,0.0001Arrest of 2nd stage of labor 0.8% (7/912) 0.0% (0/596) 1.1% (3/284) 0.0694Arrest of 1st or 2nd stage of labor 0.8% (7/912) 0.0% (0/596) 15.1% (43/284) ,0.0001NRFHR 1.2% (11/912) 0.0% (0/596) 4.2% (12/284) ,0.0001Prolapse of cord 0.0% (0/912) 0.0% (0/596) 1.8% (5/284) ,0.0001Placenta previa 0.1% (1/912) 1.7% (10/596) 0.4% (1/284) 0.0010Uterine rupture 0.0% (0/912) 0.3% (2/596) 0.7% (2/284) 0.0697
Abbreviations: PET, preeclampsia; GDM, gestational diabetes; PROM, prelabor rupture of membranes; PPROM, preterm prelabor rupture of membranes; NRFHR, non reassuring fetal heart rate.
submit your manuscript | www.dovepress.com
Dovepress
Dovepress
105
Remote prognosis of recurrent VBAC versus cesarean deliveries

International Journal of Women’s Health 2012:4
Table S5 Peri-partum complications in the fourth delivery after primary CS
Measure VBAC (N = 514)
Elective CS (N = 256)
Urgent CS (N = 156)
P-value
Mild PET 3.3% (17/514) 0.4% (1/256) 1.9% (3/156) 0.0358Severe PET 0.6% (3/514) 0.0% (0/256) 6.4% (10/156) ,0.0001Chronic hypertension 1.6% (8/514) 3.1% (8/256) 5.8% (9/156) 0.0155GDM class A 5.1% (26/514) 6.6% (17/256) 5.8% (9/156) 0.6651GDM class B-R 1.4% (7/514) 4.7% (12/256) 3.2% (5/156) 0.0206Hydramnios 2.1% (11/514) 5.1% (13/256) 7.7% (12/156) 0.0037Olihydramnios 1.4% (7/514) 0.4% (1/256) 1.9% (3/156) 0.3267PROM 6.8% (35/514) 2.3% (6/256) 6.4% (10/156) 0.0327Mal presentation 1.4% (7/514) 11.3% (29/256) 13.5% (21/156) ,0.0001Preterm delivery 7.6% (39/514) 27.0% (69/256) 24.4% (38/156) ,0.0001PPROM 1.8% (9/514) 0.8% (2/256) 1.9% (3/156) 0.5241Arrest of 1st stage of labor 0.0% (0/514) 0.0% (0/256) 13.5% (21/156) ,0.0001Arrest of 2nd stage of labor 0.6% (3/514) 0.0% (0/256) 1.9% (3/156) 0.0595Arrest of 1st or 2nd stage of labor 0.6% (3/514) 0.0% (0/256) 15.4% (24/156) ,0.0001NRFHR 1.6% (8/514) 0.0% (0/256) 8.3% (13/156) ,0.0001Prolapse of cord 0.2% (1/514) 0.0% (0/256) 2.6% (4/156) 0.0007Placenta previa 0.0% (0/514) 2.3% (6/256) 1.3% (2/156) 0.0034Uterine rupture 0.0% (0/514) 1.6% (4/256) 0.6% (1/156) 0.0202
Abbreviations: PET, preeclampsia; GDM, gestational diabetes; PROM, prelabor rupture of membranes; PPROM, preterm prelabor rupture of membranes; NRFHR, non reassuring fetal heart rate.
Table S6 Perinatal outcome of first delivery after primary cesarean delivery according to the route of delivery
Measure VBAC N = 3622 CS N = 3807 P-value
Male fetus 49.9% (1806/3622) 53.0% (2019/3807) 0.007SGA 7.4% (267/3622) 6.1% (231/3807) 0.026LGA 8.3% (301/3622) 17.7% (674/3807) ,0.001APD 2.0% (73/3622) 0.4% (15/3807) ,0.001IPD 0.1% (5/3622) 0.0% (1/3807) 0.116PPD 0.6% (21/3622) 0.8% (32/3807) 0.2151 minutes Apgar score ,5
5.1% (186/3622) 13.2% (502/3807) ,0.001
5 minutes Apgar score ,7
3.7% (135/3622) 3.7% (142/3807) 1.000
Birth weight(grams) mean ± SD 3129.2 ± 569.0 3176.7 ± 641.3 ,0.001Birth weight (grams),1500 2.3% (82/3622) 1.9% (74/3807) ,0.0011500–2500 6.7% (243/3622) 9.7% (368/3807).2500 91.0% (3297/3622) 88.4% (3365/3807)Gestational age at delivery (weeks),28 1.0% (38/3622) 0.5% (19/3807) ,0.00128–32 1.0% (37/3622) 1.5% (59/3807)32–37 6.1% (220/3622) 9.7% (369/3807).37 91.9% (3327/3622) 88.3% (3360/3807)
Abbreviations: SGA, small for gestational age; LGA, large for gestational age; APD, ante partum death; IPD, intrapartum death; PPD, postpartum death.
submit your manuscript | www.dovepress.com
Dovepress
Dovepress
106
Erez et al

International Journal of Women’s Health
Publish your work in this journal
Submit your manuscript here: http://www.dovepress.com/international-journal-of-womens-health-journal
The International Journal of Women’s Health is an international, peer-reviewed open-access journal publishing original research, reports, reviews and commentaries on all aspects of women’s healthcare includ-ing gynecology, obstetrics, and breast cancer. Subject areas include: Chronic conditions (migraine headaches, arthritis, osteoporosis);
Endocrine and autoimmune syndromes; Sexual and reproductive health; Psychological and psychosocial conditions. The manuscript management system is completely online and includes a very quick and fair peer-review system. Visit http://www.dovepress.com/ testimonials.php to read real quotes from published authors.
International Journal of Women’s Health 2012:4
Table S7 Neonatal complications in patients with consecutive CS
Complications CS*2 (n = 3807) CS*3 (n = 1387) CS*4 (n = 504) CS*5 (n = 168)
APD 15 (0.4%) 18 (1.1%) 0 2 (1.2%)PPD 32 (0.8%) 1 (0.6%) 4 (0.8%) 6 (3.6%)IPD 1 (0.03%) 1 (0.1%) 0 0All mortality 48 (1.3%) 27 (2.0%) 4 (0.8%) 8 (4.8%)Apgar score at 1 minute ,5 502 (13.2%) 140 (10.1%) 43 (8.5%) 26 (15.5%)
Apgar score at 5 minutes ,7 142 (3.7%) 51 (3.7%) 12 (2.4%) 14 (8.3%)Birthweight 3176.7 ± 641.3 3021.4 ± 596.0 2952.5 ± 538.9 2903.4 ± 510.4SGA 231 (6.1%) 81 (5.8%) 28 (5.6%) 11 (6.6%)LGA 674 (17.7%) 210 (15.1%) 58 (11.5%) 19 (11.3%)Gestational age at delivery (mean ± S.D.) 38.5 ± 2.5 37.5 ± 2.1 37.2 ± 2.1 36.8 ± 3.1
Abbreviations: SGA, small for gestational age; LGA, large for gestational age; APD, ante partum death; IPD, intrapartum death; PPD, postpartum death; S.D., standard deviation.
Table S8 Neonatal complications in patients with consecutive VBAC
Complications VBAC*2 (n = 3622) VBAC *3 (n = 1721) VBAC *4 (n = 881) VBAC *5 (n = 506)
APD 73 (2.0%) 9 (0.7%) 9 (1.0%) 5 (1.0%)PPD 21 (0.8%) 11 (0.6%) 4 (0.5%) 0IPD 5 (0.1%) 1 (0.1%) 1 (0.1%) 0All mortality 99 (2.7%) 31 (1.8%) 14 (1.6%) 5 (1.0%)Apgar score at 1 minute ,5 186 (5.4%) 70 (4.1%) 36 (4.1%) 27 (5.3%)
Apgar score at 5 minutes ,7 135 (3.7%) 61 (3.5%) 30 (3.4%) 24 (4.7%)Birthweight 3129.2 ± 569.0 3187.0 ± 541.0 3215.9 ± 510.2 3224.0 ± 518.0SGA 267 (7.4%) 114 (6.6%) 61 (6.9%) 39 (7.7%)LGA 301 (8.3%) 189 (11.0%) 92 (10.4%) 72 (14.2%)Gestational age at delivery (mean ± S.D.) 39.1 ± 2.5 39.3 ± 2.3 39.5 ± 2.0 39.4 ± 2.1
Abbreviations: SGA, small for gestational age; LGA, large for gestational age; APD, ante partum death; IPD, intrapartum death; PPD, postpartum death; S.D., standard deviation.
submit your manuscript | www.dovepress.com
Dovepress
Dovepress
Dovepress
107
Remote prognosis of recurrent VBAC versus cesarean deliveries
Recommended
![[Paresthesia and spinal anesthesia for cesarean section: comparison of patient positioning]](https://img.pdfslide.net/doc/110x75/63621e69c78c28495d0bbb91/paresthesia-and-spinal-anesthesia-for-cesarean-section-comparison-of-patient-positioning.jpg)


