
Salinity from Space Unlocks Satellite-Based Assessment of OceanAcidificationPeter E. Land,*,† Jamie D. Shutler,‡ Helen S. Findlay,† Fanny Girard-Ardhuin,§ Roberto Sabia,∥
Nicolas Reul,§ Jean-Francois Piolle,§ Bertrand Chapron,§ Yves Quilfen,§ Joseph Salisbury,⊥
Douglas Vandemark,⊥ Richard Bellerby,# and Punyasloke Bhadury∇
†Plymouth Marine Laboratory, Prospect Place, The Hoe, Plymouth PL1 3DH, U.K.‡University of Exeter, Penryn Campus, Cornwall TR10 9FE, U.K.§Institut Francais Recherche Pour LExploitation de la Mer, Pointe du Diable, 29280 Plouzane France∥Telespazio-Vega U.K. for European Space Agency (ESA), ESTEC, Noordwijk, The Netherlands⊥Ocean Processes Analysis Laboratory, University of New Hampshire, Durham, New Hampshire 3824, United States#Norwegian Institute for Water Research, Thormøhlensgate 53 D, N-5006 Bergen, Norway∇Department of Biological Sciences, Indian Institute of Science Education and Research-Kolkata, Mohanpur 741 246, West BengalIndia
Approximately a quarter of the carbon dioxide (CO2) that weemit into the atmosphere is absorbed by the ocean. This oceanicuptake of CO2 leads to a change in marine carbonate chemistryresulting in a decrease of seawater pH and carbonate ionconcentration, a process commonly called “Ocean Acidification”.Salinity data are key for assessing the marine carbonate system,and new space-based salinity measurements will enable thedevelopment of novel space-based ocean acidification assess-ment. Recent studies have highlighted the need to develop newin situ technology for monitoring ocean acidification, but thepotential capabilities of space-based measurements remainlargely untapped. Routine measurements from space can providequasi-synoptic, reproducible data for investigating processes onglobal scales; they may also be the most efficient way to monitorthe ocean surface. As the carbon cycle is dominantly controlledby the balance between the biological and solubility carbonpumps, innovative methods to exploit existing satellite seasurface temperature and ocean color, and new satellite sea surfacesalinity measurements, are needed and will enable frequentassessment of ocean acidification parameters over large spatialscales.
1. INTRODUCTION
Each year global emissions of carbon dioxide (CO2) into ouratmosphere continue to rise. These increasing atmosphericconcentrations cause a net influx of CO2 into the oceans. Of theroughly 36 billion metric tons of CO2 that is emitted into our
atmosphere each year, approximately a quarter transfers into theoceans.1 This CO2 addition has caused a shift in the seawater−carbonate system, termed ocean acidification (OA), resulting in a26% increase in acidity and a 16% decrease in carbonate ionconcentration since the industrial revolution.2 Recently there hasbeen recognition that this acidification is not occurring uniformlyacross the global oceans, with some regions acidifying faster thanothers.3,4 However, the overall cause of OA remains consistent:the addition of CO2 into the oceans, and as such, it remains aglobal issue. Continual emissions of CO2 into the atmosphereover the next century will decrease average surface ocean pH tolevels which will be deleterious to many marine ecosystems andthe services they provide.5
While the seawater−carbonate system is relatively complex,two parameters have been suggested as pertinent to themonitoring and assessment of OA through time and space.These are pH (the measure of acidity) and calcium carbonate(CaCO3) mineral saturation state, with aragonite generallyconsidered to be an important CaCO3 mineral to be monitoredbecause of its relevance to marine organisms (e.g., corals) and itsrelative solubility. Thermodynamically, CaCO3 is stable whenthe saturation state (an index of the concentrations of calciumand carbonate ions) is greater than one and becomes unstablewhen seawater becomes undersaturated with these ions(saturation <1). While there is significant variability betweentypes of organism, there is ample experimental evidence thatmany calcifying organisms are sensitive to OA,6 and thatthresholds exist below which some organisms become stressedand their well-being and existence becomes threatened.7
Increasingly evidence suggests that the physiology and behaviorof calcifying and noncalcifying organisms can be impacted byincreasing OA,8 with cascading effects on the food chain andprotein supply for humans,3 and alterations to the functioning ofecosystems and feedbacks to our climate.9
In 2012 the Global Ocean Acidification Observing Network(GOA-ON, www.goa-on.org) was formed in an attempt to bringtogether expertise, data sets and resources to improve OA
Published: January 8, 2015
Feature
pubs.acs.org/est
© 2015 American Chemical Society 1987 DOI: 10.1021/es504849sEnviron. Sci. Technol. 2015, 49, 1987−1994

monitoring. At present, OA monitoring efforts are dominated byin situ observations from moorings, ships and associatedplatforms. While key to any monitoring campaign, in situ datatend to be spatially sparse, especially in inhospitable regions, andso on their own are unlikely to provide a comprehensive, robustand cost-effective solution to global OAmonitoring. The need tomonitor and study large areas of the Earth has driven thedevelopment of satellite-based sensors.Increasingly, as in situ data accumulate, attempts are being
made to use in situ hydrographic data10−13 and/or remotelysensed data14,15 to provide proxies and indicators for thecondition of the carbonate system, enabling data gaps to be filledin both space and time. The increased availability of in situ datacreates a substantial data set to develop and test the capabilities ofsatellite-derived products, and we suggest that the recentavailability of satellite-based salinity measurements providesnew key insights for studying and assessing OA from space.
2. THE COMPLEXITIES OF THE CARBONATE SYSTEMThe oceanic carbonate system can be understood and probedthrough four key parameters: total alkalinity (TA), dissolvedinorganic carbon (DIC), pH, and fugacity of CO2 ( f CO2). Thelatter may be replaced with the related partial pressure of CO2,pCO2, from which f CO2 can be calculated, and the two are oftenused interchangeably. In principle, knowledge of any two of thesefour is sufficient to solve the carbonate system equations.However, overdetermination, the process of measuring at leastthree parameters, is advantageous.The relationships between the different carbonate system
parameters are fundamentally driven by thermodynamics, henceinfluenced by temperature and pressure, and knowing these isfundamental for calculating the carbonate system as a whole.16
Water temperature is the major controller of the solubility ofCO2,
17 so seasonal changes in sea temperature can, depending onthe region, be significant for driving changes in f CO2 (andconsequently DIC and pH). Salinity affects the coefficients of thecarbonate system equations. Hence to solve the equations, it isnecessary to estimate temperature, salinity and pressure alongwith carbonate parameters.The ratio between ions (the constituents of salinity) will tend
to remain constant anywhere in the global oceans, resulting in astrong relationship between TA and salinity.18 Unfortunately, auniversal relationship between TA and salinity does not apply incertain regions, for instance in areas influenced by freshwateroutflows from rivers,7 or areas where calcification and/or CaCO3dissolution occurs, such as where calcifying plankton areprevalent.19 In these regions, it is therefore critical to gainadditional local knowledge. For example, different rivers will havedifferent ionic concentrations (and therefore different TAconcentrations) depending on the surrounding geology andhydrology.For DIC, f CO2 (or pCO2), and pH, the other important process
is biological activity.19 Removal or addition of CO2 by planktonphotosynthesis or respiration can be a significant component ofthe seasonal signal.20 Biological activity, in turn, is driven byfactors such as nutrient dynamics and light conditions, whichagain are regionally specific. Measurements of chlorophyll (aproxy for biomass) and/or oxygen concentration can be usefulfor interpreting the biological component of the carbon signal.The combination of these processes means that it is extremely
challenging to produce a global relationship between anycomponent of the carbonate system and its drivers. To enableus to understand these dynamics, extrapolation from collected
data points to the global ocean is needed, and along with modelpredictions, empirical relationships and data sets are importantand need to be studied and developed. OA needs to be assessedusing these relationships on a global scale, but regionalcomplexities, particularly where riverine and coastal processesdominate,21,22 cause significant challenges for global empiricalrelationships.
3. CURRENT IN SITU APPROACHES AND CHALLENGESLaboratory measurements are the gold standard for assessing thecarbonate system in seawater, with accuracy far in excess of thatachievable from satellites.23−25 However, research vessel time isexpensive and limited in coverage, so autonomous in situinstruments are also deployed, for example, on buoys, with lessaccuracy.26 A notable example is the Argo network of over 3000drifters, which measure temperature and salinity throughout thedeep global ocean. Interpolation of Argo data is much lesschallenging than for most in situ measurements. Argo is theclosest in situ data have come to the global, synopticmeasurements possible with satellites, but shallow or enclosedseas are not represented (there are as yet no Argo instruments inthe open Arctic Ocean). Table 1 lists more examples. Of the four
key parameters, only f CO2 (or pCO2) and pH are routinelymonitored in situ. As yet there are limited capabilities to measureDIC and TA autonomously, hence these parameters must bemeasured either in a ship-based laboratory or on land.
4. POTENTIAL OF SPACE BASED OBSERVATIONS4.1. Advantages and Disadvantages.While it has proven
difficult to use remote sensing to directly monitor and detectchanges in seawater pH and their impact on marine organisms,22
satellites can measure sea surface temperature and salinity (SSTand SSS) and surface chlorophyll-a, from which carbonatesystem parameters can be estimated using empirical relationships
Table 1. In Situ Datasets and Programs than Can Be Used forthe Development and Validation of OA Remote SensingAlgorithms
data set nameand reference
temporalperiod
geographiclocation variables
no. of datapoints
SOCAT v2.027 1968−2011 global* f CO2, SSS, SST 6 000 000+
LDEO v201228 1980-present global* pCO2, SSS, SST 6 000 000+
GLODAP29 1970−2000 global TA, DIC, SSS,SST, Nitrate
10 000+
CARINA AMSv1.230
1980−2006 Arctic TA, DIC, SSS,SST
1500+
CARINA ATLv1.031
Atlantic
CARINA SOv1.132
SouthernOcean
AMT33 1995-present Atlantic pCO2W, SSS,SST, Chl, pH
1000+
NIVAFerrybox34
2008-present Arctic pCO2W, TA,DIC, SSS,SST
1000+
OWS Mike35 1948−2009 Arctic TA, DIC, SSS,SST, Chl
1000+
RAMA Mooredbuoy array36
2007-present Bay ofBengal
SSS, SST 1000+
ARGO buoys37 2003-present global SSS, SST 1 000 000+
OOI38 2014 onward global (sixsites)
pCO2, SSS, SST,nitrate
new program
SOCCOM39 2014 onward SouthernOcean
SSS, SST, pH,nitrate
new program
Environmental Science & Technology Feature
DOI: 10.1021/es504849sEnviron. Sci. Technol. 2015, 49, 1987−1994
1988
derived from in situ data. Although surface measurements maynot be representative of important biological processes, forexample, fish or shellfish, observations at the surface areparticularly important for OA because the change in carbonatechemistry due to atmospheric CO2 occurs in the surface first.Thus, satellites have great potential as a tool for assessing changesin carbonate chemistry.SST has been measured from space with infrared radiometry
since the 1960s, but the data are only globally of sufficient qualityfor climate studies since 1991.40 Satellite measurements ofchlorophyll-a in the visible are more recent, starting in 1986 anddelivering high quality global data since 1997.41 Both measure-ments are made globally at high spatial and temporal resolution,but with data gaps due to effects such as cloud, which can greatlyaffect data availability in cloudy regions. SST is measured in thetop few microns, and chlorophyll-a is generally measured todepths around 1−100 m, depending on water clarity. Dataquality can be affected by many issues, for example, adjacent landor ice may affect both SST and chlorophyll-a retrievals, andsuspended sediment may affect chlorophyll-a retrievals.Only since 2009 has a satellite-based capability for measuring
SSS existed. Increasing salinity decreases the emissivity ofseawater and so changes the microwave radiation emitted at thewater surface. ESA Soil Moisture and Ocean Salinity (SMOS)and NASA-CONAE Aquarius (launched in 2009 and 2011respectively, both currently in operation), are L-band microwavesensors designed to detect variations in microwave radiation andthus estimate ocean salinity in the top centimeter. Theinstruments are novel and the measurement is very challenging,and research is ongoing to improve data quality.42 Theinstruments can measure every few days at a spatial resolutionof 35−100 km, but single measurements are very noisy, so theinstantaneous swath data are generally spatially and temporallyaveraged over 10 days or a month, with an intended accuracyaround 0.1−0.2 g/kg for monthly 200 km data. A particular issueclose to urban areas is radio frequency interference from illegalbroadcasts, which are gradually being eliminated but still result inlarge data gaps, particularly for SMOS. The signal can be affectedby nearby land or sea ice, and the sensitivity to SSS decreases forcold water, by about 50% from 20 to 0 °C.43
With these challenges, a central question is whether satelliteSSS can bring new complementary information to in situ SSSmeasurements such as Argo for assessing OA. Directcomparisons44,45 indicate differences of 0.15−0.5 g/kg in a 1°× 1° region over 10−30 days. The two are difficult to comparedirectly, however, as Argo measures 5 m or more from thesurface, so some differences are expected even in the absence oferrors, especially where the water column is stratified. A betterstrategy might be to compare their effectiveness in estimatingOA. How the uncertainties propagate through the carbonatesystem calculations is the subject of ongoing research.Despite biases and uncertainties, satellite measurements of
SSS in the top centimeter contain geophysical information notdetected by Argo.46,47 In addition, Argo coverage can be muchpoorer than satellite SSS in several regions such as the majorwestern boundary or equatorial currents and across strongoceanic fronts. The use of interpolated Argo products presents anadditional source of uncertainty due to the interpolationscheme.48 Satellite SSS can also resolve mesoscale spatialstructures not resolved by Argo measurements,49 and unlikeArgo, satellites provide a synoptic “snapshot” of a region at agiven time.
Regular mapping of the SSS field with unprecedentedtemporal and spatial resolution at global scale is now possiblefrom satellites. The impact of using satellite SSS for carbonatesystem algorithms can now be tested, where previously there wasa reliance on climatology, in situ or model data. For example, thisprovides themeans to study the impact that freshwater influences(sea ice melt, riverine inputs and rain) can have on the marinecarbonate system. The use of satellite SSS data will also allowevaluation of the impact on the carbonate system of the inter- andintra-annual variations in SSS.Recent advances in radar altimetry (e.g., Cryosat-2 and
Sentinel 1 satellites and sensors) are already enabling significantimprovements in satellite sea-ice thickness measurements.50
Thin sea ice thickness can now also be determined from SMOS,complementing altimeter estimates mostly valid for thick seaice.51 Sea ice thickness is important for OA research as it indicateswhether ice is seasonal or multiyear, supporting the interpreta-tion of carbonate parameters. Altimetry is also used to measurewind speeds and increases the coverage of scatterometerestimates in polar regions. It provides higher-resolution (alongtrack) estimates of surface wind stress, which can potentially beused to indicate regions of upwelling. Wind-driven upwellingcauses dense cooler water (with higher concentrations of CO2and thus more acidic) to be drawn up from depth to the oceansurface. This upwelling can have significant impacts on local OAand ecosystems,4,52 especially at eastern oceanic boundaries.53,54
It is important to emphasize that the use of Earth observationdata to derive carbonate parameters should not be seen as areplacement for in situ measurement campaigns, especially dueto the current reliance on empirical and regional algorithms.Earth observation algorithms need calibration and validationwith in situ data such as those taken by GOA-ON, and if thecarbonate system response changes over time, empirical andregional algorithms tuned to previous conditions may becomeless reliable.
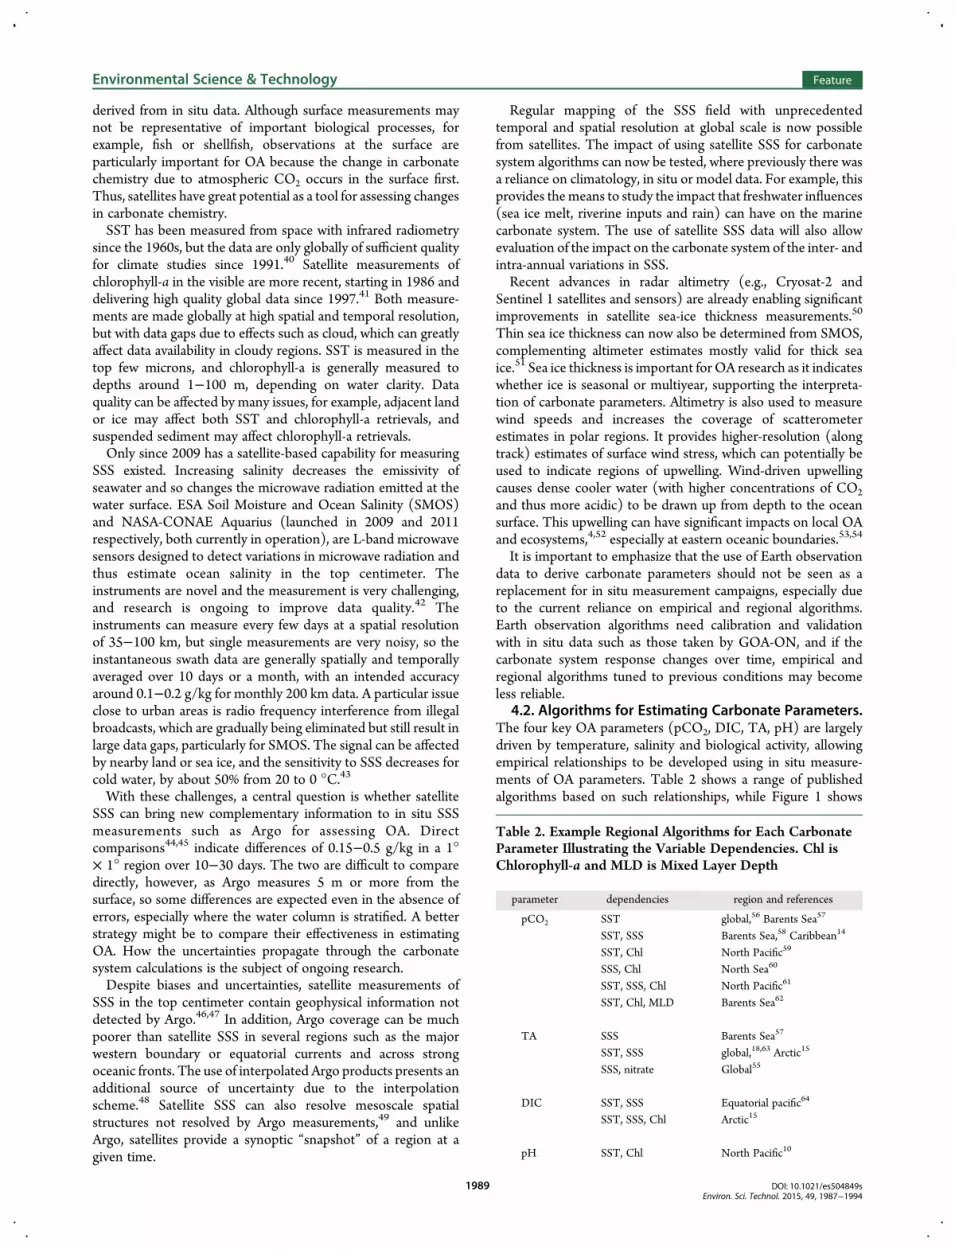
4.2. Algorithms for Estimating Carbonate Parameters.The four key OA parameters (pCO2, DIC, TA, pH) are largelydriven by temperature, salinity and biological activity, allowingempirical relationships to be developed using in situ measure-ments of OA parameters. Table 2 shows a range of publishedalgorithms based on such relationships, while Figure 1 shows
Table 2. Example Regional Algorithms for Each CarbonateParameter Illustrating the Variable Dependencies. Chl isChlorophyll-a and MLD is Mixed Layer Depth
parameter dependencies region and references
pCO2 SST global,56 Barents Sea57
SST, SSS Barents Sea,58 Caribbean14
SST, Chl North Pacific59
SSS, Chl North Sea60
SST, SSS, Chl North Pacific61
SST, Chl, MLD Barents Sea62
TA SSS Barents Sea57
SST, SSS global,18,63 Arctic15
SSS, nitrate Global55
DIC SST, SSS Equatorial pacific64
SST, SSS, Chl Arctic15
pH SST, Chl North Pacific10
Environmental Science & Technology Feature
DOI: 10.1021/es504849sEnviron. Sci. Technol. 2015, 49, 1987−1994
1989

their geographical coverage. Both illustrate that most of theliterature has focused on the northern basins of the Pacific andAtlantic and the Arctic, especially the Barents Sea, with all otherregions only attracting algorithms for a single parameter or noneat all..55
NOAA’s experimental Ocean Acidification Product Suite(OAPS) is a regional example of using empirical algorithms witha combination of climatological SSS and satellite SST to providesynoptic estimates of sea surface carbonate chemistry in theGreater Caribbean Region.14 pCO2 and TA were derived fromclimatological SSS and satellite SST, then used to calculatemonthly estimates of the remaining carbonate parameters,including aragonite saturation state and carbonate ion concen-tration. In general the derived data were in good agreement within situ measured data (e.g., mean derived TA = 2375 ± 36 μmolkg−1 compared to a mean ship-measured TA = 2366 ± 77 μmolkg−1). OAPS works well in areas where chlorophyll-a is low,however in regions of high chlorophyll-a, where net productivityis likely to perturb the carbonate system, and in areas where thereare river inputs, the approach tends to underestimate aragonitesaturation state, for example.21
A quite different approach is the assimilation of satellite datainto ocean circulation models.65 The model output carbonateparameters can then be used directly. This allows satellite-observed effects to be extended below the water surface, albeitwith the uncertainties inherent in model data. Here we seek toassess the direct use of satellite data through empirical algorithmsto improve OA estimates.4.3. Regions of Interest for Earth Observation. Arctic
Seas. It is increasingly recognized that the Polar Oceans (Arcticand Antarctic) are particularly sensitive to OA.66 Lower alkalinity(and thus buffer capacity), enhanced warming, reduced sea-icecover resulting in changes in the freshwater budget,67 andnutrient limitation make it more vulnerable to future OA.68
Retreating ice also provides increased open water for air-sea gasexchange and primary production.69
The remote nature of the Arctic Ocean provides difficulties forcollecting in situ data sets, with limited ship, autonomous vehicleand buoy access, and in situ data collection during winter monthsis often impossible. Therefore, the use of remote sensingtechniques is very attractive, if sufficient in situ data can be found
to calibrate satellite algorithms, and if the challenges of Arcticremote sensing can be overcome. These waters are verychallenging regions for satellite remote sensing. For instance,low water temperatures reduce the sensitivity range of SSSsensors,43 and sea ice can complicate retrievals of SSS andchlorophyll-a.70,71 Improvement in the accuracy of high latitudesatellite SSS is expected soon by combining observations fromSMOS, Aquarius and the upcoming SMAP sensor, all polar-orbiting L-band radiometers.
The Bay of Bengal.This region is clearly a focus of current OAresearch with unique characteristics due to the large freshwaterinfluence. The flow of fresh water from theGanges Delta into Bayof Bengal (42 000 m3/sec) represents the second greatestdischarge source in the world. Additionally, rainfall along withfreshwater inputs exceeds evaporation, resulting in net water gainannually in the Bay of Bengal. Collectively these provide anannual positive water balance that reduces surface salinity by 3−7g/kg compared to the adjacent Arabian Sea,72,73 resulting indistinctly different biogeochemical regimes.74 Biogeochemically,the Indian Ocean is one of the least studied and most poorlyunderstood ocean basins in the world.74 This is particularly truefor the Bay of Bengal where a relatively small number ofhydrographic sections and underway surface observations havebeen undertaken, despite the notable influence of freshwater onparticle dynamics, air-sea carbon flux and surface carbonatechemistry.75−79 North of 15° S, TA increases relative tosalinity,80 indicating the presence of an important land sourcethat can broadly affect acidification dynamics.To date there is little work on acidification dynamics and air
sea exchange of CO2 in the Bay of Bengal.81−83 In 2013, the Bay
of Bengal Ocean Acidification (BOBOA)Mooring was deployedfor the first time in Bay of Bengal (15°N, 90°E) by PMEL(NOAA) and the Bay of Bengal Large Marine EcosystemProgram (BOBLME). Data from the buoy will improve ourunderstanding of biogeochemical variations in the open oceanenvironment of the Bay of Bengal.It is an open question whether SSS can be used to estimate TA
in the Bay of Bengal. An important step toward answering thisquestion would be to investigate the spatial variability of the TAto salinity relationship in the region. Use of satellite SSS in theregion is also challenged by heavy radio frequency interference.
Figure 1. Number of key carbonate parameters ( f CO2 or pCO2, TA, DIC, pH) for which regional algorithms exist in the literature that can beimplemented using just satellite Earth observation data. Regions are indicative of open ocean areas, as implementation of algorithms in coastal areas maybe problematic.
Environmental Science & Technology Feature
DOI: 10.1021/es504849sEnviron. Sci. Technol. 2015, 49, 1987−1994
1990

The Greater Caribbean and the Amazon plume. The reefsin the Greater Caribbean Region are economically important tothe US and Caribbean nations with an estimated annual net valueof US$3.1−4.6 billion in 2000.84 At least two-thirds of these reefsare threatened from human impacts including OA. The skeletonof a coral is made of aragonite and the growth of their skeletons isreduced by OA,6 and numerous studies have shown a net declinein coral calcification (growth) rates in accordance with decliningCaCO3 saturation state.85 The waters of the Greater Caribbeanregion are predominantly oligotrophic and similar to thesubtropical gyre from which it receives most of its water.14
While the often shallow water environments of coral reefs andthe plethora of small islands can make it challenging for Earthobservation instruments to collect reliable data, the oligotrophicnature and the similarities in water type across the whole regionmake it ideal for the development of novel products. This regiontherefore provides an ideal case study to develop and evaluatealgorithms representative of a shallow, oligotrophic environ-ment.The Amazon plume, south of the Greater Caribbean, is the
largest freshwater discharge source in the world (209 000 m3/sec). It can cause SSS decreases of several units many hundreds ofkilometers from land, and has an area that seasonally can reach106 km2. These characteristics make it an ideal case study fortesting and evaluating remote sensing algorithms, particularly tostudy the space-time resolution trade-offs using SSS sensors.
5. FUTURE OPPORTUNITIES AND FOCUSThe Copernicus program is a European flagship initiative, worthmore than €7 billion, which aims to provide an operationalsatellite monitoring capability and related services for theenvironment and security.86 The launch of the Sentinel-1Asatellite in 2014 signaled its start. Of the five Sentinel satellitetypes, Sentinels 2 and 3 are most appropriate for assessment ofthe marine carbonate system.87−89 These satellites will providechlorophyll-a and SST with unprecedented spatial and temporalcoverage. The development of higher spatial resolution geosta-tionary sensors that continually monitor chlorophyll-a and SSTover the same area of the Earth also holds much potential for thefuture of OA assessment and research.90 These satellites andsensors are able to provide 10 or more observations per day,allowing the study of the effect of tidal and diurnal cycles on OA.The societal importance of measuring and observing the globalcarbon cycle was further highlighted with the launch of theNASAOrbiting Carbon Observatory (OCO-2) in 2014. This satelliteand its sensors are designed to observe atmospheric CO2concentrations, but its potential for marine carbon cycle andOA is likely to be a focus of future research.SMOS and Aquarius have recently passed their nominal
lifetimes, with SMOS now extended until 2017. Based on thelifetimes of previous satellite Earth observation sensors, they maywell operate until the early 2020s. NASA’s SMAP satellite, to belaunched in January 2015, should provide short-term continuity.The development of the technology and the clear importance ofmonitoring ocean salinity are likely to support the developmentof future satellite sensors. Also, historical time series data fromalternative microwave sensors hold the potential for a 10+ yeartime series of satellite based SSS observations,91 and this sort ofmeasurement record is likely to extend into the future as it formsthe basis of a global SSS monitoring effort.In summary, satellite products developed up to now in the OA
context have been regional, empirical or derived with a limitedvariety of satellite data sets, rendering an effort to systematically
exploit remote sensing assets (capitalizing on the recent adventof satellite salinity measurements) absolutely timely. To-datethere is only regional application of satellite SST to address theissue of assessing OA,62 along with two nonpeer-reviewedattempts to calculate carbonate system products using satelliteSSS data.92,93 Supported by good in situ measurementcampaigns, especially in places with currently poor in situcoverage such as the Arctic, satellite measurements are likely tobecome a key element in understanding and assessing OA.
■ AUTHOR INFORMATIONCorresponding Author*E-mail: [email protected] ContributionsThe manuscript was written through contributions of all authors.All authors have given approval to the final version of themanuscript.FundingThis work was funded by the European Space Agency Support toScience Element Pathfinders Ocean Acidification project(contract No. 4000110778/14/I-BG).NotesThe authors declare no competing financial interest.BiographyPeter Land is a remote sensing scientist at Plymouth Marine Laboratory(PML), specializing in atmosphere-ocean gas exchange and carbonatechemistry. Jamie Shutler is an oceanographer and former EuropeanSpace Agency (ESA) fellow specializing in atmosphere-ocean gasexchange at the University of Exeter. Helen Findlay is an oceanographerat PML specializing in ocean acidification and carbonate chemistry.Fanny Girard-Ardhuin is a remote sensing scientist specializing in sea iceat l’Institut Francais de Recherche pour l’Exploitation de la Mer(Ifremer). Nicolas Reul is a remote sensing scientist at Ifremer andmember of the SMOS scientific team. Jean-Francois Piolle is a computerscientist at Ifremer. Bertrand Chapron leads remote sensing research atIfremer. Yves Quilfen is an altimetry remote sensing scientist at Ifremer.Joseph Salisbury and Douglas Vandemark are oceanographers at theUniversity of NewHampshire focusing on biogeochemistry and ecologyin coastal areas. Richard Bellerby is a chemical oceanographer at theNorwegian Institute for Water Research, a member of the GOA-ONexecutive committee, and leader of the AMAP and SCAR oceanacidification working groups. Punyasloke Bhadury is a coastal ecologistat the Indian Institute of Science Education and Research-Kolkata.Roberto Sabia is a specialist in remote sensing of salinity working forESA.
■ ACKNOWLEDGMENTSThis work was enabled by European Space Agency (ESA)Support to Science Element (STSE) Pathfinders OceanAcidification project (contract No. 4000110778/14/I-BG).The authors gratefully acknowledge the assistance of DiegoFernandez (STSE programme manager).
■ REFERENCES(1) Stocker, T. F.; Qin, D.; Plattner, G. K.; Tignor, M.; Allen, S. K.;Boschung, J.; Nauels, A.; Xia, Y.; Bex, V.; Midgley, P. M. Climate Change2013: The Physical Science Basis. Intergovernmental Panel on ClimateChange, Working Group I Contribution to the IPCC Fifth AssessmentReport (AR5); Cambridge Univ. Press: New York, 2013.(2) Fabry, V. J.; Seibel, B. A.; Feely, R. A.; Orr, J. C. Impacts of oceanacidification on marine fauna and ecosystem processes. ICES J. Mar. Sci.2008, 65 (3), 414−432.
Environmental Science & Technology Feature
DOI: 10.1021/es504849sEnviron. Sci. Technol. 2015, 49, 1987−1994
1991
(3) Turley, C.; Eby, M.; Ridgwell, A. J.; Schmidt, D. N.; Findlay, H. S.;Brownlee, C.; Riebesell, U.; Fabry, V. J.; Feely, R. A.; Gattuso, J. P. Thesocietal challenge of ocean acidification. Mar. Pollut. Bull. 2010, 60 (6),787−792.(4) Feely, R. A.; Sabine, C. L.; Hernandez-Ayon, J. M.; Ianson, D.;Hales, B. Evidence for upwelling of corrosive “acidified” water onto thecontinental shelf. Science 2008, 320 (5882), 1490−1492.(5) Bellerby, R. G. J. UN biodiversity and OA report. http://www.cbd.int/ts.(6) Kroeker, K. J.; Kordas, R. L.; Crim, R.; Hendriks, I. E.; Ramajo, L.;Singh, G. S.; Duarte, C. M.; Gattuso, J. P. Impacts of ocean acidificationon marine organisms: Quantifying sensitivities and interaction withwarming. Global Change Biol. 2013, DOI: 10.1111/gcb.12179.(7) Salisbury, J.; Green,M.; Hunt, C.; Campbell, J. Coastal acidificationby rivers: A threat to shellfish? Eos, Trans. Am. Geophys. Union 2008, 89(50), 513.(8) Widdicombe, S.; Spicer, J. I. Predicting the impact of oceanacidification on benthic biodiversity: What can animal physiology tellus? J. Exper. Mar. Biol. Ecol. 2008, 366 (1), 187−197.(9) Ridgwell, A.; Schmidt, D. N.; Turley, C.; Brownlee, C.; Maldonado,M. T.; Tortell, P.; Young, J. R. From laboratory manipulations to Earthsystem models: Scaling calcification impacts of ocean acidification.Biogeosciences 2009, 6 (11), 2611−2623.(10) Nakano, Y.; Watanabe, Y. W. Reconstruction of pH in the surfaceseawater over the north Pacific basin for all seasons using temperatureand chlorophyll-a. J. Oceanogr. 2005, 61 (4), 673−680.(11) Juranek, L. W.; Feely, R. A.; Peterson, W. T.; Alin, S. R.; Hales, B.;Lee, K.; Sabine, C. L.; Peterson, J. A novel method for determination ofaragonite saturation state on the continental shelf of central Oregonusing multi-parameter relationships with hydrographic data. Geophys.Res. Lett. 2009, 36 (24), L24601.(12) Midorikawa, T.; Inoue, H. Y.; Ishii, M.; Sasano, D.; Kosugi, N.;Hashida, G.; Nakaoka, S.-i.; Suzuki, T. Decreasing pH trend estimatedfrom 35-year time series of carbonate parameters in the Pacific sector ofthe SouthernOcean in summer.Deep Sea Res., Part I 2012, 61, 131−139.(13) Bostock, H. C.; Mikaloff Fletcher, S. E.; Williams, M. J. M.Estimating carbonate parameters from hydrographic data for theintermediate and deep waters of the Southern Hemisphere Oceans.Biogeosci. Discuss. 2013, 10 (4), 6225−6257.(14) Gledhill, D. K.; Wanninkhof, R.; Millero, F. J.; Eakin, M. Oceanacidification of the greater Caribbean region 1996−2006. J. Geophys. Res.2008, 113 (C10), C10031.(15) Arrigo, K. R.; Pabi, S.; van Dijken, G. L.; Maslowski, W. Air-seaflux of CO2 in the Arctic Ocean, 1998−2003. J. Geophys. Res. 2010, 115(G4), G04024.(16) Dickson, A. G.; Goyet, C. Handbook of Methods for the Analysis ofthe Various Parameters of the Carbon Dioxide System in Sea Water, 1992;Vol. 2.(17) Weiss, R. F. Carbon dioxide in water and seawater: The solubilityof a non-ideal gas. Mar. Chem. 1974, 2 (3), 203−215.(18) Lee, K.; Tong, L. T.; Millero, F. J.; Sabine, C. L.; Dickson, A. G.;Goyet, C.; Park, G. H.; Wanninkhof, R.; Feely, R. A.; Key, R. M., Globalrelationships of total alkalinity with salinity and temperature in surfacewaters of the world’s oceans. Geophys. Res. Lett. 2006, 33, (19).(19) Smith, S. V.; Key, G. S. Carbon dioxide and metabolism in marineenvironments. Limnol. Oceanogr 1975, 20 (3), 493−495.(20) Sarmiento, J. L.; Gruber, N. Ocean Biogeochemical Dynamics;Cambridge University Press, 2006; Vol. 503.(21) Gledhill, D. K.; Wanninkhof, R.; Eakin, C. M., Observing oceanacidification from space. Oceanography 2009, 22.(22) Sun, Q.; Tang, D.; Wang, S. Remote-sensing observationsrelevant to ocean acidification. Int. J. Rem. Sensing 2012, 33 (23), 7542−7558.(23) Dickson, A. G., The carbon dioxide system in seawater:Equilibrium chemistry and measurements. In Guide to Best Practicesfor Ocean Acidification Research and Data Reporting, Riebesell, U.; Fabry,C. J.; Hansson, L.; Gattuso, J.-P., Eds.; European Commission: Brussels,2011; pp 17−40.
(24) DicksonA. G.SabineC. L.ChristianJ. R.Guide to Best Practices forOcean CO2 Measurements, PICES Special Publication 3, 2007(25) Byrne, R. H.Measuring Ocean Acidification: NewTechnology fora New Era of Ocean Chemistry. Environ. Sci. Technol. 2014, 48 (10),5352−5360.(26)Martz, T. R.; Connery, J. G.; Johnson, K. S. Testing theHoneywellDurafet® for seawater pH applications. Limnol. Oceanogr. Methods2010, 8, 172−184.(27) Bakker, D. C. E.; Hankin, S.; Olsen, A.; Pfeil, B.; Smith, K.; Alin, S.R.; Cosca, C.; Hales, B.; Harasawa, S.; Kozyr, A. An update to the surfaceocean CO2 Atlas (SOCAT version 2). Earth Syst. Sci. Data 2014,DOI: 10.5194/essd-6-69-2014.(28) Takahashi, T.; Sutherland, S. C.; Kozyr, A. Global Ocean SurfaceWater Partial Pressure of CO2 Database: Measurements Performed During1957−2012 (Version 2012), ORNL/CDIAC-160, NDP-088(V2012);Carbon Dioxide Information Analysis Center, Oak Ridge NationalLaboratory, U.S. Department of Energy: Oak Ridge, TN, 2013.(29) Key, R. M.; Kozyr, A.; Sabine, C. L.; Lee, K.; Wanninkhof, R.;Bullister, J. L.; Feely, R. A.; Millero, F. J.; Mordy, C.; Peng, T. H., Aglobal ocean carbon climatology: Results from Global Data AnalysisProject (GLODAP). Global Biogeochem. Cycles 2004, 18, (4).(30) CARINA group. Carbon in the Arctic Mediterranean Seas RegionThe CARINA Project: Results and Data, Version 1.2; Carbon DioxideInformation Analysis Center, Oak Ridge National Laboratory, U.S.Department of Energy: Oak Ridge, TN, 2009.(31) CARINA group. Carbon in the Atlantic Ocean RegionTheCARINA Project: Results and Data, Version 1.0.; Carbon DioxideInformation Analysis Center, Oak Ridge National Laboratory, U.S.Department of Energy: Oak Ridge, TN, 2009.(32) CARINA group. Carbon in the Southern Ocean RegionTheCARINA Project: Results and Data, Version 1.1.; Carbon DioxideInformation Analysis Center, Oak Ridge National Laboratory, U.S.Department of Energy: Oak Ridge, TN, 2010.(33) Robinson, C.; Holligan, P.; Jickells, T.; Lavender, S. The AtlanticMeridional Transect Programme (1995−2012). Deep Sea Res., Part II2009, 56 (15), 895−898.(34) Yakushev, E. V.; Sørensen, K. On seasonal changes of thecarbonate system in the Barents Sea: Observations and modeling. Mar.Biol. Res. 2013, 9 (9), 822−830.(35) Skjelvan, I.; Falck, E.; Rey, F.; Kringstad, S. B. Inorganic carbontime series at Ocean Weather Station M in the Norwegian Sea.Biogeosciences 2008, 5, 549−560.(36) McPhadenM. J.MeyersG.AndoK.MasumotoY.MurtyV. S.N.RavichandranM.SyamsudinF.VialardJ.YuL.YuW.RAMA: The Re-search Moored Array for African−asian−australian Monsoon Analysisand Prediction, 2009(37) ARGO Argo - part of the integrated global observation strategy.http://www.argo.ucsd.edu (14/12/2014),.(38) OOI Ocean Observatories Initiative. http://oceanobservatories.org (14/12/2014),.(39) SOCCOM, Southern Ocean Carbon and Climate Observationsand Modeling. http://soccom.princeton.edu (accessed December 14,2014).(40) Merchant, C. J.; Embury, O.; Rayner, N. A.; Berry, D. I.; Corlett,G. K.; Lean, K.; Veal, K. L.; Kent, E. C.; Llewellyn-Jones, D. T.;Remedios, J. J., A 20 year independent record of sea surface temperaturefor climate from Along−Track Scanning Radiometers. J. Geophys. Res.:Oceans 2012, 117, (C12).(41) McClain, C. R.; Feldman, G. C.; Hooker, S. B. An overview of theSeaWiFS project and strategies for producing a climate research qualityglobal ocean bio-optical time series. Deep Sea Res., Part II 2004, 51 (1),5−42.(42) Font, J.; Boutin, J.; Reul, N.; Spurgeon, P.; Ballabrera-Poy, J.;Chuprin, A.; Gabarro, C.; Gourrion, J.; Guimbard, S.; Henocq, C. SMOSfirst data analysis for sea surface salinity determination. Int. J. Rem. Sens.2013, 34 (9−10), 3654−3670.(43) Font, J.; Camps, A.; Borges, A.; Martín-Neira, M.; Boutin, J.; Reul,N.; Kerr, Y. H.; Hahne, A.; Mecklenburg, S. SMOS: The challenging sea
Environmental Science & Technology Feature
DOI: 10.1021/es504849sEnviron. Sci. Technol. 2015, 49, 1987−1994
1992

surface salinity measurement from space. Proc. IEEE 2010, 98 (5), 649−665.(44) Boutin, J.; Martin, N.; Reverdin, G.; Morisset, S.; Yin, X.;Centurioni, L.; Reul, N. Sea surface salinity under rain cells: SMOSsatellite and in situ drifters observations. J. Geophys. Res.: Oceans 2014,119 (8), 5533−5545.(45) Reul, N.; Chapron, B.; Lee, T.; Donlon, C.; Boutin, J.; Alory, G.Sea surface salinity structure of the meandering Gulf Stream revealed bySMOS sensor. Geophys. Res. Lett. 2014, 41 (9), 3141−3148.(46) Boutin, J.; Martin, N.; Reverdin, G.; Yin, X.; Gaillard, F. Seasurface freshening inferred from SMOS and ARGO salinity: Impact ofrain. Ocean Sci. 2013, 9, 183−192.(47) Sabia, R.; Klockmann, M. Fernandez-Prieto, D.; Donlon, C., Afirst estimation of SMOS-based ocean surface T-S diagrams. J. Geophys.Res.: Oceans 2014, 119 (10), 7357−7371.(48) Hosoda, S.; Ohira, T.; Nakamura, T. A monthly mean dataset ofglobal oceanic temperature and salinity derived from Argo floatobservations. JAMSTEC Rep. Res. Dev 2008, 8, 47−59.(49) Reul, N.; Fournier, S.; Boutin, J.; Hernandez, O.; Maes, C.;Chapron, B.; Alory, G.; Quilfen, Y.; Tenerelli, J.; Morisset, S. Sea surfacesalinity observations from space with the SMOS satellite: A new meansto monitor the marine branch of the water cycle. Surv. Geophysics 2014,35 (3), 681−722.(50) Laxon, S. W.; Giles, K. A.; Ridout, A. L.; Wingham, D. J.; Willatt,R.; Cullen, R.; Kwok, R.; Schweiger, A.; Zhang, J.; Haas, C. CryoSat-2estimates of Arctic sea ice thickness and volume. Geophys. Res. Lett.2013, 40 (4), 732−737.(51) Kaleschke, L.; Tian-Kunze, X.; Maaß, N.; Makynen, M.; Drusch,M., Sea ice thickness retrieval from SMOS brightness temperaturesduring the Arctic freeze-up period. Geophys. Res. Lett. 2012, 39, (5).(52)Mathis, J. T.; Pickart, R. S.; Byrne, R. H.; McNeil, C. L.; Moore, G.W. K.; Juranek, L. W.; Liu, X.; Ma, J.; Easley, R. A.; Elliot, M. M., Storm-induced upwelling of high pCO2 waters onto the continental shelf of thewestern Arctic Ocean and implications for carbonate mineral saturationstates. Geophys. Res. Lett. 2012, 39, (7).(53) Mahadevan, A.; Tagliabue, A.; Bopp, L.; Lenton, A.; Memery, L.;Levy, M. Impact of episodic vertical fluxes on sea surface pCO2. Philos.Trans. R. Soc., A 2011, 369 (1943), 2009−2025.(54) Mahadevan, A. Ocean science: Eddy effects on biogeochemistry.Nature 2014, 506, 168−169.(55) Takahashi, T.; Sutherland, S. Climatological Mean Distribution ofpH and Carbonate Ion Concentration in Global Ocean Surface Waters inthe Unified pH Scale and Mean Rate of Their Changes in Selected Areas,OCE 10-38891; National Science Foundation: Washington, D. C.,USA,, 2013.(56) Goddijn-Murphy, L. M.; Woolf, D. K.; Land, P. E.; Shutler, J. D.;Donlon, C. Deriving a sea surface climatology of CO2 fugacity in supportof air-sea gas flux studies. Ocean Sci. Discuss. 2014, 11, 1895−1948.(57) Årthun, M.; Bellerby, R. G. J.; Omar, A. M.; Schrum, C.Spatiotemporal variability of air−sea CO < sub> 2</sub> fluxes in theBarents Sea, as determined from empirical relationships and modeledhydrography. J. Mar. Syst. 2012, 98, 40−50.(58) Friedrich, T.; Oschlies, A., Basin-scale pCO2maps estimated fromARGO float data: A model study. J. Geophys. Res.: Oceans 2009, 114,(C10).(59) Ono, T.; Saino, T.; Kurita, N.; Sasaki, K. Basin-scale extrapolationof shipboard pCO2 data by using satellite SST and Chla. Int. J. Rem. Sens.2004, 25 (19), 3803−3815.(60) Borges, A. V.; Ruddick, K.; Lacroix, G.; Nechad, B.; Asteroca, R.;Rousseau, V.; Harlay, J., Estimating pCO2 from remote sensing in theBelgian coastal zone. ESA Spec. Publ. 2010, 686.(61) Sarma, V. V. S. S.; Saino, T.; Sasaoka, K.; Nojiri, Y.; Ono, T.; Ishii,M.; Inoue, H. Y.; Matsumoto, K., Basin-scale pCO2 distribution usingsatellite sea surface temperature, Chl a, and climatological salinity in theNorth Pacific in spring and summer.Global Biogeochem. Cycles 2006, 20,(3).(62) Lauvset, S. K.; Chierici, M.; Counillon, F.; Omar, A.; Nondal, G.;Johannessen, T.; Olsen, A. Annual and seasonal fCO2 and air−sea CO2
fluxes in the Barents Sea. J. Mar. Syst. 2013, DOI: 10.1016/j.jmarsys.2012.12.011.(63) Millero, F. J.; Lee, K.; Roche, M. Distribution of alkalinity in thesurface waters of the major oceans.Mar. Chem. 1998, 60 (1), 111−130.(64) Loukos, H.; Vivier, F.; Murphy, P. P.; Harrison, D. E.; Le Quere,C. Interannual variability of equatorial Pacific CO2 fluxes estimated fromtemperature and salinity data. Geophys. Res. Lett. 2000, 27 (12), 1735−1738.(65) Anderson, D.; Sheinbaum, J.; Haines, K. Data assimilation inocean models. Rep. Prog. Phys. 1996, 59 (10), 1209.(66) Steinacher, M.; Joos, F.; Frolicher, T. L.; Plattner, G. K.; Doney, S.C. Imminent ocean acidification in the Arctic projected with the NCARglobal coupled carbon cycle-climate model. Biogeosciences 2009, 6 (4),515−533.(67) Peterson, B. J.; Holmes, R. M.; McClelland, J. W.; Vorosmarty, C.J.; Lammers, R. B.; Shiklomanov, A. I.; Shiklomanov, I. A.; Rahmstorf, S.Increasing river discharge to the Arctic Ocean. Science 2002, 298 (5601),2171−2173.(68) Shadwick, E. H.; Trull, T. W.; Thomas, H.; Gibson, J. A. E.,Vulnerability of polar oceans to anthropogenic acidification: Compar-ison of arctic and antarctic seasonal cycles. Sci. Rep. 2013, 3.(69) McGuire, A. D.; Anderson, L. G.; Christensen, T. R.; Dallimore,S.; Guo, L.; Hayes, D. J.; Heimann, M.; Lorenson, T. D.; Macdonald, R.W.; Roulet, N. Sensitivity of the carbon cycle in the Arctic to climatechange. Ecol. Monogr. 2009, 79 (4), 523−555.(70) Zine, S.; Boutin, J.; Font, J.; Reul, N.; Waldteufel, P.; Gabarro, C.;Tenerelli, J.; Petitcolin, F.; Vergely, J. L.; Talone, M. Overview of theSMOS sea surface salinity prototype processor. IEEE Trans. Geosci. Rem.Sens. 2008, 46 (3), 621−645.(71) Belanger, S.; Ehn, J. K.; Babin, M. Impact of sea ice on the retrievalof water-leaving reflectance, chlorophyll a concentration and inherentoptical properties from satellite ocean color data. Rem. Sens. Environ.2007, 111 (1), 51−68.(72) Varkey, M. J.; Murty, V. S. N.; Suryanarayana, A. Physicaloceanography of the Bay of Bengal and Andaman Sea. Oceanogr. Mar.Biol.: Annu. Rev. 1996, 34, 1−70p.(73) Vinayachandran, P. N.; Murty, V. S. N.; Ramesh Babu, V.Observations of barrier layer formation in the Bay of Bengal duringsummer monsoon. J. Geophys. Res.: Oceans 2002, 107 (C12), SRF-19.(74) International CLIVAR Project Office Understanding The Role OfThe Indian Ocean In The Climate SystemImplementation Plan ForSustained Observations; International CLIVAR Project Office: 2006.(75) Sarma, V. V. S. S.; Krishna, M. S.; Rao, V. D.; Viswanadham, R.;Kumar, N. A.; Kumari, T. R.; Gawade, L.; Ghatkar, S.; Tari, A. Sourcesand sinks of CO2 in the west coast of Bay of Bengal. Tellus B 2012, 64,10961.(76) Madhupratap, M.; Gauns, M.; Ramaiah, N.; Prasanna Kumar, S.;Muraleedharan, P. M.; De Sousa, S. N.; Sardessai, S.; Muraleedharan, U.Biogeochemistry of the Bay of Bengal: Physical, chemical and primaryproductivity characteristics of the central and western Bay of Bengalduring summermonsoon 2001.Deep Sea Res., Part II 2003, 50 (5), 881−896.(77) Ittekkot, V.; Nair, R. R.; Honjo, S.; Ramaswamy, V.; Bartsch, M.;Manganini, S.; Desai, B. N. Enhanced particle fluxes in Bay of Bengalinduced by injection of fresh water.Nature 1991, 351 (6325), 385−387.(78) Ramaswamy, V.; Nair, R. R. Fluxes of material in the Arabian Seaand Bay of BengalSediment trap studies. Proc. - Indian Acad. Sci., EarthPlanet. Sci. 1994, 103 (2), 189−210.(79) Gomes, H. R.; Goes, J. I.; Saino, T. Influence of physical processesand freshwater discharge on the seasonality of phytoplankton regime inthe Bay of Bengal. Continental Shelf Research 2000, 20 (3), 313−330.(80) Sabine, C. L.; Key, R. M.; Feely, R. A.; Greeley, D. Inorganiccarbon in the Indian Ocean: Distribution and dissolution processes.Global Biogeochem. Cycles 2002, 16 (4), 1067.(81) Biswas, H.; Mukhopadhyay, S. K.; De, T. K.; Sen, S.; Jana, T. K.Biogenic controls on the air-water carbon dioxide exchange in theSundarban mangrove environment, northeast coast of Bay of Bengal,India. Limnolo. Oceanogr. 2004, 49 (1), 95−101.
Environmental Science & Technology Feature
DOI: 10.1021/es504849sEnviron. Sci. Technol. 2015, 49, 1987−1994
1993

(82) PrasannaKumar, S.; Sardessai, S.; Ramaiah, N.; Bhosle, N. B.;Ramaswamy, V.; Ramesh, R.; Sharada, M. K.; Sarin, M. M.; Sarupria, J.S.; Muraleedharan, U. Bay of Bengal Process Studies Final Report; NIO:Goa, India, 2006; p 141.(83) Akhand, A.; Chanda, A.; Dutta, S.; Manna, S.; Hazra, S.; Mitra, D.;Rao, K. H.; Dadhwal, V. K. Characterizing air−sea CO2 exchangedynamics during winter in the coastal water off the Hugli-Matlaestuarine system in the northern Bay of Bengal, India. J. Oceanogr. 2013,69 (6), 687−697.(84) Burke, L. M.; Maidens, J. Reefs at Risk in the Caribbean; WorldResources Institute: Washington, DC, 2004.(85) Langdon, C.; Atkinson, M. J., Effect of elevated pCO2 onphotosynthesis and calcification of corals and interactions with seasonalchange in temperature/irradiance and nutrient enrichment. J. Geophys.Res.: Oceans 2005, 110, (C9).(86) Aschbacher, J.; Milagro-Perez, M. P. The European Earthmonitoring (GMES) programme: Status and perspectives. Rem. Sens.Environ. 2012, 120, 3−8.(87) Berger, M.; Moreno, J.; Johannessen, J. A.; Levelt, P. F.; Hanssen,R. F. ESA’s sentinel missions in support of Earth system science. Rem.Sens. Environ. 2012, 120, 84−90.(88) Drusch, M.; Del Bello, U.; Carlier, S.; Colin, O.; Fernandez, V.;Gascon, F.; Hoersch, B.; Isola, C.; Laberinti, P.; Martimort, P. Sentinel-2: ESA’s optical high-resolution mission for GMES operational services.Rem. Sens. Environ. 2012, 120, 25−36.(89) Donlon, C.; Berruti, B.; Buongiorno, A.; Ferreira, M. H.;Femenias, P.; Frerick, J.; Goryl, P.; Klein, U.; Laur, H.; Mavrocordatos,C. The global monitoring for environment and security (GMES)sentinel-3 mission. Rem. Sens. Environ. 2012, 120, 37−57.(90) IOCCG. http://www.ioccg.org/sensors/GOCI.html (accessedAugust 27, 2014).(91) Reul, N.; Saux-Picart, S.; Chapron, B.; Vandemark, D.; Tournadre,J.; Salisbury, J., Demonstration of ocean surface salinity microwavemeasurements from space using AMSR-E data over the Amazon plume.Geophys. Res. Lett. 2009, 36, (13).(92) Sabia, R.; Fernandez-Prieto, D.; Donlon, C.; Shutler, J.; Reul, N.In A Preliminary Attempt to Estimate Surface Ocean pH from SatelliteObservations; IMBEROpen Science Conference: Bergen, Norway, 2014.(93) Willey, D. A.; Fine, R. A.; Millero, F. J. Global surface alkalinityfrom Aquarius satellite. In Ocean Sciences Meeting, Honolulu, HI, 2014.
Environmental Science & Technology Feature
DOI: 10.1021/es504849sEnviron. Sci. Technol. 2015, 49, 1987−1994
1994
Recommended


