Embed Size (px)
Citation preview

On the improvement of 1 -look SAR image segmentations with mathematical morphology
Alejandro C. FreiyAna LiciaBezerra Candeias
INPE - Instituto Nacionalde Pesquisas EspaciaisDPI - DivisAode Processainento de Imagens
Avenida dos Astronautas, 175812227-010 SAo Josédos Campos
sP -BRAZIL
ABSTRACT
Synthetic Aperture Radar (SAR) images are an important souite of information.Thiskind of imaging is little affected byadverse atmospheric conditions, such as rain, clouds, fog, etc., since it operates at fiquencies other than the visible. Also, sincethe sensor is active and carries its own source of illumination, it can operate by thght. The problem that arises with the use ofthis technology is a signal-dependent noise, called speckle. This kind of noise is common to all imaging devices that usecoherent illumination, such as laser, microwaves, etc. One of the most useful techniques for image analysis is the segmentation.Using statistical modelling, two multiclass segmentation techniques for 1-look and linear detection SAR images are derived:the maximum likelihood and the Iterated Conditional Modes (1CM), both assuming multiplicative Rayleigh models for thedata. Although the 1CM segmentation yields significatively better itsults than the maximum likelihood segmentation, the1-look linear detection case is noisy enough to deserve some improvement. Mathematical Morphology, a non linear approachto signal processing, is then used as a refinement technique in order to extract infonnation.
1. INTRODUCTION
Image processing techniques have suffered an explosive growth in the last years. This is due to, among other reasons, thefact that more and more information from different sources, in the form of images, is available. It is known that about 50%of the images sent by environmental satellites has never been seen by human eyes. .. and that most of them carry preciousinformation.
That information, when retrieved within an acceptable delay after its acquisition, is present in our daily life: from relevantinformation about the weather, to statistics about continental growth of crops that take part in decisions about internationalfmancial aids, including information for ships about drifting icebergs.
Therefore, it is becoming of crucial importance the ability to process images rapidly, and in such a manner that the relevantinformation within these images is accurately retrieved. Within this context. statistical ideas are becoming very important.Other tools, such as the ones derived from Artificial ktelligence, Mathematical Morphology, etc., are also contributing to thedevelopment of techniques for the processing and the interpretation of images.
SAR images are receiving an increasing attentic&-' mainly due to the several satellites already launched, not to mentionthe airborne missions. This kind of imaging, besides providing dielectrical and textural information of the targets, is littleaffected by adverse atmospheric conditions, such as fog, rain, clouds, etc. It also allows night imaging, since the sensor is activeand carries its own illumination source.
The main problem with the use of SAR images is a kind of signal-dependent noise: speckle noise. It makes difficult the visualand the automatic interpretation of the data, since it produces a salt-and-pepper effect.
2. DEFINiTIONS AND NOTATIONThe indicator function of the set A is defmed, and denoted, as:
Ii ifxEA1A(X) =
to else.
The set of the real numbers is denoted II, the set of positive real numbers Il, the set of natural numbers N, and the setofthe integers Z. The cardinality of any denumerable set A shall be denoted #A; the difference between the sets A and B shallbe written A - B = A nBC, where BC is the complement of set B.
Random variables will be denoted with uppercase letters, and their outcomes with lowercase letters. A common underlyingprobability space will be assumed throughout this work (Q, A, Pr), where Q denotes the sample set, A its a-algebra, and Pra probability. Therefore, random variables are measurable functions of the form X : Q —'A, where A is the range of the func-tionX.
O-8194-1645-2/94/$6.OO SPIE Vol. 2315 / 245
Downloaded From: http://proceedings.spiedigitallibrary.org/ on 10/02/2013 Terms of Use: http://spiedl.org/terms

3. STOCHASTIC MODELS FOR BAYESIAN IMAGE RESTORATION
Any observable image is supposed to be the outcome of a certain vector ofrandom variables, which is indexedby the supportof the image. This support is assumed to be a finite rectangle ci the set Z2, denoted S = {O . m} x {O . n}.
It will be assumed that every observable value is chosen from a fmite or, at most, denumerable set. Another convenient,though not stringent, hypothesis is that this set is the same for every coordinate. Theifore, apixel is defmed as the pair (s, Ys),with s E S and y3 E T'. In this manner, the set of all the possible images is defmed as r = (r')5. The results presented inthis work were obtained using F' = (0 255}.
Assume that X(w) = x is the outcome ofthe ground truth. This outcome is one element ofthe set A = (4(}).Theobservedimage, denoted Y(w) = y is a (possibly stochastic) transformation r(x) = y E F. The aim of the Bayesian framework isspmiig some (convenient) distributional properties for X and for r and, therefore, estimating x throughout the observationof y. A detailed study of the transformation r : A -.F is the subject off.3.1 The Potts-Strauss Model
The Potts-Strauss model is a special case of the class of Markov random field models. For a comprehensive account ofinformation about these models, and their application to image synthesis, processing and analysis, the interested reader isreferred to the works5'7'11'14'22.
The Potts-Strauss model can be conveniently used as the apriori distribution for several Bayesian image problems. It servesas a convenient model for the contextual informatki. It can be assumed that the sets A are of the formA = {O, 1 K — 1 1 for every s E S; typically, if #A {s} 2, 3, up to, say, 8, the problem is considered as a segmentationone.
This modeL for finite supports, can be equivalently defined in two manners: by ajoint distribution and by the set of all theconditional distributions. The former is given by the expression
Pr(X = x) = -exp /3 : i 1(x5) Vx E A; (1)p \ s,IES:IIs—tII=1
' Ithe latter by the set of equations Pr(X3 X, I X5_ x5_) 0C expQ3#{t E : x = x,}), for every s E S. where ""denotes proportionality, s — t is the eudidean distance between the coordinates s, t E S. and the set denotedi9 = (t E S :11 5 — t = iJ is the neighbor set of the coordinate s E S. The parameter fi E H is often referred as the attrac-tion parameter if it is positive, repulsion parameter otherwise. The constant Z is known as the partitionfunction; it is definedby a sum over all the possible cxfigurations (over all the elements of the set A) as:
z13 = exp(—H(x)).where the function given by:
H(x) = —/3 >: 111(x3)s.IES: IIs—1II= 1
is often called the energy of the configuration x E A.It is possible to define this model with other neighbor sets, with different parameters, etc. (see15).
3.2 Pseudolikelihood EstimatorsOne of the major problems that arise with the use af Markovian distributions as a priori distributions in image processing
is the need to choose its relevant parameters in a trial-and-error basis. These parameters are needed to completely specify thereconstruction and/or segmentation algorithms.
Given X(w) = x, outcome of the Potts-Strauss model, it is often desirable to estimate the parameter /3.In general, it isimpossible to solve the maximum likelihood equation, due to the presence of the partition function 4
An alternative proposal'9 is known as maximum pseudolikelihood estimation. It consists of maximizing the product of theconditional distributions.
In these estimators are obtained in a computational tractable form. They are calculated for three different cases, namely,K = 2 (corresponding to the Isrng model), K = 3, and K � 4. Theset W = { 1 m — 1} x (1 n — 1 } isa convenientsubset of the support S and, whenever necessary, the neighborhood of the point s E S shall be denoted a, = {t, u, v, w}. Theaforementioned estimators are given by the solution of the following equations:•Case K = 2:
246 ISPIE Vol. 2315
Downloaded From: http://proceedings.spiedigitallibrary.org/ on 10/02/2013 Terms of Use: http://spiedl.org/terms

where C = #1:s w : x = €, fEa3Xt k}and W(t) = exp(t)/(1 + exp(t)).
•CaseK = 3:
>: v3(x)— 4V4W(4/3) — V3exp(3/3) + expQ3)
sEW exp(3/3) + expQ3)
where v(t) = #{u E i3 : x, = t}, and:
V=#fxa3CW:xt=xu=xv=xw},
V exp(4/3) 3 exp(2/3) + exp(fl) 4exp(2/3)
L1 v3(x3) — 4C4 A C3 A A C2 A
SEW exp(4/9) + K exp(3/3) + expQ3) + K — 1 2exp(2j3) + K — 1
—Cl2(exp(2j3) +expQ3)) 0 4exp(J3)
exp(2fl) + expq3) + K — 2 4expQ3) + K — 3
where v,(t) = #{u E a : x, = t}, and the constants C1, for every 0 � i � 4, are defmed by:
C4 = #{x3 C W : x1 = x, = x, = x}; C3 = #{xa3 C W : x1 = x, = x, x};C2 = #{xa3 C W : x1 = x x x xt}; c1 = #{xa3 C W : x = x xCo = #{Xa, C W : x x1, Vi j}.
It is important to notice that all the involved constants C, V' and C. can be determined with coly one sequential scanning of
the sample X(w) = x for every case of K; therefore, the determination of /3 can be performed in a computationally quite inex-pensive manner.
4.ELEMENTS OF MATHEMATICAL MORPHOLOGY
The definitions developed here, which are the transformations that are requiid in this paper, were extracted from1. Thedetails of the toolbox are found ins. jintroduction of Mathematical Morphology can be found j2,16,17,18,23
LetZ bethesetofintegers.LetEbethearecthngleofZ2 and Kbetheinterval [O,k - 1]ofZ,with k > O.Thecollectionof functions from E to K will represent the gray-scale images of interest (the binary images are seen like a particular case ofgmy-scale images). Such collection wiibe denoted K's, and1. g, f and 12 will denote generic elements of K's. The intersectionof f e 12' denoted 1' A12' is th function in KE given for any x E E, by (f Af2)(x) = mm {f1(x), f2(x)}; the union of fand 12' denoted 11 V 12' is the function in KEgiven, for any x E E, by (f1 Vf)(x) = max {J(x), f2(x)}.
TIE definitions oftwo important subclasses of operations, namely dilations and erosions, are recalled using the fact that(Z2 +) forms an Abelian group.
Let B be a subset of Z2, called structural element. The translation af B by any vector h in Z2 is denoted B,,; that is,B,, = {x + h : x E B }. The transpose ofB is denoted B', that is, B' = {—x: x E B). Thecomplementof B is denoted BC,that is, B' = {x: x B). The dilation of f by B is the function ÔB(J) in K' given, for any x E E, byÔB(f)(x) = max{f(y) : y E B fl El. The erosion of f by B is the function EB(t) in K's, given, for any x E E, bye8(t)(x) = min{f(y) : y E B fl E}. The two transformations 6B and 8B arecalled, respectively, dilation and erosion by B. TheMinkowski addition of the two subsets A andBof Z2 is a subset A B of Z2 given by A B = U { A,,: b E B).
Let n be any positive integer, denote nB the subset of 2 given by the n — 1 successive compositionsnB=(... (B El) B) ... El) B) El) B.
The transformations YB and /B from KE to K's, given by the following compositions YB = ÔBEB and q = B6B are called,respectively, the (morphological) opening and closing by B.
SPIEVo!. 2315/247
Downloaded From: http://proceedings.spiedigitallibrary.org/ on 10/02/2013 Terms of Use: http://spiedl.org/terms

5. SAR IMAGE FORMATION AND THE 1CM SEGMENTATION TECHNIQUE
A common model for homogeneous regions within SAR images is the multiplicative'0. For a simplified version of thismodel, it can be assumed that the observations, given the classes, obey a Rayleigh distribution and that are independent fromcoordinate to coordinate.
The random variable Y is said to be Rayleigh distributed with parameter ) E R +if its cumulative distribution function isgivenby F(x; ) = (1 — exp(— x2/(2.V)) 1R(x). Therefore, its density is givenby f(x; 1) = x/2exp(— x2/(2A2)) 1R(x).This case is denoted Y -5.1 Multiplicative Model for SAR Image Formation
Let X(w) = x = [xjSEs " the outcome of the a priori distribution that models the ground truth. Assume that X has thePotts—Strauss distribution with A = { 1 K} for every s E S. and consider the real values 0 < 2 < < 2K <The adopted model for image formation is given by:
Pr(y;21 2K) = flffexp(— 1(Y)' (2)sES X3
i.e., it is assumed that the observations, given the classes, are the outcomes of independent Rayleigh distributed random van-ables, and that the parameters of these random variables depend m the class (in fact, what is observed is a truncated and discre-tized version of every observation y if the image format is byte or integer, i.e. 8 16 bits format).
Another distribution that appears in the modelling of non-homogeneous reas' is the amplitude K distribution that, forthe considered data, is characterized by the following density:
(a—1)/2
fzA(x;a,1, 1) =rLI9 (f) KlI(2x/)1R+(x)
where a,/3 > 0, K is the modified Bessel function of the third kind and order v. Whenever optical data are considered, acommon hypothesis for their distribution is the assumption ofnormality. These three distributims are fitted to the data throughthe use of goodness-of-fit tests, and the results are presented in Table 1.
It is interesting to notice that this modelling also allows the design of specialized filters for speckle noise reduction13'1.5.2 The Bayesian Restoration of Images
Given the observation of Y(w) = y = [y3}3, it is desirable to estimate the unobserved outcome X(w) = x = [x]35 ofthe a priori distribution. Several techniques, that use the presented modelling, have been proposed in the literature; all of themare estimators of x based on the observation of y (see, for example, the references4''7'14'2).
Two estimators have received great attention, namely, the Maximum a Posteriori (MAP) and the MarginalPosterior Modes(MPM). They are defmed as:
;Lp max'Pr(xly), and
XMPM [max1Pr(x,Iy)1
Lx3s Js€sSome problems appear with the use of these estimators due to the fact that they cannot be calculated directly. They have
to be approximated by iterative stochastic techniques, whenever the apriori distribution is mm-trivial. In order to approximatethe former, simulated annealing has to be used. The latter estimator can be approximated simulating events from the distribu-tion given by Pr(XIy), and recording in every coordinate the most frequently observed value. An interesting connectionbetween those Bayesian techniques that use a non-trivial a priori distribution, and Mathematical Morphology can be foundin2753 The 1CM Algorithm
This algorithm, originally proposed by Besag4 as a manner of approximating the MAP estimator of x given y, with Marko-vian a priori distribution, soon gained a position of estimator as itself5'7'8'9'11'12.
This iterative technique consists of the maximization of the conditional distributions, for every coordinate, until there isevidence of convergence. It can be proved that, if implemented in a non-parallel manner, it produces a sequence of solutionswith non-decreasing likelihood, i.e. if (k) denotes the estimator (reconstructed or segmented image) in the k-th iteration, thenit holds, for every Q(O), that:
Pr((O)Iy) � Pr((l)Iy) � Pr((2)Iy)
248/SPIE Vol. 2315
Downloaded From: http://proceedings.spiedigitallibrary.org/ on 10/02/2013 Terms of Use: http://spiedl.org/terms

The k-th iteration consists of replacing every [(k)S]3Esby max;/l{ Pr(x,Iy, x (}).Using the properties of the distribu-
tion expressed by equation (1), it is possible to simplify the dependence on the reconstructed image, yieldingmax1} Pr(x3Iy,Xas). Now, using the properties of the multiplicative model presented in Section 5.1, this last expression
simplifies further, yielding max,1 Pr(XSIYS, Xa3) and, simplifying still further, maxM1(Pr(xSIYS) Pr(x,Ix3)). hi this
manncr, the 1CM algorithm can be expressed as: the k-th iteration consists of replacing every [(k),]3€ byaxXEA Pr(xIy3, Xa3), Where
Pr(x,1y3,xa3) expQ3#{t E a : = x,}) exp(— -).In order to avoid the effects of sequential scanning, pointed out in7, the implementation here presented makes sequential
scannings in subsets that form a partition of the support. To illustrate this idea, the order of visits to a toy support of the formS = {O 5) x (0 5}isshowninFigurel.
1 10 2 11 3 12
19 28 20 29 21 30
4 13 5 14 6 15
22 31 23 32 24 33
7 16 8 17 9 18
25 34 26 35 27 36
Fig. 1. Sequence of updatings of the 1CM algorithm to a squared support of size 36.
The presented version of this algorithm is automatic, in the sense that it does not require the use of unknown parameters.Every iteration uses as the parameter of the apriori distribution the result of estimating /3 with the pseudolikelihood estimator,basedon the previous solution, i.e., fl(k) = /3((k — 1)).
The first configuration, (0), is, by definition, any possible configuration. In this paper, these configurations were obtainedby the use of the maximum likelihood classification technique under the Rayleigh distribution11.
The maximum likelihOOd classification criterion can be expressed in the following manner: assume that the observationy E II ÷ is to be attributed to one of the following two populations, P1 characterized by a J) distribution, or P2 character-ized by a J(22) distribution, with 2 < 2• Thepoint x R where f1(x';1) = f(x;it2) is given by:
x* =
Therefore, this criterion is given by the rule: assign y to P1 if y < x*; else assign y to P2. The case y = f could be ignoredsince, at least theoretically, the probability of observing such value is identically zero for any random variable that admits a(strictly continuous) density. The generalization of this rule for more that two classes is immediate.
Figure 2 shows the result of fitting two Rayleigh densities (continuous and dashed lines) over the histograms ("+" and"o",resp.) of homogeneous regions, obtained by visual inspection of Figure 3. The parameters and A2 were obtained applyingthe maximum likelihood estimators to those samples, given by:
yielding Li = 28.9 and 1 = therefore, x' 62 is the value that discriminates class P1 (dark area) from class P2 (brightarea).
Since the validity of the presented segmentation technique heavily depends on the assumption ofRayleigh distributions forthe observations, two goodness-of-fit tests were applied to the aforementioned samples: the Kolmogorov-Smimov (KS) andthe x2(C2) tests. The p-values of the hypothesis of Rayleigh, amplitude K and Normal distributions is shown in Table 1, show-
SP1EVo!. 2315/249
Downloaded From: http://proceedings.spiedigitallibrary.org/ on 10/02/2013 Terms of Use: http://spiedl.org/terms
ing no evidence of lack of adequacyof the Rayleigh distributiif the cisideredimage, at least at the 1% level of signifi-.cance The same table clearly shows that the Normal distribution is not a good assumption ftr these data.
The convergence criteria used to obtain the results presented in Secfion 7 was the strongest: stop whenever there is no changefrcm one configuration to the next.
TAB. 1. PERENTUAL P-VALUES OF TWO GOODNESS-OF-FIT TESTS OVER HOMOGENEOUS REGIONS
A'1X K$ Q KS 21:ark 228 2653 228 2653 000 000Bright 8093 4812 000 000 000 000
6. APPLICATION OF MATHEMATICAL MORPHOLOGY TOOLS TO SEGMENTATION IMPROVEMENT
Although the 1CM segmentation yields significatively better results than the maximum likelihOOd segmentation, as can beshown comparing Figures 5 and 6(forbinary segmentations) and Figures 9 and 10 (for three-class segmentations), the 1-looklinear detection case is noisy enough to deserve some improvement With the use of tools derived from tbe MathematicalMorphology framework, better results ai obtained than those solely reached by the use of statistical segmentation.
Mathematical Morphology operations are used in this work, as a refinement technique aiming at the uniformization of thestatistical segmentations. The results ci applying the aforementioned segmentation algorithms are, then, improved with theuse of morphological operations. It is shown that, starting with a statistical segmentation and then applying operations derivedfrcKn the Mathematical Morphology framework, it is possible to generate hybrid (statistical/morphological) products that aremore adequate for image understanding than the original ones. It is also shown that the use of the 1CM algorithm yields aninitial segmentation that is more easily improved. Observing the resulting 1CM and maximum likelihood segmented images,it can be seen that both of them have lots of small regions that are not correctly attributed. The tools of Mathematical Morphol-ogy will be used to uniformize the classes.
Observing the segmentations obtained by the maximum likelihood and the 1CM algorithms, both for two and three classessegmentations (Figures 5,6,9 and 10), it can be seen that there are some small spurious classes within large area classes. Theopening transfonnation could remove small regions with high grey scale levels, whilst the closing transformation could removesmall regions with low grey levels. Then, when these two operations are combined, those two characteristics could be removed;since the spurious segmentations have this characteristics, these transformations could be adequate for the improvement ofthe segmentations. The combination of openings and closings is called "alternating sequential filtering"; the results of applying
250/SPIE Vol. 2315
Fig. 2. Histograms and fitted densities over samples of homogeneous regions.
Downloaded From: http://proceedings.spiedigitallibrary.org/ on 10/02/2013 Terms of Use: http://spiedl.org/terms
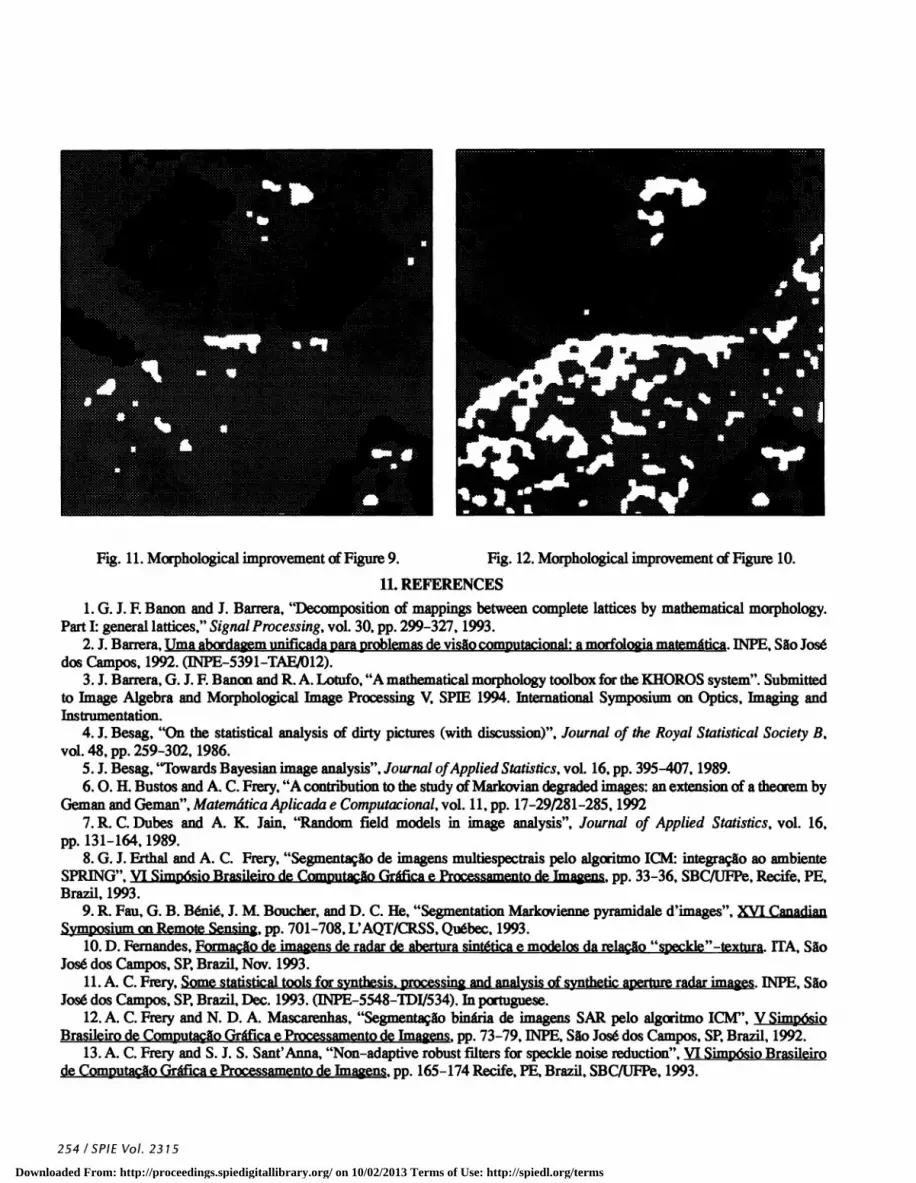
this technique to two and three classes and maximum likelihood and 1CM segmentations is shown in Figures 7,8, 11 and 12,respectively.
Let Ibe the image segmented by the 1CM or maximum likelihood technique in any number of classes. Let 11 be the imageresulting from applying the alternating sequential filtering technique obtained by Ii = 'iB6(1B5('7B4(1B3(?7B2(7Bi(J)))))), where
77,3 is the result of composing the operations of opening and dosing by the structuring element B,i.e. 77,3 = YBO cB and thesets B1, B2, B3, B4, B5 and B6are the structuring elements, defmed by:
To 1 o]B1=I111I, B2=
1 0]andB3 = 2B1;B4 = 2B2;B5 = 3B1;B6 = 3B2.Thisfilterispresentedin3
7. RESULTS
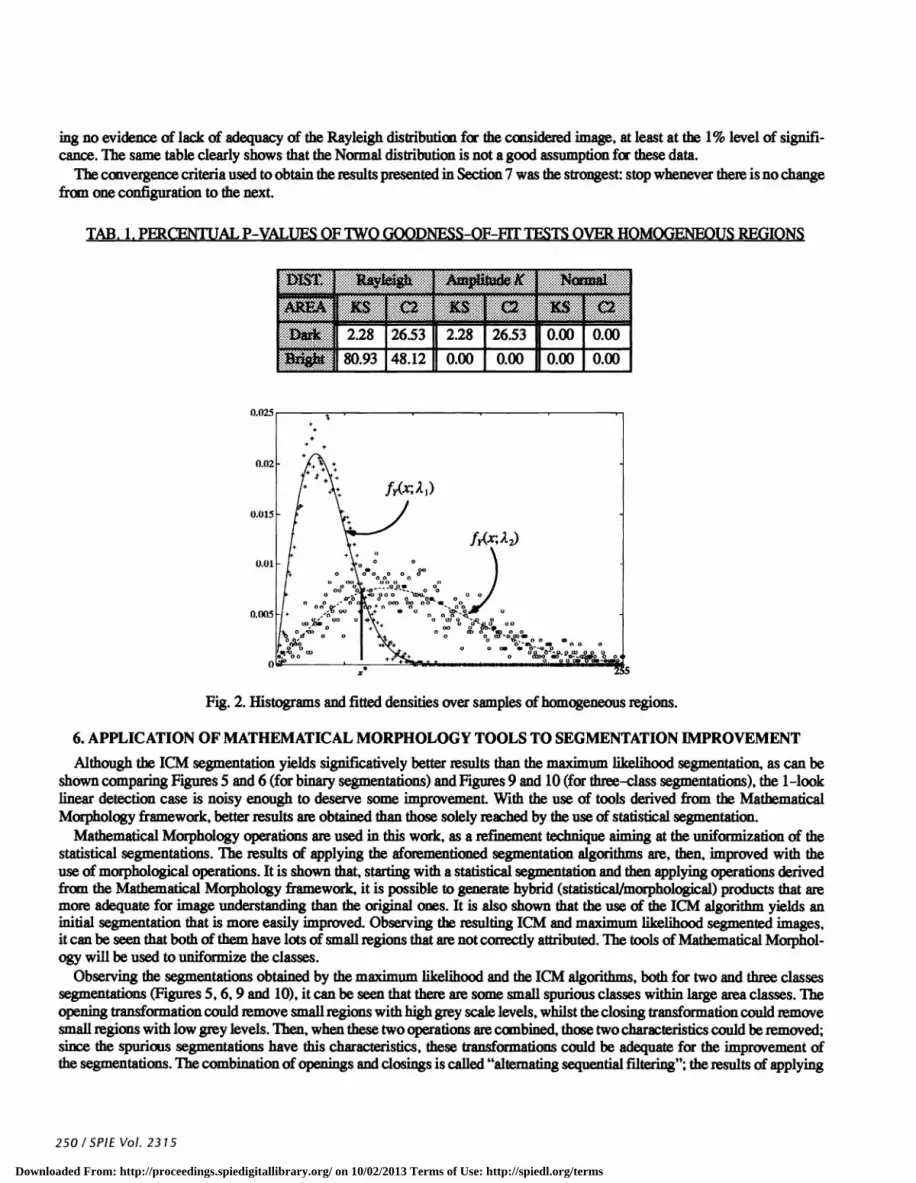
The original image (Figure 3) isa SAR58O image over the region of Freiburg, Germany (512 x 512 pixels). This is an air-borne sensor, and the image shown was obtained intheL-band, IIH polarization. A visual interpretation ofthis image showstwo main dasses: a brigh one, corresponding to forest, and a dark one, corresponding to bare soil. Some very bright spots inthe lower right corner of the image are due to the typical high return of buidings, an effect known as "double bounce backscat-ter". Figure 4 is an image of the same region, though obtained in another frequency, namely, band X; it is shown, and it wasused, after histogram equalization, and it served as an additional source of visual information for the discrimination ofhomoge-neous regions. For the use of both bands, after suitable transformations, in multiclass and multiband SAR image segmentation,the reader is referred to8'11.
The following figures show the results of applying the maximum likelihood and 1CM segmentation algorithms to the imageshown in Figure 3. Comparing Figures 5and 6 it is evident that though the 1CM segmentation retains more contextual informa-tion, it would be desirable to improve it Figures 7 and 8 show the results of applying the alternating sequential filter presentedabove, and it could be said that the use of this morphologycal operation yields better results than the original segentations, sincethe borders between regions are more dearly defined.
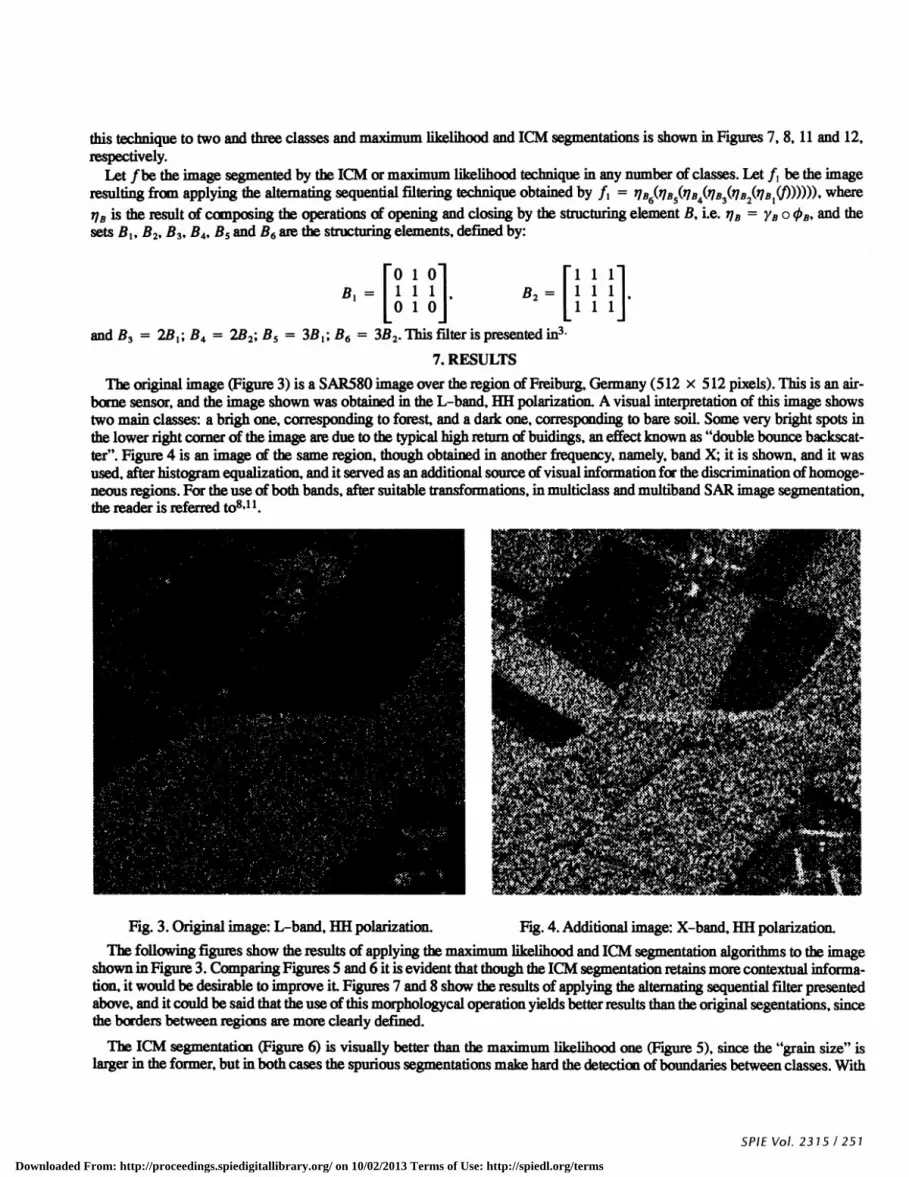
'fl 1CM segmentation (Figure 6) is visually better than the maximum likelihood one (Figure 5),since the "grain size" islarger in the former, but in both cases the spurious segmentations make hard the detection of boundaries between classes. With
Ii 1 1liii,I_i 1 1
Fig. 3. Original image: L-band, IIH polarization. Fig. 4. Additional image: X-band, HR polarization.
SPIEVo!. 2315/251
Downloaded From: http://proceedings.spiedigitallibrary.org/ on 10/02/2013 Terms of Use: http://spiedl.org/terms
the use of the altemathig sequenfial filter defined in Section 6, both segmentations are improved. It is interesthig, though, tonotice that the IM-improved segmentation ittains better some spatial features, as can be seen comparing the area close tothe middle portici of the right border in both images.
Though it is not quite clear how to extract three classes fran the original image, the presented technique was also testedwith maximum likelihood and 1CM three classes segmentations; the inforniathii required to obtain these segmentations wasobtained from the L (Figure 3) and X bands (Figure 4). This last image is shown equalized for purposes of visualization. Itis interesting to note that though there is not much visual evidence of three classes, the 1CM-improved segmentation (Fig-w 12) allows a thscriminaficn of edges between regions which is not quite evident in the other segmentations.
In order to make a quantitative, rather than the aforementioned qualitative, comparison between the four presented seg-mentations (maximum likelihood, 1CM and its morphologycal improvements) a ground-truth map could be used.
8. CONCLUSIONS
In this paper it was shown that the use of an alternating sequential filter, derived froni the Mathematical Morphology frame-work, can be successfully used to improve one look amplitude SAR segmentated images. Also, the adequacy of a Markoviansegmentation technique, the 1CM multiclass algorithm, is shown since the improved versions of its segmentations are betterthan the improved versions of the segmentations obtained with the maximum likelihood algorithm. The presented version ofthe 1CM algorithm does not require trial-an-error choice of parameters, since every required quantity is estimated from thedata; in particular, the parameters of the Potts-Strauss model are obtained iteratively using the maximum pseudolikelihoodestimators. Both maximum likelihood and 1CM techniques are adapted to the multiplicative model and linear detection, andthe hypothesis of Rayleigh distribution is tested with the Kolmogcrov-Smirnov and x2goodness-of-fit tests over homoge-neous areas.
9. COMPUTATIONAL INFORMATION
The results of applying the Mathematical Morphology filters were obtained using the Mathematical Morphology Toolboxdeveloped for the KHOROS system and presented in3. The software for maximum likelihood and 1CM segmentation of onelook amplitude SAR images is available, upon request, to E-Mail frery@dpi. inpe .br.
Fig. 5. Binarymaximum likelihood segmentation.
252/SPIE Vol. 2315
Fig. 6. Binary 1CM segmentation.
Downloaded From: http://proceedings.spiedigitallibrary.org/ on 10/02/2013 Terms of Use: http://spiedl.org/terms
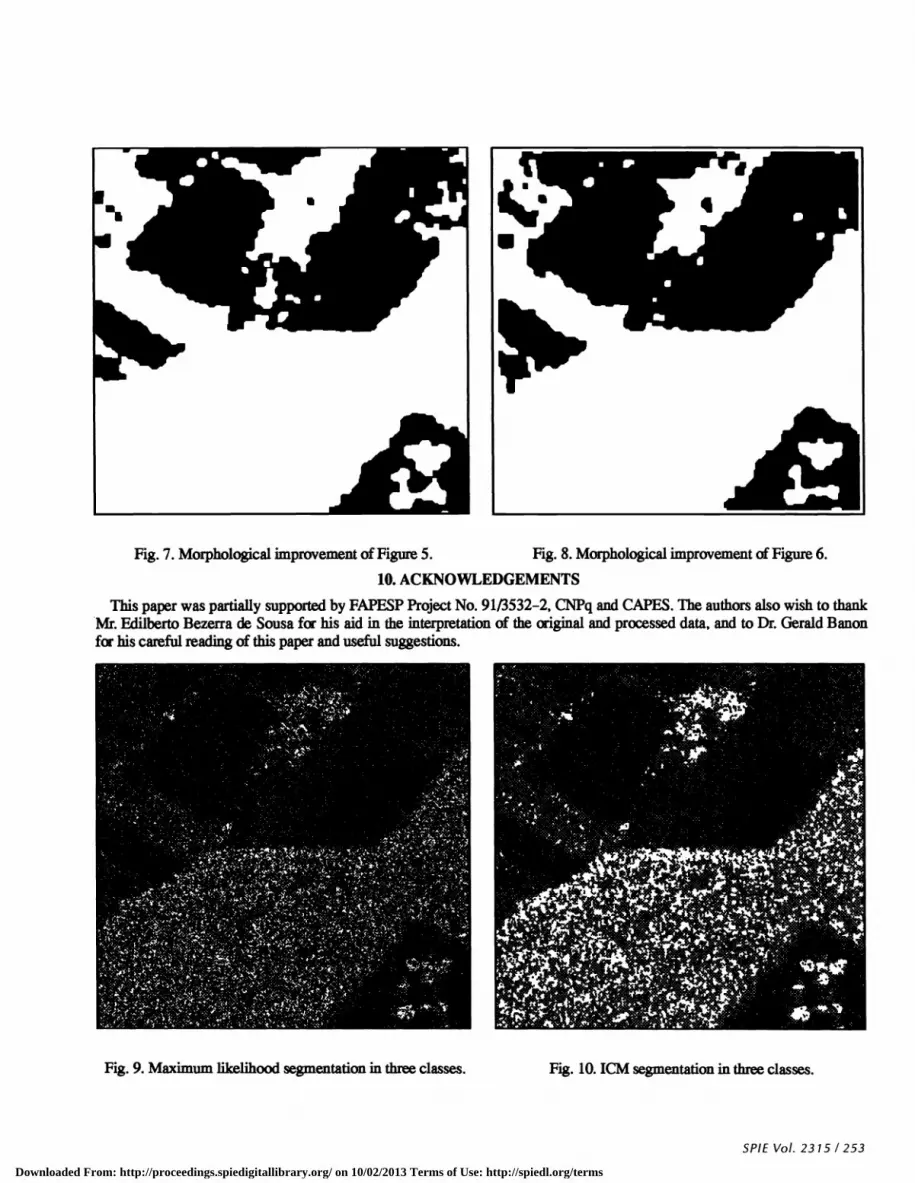
Fig. 7. Morphological improvement of Figure 5.
10.ACKNOWLEDGEMENTS
This paper was partially supported by FAPESP Project No. 9113532-2, CNPq and CAPES. The authors also wish to thankMr. Edilberto Bezerra de Sousa for his aid in the interpretation of the original and processed data, and to Dr. Gerald Banonfor his careful reading of this paper and useful suggestions.
Fig. 10.1CM segmentation in three classes.
SPIE Vol. 2315 / 253
I•1I
—
Fig. 8. Morphological improvement of Figure 6.
Fig. 9. Maximum likelihood segmentation in three classes.
Downloaded From: http://proceedings.spiedigitallibrary.org/ on 10/02/2013 Terms of Use: http://spiedl.org/terms
cLEz IOn JIdS/ 17cz
•E661 '°ddfl/DflS '1!z1fl '[ '9JI3O)j tLT-9T dd 'suouq op oyirj o51ndwoD P !9"!S IA 'UOtJ3fl9J 9S10U 9ppQdS ioj s.iojg snqoi oAidpB-uo,, 'S i s Pu (iai y j •Z661 'flZVa 'dS 'SOdWO °P 9SOf 'ac1N:I '6LEL 'dd 'suow p ouowssoooi€j o ogi o5ndwoD °P oJOjsJ o!sQdtUiS A 'NDI OtU2!JO1B o suwi 9 Ou9tU9,, 'stjumos 'y N pu iij y 'j •os3n2nxxI uJ '(f7ç/1cLL-gj7cc-;JM) E661 '°°U 'ia 'dS 'sodw sop 9SOf
os '3dtsIL 1PVJ iflJd 3I9flIS O SISAjRU jU &ISSO3Wd 'SSflUS JOJ SjOO jR3SBS OWO 'c1d D 'V 'Ti •E66T "°N 'llThJH 'dS 'S0d1U1O sop 9SOf
os 'vii 'JLtJx3-opp9ds,, pT91 p jpow o ous vinuaq op ipvi op suouq p ovuuoj 'spuuuij j .01
________ •€66T '°'L9 'SSDIJIWr1 '80L-TOL ' '"!S OwI
UBiPBUD TAX 's9w!p ppiwv&d UD!muIu9S,, '1I 'D 'ci pti 'iq3no 'p 'f 'u9 E '0 'd '1 '6 '66T '1i'fl
'Ld '°MI '°ddIl/DflS '9E€E 'dd 'suuwj p oiuwssoij gyi oiudtuo p oisup osc'dwis ii 'DNflIdS 91Uo!qwv ov Oi91t'! :yjj oupuo2jv ojad svioodspjnw suam op 'ioi y pim jtpz 'ç
'6861 'i'9TTET 'dd
'91 'jOA 's3!;S!WS paqdd Jo !Jnof 's!sIclm W! "! SjOjOW jjJ wopuB'a,, "!f 'N 'V SOfl(J ' '[ 'L Z66T 'c8Z18V6ZLT 'dd 'i 'io 'rn,owvndwoj a ripvaijdi,' vaypwaw 'uuwo puø imwcj
jo UOiSU9X9 u :suuq popvi2p ojao ipms tp o uoinqpuoo y,, 'D "r puv SO3STI 'H '0 '9
'686T 'LOi'-S6E 'dd '91 1OA 'S3yS77 V1S PllddVf0 vuJnoj' 's!sjvuU owT uscj spmoj,, '2vsoa 'r 'c '9861 'WE—6cz 'dd 'gj, 'jot
'g C,vnaog /vaijsijvS jmCo aip Jo jvuno '(uo!ssn3s!p tpp) sainpd i.ip Jo ssijmm j'øopsW3s 91fl u(),, 'socj 'f '' uOp3U9wtU1SLq
P" "!"1 '10 U° TU0!Wfl11 166T fldS 'A &RSS3OJj 9W jR3T2OOIjthOp pue uiqji ouq 02 pmmqn 'w93sis soioini on Jo; X0jOO2 O1011JOW 1!WW1WW V,, '0Jo20"j '\I '1 P" UOUV 'd 'I '0 ''1 'f '
'(zTotav1-16c-3aNI) 'Z661 'S0&ueD P sor o 'iwgw ojopow :jvuopndwo3osA op smojqoid vd pojun wopioq wfl 'uoi.nicj ' '66T 'LZE66t 'dd 'ç 'jOA 'XU!SSadWdlVU2.?S 'SO3!1Wj TJ9U9 : J1d 'i2ojotjthow joptuoijww Aq sowj o2ojdwoo uoooq s2u!ddBtu JO U0p!SOdWO3OcI,, 'VOJJBfl '1 pim U0UB 'd 'I'D,T
S3DNIL131 ii '01 JO 2U0tU0A01dU1! 'ZT 'skI '6 fl1tI JO 2uowoAoJdwI poiojoijdio ii iij
Downloaded From: http://proceedings.spiedigitallibrary.org/ on 10/02/2013 Terms of Use: http://spiedl.org/terms

ccz I c I EZ jOi\ IIdS
(89s1 jOA 'P°'dHIdS) 'tSZTLZ 'dd jjj '3IdS 'SM '""ffl!fl 'I &I!sso3oJd 3uq ojojoqcboj UB B1qjy uq rn 'S2ojotthow jvopsp,, 'irj j pu niomj ' 'Ojn LZ
'm9dd 03 'SSDI U! 's!sIc1B1m 9W! 'avs uoinqpisp y opmjdum jo osa tp wj,, 'nnj y, ' pu uuvus s i s '.'°i v j p D
(9L-ddA\ vsa) oi'-cz dd '66T 'SUed 'VS 'su!p9ooJd doqs)JJo u9w!.Iodxa pa uowy tpno 6xa'avS "! '!fl 9idB1 iAO wp
xnIvs Jo s!s1cTtI l3!2sw2S,, '?Jnc[ A "I pu sptwuijj d 'uv'us s r 'S "'i D .v 'SSU8A i D P D cz '9X61 '!TH PU tmwdtrj 'uopixr 'sAoms sainosi ioj ipv &iuq iij ' j 9861 'SOE-:8Z dd
'c jOA 'U!SSa3OJ a2vwj put' saiydvJD 'UO!SA Jndwo3 puB iojoithow vowww o onpoiitq,, 'vi 886T '1!S1AWfl Sfltjly '°nins jo.'oqj. 0 uurj.id-j 'jmwuoj 'spjg wopui opø uo szno' 'ijjøp ç itoddt o 'i66T 'VD '"Pd 'tI91UO t'6SSIVDI "! '111tfl10W IJ3I 91fl IflIM UU1jIJ 9RW IVS,, 'd D V P" 'I'°N V 'U M .TZ
8861 '!PH 3UJd 'IN 'SJJITJ OOI&9J&Ia itIISSOO1rj WI WWU1JPVI '1W! A d 0Z •p.s 'siUpy 10 ic2Tsl9Arnn 'S3i2Wit31?}4 10 32U211SU1 'S312S13V2S 1B!3O9tI1 JO
lu)tuh1Bd(J 'jmwuj 's9ssGoold jjds Jo SjOOW 1!WRJ jflfliOU0dx '0J P°°'1!1°'1!1°P°d '110P I P" 'I "1 '1 6l 1661 '&91SA UOS!PPV '1 1O 'U0!S!A 10(101 P" 1IC11110) '01!th?IIS '0 '1 P" P!I1H P '1 '81
L86T 'SSc-ZES 'i i0 'fliJ 'ipvjij VU VVJ SUVJj JJJ '2ojoidiom j133IWtU9tWW U!SU S!SII WL, '11(Z .X PU aIOc1LI91S 1 'S "P!1H Y[ 1 'LI
j 'iojso-uosTppv 'p '&rp1?Oj iu!ss3oJd OW! 1B1cJ 'spoo j pu Z9jZO9 j '9J
_____________________________ '(6 'S3W9I(W}4
UI SOIfl15 11c1U0 °(i) '8861 'U!J1fl 'JO3tU9 OQ JO2jJ 'SUO!l!SUBil 2SIijd puu sznsuw sgg '!!1f) 'H i '(LZiI 'P1L1iWiN "1 2ON 01flP'1) '8861 'U!Pfl 'P0A1t111dS '('Ps) UUU9H "I 'd '8861 -ifiAX 1no11-1U!Bs p s91gBqo1d p 9cp9p 9J0 ' &IVUI! U sw9jqold 9SI9AU! juB 1'i wopuwj,, 'uøwoJ 'j 'j
Downloaded From: http://proceedings.spiedigitallibrary.org/ on 10/02/2013 Terms of Use: http://spiedl.org/terms