
www.esri.ie
Working Paper No. 282
February 2009
The Economic Impact of Ocean Acidification on Coral Reefs
Luke M. Brandera, Katrin Rehdanzb,c, Richard S.J. Told,a,f and Pieter J.H. van Beukeringa
Abstract: Because ocean acidification has only recently been recognised as a problem caused by climate change, impact studies are still rare and estimates of the economic impact are absent. This paper estimates the economic impact of ocean acidification on coral reefs which are generally considered to be economically as well as ecologically important ecosystems. First, we conduct an impact assessment in which atmospheric concentration of CO2 is linked to ocean acidity causing coral reef area loss. Next, a meta-analysis is applied to determine the economic value of coral reefs around the world. Finally, these two analyses are combined to estimate the economic impact of ocean acidification on coral reefs for the four IPCC marker scenarios. We find that the annual economic impact rapidly escalates over time, because the scenarios have rapid economic growth in the relevant countries and coral reefs are a luxury good. Nonetheless, the annual value in 2100 in still only a fraction of total income, one order of magnitude smaller than the previously estimated impact of climate change. Although the estimated impact is uncertain, the estimated confidence interval spans one order of magnitude only. Future research should seek to extend the estimates presented here to other impacts of ocean acidification and investigate the implications of our findings for climate policy.
Key words: Ocean acidification, coral reefs, economic value JEL Classification: Q51, Q54, Q57
Corresponding Author: [email protected] a Institute for Environmental Studies, Vrije Universiteit, Amsterdam, The Netherlands b Kiel Institute for the World Economy, Kiel Germany c Department of Economics, Kiel University, Kiel, Germany d Economic and Social Research Institute, Dublin, Ireland f Department of Spatial Economics, Vrije Universiteit, Amsterdam, The Netherlands ESRI working papers represent un-refereed work-in-progress by members who are solely responsible for the content and any views expressed therein. Any comments on these papers will be welcome and should be sent to the author(s) by email. Papers may be downloaded for personal use only.

The Economic Impact of Ocean Acidification on Coral Reefs
1. Introduction
Human activity is increasing the concentration of carbon dioxide in the atmosphere and in the
ocean. In the atmosphere, carbon dioxide is a greenhouse gas causing climate change. In the
ocean, carbon dioxide is an acid causing ecosystem change. While research on aspects of
climate change has generated an enormous number of studies over the last few years, ocean
acidification has only recently been recognised as a problem. Impact studies are still rare and
estimates of the economic impact are absent. This study estimates the economic impact of
ocean acidification on coral reefs which are generally considered to be economically as well
as ecologically important ecosystems.
Ocean acidification has a range of impacts on biological systems. It will change the
competition between marine plankton species in favour of those that rely less on calcium (Orr
et al. 2005;Riebesell et al. 2000), it will negatively affect shellfish (Gazeau et al. 2007;Spicer
et al. 2007), it will impact on fish (Ishimatsu et al. 2004), it may benefit highly invasive non-
native algal species (Hall-Spencer et al. 2008), and it will reduce coral calcification (Hoegh-
Goldberg et al. 2007). However, while the initial impact of ocean acidification is relatively
clear, the eventual impact depends on the complex interaction of many species. The
estimation of resulting changes in economic values, which generally derive from the higher
trophic levels (e.g., top predator fish, marine mammals, sea birds), is therefore also pervaded
by uncertainty. Coral reefs are an exception in that the impact of ocean acidification is
relatively well understood and they have a range of direct and indirect use values for humans
(e.g., coastal protection, fisheries, recreation, amenity). It is for these reasons that this paper is
limited to assessing the economic impact of ocean acidification on coral reefs.
There are a large number of economic studies that assess the values of ecosystem services
provided by coral reefs. A few of these studies specifically address the impact of climate
change on the economic value of coral reefs. Most of these address specific regions such as
Australia (Hoegh-Goldberg & Hoegh-Goldberg 2004), Indian Ocean (Westmacott et al.
2002;Wilkinson et al. 1999), Pacific Ocean (World Bank 2000); the Caribbean(Burke &
Maidens 2004;Vergara et al. 2009) and the United States (Gibson et al. 2008). Only (Cesar et
al. 2003) estimates the global damage of climate change on coral reefs but does not
specifically address the impact of ocean acidification. To our knowledge, this is the first study
to investigate the economic impact of ocean acidification on coral reefs worldwide.
2

The current paper is a first step towards filling an important gap in the literature on the
valuation of the impact of climate change. The research tract on the economic impact of
climate change, started by (Nordhaus 1991), is still incomplete and lacks estimates of both
negative and positive impacts (Tol 2008b). Ocean acidification, however, is more than just
one of the unquantified impacts. For several reasons, the absence of this climate change
impact also has serious implications for the type of policy interventions required. First, since
ocean acidification is exclusively driven by carbon dioxide, as opposed to climate change
which is also caused by other greenhouse gases, the additional cost associated with carbon
dioxide emissions due to ocean acidification changes the trade-offs between the reduction of
greenhouse gases (Schmalensee 1993). Second, the absorption of carbon dioxide by the
oceans and thus the impact of ocean acidification occur over a short time scale, whereas the
warming of the atmosphere substantially lags behind the build-up of greenhouse gases in the
atmosphere. This changes the dynamics of optimal emission control, and makes the discount
rate less important (d'Arge et al. 1982). Third, the consideration of ocean acidification also
has implications for the instrument choice for the potential solution to climate change.
Climate change may be countered by geoengineering (Schelling 1996), but ocean
acidification would continue unabated and may even accelerate if sulphur particles are used to
cool the planet. Therefore, valuing ocean acidification will not only increase the estimates of
the Pigouvian tax required to achieve efficient greenhouse gas emissions abatement (Tol
2005), but it will affect other trade-offs and policies too.
The paper proceeds as follows. Section 2 reviews the literature on ocean acidification and its
impact of coral reefs, and constructs a simple model. Section 3 presents a meta-analysis of the
economic value of coral reefs. Section 4 combines the two to produce a scenario and
sensitivity analysis of the economic impact of ocean acidification on coral reefs. Section 5
concludes.
2. Ocean acidification and its impact on coral reefs
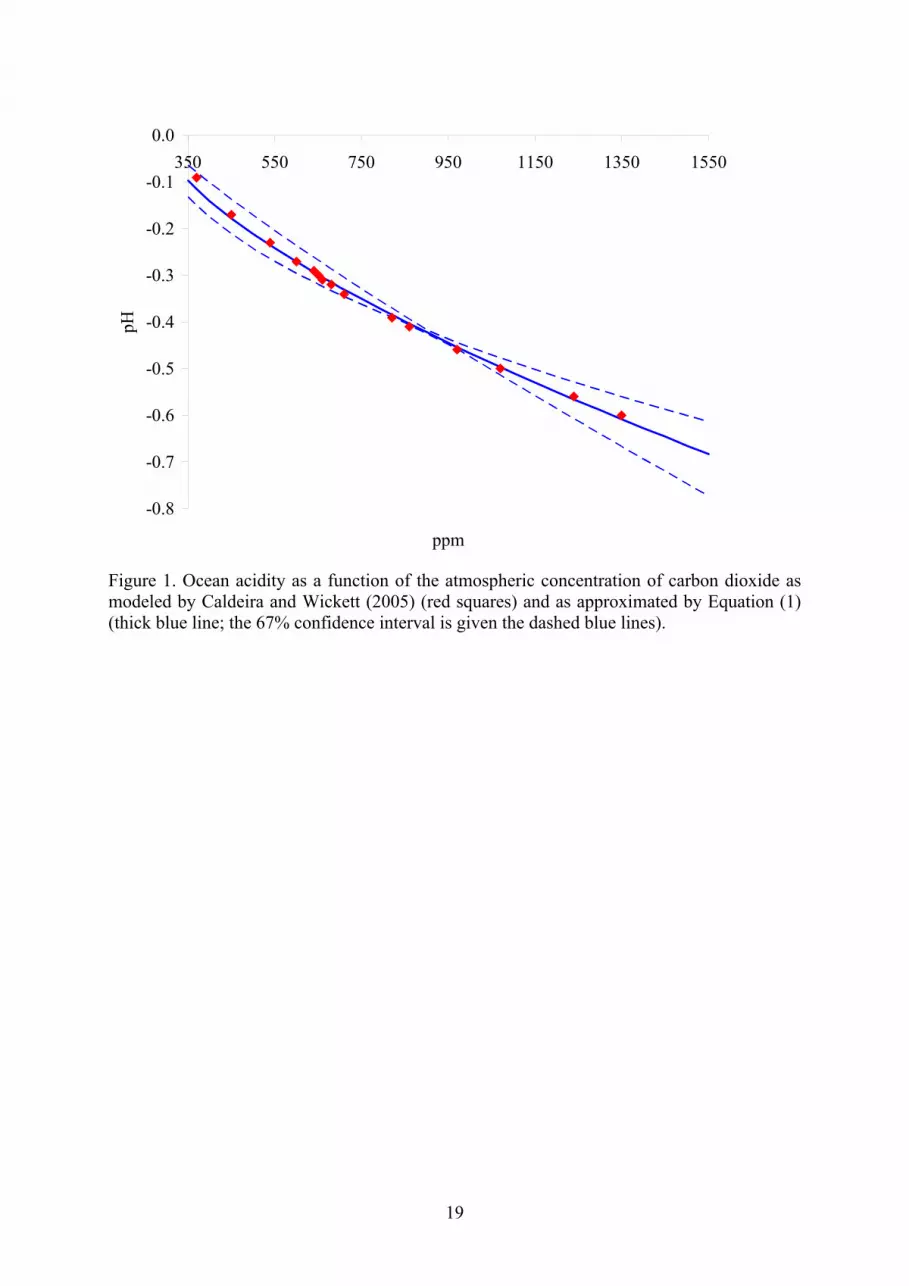
(Caldeira & Wickett 2005) show the results of 15 experiments with an ocean chemistry model
to predict chemistry changes from carbon dioxide emissions to the atmosphere and the ocean.
Although there are a number of mechanisms that lead to increased ocean acidity, the main
mechanism is the higher concentration of dissolved CO2 (Cao et al. 2007;McNeil & Matear
2006;McNeil & Matear 2007;Morse et al. 2006;Ridgwell et al. 2007). This allows us to
approximate ocean acidity as a simple function of the atmospheric concentration of CO2:
3

(1) ( )280t tA M βα= −
where A is change in ocean acidity relative to pre-industrial times (in pH) at time t, M is
atmospheric carbon dioxide in parts per million by volume (ppmv). The pre-industrial level of
carbon dioxide is the assumed value of 280 ppmv. The parameters α = 5.69 (0.04) 10-3 and β
= 0.67 (0.53-0.86) are based on OLS regression using the results of (Caldeira & Wickett
2005). Figure 1 shows that Equation (1) is a rather good approximation; the R2 is 99.9%.
A number of studies has estimated the impact of ocean acidification on coral reefs (Andersson
et al. 2003;Andersson et al. 2007;Gattuso et al. 1998;Kleypas et al. 1999;Langdon et al.
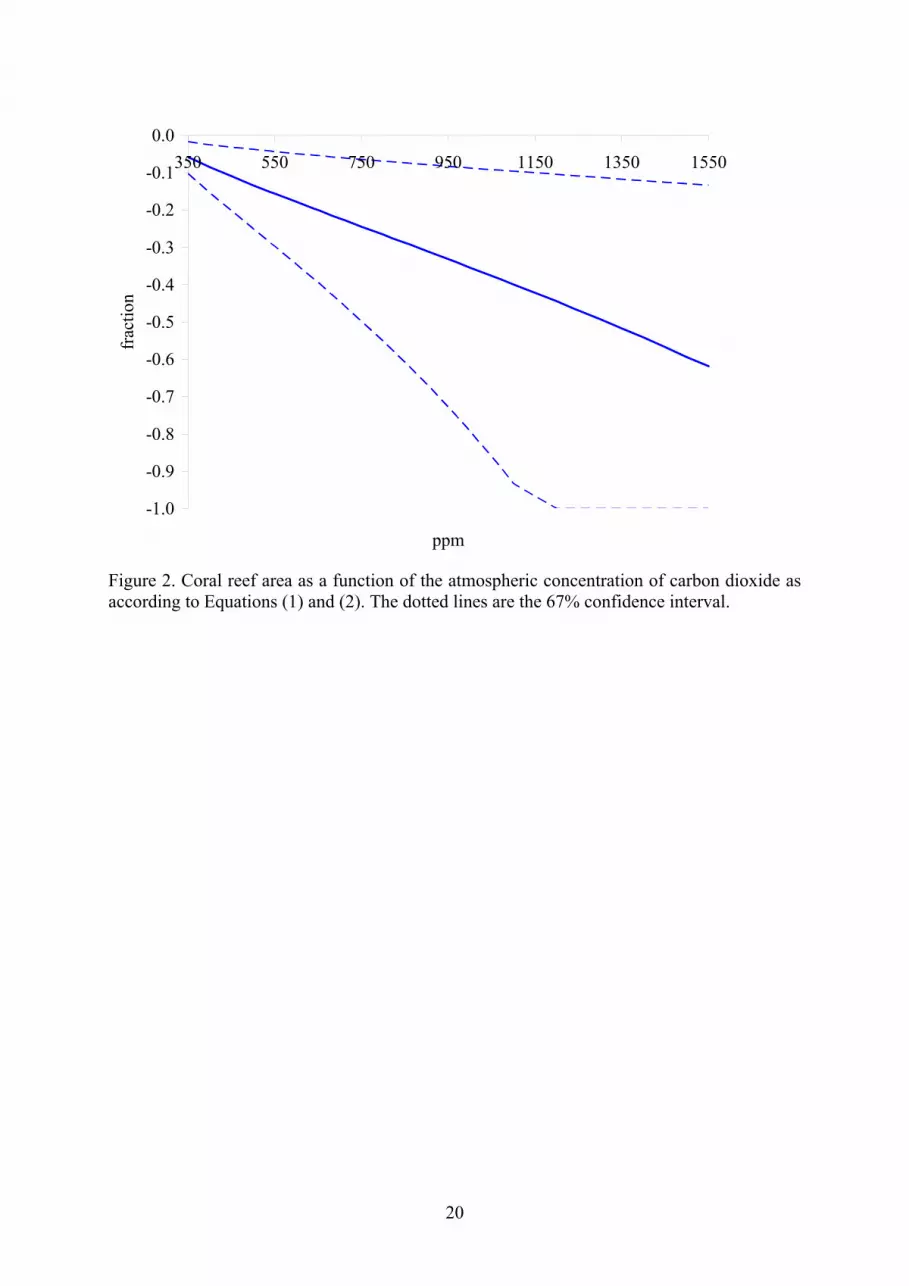
2000). Table 1 summarizes their results, expressed as a loss in reef area. We assume that reef
area is a logistic function in ocean acidity:
(2) 1
tt
t
ARA
γγ
=+
Where R is the change in reef area since pre-industrial times, and γ = 0.56 (0.39) is a
parameter; its value is the average of the parameters in Table 1. Figure 2 gives reef area as a
function of the atmospheric concentration of carbon dioxide, using Equation (1) to compute
ocean acidity. The uncertainty shown is the uncertainty about the coral reef response to
acidification only; this uncertainty is substantial. At around 1200 ppm, there is a 16.5%
chance that coral reefs are extinct.
3. The value of coral reefs
Coral reefs are highly productive ecosystems that provide a variety of valuable goods and
services to humans. These goods and services include coral mining and recreational
opportunities for diving, snorkelling and viewing (direct use values); amenity services
reflected in real estate prices, coastal protection and habitat and nursery functions for
commercial and recreational fisheries (indirect use values); and the welfare associated with
the existence of diverse natural ecosystems (preservation values). The open-access nature and
public good characteristics of coral reefs often result in reefs being undervalued in decision
making related to their use and conservation. In response to this, there is now a substantial
literature on the economic values of coral reefs. This section synthesises the results of the
coral reef valuation literature through a meta-analysis. The data and analysis here are similar
to those in (Brander et al. 2007), but this study includes value estimates for all goods and
services while Brander et al. was limited to recreation values.
4

160 separate coral reef valuation studies were collected from a variety of publication outlets,
including journal articles, book chapters, occasional papers, reports, and academic theses. In
order to compare value observations, information on a number of key variables is required,
including coral reef value, goods and services being valued, number of visitors, area of coral
cover, location, year of valuation, and valuation method used. 45 studies yielded sufficient
information for a statistical meta-analysis. From these 45 studies we were able to code 81
separate value observations, taking multiple observations from single studies. On average 1.8
observations per study were obtained, with a maximum of 12 observations from a single
study. Table A1 has the descriptive statistics.
Regarding the geographic representation of the of the sample, 30 observations are for US
coral reefs, 21 from South-East Asia, 9 from East Africa, 8 from Australia and 13 from the
Caribbean. The value observations have been estimated using a variety of valuation methods.
Around half were obtained using the contingent valuation method, with the remainder derived
from the travel cost (11), net factor income (7), production function (6), and gross revenue
methods (17).
There is no standard reporting format for valuation results and so value observations are
reported in a wide variety of units (e.g. total values, per unit of area, per visitor etc.), for
different time periods (e.g. per day, per year, NPV over a given time horizon etc.), and in
different currencies and years of value. Therefore, we standardised these values to a common
metric, which is $/km2/year in 2000 prices. The unit of area refers to the area of coral cover.
Values from different years were converted to 2000 prices using GDP deflators from the
World Bank World Development Indicators. PPP conversions were made to correct for
differences in price levels between countries.
The main methodological approach to explaining observed differences in coral reef values is a
meta-regression. Meta-analysis is a statistical method for combining study results that allows
the analyst to systematically explore variation estimates across studies. Our meta-analysis of
coral reef values involves regressing the standardized coral values on a set of explanatory
variables. These explanatory variables include geographic (location dummies), ecological
(area of coral cover, biodiversity), socio-economic (GDP per capita, population density,
goods and services provided, number of visitors), and methodological variables (valuation
method used).
The results of the meta-regression are presented in Table 2. The adjusted R2 value of 0.60 is
reasonably high, and indicates that almost two-thirds of the variation in coral reef value is
explained by variation in the explanatory variables. In this log-log model, the coefficients
5

measure the constant proportional or relative change in the dependent variable for a given
relative change in the value of the explanatory variable. For example, the coefficient of 0.535
for the dummy variable indicating that the coral reef supports reef tourism means that, ceteris
paribus, the value of the coral reef will be 71% (i.e., e0.535 – 1) higher than the average when
this service is provided, as compared to when this service is not present.
Regarding the results on the regional indicators, all else being equal, Caribbean reefs (the
omitted dummy) have higher values than reefs in any other region, and Australian reefs are
least valuable. As one would expect, income per capita, population density, and the number of
visitors all have positive effects on coral reef value. More biodiverse reefs are more valuable,
and smaller reefs are more valuable (per square kilometer) than are bigger reefs, again as one
would expect. The category ‘type of goods and services’ provided by coral reefs generate only
a few significant coefficients on the dummy variables explaining economic value. Coral reefs
that have been valued as providing snorkeling opportunities and coastal protection have lower
values than the average, but this is significant only at the 10% level. The results on the
dummy variables indicating the type of valuation method used are equally inconclusive. Only
the contingent valuation method stands out, albeit at the 10% significance level only, yielding
lower than average values.
4. Scenarios and results
In this section we combine the results of the two previous sections to calculate the economic
impact of ocean acidification on coral reefs and show results for the four marker scenarios of
the IPCC Special Report on Emission Scenarios (Nakicenovic, N. and Swart, R. J. 2001).
Although controversial (Castles & Henderson 2003;Pielke, Jr. et al. 2008), the SRES
scenarios are the standard in climate change impact analysis. Table A2 shows the scenario
characteristics of the affected countries, that is, those with coral reefs.
Figure 3 shows the atmospheric concentration of carbon dioxide according to the four SRES
scenarios and a standard (Maier-Reimer & Hasselmann 1987) carbon cycle model as
embedded in the integrated assessment model FUND (Tol 2008a). The CO2 concentration in
2100 shows a wide range, from 570 ppm (and falling) in the B1 scenario to 812 ppm (and
accelerating) in A2.
Figure 4 shows the resulting change in ocean pH, following Equation (1); in pre-industrial
time, ocean PhD was 8.2 (Key et al. 2004). Again, there is a wide range. The change in pH in
6

2100 varies from -0.25 (but rising) in B1 to -0.38 (and accelerating) in A2. This pattern
follows immediately from the CO2 concentrations in Figure 3.
Figure 5 shows the percentage loss of coral reef area (since pre-industrial times) due to the
increased acidity of the ocean, following Equation (2). In 2000, the total area was some
307,000 km2, but already 7% was lost due to ocean acidification. The loss in 2100 ranges
from 16% or 30,000 km2 (but falling1) in B1 to 27% or 65,000 km2 (and accelerating) in A2.
Again, this pattern follows straightforwardly from the pH values in Figure 4. It should be
noted that the estimated loss in coral area is only due to projected ocean acidification and not
to other factors that may result in coral degradation (e.g. warming, sea level rise, pollution
etc.).
Figure 6 shows the global average value per km2 of coral reef area. The average is a weighted
average, using national coral reef area as weights.2 Several variables feed into the meta-
regression (cf. Section 3). Population density and per capita income are part of the SRES
scenarios. We assumed that the growth rates are uniform across the countries in the FUND
regions,3 and used these growth rates to extrapolate the national coral reef value. The number
of visitors is also important. We used the number of international arrivals according the
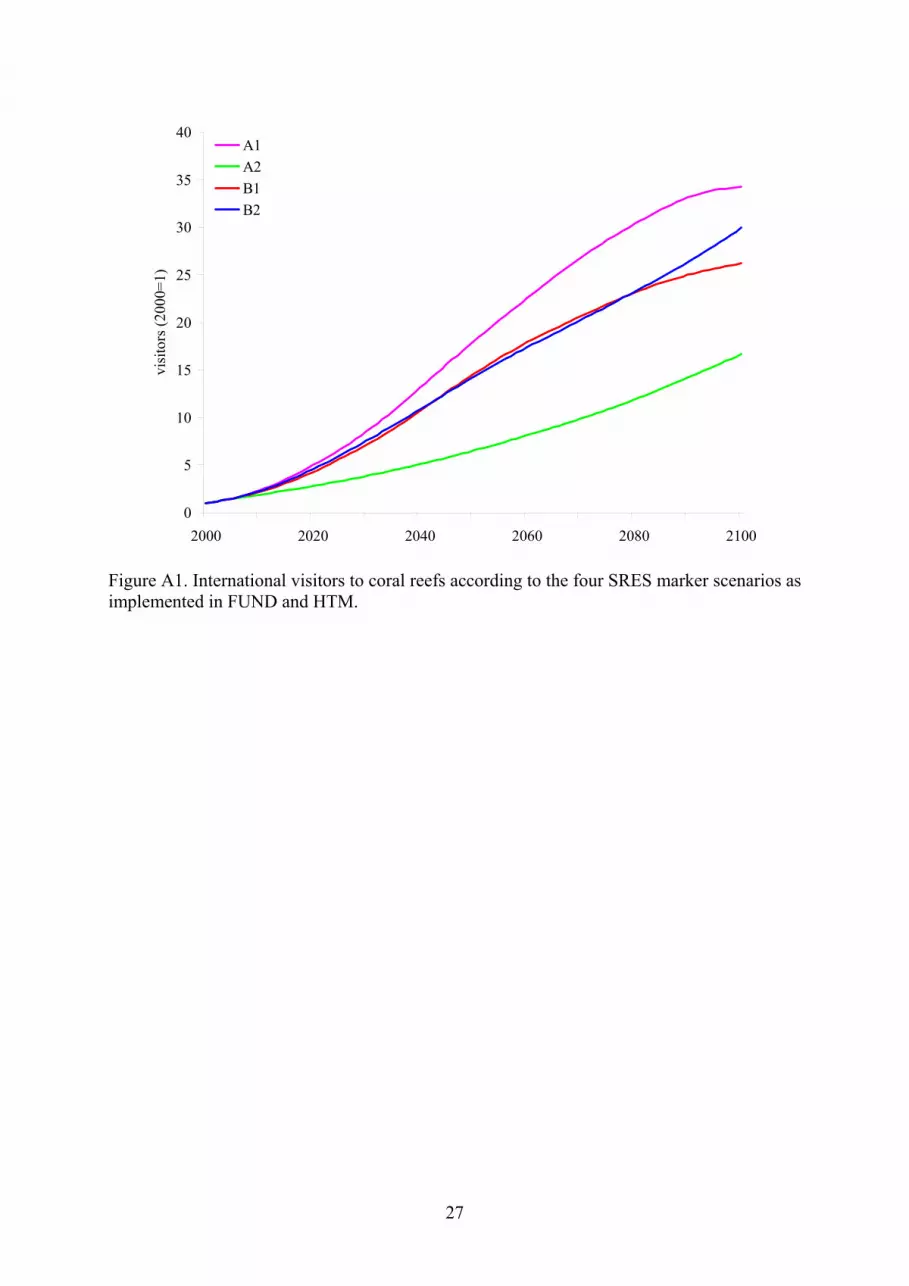
Hamburg Tourism Model (Hamilton et al. 2005). See Figure A1. Coral reef area also affects
coral reef value. We used the areal change of Figure 5. The meta-analysis is about the annual
value per area of coral reef. We calculate the net present value by assuming that the annual
value is constant; we use a Ramsey rate of discount, with a pure rate of time preference of 3%
per year and an income elasticity of marginal utility of one.
All scenarios display a rapid rise in per unit area values. We assumed that the meta-regression
results are representative for 2000. The average value then was $177 thousand per square
kilometre, with a range of $39 to $804 thousand per km2. This value rises by a factor 67 in the
A2 scenario, and a factor 681 in the A1 scenario. Four developments contribute to this.
Firstly, population grows substantially. Secondly, coral reef area falls substantially. These two
factors contribute relatively little, because the elasticities are relatively small (around 0.5) and
because the levels change only moderately. The third development is more important. Visitor 1 Note that we assume that coral reefs respond as fast to falling acidity as to rising acidity. This assumption may be optimistic, although one would expect an eventual positive effect from falling ocean acidity. 2 Using the ReefBase database: http://www.reefbase.org/global_database/default.aspx 3 That is Canada, USA, Western Europe, Japan and South Korea, Australia and New Zealand, Eastern Europe, former Soviet Union, Middle East, Central America, South America, South Asia, Southeast Asia, China, North Africa, Sub-Saharan Africa, and Small Island States. See http://www.fund-model.org/
7

numbers rapidly rise as people become more affluent and take more holidays. In the SRES
scenarios, economic growth is concentrated in the poor countries in the tropics – exactly
where coral reefs tend to be as well. The HTM model assumes that mass tourism will remain
at destinations that are not too far from the home country, so that tourism growth is also
concentrated in the tropics. However, the elasticity is only 0.68. The fourth development
dominates. The SRES scenarios have rapid growth in poor countries, and the income
elasticity of the coral reef value is 1.2. This explains the explosive growth in value.
Figure 7 shows the annual economic damage of ocean-acidification-induced coral reef loss.
Figure 7 multiplies Figure 5 (area loss) and Figure 6 (net present value per area).4 Damages
are higher in the A1 and B2 scenarios than in the A2 scenario because values are higher in A1
and B2 than in A2. The B2 scenario has both lower values and lower loss than the A1
scenario. In the long run, the B1 scenario has the lowest damages, because it has the lowest
loss of coral reefs; following the coral loss scenarios, there are even benefits towards the end
of the century. The annual damage goes up to $870 billion in the A1 scenario in 2100.
Although this may seem a substantial economic loss, this damage figure is only 0.14% of
global GDP. The proportional loss in the B2 scenario is in fact higher (0.18% of GDP), while
the A2 scenario is again lower (0.14% of GDP).
Figure 8 shows a sensitivity analysis of the annual damage in 2100. The B2 scenario is central
in most cases, so we varied parameters in that scenario. Parameters were varied by one
standard deviation. For comparison, the results of the other three scenarios are also shown.
The response of ocean acidity to ambient carbon dioxide concentrations is not particularly
uncertain, and damages are hardly affected. The area elasticity of value is not that important
either. The extent of coral area loss per unit change in ocean pH is very uncertain, however,
and this uncertainty is about as large as the uncertainty about the scenarios. The largest
uncertainty, more than a factor four, is the value per unit area.
5. Discussion and conclusion
This paper gives the first estimate of the economic value of ocean acidification. Although this
estimate is limited to the impact on coral reefs, perhaps the most tractable of the many
4 Multiplying the annual value per area of coral reef with the total coral reef loss until a particular year assumes perpetual regret – that is, people in 2100 still suffer a loss of welfare because of coral reef loss in 2000, and the 2100 loss is in fact greater than the 2000 loss because of economic growth etc.
8
impacts of ocean acidification. We construct and calibrate simple models of ocean
acidification and coral reef area loss, driven by the atmospheric concentration of carbon
dioxide. We extend an earlier meta-analysis of coral reef values to estimate a value transfer
function for coral reefs, and apply an existing model of tourist numbers. The FUND model is
used to estimate CO2 emissions for the four SRES scenarios. Combining these models, we
derive a number of scenarios of the annual impact of ocean-acidification-induced coral reef
loss, and conduct a sensitivity analysis.
We find that the annual economic impact rapidly escalates over time, essentially because the
scenarios have rapid economic growth in the relevant countries and coral reefs are a luxury
good. Nonetheless, the annual value in 2100 in still only a small fraction of total income, and
one order of magnitude smaller than the impact of climate change (Tol 2008b). The estimated
impact is uncertain, of course, but the estimated confidence interval spans one order of
magnitude only.
Despite the relatively small numbers, future research should investigate the implications of
our findings for climate policy – the Pigouvian tax on carbon dioxide emissions, the trade-offs
between greenhouse gases, the optimal trajectory over time and its sensitivity to the discount
rate, and the attractiveness of geoengineering. If indeed ocean acidification adds some 10% to
the total impact of climate change, then the Pigouvian tax on carbon dioxide (but not on other
greenhouse gases) should go up by at least 10% too. However, as ocean acidification is a
more direct and more immediate impact, the marginal cost estimate should be more sensitive
than the total cost estimate – but how much remains to be studied. To test the robustness of
our conclusions, other researchers should derive their own estimates of the economic value of
ocean acidification. Future research should seek to extend the estimates presented here to
other impacts of ocean acidification, notably on shellfish, fish, marine mammals, and birds;
and to investigate the interactions between ocean acidification, climate change, and sea level
rise.
Acknowledgements
We acknowledge the funding support from the Institute for Environmental Studies of the
Vrije Universiteit. Moreover, we thank Bob Leeworthy of NOAA for granting us access to his
collection of coral reef valuation studies, giving us a head start with the meta-analysis.
9

References
Nakicenovic, N. and R.J.Swart (eds.) (2001), IPCC Special Report on Emissions Scenarios Cambridge University Press, Cambridge.
Andersson, A.J., N.R.Bates, and F.T.MacKenzie (2007), 'Dissolution of Carbonate Sediments under Rising pCO2 and Ocean Acidification: Observations from Devil's Hole, Bermuda', Aquatic Geochemistry, 13, 237-264.
Andersson, A.J., F.T.MacKenzie, and L.M.Ver (2003), 'Solution of Shallow-Water Carbonates: An Insignificant Buffer Against Rising Atmospheric CO2', Geology, 31, (6), 513-516.
Brander, L.M., P.J.H.van Beukering, and H.S.J.Cesar (2007), 'The Recreational Value of Coral Reefs: A Meta-Analysis', Ecological Economics, 63, 209-218.
Burke, L. and J.Maidens (2004), Reefs at Risk in the Caribbean ,World Resources Institute, Washington,D.C.
Caldeira, K. and M.E.Wickett (2005), 'Ocean Model Predictions of Chemistry Changes from Carbon Dioxide Emissions to the Atmosphere and Ocean', Journal of Geophysical Research, 110, (C09S04).
Cao, L., K.Caldeira, and A.K.Jain (2007), 'Effects of Carbon Dioxide and Climate Change on Ocean Acidification and Carbonate Mineral Saturation', Geophysical Research Letters, 34, (L05607), 1-5.
Castles, I. and D.Henderson (2003), 'The IPCC Emission Scenarios: An Economic-Statistical Critique', Energy & Environment, 14, (2-3), 159-185.
Cesar, H.S.J., L.Burke, and L.Pet-Soede (2003), The Economics of Worldwide Coral Reef Degradation ,Cesar Environmental Economic Consulting, Arnhem.
d'Arge, R., W.D.Schulze, and D.S.Brookshire (1982), 'Carbon Dioxide on Intergenerational Choice', American Economic Review, 72, (2), 251-256.
Gattuso, J.-P., M.Frankignoulle, I.Bourge, S.Romaine, and R.W.Buddemeier (1998), 'Effect of Calcium Carbonate Saturation of Seawater on Coral Calcification', Global and Planetary Change, 18, 37-46.
Gazeau, F., C.Quiblier, J.M.Jansen, J.-P.Gattuso, J.J.Middelburg, and C.H.R.Heip (2007), 'Impact of Elevated CO2 on Shellfish Calcification', Geophysical Research Letters, 34, (L07603), 1-5.
Gibson, T., H.Wanless, J.Klaus, P.Foster-Turley, K.Florini, and T.Olso (2008), Corals and Climate Change: Florida's National Treasures at Risk ,Environmental Defense Fund, Washington, D.C.
Hall-Spencer, J.M., R.Rodolfo-Metalpa, S.Martin, E.Ransome, M.Fine, S.M.Turner, S.J.Rowley, D.Tedesco, and M.-C.Buia (2008), 'Volcanic Carbon Dioxide Vents Show Ecosystem Effects of Ocean Acidification', Nature, 454, 96-99.
Hamilton, J.M., D.J.Maddison, and R.S.J.Tol (2005), 'Effects of Climate Change on International Tourism', Climate Research, 29, 245-254.
Hoegh-Goldberg, H. and O.Hoegh-Goldberg (2004), The Implications of Climate Change for Australia's Great Barrier Reef: People and Industries at Risk ,World Wildlife Fund and Queensland Tourism Industry Council, Brisbane.
10

Hoegh-Goldberg, O., P.J.Mumby, A.J.Hooten, R.S.Steneck, P.Greenfield, E.Gomez, C.D.Harvell, P.F.Sale, A.J.Edwards, K.Caldeira, N.Knowlton, C.M.Eakin, R.Iglesias-Prieto, N.Muthiga, R.H.Bradbury, A.Dubi, and M.E.Hatziolos (2007), 'Coral Reefs under Rapid Climate Change and Ocean Acidification', Science, 318, 1737-1742.
Ishimatsu, A., T.Kikkawa, M.Hayashi, K.-S.Lee, and J.Kita (2004), 'Effects of CO2 on Marine Fish: Larvae and Adults', Journal of Oceanography, 60, 731-741.
Key, R.M., A.Kozyr, C.L.Sabine, K.Lee, R.Wanninkhof, J.L.Bullister, R.A.Feely, F.J.Millero, C.Mordy, and T.H.Peng (29-12-2004), 'A global ocean carbon climatology: Results from Global Data Analysis Project (GLODAP)', Global Biogeochem.Cycles, 18.
Kleypas, J.A., R.W.Buddemeier, D.Archer, J.-P.Gattuso, C.Langdon, and B.N.Opdyke (1999), 'Geochemical Consequences of Increased Atmospheric Carbon Dioxide on Coral Reefs', Science, 284, 118-120.
Langdon, C., T.Takahashi, C.Sweeney, D.Chipman, J.Goddard, F.Marubini, H.Aceves, H.Barnett, and M.J.Atkinson (2000), 'Effect of Calcium Carbonate Saturation State on the Calcification Rate of an Experimental Coral Reef', Global Biogeochemical Cycles, 14, (2), 639-654.
Maier-Reimer, E. and K.Hasselmann (1987), 'Transport and Storage of Carbon Dioxide in the Ocean: An Inorganic Ocean Circulation Carbon Cycle Model', Climate Dynamics, 2, 63-90.
McNeil, B.I. and R.J.Matear (2006), 'Projected Climate Change Impact on Oceanic Acidification', Carbon Balance and Management, 1, (2), 1-6.
McNeil, B.I. and R.J.Matear (2007), 'Climate Change Feedbacks on Future Oceanic Acidification', Tellus, 59B, 191-198.
Morse, J.W., A.J.Andersson, and F.T.MacKenzie (2006), 'Initial Responses of Carbonate-Rise Shelf Sediments to Rising Atmospheric pCO2 and "Ocean Acidification": Role of High Mg-Calcites', Geochimica et Cosmochimica Acta, 70, 5814-5830.
Nordhaus, W.D. (1991), 'To Slow or Not to Slow: The Economics of the Greenhouse Effect', Economic Journal, 101, 920-937.
Orr, J.C., V.J.Fabry, O.Aumont, L.Bopp, S.C.Doney, R.A.Feely, A.Gnanadesikan, N.Gruber, A.Ishida, F.Joos, R.M.Key, K.Lindsay, E.Maier-Reimer, R.Matear, P.Monfray, A.Mouchet, R.G.Najjar, G.-K.Plattner, K.B.Rodgers, C.L.Sabine, J.L.Sarmiento, R.Schlitzer, R.D.Slater, I.J.Totterdell, M.-F.Weirig, Y.Yamanaka, and A.Yool (2005), 'Anthropogenic Ocean Acidification over the Twenty-First Century and its Impact on Calcifying Organisms', Nature, 437, 681-686.
Pielke, R.A., Jr., T.M.L.Wigley, and C.Green (2008), 'Dangerous Assumptions', Nature, 452, 531-532.
Ridgwell, A., I.Zondervan, J.C.Hargreaves, J.Bijma, and T.M.Lenton (2007), 'Assessing the Potential Long-Term Increase of Oceanic Fossil Fuel CO2 Uptake due to CO2-Calcification Feedback', Biogeosciences, 4, 481-492.
Riebesell, U., I.Zondervan, B.Rost, P.D.Tortell, R.E.Zeebe, and F.M.M.Morel (2000), 'Reduced Calcification of Marine Plankton in Response to Increased Atmospheric CO2', Nature, 407, 364-367.
Schelling, T.C. (1996), 'The Economic Diplomacy of Geoengineering', Climatic Change, 33, 303-307.
11

Schmalensee, R. (1993), 'Comparing Greenhouse Gases for Policy Purposes', Energy Journal, 14, 245-255.
Spicer, J.I., A.Raffo, and S.Widdicombe (2007), 'Influence of CO2-Related Seawater Acidification on Extracellular Acid-Base Balance in the Velvet Swimming Crab Necora Puber', Marine Biology, 151, 1117-1125.
Tol, R.S.J. (2005), 'The marginal damage costs of carbon dioxide emissions: an assessment of the uncertainties', Energy Policy, 33, 2064-2074.
Tol, R.S.J. (2008a), 'Climate, development and malaria: An application of FUND', Climatic Change, 88, (1), 21-34.
Tol, R.S.J. (2008b), 'Why Worry About Climate Change? A Research Agenda', Environmental Values, 17, (4), 437-470.
Vergara, W., N.Toba, D.Mira-Salama, and A.Deeb (2009), 'The Potential Consequences of Climate-Induced Coral Loss in the Caribbean by 2050-2080', in Assessing the Potential Consquences of Climate Destabilization in Latin America, vol. 32 W. Vergara (ed.), World Bank, Washington, D.C..
Westmacott, S., H.S.J.Cesar, L.Pet-Soede, and O.Linden (2002), 'Coral Bleaching in the Indian Ocean: Socio-Economic Assessment of the Effects', in Collected Essays on the Economics of Coral Reefs, H.S.J. Cesar (ed.), Kalmar University, Kalmar.
Wilkinson, C., O.Linden, H.S.J.Cesar, G.M.Hodgson, J.Rubens, and A.E.Strong (1999), 'Ecological and Socioeconomic Impacts of 1998 Coral Mortality in the Indian Ocean: An ENSO Impact and a Warning of Future Change?', Ambio, 28, 188-199.
World Bank (2000), Cities, Sea, and Storms: Managing Change in Pacific Island Economies. Volume IV: Adapting to Climate Change Change ,Papua New Guinea and Pacific Islands Country Unit, World Bank, Washington, D.C.
12
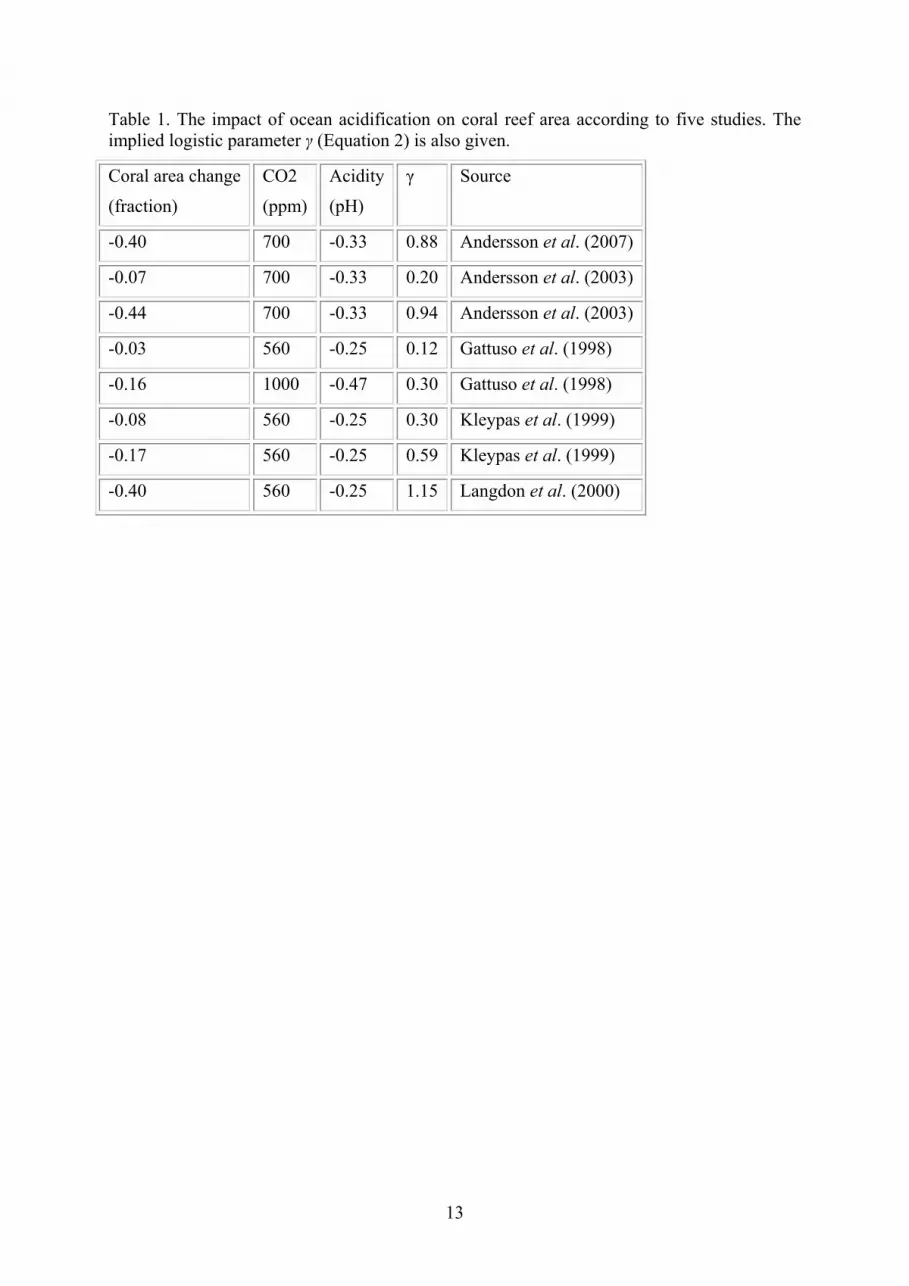
Table 1. The impact of ocean acidification on coral reef area according to five studies. The implied logistic parameter γ (Equation 2) is also given.
Coral area change
(fraction)
CO2
(ppm)
Acidity
(pH)
γ
Source
-0.40 700 -0.33 0.88 Andersson et al. (2007)
-0.07 700 -0.33 0.20 Andersson et al. (2003)
-0.44 700 -0.33 0.94 Andersson et al. (2003)
-0.03 560 -0.25 0.12 Gattuso et al. (1998)
-0.16 1000 -0.47 0.30 Gattuso et al. (1998)
-0.08 560 -0.25 0.30 Kleypas et al. (1999)
-0.17 560 -0.25 0.59 Kleypas et al. (1999)
-0.40 560 -0.25 1.15 Langdon et al. (2000)
13

Table 2. Meta-regression results; dependent variable is ln(coral reef value per square kilometer).
Category Variable Coefficient Standard deviation Constant 0.216 5.298 Socio-economic GDP per capita (ln) 1.125* 0.573 Population density (ln) 0.516* 0.282 Visitors (ln) 0.675*** 0.129 Location USA -3.604** 1.457 East Africa -0.200 1.706 South East Asia -4.606** 1.614 Australia -6.725** 2.779 Reef quality Area coral cover (ln) -0.524*** 0.092 Biodiversity index (ln) 2.475** 1.000 Goods and services Dive tourism 0.355 0.505 Snorkelling -0.605* 0.427 Other reef tourism 0.535* 0.466 Commercial fishing -0.390 0.758 Recreational fishing -1.192 1.656 Coastal protection -3.061* 1.757 Biodiversity 0.638 1.656 Preservation 0.148 1.119 Valuation method CVM -1.701* 1.649 Travel cost method 0.405 1.708 Net factor income -1.377 1.797 Production function method -0.512 1.928 Gross revenue -0.281 1.703 Adj. R2 0.601 F 6.553 Standard error 1.510 N 81 *** p<0.01, ** p<0.05, * p<0.1
14

Table A1. Descriptive statistics for the variables in the meta-regression (cf. Table 1)
Mean Std. Deviation
US$ per km2 per year (ln) 10.946 2.392
GDP per capita (ln) 9.141 1.275
Population density (ln) 3.924 1.374
Visitors (ln) 11.514 2.312
US 0.366 0.485
East Africa 0.110 0.315
SE Asia 0.256 0.439
Australia 0.098 0.299
Area coral cover (ln) 3.902 2.703
Biodiversity index (ln) -1.290 0.773
Dive tourism 0.720 0.452
Snorkelling 0.561 0.499
Other reef tourism 0.451 0.501
Commercial fishing 0.073 0.262
Recreational fishing 0.012 0.110
Coastal protection 0.024 0.155
Biodiversity 0.012 0.110
Preservation 0.061 0.241
CVM 0.488 0.503
Travel cost method 0.134 0.343
Net factor income 0.085 0.281
Production function method 0.073 0.262
Gross revenue 0.207 0.408
15

Table A2. Selected characteristics of affected countries: Reef area in 2000; population, per capita income, and international tourist arrivals in 2000 and assumed growth rates for the 21st century.
Reef Population Growth rate (%) Income Growth rate (%) Arrivals Growth rate (%)
km^2 000 A1 A2 B1 B2 $ A1 A2 B1 B2 000 A1 A2 B1 B2
Indonesia 51020 228438 0.20 0.68 0.20 0.68 1024 5.07 2.61 4.56 3.53 4324 5.00 3.79 4.83 4.39
Australia 48960 19358 -0.31 -0.09 -0.31 -0.09 20327 3.66 2.19 3.09 2.60 3726 3.58 3.00 3.33 3.29
New Caledonia 40000 205 0.76 0.97 0.76 0.97 7367 3.96 2.57 3.43 2.97 86 3.82 3.22 3.56 3.50
Paraguay 25060 5734 0.03 0.02 0.03 0.02 1860 1.87 0.86 1.34 1.11 438 2.09 1.79 1.82 1.94
Papua New Guinea 13840 5049 0.81 1.34 0.81 1.34 1172 3.67 1.88 3.71 2.20 42 4.51 3.55 4.66 3.80
Fiji 10020 844 0.24 0.59 0.24 0.59 2544 3.48 2.21 3.00 2.60 318 3.66 3.16 3.43 3.42
Maldives 8920 311 0.24 0.59 0.24 0.59 1088 3.11 1.91 2.64 2.30 315 3.09 2.64 2.85 2.91
Saudi Arabia 6660 22757 -0.15 -0.08 -0.15 -0.08 6886 4.11 2.52 3.61 3.27 3325 4.86 4.21 4.66 4.77
Marshall Islands 6110 71 0.24 0.59 0.24 0.59 1923 2.94 1.76 2.47 2.12 5 3.27 2.84 3.04 3.08
French Polynesia 6000 254 -0.01 -0.23 -0.01 -0.23 5095 1.95 0.85 1.48 1.16 172 3.01 2.58 2.75 2.87
India 5790 1029991 0.03 0.02 0.03 0.02 358 1.87 0.86 1.34 1.11 2124 1.95 1.68 1.69 1.83
Solomon Islands 5750 480 -0.15 -0.08 -0.15 -0.08 863 4.11 2.52 3.61 3.27 12 4.85 4.21 4.65 4.77
Vanuatu 4110 193 0.24 0.59 0.24 0.59 1402 3.48 2.21 3.00 2.60 44 3.57 3.09 3.36 3.33
Egypt 3800 69537 0.85 0.97 0.85 0.97 949 3.17 1.91 2.64 2.31 2872 3.72 3.28 3.47 3.56
Malaysia 3600 22229 0.20 0.68 0.20 0.68 4343 5.07 2.61 4.56 3.53 7469 5.33 4.12 5.16 4.75
Bahamas 3580 298 0.24 0.59 0.24 0.59 12338 3.48 2.21 3.00 2.60 1598 3.74 3.24 3.51 3.50
Tanzania, United Rep 3580 36232 -0.15 -0.08 -0.15 -0.08 155 4.11 2.52 3.61 3.27 285 4.21 3.56 4.02 4.11
Cuba 3290 11184 0.03 0.02 0.03 0.02 640 1.87 0.86 1.34 1.11 738 1.90 1.61 1.63 1.76
Eritrea 3260 4298 0.24 0.59 0.24 0.59 180 3.48 2.21 3.00 2.60 315 3.63 3.14 3.40 3.40
Kiribati 2940 94 0.81 1.34 0.81 1.34 616 4.67 2.67 4.71 2.99 4 4.89 3.78 5.05 4.02
Japan 2900 126772 0.24 0.59 0.24 0.59 40944 2.94 1.76 2.47 2.12 1731 3.16 2.73 2.95 2.96
Sudan 2720 36080 0.20 0.68 0.20 0.68 279 5.07 2.61 4.56 3.53 63 5.45 4.25 5.28 4.87
Madagascar 2230 15983 0.24 0.59 0.24 0.59 230 3.11 1.91 2.64 2.30 75 3.50 3.06 3.26 3.32
Thailand 2130 61798 -0.31 -0.09 -0.31 -0.09 2869 3.66 2.19 3.09 2.60 6952 3.66 3.07 3.41 3.36
Colombia 2060 40349 0.81 1.34 0.81 1.34 2090 3.67 1.88 3.71 2.20 1399 4.31 3.38 4.48 3.62
Myanmar 1870 41995 0.24 0.59 0.24 0.59 556 3.11 1.91 2.64 2.30 110 3.41 2.87 3.16 3.17
Mozambique 1860 19371 0.01 0.39 0.01 0.39 111 3.31 1.67 2.67 2.60 51 3.85 3.18 3.53 3.90
Seychelles 1690 80 -0.31 -0.09 -0.31 -0.09 6920 3.66 2.19 3.09 2.60 121 3.57 2.99 3.32 3.28
Puerto Rico 1610 3937 0.81 1.34 0.81 1.34 4673 4.67 2.67 4.71 2.99 3131 4.82 3.70 4.97 3.94
Panama 1600 2846 0.81 1.34 0.81 1.34 3005 4.96 2.91 4.99 3.24 345 5.02 3.90 5.18 4.15
China 1510 1273111 0.01 0.39 0.01 0.39 574 3.93 2.17 3.27 3.18 20034 4.19 3.51 3.91 4.24
Tonga 1500 104 0.81 1.34 0.81 1.34 1692 4.67 2.67 4.71 2.99 29 4.92 3.81 5.08 4.06
Belize 1420 256 0.52 0.30 0.52 0.30 2775 1.86 0.86 1.40 1.13 131 2.36 2.07 2.15 2.23
Dominican Rep 1350 8582 0.81 1.34 0.81 1.34 1525 4.67 2.67 4.71 2.99 1776 4.91 3.79 5.06 4.03
Viet Nam 1270 79939 0.81 1.34 0.81 1.34 274 4.67 2.67 4.71 2.99 1351 4.92 3.82 5.08 4.06
Haiti 1260 6965 0.81 1.34 0.81 1.34 349 4.67 2.67 4.71 2.99 145 5.01 3.90 5.17 4.15
Mexico 1220 101879 0.24 0.59 0.24 0.59 3139 3.11 1.91 2.64 2.30 20241 3.56 3.08 3.31 3.36
16

Reef Population Growth rate (%) Income Growth rate (%) Arrivals Growth rate (%)
Brazil 1200 174469 -0.41 0.24 -0.41 0.24 4418 4.24 1.91 3.63 3.00 1991 4.41 3.18 4.14 3.92
United Arab Emirates 1190 2408 0.24 0.59 0.24 0.59 11786 3.11 1.91 2.64 2.30 1601 3.28 2.83 3.05 3.09
Palau 1150 19 0.81 1.34 0.81 1.34 3182 4.67 2.67 4.71 2.99 45 4.87 3.76 5.02 4.02
Honduras 1120 6406 0.81 1.34 0.81 1.34 702 4.67 2.67 4.71 2.99 215 4.59 3.49 4.75 3.73
Jamaica 1010 2657 0.81 1.34 0.81 1.34 1691 4.67 2.67 4.71 2.99 1147 4.55 3.45 4.71 3.69
Taiwan, Province of China 940 22371 0.24 0.59 0.24 0.59 8702 3.48 2.21 3.00 2.60 1553 3.67 3.17 3.44 3.43
Mauritius 870 1190 0.81 1.34 0.81 1.34 3561 4.67 2.67 4.71 2.99 422 4.64 3.53 4.80 3.77
Nicaragua 870 4918 -0.31 -0.09 -0.31 -0.09 426 3.66 2.19 3.09 2.60 281 3.42 2.84 3.17 3.12
United States 840 278959 0.24 0.59 0.24 0.59 26341 3.48 2.21 3.00 2.60 43385 3.63 3.14 3.41 3.39
Somalia 710 7489 0.03 0.02 0.03 0.02 199 1.87 0.86 1.34 1.11 10 2.38 2.11 2.11 2.26
Tuvalu 710 11 -0.31 -0.09 -0.31 -0.09 392 3.66 2.19 3.09 2.60 45 3.16 2.59 2.92 2.87
Iran, Islamic Rep 700 66129 0.03 0.02 0.03 0.02 1444 1.87 0.86 1.34 1.11 452 1.94 1.67 1.68 1.82
Qatar 700 769 0.81 1.34 0.81 1.34 10346 4.67 2.67 4.71 2.99 250 4.75 3.67 4.91 3.92
Yemen 700 18078 0.24 0.59 0.24 0.59 246 3.48 2.21 3.00 2.60 61 3.45 2.95 3.22 3.21
Sri Lanka 680 19409 0.24 0.59 0.24 0.59 726 3.48 2.21 3.00 2.60 403 3.77 3.27 3.54 3.53
Kenya 630 30766 0.01 0.39 0.01 0.39 333 3.93 2.17 3.27 3.18 691 4.30 3.52 3.99 4.28
Virgin Islands, U.S. 590 122 0.24 0.59 0.24 0.59 7367 3.11 1.91 2.64 2.30 454 3.41 2.96 3.17 3.22
Bahrain 570 645 0.76 0.97 0.76 0.97 9839 3.96 2.57 3.43 2.97 2043 4.06 3.48 3.80 3.77
Oman 530 2622 0.24 0.59 0.24 0.59 5615 3.48 2.21 3.00 2.60 352 3.57 3.07 3.34 3.33
Samoa 490 179 0.81 1.34 0.81 1.34 924 4.67 2.67 4.71 2.99 68 5.56 4.44 5.71 4.69
Djibouti 450 461 0.81 1.34 0.81 1.34 817 4.96 2.91 4.99 3.24 21 5.10 4.00 5.26 4.24
Cameroon 430 15803 -0.15 -0.08 -0.15 -0.08 604 4.11 2.52 3.61 3.27 100 4.26 3.60 4.06 4.16
Comoros 430 596 0.81 1.34 0.81 1.34 354 4.96 2.91 4.99 3.24 23 5.19 4.08 5.35 4.32
Guadeloupe 400 431 -0.01 -0.23 -0.01 -0.23 4152 1.95 0.85 1.48 1.16 640 2.90 2.46 2.64 2.74
Martinique 260 419 0.03 0.02 0.03 0.02 5201 1.87 0.86 1.34 1.11 457 2.21 1.94 1.95 2.10
Netherlands Antilles 250 212 0.03 0.02 0.03 0.02 5414 1.87 0.86 1.34 1.11 681 1.96 1.68 1.70 1.83
Venezuela 230 23917 0.24 0.59 0.24 0.59 3537 3.11 1.91 2.64 2.30 597 3.44 3.00 3.21 3.26
Bermuda 210 64 -0.01 -0.23 -0.01 -0.23 17849 1.95 0.85 1.48 1.16 387 2.88 2.43 2.62 2.70
Brunei Darussalam 210 344 0.81 1.34 0.81 1.34 16938 4.67 2.67 4.71 2.99 498 4.74 3.63 4.90 3.88
Antigua and Barbuda 180 67 0.81 1.34 0.81 1.34 3740 4.67 2.67 4.71 2.99 414 4.65 3.53 4.80 3.77
Grenada 160 89 -0.15 -0.08 -0.15 -0.08 2999 4.11 2.52 3.61 3.27 108 4.56 3.92 4.36 4.48
St. Kitts and Nevis 160 39 0.03 0.02 0.03 0.02 3132 1.87 0.86 1.34 1.11 232 2.07 1.80 1.81 1.96
St. Vincent & Grenadines 140 116 0.81 1.34 0.81 1.34 1120 4.67 2.67 4.71 2.99 60 4.87 3.75 5.02 3.99
Kuwait 110 2042 0.03 0.02 0.03 0.02 15719 1.87 0.86 1.34 1.11 295 2.34 2.06 2.07 2.22
Singapore 100 4300 0.24 0.59 0.24 0.59 25645 3.48 2.21 3.00 2.60 6422 3.79 3.29 3.56 3.55
Barbados 90 275 0.24 0.59 0.24 0.59 6594 3.48 2.21 3.00 2.60 442 3.72 3.22 3.49 3.47
St. Lucia 90 158 0.24 0.59 0.24 0.59 1825 3.48 2.21 3.00 2.60 256 3.50 3.01 3.27 3.27
Dominica 70 71 0.81 1.34 0.81 1.34 3140 4.67 2.67 4.71 2.99 60 4.87 3.75 5.01 3.99
Bangladesh 50 131270 0.81 1.34 0.81 1.34 317 4.67 2.67 4.71 2.99 156 4.24 3.13 4.39 3.37
Cambodia 50 12492 0.24 0.59 0.24 0.59 294 3.11 1.91 2.64 2.30 220 3.40 2.96 3.17 3.21
Ecuador 50 13184 0.24 0.59 0.24 0.59 1565 3.48 2.21 3.00 2.60 440 3.43 2.94 3.21 3.19
17

Reef Population Growth rate (%) Income Growth rate (%) Arrivals Growth rate (%)
Jordan 50 5153 0.24 0.59 0.24 0.59 1150 3.48 2.21 3.00 2.60 1074 3.48 2.99 3.25 3.25
Nauru 50 12 -0.41 0.24 -0.41 0.24 2147 3.60 1.46 3.00 2.45 190 3.89 2.90 3.63 3.62
Pakistan 50 144617 -0.31 -0.09 -0.31 -0.09 449 3.66 2.19 3.09 2.60 378 3.50 2.92 3.26 3.21
Reunion 50 733 0.03 0.02 0.03 0.02 2050 1.87 0.86 1.34 1.11 304 2.28 1.97 2.01 2.14
South Africa 50 43586 0.20 0.68 0.20 0.68 3566 5.07 2.61 4.56 3.53 4488 4.67 3.46 4.49 4.11
Trinidad and Tobago 40 1170 0.01 0.39 0.01 0.39 4202 3.93 2.17 3.27 3.18 260 4.04 3.29 3.74 4.01
Costa Rica 30 3773 0.85 0.97 0.85 0.97 2540 3.17 1.91 2.64 2.31 785 3.74 3.31 3.49 3.59
Israel 10 5938 0.85 0.97 0.85 0.97 15555 3.17 1.91 2.64 2.31 2212 3.56 3.10 3.30 3.39
18
-0.8
-0.7
-0.6
-0.5
-0.4
-0.3
-0.2
-0.1
0.0350 550 750 950 1150 1350 1550
ppm
pH
Figure 1. Ocean acidity as a function of the atmospheric concentration of carbon dioxide as modeled by Caldeira and Wickett (2005) (red squares) and as approximated by Equation (1) (thick blue line; the 67% confidence interval is given the dashed blue lines).
19
-1.0
-0.9
-0.8
-0.7
-0.6
-0.5
-0.4
-0.3
-0.2
-0.1
0.0350 550 750 950 1150 1350 1550
ppm
frac
tion
Figure 2. Coral reef area as a function of the atmospheric concentration of carbon dioxide as according to Equations (1) and (2). The dotted lines are the 67% confidence interval.
20

300
400
500
600
700
800
900
2000 2020 2040 2060 2080 2100
ppm
A2A1B2B1
Figure 3. The atmospheric concentration of carbon dioxide according to the four SRES marker scenarios as implemented in FUND.
21

-0.45
-0.40
-0.35
-0.30
-0.25
-0.20
-0.15
-0.10
-0.05
0.002000 2020 2040 2060 2080 2100
chan
ge in
pH
B1B2A1A2
Figure 4. The change in ocean acidity according to the four SRES marker scenarios as implemented in FUND and Equation (1).
22

-0.30
-0.25
-0.20
-0.15
-0.10
-0.05
0.002000 2020 2040 2060 2080 2100
frac
tion
cora
l
B1B2A1A2
Figure 5. The change in coral reef area according to the four SRES marker scenarios as implemented in FUND and Equation (2).
23

0
500
1000
1500
2000
2500
2000 2020 2040 2060 2080 2100
mln
$/k
m2
A1B1B2A2
Figure 6. The net present value of coral reefs according to the four SRES marker scenarios as implemented in FUND and the meta-regression.
24

-200
0
200
400
600
800
1000
2000 2020 2040 2060 2080 2100
billi
on d
olla
rA1B2A2B1
Figure 7. The annual economic damage of ocean-acidification-induced coral reef area loss.
25

-500 0 500 1000 1500 2000 2500 3000
B1
B2, high loss
B2, low value
A2
B2, low pH
B2, high scarcity
B2
B2, low scarcity
B2, high pH
A1b
B2, low loss
B2, high value
billion dollar
Figure 8. A sensitivity analysis around the annual economic damage of ocean-acidification-induced coral reef area loss.
26
0
5
10
15
20
25
30
35
40
2000 2020 2040 2060 2080 2100
visi
tors
(200
0=1)
A1A2B1B2
Figure A1. International visitors to coral reefs according to the four SRES marker scenarios as implemented in FUND and HTM.
27

Year Number Title/Author(s) ESRI Authors/Co-authors Italicised
2009 281 Assessing the impact of biodiversity on tourism flows:
A model for tourist behaviour and its policy implications Giulia Macagno, Maria Loureiro, Paulo A.L.D. Nunes and
Richard S.J. Tol 280 Advertising to boost energy efficiency: the Power of One
campaign and natural gas consumption Seán Diffney, Seán Lyons and Laura Malaguzzi Valeri 279 International Transmission of Business Cycles Between
Ireland and its Trading Partners Jean Goggin and Iulia Siedschlag 278 Optimal Global Dynamic Carbon Taxation David Anthoff 277 Energy Use and Appliance Ownership in Ireland Eimear Leahy and Seán Lyons 276 Discounting for Climate Change David Anthoff, Richard S.J. Tol and Gary W. Yohe 275 Projecting the Future Numbers of Migrant Workers in the
Health and Social Care Sectors in Ireland Alan Barrett and Anna Rust 274 Economic Costs of Extratropical Storms under Climate
Change: An application of FUND Daiju Narita, Richard S.J. Tol, David Anthoff 273 The Macro-Economic Impact of Changing the Rate of
Corporation Tax Thomas Conefrey and John D. Fitz Gerald 272 The Games We Used to Play
An Application of Survival Analysis to the Sporting Life-course Pete Lunn 2008 271 Exploring the Economic Geography of Ireland Edgar Morgenroth 270 Benchmarking, Social Partnership and Higher Remuneration:
Wage Settling Institutions and the Public-Private Sector Wage Gap in Ireland
Elish Kelly, Seamus McGuinness, Philip O’Connell 269 A Dynamic Analysis of Household Car Ownership in Ireland Anne Nolan
28

268 The Determinants of Mode of Transport to Work in the
Greater Dublin Area Nicola Commins and Anne Nolan 267 Resonances from Economic Development for Current
Economic Policymaking Frances Ruane 266 The Impact of Wage Bargaining Regime on Firm-Level
Competitiveness and Wage Inequality: The Case of Ireland Seamus McGuinness, Elish Kelly and Philip O’Connell 265 Poverty in Ireland in Comparative European Perspective Christopher T. Whelan and Bertrand Maître 264 A Hedonic Analysis of the Value of Rail Transport in the
Greater Dublin Area Karen Mayor, Seán Lyons, David Duffy and Richard S.J. Tol 263 Comparing Poverty Indicators in an Enlarged EU Christopher T. Whelan and Bertrand Maître 262 Fuel Poverty in Ireland: Extent,
Affected Groups and Policy Issues Sue Scott, Seán Lyons, Claire Keane, Donal McCarthy and
Richard S.J. Tol 261 The Misperception of Inflation by Irish Consumers David Duffy and Pete Lunn 260 The Direct Impact of Climate Change on Regional Labour
Productivity Tord Kjellstrom, R Sari Kovats, Simon J. Lloyd, Tom Holt,
Richard S.J. Tol 259 Damage Costs of Climate Change through Intensification of
Tropical Cyclone Activities: An Application of FUND
Daiju Narita, Richard S. J. Tol and David Anthoff 258 Are Over-educated People Insiders or Outsiders?
A Case of Job Search Methods and Over-education in UK Aleksander Kucel, Delma Byrne 257 Metrics for Aggregating the Climate Effect of Different
Emissions: A Unifying Framework Richard S.J. Tol, Terje K. Berntsen, Brian C. O’Neill, Jan S.
Fuglestvedt, Keith P. Shine, Yves Balkanski and Laszlo Makra 256 Intra-Union Flexibility of Non-ETS Emission Reduction
Obligations in the European Union
29

Richard S.J. Tol 255 The Economic Impact of Climate Change Richard S.J. Tol 254 Measuring International Inequity Aversion Richard S.J. Tol 253 Using a Census to Assess the Reliability of a National
Household Survey for Migration Research: The Case of Ireland
Alan Barrett and Elish Kelly 252 Risk Aversion, Time Preference, and the Social Cost of Carbon David Anthoff, Richard S.J. Tol and Gary W. Yohe 251 The Impact of a Carbon Tax on Economic Growth and Carbon
Dioxide Emissions in Ireland Thomas Conefrey, John D. Fitz Gerald, Laura Malaguzzi Valeri
and Richard S.J. Tol 250 The Distributional Implications of a Carbon Tax in Ireland Tim Callan, Sean Lyons, Susan Scott, Richard S.J. Tol and
Stefano Verde 249 Measuring Material Deprivation in the Enlarged EU Christopher T. Whelan, Brian Nolan and Bertrand Maître 248 Marginal Abatement Costs on Carbon-Dioxide Emissions: A
Meta-Analysis Onno Kuik, Luke Brander and Richard S.J. Tol 247 Incorporating GHG Emission Costs in the Economic Appraisal
of Projects Supported by State Development Agencies Richard S.J. Tol and Seán Lyons 246 A Carton Tax for Ireland Richard S.J. Tol, Tim Callan, Thomas Conefrey, John D. Fitz
Gerald, Seán Lyons, Laura Malaguzzi Valeri and Susan Scott 245 Non-cash Benefits and the Distribution of Economic Welfare Tim Callan and Claire Keane 244 Scenarios of Carbon Dioxide Emissions from Aviation Karen Mayor and Richard S.J. Tol 243 The Effect of the Euro on Export Patterns: Empirical Evidence
from Industry Data Gavin Murphy and Iulia Siedschlag 242 The Economic Returns to Field of Study and Competencies
30

Among Higher Education Graduates in Ireland Elish Kelly, Philip O’Connell and Emer Smyth 241 European Climate Policy and Aviation Emissions Karen Mayor and Richard S.J. Tol 240 Aviation and the Environment in the Context of the EU-US
Open Skies Agreement Karen Mayor and Richard S.J. Tol 239 Yuppie Kvetch? Work-life Conflict and Social Class in Western
Europe Frances McGinnity and Emma Calvert 238 Immigrants and Welfare Programmes: Exploring the
Interactions between Immigrant Characteristics, Immigrant Welfare Dependence and Welfare Policy
Alan Barrett and Yvonne McCarthy 237 How Local is Hospital Treatment? An Exploratory Analysis of
Public/Private Variation in Location of Treatment in Irish Acute Public Hospitals
Jacqueline O’Reilly and Miriam M. Wiley 236 The Immigrant Earnings Disadvantage Across the Earnings
and Skills Distributions: The Case of Immigrants from the EU’s New Member States in Ireland
Alan Barrett, Seamus McGuinness and Martin O’Brien 235 Europeanisation of Inequality and European Reference
Groups Christopher T. Whelan and Bertrand Maître 234 Managing Capital Flows: Experiences from Central and
Eastern Europe Jürgen von Hagen and Iulia Siedschlag 233 ICT Diffusion, Innovation Systems, Globalisation and Regional
Economic Dynamics: Theory and Empirical Evidence Charlie Karlsson, Gunther Maier, Michaela Trippl, Iulia
Siedschlag, Robert Owen and Gavin Murphy 232 Welfare and Competition Effects of Electricity Interconnection
between Great Britain and Ireland Laura Malaguzzi Valeri 231 Is FDI into China Crowding Out the FDI into the European
Union? Laura Resmini and Iulia Siedschlag 230 Estimating the Economic Cost of Disability in Ireland John Cullinan, Brenda Gannon and Seán Lyons
31

32
229 Controlling the Cost of Controlling the Climate: The Irish Government’s Climate Change Strategy
Colm McCarthy, Sue Scott 228 The Impact of Climate Change on the Balanced-Growth-
Equivalent: An Application of FUND David Anthoff, Richard S.J. Tol 227 Changing Returns to Education During a Boom? The Case of
Ireland Seamus McGuinness, Frances McGinnity, Philip O’Connell 226 ‘New’ and ‘Old’ Social Risks: Life Cycle and Social Class
Perspectives on Social Exclusion in Ireland Christopher T. Whelan and Bertrand Maître 225 The Climate Preferences of Irish Tourists by Purpose of Travel Seán Lyons, Karen Mayor and Richard S.J. Tol 224 A Hirsch Measure for the Quality of Research Supervision, and
an Illustration with Trade Economists Frances P. Ruane and Richard S.J. Tol 223 Environmental Accounts for the Republic of Ireland: 1990-
2005 Seán Lyons, Karen Mayor and Richard S.J. Tol 2007 222 Assessing Vulnerability of Selected Sectors under
Environmental Tax Reform: The issue of pricing power J. Fitz Gerald, M. Keeney and S. Scott 221 Climate Policy Versus Development Aid
Richard S.J. Tol 220 Exports and Productivity – Comparable Evidence for 14
Countries The International Study Group on Exports and Productivity 219 Energy-Using Appliances and Energy-Saving Features:
Determinants of Ownership in Ireland Joe O’Doherty, Seán Lyons and Richard S.J. Tol 218 The Public/Private Mix in Irish Acute Public Hospitals: Trends
and Implications Jacqueline O’Reilly and Miriam M. Wiley
217 Regret About the Timing of First Sexual Intercourse: The Role
of Age and Context Richard Layte, Hannah McGee
216 Determinants of Water Connection Type and Ownership of

33
Water-Using Appliances in Ireland Joe O’Doherty, Seán Lyons and Richard S.J. Tol
215 Unemployment – Stage or Stigma?
Being Unemployed During an Economic Boom Emer Smyth
214 The Value of Lost Load Richard S.J. Tol 213 Adolescents’ Educational Attainment and School Experiences
in Contemporary Ireland Merike Darmody, Selina McCoy, Emer Smyth
212 Acting Up or Opting Out? Truancy in Irish Secondary Schools
Merike Darmody, Emer Smyth and Selina McCoy 211 Where do MNEs Expand Production: Location Choices of the
Pharmaceutical Industry in Europe after 1992 Frances P. Ruane, Xiaoheng Zhang
210 Holiday Destinations: Understanding the Travel Choices of
Irish Tourists Seán Lyons, Karen Mayor and Richard S.J. Tol
209 The Effectiveness of Competition Policy and the Price-Cost
Margin: Evidence from Panel Data Patrick McCloughan, Seán Lyons and William Batt
208 Tax Structure and Female Labour Market Participation:
Evidence from Ireland Tim Callan, A. Van Soest, J.R. Walsh
207 Distributional Effects of Public Education Transfers in Seven
European Countries Tim Callan, Tim Smeeding and Panos Tsakloglou
Recommended


