
The Fecal Microbiome in Dogs with Acute Diarrhea andIdiopathic Inflammatory Bowel DiseaseJan S. Suchodolski1*, Melissa E. Markel1, Jose F. Garcia-Mazcorro2, Stefan Unterer3, Romy M. Heilmann1,
Scot E. Dowd4, Priyanka Kachroo5, Ivan Ivanov5, Yasushi Minamoto1, Enricka M. Dillman5,
Jorg M. Steiner1, Audrey K. Cook5, Linda Toresson6
1 Gastrointestinal Laboratory, Small Animal Clinical Sciences, College of Veterinary Medicine and Biomedical Sciences, Texas A&M University, College Station, Texas, United
States of America, 2 Facultad de Medicina Veterinaria, Universidad Autonoma de Nuevo Leon. Gral. Escobedo, Nuevo Leon, Mexico, 3 Clinic of Small Animal Medicine,
Ludwig-Maximillians-University, Munich, Germany, 4 Molecular Research DNA Laboratory, Shallowater, Texas, United States of America, 5 College of Veterinary Medicine
and Biomedical Sciences, Texas A&M University, College Station, Texas, United States of America, 6 Helsingborg Referral Animal Hospital, Helsingborg, Sweden
Abstract
Background: Recent molecular studies have revealed a highly complex bacterial assembly in the canine intestinal tract.There is mounting evidence that microbes play an important role in the pathogenesis of acute and chronic enteropathies ofdogs, including idiopathic inflammatory bowel disease (IBD). The aim of this study was to characterize the bacterialmicrobiota in dogs with various gastrointestinal disorders.
Methodology/Principal Findings: Fecal samples from healthy dogs (n = 32), dogs with acute non-hemorrhagic diarrhea(NHD; n = 12), dogs with acute hemorrhagic diarrhea (AHD; n = 13), and dogs with active (n = 9) and therapeuticallycontrolled idiopathic IBD (n = 10) were analyzed by 454-pyrosequencing of the 16S rRNA gene and qPCR assays. Dogs withacute diarrhea, especially those with AHD, had the most profound alterations in their microbiome, as significant separationswere observed on PCoA plots of unweighted Unifrac distances. Dogs with AHD had significant decreases in Blautia,Ruminococcaceae including Faecalibacterium, and Turicibacter spp., and significant increases in genus Sutterella andClostridium perfringens when compared to healthy dogs. No significant separation on PCoA plots was observed for the dogswith IBD. Faecalibacterium spp. and Fusobacteria were, however, decreased in the dogs with clinically active IBD, butincreased during time periods of clinically insignificant IBD, as defined by a clinical IBD activity index (CIBDAI).
Conclusions: Results of this study revealed a bacterial dysbiosis in fecal samples of dogs with various GI disorders. Theobserved changes in the microbiome differed between acute and chronic disease states. The bacterial groups that werecommonly decreased during diarrhea are considered to be important short-chain fatty acid producers and may beimportant for canine intestinal health. Future studies should correlate these observed phylogenetic differences withfunctional changes in the intestinal microbiome of dogs with defined disease phenotypes.
Citation: Suchodolski JS, Markel ME, Garcia-Mazcorro JF, Unterer S, Heilmann RM, et al. (2012) The Fecal Microbiome in Dogs with Acute Diarrhea and IdiopathicInflammatory Bowel Disease. PLoS ONE 7(12): e51907. doi:10.1371/journal.pone.0051907
Editor: Markus M. Heimesaat, Charite, Campus Benjamin Franklin, Germany
Received September 29, 2012; Accepted November 6, 2012; Published December 26, 2012
Copyright: � 2012 Suchodolski et al. This is an open-access article distributed under the terms of the Creative Commons Attribution License, which permitsunrestricted use, distribution, and reproduction in any medium, provided the original author and source are credited.
Funding: These authors have no support or funding to report.
Competing Interests: The authors have read the journal’s policy and have the following conflict. Author Scot E. Dowd is an employee of MR DNA (MolecularResearch), Shallowater. There are no patents, products in development or marketed products to declare. This does not alter the authors’ adherence to all the PLOSONE policies on sharing data and materials, as detailed online in the guide for authors.
* E-mail: [email protected]
Introduction
Recent molecular-phylogenetic studies have revealed a complex
assembly of bacteria in the mammalian gastrointestinal (GI) tract
[1–3]. Intestinal microbes play a crucial role in the maintenance of
host health. They act as a defending barrier against transient
pathogens, support the host in digestion and energy harvest from
the diet, stimulate the immune system, and provide nutritional
support for enterocytes [4].
The intestinal microbiota has also been implicated in the
pathogenesis of various canine GI disorders, either associated with
the presence of specific pathogens (e.g., enterotoxigenic C.
perfringens, Salmonella, viruses, and parasites) in acute episodes of
diarrhea [5,6], or a non-specific dysbiosis such as that described in
dogs with idiopathic inflammatory bowel disease [7–10]. Canine
idiopathic IBD is one of the most common causes of chronic GI
disease in dogs and encompasses a group of chronic enteropathies
of unknown cause, which are characterized by infiltration of the
intestinal mucosa with inflammatory cells [11]. Although histo-
pathologic changes may be found in any segment of the GI tract,
the small intestine is typically the most frequently affected
segment. The diagnosis of idiopathic IBD is made after known
causes of GI inflammation have been ruled out, the animal has not
shown a favorable response to a dietary and antibiotic therapeutic
trial, and typically requires immunosuppressive or anti-inflamma-
tory therapy [11].
Molecular-phylogenetic studies have revealed a bacterial and/
or fungal dysbiosis in the duodenum of dogs with idiopathic IBD.
Most commonly, a decrease in the proportions of Clostridiales and
PLOS ONE | www.plosone.org 1 December 2012 | Volume 7 | Issue 12 | e51907
an increase in Proteobacteria is observed [7,9,10,12]. Only few
molecular studies have described the fecal microbiota of dogs with
acute and chronic GI disorders. One study, using fluorescent in situ
hybridization (FISH) probes, found Bacteroides counts to be
significantly increased in Beagle dogs with chronic diarrhea [13].
In contrast, using 454-pyrosequencing of the cpn60 gene,
significantly decreased proportions of Bacteroidetes were observed
in dogs with unspecified diarrhea [14]. Using terminal restriction
fragment length polymorphism (T-RFLP) analysis and quantita-
tive PCR (qPCR), an increased abundance of Clostridium perfringens,
Enterococcus faecalis, and E. faecium was observed in dogs during
diarrheic episodes [15]. While these studies suggest a dysbiosis
present in fecal samples of dogs with diarrhea, additional studies
using high-throughput sequencing technologies in dogs with well-
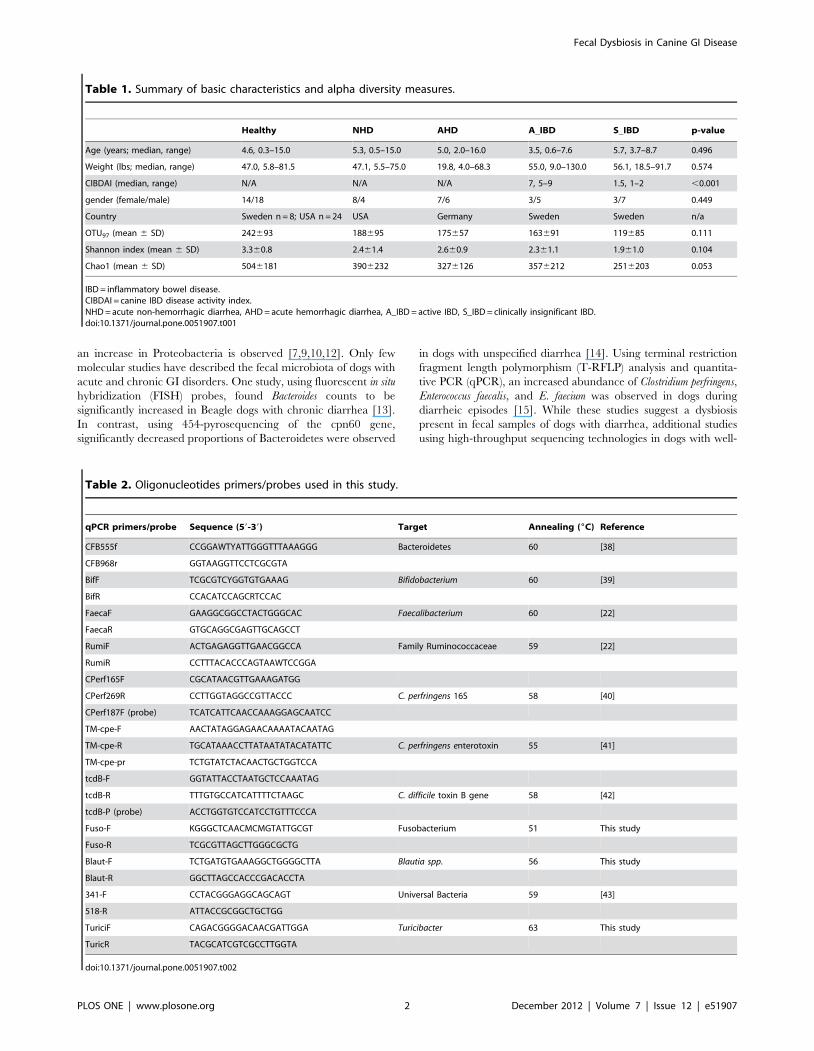
Table 1. Summary of basic characteristics and alpha diversity measures.
Healthy NHD AHD A_IBD S_IBD p-value
Age (years; median, range) 4.6, 0.3–15.0 5.3, 0.5–15.0 5.0, 2.0–16.0 3.5, 0.6–7.6 5.7, 3.7–8.7 0.496
Weight (lbs; median, range) 47.0, 5.8–81.5 47.1, 5.5–75.0 19.8, 4.0–68.3 55.0, 9.0–130.0 56.1, 18.5–91.7 0.574
CIBDAI (median, range) N/A N/A N/A 7, 5–9 1.5, 1–2 ,0.001
gender (female/male) 14/18 8/4 7/6 3/5 3/7 0.449
Country Sweden n = 8; USA n = 24 USA Germany Sweden Sweden n/a
OTU97 (mean 6 SD) 242693 188695 175657 163691 119685 0.111
Shannon index (mean 6 SD) 3.360.8 2.461.4 2.660.9 2.361.1 1.961.0 0.104
Chao1 (mean 6 SD) 5046181 3906232 3276126 3576212 2516203 0.053
IBD = inflammatory bowel disease.CIBDAI = canine IBD disease activity index.NHD = acute non-hemorrhagic diarrhea, AHD = acute hemorrhagic diarrhea, A_IBD = active IBD, S_IBD = clinically insignificant IBD.doi:10.1371/journal.pone.0051907.t001
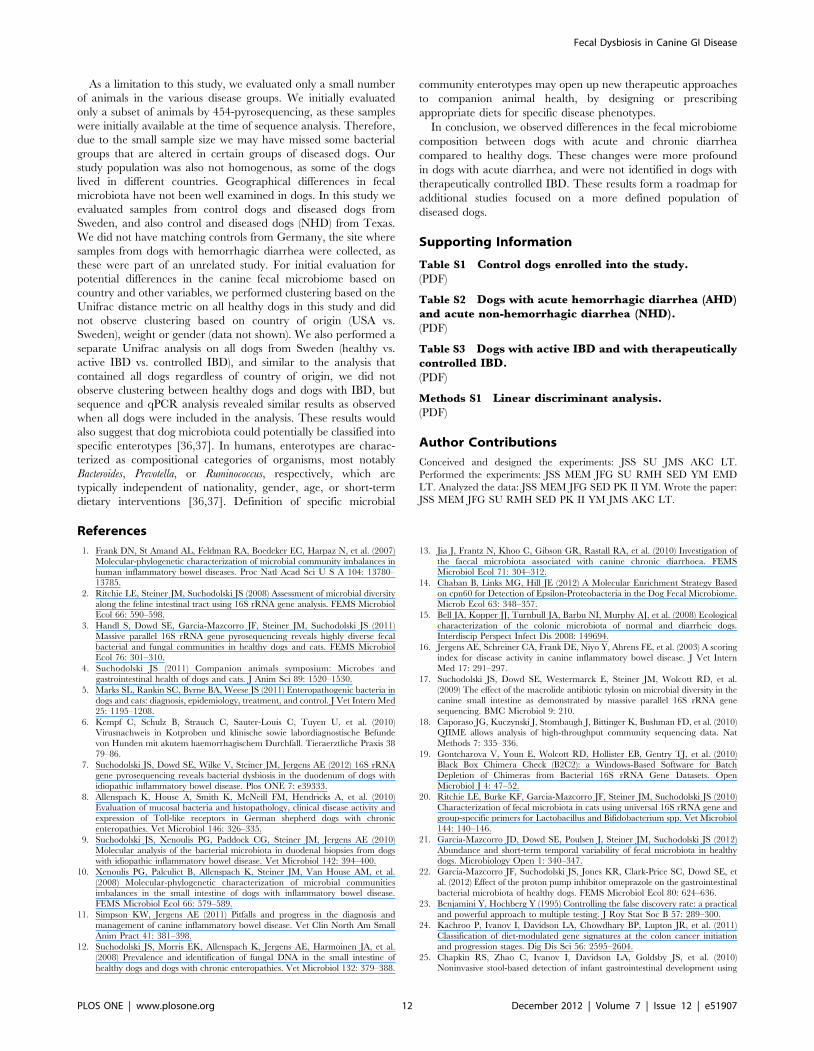
Table 2. Oligonucleotides primers/probes used in this study.
qPCR primers/probe Sequence (59-39) Target Annealing (6C) Reference
CFB555f CCGGAWTYATTGGGTTTAAAGGG Bacteroidetes 60 [38]
CFB968r GGTAAGGTTCCTCGCGTA
BifF TCGCGTCYGGTGTGAAAG Bifidobacterium 60 [39]
BifR CCACATCCAGCRTCCAC
FaecaF GAAGGCGGCCTACTGGGCAC Faecalibacterium 60 [22]
FaecaR GTGCAGGCGAGTTGCAGCCT
RumiF ACTGAGAGGTTGAACGGCCA Family Ruminococcaceae 59 [22]
RumiR CCTTTACACCCAGTAAWTCCGGA
CPerf165F CGCATAACGTTGAAAGATGG
CPerf269R CCTTGGTAGGCCGTTACCC C. perfringens 16S 58 [40]
CPerf187F (probe) TCATCATTCAACCAAAGGAGCAATCC
TM-cpe-F AACTATAGGAGAACAAAATACAATAG
TM-cpe-R TGCATAAACCTTATAATATACATATTC C. perfringens enterotoxin 55 [41]
TM-cpe-pr TCTGTATCTACAACTGCTGGTCCA
tcdB-F GGTATTACCTAATGCTCCAAATAG
tcdB-R TTTGTGCCATCATTTTCTAAGC C. difficile toxin B gene 58 [42]
tcdB-P (probe) ACCTGGTGTCCATCCTGTTTCCCA
Fuso-F KGGGCTCAACMCMGTATTGCGT Fusobacterium 51 This study
Fuso-R TCGCGTTAGCTTGGGCGCTG
Blaut-F TCTGATGTGAAAGGCTGGGGCTTA Blautia spp. 56 This study
Blaut-R GGCTTAGCCACCCGACACCTA
341-F CCTACGGGAGGCAGCAGT Universal Bacteria 59 [43]
518-R ATTACCGCGGCTGCTGG
TuriciF CAGACGGGGACAACGATTGGA Turicibacter 63 This study
TuricR TACGCATCGTCGCCTTGGTA
doi:10.1371/journal.pone.0051907.t002
Fecal Dysbiosis in Canine GI Disease
PLOS ONE | www.plosone.org 2 December 2012 | Volume 7 | Issue 12 | e51907

defined acute and chronic disease phenotypes are needed to
further characterize changes in the fecal microbiome. In addition,
comparison of fecal findings in dogs with IBD with those
previously observed in duodenal biopsies is of interest [7], as
collection of fecal samples is more practical. Furthermore, it is
unclear if the pattern of dysbiosis observed in dogs with IBD is
specific for this disorder, or if similar patterns are present in acute
GI diseases.
This study compared the fecal microbiome of healthy dogs, dogs
with acute non-hemorrhagic diarrhea (NHD), dogs with acute
hemorrhagic diarrhea (AHD), and dogs with active and thera-
peutically controlled clinically insignificant IBD. The results
indicate differences in the fecal microbiome among the dogs with
various GI diseases. Dogs with acute diarrhea had the most
pronounced changes, with several bacterial groups altered when
compared to healthy dogs. Only Faecalibacterium spp. and
Fusobacteria were decreased in dogs with clinically active IBD,
but increased during time periods of clinically insignificant IBD.
Materials and Methods
Ethics StatementThe collection and analysis of fecal samples was approved by
the institutional Clinical Research Review Committee of the
College of Veterinary Medicine, Texas A&M University
(CRRC#09-06).
Animals and Sample CollectionFecal samples from a total of 76 dogs were analyzed. These dogs
were either healthy (n = 32), or had signs of either acute non-
hemorrhagic diarrhea (NHD; n = 12), acute hemorrhagic diarrhea
(AHD, n = 13), active inflammatory bowel disease (A-IBD; n = 9),
or therapeutically controlled clinically insignificant IBD (S-IBD;
n = 10), as scored by a published canine clinical IBD activity index
(CIBDAI) [16]. Left-over naturally-passed feces collected for
routine fecal examination were frozen within a few hours of
collection at either 220uC or 280uC, and were stored frozen until
processing of samples for DNA extraction. The summary of the
baseline characteristics for each animal group is listed in Table 1,
and detailed descriptions of each enrolled dog are listed in
supplementary Tables S1–S3.
Healthy controls. Fecal samples from a total of 32 pet dogs
were analyzed by 454-pyrosequencing and quantitative PCR
assays (qPCR). All dogs were privately owned and lived in diverse
home environments, were on a variety of commercial diets, and
none of the dogs had a history of gastrointestinal signs or
administration of antibiotics for at least the past 3 months (Table
S1). Eight healthy dogs lived in Sweden, while the remaining 24
healthy dogs lived in Texas, USA.
Dogs with acute non-hemorrhagic diarrhea
(NHD). Fecal samples from a total of 12 pet dogs that presented
to a first-opinion practice (Austin, TX) with acute, uncomplicated,
non-hemorrhagic diarrhea were evaluated (duration of diarrhea
,3 days). Of those, 7 samples were analyzed by 454-pyrose-
quencing, while all 12 samples were analyzed by qPCR assays.
None of the dogs had a previous history of GI signs or had
received antibiotics within the previous 3 months (Table S2).
Diagnostic evaluation included complete blood count (CBC),
serum chemistry profiles, and partial fecal analysis for enteric
pathogens by fecal flotation and fecal cytology. Clostridium
Figure 1. Rarefaction analysis of 16 S rRNA gene sequences obtained from canine fecal samples. Lines represent the average of eachgroup, while the error bars represent the standard deviations. The analysis was performed on a randomly selected subset of 2,000 sequences persample. A_IBD = active IBD; S_IBD = therapeutically controlled IBD; NHD = acute non-hemorrhagic diarrhea; AHD = acute hemorrhagic diarrhea.doi:10.1371/journal.pone.0051907.g001
Fecal Dysbiosis in Canine GI Disease
PLOS ONE | www.plosone.org 3 December 2012 | Volume 7 | Issue 12 | e51907

Table 3. Relative percentages of the most abundant bacterial groups at the various phylogenetic levels (phylum, class, order,family, genus) based on pyrosequencing.
Medians % (min-max%)*
Healthy NHD AHD Active IBD Controlled IBDKruskal-WallisP-value**
Firmicutes 96.6 (81–100) 95.6 (83–100) 56 (13–100) 98.7 (95–100) 98.6 (24–100) 0.0985
Clostridia 78.1 (21–97) 86.8 (46–99) 55.6 (12–99) 45.5 (1–94) 47 1–91) 1
Clostridiales 78.1 (21–97) 86.8 (46–99) 55.6 (12–99) 45.5 (1–94) 47 (1–91) 1
Clostridiaceae 36.2 (6–84) 81.5 (32–99) 46.4 (7–99) 26.4 (1–82) 18.2 (1–75) 0.302
Clostridium 33.7a (5–84) 81.5b (32–99) 44.0a,b (6–99) 13.7a (0–82) 14.2a (0–82) 0.03
Ruminococcaceae 16.0a (0–46) 4.7b (0–21) 0.8b (0–18) 5.6a,b (0–54) 7.9a,b (0–53) 0.004
Faecalibacterium 0.1 (0–16) 0 (0–5) 0 (0–3) 0 (0–0) 0.3 (0–3) 1
Ruminococcus 15.4a (0–46) 4.7b (0–16) 0.7b (0–18) 5.6a,b (0–54) 6.8a,b (0–53) 0.008
Lachnospiraceae 0.4 (0–2) 0.1 (0–3) 0 (0–1) 0.3 (0–1) 0.3 (0–3) 0.114
Blautia 9.9a (0–28) 0.2b (0–17) 0.2b (0–4) 5.9a,b (0–9) 3.6b (0–16) 0.002
Roseburia 0.2 (0–1) 0.1 (0–3) 0 (0–1) 0.1 (0–0) 0.1 (0–1) 0.642
Coprococcus 0 (0–1) 0 (0–0) 0 (0–0) 0.1 (0–0) 0.1 (0–1) 1
Veillonellaceae 0 (0–4) 0 (0–0) 0 (0–1) 0 (0–0) 0 (0–0) 1
Eubacteriaceae 0.2 (0–2) 0.1 (0–13) 0.1 (0–17) 0.2 (0–0) 0.5 (0–4) 1
Eubacterium 0.8 (0–27) 0.1 (0–13) 0.1 (0–17) 0.3 (0–1) 1 (0–5) 0.564
Erysipelotrichi 7.8a (0–45) 0.7a,b (0–9) 0.1b (0–2) 0.8a,b (0–99) 0.8b (0–8) 0.0009
Erysipelotrichales 7.8a (0–45) 0.7a,b (0–9) 0.1b (0–2) 0.8a,b (0–99) 0.8b (0–8) 0.0009
Erysipelotrichaceae 7.8a (0–45) 0.7a,b (0–9) 0.1b (0–2) 0.8a,b (0–99) 0.8b (0–8) 0.0009
Turicibacter 0.5 (0–39) 0.1 (0–4) 0 (0–0) 0 (0–0) 0.1 (0–1) 0.138
Allobaculum 0.3 (0–14) 0.4 (0–8) 0 (0–1) 0 (0–3) 0 (0–2) 1
Bacilli 0 (0–15) 0.2 (0–16) 0 (0–3) 0 (0–1) 0 (0–1) 0.2169
Lactobacillales 0.2 (0–74) 1.7 (0–29) 0.4 (0–5) 18.2 (0–60) 7.9 (0–98) 1
Streptococcaceae 0.1 (0–74) 0.3 (0–19) 0.1 (0–4) 6 (0–60) 2.7 (0–95) 1
Streptococcus 0 (0–74) 0.3 (0–19) 0.1 (0–4) 3.4 (0–60) 2.5 (0–95) 1
Lactobacillaceae 0 (0–61) 0 (0–2) 0 (0–0) 0 (0–11) 0.2 (0–98) 0.86
Enterococcaceae 0 (0–3) 0 (0–2) 0 (0–3) 0 (0–1) 0 (0–1) 1
Proteobacteria 0.30a (0–3) 1.3a,b (0–16) 4.3b (0–17) 0.1a (0–1) 0.1a (0–46) 0.016
Betaproteobacteria 0.0a (0–0) 0.0a,b (0–3) 2.1b (0–14) 0.0a,b (0–0) 0.0a (0–8) 0.0099
Sutterella 0.0a (0–0) 0.0a (0–0) 1.6b (0–14) 0.0a (0–0) 0.0a (0–1) 0.008
Gammaproteobacteria 0 (0–3) 1 (0–16) 0.6 (0–15) 0 (0–0) 0 (0–29) 0.0648
Enterobacteriales 0 (0–3) 0.2 (0–16) 0.1 (0–13) 0 (0–0) 0 (0–19) 1
Enterobacteriaceae 0 (0–0) 0.2 (0–16) 0.1 (0–13) 0 (0–0) 0 (0–19) 1
Alphaproteobacteria 0.1 (0–0.9) 0.1 (0–1.2) 0 (0–0.2) 0.1 (0–0.3) 0 (0–2) 0.063
Rickettsiales 0.1a (0–0.9) 0.0a,b (0–0.2) 0.0b (0–0.2) 0.1a,b (0–0.3) 0.0b (0–0.4) 0.0072
Anaplasmataceae 0.1a (0–0.9) 0.0a,b (0–0.2) 0.0b (0–0.2) 0.1a,b (0–0.3) 0.0b (0–0.4) 0.016
Anaplasma 0.1a (0–0.9) 0.0a,b (0–0.2) 0.0b (0–0.2) 0.1a,b (0–0.3) 0.0b (0–0.4) 0.016
Bacteroidetes 0 (0–18) 0 (0–3) 0.5 (0–17) 0 (0–0) 0 (0–12) 0.0685
Bacteroidia 0 (0–18) 0 (0–0) 0.5 (0–17) 0 (0–0) 0 (0–11) 0.1683
Bacteroidales 0 (0–18) 0 (0–0) 0.5 (0–17) 0 (0–0) 0 (0–11) 0.1683
Bacteroidaceae 0 (0–4) 0 (0–0) 0.5 (0–10) 0 (0–0) 0 (0–3) 0.524
Bacteroides 0 (0–3) 0 (0–0) 0.5 (0–10) 0 (0–0) 0 (0–3) 0.696
Actinobacteria 1.8a (0–13) 1.4a.b (0–6) 0.2b (0–3) 0.8a,b (0–5) 1.0a,b (0–15) 0.019
Actinobacteria (class) 1.8a (0–13) 1.4a.b (0–6) 0.2b (0–3) 0.8a,b (0–5) 1.0a,b (0–15) 0.0342
Coriobacteriales 1.8a (0–13) 1.0a,b (0–6) 0.1b (0–2) 0.8a,b (0–5) 0.7a,b (0–15) 0.0162
Coriobacteriaceae 1.8a (0–13) 1.0a,b (0–6) 0.1b (0–2) 0.8a,b (0–5) 0.7a,b (0–15) 0.036
Collinsella 1.5a (0–13) 1.0a,b (0–4) 0.0b (0–2) 0.7a,b (0–5) 0.5a,b (0–13) 0.018
Fusobacteria 0.1 (0–4) 0 (0–2) 23.5 (0–75) 0 (0–0) 0 (0–17) 0.0865
Fecal Dysbiosis in Canine GI Disease
PLOS ONE | www.plosone.org 4 December 2012 | Volume 7 | Issue 12 | e51907

perfringens enterotoxin and C. difficile toxin A/B were analyzed using
commercially available ELISA kits (C. perfringens Enterotoxin
TestTM and C. difficile Tox A/B IITM, TechLab, Blacksburg,
VA). Based on review of the medical records, all dogs in this group
recovered after non-specific symptomatic therapy (e.g., fluid
supplementation, gastric acid blockers) within a few days.
Dogs with acute hemorrhagic diarrhea (AHD). Fecal
samples were analyzed from a total of 13 pet dogs that presented
to the Clinic of Small Animal Medicine, LMU University of
Munich, Germany, with acute hemorrhagic diarrhea (duration of
,3 days). None of the dogs had a previous history of GI signs or
had received antibiotics within the previous 3 months (Table S2).
Diagnostic evaluation included CBC, serum chemistry profiles,
and partial fecal analysis for enteric pathogens (C. perfringens
enterotoxin ELISA, C. difficile toxin A/B ELISA, and fecal
culture).
Dogs with idiopathic IBD. Fecal samples were analyzed
from pet dogs that had been presented to the Helsingborg Referral
Animal Hospital, Helsingborg, Sweden with signs of chronic GI
disease. Dogs underwent clinical evaluation by a veterinary
internist (LT). Diagnostic tests that were performed included a
CBC, serum chemistry profiles, fecal flotation, serum concentra-
tions of cobalamin and folate, and depending on the clinical signs,
serum concentrations of trypsin-like immunoreactivity (cTLI) and
pancreatic lipase-immunoreactivity (cPLI). During the months of
diagnostic work-ups, dogs underwent various forms of antibiotic
and/or dietary trials. All dogs failed the trials and subsequently
underwent endoscopy with collection of intestinal biopsies. All
dogs then received and responded to immunosuppressive therapy,
leading to a diagnosis of idiopathic IBD (Table S3).
The disease activity of these dogs was scored using the published
clinical canine IBD activity index (CIBDAI) [16]. The CIBDAI is
based on 6 criteria, each scored on a scale from 0–3: attitude/
activity, appetite, vomiting, stool consistency, stool frequency, and
weight loss. The total composite score is determined to be
clinically insignificant (score 0–3), mild (score 4–5), moderate
(score 6–8), or severe (score 9 or greater). We analyzed a total of 19
dogs (Table S3). Of those 19 dogs, 9 were newly diagnosed with
active IBD (A_IBD) as judged by their CIBDAI score (median 7,
range 5–9), and fecal samples collected at the time of diagnosis
were analyzed (5 samples were analyzed by pyrosequencing; all 9
samples were analyzed by qPCR). The other 10 dogs had been on
medical treatment (Table S3) for their idiopathic IBD for several
months to years (therapeutically controlled stable IBD; S_IBD)
and had clinically insignificant or no signs of IBD as scored by the
CIBDAI (median 1.5, range 1–2) at the time of sample collection.
From the latter group of dogs all 10 samples were analyzed by
pyrosequencing and qPCR assays. None of these 19 dogs received
antibiotics for at least 2 months before sample collection.
In addition, paired samples were obtained from 8 dogs,
representing time points when, based on CIBDAI scoring, the
dogs showed either a clinically significant CIBDAI (median 5,
Table 3. Cont.
Medians % (min-max%)*
Healthy NHD AHD Active IBD Controlled IBDKruskal-WallisP-value**
Fusobacteriales 0 (0–4) 0 (0–2) 23.4 (0–0) 0 (0–0) 0 (0–14) 0.1647
Fusobacteriaceae 0 (0–4) 0 (0–2) 23.4 (0–0) 0 (0–0) 0 (0–14) 0.366
Fusobacterium 0 (0–4) 0 (0–2) 23.2 (0–0) 0 (0–0) 0 (0–6) 0.5
Taxa present in at least 50% of dogs (either healthy or diseased) included in analysis.**p-values adjusted based on the Benjamini and Hochberg False discovery rate.*Medians not sharing a common superscript are significantly different (p,0.05 based on a Dunn’s multiple comparisons test).NHD = acute hemorrhagic diarrhea; AHD = acute hemorrhagic diarrhea; IBD = inflammatory bowel disease.doi:10.1371/journal.pone.0051907.t003
Table 4. Summary statistics for qPCR results.
Medians (min-max)* log DNA
Healthy NHD AHD Active IBD Controlled IBDKruskal-WallisP-value
Bacteroidetes 6.4a (0.0–12.1) 4.5b (0.0–6.1) 6.7a (4.7–9.9) 7.3a (0.0–9.3) 5.3a,b (0.0–7.5) 0.0009
Bifidobacterium 2.9 (0.0–7.3) 3.1 (0.0–6.2) 0 (0.0–3.9) 2.2 (0.0–6.6) 3.8 (0.0–7.5) 0.0959
Blautia 9.7a (8.2–10.7) 6.3b (5.7–10.2) 8.2b (6.9–10.2) 9.2a,b (7.3–9.9) 9.5a,b (5.9–9.9) 0.0003
C. perfringens 2.0a (0.0–6.1) 4.0a,b (0.0–7.4) 6.2b (0.6–7.6) 3.0a,b (0.0–6.7) 2.4a,b (0.6–5.7) 0.0002
Faecalibacterium 5.8a (4.1–7.9) 0.0b (0.0–7.7) 4.7b (0.0–7.8) 4.2b (0.0–6.3) 5.5a,b (0.0–7.3) 0.0002
Fusobacteria 7.3a,b (5.5–8.8) 6.9a,c (3.9–8.6) 8.2b (6.0–10.3) 6.4c (4.7–6.7) 7.1a,b,c (3.0–7.9) 0.0014
Ruminococcaceae 7.6a (2.4–8.9) 5.7b (2.7–7.1) 5.6b (0.0–7.5) 7.3a,b (0.0–8.6) 7.9a (6.5–8.6) ,0.0001
Turicibacter 2.9a (0.0–7.7) 0.0b (0.0–4.8) 0.0b (0.0–0.0) 1.5a,b (0.0–6.6) 3.8a (0.0–5.9) 0.0003
Universal 12.0 (10.9–13.2) 10.8 (8.3–12.7) 11.6 (10.7–12.4) 12.0 (9.7–12.2) 12.3 (8.2–12.8) 0.0935
*Medians not sharing a common superscript are significantly different (p,0.05 based on a Dunn’s multiple comparisons test).NHD = acute non-hemorrhagic diarrhea; AHD = acute hemorrhagic diarrhea; IBD = inflammatory bowel diseasedoi:10.1371/journal.pone.0051907.t004
Fecal Dysbiosis in Canine GI Disease
PLOS ONE | www.plosone.org 5 December 2012 | Volume 7 | Issue 12 | e51907

range 4–9) or a clinically insignificant CIBDAI (median 1.5, range
1–3). The time period between the collections of repeated samples
ranged from 2–8 months (median 5.5 months). These paired
samples were analyzed separately by qPCR assays, as these follow
up samples were obtained after the pyrosequencing analysis had
been completed.
DNA ExtractionAn aliquot of 100 mg (wet weight) of each fecal sample was
extracted by a bead-beating method using a commercial DNA
extraction kit (ZR Fecal DNA KitTM, Zymo Research Corpora-
tion) following the manufacturer’s instructions. The bead beating
step was performed on a homogenizer (FastPrep-24, MP
Biomedicals) for 60 s at a speed of 4 m/s.
454-pyrosequencingBacterial tag-encoded FLX-titanium amplicon pyrosequencing
(bTEFAP) based on the V1–V3 region (E. coli position 27–519) of
the 16 S rRNA gene was performed on 67 of the 77 samples as
described previously with primers forward 28F: GAGTTT-
GATCNTGGCTCAG and reverse 519R:
GTNTTACNGCGGCKGCTG [3,17]. Raw sequence data were
screened, trimmed, denoised, and filtered with the QIIME
pipeline version 1.4.0 (http://qiime.sourceforge.net) [18] with
the following settings: minimum read length of 300 bp; no
ambiguous base calls; no homopolymeric runs longer than 8 bp;
average quality value.q25 within a sliding window of 50 bp.
Chimeras were excluded using the software B2C2 (http://www.
researchandtesting.com/B2C2.html) [7,19]. Operational taxo-
nomic units (OTUs) were defined as sequences with at least
97% similarity using QIIME. For classification of sequences on a
genus level the naıve Bayesian classifier within the Ribosomal
Database Project (RDP, v10.28) was used. The confidence
threshold in RDP was set to 80% [7].
Quantitative PCR (qPCR)For validation of pyrosequencing results and/or to evaluate
bacterial groups that are typically present at very low abundance
or typically not detected in sequence data based on the authors’
experience from previous studies (i.e., Bifidobacterium spp.; Faecali-
bacterium spp.) [3,20,21], qPCR assays for selected bacterial groups
were performed: total bacteria, Bacteroidetes, Fusobacteria,
Blautia, Ruminococcaceae, Faecalibacterium spp., Turicibacter spp.,
Bifidobacterium spp., and Clostridium perfringens. PCR was also used to
detect the genes encoding C. perfringens enterotoxin (cpe) and C.
difficile toxin B (tcd B). Real-time PCR conditions were performed
as described previously [22]. The oligonucleotide sequences of
primers and probes, and respective annealing temperatures are
summarized in Table 2. The qPCR data was expressed as log
amount of DNA (fg) for each particular bacterial group per 10 ng
of isolated total DNA.
Statistical AnalysisTo account for unequal sequencing depth across samples, and
to avoid exclusion of samples with lower number of sequence
reads, the subsequent analysis was performed on a randomly
selected subset of 2,000 sequences per sample. Differences in
microbial communities between disease groups were investigated
using the phylogeny-based unweighted UniFrac distance metric,
and PCoA plots and rarefaction curves were plotted using QIIME.
Figure 2. Principal Coordinates Analysis (PCoA) of unweighted UniFrac distances of 16 S rRNA genes. (A) Analysis for healthy dogs(blue), dogs with acute non-hemorrhagic diarrhea (NHD; green), and dogs with acute hemorrhagic diarrhea (AHD; red). These results indicate thatfecal microbial communities differ in dogs with acute forms of diarrhea compared to healthy control dogs. Statistical analysis revealed a significantseparation between samples obtained from NHD and AHD (ANOSIM; p = 0.004) and both groups were also significantly different from the healthydogs (ANOSIM; NHD vs. healthy dogs, p = 0.003; AHD vs. healthy dogs, p = 0.001). (B) Analysis for healthy dogs (blue), dogs with active IBD (red), anddogs with therapeutically controlled IBD (green). In contrast to the dogs with acute diarrhea, fecal communities in dogs with chronic forms ofdiarrhea (active idiopathic IBD) were not significantly different from healthy dogs in this study.doi:10.1371/journal.pone.0051907.g002
Fecal Dysbiosis in Canine GI Disease
PLOS ONE | www.plosone.org 6 December 2012 | Volume 7 | Issue 12 | e51907

Fecal Dysbiosis in Canine GI Disease
PLOS ONE | www.plosone.org 7 December 2012 | Volume 7 | Issue 12 | e51907

To determine differences in microbiota composition between the
animal groups, the analysis of similarities (ANOSIM) function in
the statistical software package PRIMER 6 (PRIMER-E Ltd.,
Lutton, UK) was used on the unweighted UniFrac distance
matrixes. To visualize the relative abundance of bacterial families
for individual fecal samples, heat maps were generated in NCSS
2007 (NCSS, Kaysville, Utah).
For all datasets, assumption of normality was tested using the
D’Agostino and Pearson normality test (Prism 5.00, GraphPad
Software Inc.). Only bacterial taxa that were present in at least
50% of dogs (either healthy or diseased) were included in the
analysis. Because most datasets did not meet the assumptions of
normal distribution, the differences in the proportions of bacterial
taxa (defined as percentage of total sequences) or qPCR results
between healthy and disease groups were determined using non-
parametric Kruskal-Wallis tests (Prism v5.00, GraphPad Software
Inc.). The resulting p-values of the Kruskal-Wallis tests were
corrected for multiple comparisons on each phylogenetic level
using the Benjamini & Hochberg’s False Discovery Rate, and a
p,0.05 was considered statistically significant [23]. For those
bacterial groups that were still significant after p-value adjustment,
a Dunns’ post-test was used to determine which disease categories
were significantly different. A Fisher’s exact test was used to
determine the proportions of dogs that harbored specific bacterial
taxa or toxins.
Paired samples were available for 8 dogs with IBD, representing
samples at time of clinically active and therapeutically controlled
IBD (i.e., clinically insignificant IBD), respectively. The qPCR
assays for these paired samples were performed as batch in the
same assay run, and the obtained data for the paired time points
were compared using a Wilcoxon signed rank test.
Linear Discriminant Analysis (LDA) was used to achieve
dimensionality reduction and thereby to identify combinations
of bacterial groups that would discriminate between healthy
dogs and all diseased dogs (independent of disease phenotype)
[24]. Using the OTUs as features for the classification, the
single, two, or three feature LDA classifiers were constructed
and ranked based on their error estimates [25,26]. More
detailed descriptions of LDA classification are provided as
supplementary Method S1.
Results
Animals and Disease CharacteristicsNo significant differences in age, gender, or body weight were
found among the various animal groups (Table 1).
Sequence AnalysisThe 454- pyrosequencing pipeline yielded 189,138 quality
sequences for the 67 samples analyzed. Across all disease groups,
sequences were classified into nine bacterial phyla (Table 3). Figure 1
illustrates the rarefaction curves for all disease groups. No significant
differences in the number of OTUs, the Shannon index, and the
Chao1 metric were observed (Table 1).
Microbial Communities in Controls and in Dogs withAcute and Chronic Gastrointestinal Diseases
No significant differences were observed in total bacterial
abundance among the groups based on qPCR analysis (Table 4;
p = 0.09). Significant differences in microbial communities were,
however, observed among the various groups. According to the
linear discriminant analysis (LDA; Method S1), the triple
combination of Blautia spp., Faecalibacterium spp., and Turicibacter
spp. had the highest discriminatory power when healthy dogs were
compared to all the dogs with gastrointestinal disease (independent
of disease phenotype).
PCoA plots (Fig. 2) were constructed to compare the individual
groups of dogs, and showed notable differences between healthy
dogs and dogs with acute GI disorders (ANOSIM; NHD vs.
healthy dogs, p = 0.003; AHD vs. healthy dogs, p = 0.001).
Furthermore, both acute disease groups differed significantly from
each other (Fig. 2) (ANOSIM; NHD vs. AHD, p = 0.004).
In contrast, neither the A_IBD nor the S_IBD group were
significantly different from the healthy group or different from
each other based on PCoA plots (ANOSIM; A_IBD vs. S-_IBD,
p = 0.91; A_IBD vs. controls, p = 0.75; S_IBD vs. controls,
p = 0.07). However, sequence analysis and qPCR results revealed
that Faecalibacterium spp. and Fusobacteria were significantly lower
in dogs with clinically active IBD when compared to healthy dogs
(see below).
Dogs with acute hemorrhagic diarrhea (AHD). Based on
PCoA plots, dogs with AHD had profound microbiome changes.
Several bacterial groups were altered in dogs with AHD compared
to the healthy dogs, but also to dogs with other forms of GI disease
(Table 3). Increases in proportions were observed for the genus
Sutterella (class b-Proteobacteria) and Clostridium perfringens--like
sequences (Table 3, Fig. 3). The phylum Fusobacteria was also
increased in dogs with AHD (Fig. 3), but this difference did not
reach significant differences when p-values were adjusted for
multiple comparisons (p = 0.08). Decreases in proportions were
observed for Actinobacteria (i.e., Coriobacteriaceaea) and several
members within the Firmicutes, most notably Ruminococcaceae,
Blautia spp. (Lachnospiraceae), and Turicibacter spp. (Erysipelo-
trichaceae) (Table 3, Fig. 3).
Results of qPCR assays confirmed significant decreases in
Blautia, Ruminococcaceae including Faecalibacterium, and Tur-
icibacter spp. (Fig. 4). Clostridium perfringens was significantly
increased only in the dogs with AHD when compared to
healthy dogs.
Dogs with acute non-hemorrhagic diarrhea
(NHD). PCoA plots also revealed shifts in the fecal micro-
biome of dogs with NHD (ANOSIM; NHD vs. healthy dogs,
p = 0.003). While several bacterial taxa showed similar trends as
observed for dogs with AHD, only few groups reached
significance (Table 3). Sequence analysis revealed decreased
proportions of Blautia spp. and Ruminococcaceae. Analysis by
qPCR confirmed these decreases and also revealed decreases in
Turicibacter spp., Faecalibacterium spp., and Bacteroidetes (Table 4).
Dogs with idiopathic IBD. PCoA plots did not indicate a
significant separation between dogs with idiopathic IBD and
control dogs (Fig. 2.). However, trends were observed for
decreases in proportions of Faecalibacterium spp. and Turicibacter
spp. (p = 0.06) in active IBD when compared to the healthy
dogs, and the proportions of these groups tended to be similar
to control dogs in the samples of dogs with controlled IBD. One
reason for lack of significance in the sequencing results was
most likely due to the low percentage of sequencing tags for
Faecalibacterium, with medians of 0.1% in healthy dogs and 0.0%
Figure 3. Results of sequence analysis for selected bacterial groups. H = healthy, NHD = acute non-hemorrhagic diarrhea, AHD = acutehemorrhagic diarrhea, A_IBD = active IBD, S_IBD = therapeutically controlled, clinically insignificant IBD. Columns not sharing a common superscriptare significantly different (P,0.05).doi:10.1371/journal.pone.0051907.g003
Fecal Dysbiosis in Canine GI Disease
PLOS ONE | www.plosone.org 8 December 2012 | Volume 7 | Issue 12 | e51907

Fecal Dysbiosis in Canine GI Disease
PLOS ONE | www.plosone.org 9 December 2012 | Volume 7 | Issue 12 | e51907

in diseased animals. However, Faecalibacterium was detectable in
23/32 healthy dogs, 6/10 dogs with controlled IBD, but only
1/5 with active IBD (p = 0.04 vs. healthy dogs). Results of
qPCR analysis for Faecalibacterium spp. confirmed the trend
observed for the pyrosequencing results and showed a significant
decrease in dogs with active IBD, but no significant difference
between the healthy dogs and dogs with clinically insignificant
IBD. Furthermore, when paired samples were analyzed from
dogs (n = 8) at time periods of active and clinically insignificant
IBD, the abundance of Faecalibacterium was significantly higher in
samples collected during time periods of clinically insignificant
IBD (Fig. 5, p = 0.0313).
Based on qPCR analysis, also Fusobacteria were significantly
decreased in dogs with active IBD compared to the healthy dogs.
Fusobacteria were also significantly increased in samples collected
during time periods of clinically insignificant IBD compared to
those during active disease when paired samples were analyzed
(Fig. 5, p = 0.0148).
None of the other bacterial groups evaluated by qPCR,
including total bacteria, revealed significant differences between
healthy dogs and those with active IBD, or between time periods
of active disease vs. time periods of clinically insignificant IBD.
Discussion
This study evaluated the fecal microbiome of healthy dogs and
dogs with acute and chronic GI disorders. Significant differences
were observed in microbiome composition among the various
disease groups. Dogs with acute diarrhea showed the most
profound alterations in their microbiome. Faecalibacterium spp.
and the phylum Fusobacteria were decreased in active IBD, but
not significantly different during time periods of clinically
insignificant IBD. Rarefaction curves (Fig. 1.) and alpha diversity
measures (Table 1) suggested a trend for lower species richness and
microbial diversity in the diseased groups. However, statistical
differences (e.g., p = 0.053 for the Chao1) were not identified, most
likely due to the large inter-animal variation and the relative small
number of animals analyzed.
Various pathogens, but also other causes such as hypersensitiv-
ities, have been associated with causing acute diarrhea [27,28]. In
this study only a partial evaluation for bacterial and parasitic
enteropathogens was conducted. Potential pathogens identified
were E. coli, Isospora, Giardia/Cryptosporidium, enterotoxigenic C.
perfringens, and toxigenic C. difficile (Table S2), but no clear evidence
for an association between specific pathogens and acute diarrhea
was identified. Patients were, therefore, classified based on clinical
signs (i.e., AHD and NHD) rather than the presence of specific
pathogens. The results of this study are in general agreement with
previous molecular studies examining the fecal microbiota of dogs
with diarrhea. In one study, dogs with acute episodes of diarrhea
had an increased abundance of C. perfringens and Enterococcus spp.,
and a decrease in Bacteroides spp. [15]. Decreased proportions of
Bacteroidetes were also observed in 9 dogs with unspecified
diarrhea when compared to 9 healthy dogs [14]. Similarly, this
study observed significant decreases in Bacteroidetes in the dogs
with acute non-hemorrhagic diarrhea, but interestingly not in dogs
with AHD. We also observed significant increases in Clostridium
spp. in dogs with NHD and increases in C. perfringens in dogs with
AHD (Fig. 4). Additionally, dogs with AHD showed increases in
Fusobacteria and the genus Sutterella (family Alcaligenaceae). We
also observed that dogs with acute diarrhea displayed significant
decreases in prominent members of the intestinal microbiota, such
as Erysipelotrichaceae (i.e., genus Turicibacter), Ruminococcaceae
(i.e., Ruminocococcus, Faecalibacterium) and Lachnospiraceae (i.e.,
Blautia) (Fig. 6). Some of these groups are believed to be important
producers of short-chain fatty acids (SCFA), which are important
for intestinal health. For example, butyrate protects against colitis
by inducing apoptosis in cells with DNA damage, while acetate
beneficially modulates intestinal permeability [29,30]. The mem-
Figure 4. Results of quantitative PCR assays for selected bacterial groups. H = healthy, NHD = acute non-hemorrhagic diarrhea, AHD = acutehemorrhagic diarrhea, A_IBD = active IBD, S_IBD = therapeutically controlled, clinically insignificant IBD. Columns not sharing a common superscriptare significantly different (P,0.05).doi:10.1371/journal.pone.0051907.g004
Figure 5. Faecalibacterium spp. and the phylum Fusobacteria in active and non-active IBD. Using qPCR, paired fecal samples wereanalyzed from dogs (n = 8) at time periods of active and clinically insignificant IBD as scored by a clinical IBD disease activity index (CIBDAI). The timeperiod between the collections of repeated samples ranged from 2–8 months (median 5.5 months). None of the other bacterial groups evaluated byqPCR, including total bacteria, revealed significant differences between the paired time periods.doi:10.1371/journal.pone.0051907.g005
Fecal Dysbiosis in Canine GI Disease
PLOS ONE | www.plosone.org 10 December 2012 | Volume 7 | Issue 12 | e51907

bers of the intestinal microbiota produce various other metabolites
(e.g., indole) that have direct immunomodulatory properties
[30,31]. Future studies are warranted to evaluate microbiome
function (e.g., microbial derived metabolites) in dogs with acute
diarrhea.
Idiopathic IBD is a common chronic GI disorder of dogs. As in
humans, an interplay between the intestinal microbiota together
with an underlying genetic susceptibility of the host and dietary
and environmental factors, are implicated in the development of
disease [7,32]. While recent studies have reported a dysbiosis in
duodenal samples of dogs with IBD, limited data are available
describing the fecal microbiota in these dogs [7–10]. In this study,
Faecalibacterium spp. and Fusobacteria were significantly decreased
in dogs with active IBD. Furthermore, when paired fecal samples
were analyzed, the abundances of Faecalibacterium spp. and
Fusobacteria were significantly decreased in samples collected
during episodes of clinically active disease vs. periods of clinically
insignificant IBD (Fig. 5). In contrast to previous findings in
duodenal biopsies of dogs with IBD [7], we did not observe
significant differences in members of Proteobacteria between
healthy dogs and dogs with IBD. Proteobacteria were only
significantly higher in dogs with acute diarrhea.
Faecalibacterium spp. were found decreased in dogs with acute
diarrhea and active IBD. Faecalibacterium prausnitzii has garnered
attention as it is often observed to be decreased in humans with
IBD [33]. Furthermore it has been shown to secrete anti-
inflammatory peptides in in-vitro studies [34]. Recent studies
suggest that Faecalibacterium spp. are prominent members of the
canine gut microbiota, as FISH analysis of fecal samples of healthy
dogs estimated the abundance of the Faecalibacterium–Subdoligranu-
lum group as a median 16% of total bacterial counts [21]. It has
been suggested that dogs may harbor Faecalibacterium spp. other
than F. prausnitzii, as an initial phylogenetic assessment of a near-
full-length 16S rRNA gene clone obtained from the canine colon
clustered distinct from a human strain of F. prausnitzii (AJ270469)
[35]. Therefore, the phylogenetic classification of Faecalibacterium
spp and their functional properties in the canine intestine deserve
further research.
Figure 6. Heatmap illustrating the relative abundance of predominant bacterial families in fecal samples of healthy dogs and dogswith acute diarrhea based on 454-pyrosequencing. Samples from healthy dogs (H), dogs with acute non-hemorrhagic diarrhea (NHD), anddogs with acute hemorrhagic diarrhea (AHD) are shown. The heatmap represents the relative percentage of each family within each sample.doi:10.1371/journal.pone.0051907.g006
Fecal Dysbiosis in Canine GI Disease
PLOS ONE | www.plosone.org 11 December 2012 | Volume 7 | Issue 12 | e51907
As a limitation to this study, we evaluated only a small number
of animals in the various disease groups. We initially evaluated
only a subset of animals by 454-pyrosequencing, as these samples
were initially available at the time of sequence analysis. Therefore,
due to the small sample size we may have missed some bacterial
groups that are altered in certain groups of diseased dogs. Our
study population was also not homogenous, as some of the dogs
lived in different countries. Geographical differences in fecal
microbiota have not been well examined in dogs. In this study we
evaluated samples from control dogs and diseased dogs from
Sweden, and also control and diseased dogs (NHD) from Texas.
We did not have matching controls from Germany, the site where
samples from dogs with hemorrhagic diarrhea were collected, as
these were part of an unrelated study. For initial evaluation for
potential differences in the canine fecal microbiome based on
country and other variables, we performed clustering based on the
Unifrac distance metric on all healthy dogs in this study and did
not observe clustering based on country of origin (USA vs.
Sweden), weight or gender (data not shown). We also performed a
separate Unifrac analysis on all dogs from Sweden (healthy vs.
active IBD vs. controlled IBD), and similar to the analysis that
contained all dogs regardless of country of origin, we did not
observe clustering between healthy dogs and dogs with IBD, but
sequence and qPCR analysis revealed similar results as observed
when all dogs were included in the analysis. These results would
also suggest that dog microbiota could potentially be classified into
specific enterotypes [36,37]. In humans, enterotypes are charac-
terized as compositional categories of organisms, most notably
Bacteroides, Prevotella, or Ruminococcus, respectively, which are
typically independent of nationality, gender, age, or short-term
dietary interventions [36,37]. Definition of specific microbial
community enterotypes may open up new therapeutic approaches
to companion animal health, by designing or prescribing
appropriate diets for specific disease phenotypes.
In conclusion, we observed differences in the fecal microbiome
composition between dogs with acute and chronic diarrhea
compared to healthy dogs. These changes were more profound
in dogs with acute diarrhea, and were not identified in dogs with
therapeutically controlled IBD. These results form a roadmap for
additional studies focused on a more defined population of
diseased dogs.
Supporting Information
Table S1 Control dogs enrolled into the study.
(PDF)
Table S2 Dogs with acute hemorrhagic diarrhea (AHD)and acute non-hemorrhagic diarrhea (NHD).
(PDF)
Table S3 Dogs with active IBD and with therapeuticallycontrolled IBD.
(PDF)
Methods S1 Linear discriminant analysis.
(PDF)
Author Contributions
Conceived and designed the experiments: JSS SU JMS AKC LT.
Performed the experiments: JSS MEM JFG SU RMH SED YM EMD
LT. Analyzed the data: JSS MEM JFG SED PK II YM. Wrote the paper:
JSS MEM JFG SU RMH SED PK II YM JMS AKC LT.
References
1. Frank DN, St Amand AL, Feldman RA, Boedeker EC, Harpaz N, et al. (2007)
Molecular-phylogenetic characterization of microbial community imbalances in
human inflammatory bowel diseases. Proc Natl Acad Sci U S A 104: 13780–13785.
2. Ritchie LE, Steiner JM, Suchodolski JS (2008) Assessment of microbial diversity
along the feline intestinal tract using 16S rRNA gene analysis. FEMS MicrobiolEcol 66: 590–598.
3. Handl S, Dowd SE, Garcia-Mazcorro JF, Steiner JM, Suchodolski JS (2011)Massive parallel 16S rRNA gene pyrosequencing reveals highly diverse fecal
bacterial and fungal communities in healthy dogs and cats. FEMS MicrobiolEcol 76: 301–310.
4. Suchodolski JS (2011) Companion animals symposium: Microbes andgastrointestinal health of dogs and cats. J Anim Sci 89: 1520–1530.
5. Marks SL, Rankin SC, Byrne BA, Weese JS (2011) Enteropathogenic bacteria in
dogs and cats: diagnosis, epidemiology, treatment, and control. J Vet Intern Med25: 1195–1208.
6. Kempf C, Schulz B, Strauch C, Sauter-Louis C, Tuyen U, et al. (2010)Virusnachweis in Kotproben und klinische sowie labordiagnostische Befunde
von Hunden mit akutem haemorrhagischem Durchfall. Tieraerztliche Praxis 3879–86.
7. Suchodolski JS, Dowd SE, Wilke V, Steiner JM, Jergens AE (2012) 16S rRNAgene pyrosequencing reveals bacterial dysbiosis in the duodenum of dogs with
idiopathic inflammatory bowel disease. Plos ONE 7: e39333.
8. Allenspach K, House A, Smith K, McNeill FM, Hendricks A, et al. (2010)Evaluation of mucosal bacteria and histopathology, clinical disease activity and
expression of Toll-like receptors in German shepherd dogs with chronic
enteropathies. Vet Microbiol 146: 326–335.
9. Suchodolski JS, Xenoulis PG, Paddock CG, Steiner JM, Jergens AE (2010)Molecular analysis of the bacterial microbiota in duodenal biopsies from dogs
with idiopathic inflammatory bowel disease. Vet Microbiol 142: 394–400.
10. Xenoulis PG, Palculict B, Allenspach K, Steiner JM, Van House AM, et al.
(2008) Molecular-phylogenetic characterization of microbial communitiesimbalances in the small intestine of dogs with inflammatory bowel disease.
FEMS Microbiol Ecol 66: 579–589.
11. Simpson KW, Jergens AE (2011) Pitfalls and progress in the diagnosis and
management of canine inflammatory bowel disease. Vet Clin North Am SmallAnim Pract 41: 381–398.
12. Suchodolski JS, Morris EK, Allenspach K, Jergens AE, Harmoinen JA, et al.
(2008) Prevalence and identification of fungal DNA in the small intestine of
healthy dogs and dogs with chronic enteropathies. Vet Microbiol 132: 379–388.
13. Jia J, Frantz N, Khoo C, Gibson GR, Rastall RA, et al. (2010) Investigation of
the faecal microbiota associated with canine chronic diarrhoea. FEMSMicrobiol Ecol 71: 304–312.
14. Chaban B, Links MG, Hill JE (2012) A Molecular Enrichment Strategy Based
on cpn60 for Detection of Epsilon-Proteobacteria in the Dog Fecal Microbiome.Microb Ecol 63: 348–357.
15. Bell JA, Kopper JJ, Turnbull JA, Barbu NI, Murphy AJ, et al. (2008) Ecological
characterization of the colonic microbiota of normal and diarrheic dogs.Interdiscip Perspect Infect Dis 2008: 149694.
16. Jergens AE, Schreiner CA, Frank DE, Niyo Y, Ahrens FE, et al. (2003) A scoring
index for disease activity in canine inflammatory bowel disease. J Vet InternMed 17: 291–297.
17. Suchodolski JS, Dowd SE, Westermarck E, Steiner JM, Wolcott RD, et al.
(2009) The effect of the macrolide antibiotic tylosin on microbial diversity in thecanine small intestine as demonstrated by massive parallel 16S rRNA gene
sequencing. BMC Microbiol 9: 210.
18. Caporaso JG, Kuczynski J, Stombaugh J, Bittinger K, Bushman FD, et al. (2010)QIIME allows analysis of high-throughput community sequencing data. Nat
Methods 7: 335–336.
19. Gontcharova V, Youn E, Wolcott RD, Hollister EB, Gentry TJ, et al. (2010)Black Box Chimera Check (B2C2): a Windows-Based Software for Batch
Depletion of Chimeras from Bacterial 16S rRNA Gene Datasets. OpenMicrobiol J 4: 47–52.
20. Ritchie LE, Burke KF, Garcia-Mazcorro JF, Steiner JM, Suchodolski JS (2010)
Characterization of fecal microbiota in cats using universal 16S rRNA gene andgroup-specific primers for Lactobacillus and Bifidobacterium spp. Vet Microbiol
144: 140–146.
21. Garcia-Mazcorro JD, Dowd SE, Poulsen J, Steiner JM, Suchodolski JS (2012)Abundance and short-term temporal variability of fecal microbiota in healthy
dogs. Microbiology Open 1: 340–347.
22. Garcia-Mazcorro JF, Suchodolski JS, Jones KR, Clark-Price SC, Dowd SE, etal. (2012) Effect of the proton pump inhibitor omeprazole on the gastrointestinal
bacterial microbiota of healthy dogs. FEMS Microbiol Ecol 80: 624–636.
23. Benjamini Y, Hochberg Y (1995) Controlling the false discovery rate: a practicaland powerful approach to multiple testing. J Roy Stat Soc B 57: 289–300.
24. Kachroo P, Ivanov I, Davidson LA, Chowdhary BP, Lupton JR, et al. (2011)
Classification of diet-modulated gene signatures at the colon cancer initiationand progression stages. Dig Dis Sci 56: 2595–2604.
25. Chapkin RS, Zhao C, Ivanov I, Davidson LA, Goldsby JS, et al. (2010)Noninvasive stool-based detection of infant gastrointestinal development using
Fecal Dysbiosis in Canine GI Disease
PLOS ONE | www.plosone.org 12 December 2012 | Volume 7 | Issue 12 | e51907

gene expression profiles from exfoliated epithelial cells. Am J Physiol Gastro-
intest Liver Physiol 298: G582–589.26. Sima C, Braga-Neto UM, Dougherty ER (2011) High-dimensional bolstered
error estimation. Bioinformatics 27: 3056–3064.
27. Unterer S, Strohmeyer K, Kruse BD, Sauter-Louis C, Hartmann K (2011)Treatment of aseptic dogs with hemorrhagic gastroenteritis with amoxicillin/
clavulanic acid: a prospective blinded study. J Vet Intern Med 25: 973–979.28. Weese JS (2011) Bacterial enteritis in dogs and cats: diagnosis, therapy, and
zoonotic potential. Vet Clin North Am Small Anim Pract 41: 287–309.
29. Pryde SE, Duncan SH, Hold GL, Stewart CS, Flint HJ (2002) The microbiologyof butyrate formation in the human colon. FEMS Microbiol Lett 217: 133–139.
30. Fukuda S, Toh H, Taylor TD, Ohno H, Hattori M (2012) Acetate-producingbifidobacteria protect the host from enteropathogenic infection via carbohydrate
transporters. Gut Microbes 3: 449–454.31. Bansal T, Alaniz RC, Wood TK, Jayaraman A (2010) The bacterial signal
indole increases epithelial-cell tight-junction resistance and attenuates indicators
of inflammation. Proc Natl Acad Sci U S A 107: 228–233.32. Packey CD, Sartor RB (2009) Commensal bacteria, traditional and opportu-
nistic pathogens, dysbiosis and bacterial killing in inflammatory bowel diseases.Curr Opin Infect Dis 22: 292–301.
33. Sokol H, Seksik P, Furet JP, Firmesse O, Nion-Larmurier I, et al. (2009) Low
counts of Faecalibacterium prausnitzii in colitis microbiota. Inflamm Bowel Dis 15:1183–1189.
34. Sokol H, Pigneur B, Watterlot L, Lakhdari O, Bermudez-Humaran LG, et al.(2008) Faecalibacterium prausnitzii is an anti-inflammatory commensal bacterium
identified by gut microbiota analysis of Crohn disease patients. Proc Natl AcadSci U S A 105: 16731–16736.
35. Suchodolski JS, Camacho J, Steiner JM (2008) Analysis of bacterial diversity in
the canine duodenum, jejunum, ileum, and colon by comparative 16S rRNA
gene analysis. FEMS Microbiol Ecol 66: 567–578.
36. Wu GD, Chen J, Hoffmann C, Bittinger K, Chen YY, et al. (2011) Linking long-
term dietary patterns with gut microbial enterotypes. Science 334: 105–108.
37. Arumugam M, Raes J, Pelletier E, Le Paslier D, Yamada T, et al. (2011)
Enterotypes of the human gut microbiome. Nature 473: 174–180.
38. Muhling M, Woolven-Allen J, Murrell JC, Joint I (2008) Improved group-
specific PCR primers for denaturing gradient gel electrophoresis analysis of the
genetic diversity of complex microbial communities. ISME J 2: 379–392.
39. Malinen E, Rinttila T, Kajander K, Matto J, Kassinen A, et al. (2005) Analysis
of the fecal microbiota of irritable bowel syndrome patients and healthy controls
with real-time PCR. Am J Gastroenterol 100: 373–382.
40. Wise MG, Siragusa GR (2005) Quantitative detection of Clostridium perfringens in
the broiler fowl gastrointestinal tract by real-time PCR. Appl Environ Microbiol
71: 3911–3916.
41. Gurjar AA, Hegde NV, Love BC, Jayarao BM (2008) Real-time multiplex PCR
assay for rapid detection and toxintyping of Clostridium perfringens toxin producing
strains in feces of dairy cattle. Mol Cell Probes 22: 90–95.
42. Houser BA, Hattel AL, Jayarao BM (2010) Real-time multiplex polymerase
chain reaction assay for rapid detection of Clostridium difficile toxin-encoding
strains. Foodborne Pathog Dis 7: 719–726.
43. Lubbs DC, Vester BM, Fastinger ND, Swanson KS (2009) Dietary protein
concentration affects intestinal microbiota of adult cats: a study using DGGE
and qPCR to evaluate differences in microbial populations in the feline
gastrointestinal tract. J Anim Physiol Anim Nutr (Berl) 93: 113–121.
Fecal Dysbiosis in Canine GI Disease
PLOS ONE | www.plosone.org 13 December 2012 | Volume 7 | Issue 12 | e51907
Recommended


