THE IMPACT OF WORKING CAPITAL MANAGEMENT ON
PROFITABILITY OF THE BREWERY COMPANIES LISTED IN
DSE TANZANIA.
By
Anatory Fradius Rugambwa
A dissertation submitted in partial fulfillment of the requirement for Award of the
Degree of Master of Science in Accounting and Finance (MSc. Accounting and
Finance) of Mzumbe University.
2016
i
CERTIFICATION
We, the undersigned, certify that we have read and hereby recommend for acceptance by
the Mzumbe University, a dissertation/ thesis entitled The Impact of Working Capital
on Profitability of brewery Companies Listed on Dar es Salaam Stock of Exchange:
The case of Tanzania Breweries Limited (TBL) and East Africa Breweries Limited
(EABL), in partial/ fulfillment of the requirements for award of the degree of Master of
Science in Accounting and Finance of Mzumbe University.
Major supervisor
Internal Examiner
Accepted for the board of ………………..
DEAN, SCHOOL OF BUSINESS

ii
DECLARATION
AND
COPYRIGHTS
I, Anatory Fradius Rugambwa, declare that this thesis is my own original work and that
it has not been presented and will not be presented to any other university for a similar
or any other degree award.
Signature ……………………………………………..
Date …………………………………………………...
©
This dissertation is a copy material protected, under the Berne Convention, the
Copyright Act 1999 and other international and national enactments, in that behalf, on
intellectual property. It may not be reproduced by any means in full or part, except for
short extracts in fair dealings, for research or private study, critical scholarly review or
discourse with an acknowledgement, without the written permission of Mzumbe
University, on behalf of the author.

iii
ACKNOWLEDGEMENT
This study is a result of hard work which have been supported and accompanied by
many people whom devoted their time and energy to facilitate the accomplishment of
this work, which makes me happy to express my gratitude. In a special way I would like
to express my sincere thanks to almighty God for protecting and giving me good health,
wisdom, time and knowledge in order to complete this research, I would like also to
express my sincere appreciation to my supervisor Prof. Srinivas Madishetti of School of
Business (SOB), Mzumbe University for his valuable guidance, assistance and
inspiration throughout the study.
Lastly my heartfelt thanks go to my family; my father Fradius Anatory Kyaruzi, my
mother Dorosela Kalisa, my sisters Salome and Dina and my beloved young brother
Dickson . I love you all!

iv
DEDICATION
I would like to dedicate this research report to my father Mr. Fradius Anatory Kyaruzi,
my mother Ms. Dorosella kalisa and entire family for being supportive during my
studies.
v
LIST OF ABBREVIATIONS AND ACRONYMS
ACP - Average Collections Period
AP - Average Payables
APP - Average Payables Period
AR - Average Receivables
CCC - Cash Conversion Cycle
CR - Current Ratio
DER - Debt to Equity Ratio
DSE - Dar es Salaam Stock of Exchange
EABL - East Africa Breweries Limited
GOP - Gross Operating Profit
ICP - Inventory Conversion Period
SPSS - Statistical Package for Social Scientist
TA - Total Asset
TBL - Tanzania Breweries Limited.
TD - Total Debt
TE - Total Equity
vi
ABSTRACT
The main objective of this study was to investigate if there is relationship between
working capital management and profitability of brewery companies listed on Dar es
Salaam Stock of Exchange. Divergent views have been brought up by number of
researchers particularly authors outside Africa who wrote on impact of working capital
to the profitability of the company created a knowledge gap to investigate to what extent
working capital affects the profitability of the listed brewery companies at DSE, due to
number of factors like difference in laws, culture, and regulations between these country.
In dealing with the objective of the study, the ratios of working capital management such
as Average Collection period (ACP), Inventory conversion period in days (ICP),
Average Payables Period (APP), and Cash Conversion Cycle (CCC) were used as
independent variables, while gross operating profit was used as dependent variable and
control variable were current ratio (CR) and debt to equity ratio (DER).This study
covered all listed brewery companies at DSE covering a period of 10 years from 2005 to
2014. Regression analysis was kept in use when dealing with the objective of the study
in order to determine the relationship between working capital management and
profitability of the brewery companies listed in DSE. Statistical Package for Social
Scientist (SPSS) was used in the study.
The key findings of the study revealed that for TBL; ICP, APP, and CCC were found to
have impact on profitability of the company except ACP which was against expectation.
This means that all components of working capital of TBL except ACP had good
relation with the profitability of the company. In the case of EABL, it is found that some
of the components of working capital bear unexpected results in relationship with gross
operating profit (GOP) except APP but not significant, meaning that among all
components of working capital only APP had impact on the profitability of the EABL,
which means other components such as ACP, ICP, and CCC facilitates the decrease in
profit of the company
Therefore,it requires separate study to know why the relationship of most of independent
variables is not as expected to enable the management to take appropriate decision.
vii
TABLE OF CONTENTS
CERTIFICATION .............................................................................................................. i
DECLARATION ............................................................................................................... ii
COPYRIGHTS................................................................................................................... ii
ACKNOWLEDGEMENT ............................................................................................... iii
DEDICATION .................................................................................................................. iv
LIST OF ABBREVIATIONS AND ACRONYMS .......................................................... v
ABSTRACT ...................................................................................................................... vi
CHAPTER ONE .............................................................................................................. 1
PROBLEM SETTING ..................................................................................................... 1
1.1 Introduction .................................................................................................................. 1
1.2 Back ground of the study. ............................................................................................ 1
1.2.1 Over view of brewery industry in Tanzania ............ Error! Bookmark not defined.
1.3 Statement of the problems............................................................................................ 7
1.4 Objective of the study .................................................................................................. 9
1.4.1 General objective. ..................................................................................................... 9
1.4.2 Specific objectives .................................................................................................... 9
1.5 Scope of the study. ....................................................................................................... 9
1.6 Limitations of the study. ............................................................................................ 10
1.7 Significance of the study ............................................................................................ 10
1.8. Chapter plan .............................................................................................................. 11
viii
CHAPTER TWO ........................................................................................................... 12
REVIEW OF LITERATURE ....................................................................................... 12
2.1 Introduction. ............................................................................................................... 12
2.2 Theoretical literature review ...................................................................................... 12
2.2.1The conceptual review ............................................................................................. 12
2.3 Empirical literature review......................................................................................... 19
2.1 Table of Summary of empirical review ..................................................................... 24
2.4 Conceptual Frame Work. ........................................................................................... 27
2.5 Research hypotheses .................................................................................................. 28
CHAPTER THREE ....................................................................................................... 29
RESEARCH METHODOLOGY ................................................................................. 29
3.1 Introduction ................................................................ Error! Bookmark not defined.
3.2 Research design.......................................................... Error! Bookmark not defined.
3.3 Study area. .................................................................. Error! Bookmark not defined.
3.4 Study Population. ....................................................... Error! Bookmark not defined.
3.4.1 Sample size and Sampling technique ...................... Error! Bookmark not defined.
3.6 Sources of data ........................................................... Error! Bookmark not defined.
3.7 Data collection method .............................................. Error! Bookmark not defined.
3.8 Research Variables and their measurement. .............. Error! Bookmark not defined.
3.8.1 Dependant variable ................................................. Error! Bookmark not defined.
3.8.1.2 Gross operating profit .......................................... Error! Bookmark not defined.
ix
3.8.2 Independent variable and its measurement ............. Error! Bookmark not defined.
3.8.2.1 Inventory Conversion Period ............................... Error! Bookmark not defined.
3.8.2.2 Average Collection Period. .................................. Error! Bookmark not defined.
3.8.2.3 Accounts payable period ...................................... Error! Bookmark not defined.
3.8.2.4 Cash conversion cycle .......................................... Error! Bookmark not defined.
3.8.3 Control variables and their measurements .............. Error! Bookmark not defined.
3.8.3.1Current ratio .......................................................... Error! Bookmark not defined.
3.8.3.2 Debt to equity ratio. ............................................. Error! Bookmark not defined.
3.9 Data analysis method ................................................. Error! Bookmark not defined.
3.10 Relationship between variables used in the study .................................................... 38
CHAPTER FOUR .......................................................................................................... 39
PRESENTATION OF FINDINGS ............................................................................... 39
4.1 Introduction. ............................................................................................................... 39
4.2 Descriptive analysis. .................................................................................................. 39
4.2.1 Descriptive statistic results for TBL. ...................................................................... 39
4.2.2 Descriptive statistic results of EABL. ..................................................................... 41
4.3 Correlation analysis.................................................................................................... 45
4.3.1 Correlation results of TBL. .................................................................................... 45
4.3.2 Correlation analysis of EABL ................................................................................. 46
4.3.3 Correlation of EABL and TBL (INDUSTRY) ....................................................... 48
4.4 Regression analysis .................................................................................................... 49
4.4.1 Regression results of TBL....................................................................................... 49
4.4.1.1The Impact of ACP on GOP ................................................................................. 49
x
4.4.1.2 The impact of ICP on GOP .................................................................................. 52
4.4.1.3 Impact of APP on GOP. ....................................................................................... 53
4.5.1.4 Impact of CCC on GOP ....................................................................................... 55
4.4.2 Regression results of EABL. ................................................................................... 57
4.4.2.1 The impact of ACP on GOP. ............................................................................... 57
4.4.2.2 The impact of ICP on GOP. ................................................................................. 59
4.4.2.3 The impact of APP on GOP. ................................................................................ 61
4.4.2.4 The impact of CCC on GOP ................................................................................ 63
4.4.2.5 Comparison between coefficients of EABL and TBL with the industry ............. 64
CHAPTER FIVE............................................................................................................ 66
DISCUSSION OF THE FINDINGS ............................................................................. 66
5.1 Introduction ................................................................................................................ 66
5.2 Discussion on correlation results of TBL .................................................................. 66
5.3 Discussion on correlation results of EABL................................................................ 67
5.4 Discussion on results of multiple regressions of the study. ....................................... 69
5.4.1 Discussion on impact of components of working capital results on GOP for TBL.
.......................................................................................................................................... 69
5.4.1.1 The relationship between Average Collection Period and Gross Operating profit.
.......................................................................................................................................... 69
5.4.1.2 The relationship between Inventory Conversion Period and Gross Operating
Profit. ................................................................................................................................ 70
5.4.1.3 The relationship between Average Payables Period and Gross Operating Profit.
.......................................................................................................................................... 70
xi
5.4.1.4 The relationship between Cash Conversion Cycle and Gross Operating Profit. . 70
5.4.2 Discussion on influence of components of working capital on GOP for EABL .... 71
5.4.2.1 The relationship between Average Collection Period and GOP . ........................ 71
5.4.2.2 The relationship between Inventory Conversion Period and GOP. ..................... 71
5.4.2.3 The relationship between Average Payment Period and GOP. ........................... 71
5.4.2.4 The relationship between Cash Conversion Cycle and GOP. .............................. 72
CHAPTER SIX .............................................................................................................. 73
SUMMARY, CONCLUSSION AND RECOMMENDATION .................................. 73
6.1 Introduction. ............................................................................................................... 73
6.2 Summary. ................................................................................................................... 73
6.3 Conclusion. ................................................................................................................ 74
6.4 Recommendation. ...................................................................................................... 75
6.5 Suggestions for other further studies ......................................................................... 75
REFERENCES ............................................................................................................... 77
APPENDICES. ............................................................................................................... 81
xii
LIST OF TABLES
Table 3.1 shown the relationship between variables used in the study............................ 38
Table 4.1 Descriptive Statistics for TBL ........................................................................ 40
Table 4.2 Descriptive Statistics of EABL ................................................................... 42
Table no. 4.3 Descriptive Statistics of the industry ......................................................... 43
Table 4.4 Correlation of TBL. ......................................................................................... 45
Table 4.5 Correlations results of EABL .......................................................................... 46
Table 4.6 Correlations results for the industry ................................................................ 48
Table 4.7 The model summary of impact of ACP on GOP ............................................. 50
Table 4.8: The Coefficients of Regression showing impact of ACP on GOP .............. 50
Table 4.9 The Model Summaryb
results showing impact of ICP on GOP ...................... 52
Table 4.10 the Coefficients of regression showing impact of ICP on GOP .................. 52
Table 4.11 Model Summary result showing impact of APP on GOP ............................. 54
Table 4.12 Coefficient regression showing impact of APP on GOP ............................. 54
Table 4.13 the Model Summary results showing impact of CCC on GOP .................... 56
Table 4.14 the coefficients of regression showing impact of CCC on GOP ................... 56
Table 4.15 Model Summaryb results showing impact of ACP on GOP .......................... 58
Table 4.16 regression Coefficients showing impact of ACP on GOP ........................... 58
Table 4.17 Model Summaryb results showing impact of ICP on GOP ....................... 60
Table 4.18 regression coefficients showing impact of ICP on GOP ............................. 60
Table .4.19 Model Summaryb results showing impact of APP on GOP .......................... 61
Table 4.20 Regression coefficients showing impact of APP on GOP ............................ 62
Table 4.21 Model Summaryb results showing impact of CCC on GOP .......................... 63
Table 4.22 Regression coefficients showing impact of CCC on GOP ............................ 63

xiii
Table 4.23 summary showing regression coefficient of EABL,TBL and the industry. .. 64

xiv
LIST OF FIGURE
Figure 2.1. Conceptual frame work on how variables depend on each other. ................. 27
1
CHAPTER ONE
PROBLEM SETTING
1.1 Introduction
This chapter introduces the context of the research on working capital management and
its effect on the profitability of the company. The chapter is divided into number of
section like background of the study, statement of the problem, scope and significance of
the study, chapter scheme.
1.2 Back ground of the study.
Working capital, is the money needed for day-to-day operations of a firm, is described
as an investment of the firm‟s capital in current assets and the use of current liabilities to
fund part of the investment. Management of these current assets and current liabilities is
important in creating value for shareholders. If a firm can minimize its investment tied
up in current assets without effecting effectiveness, the resulting funds can be invested
in value-creating projects, thereby increasing the firm‟s growth opportunities and
shareholders‟ return. However, management can also confront liquidity problems due to
underinvestment in working capital. As pointed out by Filbeck and Krueger (2005), the
ability of financial managers to effectively manage the components of working capital
such as receivables, inventories, and payables has a significant impact on the success of
the business.
If capital invested in cash, trade receivables, or inventories is not sufficient, the firm may
have difficulty in carrying out its daily business operations. This may result in declining
sales and, in the end, a reduction in profit ability. Smith (1980) emphasized the trade-off
between liquidity and profitability when he argued that working capital management can
play an essential role not only in a firm‟s profitability and risk, but also in its value.
Decisions regarding an increase in profitability are likely to involve increased risk, and
2
risk-reducing decisions are likely to result in a reduction in profitability. An accepted
measure of working capital management is the cash conversion cycle.
In particular,(Hall,2002) argued that all activities of the company related to customers,
suppliers and products are covered under management of working capital .Thus, in order
to keep at low rate risks associated to working capital and advance the generally
performance, the financial managers have to keep an eye properly on every component
of working capital, the components of working capital are, receivables, payables and
inventories. These components of working capital management acts as the vectors of
facilitating profitability within the company as can be explained below,
The essential features or issues of working capital management are directly related with
the management of payables, cash, accounts receivables and inventories. The mix of
these components of working capital in order to acceralate the profitability of the
company must be well organized and managed to get the targeted results of the
management team. In managing inventory the aim in holding a minimum up to standard
point of inventory in relation to the costs associated with inventory like transport,
insurance, storage fee, obsolescence and spoilage ( deloof and jegers, 2003), but when
keeping low level of inventory may result into lost of sales and stock- out, that is why
optimal inventory is crucial to the company‟s profitability, this shows the capability of
the company to take into consideration the fluctuation of customers demand basing on
time and quantity. Delof (2003) argues that with the intention of creating or increasing
the wealth of shareholders and facilitate the profitability of the company the managers of
Belgian firms can reduce the period of converting the raw materials used in production
into cash.
Average collections are important components of current assets, which is to say that the
financial capacity of the firm can highly be affected with any percentage change in
collection magnitude of the firm, in regards when deciding on the credit sales of the
firm, there are major key factors which have to be taken into consideration which are
market competition, customers, competition price, goods or service offered. Meanwhile
when in need to determine the length of period required to convert the collections of the
3
firm into cash following a credit sales the average collection period have to be taken
into consideration. Makonnen (2011) argues, profitability of the company and the
average collection period are negatively related with each other, which in turn mean that
company can influence the profitability of the company by decreasing number of days in
collecting the receivables outstanding.
Similarly, the effective and efficient management of payables have significant impact to
the profitability of the company. The company makes credit purchases when other
sources of finance are not available, average payables period is the length of time taken
by the firm when purchasing raw materials and labour used in production activities of
the company, delaying to pay the payables is one of the tool for working capital
management, in case of nonpayment of payables to suppliers trade credit may damage
the image and reputation of the company. Sometimes it is advised to lengthen the time
duration to pay creditors of the firm but one have to ensure that the business relationship
is not destroyedfor the betterment of the firm. Mathuva (2010) on the research about
working capital titled,” the influence of working capital management components on
corporate profitability reveals, the profitability of the company is positive related to the
average payment period of the given company, meaning that increase in days of
accounts payables leads to the increase in profitability of the company.
Share of working capital in relation to the capital of the in these two brewery has been
changing frequently from one year to another which in turn might have effect to the
profitability of the companies. For example in case of TBL the share of working for the
period of 10 years from 2005 to 2014 has been changing as 21%, 27%, 23%,
30%,15%,14%, 23%,26%, 26%, 21% and 22% respectively in relation to the capital of
the company, these changes in share of working capital had impact to the changes in
components of working capital like payables for the period of 10 years ranged between
2% to 36%, receivables being between 7% to 39% and inventory between 32% to 82%
while for the case of EABL the share of working capital for the period of 10 years from
4
2005 to 2014 was 43%, 45%, 30%,35%, 45%, 21%, 24%, 33%, 38%, and 37%
respectively, these changes facilitated the changes in working capital essential
components such as, for the period of 10 years payables ranged between 9% to 32%,
receivables between 16% to 34%, and inventories share between 34% to 61%.
Working capital is vital part of the business investment which is important for
continuation of the business daily operation, Lazaridis and Tryfonidis (2006) argued that
companies make use of working capital in order to maintain their liquidity, solvency and
profitability. It is very important for the companies to know and recognize the effects of
managing working capital and its significant contribution to the company‟s profit. In
different countries especially developed countries many researchers have been
conducting study on working capital and their effect on profitability of the company
while in developing countries where Tanzania belongs due to their difference in culture,
economy, capital markets , rules and regulations with developed states needs separate
studies to be done on working capital in order to increase evidences of impact of
working capital on profitability of the companies that relate to our culture, economy and
rules and regulations. Thus this gap calls for research to be conducted in context of
Tanzania assessing the impact of working capital management on profitability of the
companies. Therefore this study is done to investigate the impact of working capital on
profitability of brewery companies listed on Dar es Salaam Stock of Exchange
Overview of the brewery companies:
The overview of brewery companies selected for this study is presented here under.
Overview of TBL
Tanzania breweries Ltd (TBL), is the Tanzanian –based company which was
incorporated in 1994 in Tanzania main land and listed in Dar es salaam Stock Exchange
in Sept 9 1998. TBL is the public traded company which has specialized in the
production , distribution and marketing of malt beer and alcoholic beverages in
5
Tanzania. The shares of TBL are traded on the Dar es salaam Stock Exchange with the
ticker symbol TBL, the corporate office of the company are located in Dar es Salaam,
Tanzania. The TBL company owns, produces and distributes brands are safari,
Kilimanjaro Premium Lager, Tusker, Ndovu, Balimi, Castle Milk stout, Eagle, Redds
Premium and Konyagi Ice. The TBL company owns a subsidiary called Tanzania
Distilleries Ltd which is the spirituous liquor company where it possess approximately
60% interest of this company. SABMiller PLC, which the said to be one of the world‟s
leading brewers with brewing interests or major distribution agreements in more than 60
countries spread across six continents is also a majority owner of TBL company.
Description and history.
TBL is the manufacture company which produces, sells and distributes alcoholic
beverages ,clear beer and non- alcoholic beverages within Tanzania. TBL is the
controlling interest in Tanzania Distilleries Ltd, and Dar brew Ltd. Apart from this ,
TBL also owns an interest in an associated company, mountainside Farms Limited. The
company is also involved in production of malt since it possesses a malting plant in
Moshi. In it‟s daily operation in production the company operates in two main segments,
which are clear beer and wines and spirits. The company offers brands like safari lager,
Kilimanjaro Premium Lager, and Konyagi. The company owns number of subsidiaries
including Tanzania Distilleries Limited, Mountainside Limited and Kibo Breweries
Limited. But SABMiller Africa BV is the principal shareholder of the TBL company.
The TBL company most popular clear beer brands includes, safari lager, Kilimanjaro
Premium Lager, castle Lager, Pilsner ice and Tusker Lager. Other prominent brands
associated with the Tbl group are Konyagi, Gin, Amarula cream, kibuku mwamba,
Redds,Premium Cold and konyagi Ice.
6
Overview of EABL
1920-1949
East African Breweries Limited was founded in 1992, as the Kenyan breweries Limited
(KBL) by two white settlers, George and Charles Hurst. The company was owned by the
Dodd family of Kenya
KBL acquired Tanganyika based Tanganyika Breweries in 1935 and 1936 these two
companies were merged leading to the creation of the East African Breweries Limited
(EABL).The group continued expanding locally through the opening of more breweries
such as Mombasa brewery.
1950 - 1999
In 1954, EABL went publicly by being listed to the Nairobi Securities Exchange. This
was among the first listings in the region's oldest stock exchange. As a group, EABL
expanded to Uganda through the acquisition of Uganda Breweries in 1959.
In 1964, the group's subsidiary name was changed from Tanganyika Breweries Limited
to Tanzania Breweries Limited (TBL) following the political unification of Tanganyika
and the People's Republic of Zanzibar and Pemba to form the United Republic of
Tanzania. This led to increased market for the group through the creation of union.
However, in 1979 the Government of Tanzania nationalized TBL as part of the Arusha
Declaration. The group officially opened 1987 Central Glass Industries Limited (CGI),
as a producer of glass containers and bottles there for leading to internal sourcing.
By 1990, the Dodd family had reduced their shareholding and most of the shareholders
were Kenyan and the company was very successful.
7
2000 – 2010
Diego acquired majority control of EABL and the following year the group cross listed
its shares on the Uganda Securities Exchange in year 2000
The partnership between EABL and SAB Miller in Tanzania in 2009 went through
turbulence , EABL claiming breach of contract by Tanzania Breweries (TBL) that led to
low quality of EABL‟s drinks that were produced by TBL and restriction of some of
Diageo‟s and EABL brands to enter the Tanzanian market. This led to EABL‟s
acquisition of 51% of Serengeti Breweries Limited (SBL) and exit from TBL's
shareholder structure through a $71.5 million successful secondary offer on the Dar es
Salaam Stock Exchange in 2011. SAB Miller sold it stake Kenya Breweries to East
African Breweries.
2010- To date .
Starting in year 2003, EABL expanded its operations in by establishing East African
Beverage South Sudan Limited (EABSS) in South Sudan where the company opened a
depot in Juba with the aim of reducing much reliance on the third party distributors
logistical arrangements that led to the periodic stock out (www.eabl.com)
1.3 Statement of the problems
Working capital means investment in the current assets and current liabilities which are
liquidated in the year or less and very crucial for the firms day to day operations and the
profitability of the firm. Firms can maximize their profitability by having an optimal
level working level of working capital. In a straight line profitability of the company and
its liquidity can be affected by the management of working capital either positive or
negative depending on the way how the key components of working capital are
managed. That is why it is encouraged to make proper management of working capital
since when working capital components are efficiently managed marks as the most
essential or primary part of the general strategy to create and increase the shareholders
8
wealth. Generally, companies when aiming at maximizing their value and shareholders
wealth, achieves their target by keeping to an optimal point the level of working capital
of the company, but sometimes the firms at the cost of liquidity increases their profit
which many times tend to keep the firms into serious problems, hence the substitute of
these two objectives of the firm must be taken into consideration. The firm that do not
care about the profit tend not to survive for a longer period of time but also when the
firm do not take into consideration its liquidity position may highly face the insolvency
problem or bankruptcy. Basing on the above reasons working capital management is
found to be fundamental part in enhancing the profitability of the firms thus proper
consideration must be taken into account for the betterment of the company.
In context of the brewery companies, the amount of working capital in total capital of
the company has been changing which results into effect to the profit of the company,
which means the ratio of working capital has been changing time over time together
with its components, in case of TBL for the period of 10 years from 2005 to 2014 the
percentage share of working capital in relation to the total capital of the company was
ranging from 14% to 27% and the profitability of the company ranges from Tsh
108,146,000 to Tsh 502,538,000,000 where within this period of 10 years share of
payables ranges from 1.6% to 36.5%, collections ranging from 6% to 39 %, and
inventory ranges from 31.5% to 82.5% of the total working capital of TBL.
While in case of EABL for the period of 10 years the percentage share of working
capital in relation to the capital of the company is ranging from 21% to 45.7% and the
company profit ranging from 12,890285,000 to 30,193,626,000 where its components
were changing over time for the period of 10 years like payables which range from 9%
to 38%, collections ranging from 16% to 33.8% and inventory ranging from 33% to
63.6%. The disproportionate change in components of working capital and gross profits
require attention.
9
There are few known studies which up to now are done investigating the impact of
working capital management on profit of listed companies on DSE, but there is no
known research that has been conducted on relation of impact of working capital on
profitability of listed brewery companies in Tanzania, thus this leaves a knowledge gap.
All of the above necessitated making an attempt to the topic „the impact of working
capital management on profitability of listed Breweries companies in Tanzania‟.
1.4 Objective of the study
1.4.1 General objective.
The main objective of this study is to examine the relationship between working capital
management and profitability of the Brewery companies listed in Dar es Salaam Stock
of Exchange.
1.4.2 Specific objectives
To determine whether there is a significant relationship between Average
Collection Period (ACP) and profitability for the listed brewery companies.
To establish whether there is a significant relationship between Inventory
Conversion Period(ICP) and the profitability of the listed brewery companies.
To ascertain if there is a significant relationship between Average Payment
Period (APP) and Profitability of the listed brewery companies
To establish whether there is significant relationship between Cash Conversion
Cycle (CCC) and profitability of the listed brewery companies.
1.5 Scope of the study.
The study is limited to the effects of working capital management on the profitability of
breweries companies in Tanzania. The study covers the period of ten(10) years from
2005 to 2014, The study will base on the internal factors of working capital affecting the
profitability of the company thus using components of working capital like payables ,
10
collections, inventory and cash as independent variables , and gross operating profit as
dependent variable, the control variables are current ratio and debt to equity ratio.
1.6 Limitations of the study.
In conducting the study, there were factors that occurred which in one way or another
might be the reason for satisfactory results not to be obtained after an investigation. The
research was conducted basing on listed brewery companies listed on Dar es Salaam
Stock of Exchange (DSE) where there are only 2 companies listed which are Tanzania
Breweries Limited (TBL) and East Africa Breweries Limited (EABL), this makes the
sample size of the study to be too low for the study but also the results obtained doesn‟t
reflect other brewery companies which are not registered in DSE since only the public
companies are studied. The other limitation which was encountered when conducting
investigation is the period to be covered by the research, this resulted due to difference
in time for these 2 companies for the time which they were listed in DSE ,the other is
registered earlier than another with this factor the data for periods to be used must base
on the last company to be listed in DSE.
1.7 Significance of the study
The study will provide the easy way to understand how components of working capital
relate with the profitability of the company. Apart from that, this research will be of
huge importance to different group of people in the in the society and country as whole
depending on how they deal with working capital, the corporate managers, researchers
and students will find this relevant in their daily works. Researchers and students who
are interested in working capital management and the impact of it on performance of the
organization or company will find this work of huge benefit. To managers of companies,
especially breweries companies will be in the good position to know the best way to
optimize balance between liquidity and profitability in the companies which they
manage, from this study the managers will be equipped with desirable working capital
strategy that maximizes shareholders wealth and solution of the challenges that the
entity faces. it will therefore contribute to already done researches in the field area of
11
corporate finance. Also the research will bridge the gap left by previous researchers on
the area of working capital management and its impact on profitability of brewery
companies listed in Dar es Salaam stock of Exchange (DSE).
1.8. Chapter plan
In this study, the presentation is divided into six chapters.
Chapter one, deals with back ground of the study, statement of the problem, objectives,
scope of the study, limitation of the study and significance of the study
Chapter two, deals with theoretical part, empirical part, conceptual frame work and
hypothesis.
Chapter three, deals with research design, study population, types and sources of data,
data collection method, research measurements and their methods sample size and
sampling techniques, types and sources of data and data analysis methods.
Chapter four, deals with presentation of descriptive results, presentation of correlation
results and results of coefficient regression.
Chapter five, deals with discussion on correlation results and discussion on multiple
regression results of the study.
Chapter six, deals with the summary, conclusion, recommendation and suggestions for
the further studies.
12
CHAPTER TWO
REVIEW OF LITERATURE
2.1 Introduction.
This part of research reviews the theoretical and empirical literatures relevant to the
impact of working capital management on profitability to the brewery companies. The
part of theoretical literature review provides clear understanding of the key definitions
and basic concepts which are used in this study. The part of empirical literature review
provides the ideas and knowledge provided by other scholars who published about
working capital. It also provides conceptual frame work
2.2 Theoretical literature review
The theoretical review is presented in terms of conceptual review underlying this study.
2.2.1The conceptual review
In this part, the basic concepts and important definitions which relate to the working
capital, working capital management and performance are provided.
According to (Harris, 2005), working capital is defined as money or cash that a firm
needs in order to undertake various actions and operating activities in daily functions of
the firm such as money to make purchase on raw materials for production, money for
paying workers salaries ,wages, rent or any other daily repeated expenditure of the firm,
It is sometimes obtained demonstrated by taking the difference between current asset of
the company and the current liabilities available within the firm. Current asset and
current liabilities includes three accounts which are very important for the health of the
company, such as inventory, accounts receivables and account payables. Working
capital is common measure of company liquidity and efficiency of the company. In
working capital there are two concepts which are explained such as Net working capital
and gross working capital. Pandey (2007).
13
Net working capital is often used to measure the efficiency of working capital of the
firm, showing the surplus of current assets of the firms over their current liabilities, it
demonstrates the ability of the firms to be in a position meet their short term obligation
when they fall due,( Brealey& Myers, 2002). The net working capital of the organization
can either be positive or negative, where positive net working capital happens at a point
in time when there is surplus of current assets over current liabilities of the firm, this
means that the firm is in good position to meet its short term obligations as when they
fall due.
. Positive working capital ensures the firm to continue with its daily operation which
means that the firm has adequate fund to meet both, due short term debts and the future
operational costs or expenses. Negative net working capital happens at a point where
current liabilities of the firm exceed the available current assets of the firm, which means
that the firm is in the condition where it cannot meet its short term obligation which fall
due. The investment in Working Capital is very fundamental and it helps analysis of
capital budgeting of a firm.In short-term sources of finance working capital can be
invested, such as cash, inventories, account receivables, and notes receivables. WC can
be minimized when terms of payments are made to account payables (creditors), account
notes payable and other accrued liabilities of the entity, for the sake of regulating out the
optimal levels of costs and benefits of working capital, then the components of working
capital which are liquid( easily converted into cash) must be managed with appropriate
techniques through raising or lowering the stocks, cash, account receivables and account
payables (Arnold, 2008; Gitman, 2009).
Net Working Capital (NWC) = Current Assets (CA) – Current Liabilities (CL)
Gross working capital refers to the amount of funds invested in current assets employed
by the business concern. This is going concern concept that enables the financial
planners to provide the proper amount of working capital at the right time, so that the
operations of the business are not interrupted and the return on working capital
14
investment is maximized. However, the amount investment in the current asset of the
business, by itself doesn‟t give a correct indication of the firm‟s financial position. For
the true assessment of a firm‟s financial strength, investment in current assets must be
viewed in relation with current liabilities.
For the efficient working capital management both of these two concepts of working
capital, net working capital and net working capital are equally important.Net working
capital concept indicates liquidity position of the company and it suggests the extent to
which net working capital needs may be financed by permanent sources of fund. While,
gross working capital focuses on how to optimize investment in current assets and how
these current assets may be financed.
Current assets are items held by a company with the objective of converting them in
the near future, the most important items are debtors or accounts receivable
balances(money due from customers), inventory( raw materials stock , WIP and finished
goods) and cash or near cash( such as short term loans and tax reserve certificate).
Current liabilities are short term sources of finance which are liable to fluctuation, such
as trade creditors (accounts payables) from suppliers, bank overdraft and tax payables
Working capital management
Working capital management is the process of managing activities and process related to
working capital. This level of management serves as a check and balances system to
ensure that the amount of cash flowing into a business is enough to sustain the
company‟s operations. (Meredith, 1986) defined working capital as most important and
fundamental part in relation to the management of financial matters of the firm, which is
found to be much concerned with management of all areas regarding to finance not just
only uses and sources of funds in the related firm but also the financial implications of
the major monetary activities performed by the firm such as production, investment,
marketing or personnel‟s decisions and the total performance of the given firm. That is
15
to say working capital is widely considered as lifeblood to feed up the day to day
operation of the firm,the firm makes use of working capital for the betterment of the
business (Seidman, 2004) management of working capital being an unending process
must be evaluated using the current assets and liabilities of the firm. The objective of
managing working capital is to manage firms current liabilities and assets in order the
level of working capital satisfaction is maintained, failure to maintain this, the firm
might be in high position to become ruined (broke) and sometimes may even find itself
into bankruptcy, therefore in order the day to day activities of the company to run
smoothly then working capital management have to be taken into consideration.
Requirements of working capital
Generally, to determining working capital requirements of the firm there is no specific
rules of formula. There is good number of factors that manipulate the working capital
needed for the given firm; each factor has its importance and the importance tend to
change from one firm to another. The factors that influence the working capital
requirements of the firm are nature and size of the firm, seasonal fluctuation, production
policy, taxation, depreciation policy, reserve policy, dividend policy, credit policy,
growth and expansion, price level changes, operating efficiency, profit margin and profit
appropriation.
The desire of working capital tend to differ from one industry to another but also some
times they can differ even among similar companies, which might be due to number of
factors such as difference in company‟s payment and collection policies, timing of
asset purchases, the way how a company writing off some of the accrued accounts
receivables and sometimes the extent the company keeps efforts in undertaking capital
raising process.
. The importances of working capital management are as follows;
16
Working capital management is prevalent metric for the efficiency, liquidity and overall
health of the company. It is a reflection the results of various company activities,
including revenue collection, debt management and payment to suppliers. This is
because it includes inventory, accounts payable and accounts receivables, cash, portions
of debt due within the period of a year and other short term accounts.
Strengthen the solvency, when Working capital is managed helps the business to be
operated smoothly without any financial problem for making payment to the short-term
liabilities that belongs to the firms. Purchasing of raw materials used in production and
payment of salary, wages and overhead can be made early as required without any delay.
Enhance goodwill, sufficient working capital within the organization or a business
concern enables them to make prompt payments to the creditors and hence helps the
business in creating and maintaining its goodwill. Goodwill is enhanced because all
current assets and current liabilities of the business are paid on time as it is required.
Easy to obtain loan, A firm having adequate working capital , high solvency and good
credit rating can arrange loans from banks and financial institution in easy and favorable
terms because these banks are sure of the loan to be paid back due to the solvency
position of the company.
Generally, depending on how working capital is managed with in the firm can have a
major effects on both profitability and liquidity position of the firm (shin
&soenen,1998). For the firm to achieve them all have to make sure there is good and
well balance among these two targets. The operating process of the company can be kept
in danger when any trade off appear with in the firm, mean while when it occurs a
situation where liquidity of the firm is ignored, the firm is found to be in high position to
get a problem of insolvency, because the firm will be limited to access long-term capital
markets. Thus working capital management is found to be very useful to the small
business since these firms mostly tend to depend heavily on owner financing,trade credit
17
and short term bank loans to finance the kind of investment they need, inventory cash
and accounts receivables, (Chittenden et al, saccurator,1994 )
The interaction between working capital management components;
In general working capital deals with the control of inventories, accounts payables and
receivables. Ganesan (2007) argued that an efficient mix of components of working
capital must be be encouraged to ensure the presence of adequate capital with in the
company.
Inventory and firms profitability
The firm have to take into consideration and hold a minimal acceptable point of
inventory in relation to the cost involved in managing it( Toomey, 2000). Indeed,
maintaining a large inventory implies using capital to finance it and to cover different
costs (insurance, storage, obsolescence, spoilage and transport) Deloof and
jegers,(1996). However, keeping a low level of inventory may results to less sales and
stock –out (Deloof, 2003). Thus, inventory flexibility must be observed from integrative
perspective; inadequate inventory planning is the major source of many SMEs failure
since the incapacity to send required goods to customer handicaps the company‟s long
run viability, (Robinson and all. (1986). Managers of the companies can reduce the
number of days to convert raw materials into cash in order to enhance the profitability
of the company and also to create the value of shareholders wealth.
Accounts payables and firms profitability.
Many firms make sometimes tend to make use of trade credit as the substitute to the
bank credit (Petersen and Rajan, 1994).when the firm delays to pay its suppliers, and
creditors, the this action the managers allow the firm to enjoy advantages from a flexible
source of finance and reducing the chance for the firm to receive materials with low
quality from the suppliers, while by making early payments to the suppliers the company
is subject to enjoy discount which can be considered as an implicit cost, thus it is
18
encouraged the company to make use of credit from suppliers when other financing
sources are not available or very cost fully to be obtained, but when delaying to make
payment or nonpayment of credit to supplier may be seen about destroying or damaging
the image of the firm. Due to these disadvantage related to lengthening the payable
period, Deloof (2003) found the negative relationship between profitability and the
number of days of accounts payable. The result is consistent with the more profitable
companies pay bills in short period of time.
Average collections and firms profitability
Accounts receivables being one among of the major component of the current assets,
hence financial viability of the company can be influenced by the magnitude change in
accounts receivables. Decision on trade credit can be influenced by many factors such as
market market competition, price , customers, and goods or services. A flexible trade
credit policy with an interest on receivables may increase sales (long and al., (1993)
Deloof and Jegers (1996). However, such practice can be expensive due to the lock up
money in working capital. Besides, if managers choose to reduce the accounts
receivable, they limit sales through credit to customers which in turn leads into loose of
purchasers and reduce profits. In his study Deloof (2003) presented the relationship
between gross operating income and the time duration a company takes to receive its
payment on accounts receivables to be significant negative to each other.
However, Working capital management being essential to the company‟s financial
health and operational success of the brewery companies and other business have to be
taken into consideration, the most important task of the managers is to find an optimal
working capital in order to increase the profitability of the company since working
capital management is found to have a major impact on both the liquidity and
profitability position of the company (shin & Soenen, 1998). In a number of studies the
cash conversion cycle proves to be a popular measure of working capital management.
Cash conversion cycle is the period of time that cash is fixed up in accounts receivables
19
and inventory. In details, Cash Conversion Cycle (CCC) is concerned with the amount
of time that resources of the firm are fixed up,(Dong and Su, 2010; Gill, Biger, and
Mathur, 2010; Gitman, 2009). Cash is tied up in the firms operation activities when cash
conversion cycle is increased or lengthen, this situation can have two outcomes. It can
have a positive effect on profitability if a longer cash conversion cycle leads to more
sales or, it can have a negative effect on profitability if the cost of the investment in
working capital rises faster than the benefits of having a large inventory or generous
trade credit (Deloof, 2003). Which means there will be relative low chance for other
investments of this cash flow.In this case cash conversion cycle is said to have negative
relationship with company profitability, by handling enough cash conversion cycle and
keeping to optimal other components of working capital the owner-managers can create
a positive value for the business owners (Gitman, 2009; Uyar, 2009). In contrast when
Cash Conversion Cycle shortens, cash becomes free for other usage such as investing o
equipment, infrastructures and selling process, which in turn leads to the higher
operating profit of the company.
2.3 Empirical literature review.
Working capital management has been studied by many researchers in different views
and environments. This study is an attempt to investigate the brewery companies listed
in Dar es Salaam Stock of Exchange (DSE). There have been many studies carried out
on the subject of working capital and profitability and this section is devoted to the
review of existing literatures wrote that relate to this subject. In doing comprehensive
analysis in this research most recent information were used. Mentioned below are just
few studies which are the useful and interesting relating to this study. Prior studies
reported that working capital management may have an important effect on the
organization‟s profitability.
Dong (2010) in his study “the effect of working capital on profitability and liquidity of
listed companies in stock market of Vietnam”. Carrying out the research for the period
ranging from the year 2006 to 2008 Dong selected pooled data to assess the companies
20
listed in Vietnam stock market. Dong in doing his study made focused on the existing
relationship between the variables that are used in his research including cash
conversion cycle, profitability and the related elements. As per findings obtained from
his research Dong found that the relationship between independent and dependent
variables of the study are strongly negative related. This implies that increase in cash
conversion cycle (CCC) results to the decrease in profitability of the company. He also
found that if the number of days of account receivable and inventories are reduced the
profitability of the companies will increase. Dong in his study presented that the profit of
the organization and liquidity are affected by management of working capital of the
organization. He claimed that the value of the shareholders of the organization can be
created by the managers of the organization to reduce the time period of cash conversion
cycle and also claimed that firms which are more profitable tend to wait for longer
period to pay their bills.
Deloof (2003) when conducting his research with the title, Does working capital
management affect the profitability of the Belgian firms? Covering the time period of 5
years starting from 1992 to 1996, where the sample of non- financial Belgian companies
which were 1009 were selected and used in this research, in making analysis for the
results found in this study Deloof employed regression and correlation tests where the
outcomes presented from the research reveals that there is significant negative
relationship between gross profit and average period of receivables, average period of
payable and inventory. He presented that most firms had a high amount of cash invested
in working capital, thus the way in which management is done on working capital have
significant impact on the profitability of these studied firms. Deloof in his conclusion
advised that for the managers of the firms to create value for the shareholders have to
reduce to the acceptable level the time period to convert inventories into finished goods
and time period to collect receivables.
Raheman and Nasr (2007) in their research work, with the title effect of working capital
management on profitability of the firm conducting business in Pakistan. In their study
21
the variables which were kept in use are components of working capital as independent
variable such as inventory turnover, average collection period, average payment period
and cash conversion cycle (CCC) current ratio and the net operating profit as dependent
variable also employed debt ratio,size of the firm and financial assets to total asset as
control variables. The observation as per the study revealed that there is strong negative
relationship between variables of working capital management and the profitability of
the firm. meaning that when the cash conversion cycle is increased results to the
decreasing of the profitability of the firms, thus the positive value of the shareholders of
the firms can be increased by reducing the time period which is used to convert the cash
cycle of the firm at required possible level. Raheman and Nasr also in their findings
found that liquidity of the firm are significant negative related with the profitability of
the firm, size of the firm is positively related with the firms profitability, apart from that
found a significant negative relationship between profitability and the debt used by the
firm.
Shin and soenen (1998), on their study investigating the relationship between cash
conversion cycle and the profitability of the firms where the sample was taken from the
firms listed in the stock exchange of united states for the time period from year 1975 to
year 1994, whereby the findings obtained from the study show that CCC have
significant negative relationship with the profitability of the firms used to undertake the
research.
Abdul and Mohamed (2007) in their research work conducted to investigate on how net
operating profit of Pakistan firms are effected by different variables of working capital
management and current ratio, the sample which was used in the study was of 6 years
period counting from year 1999 to 2004 making use of 94 Pakistan firms listed on
Karachi Stock Exchange. In making analysis from the results obtained Pearson‟s
correlation and regression analysis were used. The results obtained from the study show
that there is a strong negative relationship between components of working capital
22
which are independent variables and profitability of the firm which is dependent
variable, meaning that as the CCC increases, profitability of the firm decreases. In their
study, they also came with the results showing that profitability and liquidity are
significantly negative related, the positive relationship between the profitability of the
firm and the size of the firm and the other results obtained showed that there is
significant negative relationship between profitability and debts of the firms used in
investigation
Teruel and Solano (2007) in their research on impact of working capital management on
profitability of the firm, taking a sample of Spanish organizations which are small to
medium size making into consideration time period of 7 years starting year 1996 to year
2002. From the findings it was found that the value of the organization can be increased
by reducing time period which is number of days to convert inventory into finished
goods and the debtors collection period which in turn leads to reduction of cash
conversion cycle, but other researchers suggest that conservative policy which
encourages more investment in cash cycle may increase the profitability of the firm
believing that maintaining high levels of inventory will result into increase in sales ,
cutting down any possible kind of cost occurring in production process and protect
fluctuations of costs (Blinder and maccini, 1991)
Rehman and anjum (2003) in their study, the impact of working capital management on
profitability, conducted empirical study from cement sector in Pakistan where 10 listed
cement companies in Karachi Stock Exchange were taken as sample. Secondary data
were used, where data are collected from the financial statements for the period from
2003 -2008.To analyze the relationship between dependant and independent variables,
correlation and regression analysis were employed. The results obtained from an
investigation indicated a positive relationship between components of working capital
management and profitability in these cement companies found in Pakistan
23
Ghosh and Maji, (2004) with the aim of measuring the efficiency of managing working
capital Gosh and Maji conducted a research to examine the efficiency of working capital
management of the cement companies in India for the period of 1992-93 to 2001-02.
Whereby the indices were computed in order to measure the efficiency of working
capital management, utilization, performance instead of using the common ratios of
working capital. As per results obtained from the study undertaken shows that the
cement industry in India as whole did not perform well during this period
Soekhoe (2012) conducted a research to assess the relationship that exist between
management of working capital and profitability of the corporate, whereby in
undertaking the study he selected sample of firms listed in the Dutch stock exchange
which were 70 in number covering a period of 5 years from 2006 to 2010, in making
interpretation and analysis of the results obtained, correlation and regression were kept
in use to determine the relationship between independent and dependent. The results
obtained shows that there is significant negative relationship between the profit of the
Dutch firms listed in the stock market with ACP and APP.
Arshad and Gondal (2013) in their study on impact of working capital management on
profitability. The study was conducted covering a period of seven years from 2004 to
2010 using a sample of 21 cement companies listed in Karachi stock exchange, where
independent variables used are current ratio, total asset ratio, net current ratio, inventory
turnover ratio and working capital turn over and profitability as dependent variable, to
confirm research hypothesis quantitative research method was employed. Simple linear
regression analysis was used to explore the relationship among variables and found there
is significant relationship between working capital management on firm‟s profitability
24
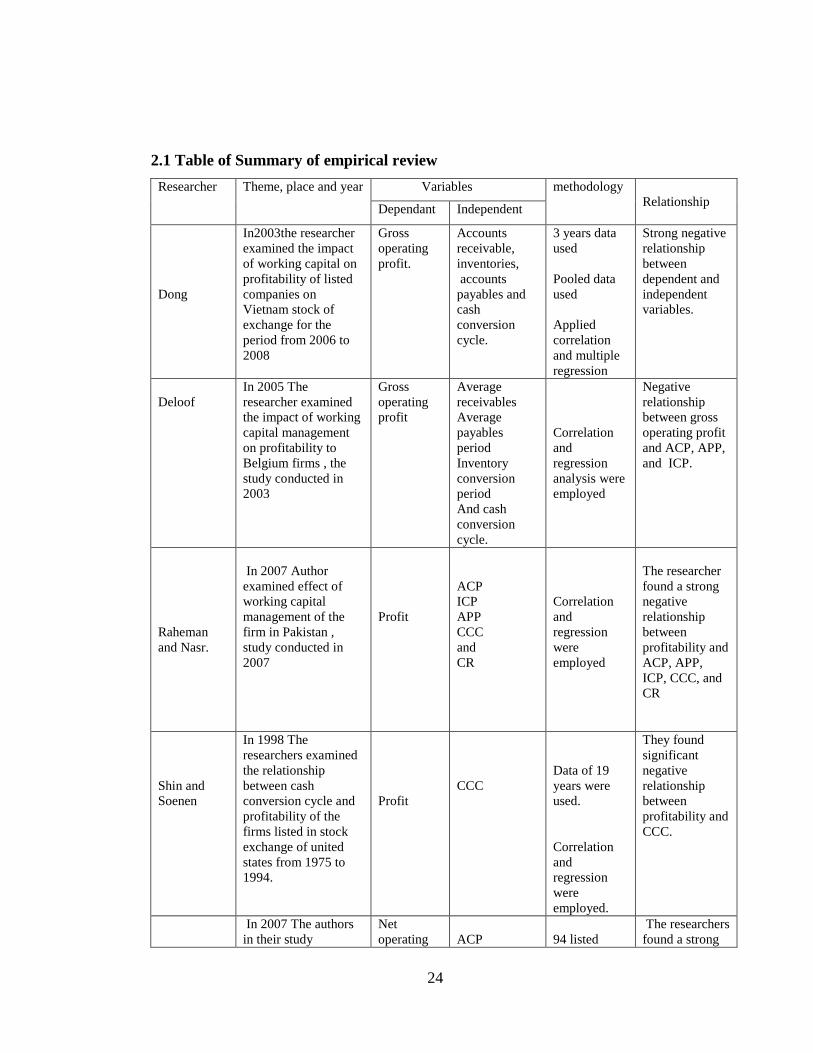
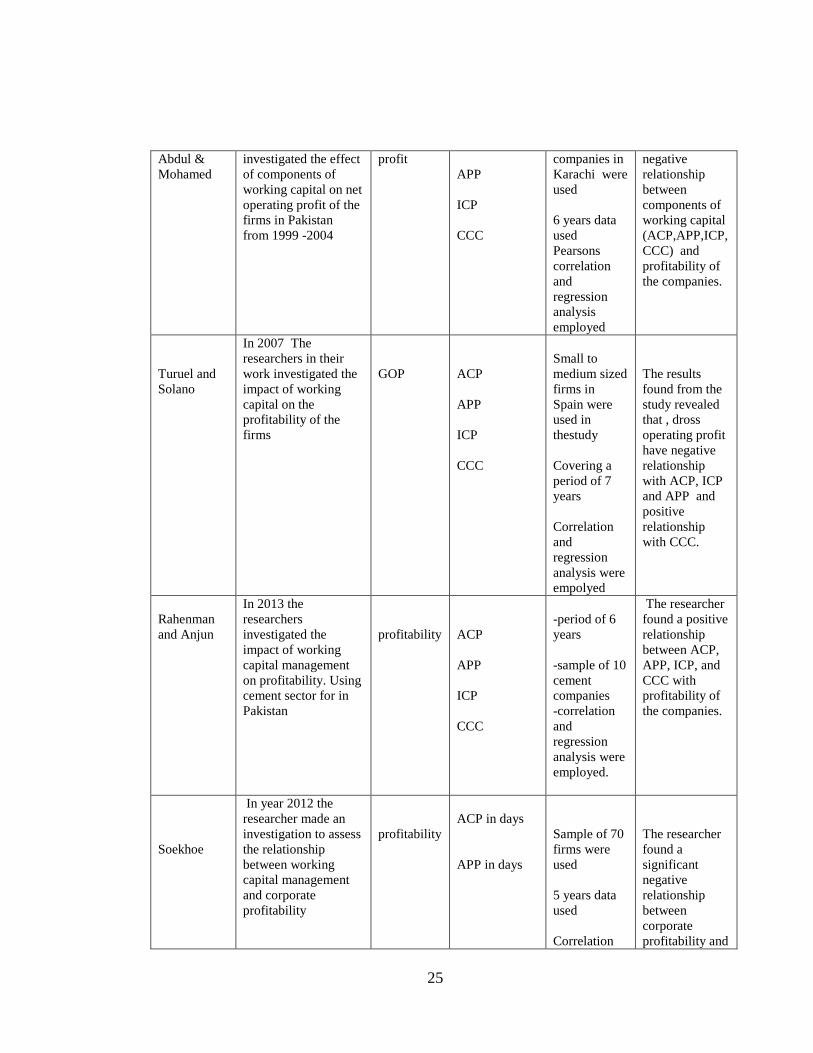
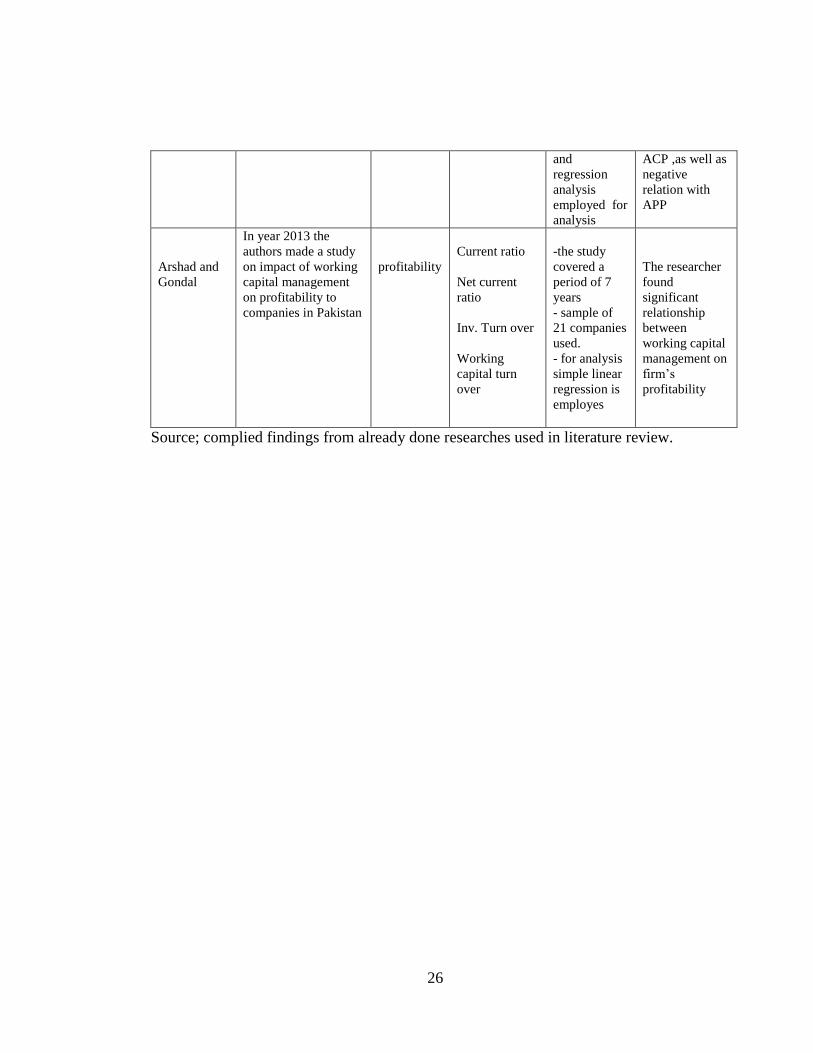
2.1 Table of Summary of empirical review
Researcher
Theme, place and year Variables methodology
Relationship Dependant Independent
Dong
In2003the researcher
examined the impact
of working capital on
profitability of listed
companies on
Vietnam stock of
exchange for the
period from 2006 to
2008
Gross
operating
profit.
Accounts
receivable,
inventories,
accounts
payables and
cash
conversion
cycle.
3 years data
used
Pooled data
used
Applied
correlation
and multiple
regression
Strong negative
relationship
between
dependent and
independent
variables.
Deloof
In 2005 The
researcher examined
the impact of working
capital management
on profitability to
Belgium firms , the
study conducted in
2003
Gross
operating
profit
Average
receivables
Average
payables
period
Inventory
conversion
period
And cash
conversion
cycle.
Correlation
and
regression
analysis were
employed
Negative
relationship
between gross
operating profit
and ACP, APP,
and ICP.
Raheman
and Nasr.
In 2007 Author
examined effect of
working capital
management of the
firm in Pakistan ,
study conducted in
2007
Profit
ACP
ICP
APP
CCC
and
CR
Correlation
and
regression
were
employed
The researcher
found a strong
negative
relationship
between
profitability and
ACP, APP,
ICP, CCC, and
CR
Shin and
Soenen
In 1998 The
researchers examined
the relationship
between cash
conversion cycle and
profitability of the
firms listed in stock
exchange of united
states from 1975 to
1994.
Profit
CCC
Data of 19
years were
used.
Correlation
and
regression
were
employed.
They found
significant
negative
relationship
between
profitability and
CCC.
In 2007 The authors
in their study
Net
operating
ACP
94 listed
The researchers
found a strong
25
Abdul &
Mohamed
investigated the effect
of components of
working capital on net
operating profit of the
firms in Pakistan
from 1999 -2004
profit
APP
ICP
CCC
companies in
Karachi were
used
6 years data
used
Pearsons
correlation
and
regression
analysis
employed
negative
relationship
between
components of
working capital
(ACP,APP,ICP,
CCC) and
profitability of
the companies.
Turuel and
Solano
In 2007 The
researchers in their
work investigated the
impact of working
capital on the
profitability of the
firms
GOP
ACP
APP
ICP
CCC
Small to
medium sized
firms in
Spain were
used in
thestudy
Covering a
period of 7
years
Correlation
and
regression
analysis were
empolyed
The results
found from the
study revealed
that , dross
operating profit
have negative
relationship
with ACP, ICP
and APP and
positive
relationship
with CCC.
Rahenman
and Anjun
In 2013 the
researchers
investigated the
impact of working
capital management
on profitability. Using
cement sector for in
Pakistan
profitability
ACP
APP
ICP
CCC
-period of 6
years
-sample of 10
cement
companies
-correlation
and
regression
analysis were
employed.
The researcher
found a positive
relationship
between ACP,
APP, ICP, and
CCC with
profitability of
the companies.
Soekhoe
In year 2012 the
researcher made an
investigation to assess
the relationship
between working
capital management
and corporate
profitability
profitability
ACP in days
APP in days
Sample of 70
firms were
used
5 years data
used
Correlation
The researcher
found a
significant
negative
relationship
between
corporate
profitability and
26
and
regression
analysis
employed for
analysis
ACP ,as well as
negative
relation with
APP
Arshad and
Gondal
In year 2013 the
authors made a study
on impact of working
capital management
on profitability to
companies in Pakistan
profitability
Current ratio
Net current
ratio
Inv. Turn over
Working
capital turn
over
-the study
covered a
period of 7
years
- sample of
21 companies
used.
- for analysis
simple linear
regression is
employes
The researcher
found
significant
relationship
between
working capital
management on
firm‟s
profitability
Source; complied findings from already done researches used in literature review.
27
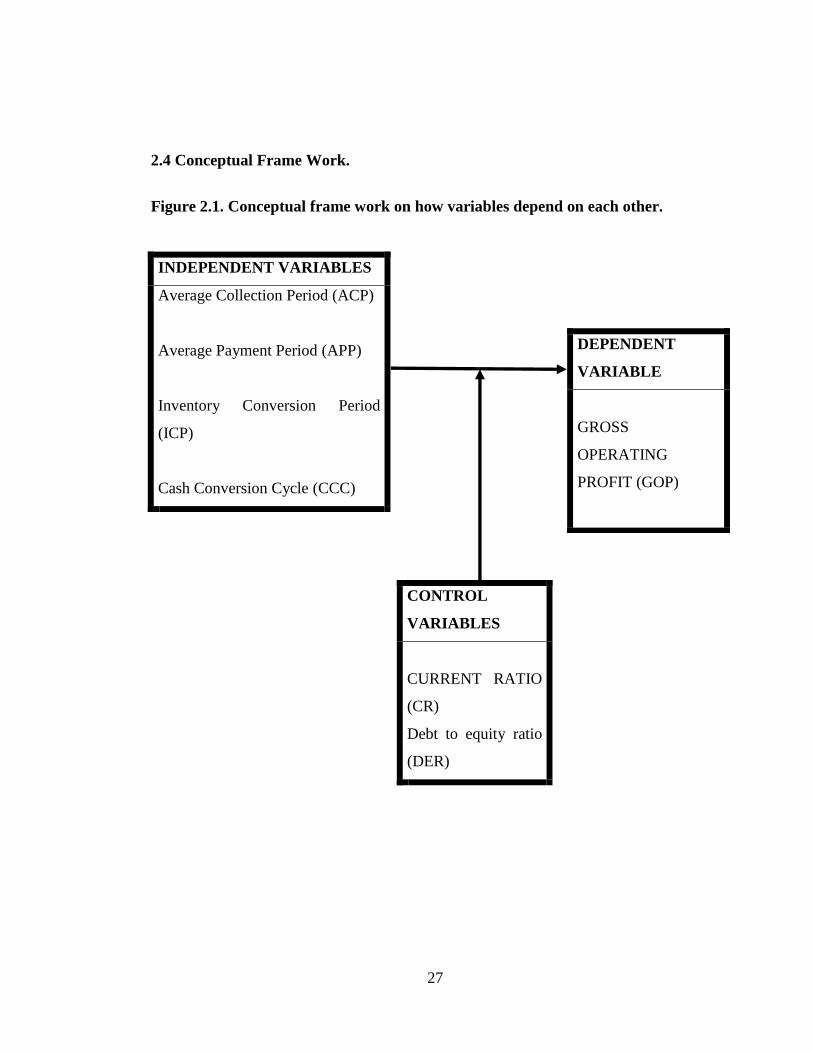
2.4 Conceptual Frame Work.
Figure 2.1. Conceptual frame work on how variables depend on each other.
INDEPENDENT VARIABLES
1. Average Collection Period (ACP)
2.
3. Average Payment Period (APP)
4.
5. Inventory Conversion Period
(ICP)
6.
7. Cash Conversion Cycle (CCC)
DEPENDENT
VARIABLE
GROSS
OPERATING
PROFIT (GOP)
CONTROL
VARIABLES
CURRENT RATIO
(CR)
Debt to equity ratio
(DER)
28
2.5 Research hypotheses
The objective of the study being to examine the impact of working capital management
on profitability of the listed brewery companies in DSE, thus the study presents set of
hypothesis to be tested which are Null Hypothesis Ho and the alternative one H1
Hypothesis one.
Ho: there is no significant relationship between average collection period and
profitability of the company
H1: there is significance relationship between average collection period and profitability
of the company.
Hypothesis two
Ho: there is no significant relationship between inventory conversion period and
profitability of the company
H1: there is significant relationship between inventory conversion period and
profitability of the company.
Hypothesis three
Ho: there is no significant relationship between average payables period and profitability
of the company
H1:there is significant relationship between average payables period and profitability of
the company.
Hypothesis four.
Ho: there is no significant relationship between cash conversion cycle and profitability
of the company.
H1: there is significant relationship between cash conversion cycle and profitability of
the company.
29
CHAPTER THREE
RESEARCH METHODOLOGY
3.1 Introduction
Research Methodology is a systematic and scientific processes and procedures necessary
to conduct research (Mlowe and Diyamett, 2012). This chapter puts down all systematic
planning, action and methods which are used for accomplishing this research work. The
research methodology provides a description of research area, technique, variables and
their instruments, sources of data, data collection methods, and instruments to be used,
type of data that will be collected, and methods of data analysis as applied in this
research.
This chapter deals with research design, study population, sample size and sampling
techniques, types and sources of data, data collection method, research variables, data
analysis method.
3.2 Research design
Research design is the blueprint through which the researcher use and plan in order to
get the answers of the research questions in respect of the study. Burns and Grove
(2001) defined research design as a study that helps a researcher to direct the research in
a manner that help the smooth attainment of the expected required results
In this study the researcher will use quantitative approach. Quantitative research
questions are designed to find out the degree of association amongst the variables that
the researchers intend to find out, these variables are working capital components
(Average Payment Period (APP), Average Receivables Period (ARP), Inventory
Conversion Period (ICP) and Cash Conversion Cycle (CCC) as independent variables
and gross profit as dependent variable and these are utilized mainly to interpret the
results.
30
3.3 Study area.
The research is conducted to the Dar es salaam Stock of Exchange (DSE) selecting the
listed brewery companies starting year 2005 to 2014
3.4 Study Population.
Population is the total collection of elements of which a researcher wish to make some
inferences. In this study, the population used is of all listed brewery companies in Dar es
Salaam Stock of Exchange (DSE), these companies are Tanzania Breweries Limited
(TBL) and East Africa Breweries limited.
3.4.1 Sample size and Sampling technique
Sample size refers to the number of items to be selected from the universe to constitute a
sample, it consist of some elements in a population a researcher wish to make conclusion
about the entire population, the sample size should not be extremely large or too small
rather, it is should be optimal. From these few items selected as sample conclusion of the
study will be drawn.
All the listed brewery companies are taken for this and they include two companies.
3.5 Types of data
Types of data used in this study are Secondary data, these data are found in annual
financial statements of these two brewery companies employed in the study. The audited
financial statements being reliable in nature that‟s why are chose
3.6 Sources of data
The financial data will be taken from the annual reports of the Brewery Companies
listed at the Dar es Salaam Stock Exchange (DSE). As the audited financial statements
are reliable in nature, they have been chosen in this research. Now, why publicly traded
companies are chosen instead of the non listed companies? Publicly traded companies
31
have a statutory requirement to have their financial statements audited by an
independent auditor in an accounting year.
3.7 Data collection method
The audited financial statements for the period of 10 years covered by the study were
found from both Dar es Salaam (DSE) website and the website of the selected two
brewery companies used in the study.
3.8 Research Variables and their measurement.
Variable means an aspect of the theory which differs or altered as being part of the
interaction within the theory. In such a way, they are as well defined as anything that can
influence the change of the results of the study. Each research undertaken must be
carried with the inclusion of these variables as they help to understand the difference. In
order to be a variable, a variable must vary (e.g. not be a constant), that is, it must take
on different values, levels, intensities, or states. Example, Gender (male & Female), self
esteem (low, high), managerial style (authoritative, demographic), Education (primary,
secondary, college). Variables are distinguished in two categories including the
dependent and the independent variables as can be explained below;
3.8.1 Dependant variable
Dependant variables are defined as factors whose variations are thought to be influenced
by the movements in the independent variables. They are the outcome due to the
occurrence of other factors, in this study to measure the company profitability gross
profit is used as dependent variable.
3.8.1.2 Gross operating profit
Equals to total revenue minus cost of goods sold. Generally, profit refers to the gain or
benefit from the business activity. Gross operating profit is calculated by taking the sales
revenue obtained from the business activities minus the cost of goods sold (Ildiko and
Tamas, 2009) gross operating profit = sales revenue- cost of goods sold
32
3.8.2 Independent variable and its measurement
Independent variable is a stimulus, input, or predictor variable that influences the
outcome. In this study the components of working capital such as average collection
period (ACP), inventory conversion period( ICP) , average payment period( APP), and
cash conversion Cycle (CCC) are used as the independent variable as result Cash
Conversion Cycle is measured the source of three parts, number of days receivable,
inventory Conversion Period and number of days payable.
3.8.2.1 Inventory Conversion Period
Inventory Conversion Period is being defined as the time duration involved from
ordering the raw materials, production of the product and finally selling of the product
(Hillier et al, 2010). Inventory period accounts for the time that stocks are stored by the
company before they are sold out. Inclusively, period of day‟s time inventory goes
through over the production process and selling process. Time involved in the
production process shall depend basically on the product nature, smooth automation and
the technology involved in the manufacturing of such product.
The company obtains advantages when it reduces the inventories such as reducing
obsolete inventory, lowering depreciation, decreasing warehouse space, etc. in
calculations inventory period is computed by dividing inventories by the average daily
cost of goods sold of the company. The rationale of this formula is that when raw
materials are bought ,they are correspondently booked into the account of costs for
inventories, and when the products to be produced are finished and sold , the cost for
selling these goods are transferred into the account of cost of goods sold. (Melicher
&Leach, 2009). The formula for inventory period is as follows;
Inventory Conversion Period = average inventory/ cost of goods sold* 365
33
3.8.2.2 Average Collection Period.
This variable is defined as the number of the days which is needed to collect cash
receipts, that, the average period for which collections are outstanding. (Hillier et al,
2010) defined Average collection Period as time duration involved in the collection of
cash. Accordingly, early cash receiving will largely reduce the time lag between the
inflow of sales and outflow of the product‟s raw materials and cost for labor already
incurred. Practically there arise obstacles for the entities in accomplishing all sales in
cash basis because of a number of reasons like, its trade policy or pressure from
competitors. Reducing average collection have impact to the company‟s earnings since
bad debts are reduced through accelerated collections.
Average collection period= Average collection *365
Net sales
3.8.2.3 Accounts payable period
This variable refers to the time period of days a company takes to pay off the accounts
payable. In measuring average payment period of the company, the average of beginning
and ending accounts payables are taken into consideration (Deloof, 2003).it can also be
defined as the time period that a firm making late payments to the suppliers on the
purchase of raw materials for production purpose, it involves the range of time between
a time when raw materials are purchased and when the real cash payment made to those
who supplied raw materials to the firm, sometimes when a firm delay to make payment
to the suppliers is seen and considered as one of the internal financing which in turn tend
to help the firm to save expenses which might be incurred when the external financing
such as bank loan are used. The accounts payables period can be formulated as follows;
Accounts Payable Periods = Average trade payables* 365
Cost of goods sold
34
3.8.2.4 Cash conversion cycle
Cash Conversion Cycle (CCC) refers to time in days taken by the company or firm to
pay its payables and to receive receivables. CCC shows the duration or period of time a
company can take for cash movements, this cycle of cash is initiated by cash outflow
made by a company through payments to the suppliers of the raw materials used by the
company in production process and the cycle ends the inflow of money to the company
through making sales of products such as goods and services to the customers. Shortly it
can be said that, the cycle the time period taken by the company to convert all operating
activities of the company that requires cash into cash return. Shortening of CCC
accelerates the availability of cash with in the company thus presence of cash surplus
with in the firm which can be invested in infrastructures and equipments related to the
day to day operation of the company, while at a time when cash conversion cycle is
lengthen, more cash will be found tied up in the firms day to day operation thus leaving
a little chance for the firm to make other investments from this cash flow
Cash Conversion Cycle = Operating Cycle – Accounts Payable Period
Or
Cash Conversion Cycle = (inventory period + Accounts Receivable Period) – Accounts
Payable period
3.8.3 Control variables and their measurements
For the analysis to be reliable on the impact of working capital management on
profitability to the listed brewery companies in DSE.In order to account for factors that
may influence profitability of the firm, it is inevitable to make use of control variables.
(Deelof, 2003; Eljelly, 2004; Padachi, 2006;). Generally, in this study the above working
capital variables and some control variables below as whole were taken into
consideration.
35
Short term liquidity
Profitability of the firm is affected by its liquidity, in order to keep the effect liquidity
neutral the researcher will be using current ratio as a control variable
3.8.3.1Current ratio is a financial ratio which shows amount or quantity of current
asset over current liabilities of the company. Shortly it can be said the proportion or ratio
of current asset to current liabilities, this ratio is mostly used in financial analysis and
interpretation as the indicator of liquidity position of the company. When at a time in the
company it happens that the amount of current asset is higher than the amount of current
liabilities available with in the firm shows that the company is in good position to meet
it s obligations as they fall due because the resources are more than the liabilities to be
paid out. Current ratio is both liquidity and working capital ratio, current assets are those
assets which can be realized with in 12 months and current liabilities are liabilities
which with in the 12 months have to be settled, in financial analysis and interpretation
the higher the ratio of current ratio the favorable is the situation, which means when
having a current ratio of 2 shows the firm has sufficient or adequate current assets to
cover for twice the required amount of short term liabilities of the company.
Current Ratio =
Current Assets
Current Liabilities
3.8.3.2 Debt to equity ratio.
For the sake of keeping constant the effect debt utilization , debt to equity ratio is used
as a control variable, mathematically it is obtained by dividing total debt to equity ratio.
When the debt to equity ratio is found to be high, it stipulates that the company may not
be in a good position to make more cash to meet its debts obligations as they fall due.
While in turn low debt to equity ratio point out that the firm is not in a good position to
36
take an advantage of the increased profit brought up by financial leverage. Most of the
capital industries always are used to have higher debt to equity ratios because these
capital intensive industries tend to make purchase of more plants, property and
equipments for operation than low capital industries
Debt to Equity ratio =total debts / total equity
3.9 Data analysis method
The data to be used in this study are collected and analyzed quantitatively by using
computer software which is statistical package for social sciences (SPSS) V.16.0. M to
get the desired results from the study. With the aim of examining the relationship that
exist between dependent and independent variables of the listed brewery companies in
DSE, the researcher made use of correlation and regression analysis in the study to
present and interpret the results obtained.Overall the model used for the regression
analysis is expressed as follows;
GOPln =β0 + β1(ACP it) + 2β(ICP it) + 3β(APP it) + 4β (CCC it) + 5β (CR it) + 6β
(DER it) + e
Where,
GOPLn : log of Gross operating profit
ACP: Average Collection Period
ICP: Inventory Conversion Period
APP: Average Payables Period
CCC: Cash Conversion Cycle
CR: Current Ratio
DER: Debt Equity Ratio
e: The error term
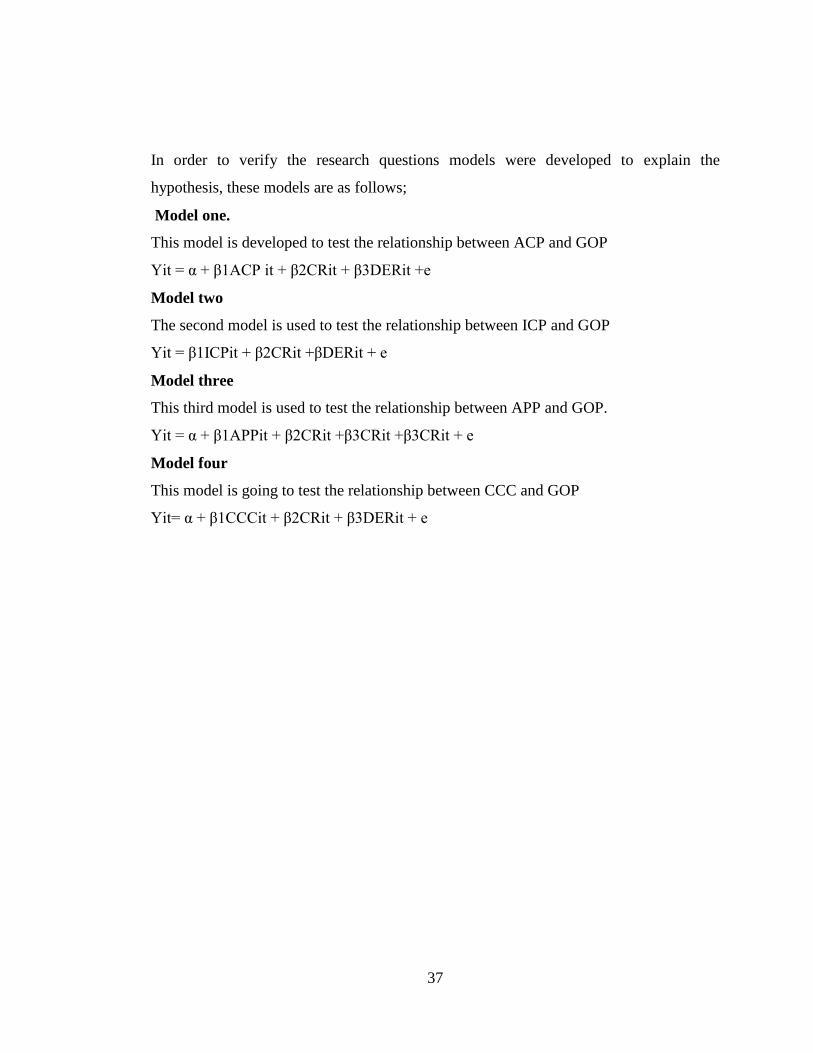
37
In order to verify the research questions models were developed to explain the
hypothesis, these models are as follows;
Model one.
This model is developed to test the relationship between ACP and GOP
Yit = α + β1ACP it + β2CRit + β3DERit +e
Model two
The second model is used to test the relationship between ICP and GOP
Yit = β1ICPit + β2CRit +βDERit + e
Model three
This third model is used to test the relationship between APP and GOP.
Yit = α + β1APPit + β2CRit +β3CRit +β3CRit + e
Model four
This model is going to test the relationship between CCC and GOP
Yit= α + β1CCCit + β2CRit + β3DERit + e
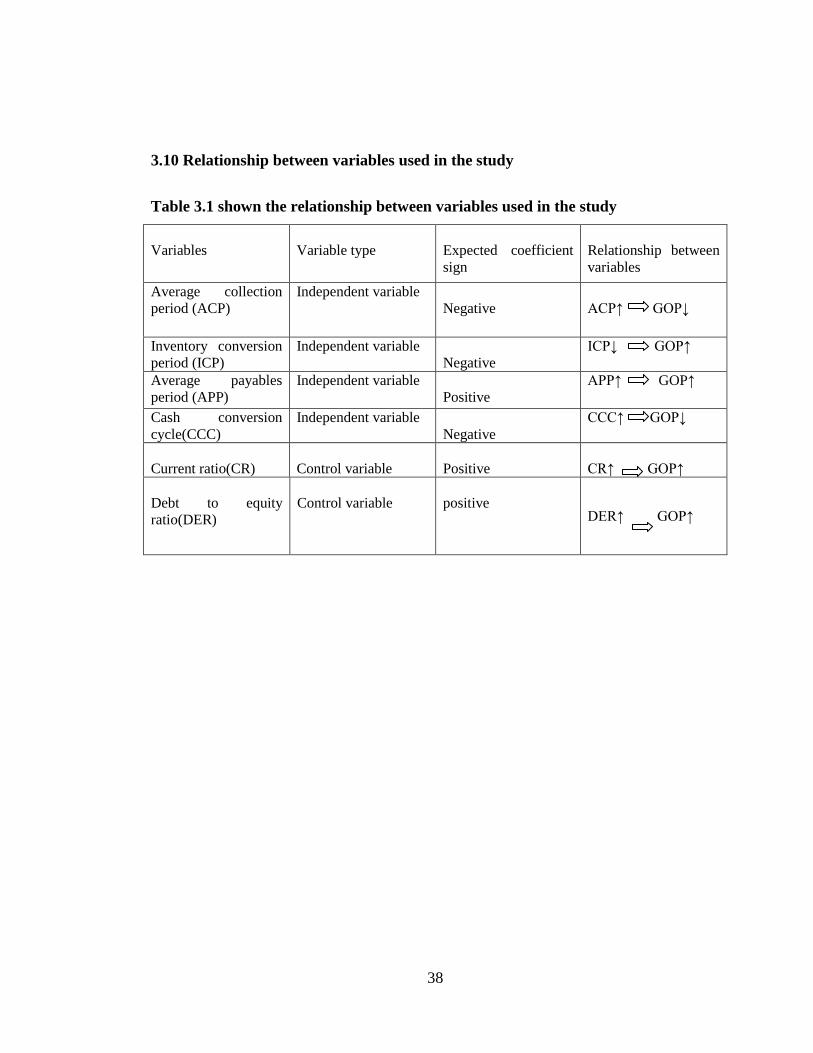
38
3.10 Relationship between variables used in the study
Table 3.1 shown the relationship between variables used in the study
Variables
Variable type
Expected coefficient
sign
Relationship between
variables
Average collection
period (ACP)
Independent variable
Negative
ACP↑ GOP↓
Inventory conversion
period (ICP)
Independent variable
Negative
ICP↓ GOP↑
Average payables
period (APP)
Independent variable
Positive
APP↑ GOP↑
Cash conversion
cycle(CCC)
Independent variable
Negative
CCC↑ GOP↓
Current ratio(CR)
Control variable
Positive
CR↑ GOP↑
Debt to equity
ratio(DER)
Control variable
positive
DER↑ GOP↑
39
CHAPTER FOUR
PRESENTATION OF FINDINGS
4.1 Introduction.
This chapter presents data analysis and interpretation of the findings found in the
research. This chapter examines, categorizes, and tabulates the evidence with the aim of
presenting the objective of the study as it was thought to be. In assessing the relationship
between working capital management and GOP for the brewery companies listed in
DSE , the variable which are used in assessment of this study are Average Collection
Period in days (ACP), Inventory Conversion Period in days (ICP), Average Payables
Period in days, Cash Conversion Cycle (CCC), Gross Operating Profit ( GOP), Current
Ratio (CR),and Debt to Equity ratio whereby all these independent, dependant and
control variables are obtained from the published annual financial reports of the given
companies for the period from 2005 to 2014. This chapter includes descriptive analysis
correlation analysis and analysis of regression results.
4.2 Descriptive analysis.
Descriptive analysis provides summary descriptive statistics of TBL and EABL for all
independent and dependent variables of these 2 companies listed on the Dar es Salaam
Stock of Exchange for the period of 10 years from 2005 to 2014. It shows the average,
range, minimum, maximum, mean and standard deviation values of variables used
within the study.
4.2.1 Descriptive statistic results for TBL.
Table 4.1 below presents a summary of descriptive statistics of the dependent and
independent variables of TBL for a period of 10 years from 2005 to 2014.
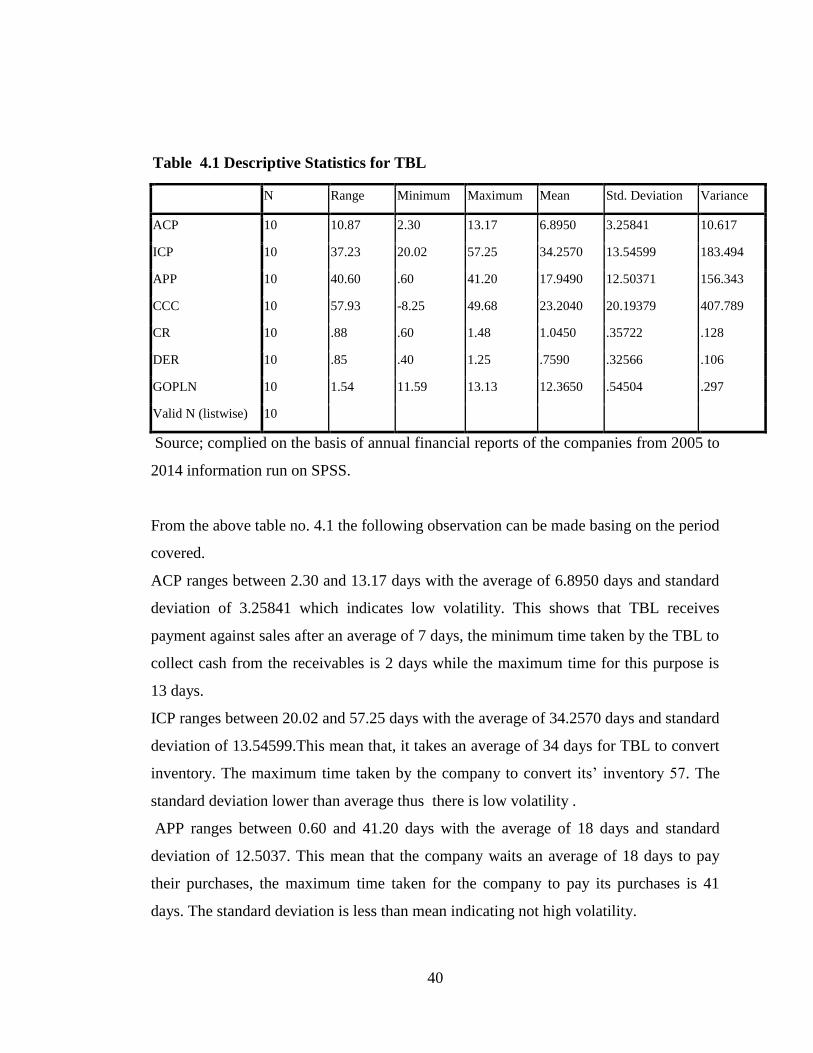
40
Table 4.1 Descriptive Statistics for TBL
N Range Minimum Maximum Mean Std. Deviation Variance
ACP 10 10.87 2.30 13.17 6.8950 3.25841 10.617
ICP 10 37.23 20.02 57.25 34.2570 13.54599 183.494
APP 10 40.60 .60 41.20 17.9490 12.50371 156.343
CCC 10 57.93 -8.25 49.68 23.2040 20.19379 407.789
CR 10 .88 .60 1.48 1.0450 .35722 .128
DER 10 .85 .40 1.25 .7590 .32566 .106
GOPLN 10 1.54 11.59 13.13 12.3650 .54504 .297
Valid N (listwise) 10
Source; complied on the basis of annual financial reports of the companies from 2005 to
2014 information run on SPSS.
From the above table no. 4.1 the following observation can be made basing on the period
covered.
ACP ranges between 2.30 and 13.17 days with the average of 6.8950 days and standard
deviation of 3.25841 which indicates low volatility. This shows that TBL receives
payment against sales after an average of 7 days, the minimum time taken by the TBL to
collect cash from the receivables is 2 days while the maximum time for this purpose is
13 days.
ICP ranges between 20.02 and 57.25 days with the average of 34.2570 days and standard
deviation of 13.54599.This mean that, it takes an average of 34 days for TBL to convert
inventory. The maximum time taken by the company to convert its‟ inventory 57. The
standard deviation lower than average thus there is low volatility .
APP ranges between 0.60 and 41.20 days with the average of 18 days and standard
deviation of 12.5037. This mean that the company waits an average of 18 days to pay
their purchases, the maximum time taken for the company to pay its purchases is 41
days. The standard deviation is less than mean indicating not high volatility.
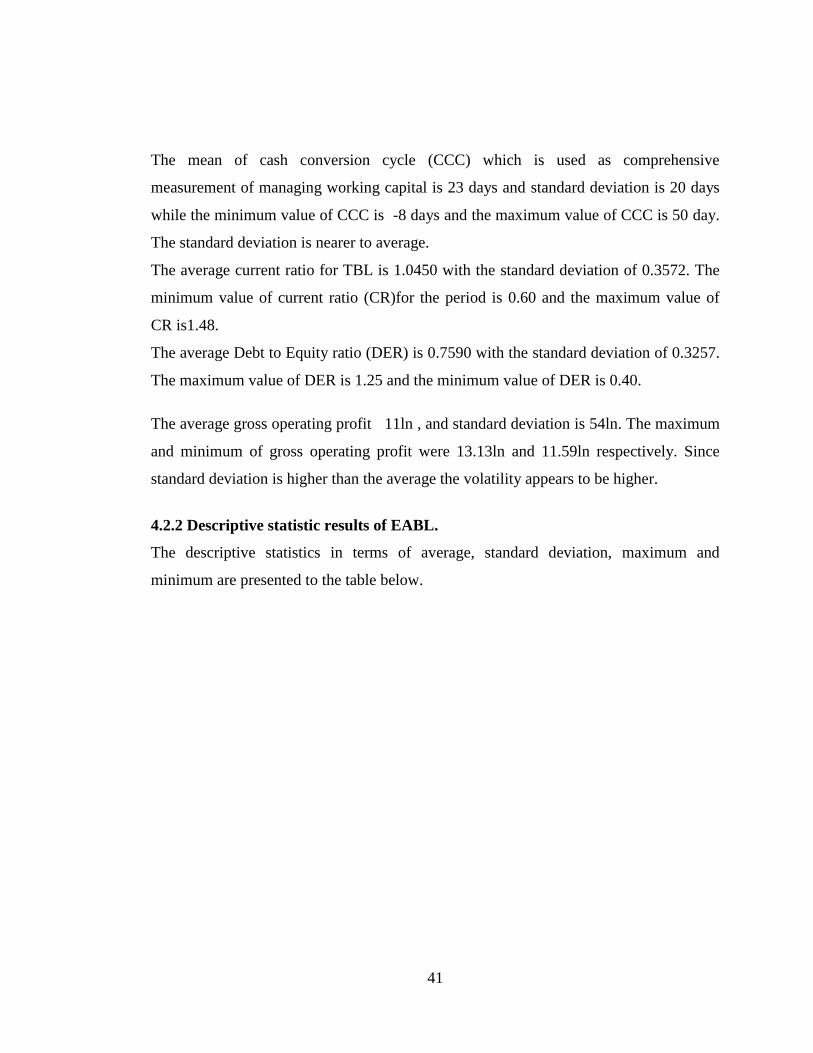
41
The mean of cash conversion cycle (CCC) which is used as comprehensive
measurement of managing working capital is 23 days and standard deviation is 20 days
while the minimum value of CCC is -8 days and the maximum value of CCC is 50 day.
The standard deviation is nearer to average.
The average current ratio for TBL is 1.0450 with the standard deviation of 0.3572. The
minimum value of current ratio (CR)for the period is 0.60 and the maximum value of
CR is1.48.
The average Debt to Equity ratio (DER) is 0.7590 with the standard deviation of 0.3257.
The maximum value of DER is 1.25 and the minimum value of DER is 0.40.
The average gross operating profit 11ln , and standard deviation is 54ln. The maximum
and minimum of gross operating profit were 13.13ln and 11.59ln respectively. Since
standard deviation is higher than the average the volatility appears to be higher.
4.2.2 Descriptive statistic results of EABL.
The descriptive statistics in terms of average, standard deviation, maximum and
minimum are presented to the table below.
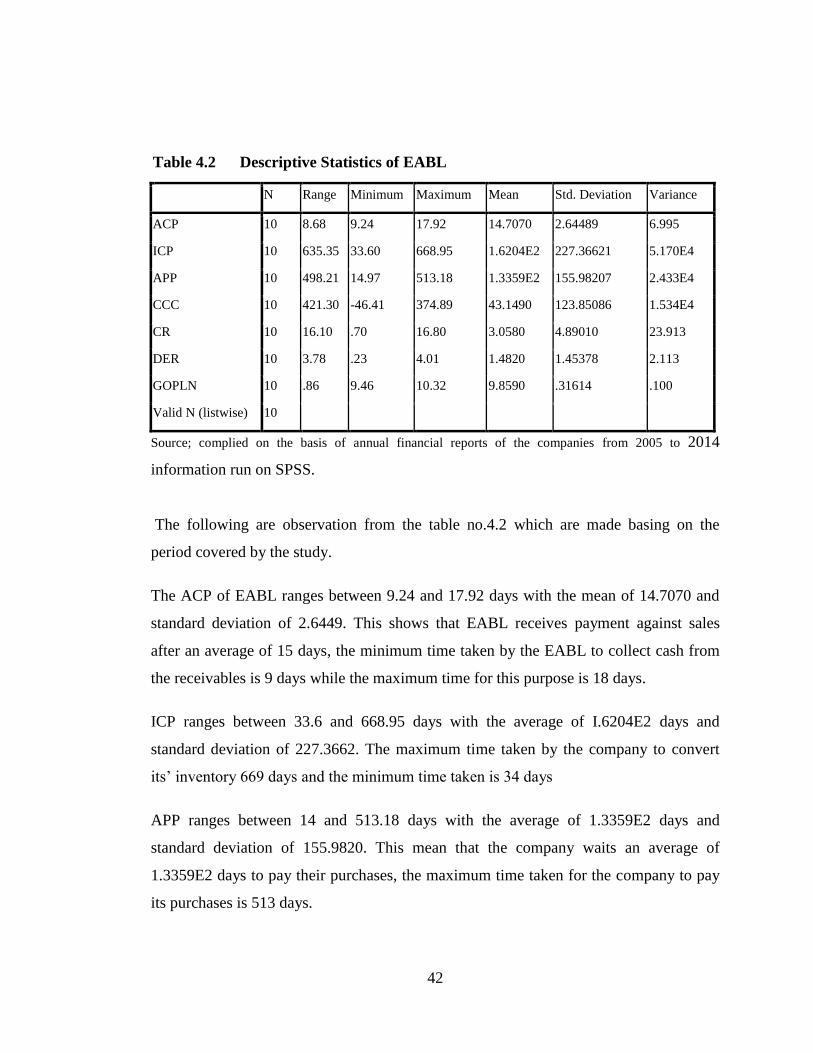
42
Table 4.2 Descriptive Statistics of EABL
N Range Minimum Maximum Mean Std. Deviation Variance
ACP 10 8.68 9.24 17.92 14.7070 2.64489 6.995
ICP 10 635.35 33.60 668.95 1.6204E2 227.36621 5.170E4
APP 10 498.21 14.97 513.18 1.3359E2 155.98207 2.433E4
CCC 10 421.30 -46.41 374.89 43.1490 123.85086 1.534E4
CR 10 16.10 .70 16.80 3.0580 4.89010 23.913
DER 10 3.78 .23 4.01 1.4820 1.45378 2.113
GOPLN 10 .86 9.46 10.32 9.8590 .31614 .100
Valid N (listwise) 10
Source; complied on the basis of annual financial reports of the companies from 2005 to 2014
information run on SPSS.
The following are observation from the table no.4.2 which are made basing on the
period covered by the study.
The ACP of EABL ranges between 9.24 and 17.92 days with the mean of 14.7070 and
standard deviation of 2.6449. This shows that EABL receives payment against sales
after an average of 15 days, the minimum time taken by the EABL to collect cash from
the receivables is 9 days while the maximum time for this purpose is 18 days.
ICP ranges between 33.6 and 668.95 days with the average of I.6204E2 days and
standard deviation of 227.3662. The maximum time taken by the company to convert
its‟ inventory 669 days and the minimum time taken is 34 days
APP ranges between 14 and 513.18 days with the average of 1.3359E2 days and
standard deviation of 155.9820. This mean that the company waits an average of
1.3359E2 days to pay their purchases, the maximum time taken for the company to pay
its purchases is 513 days.
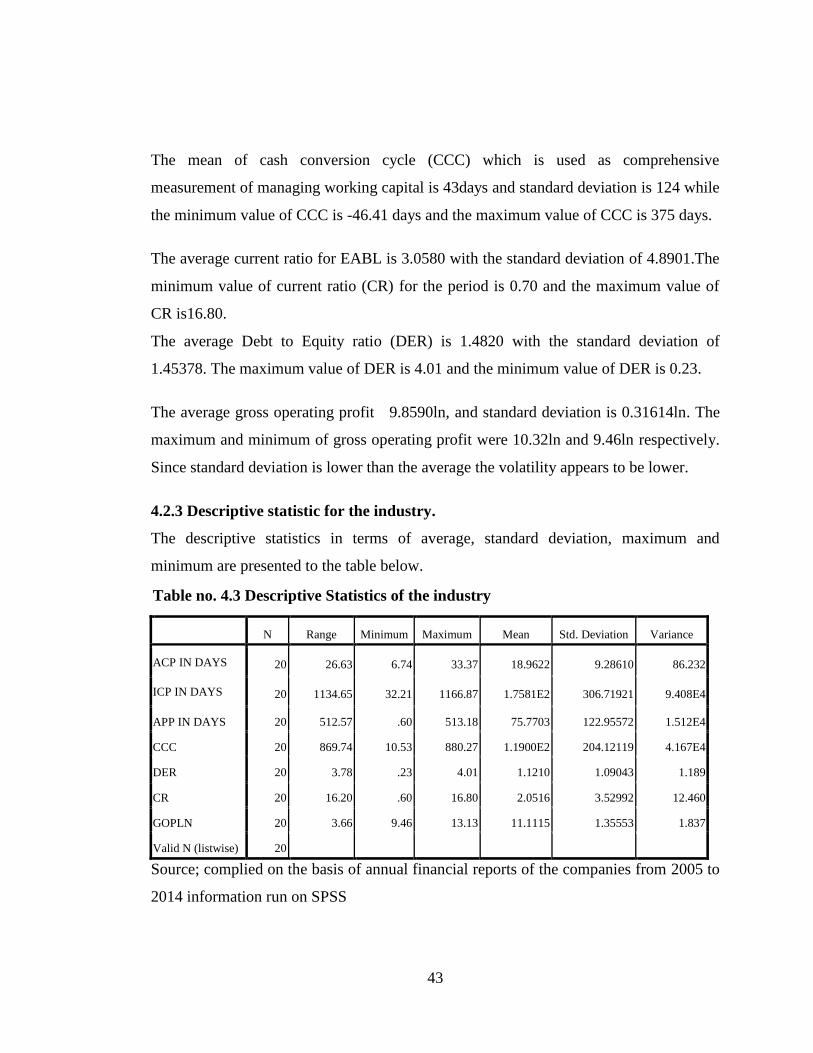
43
The mean of cash conversion cycle (CCC) which is used as comprehensive
measurement of managing working capital is 43days and standard deviation is 124 while
the minimum value of CCC is -46.41 days and the maximum value of CCC is 375 days.
The average current ratio for EABL is 3.0580 with the standard deviation of 4.8901.The
minimum value of current ratio (CR) for the period is 0.70 and the maximum value of
CR is16.80.
The average Debt to Equity ratio (DER) is 1.4820 with the standard deviation of
1.45378. The maximum value of DER is 4.01 and the minimum value of DER is 0.23.
The average gross operating profit 9.8590ln, and standard deviation is 0.31614ln. The
maximum and minimum of gross operating profit were 10.32ln and 9.46ln respectively.
Since standard deviation is lower than the average the volatility appears to be lower.
4.2.3 Descriptive statistic for the industry.
The descriptive statistics in terms of average, standard deviation, maximum and
minimum are presented to the table below.
Table no. 4.3 Descriptive Statistics of the industry
N Range Minimum Maximum Mean Std. Deviation Variance
ACP IN DAYS 20 26.63 6.74 33.37 18.9622 9.28610 86.232
ICP IN DAYS 20 1134.65 32.21 1166.87 1.7581E2 306.71921 9.408E4
APP IN DAYS 20 512.57 .60 513.18 75.7703 122.95572 1.512E4
CCC 20 869.74 10.53 880.27 1.1900E2 204.12119 4.167E4
DER 20 3.78 .23 4.01 1.1210 1.09043 1.189
CR 20 16.20 .60 16.80 2.0516 3.52992 12.460
GOPLN 20 3.66 9.46 13.13 11.1115 1.35553 1.837
Valid N (listwise) 20
Source; complied on the basis of annual financial reports of the companies from 2005 to
2014 information run on SPSS
44
From table no. 4.3 above the following information is observed;
ACP ranges between 6.74 and 33.37 days with the average of 18.96 days and standard
deviation of 9.286 which indicates low volatility. This shows that the industry receives
payment against sales after an average of 18.96 days, the minimum time taken by the
TBL to collect cash from the credit sales is 6.74 days while the maximum time for this
purpose is 33.37 days.
ICP ranges between 32.21 and 1166.87 days with the average of 1.7581E2 days and
standard deviation of 306.7192.This mean that, it takes an average of 34 days for the
industry to convert its inventory. The maximum time taken by the company to convert
its‟ inventory 1167 day.
APP ranges between 0.60 and 513.18 days with the average of 75.77 days and standard
deviation of 12.95572.This mean that, the industry waits an average of 76 days to pay
their purchases, the maximum time taken for the industry to pay its purchases is 513.18
days.
The mean of cash conversion cycle (CCC) which is used as comprehensive
measurement of managing working capital is 1.1900E2 days and standard deviation is
204.12119 days while the minimum value of CCC is 10.53 days and the maximum value
of CCC is 880.27 day. The minimum value of 10.53 days shows that the industry
records large inventory turnover or cash collections from credit sales before making a
single payment for credit purchase, it means that the average collection period or
inventory holding period are very short and the accounts payable period of the industry
is very long.
The average current ratio for the industry is 2.0516 with the standard deviation of
3.52992., the minimum value of current ratio (CR) for the period is 0.60 and the
maximum value of CR is16.80
The average Debt to Equity ratio (DER) is 1.1210 with the standard deviation of
1.09043.
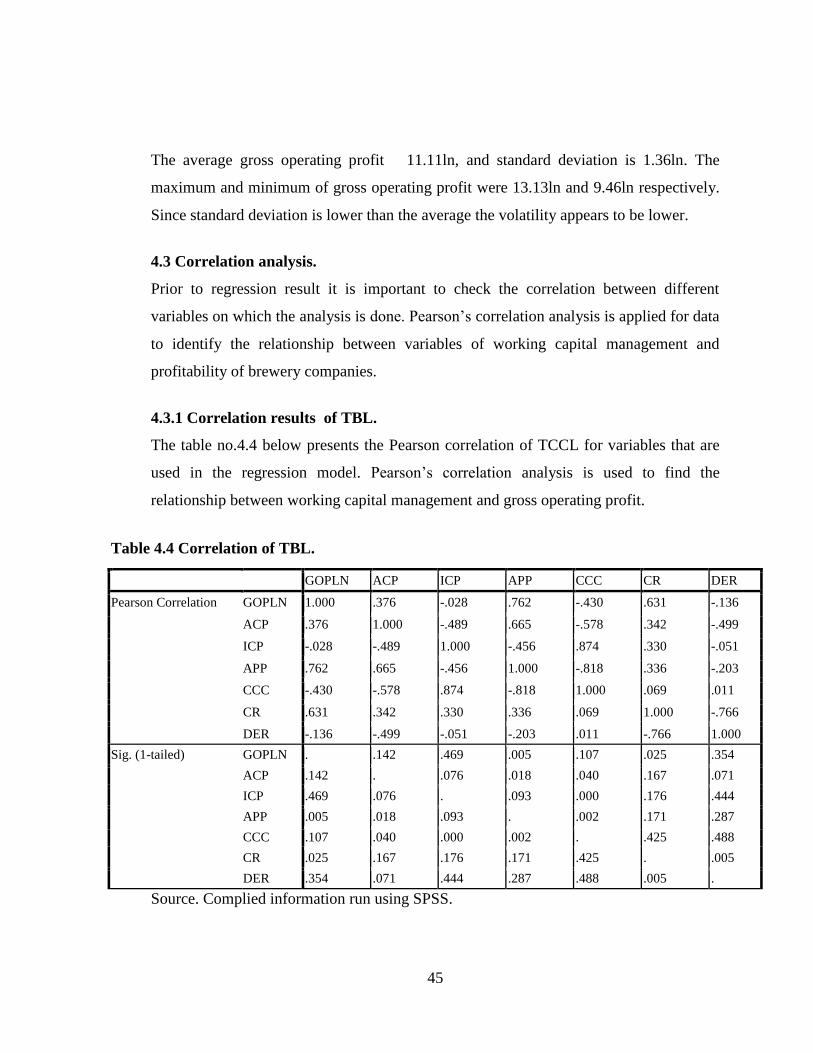
45
The average gross operating profit 11.11ln, and standard deviation is 1.36ln. The
maximum and minimum of gross operating profit were 13.13ln and 9.46ln respectively.
Since standard deviation is lower than the average the volatility appears to be lower.
4.3 Correlation analysis.
Prior to regression result it is important to check the correlation between different
variables on which the analysis is done. Pearson‟s correlation analysis is applied for data
to identify the relationship between variables of working capital management and
profitability of brewery companies.
4.3.1 Correlation results of TBL.
The table no.4.4 below presents the Pearson correlation of TCCL for variables that are
used in the regression model. Pearson‟s correlation analysis is used to find the
relationship between working capital management and gross operating profit.
Table 4.4 Correlation of TBL.
GOPLN ACP ICP APP CCC CR DER
Pearson Correlation GOPLN 1.000 .376 -.028 .762 -.430 .631 -.136
ACP .376 1.000 -.489 .665 -.578 .342 -.499
ICP -.028 -.489 1.000 -.456 .874 .330 -.051
APP .762 .665 -.456 1.000 -.818 .336 -.203
CCC -.430 -.578 .874 -.818 1.000 .069 .011
CR .631 .342 .330 .336 .069 1.000 -.766
DER -.136 -.499 -.051 -.203 .011 -.766 1.000
Sig. (1-tailed) GOPLN . .142 .469 .005 .107 .025 .354
ACP .142 . .076 .018 .040 .167 .071
ICP .469 .076 . .093 .000 .176 .444
APP .005 .018 .093 . .002 .171 .287
CCC .107 .040 .000 .002 . .425 .488
CR .025 .167 .176 .171 .425 . .005
DER .354 .071 .444 .287 .488 .005 .
Source. Complied information run using SPSS.
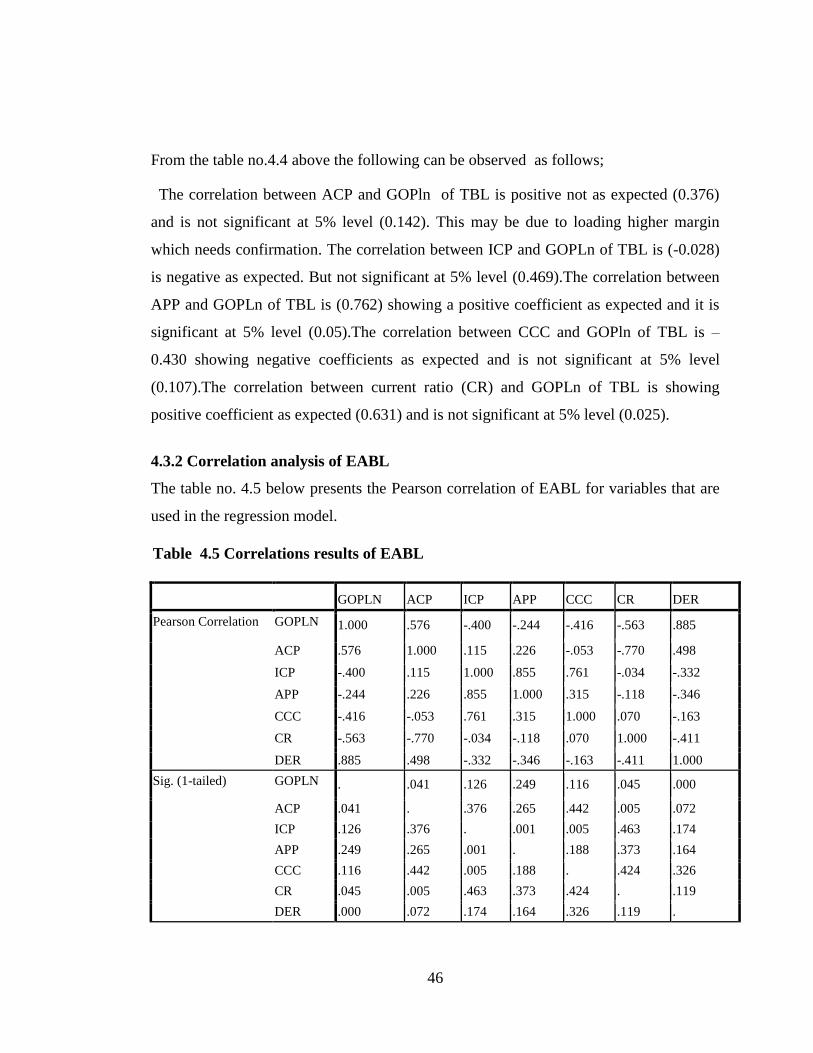
46
From the table no.4.4 above the following can be observed as follows;
The correlation between ACP and GOPln of TBL is positive not as expected (0.376)
and is not significant at 5% level (0.142). This may be due to loading higher margin
which needs confirmation. The correlation between ICP and GOPLn of TBL is (-0.028)
is negative as expected. But not significant at 5% level (0.469).The correlation between
APP and GOPLn of TBL is (0.762) showing a positive coefficient as expected and it is
significant at 5% level (0.05).The correlation between CCC and GOPln of TBL is –
0.430 showing negative coefficients as expected and is not significant at 5% level
(0.107).The correlation between current ratio (CR) and GOPLn of TBL is showing
positive coefficient as expected (0.631) and is not significant at 5% level (0.025).
4.3.2 Correlation analysis of EABL
The table no. 4.5 below presents the Pearson correlation of EABL for variables that are
used in the regression model.
Table 4.5 Correlations results of EABL
GOPLN ACP ICP APP CCC CR DER
Pearson Correlation GOPLN 1.000 .576 -.400 -.244 -.416 -.563 .885
ACP .576 1.000 .115 .226 -.053 -.770 .498
ICP -.400 .115 1.000 .855 .761 -.034 -.332
APP -.244 .226 .855 1.000 .315 -.118 -.346
CCC -.416 -.053 .761 .315 1.000 .070 -.163
CR -.563 -.770 -.034 -.118 .070 1.000 -.411
DER .885 .498 -.332 -.346 -.163 -.411 1.000
Sig. (1-tailed) GOPLN . .041 .126 .249 .116 .045 .000
ACP .041 . .376 .265 .442 .005 .072
ICP .126 .376 . .001 .005 .463 .174
APP .249 .265 .001 . .188 .373 .164
CCC .116 .442 .005 .188 . .424 .326
CR .045 .005 .463 .373 .424 . .119
DER .000 .072 .174 .164 .326 .119 .
47
Source; complied on the basis of annual financial reports of the companies from 2005 to
2014 information run on SPSS.
From the above table no. 4.5 the following can be observed ;
The correlation between ACP and GOPLn is positive against expectation (0.576) and
the relationship is significant (0.41).The correlation between ICP and GOPLn is -0.400
which is negative as expected and the relation is not significant at 5% level (0.126).The
correlation between APP and GOPLn is -0.244 which is negative against expectation
and the relationship is not significant at 5% level (0.249).The correlation between CCC
and GOPLn is negative coefficients as expected (-0.416) and the relationship is not
significant at 5% level (0.116)The correlation between CR and GOPln is showing
negative coefficients not as expected(-0.563) and the relationship is significant at 5%
level (0.45).The correlation between DER and GOPln is showing a positive coefficient
(0.885) and the relationship is significant at 5% level.
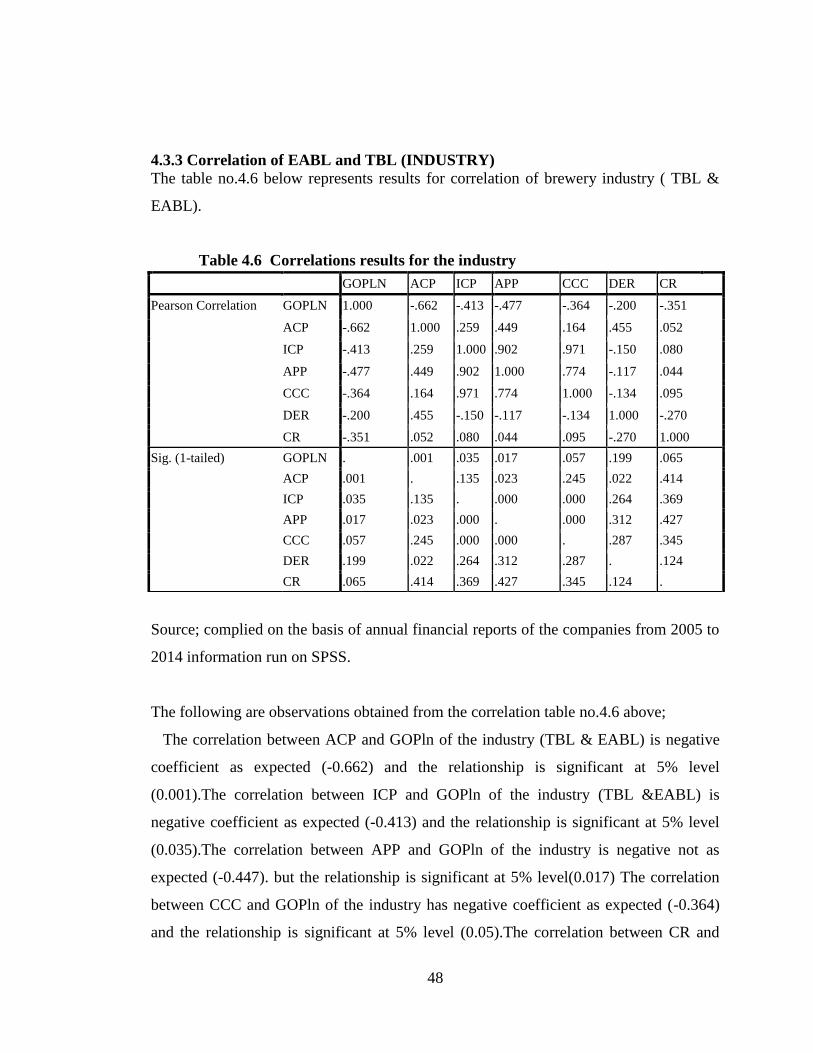
48
4.3.3 Correlation of EABL and TBL (INDUSTRY)
The table no.4.6 below represents results for correlation of brewery industry ( TBL &
EABL).
Source; complied on the basis of annual financial reports of the companies from 2005 to
2014 information run on SPSS.
The following are observations obtained from the correlation table no.4.6 above;
The correlation between ACP and GOPln of the industry (TBL & EABL) is negative
coefficient as expected (-0.662) and the relationship is significant at 5% level
(0.001).The correlation between ICP and GOPln of the industry (TBL &EABL) is
negative coefficient as expected (-0.413) and the relationship is significant at 5% level
(0.035).The correlation between APP and GOPln of the industry is negative not as
expected (-0.447). but the relationship is significant at 5% level(0.017) The correlation
between CCC and GOPln of the industry has negative coefficient as expected (-0.364)
and the relationship is significant at 5% level (0.05).The correlation between CR and
Table 4.6 Correlations results for the industry
GOPLN ACP ICP APP CCC DER CR
Pearson Correlation GOPLN 1.000 -.662 -.413 -.477 -.364 -.200 -.351
ACP -.662 1.000 .259 .449 .164 .455 .052
ICP -.413 .259 1.000 .902 .971 -.150 .080
APP -.477 .449 .902 1.000 .774 -.117 .044
CCC -.364 .164 .971 .774 1.000 -.134 .095
DER -.200 .455 -.150 -.117 -.134 1.000 -.270
CR -.351 .052 .080 .044 .095 -.270 1.000
Sig. (1-tailed) GOPLN . .001 .035 .017 .057 .199 .065
ACP .001 . .135 .023 .245 .022 .414
ICP .035 .135 . .000 .000 .264 .369
APP .017 .023 .000 . .000 .312 .427
CCC .057 .245 .000 .000 . .287 .345
DER .199 .022 .264 .312 .287 . .124
CR .065 .414 .369 .427 .345 .124 .
49
GOPLn of the industry is showing negative coefficient not as expected (-0.351), but the
relationship is not significant at level 5% (0.065).The correlation between DER and
GOPln of the industry is showing a negative coefficient of -.0.200 and the relationship is
not significant at 5% level (0.199).
4.4 Regression analysis
This shows the extent on how working capital variables affect the profitability of the
companies. Multiple regression analysis is done for ACP, ICP, APP, CCC, CR DER
with GOPln. In this model ACP, ICP, APP, and CCC are used as independent variables,
GOPln is taken as dependant variable and CR and DER are taken as control variables.
Regression is done for each independent variable with GOPln in order to assess the
impact of each component of working capital on profitability of the company.
4.4.1 Regression results of TBL.
The regression analysis has been done to assess the impact of each component of
working capital viz; ACP, ICP, APP and CCC on profitability of TBL taking DER and
CR as control variables. The following aspects discuss the same.
4.4.1.1The Impact of ACP on GOP
The review of literature revealed that there is negative association between ACP and
profitability indicating increase in ACP decreases profitability and vice versa. In order to
test whether it holds well, in the present study regression is calculated taking GOP as
dependent variable and ACP as independent variable. In addition DER and CR are taken
as control variables. The worked out regression result are presented in table no. 4.7 and
table no.4.8 below
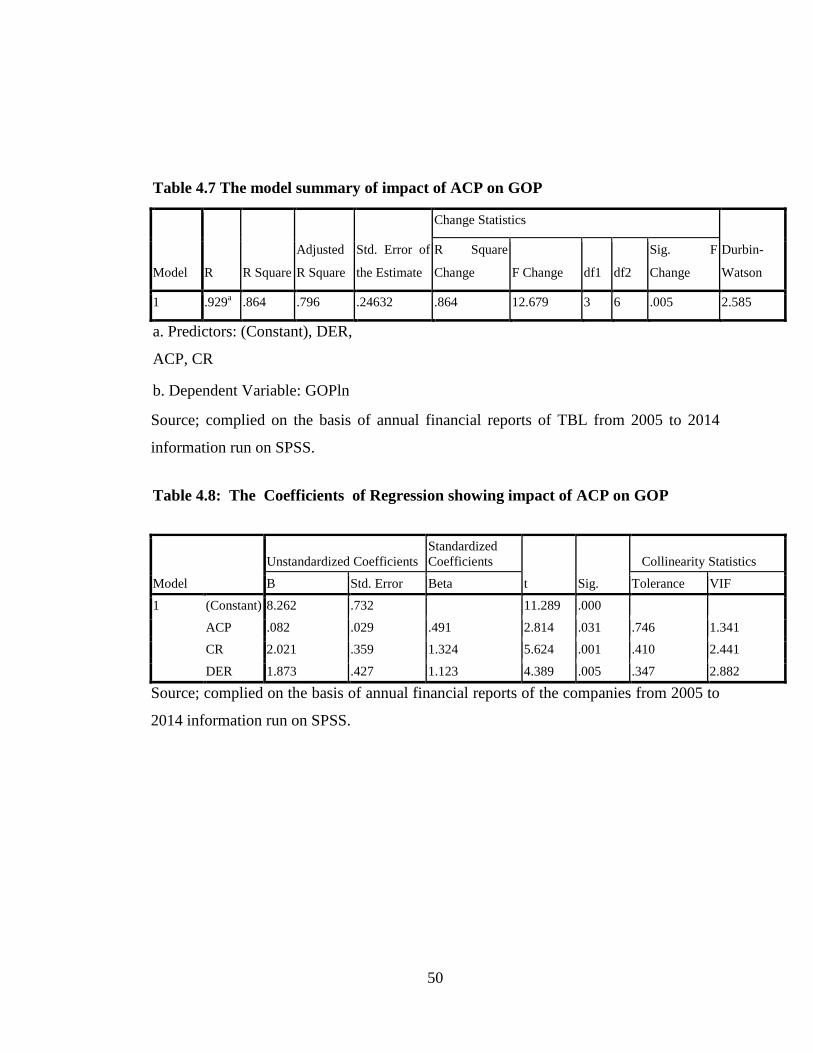
50
Table 4.7 The model summary of impact of ACP on GOP
Model R R Square
Adjusted
R Square
Std. Error of
the Estimate
Change Statistics
Durbin-
Watson
R Square
Change F Change df1 df2
Sig. F
Change
1 .929a .864 .796 .24632 .864 12.679 3 6 .005 2.585
a. Predictors: (Constant), DER,
ACP, CR
b. Dependent Variable: GOPln
Source; complied on the basis of annual financial reports of TBL from 2005 to 2014
information run on SPSS.
Table 4.8: The Coefficients of Regression showing impact of ACP on GOP
Model
Unstandardized Coefficients
Standardized
Coefficients
t Sig.
Collinearity Statistics
B Std. Error Beta Tolerance VIF
1 (Constant) 8.262 .732 11.289 .000
ACP .082 .029 .491 2.814 .031 .746 1.341
CR 2.021 .359 1.324 5.624 .001 .410 2.441
DER 1.873 .427 1.123 4.389 .005 .347 2.882
Source; complied on the basis of annual financial reports of the companies from 2005 to
2014 information run on SPSS.
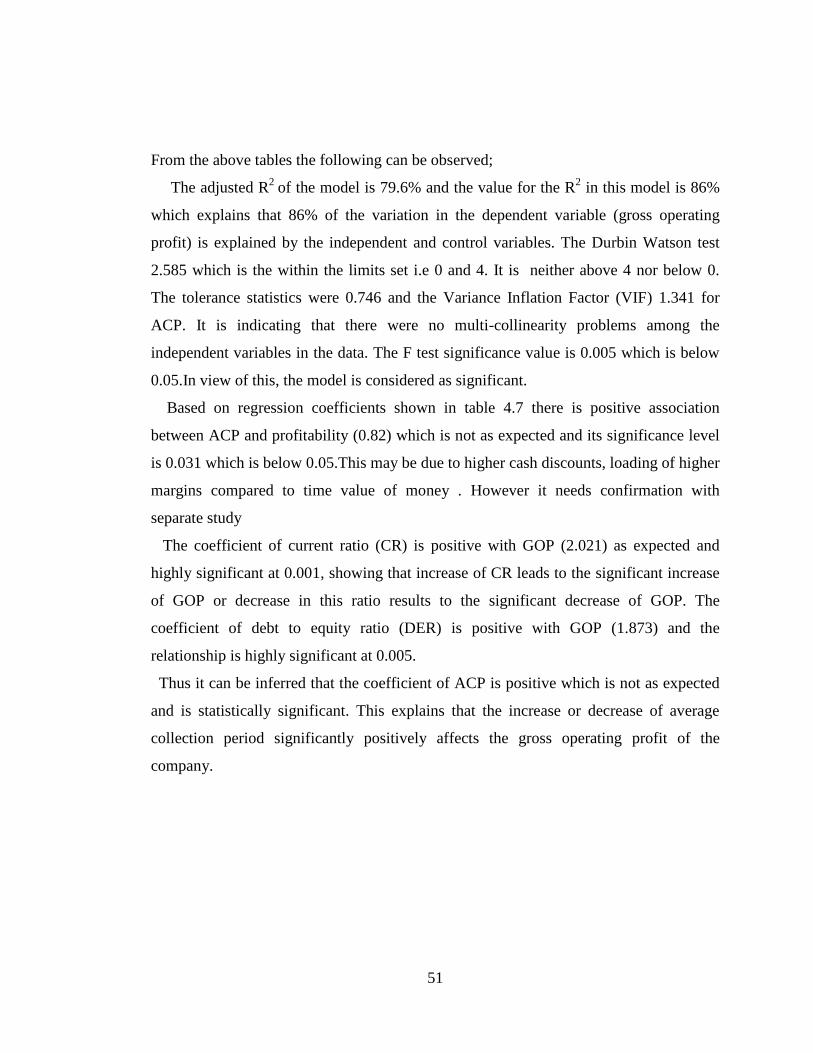
51
From the above tables the following can be observed;
The adjusted R2
of the model is 79.6% and the value for the R2 in this model is 86%
which explains that 86% of the variation in the dependent variable (gross operating
profit) is explained by the independent and control variables. The Durbin Watson test
2.585 which is the within the limits set i.e 0 and 4. It is neither above 4 nor below 0.
The tolerance statistics were 0.746 and the Variance Inflation Factor (VIF) 1.341 for
ACP. It is indicating that there were no multi-collinearity problems among the
independent variables in the data. The F test significance value is 0.005 which is below
0.05.In view of this, the model is considered as significant.
Based on regression coefficients shown in table 4.7 there is positive association
between ACP and profitability (0.82) which is not as expected and its significance level
is 0.031 which is below 0.05.This may be due to higher cash discounts, loading of higher
margins compared to time value of money . However it needs confirmation with
separate study
The coefficient of current ratio (CR) is positive with GOP (2.021) as expected and
highly significant at 0.001, showing that increase of CR leads to the significant increase
of GOP or decrease in this ratio results to the significant decrease of GOP. The
coefficient of debt to equity ratio (DER) is positive with GOP (1.873) and the
relationship is highly significant at 0.005.
Thus it can be inferred that the coefficient of ACP is positive which is not as expected
and is statistically significant. This explains that the increase or decrease of average
collection period significantly positively affects the gross operating profit of the
company.
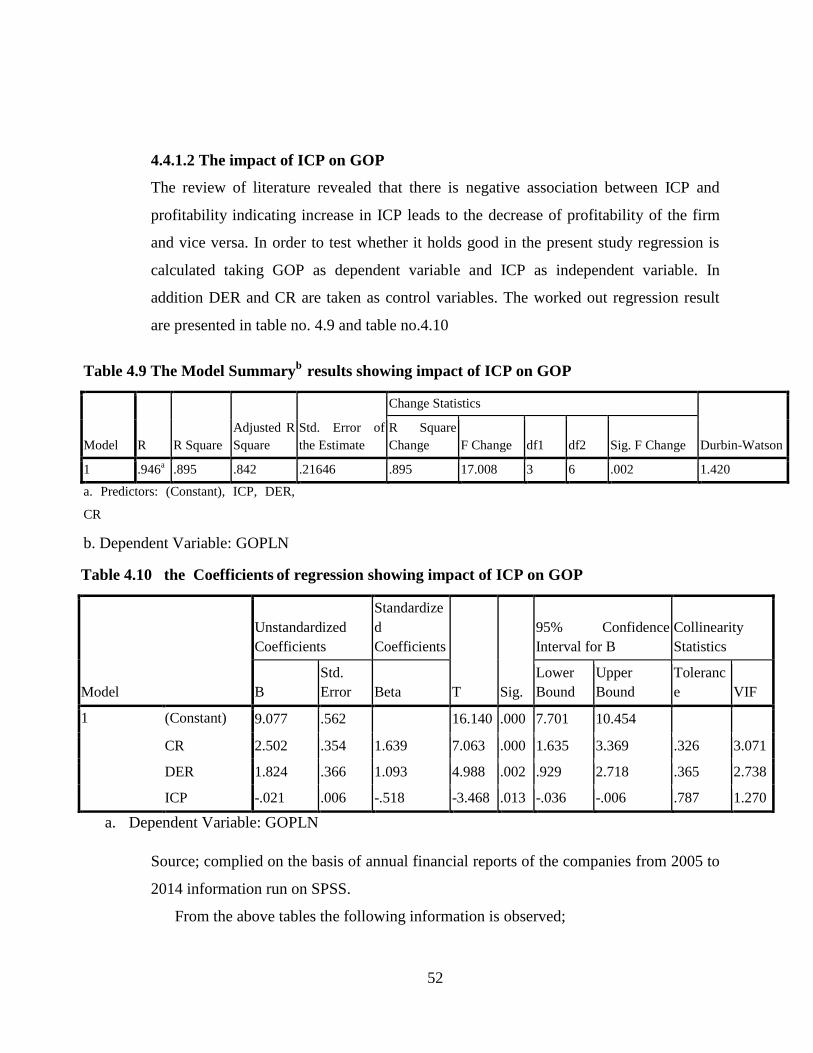
52
4.4.1.2 The impact of ICP on GOP
The review of literature revealed that there is negative association between ICP and
profitability indicating increase in ICP leads to the decrease of profitability of the firm
and vice versa. In order to test whether it holds good in the present study regression is
calculated taking GOP as dependent variable and ICP as independent variable. In
addition DER and CR are taken as control variables. The worked out regression result
are presented in table no. 4.9 and table no.4.10
Table 4.9 The Model Summaryb
results showing impact of ICP on GOP
Model R R Square
Adjusted R
Square
Std. Error of
the Estimate
Change Statistics
Durbin-Watson
R Square
Change F Change df1 df2 Sig. F Change
1 .946a .895 .842 .21646 .895 17.008 3 6 .002 1.420
a. Predictors: (Constant), ICP, DER,
CR
b. Dependent Variable: GOPLN
Table 4.10 the Coefficients of regression showing impact of ICP on GOP
Model
Unstandardized
Coefficients
Standardize
d
Coefficients
T Sig.
95% Confidence
Interval for B
Collinearity
Statistics
B
Std.
Error Beta
Lower
Bound
Upper
Bound
Toleranc
e VIF
1 (Constant) 9.077 .562 16.140 .000 7.701 10.454
CR 2.502 .354 1.639 7.063 .000 1.635 3.369 .326 3.071
DER 1.824 .366 1.093 4.988 .002 .929 2.718 .365 2.738
ICP -.021 .006 -.518 -3.468 .013 -.036 -.006 .787 1.270
a. Dependent Variable: GOPLN
Source; complied on the basis of annual financial reports of the companies from 2005 to
2014 information run on SPSS.
From the above tables the following information is observed;
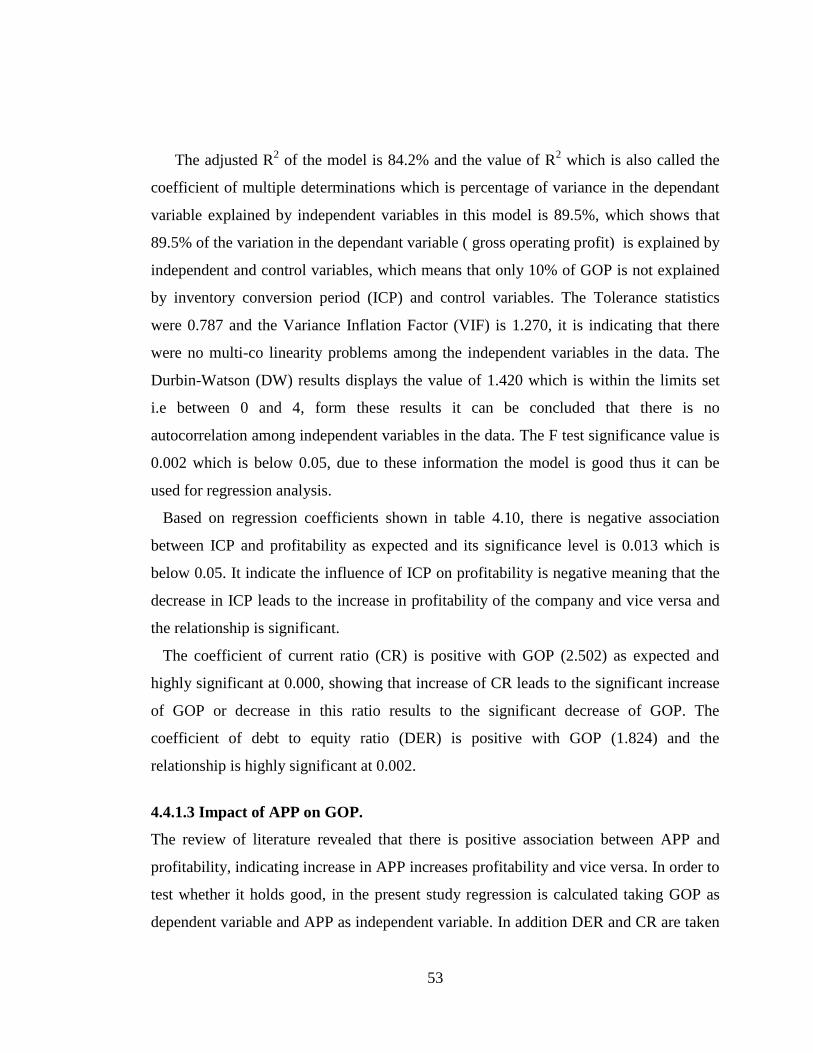
53
The adjusted R2 of the model is 84.2% and the value of R
2 which is also called the
coefficient of multiple determinations which is percentage of variance in the dependant
variable explained by independent variables in this model is 89.5%, which shows that
89.5% of the variation in the dependant variable ( gross operating profit) is explained by
independent and control variables, which means that only 10% of GOP is not explained
by inventory conversion period (ICP) and control variables. The Tolerance statistics
were 0.787 and the Variance Inflation Factor (VIF) is 1.270, it is indicating that there
were no multi-co linearity problems among the independent variables in the data. The
Durbin-Watson (DW) results displays the value of 1.420 which is within the limits set
i.e between 0 and 4, form these results it can be concluded that there is no
autocorrelation among independent variables in the data. The F test significance value is
0.002 which is below 0.05, due to these information the model is good thus it can be
used for regression analysis.
Based on regression coefficients shown in table 4.10, there is negative association
between ICP and profitability as expected and its significance level is 0.013 which is
below 0.05. It indicate the influence of ICP on profitability is negative meaning that the
decrease in ICP leads to the increase in profitability of the company and vice versa and
the relationship is significant.
The coefficient of current ratio (CR) is positive with GOP (2.502) as expected and
highly significant at 0.000, showing that increase of CR leads to the significant increase
of GOP or decrease in this ratio results to the significant decrease of GOP. The
coefficient of debt to equity ratio (DER) is positive with GOP (1.824) and the
relationship is highly significant at 0.002.
4.4.1.3 Impact of APP on GOP.
The review of literature revealed that there is positive association between APP and
profitability, indicating increase in APP increases profitability and vice versa. In order to
test whether it holds good, in the present study regression is calculated taking GOP as
dependent variable and APP as independent variable. In addition DER and CR are taken
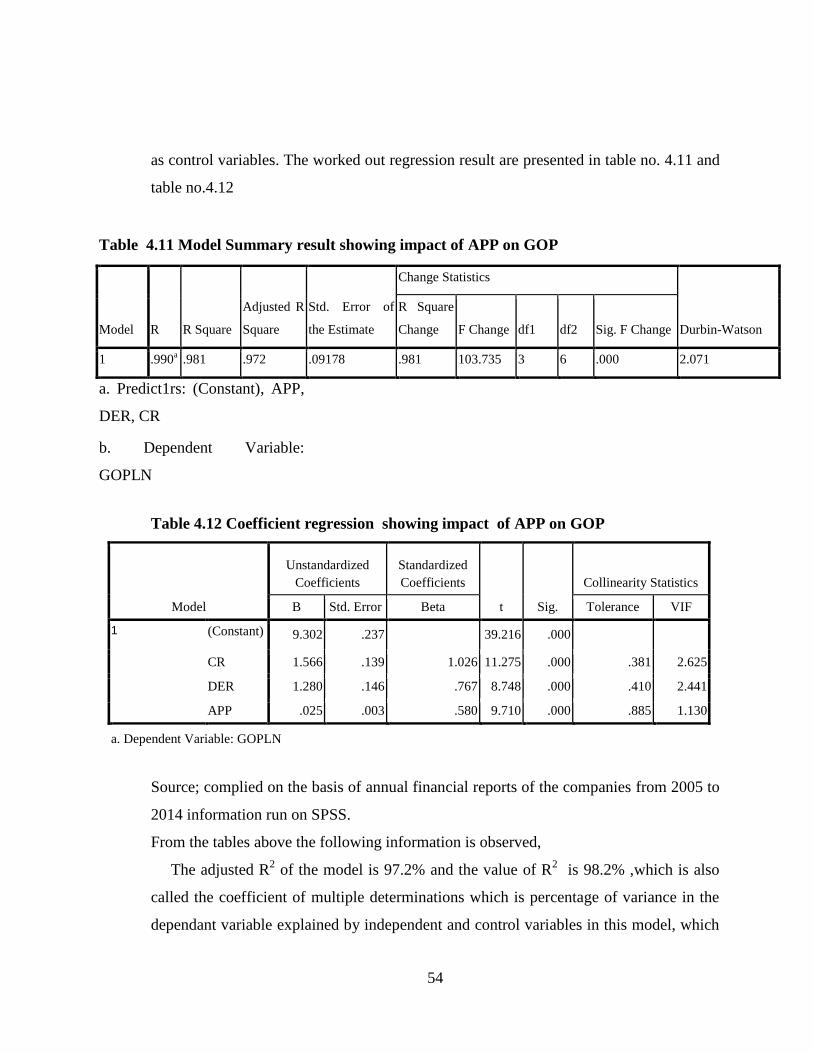
54
as control variables. The worked out regression result are presented in table no. 4.11 and
table no.4.12
Table 4.11 Model Summary result showing impact of APP on GOP
Model R R Square
Adjusted R
Square
Std. Error of
the Estimate
Change Statistics
Durbin-Watson
R Square
Change F Change df1 df2 Sig. F Change
1 .990a .981 .972 .09178 .981 103.735 3 6 .000 2.071
a. Predict1rs: (Constant), APP,
DER, CR
b. Dependent Variable:
GOPLN
Table 4.12 Coefficient regression showing impact of APP on GOP
Model
Unstandardized
Coefficients
Standardized
Coefficients
t Sig.
Collinearity Statistics
B Std. Error Beta Tolerance VIF
1 (Constant) 9.302 .237 39.216 .000
CR 1.566 .139 1.026 11.275 .000 .381 2.625
DER 1.280 .146 .767 8.748 .000 .410 2.441
APP .025 .003 .580 9.710 .000 .885 1.130
a. Dependent Variable: GOPLN
Source; complied on the basis of annual financial reports of the companies from 2005 to
2014 information run on SPSS.
From the tables above the following information is observed,
The adjusted R2 of the model is 97.2% and the value of R
2 is 98.2% ,which is also
called the coefficient of multiple determinations which is percentage of variance in the
dependant variable explained by independent and control variables in this model, which
55
shows that 98% of the variation in GOP as dependant variable is explained by
independent and control variables. The Tolerance statistics is 0.885 and the Variance
Inflation Factor ( VIF) is 1.130 ,since the values of Tolerance statistic and VIF are
within the limit it is indicating that there is no multi-collinearity problems among the
independent variables in the data .The Durbin-Watson (DW) value is 2.071 ,Whereby
Durbin Watson ranges in value from 0 to 4. A value near 2 indicates non-
autocorrelation, a value towards 0 indicates positive autocorrelation and a value towards
4 indicates negative autocorrelation, thus the Durbin Watson value it can be said that
there is non-autocorrelation among variables in the data and F test is highly significant at
0.000. Hence the model is considered as significant.
Based on regression coefficients shown in table no.4.12, the coefficients of APP is
positive as expected (0.025) ,which means there is positive association between APP and
profitability and the relationship is highly significant at level 0.000 which is below
0.05. it implies that increase in APP will result into significant increase in GOP and vice
versa, which is to say that the more the firm delays its payment to creditors the more
level of working capital is reserved and used in daily operation of the firm hence
increase of profitability.
The coefficient of current ratio (CR) is positive with GOP (1.566) as expected and
highly significant at 0.000, showing that increase of CR leads to the significant increase
of GOP or decrease in this ratio results to the significant decrease of GOP. The
coefficient of debt to equity ratio (DER) is positive with GOP (1.280) and the
relationship is highly significant at 0.000.
4.5.1.4 Impact of CCC on GOP
The review of literature revealed that there is negative association between CCC and
profitability indicating increase in CCC decreases profitability and vice versa. In order to
test whether it holds good in the present study regression is calculated taking GOP as
dependent variable and CCC as independent variable. In addition DER and CR are taken
as control variables. The worked out regression result are presented in table no. 4.13 and
table no.4.14
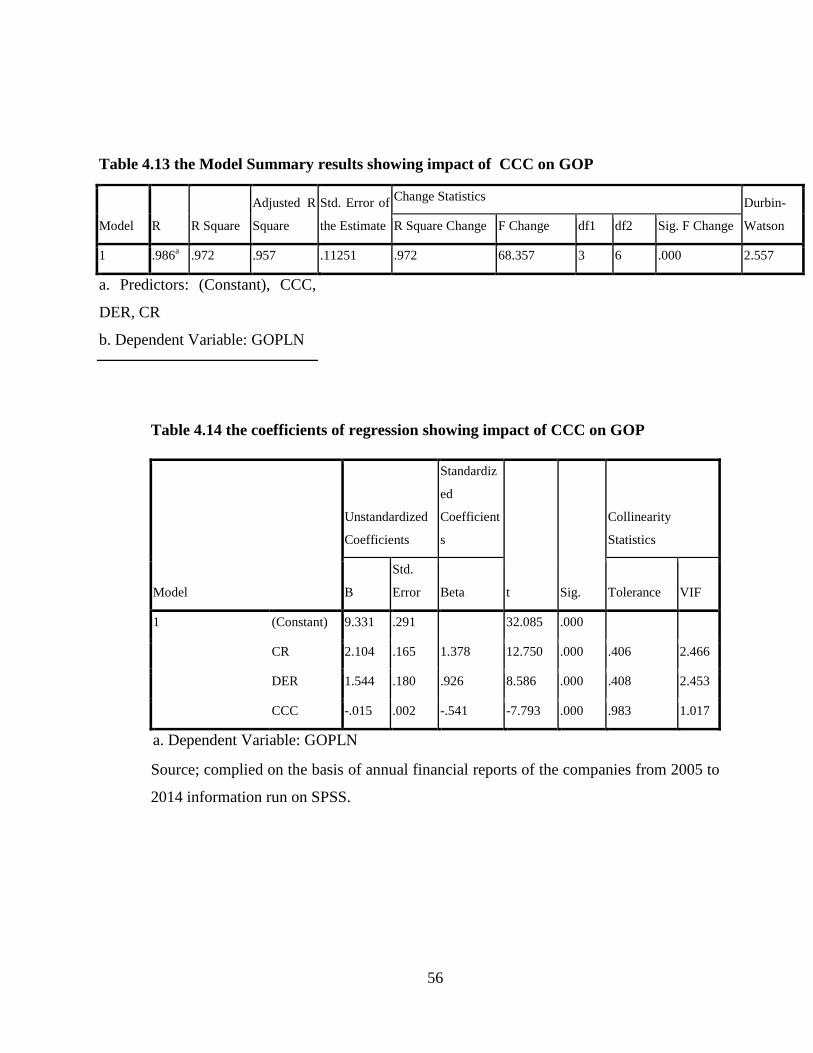
56
Table 4.13 the Model Summary results showing impact of CCC on GOP
Model R R Square
Adjusted R
Square
Std. Error of
the Estimate
Change Statistics Durbin-
Watson R Square Change F Change df1 df2 Sig. F Change
1 .986a .972 .957 .11251 .972 68.357 3 6 .000 2.557
a. Predictors: (Constant), CCC,
DER, CR
b. Dependent Variable: GOPLN
Table 4.14 the coefficients of regression showing impact of CCC on GOP
Source; complied on the basis of annual financial reports of the companies from 2005 to
2014 information run on SPSS.
Model
Unstandardized
Coefficients
Standardiz
ed
Coefficient
s
t Sig.
Collinearity
Statistics
B
Std.
Error Beta Tolerance VIF
1 (Constant) 9.331 .291 32.085 .000
CR 2.104 .165 1.378 12.750 .000 .406 2.466
DER 1.544 .180 .926 8.586 .000 .408 2.453
CCC -.015 .002 -.541 -7.793 .000 .983 1.017
a. Dependent Variable: GOPLN
57
From the above table the following information is observed;
The adjusted R2
of the model is 97.2% and the value for the R2 in this model is
95.7% which explains that 95.7% of the variation in the dependent variable (gross
operating profit) is explained by the independent and control variables. The Durbin
Watson test 2.557 which is the within the limits set i.e 0 and 4. It is neither above 4 nor
below 0. The tolerance statistics were 0.983 and the Variance Inflation Factor (VIF)
1.017 .It is indicating that there were no multi-co linearity problems among the
independent variables in the data. The F test significance value is 0.000 which is below
0.05 and highly significant. In view of this, the model is considered as significant.
The coefficient of cash conversion cycle (CCC) is negative with GOP as expected
(-0.015) and is highly significant at 0.000, which implies that when cash conversion
cycle decreases(CCC) results to the significant increase of gross operating profit or
when CCC increases leads to the significant decrease in GOP.
The coefficient of current ratio (CR) is positive with GOP (2.104) as expected and
highly significant at 0.000, showing that increase of CR leads to the significant increase
of GOP or decrease in this ratio results to the significant decrease of GOP. The
coefficient of debt to equity ratio (DER) is positive with GOP (1.544) and the
relationship is highly significant at 0.000.
4.4.2 Regression results of EABL.
The regression analysis has been done to assess the impact of each component of
working capital viz; ACP, ICP, APP and CCC on profitability of EABL taking DER and
CR as control variables. The following aspects discuss the same.
4.4.2.1 The impact of ACP on GOP.
The review of literature revealed that there is negative association between ACP and
profitability indicating increase in ACP decreases profitability and vice versa. In order to
test whether it holds well, in the present study regression is calculated taking GOP as
dependent variable and ACP as independent variable. In addition DER and CR are taken
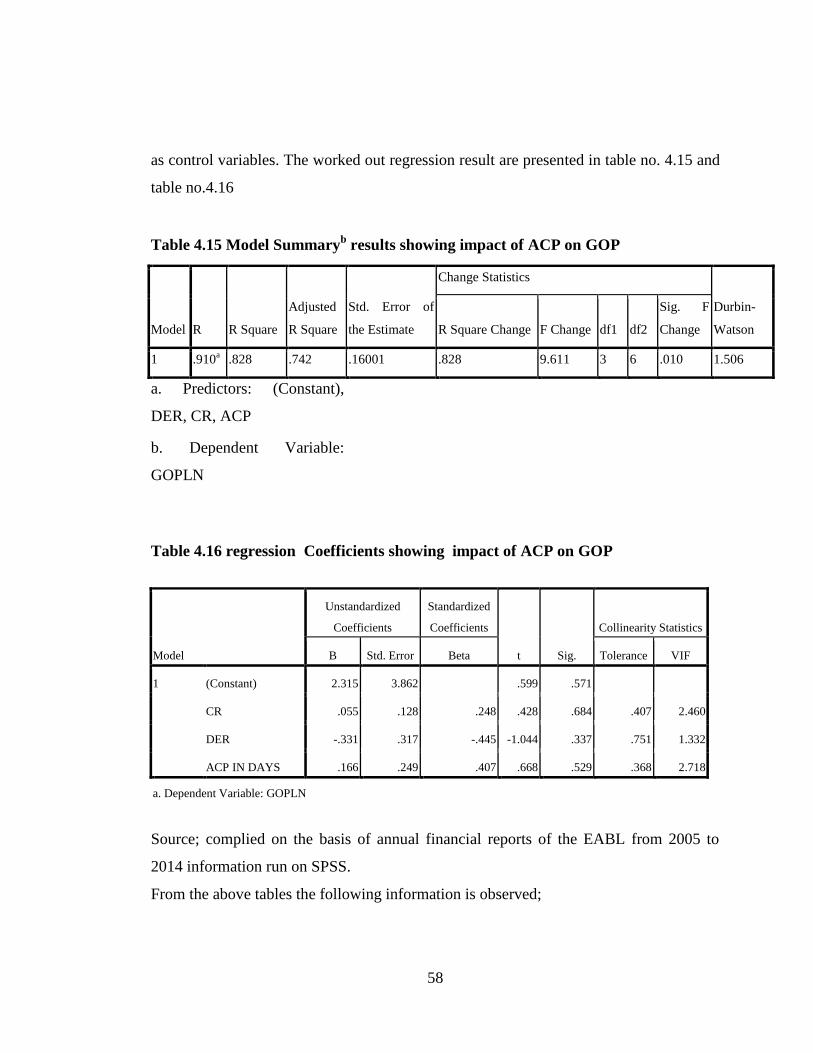
58
as control variables. The worked out regression result are presented in table no. 4.15 and
table no.4.16
Table 4.15 Model Summaryb results showing impact of ACP on GOP
Model R R Square
Adjusted
R Square
Std. Error of
the Estimate
Change Statistics
Durbin-
Watson R Square Change F Change df1 df2
Sig. F
Change
1 .910a .828 .742 .16001 .828 9.611 3 6 .010 1.506
a. Predictors: (Constant),
DER, CR, ACP
b. Dependent Variable:
GOPLN
Table 4.16 regression Coefficients showing impact of ACP on GOP
Model
Unstandardized
Coefficients
Standardized
Coefficients
t Sig.
Collinearity Statistics
B Std. Error Beta Tolerance VIF
1 (Constant) 2.315 3.862 .599 .571
CR .055 .128 .248 .428 .684 .407 2.460
DER -.331 .317 -.445 -1.044 .337 .751 1.332
ACP IN DAYS .166 .249 .407 .668 .529 .368 2.718
a. Dependent Variable: GOPLN
Source; complied on the basis of annual financial reports of the EABL from 2005 to
2014 information run on SPSS.
From the above tables the following information is observed;
59
The adjusted R2
of the model is 74% and the value for the R2 in this model is 82.8%
which explains that 82.8% of the variation in the dependent variable (gross operating
profit) is explained by the independent and control variables. The Durbin Watson test
1.506 which is the within the limits set i.e 0 and 4. It is neither above 4 nor below 0. The
tolerance statistics were 0.368 and the Variance Inflation Factor (VIF) 2.718 .It is
indicating that there were no multi-co linearity problems among the independent
variables in the data. The F test significance value is 0.010 which is below 0.05 and
highly significant. In view of this, the model is considered as significant
The coefficient of average collection period (ACP) is positive with GOP not as
expected (0.166) and is not significant at 0.529, The coefficient of current ratio (CR) is
positive with GOP (0.055) as expected and the relation is not significant at 0.684,
showing that increase of CR leads to the increase of GOP or dec. The coefficient of debt
to equity ratio (DER) is negative with GOP (-0.331) and the relationship is insignificant
at 0.337.
4.4.2.2 The impact of ICP on GOP.
The review of literature revealed that there is negative association between ICP and
profitability indicating increase in ICP leads to the decrease of profitability of the firm
and vice versa. In order to test whether it holds well, in the present study regression is
calculated taking GOP as dependent variable and ICP as independent variable. In
addition DER and CR are taken as control variables. The worked out regression result
are presented in table no. 4.17 and table no 4.18
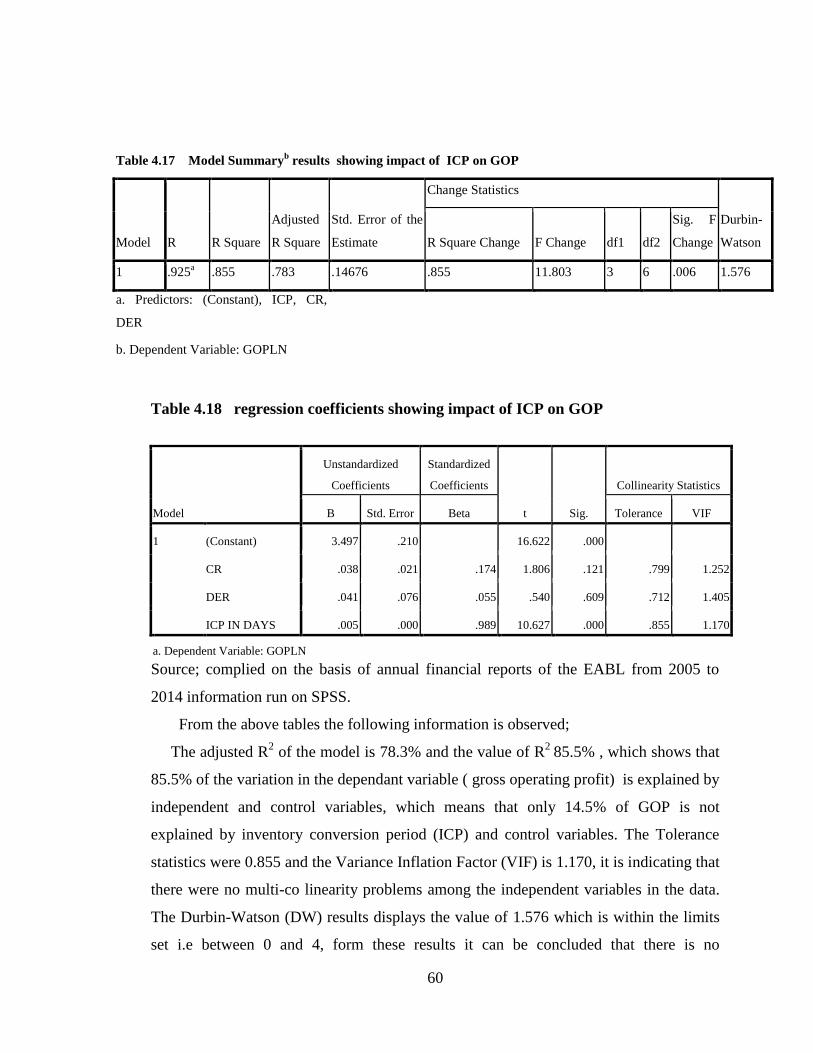
60
Table 4.17 Model Summaryb results showing impact of ICP on GOP
Model R R Square
Adjusted
R Square
Std. Error of the
Estimate
Change Statistics
Durbin-
Watson R Square Change F Change df1 df2
Sig. F
Change
1 .925a .855 .783 .14676 .855 11.803 3 6 .006 1.576
a. Predictors: (Constant), ICP, CR,
DER
b. Dependent Variable: GOPLN
Table 4.18 regression coefficients showing impact of ICP on GOP
Model
Unstandardized
Coefficients
Standardized
Coefficients
t Sig.
Collinearity Statistics
B Std. Error Beta Tolerance VIF
1 (Constant) 3.497 .210 16.622 .000
CR .038 .021 .174 1.806 .121 .799 1.252
DER .041 .076 .055 .540 .609 .712 1.405
ICP IN DAYS .005 .000 .989 10.627 .000 .855 1.170
a. Dependent Variable: GOPLN
Source; complied on the basis of annual financial reports of the EABL from 2005 to
2014 information run on SPSS.
From the above tables the following information is observed;
The adjusted R2 of the model is 78.3% and the value of R
2 85.5% , which shows that
85.5% of the variation in the dependant variable ( gross operating profit) is explained by
independent and control variables, which means that only 14.5% of GOP is not
explained by inventory conversion period (ICP) and control variables. The Tolerance
statistics were 0.855 and the Variance Inflation Factor (VIF) is 1.170, it is indicating that
there were no multi-co linearity problems among the independent variables in the data.
The Durbin-Watson (DW) results displays the value of 1.576 which is within the limits
set i.e between 0 and 4, form these results it can be concluded that there is no
61
autocorrelation among independent variables in the data. The F test significance value is
0.006 which is below 0.05, due to these information the model is good thus it can be
used for regression analysis.
Based on regression coefficients shown in table no.4.18 there is positive association
between ICP and profitability not as expected and it is highly significant at 0.000. it
indicate the influence of ICP on profitability is positive meaning that the increase in
inventory leads to the increase in profitability of the company and vice versa.
The coefficient of current ratio (CR) is positive with GOP (0.038) as expected and is
not significant at 0.121, showing that increase of CR leads to the significant increase of
GOP or decrease in this ratio results to the significant decrease of GOP. The coefficient
of debt to equity ratio (DER) is positive with GOP (0.041) and the relationship is not
significant at 0.609
4.4.2.3 The impact of APP on GOP.
The review of literature revealed that there is positive association between APP and
profitability, indicating increase in APP increases profitability and the decrease of APP
results to the decrease of GOP.In order to test whether it holds good, in the present study
regression is calculated taking GOP as dependent variable and APP as independent
variable. In addition DER and CR are taken as control variables. The worked out
regression result are presented in table no.4.19 and table no.4.20
Table .4.19 Model Summaryb results showing impact of APP on GOP
Model R R Square
Adjusted
R Square
Std. Error of
the Estimate
Change Statistics
Durbin-
Watson R Square Change F Change df1 df2
Sig. F
Change
1 .910a .828 .742 .16001 .828 9.611 3 6 .010 1.511
a. Predictors: (Constant), APP, CR,
DER
b. Dependent Variable: GOPLN
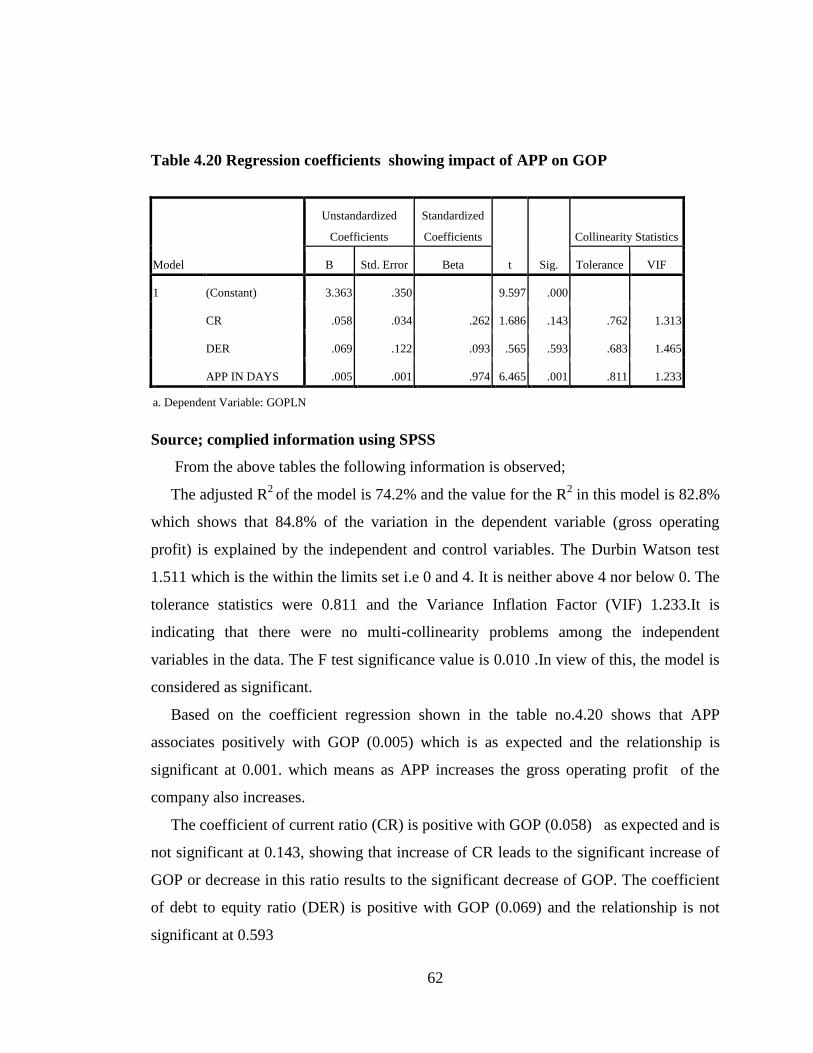
62
Table 4.20 Regression coefficients showing impact of APP on GOP
Model
Unstandardized
Coefficients
Standardized
Coefficients
t Sig.
Collinearity Statistics
B Std. Error Beta Tolerance VIF
1 (Constant) 3.363 .350 9.597 .000
CR .058 .034 .262 1.686 .143 .762 1.313
DER .069 .122 .093 .565 .593 .683 1.465
APP IN DAYS .005 .001 .974 6.465 .001 .811 1.233
a. Dependent Variable: GOPLN
Source; complied information using SPSS
From the above tables the following information is observed;
The adjusted R2
of the model is 74.2% and the value for the R2 in this model is 82.8%
which shows that 84.8% of the variation in the dependent variable (gross operating
profit) is explained by the independent and control variables. The Durbin Watson test
1.511 which is the within the limits set i.e 0 and 4. It is neither above 4 nor below 0. The
tolerance statistics were 0.811 and the Variance Inflation Factor (VIF) 1.233.It is
indicating that there were no multi-collinearity problems among the independent
variables in the data. The F test significance value is 0.010 .In view of this, the model is
considered as significant.
Based on the coefficient regression shown in the table no.4.20 shows that APP
associates positively with GOP (0.005) which is as expected and the relationship is
significant at 0.001. which means as APP increases the gross operating profit of the
company also increases.
The coefficient of current ratio (CR) is positive with GOP (0.058) as expected and is
not significant at 0.143, showing that increase of CR leads to the significant increase of
GOP or decrease in this ratio results to the significant decrease of GOP. The coefficient
of debt to equity ratio (DER) is positive with GOP (0.069) and the relationship is not
significant at 0.593
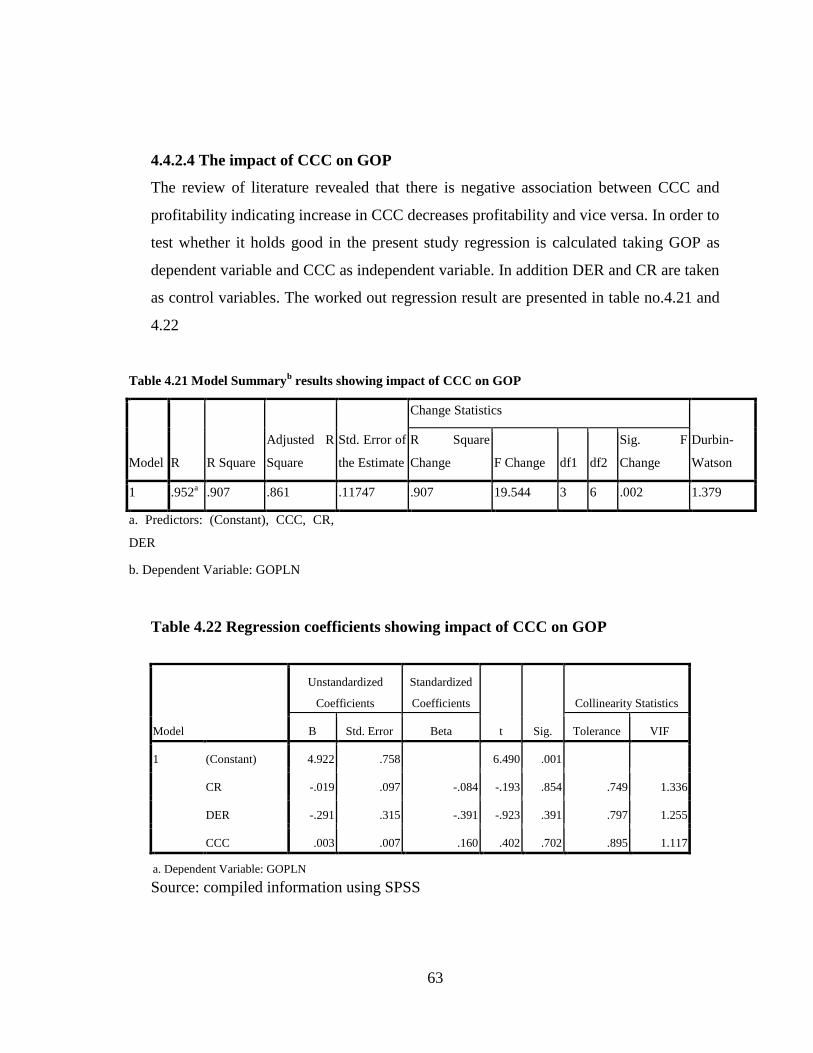
63
4.4.2.4 The impact of CCC on GOP
The review of literature revealed that there is negative association between CCC and
profitability indicating increase in CCC decreases profitability and vice versa. In order to
test whether it holds good in the present study regression is calculated taking GOP as
dependent variable and CCC as independent variable. In addition DER and CR are taken
as control variables. The worked out regression result are presented in table no.4.21 and
4.22
Table 4.21 Model Summaryb results showing impact of CCC on GOP
Model R R Square
Adjusted R
Square
Std. Error of
the Estimate
Change Statistics
Durbin-
Watson
R Square
Change F Change df1 df2
Sig. F
Change
1 .952a .907 .861 .11747 .907 19.544 3 6 .002 1.379
a. Predictors: (Constant), CCC, CR,
DER
b. Dependent Variable: GOPLN
Table 4.22 Regression coefficients showing impact of CCC on GOP
Model
Unstandardized
Coefficients
Standardized
Coefficients
t Sig.
Collinearity Statistics
B Std. Error Beta Tolerance VIF
1 (Constant) 4.922 .758 6.490 .001
CR -.019 .097 -.084 -.193 .854 .749 1.336
DER -.291 .315 -.391 -.923 .391 .797 1.255
CCC .003 .007 .160 .402 .702 .895 1.117
a. Dependent Variable: GOPLN
Source: compiled information using SPSS
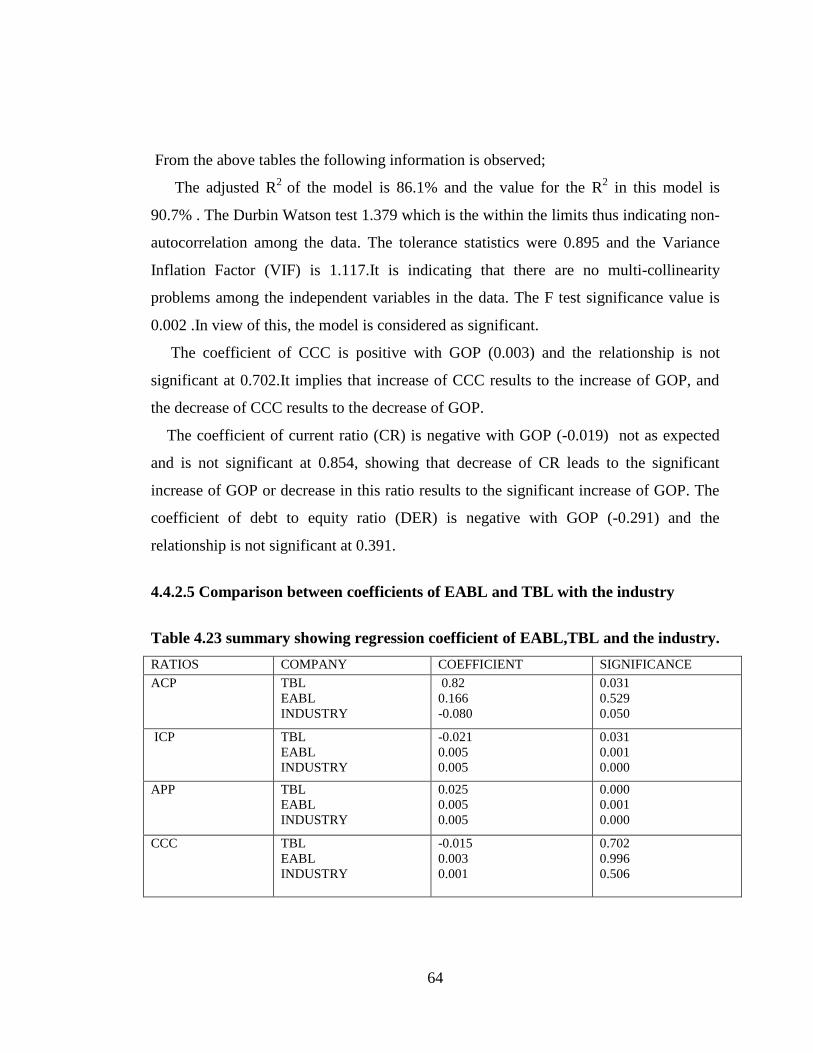
64
From the above tables the following information is observed;
The adjusted R2
of the model is 86.1% and the value for the R2 in this model is
90.7% . The Durbin Watson test 1.379 which is the within the limits thus indicating non-
autocorrelation among the data. The tolerance statistics were 0.895 and the Variance
Inflation Factor (VIF) is 1.117.It is indicating that there are no multi-collinearity
problems among the independent variables in the data. The F test significance value is
0.002 .In view of this, the model is considered as significant.
The coefficient of CCC is positive with GOP (0.003) and the relationship is not
significant at 0.702.It implies that increase of CCC results to the increase of GOP, and
the decrease of CCC results to the decrease of GOP.
The coefficient of current ratio (CR) is negative with GOP (-0.019) not as expected
and is not significant at 0.854, showing that decrease of CR leads to the significant
increase of GOP or decrease in this ratio results to the significant increase of GOP. The
coefficient of debt to equity ratio (DER) is negative with GOP (-0.291) and the
relationship is not significant at 0.391.
4.4.2.5 Comparison between coefficients of EABL and TBL with the industry
Table 4.23 summary showing regression coefficient of EABL,TBL and the industry.
RATIOS COMPANY COEFFICIENT SIGNIFICANCE
ACP
TBL
EABL
INDUSTRY
0.82
0.166
-0.080
0.031
0.529
0.050
ICP
TBL
EABL
INDUSTRY
-0.021
0.005
0.005
0.031
0.001
0.000
APP
TBL
EABL
INDUSTRY
0.025
0.005
0.005
0.000
0.001
0.000
CCC
TBL
EABL
INDUSTRY
-0.015
0.003
0.001
0.702
0.996
0.506
65
From the above table no.4.23 the following information is observed;
The coefficient of ACP for TBL and EABL are positive not as expected (0.82) and
(0.166) respectively, but significant in case of TBL (0.031) only. The coefficient of the
industry is negative as expected (-0.080) and the relationship is significant at 0.050.In
relation to ACP, industry is found to have influence on profitability compared to the
TBL and EABL.
The coefficients of ICP for EABL is (0.005) positive not as expected for TBL is
negative as expected (-0.021) but all are significant at 0.031 and 0.001 respectively.
While in case of the industry the coefficient is positive not as expected but significant at
0.000. The observation shows that for TBL inventory management have influence on
profitability compared to EABL and the industry as whole.
The coefficient of APP for EABL and TBL is positive as expected in case of both
companies TBL(0.025) and 0.005 for EABL, and significant to all companies where
TBL at 0.000 and EABL at 0.001.The coefficient of the industry is positive as expected
and it is significant. Indicating that the increase of APP results to the increase of GOP.
The coefficient of CCC for TBL is -0.015 which is negative as expected and
significant at 0.000 and EABL positive not as expected (0.003) and not significant at
0.702. While for the industry the coefficient of CCC is negative as expected (-0.001) and
not significant at 0.506.
From the above it can be observed that, except APP other independent variable have
positive influence on profitability in some or other company. It may be due to loading of
higher margins in sale price to compensate time value of money, which needs
establishment by separate study.
66
CHAPTER FIVE
DISCUSSION OF THE FINDINGS
5.1 Introduction
The main aim of this chapter is to present the findings observed, discussed and
presented in chapter four relating to the impact of working capital on profitability of the
brewery companies listed in Dar es salaam Stock of Exchange (DSE). The researcher
discuss rational and logic for drawing inferences and establishing proper linkage with
either the data analyzed in the chapter four or with other researchers findings.
5.2 Discussion on correlation results of TBL
The following is the discussion on correlation between components of working capital
management of TBL which are considered as independent variables and gross operating
profit (GOP) which is considered as dependent variable.
The observations from the study show that the correlation between ACP and GOP is
positive not as expected and the relationship is not significant. With these results it can
be said that, in TBL the increase in number of days in collecting receivables results to
the increase in profitability of the company. The finding is not corresponding with the
working capital management practice which suggests the firm to collect their cash
quickly from their debtors, thus it needs another study to establish the reason for the un
expected results.
The correlation between ICP and GOP is negative as expected and the relationship is not
significant. Which mean that the decrease in ICP leads to the increase in gross operating
profit (GOP) of the company, With these results means that as the time taken to convert
raw material into finished goods decreases and time to sell them decreases results to the
increase of profitability of the company, the manager have to strive to convert the raw
material quickly and sell the goods in short period of time in order to make profit. These
67
results correspond with Mansoor and Muhammad (2012) who in their research found
strong negative relationship between ICP and profitability.
The correlation between APP and GOP is positive as expected and the relationship is
significant as per observation from the study, meaning that the more TBL delays to pay
its debts to its creditors the more the profit for the company increases, this holds with the
working capital management practice which emphasizes firms to extend their payments
to their creditors as much they can but ensuring not destroying the image of the
company. These results are the same with Gill, Biger and Mathur (2012) who in their
study obtained the positive relationship between average payment period and
profitability of the company.
Basing on the correlation results for TBL, it is found that there is negative relationship
between Cash Conversion Cycle (CCC) and gross operating profit (GOP) of the
company as expected but the relationship is not significant. This implies that the
decrease in cash conversion cycle leads to the increase in profitability of the firm. These
findings are similar with Niresh,( 2012) and Sighar ,Hashmi and Hussein, (2011) who
found a negative relationship between Cash Conversion Cycle (CCC) and profitability of
the company and contradict with Biger and Mathur , (2012) who found a positive
relationship between CCC and profitability.
5.3 Discussion on correlation results of EABL
Basing on the results after Pearson‟s correlation analysis applied for data to identify the
relationship between variables of working capital management and profitability of
brewery companies listed on Dar es Salaam Stock of Exchange (DSE), the following is
the discussion on correlation between components of working capital management of
EABL which are considered as independent variables and gross operating profit (GOP)
which is considered as dependent variable.
68
The correlation between ACP and GOP is positive not as expected and the relationship
is significant. This means that an increase of number of days that a firm collects its debts
from sales to debtors is affecting the profitability of the company positively. The un
expected results may be due to bad debts, credit policy of the company.
On other hand the observation from the study indicates the correlation between ICP and
GOP is negative as expected and the relation is not significant. This mean that as the ICP
decreases the GOP of the company increases .The results are consistent with Falope and
Alijore (2009) who in their study found there is negative correlation between ICP and
profitability of the company. The results shows that EABL takes few days in converting
its inventory into cash thus affecting positively the profitability of the company which
means that as the days to convert inventory decreases the profitability of the company
increases and vice versa.
The correlation between APP and GOP of EABL is negative not as expected and the
relationship is not significant. The finding shows the decrease in average payment period
(APP) leads to the increase in gross operating profit (GOP) of the company. This may be
due to loading of higher margins in purchase price. Therefore the management of the
company has to find measures in order to bring the relationship between APP and GOP
as expected.
The correlation between CCC and GOP is negative which is as expected and the
relationship is not significant. The findings imply that, the decrease of cash conversion
cycle (CCC) results to the increase in gross operating profit (GOP) of the company and
vice versa. This warrants attention of the management to improve the situation till
significance level.
Generally, based on the correlation results, shows there are significant relationship
between independent variables and GOP of TBL expect ACP which shows that it has no
significant relationship with GOP. While the correlation results of EABL show that
69
many independent variable are not significant and their coefficients are found to be not
expected. Thus the management of EABL and TBL have to make look on the
components of working capital so that may have significant relationship with the gross
operating profit of the company as expected.
5.4 Discussion on results of multiple regressions of the study.
In attempting to find if ACP, ICP, APP and CCC sufficiently explain the variation in the
GOP of brewery companies multiple regression was employed. The following are results
as per observation for each company.
5.4.1 Discussion on impact of components of working capital results on GOP for
TBL.
Assessment is done to find if the ACP, ICP, APP and CCC have impact on GOP of the
company, the following is the discussion on the results of regression as observed.
5.4.1.1 The relationship between Average Collection Period and Gross Operating
profit.
From the observation, the relationship between ACP and GOP is positive and
significant. Meaning that the increase in ACP causes significant increase in gross
operating profit of the company. The results are against the working capital management
practice which suggests the negative relationship between ACP and GOP, meaning that
the firm must ensure that the collection of debts from debtors is done in a short period of
time. Deloof (2003) in his study stated that, managers can increase corporate
profitability by reducing the average collection period, meaning that the longer the
number of days accounts collection outstanding , the greater the chance a company
decrease its profitability. When the company don‟t make proper control of debtors might
experience increase rate of bad debts. But in this case the result is not as expected.
70
5.4.1.2 The relationship between Inventory Conversion Period and Gross
Operating Profit.
The relationship of ICP and GOP is negative and significant as per observation,
implying that the decrease in ICP leads to the increase in GOP. These results are
consistent with Dong (2010) and Ruichao (2013) who also found a strong relationship
between ICP and profitability. Thus in this case the results are as expected.
5.4.1.3 The relationship between Average Payables Period and Gross Operating
Profit.
The coefficient between APP and GOP is positive as expected and the relationship is
significant. This implies that increase in number of days of accounts payables by one
day results to the significant increase of profitability of the company, this may be due
to increase of working capital after the delayed amount being reserved and used in day
to day operation of the firm hence affect positively the profitability of the company. But
the results are contrary with makonnen (2011) and Reheman et al. (2010) who in their
study found the negative relationship between APP and GOP. In this case the findings
are as expected.
5.4.1.4 The relationship between Cash Conversion Cycle and Gross Operating
Profit.
As per observation, the relationship between CCC and GOP is negative as expected. The
results can be interpreted that when cash conversion cycle is reduced the profitability of
the company increases, which implies that the company maintains low investment on
inventories due to high production and sales thus avoiding the costs of overstocking and
their related expenses. The results are in line with the working capital management rule
which suggest the firm not to take more time to convert and sell its products or goods.
The findings are similar with makonnen (2011) and Reheman et al. (2010) who in their
studies found that there is negative relationship between Cash Conversion Cycle and
profitability of the company.
71
5.4.2 Discussion on influence of components of working capital on GOP for EABL
An attempt is done to find if ACP, ICP, APP AND CCC of EABL have impact on the
GOP. The following is the discussion as per observation from the analysis of regression
coefficient table of EABL.
5.4.2.1 The relationship between Average Collection Period and GOP .
The relationship between ACP and GOP is positive not as expected and insignificant.
The findings implies that as the number of days for the firm to receive payment from
credit sales increases the profitability increases, the results are contrary with the working
capital practice which suggest the firm to take few days to collect the payments from
debtors in order to facilitate the profitability of the company. This study is contrary to
Raheman and Nasr (2007) who in their research found a negative relationship between
ACP and GOP.
5.4.2.2 The relationship between Inventory Conversion Period and GOP.
The relationship between ICP and GOP is positive not as expected and insignificant. The
findings imply that as the inventory conversion period (ICP) increases the gross
operating profit of the company also increases. These results are similar with Mathuva
(2010) who also found a positive relationship between ICP and profitability of the
company. The working capital management practice suggests that when the firm
decrease the average time to convert the raw materials into finished goods and sell those
goods in short period of time affects the profitability of the company positively.
5.4.2.3 The relationship between Average Payment Period and GOP.
The regression coefficients show that there exist a positive relationship between APP
and GOP which is as expected and highly significant. This implies that as the company
increases the average period for making payment to the creditors the profitability of the
company increases, the results show that the company take more days to make payment
to its creditors. These results are similar with the working capital management practice
which suggests firms to strive to lag their payments to their creditors as much as it is
72
possible but making sure the business relationship is not destroyed. Rehman and Nasr
(2007) in their study found a positive relationship between accounts payment period and
profitability of the company which is similar with the findings obtained in this study.
5.4.2.4 The relationship between Cash Conversion Cycle and GOP.
The relationship between CCC and GOP as per regression coefficients table is positive
which is not as expected. The findings show that as the cash conversion cycle increases,
the gross operating profit increases. CCC depends on ICP, ACP and APP. This result
may be due the overstocking of inventory, and purchasing in bulk in the period when the
prices are very low. The results are not similar with Gill, Biger and Mathur (2012) who
in their study found a negative relationship between CCC and GOP.
Generally, based on the regression output of these two brewery companies, some other
components of working capital have expected relation with gross operating profit while
some other components of working capital have unexpected, therefore the management
have to make more efforts in managing its working capital in order to improve the
relation between components of working capital and gross operating profit to be as
expected thus increase the profitability of the company.
73
CHAPTER SIX
SUMMARY, CONCLUSSION AND RECOMMENDATION
6.1 Introduction.
This chapter presents briefly the summary of the research undertaken, conclusion and
recommendations based on the study by pinning out the remaining gap related to the
knowledge on this topic of impact of working capital management on profitability of the
brewery companies opening a way for further studies to be undertaken on this topic.
Thus this chapter includes summary of the study, conclusion, recommendations and
suggestions of further studies.
6.2 Summary.
The main objective of the study was to assess and investigate the impact of working
capital management on profitability of brewery companies listed in Dar es Salaam Stock
of Exchange (DSE). In extracting answers for this main objective of the study the
published and audited annual financial reports of these brewery companies were used to
obtain data which are used in the study. The data banks of Dar es Salaam Stock of
Exchange were used to obtain the audited annual financial report of TBL and EABL
which are used in this study. The examination covered the period of 10 years for each
company from 2005 to 2014, thus secondary data was employed. In making analysis
SPSS was used whereby Descriptive statistic, correlation analysis and multiple
regression analysis were employed to make evaluation of independent and dependant
variables if they have core relationship. In this study independent variables are ratios of
components of working capital which are ACP, ICP, APP, and CCC. The dependent
variable is GOP and control variable being current ratio (CR) and debt to equity ratio
(DER).
74
6.3 Conclusion.
The influence of ACP on GOP of TBL and EABL is positive and for the industry is
negative. So the relationship is not as expected in case of TBL and EABL. This may be
due to loading of additional margins in selling price not only to compensate time value
of money but also to increase the profit. So it needs further studies to establish causes of
positive relationship.
The influence of ICP on EABL and industry is positive while in case of TBL is negative.
This shows that EABL and the industry results are against expectation of decrease in
ICP will cause increase in profitability, this may be due to purchasing of inventory in
bulk when prices are very low and keeping for a longer period. Subsequently abnormal
price increase may happen not only the covering of time value of money but also
resulting to additional profit to the company. This needs separate study to establish
causes of positive relationship.
The influence of CCC on GOP in case of EABL, TBL and the industry is positive which
is against expectation. CCC depends on ACP, ICP and APP. This may be happening due
to loading of additional margins in selling price and also overstocking inventory,
purchasing in bulk during low price period. This needs further studies to establish the
causes of positive relationship.
The influence of APP on GOP is positive on EABL and the industry and negative on
TBL. This relationship relating to TBL is against expectation. This may be due to
loading higher margins in purchase prices and not availing cash discounting. This also
needs further studies to establish the causes.
75
6.4 Recommendation.
Basing on the analysis made by the researcher and the discussion presented from the
results of the study, the relationship between many components of working capital and
gross operating profit is not as expected and insignificant. Therefore the management of
these brewery companies has to survey on these components of working capital in order
to ensure that the components of working management relate to gross operating profit of
the company as expected.
The firms should formulate incentives schemes for their management to make effective
and efficiency management of working capital components for the sake of facilitating
the profitability of the company.
6.5 Suggestions for other further studies
The further studies on this study to be made by future researchers have to make look on
the following aspects;
The influence of external factors that affect working capital like interest rate risk,
business risk, competitors risk, political risk, foreign exchange risk and their relative
impact to the profitability of the firms.
The scope of further studies should be extended when conducting research on the similar
topic with different companies from different industries by increasing the years of the
sample of the study.
The study should be done also to other brewery companies which are not registered in
Dar es Salaam Stock of Exchange (DSE). The further research should extend the scope
by extending the coverage number of years for investigation in order to make reasonable
comparison between previous time efficiency and effectiveness of working capital
management and present time on profitability of the company.
The future researches have to perform their investigation to other companies and
business which are not registered in DSE. Means the coming research should
concentrate in investigating on how working capital affect the profitability of the

76
companies which are not listed to the Dar es Stock of Exchange (DSE) like private
business and parastatals which were beyond our limit.
77
REFERENCES
Abdul, R.& Mohamed, N. (2007), “Working Capital Management and Profitability –
Case of Pakistani Firms”, International Review of Business Research
Papers Vol. 3 No.1. pp.279 – 300.
Afza, T. & Nazir, M.,( 2007). “ Is it better to be aggressive or conservative in managing
working capital (P) Ltd.3, no 2, 2007.
Arnold Glen, 2008, corporate financial management, 4th
ed., Pearson education limited.
Brealey & Myers ,(2002), Principles of corporate finance.
chittenden,F.,Pourziouris,P,MICHAELAS, N. ,Financial management and working
capital practice in UK SMEs,Manchester , Manchester Business school,
1998.
Deloof, M. (2003).Does working capital management affects profitability of Belgian
firms? Journal of Business Finance & Accounting, Vol 30 No 3 & 4 pp.
573 – 587.
Deloof, M., and Jegers, M. (1996), “Trade credit, product quality, and intra group trade:
Some European evidence”, Financial Management, Vol. 25, pp. 945-968.
Dong, H.P. & Su, J. (2010). The Relationship between Working Capital Management
and Profitability: A Vietnam Case. International Research Journal of
Finance and Economics, Vol. 49, pp. 59-67.
Fabozzi Frank, j. and Peterson Pamela P., 2003, Financial management and analysis, 2nd
Ed. John Wiley and sons, Inc., publishers, New Jersey Canada.
78
Falope , O I, Ajilore O T.( 2009), “ Working capital management and profitability :
Evidence from panel data analysis of selected quoted companies in
Nigeria. Research Journal of Business Management. Vol. 3.
G. Filbeck and T. Krueger, “Industry Related Differences in Working Capital
Management” Mid-American Journal of Business, vol. 20, no. 2, pp. 11-18,
2005.
Ganesan, V,. (2007) “ Analysis of working capital management efficiency in
telecommunication equipment industry” River academic journal, Vol. 3
Gill, A., Biger, N., Mathur, N.(2010). “ The relationship between working capital
management and profitability: Evidence from the united states” business
and economic journal.
Gitman,l. J. (2009), Principles of managerial finance( 12th
ed.).Bostos,MA; Pearson
prentice Hall.Gujarant, D. 2004, Basic econometrics , 4th
ed.McGraw- Hill
Companies.
Hall, C. (2002). “ Total working Capital Management”, AFP Exchange, Vol. 22, pp26-
32.
Harris, A. (2005), “ working Capital Management :difficult but Rewarding”, Financial
executive Vol. 21.
Hillier, D., Ross, S., Westerfield R,. Jaffe, J. and Jordan, B., Corporate finance, McGraw
–Hill, 2010, 1st European Edition.
http://accounting-simplified.com/financial/ratio-analysis/current.html#definition
http://www.businessdictionary.com/definition/working-capital-
management.html#ixzz3u0Ag6x00
79
Ildiko, O, and Tamas, D., Definition questions( profit-profitability), 4th
Aspects and
visions of Applied Economics and informatics, 2009.15. Gitman, L,J.
(2009) Principal of managerial finance (12th
ed.). bostos, MA; Pearson
Prentice Hall. Gujarati, D.2004, Basic ecometrics, 4th
ed. McGraw- Hill
Companies.
Lazaridis, I. AND Tryfonidis (2006).Relationship between working capital management
and profitability of listed companies in Athens Stock Exchange. Journal of
Financial management and analysis 19 (1):26-35.
Makonnen, mulualem(2011) “ Impact of working capital management on firms‟
profitability. Unpublished thesis, Addis Ababa University ; Ethiopia.
Mansoor, E. and Dr. Muhammad (2012), “ The effect of working capital management on
firm‟s profitability : Evidence from Singapore “ interdisplinary Journal of
contemporary research in business, vol. 4, No 5, pp 472-486.
Mathuva, D M. (2010) “ The influence of working capital management components on
corporate profitability; A survey of Kenyan listed firms”, Research Journal
of Business Management.
Melicher, R.W. and Leach, J.C.,( 2009), 3rd
edition Finance entrepreneurs, McGraw-
Hill.
Meredith,G.G., Financial management of small enterprise, McGraw-Hill,1986.
Petersen M, A and Rajan, R,G, (1994), “The Benefits of Lending Relationships:
Evidence from Small Business Data”, Journal of Finance, 1994, 49(1), pp.
3-37.
80
Raheman, A., and Nasr, M. (2007), Working capital management and profitability- case
of Pakistani firms, International Review of Business Papers, 3(1), pp279 -
300
Robinson, R.B., Jr., Logan, J. E., and Salem, M. Y. (1986), “Strategic versus optional
planning in small retail firms”, American Journal of Small Business, Vol.
10, pp.7-16.24.
Ruichao, Lu (2013). Impact of working capital management on profitability. The case of
Canadian firms, Unpublished master thesis. Saint Mary‟s University;
Canada
Saghir, A., Hashmi, F, M., and Hussain, M., N ( 2011) “ Working capital management
and profitability; Evidence from Pakistan Firms”, Intercdisplinary Journal
of contemporary Research in Business, Vol 3. NO. 8.
Seidman, The Basic of Business Finance, 2004.
Sing, J.P. and Pandey, S. (2008).Impact of working capital management in the
profitability of Hindal co. industries limited [Online]. [Accessed 28th
may2015].
Toomey J. W. (2000), “ Inventory Management : Principles, Concepts and techniques”
kluwer Academic Publishers.
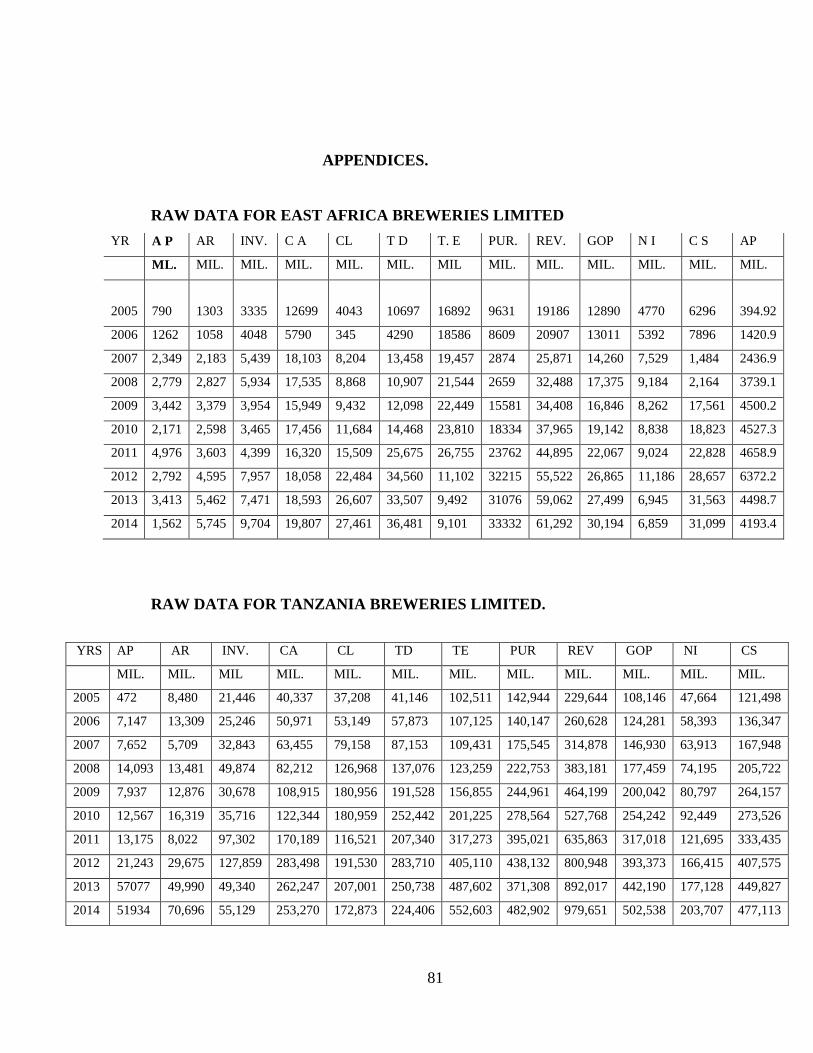
81
APPENDICES.
RAW DATA FOR EAST AFRICA BREWERIES LIMITED
YR A P AR INV. C A CL T D T. E PUR. REV. GOP N I C S AP
ML. MIL. MIL. MIL. MIL. MIL. MIL MIL. MIL. MIL. MIL. MIL. MIL.
2005 790 1303 3335 12699 4043 10697 16892 9631 19186 12890 4770
6296 394.92
2006 1262 1058 4048 5790 345 4290 18586 8609 20907 13011 5392 7896 1420.9
2007 2,349 2,183 5,439 18,103 8,204 13,458 19,457 2874 25,871 14,260 7,529 1,484 2436.9
2008 2,779 2,827 5,934 17,535 8,868 10,907 21,544 2659 32,488 17,375 9,184 2,164 3739.1
2009 3,442 3,379 3,954 15,949 9,432 12,098 22,449 15581 34,408 16,846 8,262 17,561 4500.2
2010 2,171 2,598 3,465 17,456 11,684 14,468 23,810 18334 37,965 19,142 8,838 18,823 4527.3
2011 4,976 3,603 4,399 16,320 15,509 25,675 26,755 23762 44,895 22,067 9,024 22,828 4658.9
2012 2,792 4,595 7,957 18,058 22,484 34,560 11,102 32215 55,522 26,865 11,186 28,657 6372.2
2013 3,413 5,462 7,471 18,593 26,607 33,507 9,492 31076 59,062 27,499 6,945 31,563 4498.7
2014 1,562 5,745 9,704 19,807 27,461 36,481 9,101 33332 61,292 30,194 6,859 31,099 4193.4
RAW DATA FOR TANZANIA BREWERIES LIMITED.
YRS AP AR INV. CA CL TD TE PUR REV GOP NI CS
MIL. MIL. MIL MIL. MIL. MIL. MIL. MIL. MIL. MIL. MIL. MIL.
2005 472 8,480 21,446 40,337 37,208 41,146 102,511 142,944 229,644 108,146 47,664 121,498
2006 7,147 13,309 25,246 50,971 53,149 57,873 107,125 140,147 260,628 124,281 58,393 136,347
2007 7,652 5,709 32,843 63,455 79,158 87,153 109,431 175,545 314,878 146,930 63,913 167,948
2008 14,093 13,481 49,874 82,212 126,968 137,076 123,259 222,753 383,181 177,459 74,195 205,722
2009 7,937 12,876 30,678 108,915 180,956 191,528 156,855 244,961 464,199 200,042 80,797 264,157
2010 12,567 16,319 35,716 122,344 180,959 252,442 201,225 278,564 527,768 254,242 92,449 273,526
2011 13,175 8,022 97,302 170,189 116,521 207,340 317,273 395,021 635,863 317,018 121,695 333,435
2012 21,243 29,675 127,859 283,498 191,530 283,710 405,110 438,132 800,948 393,373 166,415 407,575
2013 57077 49,990 49,340 262,247 207,001 250,738 487,602 371,308 892,017 442,190 177,128 449,827
2014 51934 70,696 55,129 253,270 172,873 224,406 552,603 482,902 979,651 502,538 203,707 477,113
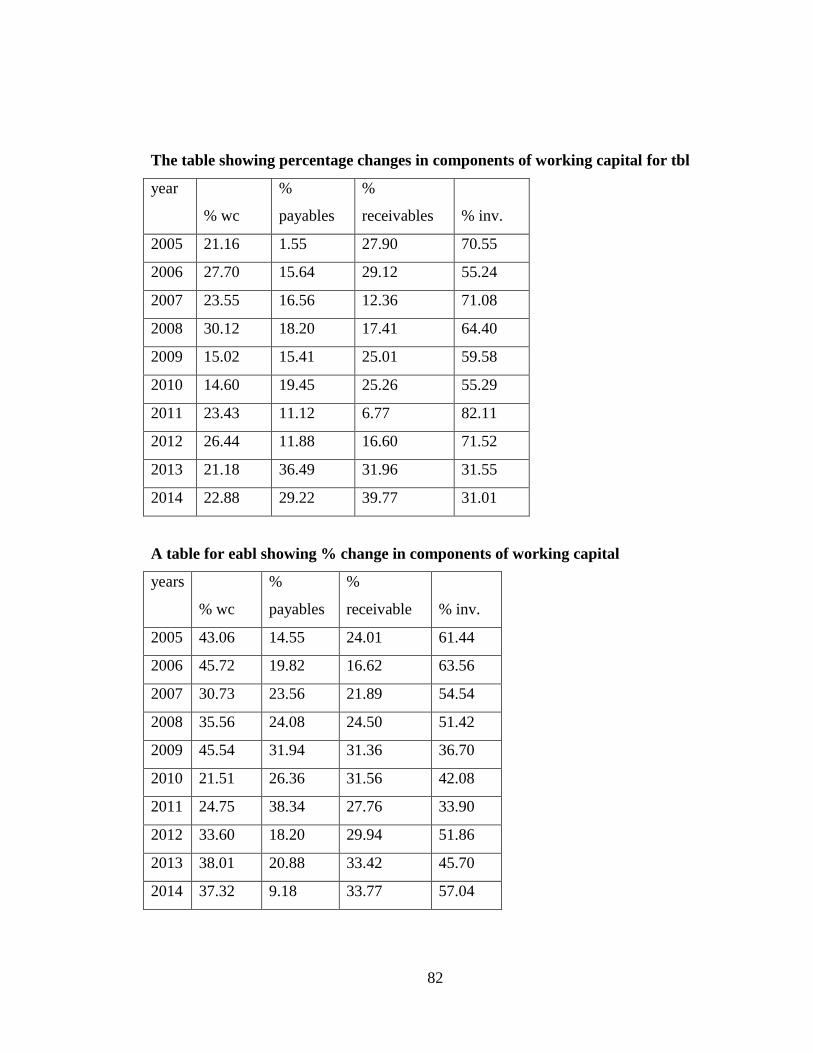
82
The table showing percentage changes in components of working capital for tbl
year
% wc
%
payables
%
receivables % inv.
2005 21.16 1.55 27.90 70.55
2006 27.70 15.64 29.12 55.24
2007 23.55 16.56 12.36 71.08
2008 30.12 18.20 17.41 64.40
2009 15.02 15.41 25.01 59.58
2010 14.60 19.45 25.26 55.29
2011 23.43 11.12 6.77 82.11
2012 26.44 11.88 16.60 71.52
2013 21.18 36.49 31.96 31.55
2014 22.88 29.22 39.77 31.01
A table for eabl showing % change in components of working capital
years
% wc
%
payables
%
receivable % inv.
2005 43.06 14.55 24.01 61.44
2006 45.72 19.82 16.62 63.56
2007 30.73 23.56 21.89 54.54
2008 35.56 24.08 24.50 51.42
2009 45.54 31.94 31.36 36.70
2010 21.51 26.36 31.56 42.08
2011 24.75 38.34 27.76 33.90
2012 33.60 18.20 29.94 51.86
2013 38.01 20.88 33.42 45.70
2014 37.32 9.18 33.77 57.04
Recommended


