HEALTH TECHNOLOGY ASSESSMENTVOLUME 23 ISSUE 13 March 2019
ISSN 1366-5278
DOI 10.3310/hta23130
Three biomarker tests to help diagnose preterm labour: a systematic review and economic evaluation
Jo Varley-Campbell, Rubén Mújica-Mota, Helen Coelho, Neel Ocean, Max Barnish, David Packman, Sophie Dodman, Chris Cooper, Tristan Snowsill, Tracey Kay, Neil Liversedge, Michelle Parr, Lisa Knight, Chris Hyde, Andrew Shennan and Martin Hoyle on behalf of the Peninsula Technology Assessment Group (PenTAG)

Three biomarker tests to help diagnosepreterm labour: a systematic review andeconomic evaluation
Jo Varley-Campbell,1* Rubén Mújica-Mota,1
Helen Coelho,1 Neel Ocean,1 Max Barnish,1
David Packman,1 Sophie Dodman,1 Chris Cooper,1
Tristan Snowsill,1,2 Tracey Kay,3 Neil Liversedge,3
Michelle Parr,4 Lisa Knight,3 Chris Hyde,1
Andrew Shennan5,6 and Martin Hoyle1 on behalf ofthe Peninsula Technology Assessment Group (PenTAG)
1Peninsula Technology Assessment Group (PenTAG), University of Exeter MedicalSchool, University of Exeter, Exeter, UK
2Health Economics Group, University of Exeter Medical School, University of Exeter,Exeter, UK
3Royal Devon and Exeter NHS Foundation Trust, Exeter, UK4Central Manchester University Hospital NHS Foundation Trust, Manchester, UK5Department of Women and Children’s Health, King’s College London, London, UK6Guy’s and St Thomas’ Hospital, London, UK
*Corresponding author
Declared competing interests of authors: Andrew Shennan is an investigator in a number of trials/studies related to preterm birth (the GlaxoSmithKline-funded NEWBORN tocolytic trial, the National Institutefor Health Research-funded PETRA and QUIDS prediction studies, the Guy’s and St Thomas’ charity-fundedEQUIPPT, the preterm management study and Tommy’s charity-funded preterm birth studies). These studiesinclude comparing PartoSure™ (Parsagen Diagnostics Inc., Boston, MA, USA) and the quantitative FetalFibronectin (fFN) Test (Hologic, Inc., Marlborough, MA, USA) and have been supported by free PartoSuresamples from QUIAGEN and received financial support from Hologic, Inc. (fFN), paid to his institution to coverexpenses of this comparison only. He has given lectures to internal staff at BioMedica [Actim® Partus (MedixBiochemica, Espoo, Finland)] and Hologic, Inc. (fFN), in the last 5 years and received financial support to coverexpenses only for this when travelling to the USA and Finland.
Published March 2019DOI: 10.3310/hta23130


This report should be referenced as follows:
Varley-Campbell J, Mújica-Mota R, Coelho H, Ocean N, Barnish M, Packman D, et al. Threebiomarker tests to help diagnose preterm labour: a systematic review and economic evaluation.
Health Technol Assess 2019;23(13).
Health Technology Assessment is indexed and abstracted in Index Medicus/MEDLINE, ExcerptaMedica/EMBASE, Science Citation Index Expanded (SciSearch®) and Current Contents®/Clinical Medicine.


Health Technology Assessment NICE TAR and DAR
ISSN 1366-5278 (Print)
ISSN 2046-4924 (Online)
Impact factor: 4.513
Health Technology Assessment is indexed in MEDLINE, CINAHL, EMBASE, The Cochrane Library and the Clarivate Analytics ScienceCitation Index.
This journal is a member of and subscribes to the principles of the Committee on Publication Ethics (COPE) (www.publicationethics.org/).
Editorial contact: [email protected]
The full HTA archive is freely available to view online at www.journalslibrary.nihr.ac.uk/hta. Print-on-demand copies can be purchased from thereport pages of the NIHR Journals Library website: www.journalslibrary.nihr.ac.uk
Criteria for inclusion in the Health Technology Assessment journalReports are published in Health Technology Assessment (HTA) if (1) they have resulted from work for the HTA programme, and (2) theyare of a sufficiently high scientific quality as assessed by the reviewers and editors.
Reviews in Health Technology Assessment are termed ‘systematic’ when the account of the search appraisal and synthesis methods(to minimise biases and random errors) would, in theory, permit the replication of the review by others.
HTA programmeThe HTA programme, part of the National Institute for Health Research (NIHR), was set up in 1993. It produces high-quality researchinformation on the effectiveness, costs and broader impact of health technologies for those who use, manage and provide care in the NHS.‘Health technologies’ are broadly defined as all interventions used to promote health, prevent and treat disease, and improve rehabilitationand long-term care.
The journal is indexed in NHS Evidence via its abstracts included in MEDLINE and its Technology Assessment Reports inform National Institutefor Health and Care Excellence (NICE) guidance. HTA research is also an important source of evidence for National Screening Committee (NSC)policy decisions.
For more information about the HTA programme please visit the website: http://www.nets.nihr.ac.uk/programmes/hta
This reportThe research reported in this issue of the journal was commissioned and funded by the HTA programme on behalf of NICE as project number17/10/01. The protocol was agreed in July 2017. The assessment report began editorial review in January 2018 and was accepted forpublication in July 2018. The authors have been wholly responsible for all data collection, analysis and interpretation, and for writing up theirwork. The HTA editors and publisher have tried to ensure the accuracy of the authors’ report and would like to thank the reviewers for theirconstructive comments on the draft document. However, they do not accept liability for damages or losses arising from material published inthis report.
This report presents independent research funded by the National Institute for Health Research (NIHR). The views and opinions expressed byauthors in this publication are those of the authors and do not necessarily reflect those of the NHS, the NIHR, NETSCC, the HTA programmeor the Department of Health and Social Care. If there are verbatim quotations included in this publication the views and opinions expressedby the interviewees are those of the interviewees and do not necessarily reflect those of the authors, those of the NHS, the NIHR, NETSCC,the HTA programme or the Department of Health and Social Care.
© Queen’s Printer and Controller of HMSO 2019. This work was produced by Varley-Campbell et al. under the terms of acommissioning contract issued by the Secretary of State for Health and Social Care. This issue may be freely reproduced for thepurposes of private research and study and extracts (or indeed, the full report) may be included in professional journals providedthat suitable acknowledgement is made and the reproduction is not associated with any form of advertising. Applications forcommercial reproduction should be addressed to: NIHR Journals Library, National Institute for Health Research, Evaluation, Trialsand Studies Coordinating Centre, Alpha House, University of Southampton Science Park, Southampton SO16 7NS, UK.
Published by the NIHR Journals Library (www.journalslibrary.nihr.ac.uk), produced by Prepress Projects Ltd, Perth, Scotland(www.prepress-projects.co.uk).

NIHR Journals Library Editor-in-Chief
Professor Ken Stein Chair of HTA and EME Editorial Board and Professor of Public Health, University of Exeter Medical School, UK
NIHR Journals Library Editors
Professor Ken Stein Chair of HTA and EME Editorial Board and Professor of Public Health, University of Exeter Medical School, UK
Professor Andrée Le May Chair of NIHR Journals Library Editorial Group (HS&DR, PGfAR, PHR journals)
Professor Matthias Beck Professor of Management, Cork University Business School, Department of Management and Marketing, University College Cork, Ireland
Dr Tessa Crilly Director, Crystal Blue Consulting Ltd, UK
Dr Eugenia Cronin Senior Scientific Advisor, Wessex Institute, UK
Dr Peter Davidson Consultant Advisor, Wessex Institute, University of Southampton, UK
Ms Tara Lamont Scientific Advisor, NETSCC, UK
Dr Catriona McDaid Senior Research Fellow, York Trials Unit, Department of Health Sciences, University of York, UK
Professor William McGuire Professor of Child Health, Hull York Medical School, University of York, UK
Professor Geoffrey Meads Professor of Wellbeing Research, University of Winchester, UK
Professor John Norrie Chair in Medical Statistics, University of Edinburgh, UK
Professor John Powell Consultant Clinical Adviser, National Institute for Health and Care Excellence (NICE), UK
Professor James Raftery Professor of Health Technology Assessment, Wessex Institute, Faculty of Medicine, University of Southampton, UK
Dr Rob Riemsma Reviews Manager, Kleijnen Systematic Reviews Ltd, UK
Professor Helen Roberts Professor of Child Health Research, UCL Great Ormond Street Institute of Child Health, UK
Professor Jonathan Ross Professor of Sexual Health and HIV, University Hospital Birmingham, UK
Professor Helen Snooks Professor of Health Services Research, Institute of Life Science, College of Medicine, Swansea University, UK
Professor Jim Thornton Professor of Obstetrics and Gynaecology, Faculty of Medicine and Health Sciences, University of Nottingham, UK
Professor Martin Underwood Warwick Clinical Trials Unit, Warwick Medical School, University of Warwick, UK
Please visit the website for a list of editors: www.journalslibrary.nihr.ac.uk/about/editors
Editorial contact: [email protected]
NIHR Journals Library www.journalslibrary.nihr.ac.uk
Abstract
Three biomarker tests to help diagnose preterm labour:a systematic review and economic evaluation
Jo Varley-Campbell,1* Rubén Mújica-Mota,1 Helen Coelho,1
Neel Ocean,1 Max Barnish,1 David Packman,1 Sophie Dodman,1
Chris Cooper,1 Tristan Snowsill,1,2 Tracey Kay,3 Neil Liversedge,3
Michelle Parr,4 Lisa Knight,3 Chris Hyde,1 Andrew Shennan5,6
and Martin Hoyle1 on behalf of the Peninsula Technology AssessmentGroup (PenTAG)
1Peninsula Technology Assessment Group (PenTAG), University of Exeter Medical School,University of Exeter, Exeter, UK
2Health Economics Group, University of Exeter Medical School, University of Exeter, Exeter, UK3Royal Devon and Exeter NHS Foundation Trust, Exeter, UK4Central Manchester University Hospital NHS Foundation Trust, Manchester, UK5Department of Women and Children’s Health, King’s College London, London, UK6Guy’s and St Thomas’ Hospital, London, UK
*Corresponding author [email protected]
Background: Preterm birth may result in short- and long-term health problems for the child. Accuratediagnoses of preterm births could prevent unnecessary (or ensure appropriate) admissions into hospitalsor transfers to specialist units.
Objectives: The purpose of this report is to assess the test accuracy, clinical effectiveness andcost-effectiveness of the diagnostic tests PartoSure™ (Parsagen Diagnostics Inc., Boston, MA, USA),Actim® Partus (Medix Biochemica, Espoo, Finland) and the Rapid Fetal Fibronectin (fFN)® 10Q CassetteKit (Hologic, Inc., Marlborough, MA, USA) at thresholds ≠50 ng/ml [quantitative fFN (qfFN)] for womenpresenting with signs and symptoms of preterm labour relative to fFN at 50 ng/ml.
Methods: Systematic reviews of the published literature were conducted for diagnostic test accuracy (DTA)studies of PartoSure, Actim Partus and qfFN for predicting preterm birth, the clinical effectiveness followingtreatment decisions informed by test results and economic evaluations of the tests. A model-based economicevaluation was also conducted to extrapolate long-term outcomes from the results of the diagnostic tests.The model followed the structure of the model that informed the 2015 National Institute for Health andCare Excellence guidelines on preterm labour diagnosis and treatment, but with antenatal steroids use,as opposed to tocolysis, driving health outcomes.
Results: Twenty studies were identified evaluating DTA against the reference standard of delivery within7 days and seven studies were identified evaluating DTA against the reference standard of delivery within48 hours. Two studies assessed two of the index tests within the same population. One study demonstratedthat depending on the threshold used, qfFN was more or less accurate than Actim Partus, whereas the otherindicated little difference between PartoSure and Actim Partus. No study assessing qfFN and PartoSure in thesame population was identified. The test accuracy results from the other included studies revealed a highlevel of uncertainty, primarily attributable to substantial methodological, clinical and statistical heterogeneitybetween studies. No study compared all three tests simultaneously. No clinical effectiveness studies
DOI: 10.3310/hta23130 HEALTH TECHNOLOGY ASSESSMENT 2019 VOL. 23 NO. 13
© Queen’s Printer and Controller of HMSO 2019. This work was produced by Varley-Campbell et al. under the terms of a commissioning contract issued by the Secretary of Statefor Health and Social Care. This issue may be freely reproduced for the purposes of private research and study and extracts (or indeed, the full report) may be included inprofessional journals provided that suitable acknowledgement is made and the reproduction is not associated with any form of advertising. Applications for commercialreproduction should be addressed to: NIHR Journals Library, National Institute for Health Research, Evaluation, Trials and Studies Coordinating Centre, Alpha House, University ofSouthampton Science Park, Southampton SO16 7NS, UK.
vii

evaluating any of the three biomarker tests were identified. One partial economic evaluation was identifiedfor predicting preterm birth. It assessed the number needed to treat to prevent a respiratory distresssyndrome case with a ‘treat-all’ strategy, relative to testing with qualitative fFN. Because of the lack of data,our de novo model involved the assumption that management of pregnant women fully adhered to theresults of the tests. In the base-case analysis for a woman at 30 weeks’ gestation, Actim Partus had lowerhealth-care costs and fewer quality-adjusted life-years (QALYs) than qfFN at 50 ng/ml, reducing costs at arate of £56,030 per QALY lost compared with qfFN at 50 ng/ml. PartoSure is less costly than Actim Partuswhile being equally effective, but this is based on diagnostic accuracy data from a small study. Treatmentwith qfFN at 200 ng/ml and 500 ng/ml resulted in lower cost savings per QALY lost relative to fFN at 50 ng/mlthan treatment with Actim Partus. In contrast, qfFN at 10 ng/ml increased QALYs, by 0.002, and had a costper QALY gained of £140,267 relative to fFN at 50 ng/ml. Similar qualitative results were obtained for womenpresenting at different gestational ages.
Conclusion: There is a high degree of uncertainty surrounding the test accuracy and cost-effectivenessresults. We are aware of four ongoing UK trials, two of which plan to enrol > 1000 participants.The results of these trials may significantly alter the findings presented here.
Study registration: The study is registered as PROSPERO CRD42017072696.
Funding: The National Institute for Health Research Health Technology Assessment programme.
ABSTRACT
NIHR Journals Library www.journalslibrary.nihr.ac.uk
viii

Contents
List of tables xiii
List of figures xvii
Glossary xix
List of abbreviations xxiii
Plain English summary xxv
Scientific summary xxvii
Chapter 1 Background and definition of the decision problem(s) 1Conditions and aetiologies 1
Aetiology, pathology and prognosis 1Epidemiology 1Incidence and/or prevalence 2Impact of the health problem 2
Current guidelines 2Description of the technologies under assessment 4
Summary of the technologies 4Population 4Current usage in the NHS 4Anticipated costs associated with the intervention 7
Comparators 7Fetal fibronectin used with a threshold of 50 ng/ml 7Clinical assessment of symptoms alone 8
Care pathways 8Tocolytic therapy 8Antenatal corticosteroids 8Magnesium sulphate 9
Outcomes 9
Chapter 2 Assessment of test accuracy 11Methods for reviewing test accuracy 11
Methods of the systematic review 11Results of the systematic review 14
Overview of the quantity and quality of research available 14Description of the included studies 15Description of included participants 26Summary of any treatments given 27Quality appraisal of included studies 29Results of quantitative data synthesis (test accuracy data) 34
Summary 42Data derived from the systematic review of diagnostic test accuracy 42Summary of the data available across the systematic review and overview 44Summary of test accuracy data across the systematic review 45
DOI: 10.3310/hta23130 HEALTH TECHNOLOGY ASSESSMENT 2019 VOL. 23 NO. 13
© Queen’s Printer and Controller of HMSO 2019. This work was produced by Varley-Campbell et al. under the terms of a commissioning contract issued by the Secretary of Statefor Health and Social Care. This issue may be freely reproduced for the purposes of private research and study and extracts (or indeed, the full report) may be included inprofessional journals provided that suitable acknowledgement is made and the reproduction is not associated with any form of advertising. Applications for commercialreproduction should be addressed to: NIHR Journals Library, National Institute for Health Research, Evaluation, Trials and Studies Coordinating Centre, Alpha House, University ofSouthampton Science Park, Southampton SO16 7NS, UK.
ix

Chapter 3 Assessment of clinical effectiveness (end-to-end) studies 47Methods for reviewing effectiveness 47
Identification of studies 47Inclusion and exclusion criteria 47Other methods 48
Results 48Quantity and quality of research available 48Assessment of effectiveness 48
Summary 49
Chapter 4 Data informing the economic modelling 51
Chapter 5 Systematic review of existing cost-effectiveness evidence 53Methods for reviewing economic evaluation studies 53
Identification of studies 53Inclusion and exclusion criteria 53Data extraction strategy 53Critical appraisal strategy 53Methods of data synthesis 53
Results 53Economic evaluation studies 54
Critique 56Summary 58
Observational cost-minimisation studies 58Model-based studies 58
The National Institute for Health and Care Excellence 2015 guidelines model 61Discussion and further research 67
Chapter 6 Independent economic assessment 69Methods 69
Model structure 69Population 71Interventions and comparators 72Perspective, time horizon and discounting 72Model parameters 72Steroid treatment 78Base-case analyses 85Scenario analyses 85Probabilistic sensitivity analyses 85
Results 85Base-case results 85Tornado analysis 87Probabilistic sensitivity analyses 90Scenario analyses 91
Chapter 7 Assessment of factors relevant to the NHS and other parties 93
Chapter 8 Patient and public involvement 95
Chapter 9 Discussion 97Review of test accuracy evidence 97
Strengths 98Weaknesses 98Areas of uncertainty 99
CONTENTS
NIHR Journals Library www.journalslibrary.nihr.ac.uk
x

Review of clinical effectiveness evidence 100Strengths 100Weaknesses 100Areas of uncertainty 101
Review of cost-effectiveness evidence 101Strengths 101Weaknesses 101Areas of uncertainty 102
Independent economic assessment 103Strengths 104Weaknesses 104Areas of uncertainty 105
Other relevant factors 106
Chapter 10 Conclusions 107Suggested research priorities 107
Acknowledgements 109
References 111
Appendix 1 Literature search strategies 123
Appendix 2 Additional details for quality appraisal for the diagnostic testaccuracy review 131
Appendix 3 Supplementary citations and data 135
Appendix 4 Additional information on existing cost-effectiveness studies 169
Appendix 5 Supplementary discussion and tables for the systematic review andselection of utilities 177
Appendix 6 Additional cost-effectiveness results 201
Appendix 7 Additional diagnostic test accuracy data on cervical length 215
DOI: 10.3310/hta23130 HEALTH TECHNOLOGY ASSESSMENT 2019 VOL. 23 NO. 13
© Queen’s Printer and Controller of HMSO 2019. This work was produced by Varley-Campbell et al. under the terms of a commissioning contract issued by the Secretary of Statefor Health and Social Care. This issue may be freely reproduced for the purposes of private research and study and extracts (or indeed, the full report) may be included inprofessional journals provided that suitable acknowledgement is made and the reproduction is not associated with any form of advertising. Applications for commercialreproduction should be addressed to: NIHR Journals Library, National Institute for Health Research, Evaluation, Trials and Studies Coordinating Centre, Alpha House, University ofSouthampton Science Park, Southampton SO16 7NS, UK.
xi


List of tables
TABLE 1 Summary of index tests 5
TABLE 2 Ongoing trials 16
TABLE 3 Study characteristics 17
TABLE 4 Participant characteristics 21
TABLE 5 Quality appraisal: QUADAS-2 30
TABLE 6 Calculated diagnostic accuracy parameters against the 7-dayreference standard 35
TABLE 7 Calculated diagnostic accuracy parameters against the 48-hour deliveryreference standard 41
TABLE 8 Summary of evidence and relative accuracy against the 7-dayreference standard 44
TABLE 9 Summary of test accuracy data from the systematic review 45
TABLE 10 The included cost-effectiveness study 55
TABLE 11 Model parameter values from the NICE guideline model 57
TABLE 12 Modelling studies identified in the systematic review of cost-effectivenessevidence 59
TABLE 13 Key assumptions in the NICE 2015 guidelines model 64
TABLE 14 The CHEERS checklist for the NICE guidelines model 65
TABLE 15 Diagnostic test options compared in cost-effectiveness analyses andtheir sources 73
TABLE 16 Diagnostic accuracy values used in the Peninsula TechnologyAssessment Group model 74
TABLE 17 Baseline risk of neonatal adverse events 77
TABLE 18 Treatment effect of ACSs 79
TABLE 19 Estimated effectiveness values of steroid treatment used in the model 79
TABLE 20 Utilities selected for the economic model 81
TABLE 21 Cost parameter values (2016 prices) 83
TABLE 22 The PenTAG model specifications and assumptions 86
DOI: 10.3310/hta23130 HEALTH TECHNOLOGY ASSESSMENT 2019 VOL. 23 NO. 13
© Queen’s Printer and Controller of HMSO 2019. This work was produced by Varley-Campbell et al. under the terms of a commissioning contract issued by the Secretary of Statefor Health and Social Care. This issue may be freely reproduced for the purposes of private research and study and extracts (or indeed, the full report) may be included inprofessional journals provided that suitable acknowledgement is made and the reproduction is not associated with any form of advertising. Applications for commercialreproduction should be addressed to: NIHR Journals Library, National Institute for Health Research, Evaluation, Trials and Studies Coordinating Centre, Alpha House, University ofSouthampton Science Park, Southampton SO16 7NS, UK.
xiii

TABLE 23 Summary of ICERs for women presenting at 30 weeks’ gestation(at a level 2 hospital) 87
TABLE 24 Fully incremental analysis of ICERs for women presenting at 30 weeks’gestation at a level 2 hospital 88
TABLE 25 Breakdown of base-case results (discounted costs and QALYs) 89
TABLE 26 Incremental cost-effectiveness ratios vs. fFN at 50 ng/ml 92
TABLE 27 Included citations 136
TABLE 28 Alere Inc. (Actim Partus) submitted citations 138
TABLE 29 Hologic, Inc. (fFN) submitted citations 140
TABLE 30 Parsagen Diagnostics Inc. (PartoSure) submitted citations 143
TABLE 31 Studies excluded at full-text review, with reasons 145
TABLE 32 The DTA values for prediction of delivery within 48 hours 166
TABLE 33 The DTA values for prediction of delivery within 7 days 167
TABLE 34 Parameter values in Chuck and Nguyen 171
TABLE 35 Model parameter values in Deshpande et al. 172
TABLE 36 Key parameters from Boyd et al. 172
TABLE 37 Effectiveness parameters based on Mozurkewich et al. 174
TABLE 38 Effectiveness parameters based on van Baaren et al. 175
TABLE 39 Summary of papers from the systematic search, with information onquality of life for preterm children 178
TABLE 40 Secondary sources for utilities (referenced by papers found in thesystematic search) 182
TABLE 41 Summary of papers on quality of life for mothers 184
TABLE 42 Summary of utilities for preterm children 185
TABLE 43 Summary of utilities from secondary sources cited by studies found inthe systematic search 189
TABLE 44 Mapped utilities for the quality of life of mothers 192
TABLE 45 Random-effects GLS estimates of utility on birthweight 196
TABLE 46 Total discounted QALYs for preterm survivors, by gestational age 198
LIST OF TABLES
NIHR Journals Library www.journalslibrary.nihr.ac.uk
xiv

TABLE 47 Total discounted QALY loss for RDS and IVH as used in the economicmodel 199
TABLE 48 Total discounted QALYs for mothers (assuming age at birth of 30 years) 199
TABLE 49 Summary of ICERs for women presenting at 26 weeks’ gestation(level 2 hospital) 201
TABLE 50 Fully incremental analysis of ICERs for women presenting at 26 weeks’gestation (level 2 hospital) 202
TABLE 51 Breakdown of discounted costs and QALYs for women presenting at26 weeks’ gestation 202
TABLE 52 Summary of ICERs for women presenting at 33 weeks’ gestation(level 2 hospital) 203
TABLE 53 Fully incremental analysis of ICERs for women presenting at 33 weeks’gestation (level 2 hospital) 204
TABLE 54 Breakdown of discounted costs and QALYs for women presenting at33 weeks’ gestation 204
TABLE 55 Results for Actim Partus and no testing vs. fFN at 50 ng/ml using datafrom Cooper et al. for women presenting at 30 weeks’ gestation (level 2 hospital) 209
TABLE 56 Results for fFN (various thresholds) vs. fFN at 50 ng/ml using data fromAbbott et al. for women presenting at 30 weeks’ gestation (level 2 hospital) 209
TABLE 57 Results for no testing and Actim Partus vs. fFN at 50 ng/ml using datafrom meta-analysis for women presenting at 30 weeks’ gestation (level 2 hospital) 211
TABLE 58 Incremental cost-effectiveness ratios vs. fFN at 50 ng/ml for womenpresenting at 26 weeks’ gestation (level 2 hospital) 212
TABLE 59 Incremental cost-effectiveness ratios vs. fFN at 50 ng/ml for womenpresenting at 33 weeks’ gestation (level 2 hospital) 213
TABLE 60 Summary of ICERs for a woman presenting at 30 weeks’ gestation(level 2 hospital), including QALY losses to the mother for 10 years in case ofinfant mortality 214
TABLE 61 Summary of ICERs for a woman presenting at 30 weeks’ gestation(level 2 hospital), including lifetime QALY losses to the mother in case ofinfant mortality 214
TABLE 62 Test accuracy results (against preterm birth within 7 days) for indextests, cervical length measurement and fFN at 50 ng/ml 216
TABLE 63 Test accuracy results (against preterm birth within 7 days) for indextests and fFN at 50 ng/ml 218
DOI: 10.3310/hta23130 HEALTH TECHNOLOGY ASSESSMENT 2019 VOL. 23 NO. 13
© Queen’s Printer and Controller of HMSO 2019. This work was produced by Varley-Campbell et al. under the terms of a commissioning contract issued by the Secretary of Statefor Health and Social Care. This issue may be freely reproduced for the purposes of private research and study and extracts (or indeed, the full report) may be included inprofessional journals provided that suitable acknowledgement is made and the reproduction is not associated with any form of advertising. Applications for commercialreproduction should be addressed to: NIHR Journals Library, National Institute for Health Research, Evaluation, Trials and Studies Coordinating Centre, Alpha House, University ofSouthampton Science Park, Southampton SO16 7NS, UK.
xv

TABLE 64 Summary of evidence and relative accuracy against the 7-dayreference standard 223
TABLE 65 Summary table 225
LIST OF TABLES
NIHR Journals Library www.journalslibrary.nihr.ac.uk
xvi

List of figures
FIGURE 1 Diagnosis of preterm labour from section 9 of the 2015 NICE guidanceon preterm labour and birth 3
FIGURE 2 Summary of the selection process 15
FIGURE 3 The ROC plot for Actim Partus against the 7-day reference standard 38
FIGURE 4 The ROC plot for PartoSure against the 7-day reference standard 39
FIGURE 5 The ROC plot for Actim Partus against the 48-hour deliveryreference standard 42
FIGURE 6 The PRISMA flow diagram for the economic evaluation review 54
FIGURE 7 The NICE 2015 guidelines model 62
FIGURE 8 Baseline (without tocolytics) risks in the NICE guideline model 63
FIGURE 9 The Peninsula Technology Assessment Group cost-effectiveness modelstructure of diagnosis and treatment of women with symptoms of preterm labour 70
FIGURE 10 Empirical summary ROC points across evaluated studies (7-day) 76
FIGURE 11 Baseline risks of neonatal adverse events 77
FIGURE 12 Total lifetime QALYs for preterm children by gestational age andhealth state, using age and survival adjustment (solid lines) and NICE’sunadjusted method (dashed lines) 82
FIGURE 13 Incremental costs and benefits of index tests against comparator(fFN at 50 ng/ml) 88
FIGURE 14 Tornado diagram for model parameters with the most influentialvariation in value: PartoSure 90
FIGURE 15 Probabilistic analysis: women presenting at 30 weeks’ gestation 90
FIGURE 16 Decision tree of fFN testing strategy in Chuck and Nguyen 170
FIGURE 17 Model of Rapid fFN testing from Mozurkewich et al. 173
FIGURE 18 Model of fFN diagnostic testing in van Baaren et al. 175
FIGURE 19 Tornado diagram of most influential model parameter values: treat all 205
FIGURE 20 Tornado diagram of most influential model parameter values: fFN at10 ng/ml 206
DOI: 10.3310/hta23130 HEALTH TECHNOLOGY ASSESSMENT 2019 VOL. 23 NO. 13
© Queen’s Printer and Controller of HMSO 2019. This work was produced by Varley-Campbell et al. under the terms of a commissioning contract issued by the Secretary of Statefor Health and Social Care. This issue may be freely reproduced for the purposes of private research and study and extracts (or indeed, the full report) may be included inprofessional journals provided that suitable acknowledgement is made and the reproduction is not associated with any form of advertising. Applications for commercialreproduction should be addressed to: NIHR Journals Library, National Institute for Health Research, Evaluation, Trials and Studies Coordinating Centre, Alpha House, University ofSouthampton Science Park, Southampton SO16 7NS, UK.
xvii

FIGURE 21 Tornado diagram of most influential model parameter values: fFN at200 ng/ml 206
FIGURE 22 Tornado diagram of most influential model parameter values: fFN at500 ng/ml 207
FIGURE 23 Tornado diagram of most influential model parameter values:Actim Partus 207
FIGURE 24 Probabilistic analysis: women presenting at 33 weeks’ gestation 208
FIGURE 25 Probabilistic analysis: women presenting at 26 weeks’ gestation 208
LIST OF FIGURES
NIHR Journals Library www.journalslibrary.nihr.ac.uk
xviii

Glossary
Antenatal corticosteroid therapy Therapy administered to women when preterm delivery is anticipated,to enhance fetal lung maturation. The aim of treatment is to prevent respiratory distress syndrome andreduce mortality and morbidity among preterm infants.
Bronchopulmonary dysplasia A chronic lung disease that affects premature infants requiring oxygentherapy. It commonly occurs secondary to respiratory distress syndrome.
Cervical length Cervical length measurement via transvaginal ultrasound scan is a technique used toassess the risk of preterm delivery in high-risk women or women presenting with signs or symptoms ofpreterm labour. Shortening of the cervical length is correlated with a higher risk of preterm delivery.
Cervical os Opening of the uterine cervix (anatomy). It dilates during childbirth to allow the passageof the baby.
Comparative study A study design that assesses (but does not necessarily directly compare) theperformance of two different diagnostic tests within the same population.
Concordance The proportion of cases in which the result of the test agrees with the clinical outcome.
Diagnostic yield The number of positive results divided by the number of samples.
Fetal fibronectin Adhesion protein that binds the fetal sac to the uterine lining. After 35 weeks’gestation, the protein begins to degrade to prepare for delivery. Detection of fetal fibronectin incervicovaginal secretions earlier than 35 weeks can be used to predict onset of preterm delivery(fetal fibronectin test).
Gestational age The number of completed weeks of pregnancy. This is usually calculated from the firstday of the woman’s last menstrual period or from clinical examination or ultrasonography. Reportedas weeks+days.
Gravidity The number of times a woman has been pregnant.
Iatrogenic delivery A delivery that is medically initiated or accelerated, such as through theadministration of labour-inducing drugs or delivery via caesarean section.
Incremental cost-effectiveness ratio A term used in health economics to compare the difference in thecost and the effectiveness of two interventions/tests:
where C1 = cost of intervention, C0 = cost of control, E1 = effectiveness of intervention andE0 = effectiveness of control.
Intraventricular haemorrhage A condition associated with preterm delivery, characterised by bleedinginto the ventricles of the brain. Severity is categorised by four grades: grades 1 and 2 denote a smalleramount of bleeding and grades 3 and 4 denote more severe bleeding.
Incremental cost-effectiveness ratio = (C1− C0)/(E1− E0), (a)
DOI: 10.3310/hta23130 HEALTH TECHNOLOGY ASSESSMENT 2019 VOL. 23 NO. 13
© Queen’s Printer and Controller of HMSO 2019. This work was produced by Varley-Campbell et al. under the terms of a commissioning contract issued by the Secretary of Statefor Health and Social Care. This issue may be freely reproduced for the purposes of private research and study and extracts (or indeed, the full report) may be included inprofessional journals provided that suitable acknowledgement is made and the reproduction is not associated with any form of advertising. Applications for commercialreproduction should be addressed to: NIHR Journals Library, National Institute for Health Research, Evaluation, Trials and Studies Coordinating Centre, Alpha House, University ofSouthampton Science Park, Southampton SO16 7NS, UK.
xix

Likelihood ratio In this study, the likelihood of a given test result in a patient who has a preterm deliverycompared with the likelihood of the same result in a patient who does not deliver preterm.
Positive likelihood ratio: how much more often a positive test result occurs in people who deliver pretermthan in those who do not:
Negative likelihood ratio: how much less likely a negative result is in people with preterm delivery than inthose without preterm delivery:
Meta-analysis A statistical technique that combines data from various studies evaluating the same indextest to calculate pooled diagnostic accuracy estimates.
Multiple gestation pregnancy A pregnancy in which the number of fetuses exceeds one.
Negative predictive value In this study, the proportion of people with a negative result who will notdeliver preterm (within 48 hours or 7 days):
Parity The number of times a woman has carried a pregnancy to a viable gestation.
Phosphorylated insulin-like growth factor-binding protein-1 A protein produced by decidual cellsthat leaks into cervical secretions when delivery is imminent and can be used to predict the onset ofpreterm labour [Actim® Partus (Medix Biochemica, Espoo, Finland)].
Placental alpha microglobulin-1 This protein is secreted by the decidual cells into the amniotic fluidthroughout pregnancy. This protein can be detected in cervicovaginal secretions when delivery is imminent[PartoSure™ (Parsagen Diagnostics Inc., Boston, MA, USA) test].
Positive predictive value In this study, the proportion of people with a positive result who will deliverpreterm (within 48 hours or 7 days):
Preterm birth/delivery The delivery of a live baby before 37+ 0 weeks’ gestational age: < 28 weeks’gestational age = extremely preterm, ≥ 28 weeks’ and < 32 weeks’ gestational age = very preterm and≥ 32 weeks’ and < 37 weeks’ gestational age = moderate to late preterm.
Preterm premature rupture of membranes Premature (< 37 weeks’ gestation) rupture of the amnioticsac surrounding the fetus before the onset of established labour. Women experiencing preterm prematurerupture of membranes are at increased risk of amniotic infection and preterm delivery.
Positive likelihood ratio =P(Test + ve j preterm)
P(Test + ve j not preterm)=
Sensitivity1 − Specificity
. (b)
Negative likelihood ratio =P(Test − ve j preterm)
P(Test − ve j not preterm)=1−SensitivitySpecificity
. (c)
Negative predictive value = true negative / (true negative + false negative). (d)
Positive predictive value = true positive / (true positive + false positive). (e)
GLOSSARY
NIHR Journals Library www.journalslibrary.nihr.ac.uk
xx

Prevalence In this study, the proportion of women actually delivering preterm (within 48 hours or 7 days).
Quality-adjusted life-year A measure of disease burden that combines length and quality of life.
Receiver operating characteristic plot A graphical depiction of diagnostic test accuracy data for allincluded studies.
Reference standard The best diagnostic test currently available, against which an index test is assessed.Owing to the predictive nature of the index tests in this study, the reference standard for all includedstudies was preterm delivery within 48 hours or 7 days.
Respiratory distress syndrome A breathing disorder that commonly affects premature babies and isattributable to insufficient surfactant production in immature lungs.
Sensitivity The ability of a diagnostic test to correctly identify women in whom delivery is imminent(within 48 hours or 7 days):
Single-gate study A study design in which participants’ disease statuses are unknown and the index testresult is evaluated against the reference standard to confirm the diagnosis.
Specificity In this study, the ability of a diagnostic test to correctly identify women for whom delivery isnot imminent (within 48 hours or 7 days).
Test failure The rate of non-informative test results.
Time to test The time required to obtain test results.
Tocolytic therapy Drugs administered to delay the onset of established preterm delivery to allow timefor in utero transfers. Tocolytic therapy was previously used to allow time to complete corticosteroidadministration; however, this is no longer recommended practice.
Sensitivity = true positive / (true positive + false negative). (f)
Specificity = true negative / (true negative + false positive). (g)
DOI: 10.3310/hta23130 HEALTH TECHNOLOGY ASSESSMENT 2019 VOL. 23 NO. 13
© Queen’s Printer and Controller of HMSO 2019. This work was produced by Varley-Campbell et al. under the terms of a commissioning contract issued by the Secretary of Statefor Health and Social Care. This issue may be freely reproduced for the purposes of private research and study and extracts (or indeed, the full report) may be included inprofessional journals provided that suitable acknowledgement is made and the reproduction is not associated with any form of advertising. Applications for commercialreproduction should be addressed to: NIHR Journals Library, National Institute for Health Research, Evaluation, Trials and Studies Coordinating Centre, Alpha House, University ofSouthampton Science Park, Southampton SO16 7NS, UK.
xxi


List of abbreviations
ACS antenatal corticosteroid
AG assessment group
APOSTEL-1 Assessment of Perinatal Outcomeafter Sustained Tocolysis inEarly Labour
BAPM British Association of PerinatalMedicine
BMI body mass index
BNF British National Formulary
CDC Centers for Disease Controland Prevention
CENTRAL Cochrane Central Register ofControlled Trials
CHEERS Consolidated Health EconomicEvaluation Reporting Standards
CI confidence interval
CINAHL Cumulative Index to Nursing andAllied Health Literature
DARE Database of Abstracts of Reviewsof Effects
DTA diagnostic test accuracy
ELISA enzyme-linked immunosorbentassay
EPICE Effective Perinatal Intensive Carein Europe
EQ-5D EuroQol-5 Dimensions
fFN fetal fibronectin
FPR false-positive rate
GBP Great British pounds
GLS generalised least squares
HRG Healthcare Resource Group
HTA Health Technology Assessment
HUI Health Utilities Index
ICER incremental cost-effectivenessratio
ICH intracranial haemorrhage
ICU intensive care unit
IQR interquartile range
ISRCTN International Standard RandomisedControlled Trial Number
IVH intraventricular haemorrhage
LR likelihood ratio
LR– likelihood ratio for a negativetest result
LR+ likelihood ratio for a positivetest result
MAPP-QOL Maternal Postpartum Quality of Life
MLE maximum likelihood estimation
NHS EED NHS Economic Evaluation Database
NICE National Institute for Health andCare Excellence
NICU neonatal intensive care unit
NNAP National Neonatal AuditProgramme
NPV negative predictive value
OLS ordinary least squares
ONS Office for National Statistics
OR odds ratio
PAMG-1 placental alpha microglobulin-1
PenTAG Peninsula Technology AssessmentGroup
ph(IGFBP-1) phosphorylated insulin-like growthfactor-binding protein-1
PPROM Preterm Premature Rupture ofMembranes
PPV positive predictive value
PRISMA Preferred Reporting Items forSystematic Reviews andMeta-Analyses
PVL periventricular leukomalacia
QALY quality-adjusted life-year
qfFN quantitative fetal fibronectin
RCOG Royal College of Obstetriciansand Gynaecologists
DOI: 10.3310/hta23130 HEALTH TECHNOLOGY ASSESSMENT 2019 VOL. 23 NO. 13
© Queen’s Printer and Controller of HMSO 2019. This work was produced by Varley-Campbell et al. under the terms of a commissioning contract issued by the Secretary of Statefor Health and Social Care. This issue may be freely reproduced for the purposes of private research and study and extracts (or indeed, the full report) may be included inprofessional journals provided that suitable acknowledgement is made and the reproduction is not associated with any form of advertising. Applications for commercialreproduction should be addressed to: NIHR Journals Library, National Institute for Health Research, Evaluation, Trials and Studies Coordinating Centre, Alpha House, University ofSouthampton Science Park, Southampton SO16 7NS, UK.
xxiii

RCT randomised controlled trial
RDS respiratory distress syndrome
ROC receiver operating characteristic
SD standard deviation
SF-36 Short Form questionnaire-36 items
VAT value-added tax
WHO World Health Organization
Note
This monograph is based on the Technology Assessment Report produced for NICE. The full
report contained a considerable number of data that were deemed confidential. The full
report was used by the Appraisal Committee at NICE in their deliberations. The full report
with each piece of confidential data removed and replaced by the statement ‘confidential
information (or data) removed’ is available on the NICE website: www.nice.org.uk.
The present monograph presents as full a version of the report as is possible while retaining
readability, but some sections, sentences, tables and figures have been removed. Readers
should bear in mind that the discussion, conclusions and implications for practice and research
are based on all the data considered in the original full NICE report.
LIST OF ABBREVIATIONS
NIHR Journals Library www.journalslibrary.nihr.ac.uk
xxiv

Plain English summary
Infants may suffer from health problems if they are born early. If a mother has symptoms of labourbefore her baby is due, a test could be used to predict if the symptoms are real or a false alarm. A test
could help the doctor to decide whether the mother needs treatment or to move to a specialist hospital orif she could be sent home (if it is a false alarm).
Our report compares three tests [PartoSure™ (Parsagen Diagnostics Inc., Boston, MA, USA), Actim® Partus(Medix Biochemica, Espoo, Finland) and the Fetal Fibronectin (fFN) Test (Hologic, Inc., Marlborough, MA,USA)] on how well they predict an early birth and how the costs and the long-term health outcomesof the child compare between and among tests.
All the published literature reporting the accuracy of the three tests and their costs was reviewed.
We developed a new cost-effectiveness model, which estimated the long-term health outcomes of thechild based on the test results.
Twenty of the studies reviewed looked at how good the tests were at predicting an early birth within thenext 7 days, and six looked at predicting birth within 48 hours. The designs of the studies and the womentaking part in the studies varied greatly. This meant that comparing the accuracy of the tests was verydifficult and it would be unfair to decide which test was the best.
Our model suggested no firm conclusions for the cost-effectiveness of fFN compared with Actim Partus.PartoSure appears to be less costly than Actim Partus and equally good at predicting preterm birth, butthis is based on a study of very few patients. There were no data that allowed us to compare all threetests together.
The accuracy of the results is uncertain, mainly because all the studies are very different. We are aware offour related UK trials that are currently ongoing that plan to include large numbers of women.
DOI: 10.3310/hta23130 HEALTH TECHNOLOGY ASSESSMENT 2019 VOL. 23 NO. 13
© Queen’s Printer and Controller of HMSO 2019. This work was produced by Varley-Campbell et al. under the terms of a commissioning contract issued by the Secretary of Statefor Health and Social Care. This issue may be freely reproduced for the purposes of private research and study and extracts (or indeed, the full report) may be included inprofessional journals provided that suitable acknowledgement is made and the reproduction is not associated with any form of advertising. Applications for commercialreproduction should be addressed to: NIHR Journals Library, National Institute for Health Research, Evaluation, Trials and Studies Coordinating Centre, Alpha House, University ofSouthampton Science Park, Southampton SO16 7NS, UK.
xxv

Scientific summary
Background
Preterm (premature) birth, as defined by the World Health Organization, refers to birth of alive baby before37 weeks of gestation. Approximately 8% of births in England and Wales are premature. Preterm birth canresult in serious short-term health issues for the infant, including difficulties with breathing [respiratorydistress syndrome (RDS)] and feeding and increased risk of infections and bleeding within the brain[intraventricular haemorrhage (IVH)]. Moreover, long-term problems include an increased risk of cerebralpalsy, cognitive and visual impairment and respiratory illnesses.
Current National Institute for Health and Care Excellence (NICE) guidelines (published in 2015) recommendthat women presenting with symptoms of preterm labour who have intact membranes should undergo aclinical assessment. If the clinical assessment suggests that the woman is in suspected preterm labour andshe is ≤ 29+ 6 weeks pregnant, treatment for preterm labour is recommended. If the clinical assessmentsuggests that the woman is in suspected preterm labour and she is ≥ 30+0 weeks pregnant, then thefollowing tests should be conducted:
1. a transvaginal ultrasound scan measurement of cervical length (positive if < 15 mm)2. if transvaginal ultrasound scan measurement of cervical length is unavailable or unacceptable, a fetal
fibronectin (fFN) test (positive if concentration is ≥ 50 ng/ml).
Accurate diagnoses of preterm births could prevent unnecessary (or ensure appropriate) admissions intohospitals or transfers to specialist units.
Objectives
The purpose of this report is to assess the following three biomarker diagnostic tests for their test accuracy,clinical effectiveness and cost-effectiveness:
1. PartoSure™ (Parsagen Diagnostics Inc., Boston, MA, USA) – a point-of-care dipstick test that detectsplacental alpha microglobulin-1 (PAMG-1) in vaginal secretions
2. Actim® Partus (Medix Biochemica, Espoo, Finland; distributed by Alere Inc.) – a point-of-care dipsticktest that detects phosphorylated insulin-like growth factor-binding protein-1 [ph(IGFBP-1)] incervical secretions
3. Rapid fFN® 10Q Cassette Kit (Hologic, Inc., Marlborough, MA, USA) [referred to in this report asquantitative fFN (qfFN)] used with a threshold ≠50 ng/ml – a point-of-care quantitative test thatdetects the concentration of fFN in cervicovaginal fluid.
This assessment comprises three systematic reviews of published literature corresponding to:
l diagnostic test accuracy (DTA) studies of the biomarker tests in symptomatic women withintact membranes
l clinical effectiveness (end-to-end) studies of the biomarker tests for symptomatic women withintact membranes
l economic evaluations of the biomarker tests for predicting preterm birth for symptomatic women withintact membranes.
In addition to these reviews, an independent economic evaluation was conducted.
DOI: 10.3310/hta23130 HEALTH TECHNOLOGY ASSESSMENT 2019 VOL. 23 NO. 13
© Queen’s Printer and Controller of HMSO 2019. This work was produced by Varley-Campbell et al. under the terms of a commissioning contract issued by the Secretary of Statefor Health and Social Care. This issue may be freely reproduced for the purposes of private research and study and extracts (or indeed, the full report) may be included inprofessional journals provided that suitable acknowledgement is made and the reproduction is not associated with any form of advertising. Applications for commercialreproduction should be addressed to: NIHR Journals Library, National Institute for Health Research, Evaluation, Trials and Studies Coordinating Centre, Alpha House, University ofSouthampton Science Park, Southampton SO16 7NS, UK.
xxvii

Review of test accuracy
MethodsA systematic review was undertaken to assess the DTA of PartoSure, Actim Partus and qfFN. Studieswere identified by searching seven bibliographic databases, searching trial registries, web searching andadditional supplementary search methods. Studies were selected if they met the following criteria:
l population – symptomatic women with intact amniotic membranesl index tests – PartoSure, Actim Partus and qfFN at thresholds ≠50 ng/mll reference standards – preterm delivery within 48 hours or within 7 daysl comparators – clinical assessment of symptoms alone, qualitative fFN, or qfFN at a threshold of 50 ng/mll outcomes – primarily sensitivity, specificity, positive predictive value and negative predictive value.
Titles and abstracts were independently double-screened for inclusion and disagreements were resolvedby discussion. Studies meeting the inclusion criteria at the title and abstract stage were double-screened asfull texts.
The methodological quality of each included study was assessed using QUADAS-2, data were extracted,tabulated and narratively synthesised. When the data allowed, summary receiver operating characteristicplots were generated and meta-analyses were conducted.
ResultsTwenty studies met the inclusion criteria: 16 studies assessed Actim Partus, four assessed PartoSure andtwo assessed qfFN.
Sufficient evidence for pooling the test accuracy data was available only for Actim Partus and PartoSureagainst the 7-day reference standard and for Actim Partus against the 48-hour reference standard.However, there was substantial methodological, clinical and statistical heterogeneity between studies,raising considerable uncertainty about the most valid estimate of accuracy for each index test.
Studies offering the greatest certainty when comparing tests were those that assessed two or moredifferent tests within the same population. We identified two such studies. In the first study, depending onthe threshold used, qfFN was more or less sensitive and specific than Actim Partus. In the second study,there was little difference between the sensitivity and specificity of PartoSure and Actim Partus. No studiesassessed qfFN and PartoSure within the same population.
When looking at all the studies identified for each of the tests and the ranges of results, the magnitudeof the substantial heterogeneity between the studies is clearly apparent. Against the 7-day referencestandard for Actim Partus (n = 16 studies), the study with the best overall sensitivity and specificity resultshad sensitivity of 94.7% [95% confidence interval (CI) 89.9% to 97.7%] and specificity of 92.4% (95% CI88.9% to 95.1%), whereas the study reporting the worst results had sensitivity of 33.3% (95% CI 4.3%to 77.7%) and specificity of 74.1% (95% CI 69.1% to 78.6%). For PartoSure (n = 4 studies), the studywith the best overall sensitivity and specificity results had sensitivity of 100.0% (95% CI 73.5% to100.0%) and specificity of 95.4% (95% CI 88.6% to 98.7%). The study reporting the worst results hadsensitivity of 0.0% (95% CI 0.0% to 97.5%) and specificity of 97.5% (95% CI 96.8% to 99.9%); thelow sensitivity reported in that study is attributable to only one woman delivering preterm (within 7 days)and her testing (falsely) negative within the study sample of size 41. fFN at a threshold of 10 ng/ml (n = 2studies) had a sensitivity range of 93.8% (95% CI 82.8% to 98.7%) to 95.7% (95% CI 87.8% to 99.1%)and a specificity range of 32.2% (95% CI 27.7% to 37.0%) to 42.3% (95% CI 36.5% to 48.4%), at athreshold of 200 ng/ml, sensitivity ranged from 70.8% (95% CI 55.9% to 83.0%) to 71.0% (95% CI58.8% to 81.3%) and specificity ranged from 78.6% (95% CI 74.3% to 82.5%) to 83.6% (95% CI78.8% to 87.8%), and at a threshold of 500 ng/ml, sensitivity ranged from 29.2% (95% CI 17.0% to44.1%) to 42.0% (95% CI 30.2% to 54.5%) and specificity ranged from 94.3% (95% CI 91.6% to
SCIENTIFIC SUMMARY
NIHR Journals Library www.journalslibrary.nihr.ac.uk
xxviii
96.4%) to 95.7% (95% CI 92.7% to 97.8%). Given the large ranges between studies assessing the sametest and the significant overlapping of CIs, it would be premature to attempt to deduce which test wassuperior against the 7-day reference standard.
We were only able to assess Actim Partus (n = 6 studies) and PartoSure (n = 1 study) against the 48-hourreference standard, because no studies were identified that assessed qfFN. Similar to the 7-day results,accuracy results for Actim Partus varied substantially across studies. Given also that there was only onePartoSure study, it would be premature to attempt to deduce which test was superior against the 48-hourreference standard.
Review of clinical effectiveness (end-to-end) studies
MethodsThe same literature search and screening methods were used as for the review of DTA to identifyrandomised controlled or controlled studies of the tests (PartoSure, Actim Partus or fFN at thresholds≠50 ng/ml). Studies could compare the tests with each other or with fFN at a threshold of 50 ng/ml,or with clinical assessment of symptoms alone. Clinical outcomes were sought.
ResultsNo eligible studies were identified.
Review of economic evaluations
A systematic review was undertaken to identify previous economic evaluations of PartoSure, Actim Partusand qfFN. The methodology was identical to that used for the systematic review of test accuracy (describedabove). From 2252 records, 63 full texts were assessed for eligibility. Only one suitable (but unpublished)study was identified; that study modelled the cost-effectiveness of a ‘treat-all’ strategy, relative to testingwith qualitative fFN to determine treatment. Based on the findings of that study, we calculated that theincremental cost-effectiveness ratio (ICER) of treating all suspected cases of preterm labour with antenatalcorticosteroids (ACSs) is £20,942 per quality-adjusted life-year (QALY) gained.
This identified study also compared the use of four different qfFN thresholds (10, 50, 200 and 500 ng/ml).Based on the results, we also calculated that testing at 200 ng/ml dominates testing at lower thresholds,owing to treatment and health-care costs saved. However, the ICER of testing at 200 ng/ml, relative to ahigher threshold of 500 ng/ml, was found to be £10,415 per QALY gained. Therefore, our calculationsmay support the study authors’ conclusions that using a 200-ng/ml threshold for qfFN was the optimaltesting threshold. However, owing to the low number of false-negative cases in the study, there is a highlevel of uncertainty in their results.
To provide a more thorough examination of the evidence on modelling approaches, studies that modelleddiagnostic interventions for suspected preterm labour were also reviewed. Six different model structureswere identified, and all utilised a decision tree. The only cost–utility model identified was developed forthe 2015 NICE guidelines for preterm labour. In addition to the decision tree structure, this model alsoextrapolated diagnostic results to obtain long-term health outcomes for the child. The remaining studieswere either cost-minimisation or cost-effectiveness analyses.
Other major design aspects in which the six models differed were:
l length of time horizonl assumptions surrounding adherence to treatment following a particular test resultl type of treatment administered.
DOI: 10.3310/hta23130 HEALTH TECHNOLOGY ASSESSMENT 2019 VOL. 23 NO. 13
© Queen’s Printer and Controller of HMSO 2019. This work was produced by Varley-Campbell et al. under the terms of a commissioning contract issued by the Secretary of Statefor Health and Social Care. This issue may be freely reproduced for the purposes of private research and study and extracts (or indeed, the full report) may be included inprofessional journals provided that suitable acknowledgement is made and the reproduction is not associated with any form of advertising. Applications for commercialreproduction should be addressed to: NIHR Journals Library, National Institute for Health Research, Evaluation, Trials and Studies Coordinating Centre, Alpha House, University ofSouthampton Science Park, Southampton SO16 7NS, UK.
xxix
Two studies conducted cost minimisation analyses (i.e. did not consider effectiveness in terms of quantityor quality of life). The first was a Canadian study that found that testing with fFN added total costs ofapproximately US$4M, relative to no testing. The second was a UK study that compared clinical examinationalone with clinical examination with a fFN test. This study found that using fFN saved the NHS £23.88 perpatient, with the additional test costs offset by the savings in hospital resource costs being resulting withfrom treating fewer women.
Three studies provided cost-effectiveness analyses. The first (in the UK) compared testing with fFN witha ‘treat-all’ strategy. This model was unique in allowing for < 100% admission following a positive testresult. However, it did not consider outcomes for false positives, or compute results based on gestationalage. The second study (in the USA) found that treating all patients had incremental costs of US$433,000per case of RDS avoided and US$1,300,000 per neonatal life saved relative to fFN (1999 prices). It differedfrom other models by explicitly modelling preterm birth within 48 hours of testing. The third study (in theNetherlands) measured a variety of adverse outcomes as a composite measure, but only up until time ofdischarge (or death).
The 2015 NICE guidelines model presented a ‘what if?’ analysis of various testing strategies against a‘treat-all’ approach. This involved varying the sensitivity and specificity of a hypothetical test to find theoptimal values at which a test would be cost-effective, given a £20,000 per QALY threshold. The modelwas unique in measuring long-term outcomes by gestational age. We comment in detail on NICE’smodel in this report and conclude that it provides the most suitable structure for the decision problem onwhich to base our own model.
Independent economic assessment
We developed a new model that adopted the best published methodological practice including that ofthe 2015 NICE guidelines model. It models diagnostic outcomes as a decision tree structure and projectslong-term health outcomes many years into the future based on the occurrence of major neonatal adverseevents. Unlike the NICE model, which assumed that all treatment involved tocolysis, our model considerstreatment with ACSs only. Use of tocolysis is only assumed in case of hospital transfer. This is based onboth recent evidence and current practice.Key features of the model include:
l accounting for costs and lifetime QALY loss for an infant as a result of mortality, IVH or RDS, as well asthe QALY loss to the mother in a scenario analysis
l differentiating costs and benefits by gestational agel distinguishing between hospital levels, and therefore accounting for the costs of a transfer from a
hospital with a lower neonatal unit to a higher-level unit hospital in mothers of the youngestgestational ages
l accounting for the costs and benefits of ACSs for treatment of preterm labour, and the cost oftocolysis for transfers
l using gestational age of birth-specific inpatient costs estimated from national registry data on level ofcare received by newborn premature infants until hospital discharge.
The structure of the model is described briefly as follows: a woman with intact membranes, between24 and 36 weeks’ gestation, presenting with signs and symptoms of preterm labour, and for whomtransvaginal ultrasound scan is not available or acceptable, is tested using one of fFN, Actim Partus orPartoSure. Regardless of the result, this woman can:
1. give birth (preterm) within 7 days of the test2. give birth (with a gestational age of < 37 weeks) > 7 days after testing3. give birth (with a gestational age of ≥ 37 weeks) > 7 days after testing.
SCIENTIFIC SUMMARY
NIHR Journals Library www.journalslibrary.nihr.ac.uk
xxx

If a woman tests positive, she is treated with steroids. If the gestational age is < 28 weeks, and shepresents at a hospital with a level 1 or 2 neonatal unit, she will also be given tocolysis and transferred to alevel 3 (tertiary) hospital. In addition to the three tests, the model also considers a ‘treat-all’ strategy forcomparison.
A review of health-related quality-of-life studies for preterm labour informed the selection of utilities forpreterm survivors, IVH, RDS and mothers. Owing to a lack of suitable data in the literature, we used proxyutility values for IVH and RDS. Because only one study provided data for the quality of life of mothers whohad had previous adverse pregnancy outcomes, we do not include their utility as part of the base case.Overall, we improve on the utility data used in the model that informed the existing NICE guidelines.
A review of cost studies informed the selection of relevant costs for inclusion in the model. Unlike theeconomic analysis that informed the NICE guidelines, our model accounts for the additional costs of savinga preterm neonatal life.
As there was no study that compared all the diagnostic options, we produced an economic assessmentfor the individual comparative studies separately. The results from our base-case analysis (for a womanpresenting at 30 weeks’ gestation) are as follows. Using test accuracy data from one study, we find thatActim Partus is £346 cheaper and 0.006 QALYs less effective than fFN at 50 ng/ml. This results in an ICERfor Actim Partus of a £56,030 cost saving per QALY lost versus 50 ng/ml of fFN. Using test accuracy datafrom another study, we find that PartoSure is less costly than Actim Partus while being equally effective.Indirectly comparing PartoSure with 50 ng/ml fFN (using data from two studies) yields a saving of £81,922per QALY loss with the former relative to the latter test. This estimate is highly uncertain given the indirectcomparison source and the small size of one of the studies used. Furthermore, qfFN at the 200 ng/ml and500 ng/ml thresholds saves £25,209 and £17,025 per QALY loss, respectively, relative to 50 ng/ml of fFN.qfFN at 10 ng/ml was the only test option that increased QALYs, by 0.002, relative to 50 ng/ml fFN, andhad an incremental cost per QALY gained of £140,267. The discounted QALY differences between newtest options against 50 ng/ml fFN were all smaller than 0.03.
Conclusion
There is a high degree of uncertainty surrounding the test accuracy results, primarily as a result of thesubstantial methodological, clinical and statistical heterogeneity between included accuracy studies and thelack of any study of the tests on decision-making and clinical outcomes. Nevertheless, our results suggest thatthe NICE guideline recommendation that symptomatic women presenting at 30 weeks’ gestation beadmitted to hospital (i.e. the no-test, treat-all policy) may not be cost-effective. We are also aware of fourongoing UK trials, two of which are planning to enrol > 1000 participants, the results of which are likely toaffect these conclusions.
Study registration
The study is registered as PROSPERO CRD42017072696.
Funding
Funding for this study was provided by the Health Technology Assessment programme of the NationalInstitute for Health Research.
DOI: 10.3310/hta23130 HEALTH TECHNOLOGY ASSESSMENT 2019 VOL. 23 NO. 13
© Queen’s Printer and Controller of HMSO 2019. This work was produced by Varley-Campbell et al. under the terms of a commissioning contract issued by the Secretary of Statefor Health and Social Care. This issue may be freely reproduced for the purposes of private research and study and extracts (or indeed, the full report) may be included inprofessional journals provided that suitable acknowledgement is made and the reproduction is not associated with any form of advertising. Applications for commercialreproduction should be addressed to: NIHR Journals Library, National Institute for Health Research, Evaluation, Trials and Studies Coordinating Centre, Alpha House, University ofSouthampton Science Park, Southampton SO16 7NS, UK.
xxxi


Chapter 1 Background and definition of thedecision problem(s)
Conditions and aetiologies
Preterm (premature) birth, as defined by the World Health Organization (WHO), refers to babies born alivebefore 37 weeks and 0 days of gestation (37+0 weeks).1
Preterm birth can be serious for an infant in terms of both short- and long-term health problems and anincreased risk of mortality. For example, short-term problems include difficulties with breathing [respiratorydistress syndrome (RDS)] and feeding and an increased risk of infections and bleeding within the brain[intraventricular haemorrhages (IVHs)]. Meanwhile, long-term problems include an increased risk of cerebralpalsy, cognitive and visual impairment and respiratory illnesses.2,3
Aetiology, pathology and prognosisThe WHO1 subcategorises preterm birth based on gestational age as:
l extremely preterm – < 28 weeks’ gestational agel very preterm – ≥ 28 weeks’ and < 32 weeks’ gestational agel moderate to late preterm – ≥ 32 weeks’ and < 37 weeks’ gestational age.
Iatrogenic preterm births are medically instigated deliveries, such as early labour induction or caesareansection.4 These elective deliveries aim to reduce health risks to the mother or fetus owing to complicationssuch as hypertension, intrauterine growth restriction or pre-eclampsia.4
Spontaneous preterm labour is a multifactorial condition with various underlying pathologies includinginfection, breakdown of fetal–maternal tolerance, stress, decidual senescence and uterine distension(commonly associated with multifetal pregnancies).5 Spontaneous preterm deliveries can be broadlycategorised as either spontaneous labour with intact membranes or those following preterm prematurerupture of membranes (PPROMs).4 Factors associated with an increased risk of preterm delivery includestress, tobacco use, drug abuse, trauma, multifetal gestations, in vitro fertilisation, low body mass index(BMI) before pregnancy, extremes of maternal age, diabetes mellitus, high blood pressure and infection.6,7
However, previous preterm delivery is the greatest risk factor for preterm birth.8
Symptoms of suspected preterm labour include painful contractions or cramps, abdominal and low-backpain and an increase or change in vaginal discharge.9 Symptoms do not always result in progression toestablished labour and birth; they may occur but then settle, allowing the pregnancy to continue towardsterm. It is understood that > 90% of women presenting with symptoms of preterm labour do not goon to deliver in the next 2 weeks and, of these, 50% will continue with pregnancy until full term.10,11 It isimportant to determine whether or not preterm labour is the cause of the symptoms and to assess the riskof preterm delivery to allow appropriate management to begin as soon as possible.12
The focus population for this report is women presenting with signs and symptoms of spontaneouspreterm labour with intact membranes.
EpidemiologyData from the England and Wales 2016 birth cohort13 report 54,143 live, preterm deliveries in accordancewith the WHO definition of preterm birth (< 37 weeks’ gestational age), corresponding to 7.8% of all livebirths. Of these deliveries, 5.9% were categorised as extremely preterm (< 28 weeks’ gestation), 10.4%
DOI: 10.3310/hta23130 HEALTH TECHNOLOGY ASSESSMENT 2019 VOL. 23 NO. 13
© Queen’s Printer and Controller of HMSO 2019. This work was produced by Varley-Campbell et al. under the terms of a commissioning contract issued by the Secretary of Statefor Health and Social Care. This issue may be freely reproduced for the purposes of private research and study and extracts (or indeed, the full report) may be included inprofessional journals provided that suitable acknowledgement is made and the reproduction is not associated with any form of advertising. Applications for commercialreproduction should be addressed to: NIHR Journals Library, National Institute for Health Research, Evaluation, Trials and Studies Coordinating Centre, Alpha House, University ofSouthampton Science Park, Southampton SO16 7NS, UK.
1

were very preterm (gestational age of ≥ 28 to < 32 weeks) and 83.7% were moderate to late preterm(≥ 32 to < 37 weeks’ gestation).13
The 2016 UK birth cohort data collected by the Office for National Statistics (ONS)13 show that the rate ofpreterm births varies between ethnic populations, with the highest proportion of preterm births occurring inblack Caribbean and Indian populations (10.4% and 8.03% of pregnancies in these populations, respectively)and the lowest rate of preterm births occurring in women of ‘white other’ ethnicity (6.6%). The rate of pretermdelivery in the population in which ethnicity was ‘not stated’ was 8.3%.13 In the UK, preterm labour, particularlyextreme preterm labour, disproportionately affects women from low socioeconomic backgrounds.14,15
Incidence and/or prevalenceImprovements in perinatal health-care services have resulted in vastly improved outcomes for babies bornpreterm, yet the prevalence of preterm birth continues to rise.1,16
Preterm birth rates vary between countries, with higher prevalence and poorer outcomes in lower-incomecountries.16 However, preterm birth is a global issue that also affects developed countries.
Impact of the health problemGlobally, preterm birth complications are directly responsible for 35% of all neonatal deaths and are thesecond leading cause of death in children aged < 5 years.16,17
Morbidities associated with preterm birth are both acute and chronic and can affect all organ systems.Respiratory distress can progress to bronchopulmonary dysplasia18 and cerebral pathology (e.g. IVHs andischaemia can lead to neurodevelopmental disorders including learning and behavioural difficulties).19,20
In addition, gastrointestinal disorders and immunodeficiencies are also associated with preterm birth.21,22
Although mortality and morbidity rates are higher for infants delivered at lower gestational ages and lowerbirthweights, near-term premature infants remain at a considerably higher risk of complications than theirfull-term counterparts.20
Preterm deliveries place a significant cost burden on the NHS. In addition to initial hospitalisation,rehospitalisation and rehabilitation, other direct medical costs include medication, aids and devices suchas wheelchairs, visits to physicians and home care.23 Direct non-medical costs such as special education,adaptations to homes or cars, special meal requirements, higher insurance premiums and other disease-associated costs are an expensive burden on both families and the state.23
Current guidelines
The National Institute for Health and Care Excellence (NICE) guideline24 on preterm labour (Figure 1) andbirth states that women reporting symptoms of preterm labour who have intact membranes should havea clinical assessment that includes:
l clinical history-takingl observations of the woman, including the length, strength and frequency of her contractions; any pain
she is experiencing; pulse, blood pressure and temperature; and urinalysisl observations of the unborn baby, including asking about the baby’s movements in the last 24 hours;
palpation of the woman’s abdomen to determine the fundal height, the baby’s lie, presentation,position, engagement of the presenting part, and frequency and duration of contractions; andauscultation of the fetal heart rate for a minimum of 1 minute immediately after a contraction
l a speculum examination (followed by a digital vaginal examination if the extent of cervical dilatationcannot be assessed).
BACKGROUND AND DEFINITION OF THE DECISION PROBLEM(S)
NIHR Journals Library www.journalslibrary.nihr.ac.uk
2
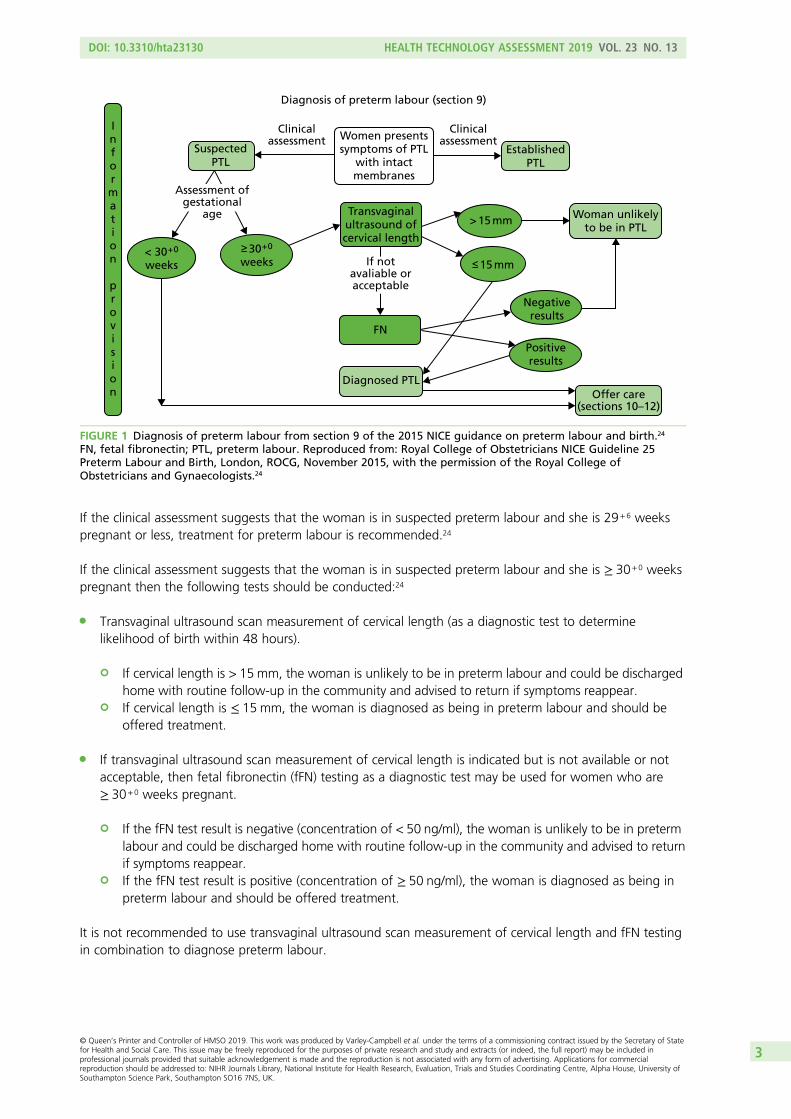
If the clinical assessment suggests that the woman is in suspected preterm labour and she is 29+6 weekspregnant or less, treatment for preterm labour is recommended.24
If the clinical assessment suggests that the woman is in suspected preterm labour and she is ≥ 30+0 weekspregnant then the following tests should be conducted:24
l Transvaginal ultrasound scan measurement of cervical length (as a diagnostic test to determinelikelihood of birth within 48 hours).
¢ If cervical length is > 15 mm, the woman is unlikely to be in preterm labour and could be dischargedhome with routine follow-up in the community and advised to return if symptoms reappear.
¢ If cervical length is ≤ 15 mm, the woman is diagnosed as being in preterm labour and should beoffered treatment.
l If transvaginal ultrasound scan measurement of cervical length is indicated but is not available or notacceptable, then fetal fibronectin (fFN) testing as a diagnostic test may be used for women who are≥ 30+0 weeks pregnant.
¢ If the fFN test result is negative (concentration of < 50 ng/ml), the woman is unlikely to be in pretermlabour and could be discharged home with routine follow-up in the community and advised to returnif symptoms reappear.
¢ If the fFN test result is positive (concentration of ≥ 50 ng/ml), the woman is diagnosed as being inpreterm labour and should be offered treatment.
It is not recommended to use transvaginal ultrasound scan measurement of cervical length and fFN testingin combination to diagnose preterm labour.
Diagnosis of preterm labour (section 9)
SuspectedPTL
EstablishedPTL
< 30+0
weeks≥ 30+0
weeks
Clinicalassessment
Clinicalassessment
Assessment ofgestational
age
If notavaliable oracceptable
FN
Diagnosed PTL
Transvaginalultrasound ofcervical length
> 15 mm
≤ 15 mm
Negativeresults
Positiveresults
Offer care(sections 10–12)
Woman unlikelyto be in PTL
Information
provision
Women presentssymptoms of PTL
with intactmembranes
FIGURE 1 Diagnosis of preterm labour from section 9 of the 2015 NICE guidance on preterm labour and birth.24
FN, fetal fibronectin; PTL, preterm labour. Reproduced from: Royal College of Obstetricians NICE Guideline 25Preterm Labour and Birth, London, ROCG, November 2015, with the permission of the Royal College ofObstetricians and Gynaecologists.24
DOI: 10.3310/hta23130 HEALTH TECHNOLOGY ASSESSMENT 2019 VOL. 23 NO. 13
© Queen’s Printer and Controller of HMSO 2019. This work was produced by Varley-Campbell et al. under the terms of a commissioning contract issued by the Secretary of Statefor Health and Social Care. This issue may be freely reproduced for the purposes of private research and study and extracts (or indeed, the full report) may be included inprofessional journals provided that suitable acknowledgement is made and the reproduction is not associated with any form of advertising. Applications for commercialreproduction should be addressed to: NIHR Journals Library, National Institute for Health Research, Evaluation, Trials and Studies Coordinating Centre, Alpha House, University ofSouthampton Science Park, Southampton SO16 7NS, UK.
3

Description of the technologies under assessment
Accurate diagnoses of preterm birth using a biomarker test could prevent unnecessary, or ensureappropriate, admissions into hospitals, transfers to specialist units and/or treatment.
Summary of the technologiesFollowing the NICE guidance, the technologies under assessment in this review would appear in thetreatment pathway where the fFN test (at the threshold of 50 ng/ml) is currently being used. A summary ofinformation relating to the tests is given in Table 1.
PartoSurePartoSure™ (Parsagen Diagnostics Inc., Boston, MA, USA) is a CE-marked qualitative lateral flow,immunochromatographic point-of-care test that detects placental alpha microglobulin-1 (PAMG-1) invaginal secretions. PAMG-1 is a protein produced by decidual cells lining the uterus and is secreted intoamniotic fluid, its concentration in vaginal discharge is usually low and studies have shown that thepresence of PAMG-1 in vaginal discharge is predictive of imminent delivery.25
Actim PartusActim® Partus (Medix Biochemica, Espoo, Finland; distributed by Alere Inc.) is a CE-marked qualitativeimmunochromatographic point-of-care test that detects phosphorylated insulin-like growth factor bindingprotein-1 [ph(IGFBP-1)] in cervical secretions. ph(IGFBP-1) is made by cells lining the uterus and leaks intothe cervix when delivery is imminent.12
Rapid Fetal Fibronectin 10Q Cassette KitThe Rapid fFN® 10Q Cassette Kit (Hologic, Inc., Marlborough, MA, USA) is a CE-marked point-of-care testfor use in the PeriLynx system or the Rapid fFN 10Q system. This test quantifies the concentration of fFNpresent in cervicovaginal fluid. fFN is a glycoprotein that connects membranes of the uterus and fetalmembranes, which begins to degrade after 35 weeks of pregnancy or soon before preterm birth.
PopulationFor the purpose of this report, the population of interest is women with signs and symptoms of pretermlabour with intact amniotic membranes, who are not in established labour and for whom a transvaginalultrasound scan is not available or acceptable.
Identification of important subgroupsThe following women are at different risks of preterm delivery and consequently adverse neonataloutcomes. The clinical utility of the test may vary across these groups and the relative value of accurateidentification of true-positive and true-negative cases is different from that in the overall population:24
l women with history of preterm deliveryl women presenting with symptoms at < 28 weeks’ gestationl women presenting with symptoms at ≥ 28 and < 32 weeks’ gestationl women presenting with symptoms at ≥ 32 weeks’ gestationl women with multiple fetusesl women from lower socioeconomic groups (i.e. in most disadvantaged decile).
Current usage in the NHSCurrent NICE guidelines are described in Current guidelines.
Advising clinicians report that the guidelines are not always followed in typical clinical practice.Symptomatic women presenting irrespective of gestational age will usually have the fFN test administered.In addition, clinicians advise that transvaginal ultrasound scan is rarely used in routine practice owing to alack of trained staff available, experience or equipment availability.
BACKGROUND AND DEFINITION OF THE DECISION PROBLEM(S)
NIHR Journals Library www.journalslibrary.nihr.ac.uk
4

TABLE 1 Summary of index tests
CategoryActim® Partus (Medix Biochemica, Espoo,Finland)26
PartoSure™ (Parsagen Diagnostics Inc., Boston,MA, USA)27
Rapid fFN® 10Q Cassette Kit (Hologic, Inc.,Marlborough, MA, USA)28
Gestational age From 22 weeks From 20+0 weeks to 36+6 weeks From 22+0 weeks to 35+6 weeks
Contraindications Ruptured membranes, vaginal bleeding (moderateor heavy), amniotic fluid
Significant blood on the swab, within 6 hours ofvaginal disinfectant solutions or medicines.Inaccurate results may be likely with previousplacenta previa or digital examination or in presenceof meconium, antifungal creams, suppositories,lubricants, moisturisers, talcum powder or baby oil
Advanced cervical dilatation (≥ 3 cm), rupturedmembranes, cervical cerclage, placental abruption,placenta previa (moderate) or vaginal bleeding(heavy). Inaccurate results may be likely with sexualintercourse, digital cervical examination ortransvaginal ultrasound scan and bacteria, bilirubinand semen. A negative test result is still valid if inthe presence of semen
Instructions 1. Take a 10- to 15-second swab from the cervicalos during sterile speculum examination beforeany other investigations
2. Swirl the swab vigorously in the specimenextraction solution for 10–15 seconds
3. Place the dipstick in the specimen extractionsolution until the liquid reaches the result area
4. Remove dipstick from sample solution and layhorizontally for 5 minutes
Negative results (one blue line) should be confirmedat 5 minutes: highly unlikely that patient will deliverwithin the next 2 weeks
Positive results (two blue lines) can be read as soonas it becomes visible (if before 5 minutes). Risk of apreterm delivery is elevated
1. Open the solvent vial and place in a verticalposition by holding by the cap with all the liquidat the bottom
2. Remove sterile flocked swab from packaging andwith the patient lying on her back and byholding the middle of the swab shaft, insert intothe vagina until the fingers contact the skin(5–7 cm deep) for 30 seconds
3. Place the swab in the solvent vial and rinse byrotating for 30 seconds
4. Insert test strip into the solvent for 5 minutes
Negative results (one line) should be confirmed at5 minutes
Positive results (two lines) can be read as soon as itbecomes visible (if before 5 minutes)
1. Perform daily analyser quality control2. During speculum examination, collect swab
sample from the posterior fornix of the vaginaand transfer to the transfer tube
3. Mix sample in transport tube prior to removingswab expressing as much liquid as possible fromthe swab to tube
4. Mix the patient sample by removing the fFN 10QCassette from the foil pouch, enter necessaryinformation into analyser and insert the cassetteinto analyser
5. When prompted pipette 200 µl of patient sampleinto sample application
6. Wait 10 minutes (7 minutes of incubation and2–3 minutes of analysis)
7. fFN concentration will be displayed
continued
DOI:10.3310/hta23130
HEA
LTHTECH
NOLO
GYASSESSM
ENT2019
VOL.23
NO.13
©Queen
’sPrinter
andController
ofHMSO
2019.This
work
was
producedby
Varley-C
ampbellet
al.under
theterm
sof
acom
missioning
contractissued
bythe
Secretaryof
Statefor
Health
andSocialC
are.This
issuemay
befreely
reproducedfor
thepurposes
ofprivate
researchand
studyand
extracts(or
indeed,the
fullreport)may
beincluded
inprofessionaljournals
providedthat
suitableacknow
ledgement
ismade
andthe
reproductionisnot
associatedwith
anyform
ofadvertising.
Applications
forcom
mercial
reproductionshould
beaddressed
to:NIHRJournals
Library,NationalInstitute
forHealth
Research,Evaluation,
Trialsand
StudiesCoordinating
Centre,
Alpha
House,
University
ofSoutham
ptonScience
Park,Southam
ptonSO
167N
S,UK.
5

TABLE 1 Summary of index tests (continued )
CategoryActim® Partus (Medix Biochemica, Espoo,Finland)26
PartoSure™ (Parsagen Diagnostics Inc., Boston,MA, USA)27
Rapid fFN® 10Q Cassette Kit (Hologic, Inc.,Marlborough, MA, USA)28
Kit components l One sterile polyester swab for specimencollection
l One tube of specimen extraction solution(0.5 ml). This phosphate-buffered solutioncontains bovine serum albumin, proteaseinhibitors and preservatives
l One dipstick in a sealed aluminium foil pouchwith desiccant
l One sterile flocked vaginal swab for specimencollection
l One plastic vial with solvent solution. Solutioncontains 0.9% NaCl, 0.05% NaN3 and 0.01%Triton X-100
l One PartoSure test strip in foil pouch withdesiccant
l Rapid fFN 10Q Cassette Kitl PeriLynx™ (Hologic, Inc., Marlborough, MA, USA)
analyser, printer, user manual and PeriLynxQCette® (Hologic, Inc., Marlborough, MA, USA)or Rapid fFN 10Q analyser, printer, user manual,and Rapid fFN 10Q QCette
l Rapid fFN Control Kit (Hologic, Inc., Marlborough,MA, USA)
l 200-µl pipette
Cost £15 per test excluding VAT £32 per test excluding VAT £35 per test excluding VAT
Storage The kit should be stored between 2 °C and 25 °C The kit should be stored in a dry place between4 °C and 25 °C
The kit should be stored at room temperaturebetween 15 °C and 30 °C
Transport specimens at 2 °C to 25 °C, or frozen.Specimens are stable for up to 8 hours at roomtemperature
Specimens not tested within 8 hours of collectionmust be stored refrigerated at 2 °C to 8 °C andassayed within 3 days of collection, or frozen andassayed within 3 months to avoid degradation ofthe analyte. Specimens arriving frozen should besubject to a single freeze–thaw cycle only
Test range The test has a limit of detection of 10 µg/l and ameasuring range of 10 to 8000 µg/l
The test has a limit of detection of 1 ng/ml and ameasuring range of 1–40,000 ng/ml
The test has a detection range of 0–500 ng/ml,concentrations of > 500 ng/ml will be displayed as> 500 ng/ml
User personnel The test is intended for professional use and resultsmust be interpreted in the light of other clinicalfindings
The test is designed to be used in conjunction withclinical assessment and by health-care professionals
The test is intended to be used in conjunction withother clinical information
VAT, value-added tax.
BACKG
ROUNDANDDEFIN
ITIONOFTH
EDECISIO
NPRO
BLEM(S)
NIHRJournals
Librarywww.journalslibrary.nihr.ac.uk
6

Anticipated costs associated with the interventionThe cost of the Rapid fFN 10Q System is usually £35 per test, not including value-added tax (VAT). Thecost per control is £40 and this is usually incurred twice per year for each site. Additional costs associatedwith equipment maintenance and test consumables are negligible (request for information from NICE toHologic, Inc., 2017, personal communication from NICE).
The cost per Actim Partus test is £15, not including VAT. No other costs are associated with this test(request for information from NICE to Alere Inc., 2017, personal communication from Alere Inc.).
The cost per PartoSure test (PAMG-1) is £32, not including VAT. No other costs are associated with thistest (request for information from NICE to Parsagen Diagnostics Inc., 2017, personal communication fromParsagen Diagnostics Inc.).
Comparators
The two comparators from the NICE scope (for the clinical and cost-effectiveness reviews) are fFN, used ata threshold of 50 ng/ml, and clinical assessment.
Fetal fibronectin used with a threshold of 50 ng/mlPoint-of-care, qualitative fFN tests currently in use in the UK include QuikCheck fFN™ (Hologic, Inc.,Marlborough, MA, USA) and Rapid fFN for the TLiIQ® System (Hologic, Inc., Marlborough, MA, USA).29
QuikCheck fFNQuikCheck fFN is a CE-marked, lateral flow immunoassay. The test kit includes a sterile applicator, test stripand a tube containing an extraction buffer. Additional materials required are a test tube rack and timer.29
The specimen is obtained from the posterior fornix using the applicator provided. The tip of the applicatoris inserted into the extraction buffer and vigorously mixed for 10–15 seconds, the applicator tip is pressedagainst the side of the tube to remove as much liquid as possible and discarded. The ‘dip area’ of the teststrip is suspended in the extraction mixture for 10 minutes and then removed. Two lines indicate a positiveresult and a high risk of preterm delivery within 7–14 days; one line indicates a negative result and a lowrisk of delivery within 7–14 days; if no lines appear, the test result is invalid. The detection limit of the testis 50 ng/ml.29
The QuikCheck fFN test must be run within 15 minutes of the sample collection. The sample should beobtained before digital examination is conducted as cervix disruption may affect the test results. Thepresence of semen and gross vaginal bleeding may also affect the test results. The test is indicated forwomen presenting with threatened preterm labour and intact amniotic membranes.29
Rapid Fetal Fibronectin for the TLiIQ SystemRapid fFN for the TLiIQ System (Hologic, Inc., Marlborough, MA, USA) is a CE-marked immunochromatographicassay. The Rapid fFN test kit includes cassettes and a directional insert. Other materials required include a200-µL pipette, a Rapid fFN Control Kit (includes positive control, negative control and directional insert)and the TLiIQ System, which contains an analyser, printer and TLiIQ QCette.29
A cervicovaginal sample is obtained from the posterior fornix or the ectocervical region of the externalcervical os using a swab. The swab is rolled against the inside of the specimen transport tube to expressthe liquid into the extraction buffer and the swab is then discarded. The TLiIQ analyser is set to internalincubation mode and the cassette containing the sample is inserted. Thereafter, 200 µl of the patientsample is dispensed into the sample application well of the Rapid fFN Cassette. After 20 minutes, the TLiIQanalyser will display a result: positive, negative or invalid. The detection limit of the test is 50 ng/ml.29
DOI: 10.3310/hta23130 HEALTH TECHNOLOGY ASSESSMENT 2019 VOL. 23 NO. 13
© Queen’s Printer and Controller of HMSO 2019. This work was produced by Varley-Campbell et al. under the terms of a commissioning contract issued by the Secretary of Statefor Health and Social Care. This issue may be freely reproduced for the purposes of private research and study and extracts (or indeed, the full report) may be included inprofessional journals provided that suitable acknowledgement is made and the reproduction is not associated with any form of advertising. Applications for commercialreproduction should be addressed to: NIHR Journals Library, National Institute for Health Research, Evaluation, Trials and Studies Coordinating Centre, Alpha House, University ofSouthampton Science Park, Southampton SO16 7NS, UK.
7

This test is indicated for use in routine prenatal visits between 22+0 weeks’ and 30+ 6 weeks’ gestation,to assess the risk of delivery at ≤ 7 or ≤ 14 days from testing. Disruption to the cervix (i.e. through sexualintercourse, digital vaginal examination or transvaginal ultrasound scan) may result in a false-positive result.Douches, semen, white blood cells, red blood cells, bacteria and bilirubin may interfere with test results.However, if the patient reports sexual intercourse within the previous 24 hours, a negative fFN test result isstill valid.29
Clinical assessment of symptoms aloneClinical assessment consists of taking a clinical history, observations of the woman and unborn baby and aspeculum examination. See Current guidelines for more details.
Care pathways
Clinical assessment and use of the biomarker tests aid clinicians in their decisions regarding whetherwomen presenting with signs and symptoms of preterm labour can be safely sent home or need to beadmitted to hospital for treatment to delay birth and improve neonatal outcomes.24 Typically, the resultswould be used in combination with clinical judgement. For example:
l If the test result is negative and the symptoms of preterm labour have settled, the woman would bedischarged home with routine follow-up in the community and advised to return if symptoms reappear.
l If the test result is negative but symptoms of preterm labour continue, the woman would be admittedand monitored and symptoms treated as appropriate and monitored. If symptoms were managedsuccessfully, the woman would be discharged home.
l If the test result is positive, the woman would be admitted and symptoms managed as appropriateand monitored.
Once a woman has been diagnosed with threatened preterm labour, she will typically be offered tocolytictherapy, corticosteroids and magnesium sulphate.24
Tocolytic therapyTocolytic therapies increase the latency period for up to 48 hours. The aim of this therapy is to allow timefor neonatal transfers and to complete the course of antenatal corticosteroids (ACSs).30 There are manyclasses of tocolytic drugs with different mechanisms of action.30
The NICE guidelines24 recommend nifedipine for women between 24+ 0 and 33+6 weeks’ gestation insuspected or diagnosed labour with intact membranes. If nifedipine is contraindicated, NICE recommendsoxytocin receptor antagonists [e.g. Atosiban (Sun Pharmaceuticals UK Ltd)] for tocolytic therapy.
Our clinical advisors suggest that tocolytic therapy is not commonly used in routine clinical practice.This may be attributable to recent evidence on the potential harms to the fetus and infant.30,31
Antenatal corticosteroidsAntenatal corticosteroids {e.g. dexamethasone [Alliance Healthcare (Distribution) Ltd] or betamethasone (AAHPharmaceuticals Ltd)} are prescribed in cases of threatened preterm labour to stimulate fetal lung developmentto reduce infant mortality and morbidity.32 Following administration of steroids, there is a window within whichthe steroids appear to be most beneficial for the infant (Figure 1C, Norman et al.).33 The primary documentednegative effect of giving steroids is a negative reduction in birthweight of approximately 100 g.34
The National Institute for Health and Care Excellence currently recommends ACSs for women between 26+0
and 33+6 weeks’ gestation in suspected, diagnosed or established preterm birth, PPROM or undergoingplanned preterm delivery. ACSs should be considered for extremely preterm (between 24+ 0 and 25+6
weeks’ gestation) and near-term (34+0 and 35+ 6 weeks’ gestation) women in suspected, diagnosed andestablished preterm labour, PPROM or undergoing iatrogenic deliveries.24 However, evidence regarding the
BACKGROUND AND DEFINITION OF THE DECISION PROBLEM(S)
NIHR Journals Library www.journalslibrary.nihr.ac.uk
8
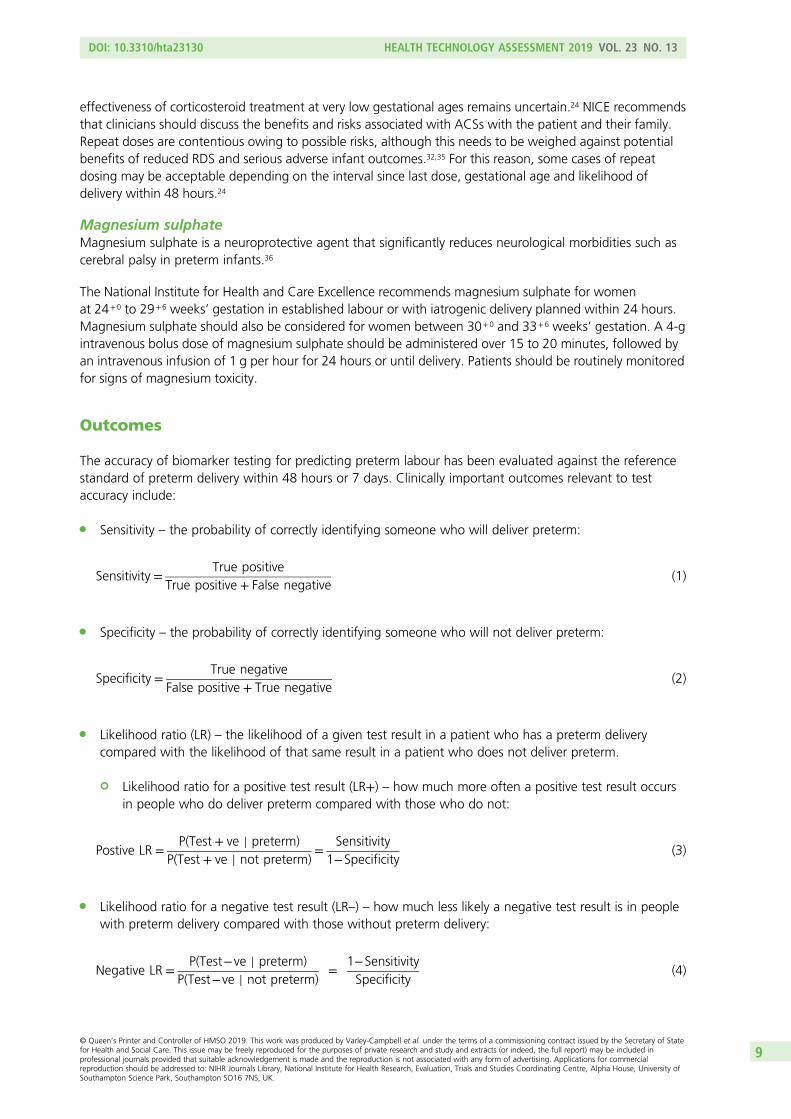
effectiveness of corticosteroid treatment at very low gestational ages remains uncertain.24 NICE recommendsthat clinicians should discuss the benefits and risks associated with ACSs with the patient and their family.Repeat doses are contentious owing to possible risks, although this needs to be weighed against potentialbenefits of reduced RDS and serious adverse infant outcomes.32,35 For this reason, some cases of repeatdosing may be acceptable depending on the interval since last dose, gestational age and likelihood ofdelivery within 48 hours.24
Magnesium sulphateMagnesium sulphate is a neuroprotective agent that significantly reduces neurological morbidities such ascerebral palsy in preterm infants.36
The National Institute for Health and Care Excellence recommends magnesium sulphate for womenat 24+0 to 29+6 weeks’ gestation in established labour or with iatrogenic delivery planned within 24 hours.Magnesium sulphate should also be considered for women between 30+0 and 33+6 weeks’ gestation. A 4-gintravenous bolus dose of magnesium sulphate should be administered over 15 to 20 minutes, followed byan intravenous infusion of 1 g per hour for 24 hours or until delivery. Patients should be routinely monitoredfor signs of magnesium toxicity.
Outcomes
The accuracy of biomarker testing for predicting preterm labour has been evaluated against the referencestandard of preterm delivery within 48 hours or 7 days. Clinically important outcomes relevant to testaccuracy include:
l Sensitivity – the probability of correctly identifying someone who will deliver preterm:
Sensitivity =True positive
True positive + False negative(1)
l Specificity – the probability of correctly identifying someone who will not deliver preterm:
Specificity =True negative
False positive + True negative(2)
l Likelihood ratio (LR) – the likelihood of a given test result in a patient who has a preterm deliverycompared with the likelihood of that same result in a patient who does not deliver preterm.
¢ Likelihood ratio for a positive test result (LR+) – how much more often a positive test result occursin people who do deliver preterm compared with those who do not:
Postive LR =P(Test + ve j preterm)
P(Test + ve j not preterm)=
Sensitivity1−Specificity
(3)
l Likelihood ratio for a negative test result (LR–) – how much less likely a negative test result is in peoplewith preterm delivery compared with those without preterm delivery:
Negative LR =P(Test−ve j preterm)
P(Test−ve j not preterm)=
1−SensitivitySpecificity
(4)
DOI: 10.3310/hta23130 HEALTH TECHNOLOGY ASSESSMENT 2019 VOL. 23 NO. 13
© Queen’s Printer and Controller of HMSO 2019. This work was produced by Varley-Campbell et al. under the terms of a commissioning contract issued by the Secretary of Statefor Health and Social Care. This issue may be freely reproduced for the purposes of private research and study and extracts (or indeed, the full report) may be included inprofessional journals provided that suitable acknowledgement is made and the reproduction is not associated with any form of advertising. Applications for commercialreproduction should be addressed to: NIHR Journals Library, National Institute for Health Research, Evaluation, Trials and Studies Coordinating Centre, Alpha House, University ofSouthampton Science Park, Southampton SO16 7NS, UK.
9

l Positive predictive value (PPV) – the probability of someone with a positive result actually having apreterm delivery:
PPV =True positive
True positive + False positive(5)
l Negative predictive value (NPV) – the probability of someone with a negative test result actually nothaving a preterm delivery:
NPV =True negative
True negative + False negative(6)
l Diagnostic yield (also known as test positivity rate or apparent prevalence) – the number of positive testresults divided by the number of samples.
l Concordance – the proportion of cases in which the result of the test agrees with the clinical outcome.l Prevalence – the proportion of women actually having a preterm delivery.l Test failure (non-informative test result) rate.l Time (required) to (obtain a) test result.
BACKGROUND AND DEFINITION OF THE DECISION PROBLEM(S)
NIHR Journals Library www.journalslibrary.nihr.ac.uk
10
Chapter 2 Assessment of test accuracy
This report contains reference to confidential information provided as part of the NICE appraisal process.This information has been removed from the report and the results, discussions and conclusions of the
report do not include the confidential information. These sections are clearly marked in the report.
Methods for reviewing test accuracy
The diagnostic accuracies of PartoSure, Actim Partus and Rapid fFN 10Q Cassette Kit [at thresholds otherthan 50 ng/ml, referred to in the remainder of this report as quantitative fFN (qfFN)] were assessed byconducting a systematic review of the research evidence for these three index tests. This review wasundertaken following the general principles published by the University of York Centre for Reviews andDissemination.37 The protocol was registered on PROSPERO (reference number CRD42017072696).
Methods of the systematic reviewThe aim of this systematic review was to identify and summarise the diagnostic test accuracy (DTA) datafor PartoSure, Actim Partus and qfFN (at thresholds other than 50 ng/ml) from test accuracy studies thatprovide data for one or more of these index tests.
Identification of studies
Study sources and searchesTo identify studies, the following bibliographic databases were searched from inception until July 2017(the search was conducted in July 2017): MEDLINE (R), MEDLINE(R) Epub Ahead of Print, MEDLINE In-Process& Other Non-Indexed Citations, MEDLINE (R) Daily and EMBASE (all via Ovid), Cumulative Index to Nursingand Allied Health Literature (CINAHL) (via EBSCOhost); BioSciences Information Service and Web of Science(via Clarivate Analytics) and The Cochrane Library [Cochrane Database of Systematic Reviews, CochraneCentral Register of Controlled Trials (CENTRAL), Database of Abstracts of Reviews of Effects (DARE), HealthTechnology Assessment (HTA) database and NHS Economic Evaluation Database (NHS EED) (all via WileyInterface)]. The search strategies were developed by a senior information specialist (CC), and comprisedterms designed to identify the index tests. Methodological filters for test accuracy studies were not used tolimit the study designs retrieved as these have been shown to reduce sensitivity38 and also because the searchresults were used to screen studies for the other two reviews described in this report (see Chapters 3 and 4).Search results were limited to English-language studies. The full search strategies for each database arereproduced in Appendix 1. The search results were exported to EndNote X8 [Clarivate Analytics (formerlyThomson Reuters), Philadelphia, PA, USA] and deduplicated using automatic and manual checking.
Additional sources were searched:
l Systematic reviews identified by the bibliographic database searches were screened for includablestudies. For the purpose of this review, a systematic review was defined as one that had a focusedresearch question; explicit search criteria that are available to view; explicit inclusion/exclusion criteria;sufficient data on included and excluded studies to populate a PRISMA (Preferred Reporting Items forSystematic Reviews and Meta-Analyses) flow diagram; a critical appraisal of included studies, includingconsideration of internal and external validity of the research; and a synthesis of the included evidence(narrative or quantitative).
l Trial registries were searched via the ClinicalTrials.gov website [https://clinicaltrials.gov/ct2/home(accessed July 2017)] and ISRCTN (International Standard Randomised Controlled Trial Number)[www.isrctn.com/editAdvancedSearch (accessed July 2017)] using terms designed to identify the indextests (see Appendix 1).
DOI: 10.3310/hta23130 HEALTH TECHNOLOGY ASSESSMENT 2019 VOL. 23 NO. 13
© Queen’s Printer and Controller of HMSO 2019. This work was produced by Varley-Campbell et al. under the terms of a commissioning contract issued by the Secretary of Statefor Health and Social Care. This issue may be freely reproduced for the purposes of private research and study and extracts (or indeed, the full report) may be included inprofessional journals provided that suitable acknowledgement is made and the reproduction is not associated with any form of advertising. Applications for commercialreproduction should be addressed to: NIHR Journals Library, National Institute for Health Research, Evaluation, Trials and Studies Coordinating Centre, Alpha House, University ofSouthampton Science Park, Southampton SO16 7NS, UK.
11
l Google Advanced Search (Google Inc., Mountain View, CA, USA) was used to conduct web searching(September 2017), using terms designed to identify the index tests (see Appendix 1). For each termsearched using Google Advanced Search, the first 50 hits were screened.
l Items included after full-text screening were forward citation chased and screened using Scopus (Elsevier).l The reference lists of included studies were screened.l The industry submissions to NICE were cross-checked for additional studies.
Study selectionRelevant studies were screened in two stages. First, titles and abstracts returned by the search strategy wereexamined independently by two reviewers (two of JVC, SD, MB and HC) and screened for possible inclusion,using prespecified inclusion and exclusion criteria (see Inclusion and exclusion criteria). Disagreementswere resolved by discussion within the review team. Full texts of studies included at the title and abstractscreening stage were obtained, as were full texts of studies identified from systematic reviews, from trialregistry searches, from forward and backward citation chasing, from references provided by the companiesand from web searching. Two researchers (two of JVC, SD, MB and HC) independently examined full textsfor inclusion or exclusion. Disagreements were again resolved by discussion within the review team.
Inclusion and exclusion criteria
PopulationIn line with the NICE scope,12 studies were included if they recruited pregnant women with signs andsymptoms of preterm labour who were not in established labour and who had intact amniotic membranes.Studies were eligible regardless of whether they were based on samples that were at high or low risk forpreterm labour. Studies were also eligible regardless of whether or not it was stipulated that the recruitedpopulation had access to transvaginal ultrasound scans. There were no specific inclusion criteria relating tothe number of weeks of gestation of the women recruited; however, the study was required to define itspopulation as preterm. The unit of assessment was individual women with a single result for each test.
Initially, studies were included only if all participants were expecting a singleton pregnancy. However,owing to the lack of evidence, a protocol amendment was made to include studies in which twin ormultiple pregnancies were included but made up ≤ 20% of the total population recruited. We are notaware of any published evidence to suggest that multifetal pregnancies would alter the DTA of any ofthe tests.
Index testsIn accordance with the NICE scope,12 the index tests to be considered were:
l PartoSure (with or without a clinical assessment)l Actim Partus (with or without a clinical assessment)l Rapid fFN 10Q Cassette Kit (qfFN), used with a threshold other than 50 ng/ml (with or without a
clinical assessment).
Studies were eligible for inclusion if one or more index test was assessed against a reference standard.
Reference standardStudies using one or more of the following reference standards were eligible for inclusion:
l preterm delivery within 48 hours or within 7 daysl clinical assessment of symptoms alonel fetal fibronectin at a threshold of 50 ng/ml (qualitative or quantitative test).
ASSESSMENT OF TEST ACCURACY
NIHR Journals Library www.journalslibrary.nihr.ac.uk
12

In addition, studies that provided test accuracy data by comparing the results of one index test withanother (i.e. by using one of the index tests as a reference standard) were also eligible for inclusion. It was,however, expected that most studies would use preterm delivery within 48 hours, or within 7 days, as thereference standard.
OutcomesIn accordance with the NICE scope,12 the outcomes assessed for index tests were:
l sensitivity – true positive/(true positive + false negative)l specificity – true negative/(false positive + true negative)l likelihood ratio for positive test resultl likelihood ratio for negative test resultl positive predictive value – true positive/(true positive + false positive)l negative predictive value – true negative/(true negative + false negative)l diagnostic yield (also known as test positivity rate or apparent prevalence)l concordancel prevalence (or incidence) of preterm delivery within 7 days and/or within 48 hoursl test failure (non-informative test result) ratel time to test result.
Study designSingle-gate prospective or retrospective diagnostic studies with random or consecutively recruited participantswere considered the optimal design for evaluating test accuracy of the index tests and were, therefore,eligible for inclusion. Ideally, studies assessing two or more index tests in the same population were sought,but studies assessing the accuracy of only one index test were also included. Studies assessing an index testand a test out of scope would be eligible for inclusion providing that data were reported specifically for allwomen receiving the index test. Two-gate diagnostic studies were also eligible for inclusion.
Studies in which the index test was conducted within 7 days of the reference standard were included.In addition, a protocol amendment was made to include studies using frozen samples (i.e. use not in linewith clinical practice), even when the test was analysed outside the window stipulated in the manufacturers’guidelines owing to a lack of evidence.
Studies were eligible for inclusion in the DTA review whether or not the index test results were used in theclinical management of patients.
We did not consider unpublished data without sufficient study methodology for quality appraisal.
Data extraction strategyData were extracted by one reviewer (SD) using a standardised data extraction form and checked by asecond reviewer (JVC). Disagreements were resolved by discussion, with involvement of a third reviewer(HC) as necessary. Data were then transferred to standardised tables.
Critical appraisal strategyThe methodological quality of the studies was assessed by one reviewer (SD) and judgements werechecked by a second reviewer (HC), in accordance with criteria specified by phase 3 of the QUADAS-2 tool(see Appendix 2).39 Any disagreements were resolved by discussion, with involvement of a third reviewer(JVC) as necessary.
DOI: 10.3310/hta23130 HEALTH TECHNOLOGY ASSESSMENT 2019 VOL. 23 NO. 13
© Queen’s Printer and Controller of HMSO 2019. This work was produced by Varley-Campbell et al. under the terms of a commissioning contract issued by the Secretary of Statefor Health and Social Care. This issue may be freely reproduced for the purposes of private research and study and extracts (or indeed, the full report) may be included inprofessional journals provided that suitable acknowledgement is made and the reproduction is not associated with any form of advertising. Applications for commercialreproduction should be addressed to: NIHR Journals Library, National Institute for Health Research, Evaluation, Trials and Studies Coordinating Centre, Alpha House, University ofSouthampton Science Park, Southampton SO16 7NS, UK.
13

Methods of data synthesisFor all included studies, sensitivity, specificity, positive and negative predictive value, positive and negativeLR, prevalence, concordance and diagnostic yield for delivery within 48 hours and 7 days were calculatedfrom true-positive, true-negative, false-positive and false-negative values. Where the raw values were notprovided, they were derived using back-calculation from other suitable available data. Summary receiveroperating characteristic (ROC) plots were generated to provide graphical depiction of the sensitivity andspecificity data. These were produced for each test separately against the 48-hour and 7-day referencestandards, and for qfFN they were also produced separately for each testing threshold.
Summary ROC plots were generated subject to a minimum of three studies per plot. In accordance withStata® requirements, the minimum number of studies for a diagnostic meta-analysis was four. Wheneverthis requirement was met, consideration was given to conducting meta-analysis. According to theCochrane DTA handbook,40 heterogeneity cannot be assessed for diagnostic meta-analysis in the sameway as for meta-analysis of interventions, and no quantitative summary statistic for heterogeneity canbe derived.
Meta-analysis against the 7-day delivery reference standard for Actim Partus was conducted using themetandi command for sensitivity and specificity. Meta-analysis against the 48-hour delivery reference standardfor Actim Partus and against the 7-day reference standard for PartoSure was conducted using a mixed-effectsmultilevel logistic regression to refine the parameters used in metandi to improve model convergence inthe presence of a low proportion of preterm births in the study by Werlen et al.41 No meta-analysis wasundertaken for qfFN at any threshold or for the 48-hour reference standard for PartoSure.
Stata® version 14.11 (StataCorp LP, College Station, TX, USA) software was used for all statistical analysis.Graphs were made using Stata or Review Manager version 5.3 (Nordic Cochrane Centre, Copenhagen)software.
Results of the systematic review
In this section, the results of the systematic review of PartoSure, Actim Partus and qfFN are presented.Studies providing DTA data for one or more of these index tests are included (see Inclusion and exclusioncriteria for specific details on inclusion and exclusion criteria).
Overview of the quantity and quality of research availableThe searches retrieved a total of 2619 unique titles and abstracts. A total of 2177 articles were excluded,based on screening titles and abstracts. The remaining 442 articles were requested as full texts for morein-depth screening.
Of the 442 articles retrieved as full texts, 415 were excluded. The primary reasons for exclusion were useof an irrelevant test, typically qualitative fFN (n = 129), the study design (n = 59), that outcomes did notmatch the review inclusion criteria (n = 31) or that the article was an abstract that both had insufficientinformation to be included in the review and was unconnected to any of the included studies (n = 108).Abstracts were included if they were connected (by reporting data from the same study) to a full-textincluded study. The bibliographic details of studies retrieved as full papers and subsequently excluded,along with the reasons for their exclusion, are detailed in Appendix 3. Additional tables (see Tables 28–30)are provided in Appendix 3, listing all the citations provided by the industry to NICE along with whether ornot the citation was included, and, if not, the reason for exclusion. After screening relevant systematicreviews (n = 11; see Appendix 3, Included systematic reviews), and forward and backward citations of theincluded studies, no further new included studies were identified. Twenty studies from 31 citations met thereview inclusion criteria. The process of study selection is shown in Figure 2.
ASSESSMENT OF TEST ACCURACY
NIHR Journals Library www.journalslibrary.nihr.ac.uk
14
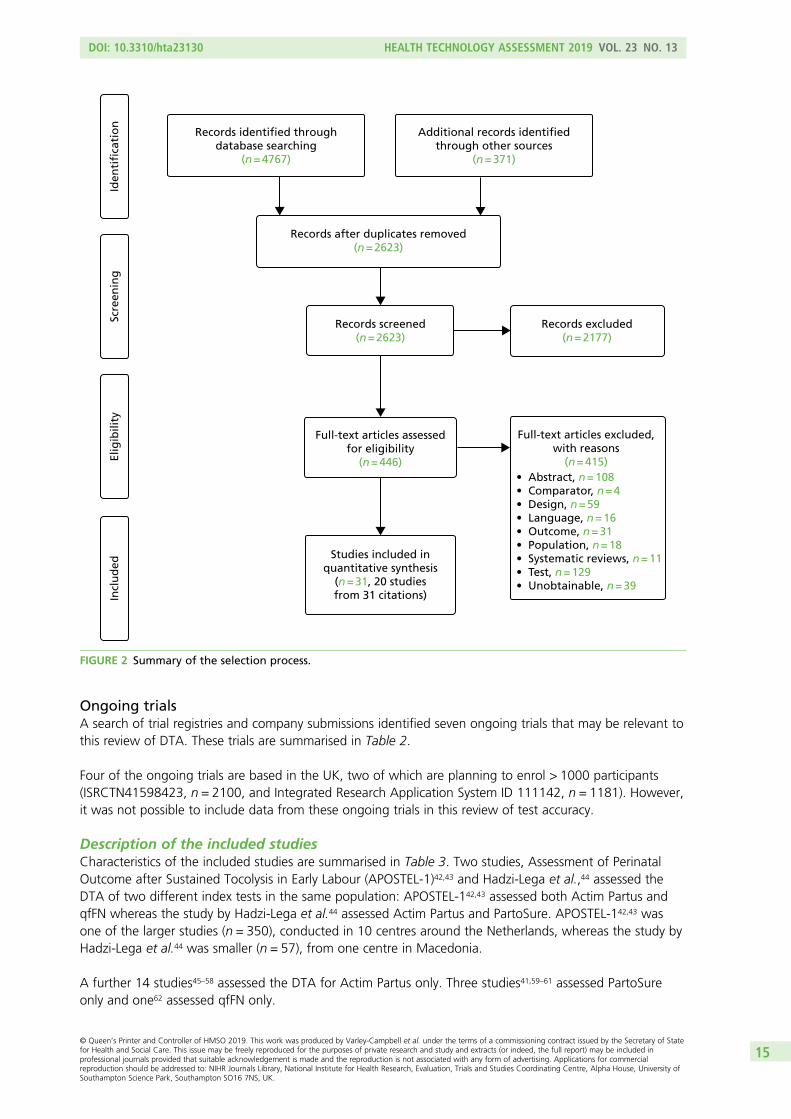
Ongoing trialsA search of trial registries and company submissions identified seven ongoing trials that may be relevant tothis review of DTA. These trials are summarised in Table 2.
Four of the ongoing trials are based in the UK, two of which are planning to enrol > 1000 participants(ISRCTN41598423, n = 2100, and Integrated Research Application System ID 111142, n = 1181). However,it was not possible to include data from these ongoing trials in this review of test accuracy.
Description of the included studiesCharacteristics of the included studies are summarised in Table 3. Two studies, Assessment of PerinatalOutcome after Sustained Tocolysis in Early Labour (APOSTEL-1)42,43 and Hadzi-Lega et al.,44 assessed theDTA of two different index tests in the same population: APOSTEL-142,43 assessed both Actim Partus andqfFN whereas the study by Hadzi-Lega et al.44 assessed Actim Partus and PartoSure. APOSTEL-142,43 wasone of the larger studies (n = 350), conducted in 10 centres around the Netherlands, whereas the study byHadzi-Lega et al.44 was smaller (n = 57), from one centre in Macedonia.
A further 14 studies45–58 assessed the DTA for Actim Partus only. Three studies41,59–61 assessed PartoSureonly and one62 assessed qfFN only.
Records identified throughdatabase searching
(n = 4767)
Additional records identifiedthrough other sources
(n = 371)
Records after duplicates removed(n = 2623)
Records screened(n = 2623)
Full-text articles assessedfor eligibility
(n = 446)
Studies included inquantitative synthesis
(n = 31, 20 studiesfrom 31 citations)
Records excluded(n = 2177)
Full-text articles excluded,with reasons
(n = 415)
Incl
ud
edEl
igib
ility
Scre
enin
gId
enti
fica
tio
n
• Abstract, n = 108• Comparator, n = 4• Design, n = 59• Language, n = 16• Outcome, n = 31• Population, n = 18• Systematic reviews, n = 11• Test, n = 129• Unobtainable, n = 39
FIGURE 2 Summary of the selection process.
DOI: 10.3310/hta23130 HEALTH TECHNOLOGY ASSESSMENT 2019 VOL. 23 NO. 13
© Queen’s Printer and Controller of HMSO 2019. This work was produced by Varley-Campbell et al. under the terms of a commissioning contract issued by the Secretary of Statefor Health and Social Care. This issue may be freely reproduced for the purposes of private research and study and extracts (or indeed, the full report) may be included inprofessional journals provided that suitable acknowledgement is made and the reproduction is not associated with any form of advertising. Applications for commercialreproduction should be addressed to: NIHR Journals Library, National Institute for Health Research, Evaluation, Trials and Studies Coordinating Centre, Alpha House, University ofSouthampton Science Park, Southampton SO16 7NS, UK.
15

TABLE 2 Ongoing trials
Study Title Sponsor Status LocationEstimatedenrolment Test(s)
NCT01987024 Advantage of Detection of phIGFBP-1 toReduce Hospitalization Time for StablePatients With a Risk of Preterm Labour
Assistance PubliqueHôpitaux De Marseille
Unknown France 420 Actim Partus
NCT01868308 Screening To Obviate Preterm Birth (STOP) University of Pennsylvania Completed USA 568 fFN
NCT02853656 Time to Delivery of Preterm Birth Basildon and ThurrockUniversity Hospitals NHSFoundation Trust
Currently recruiting UK 242 Actim Partus and fFN
NCT02904070 Interest of Placental Alpha-microglobulin-1Detection Test to Assess Risk of PrematureDelivery in Reunion Island (PARTOSURE-OI)
Centre HospitalierUniversitaire de LaRéunion
Currently recruiting Réunion Island,France
300 PartoSure, ActimPartus and fFN
ISRCTN41598423 Can a test of preterm labour (qfFN) helpdiagnosis and clinical decision making?(QUIDS and QUIDS-2)
HTA programme (UK) Currently recruiting UK 2100 PartoSure, ActimPartus and fFN
IRAS ID 111142 Threatened preterm labour: a prospectivecohort study of a clinical risk assessmenttool and a qualitative exploration ofwomen’s experiences of risk assessmentand management (PETRA)
King’s College London Currently recruiting UK 1181 fFN
(Confidential informationhas been removed)
(Confidential informationhas been removed)
(Confidentialinformation hasbeen removed)
(Confidentialinformation hasbeen removed)
(Confidentialinformation hasbeen removed)
(Confidentialinformation hasbeen removed)
(Confidentialinformation hasbeen removed)
IRAS, Integrated Research Application System.
ASSESSM
ENTOFTEST
ACCU
RACY
NIHRJournals
Librarywww.journalslibrary.nihr.ac.uk
16
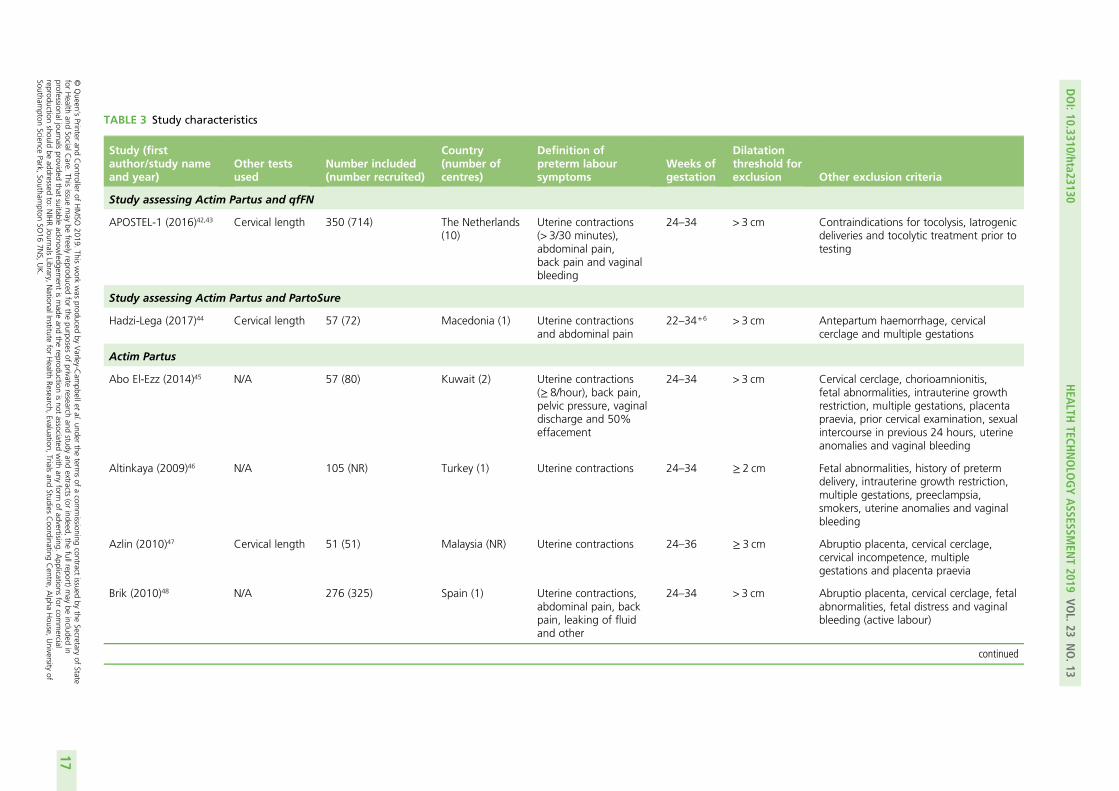
TABLE 3 Study characteristics
Study (firstauthor/study nameand year)
Other testsused
Number included(number recruited)
Country(number ofcentres)
Definition ofpreterm laboursymptoms
Weeks ofgestation
Dilatationthreshold forexclusion Other exclusion criteria
Study assessing Actim Partus and qfFN
APOSTEL-1 (2016)42,43 Cervical length 350 (714) The Netherlands(10)
Uterine contractions(> 3/30 minutes),abdominal pain,back pain and vaginalbleeding
24–34 > 3 cm Contraindications for tocolysis, Iatrogenicdeliveries and tocolytic treatment prior totesting
Study assessing Actim Partus and PartoSure
Hadzi-Lega (2017)44 Cervical length 57 (72) Macedonia (1) Uterine contractionsand abdominal pain
22–34+6 > 3 cm Antepartum haemorrhage, cervicalcerclage and multiple gestations
Actim Partus
Abo El-Ezz (2014)45 N/A 57 (80) Kuwait (2) Uterine contractions(≥ 8/hour), back pain,pelvic pressure, vaginaldischarge and 50%effacement
24–34 > 3 cm Cervical cerclage, chorioamnionitis,fetal abnormalities, intrauterine growthrestriction, multiple gestations, placentapraevia, prior cervical examination, sexualintercourse in previous 24 hours, uterineanomalies and vaginal bleeding
Altinkaya (2009)46 N/A 105 (NR) Turkey (1) Uterine contractions 24–34 ≥ 2 cm Fetal abnormalities, history of pretermdelivery, intrauterine growth restriction,multiple gestations, preeclampsia,smokers, uterine anomalies and vaginalbleeding
Azlin (2010)47 Cervical length 51 (51) Malaysia (NR) Uterine contractions 24–36 ≥ 3 cm Abruptio placenta, cervical cerclage,cervical incompetence, multiplegestations and placenta praevia
Brik (2010)48 N/A 276 (325) Spain (1) Uterine contractions,abdominal pain, backpain, leaking of fluidand other
24–34 > 3 cm Abruptio placenta, cervical cerclage, fetalabnormalities, fetal distress and vaginalbleeding (active labour)
continued
DOI:10.3310/hta23130
HEA
LTHTECH
NOLO
GYASSESSM
ENT2019
VOL.23
NO.13
©Queen
’sPrinter
andController
ofHMSO
2019.This
work
was
producedby
Varley-C
ampbellet
al.under
theterm
sof
acom
missioning
contractissued
bythe
Secretaryof
Statefor
Health
andSocialC
are.This
issuemay
befreely
reproducedfor
thepurposes
ofprivate
researchand
studyand
extracts(or
indeed,the
fullreport)may
beincluded
inprofessionaljournals
providedthat
suitableacknow
ledgement
ismade
andthe
reproductionisnot
associatedwith
anyform
ofadvertising.
Applications
forcom
mercial
reproductionshould
beaddressed
to:NIHRJournals
Library,NationalInstitute
forHealth
Research,Evaluation,
Trialsand
StudiesCoordinating
Centre,
Alpha
House,
University
ofSoutham
ptonScience
Park,Southam
ptonSO
167N
S,UK.
17
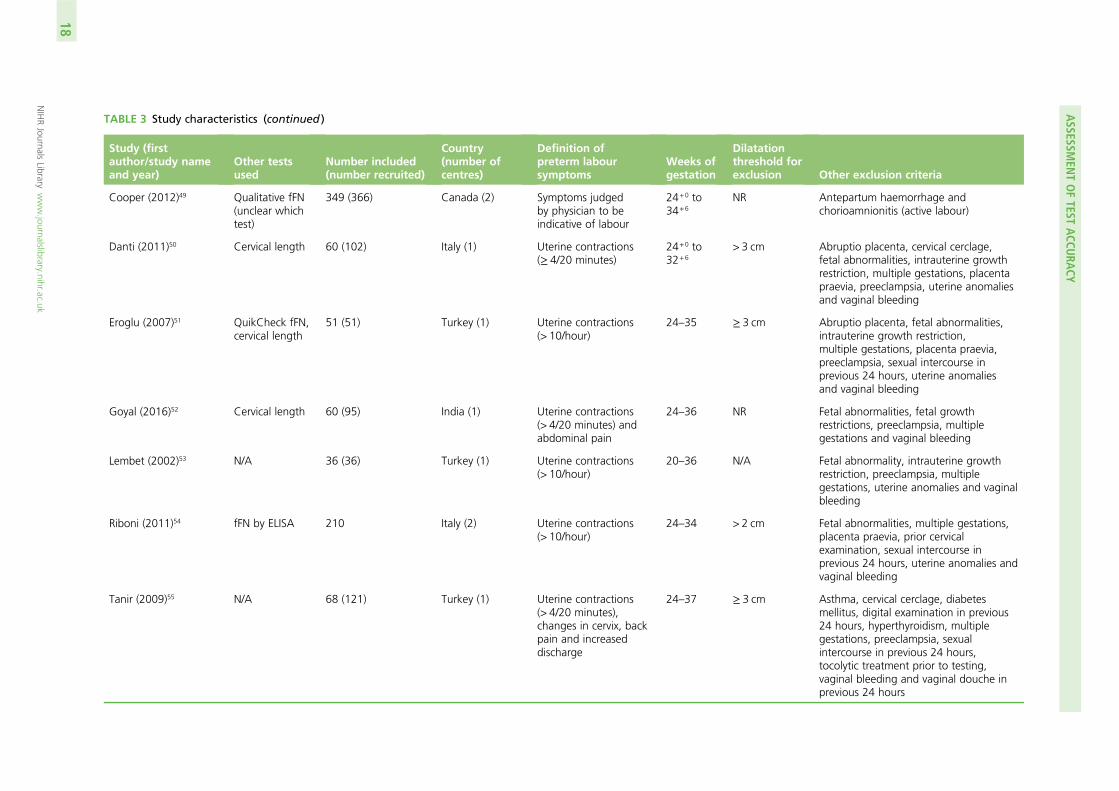
TABLE 3 Study characteristics (continued )
Study (firstauthor/study nameand year)
Other testsused
Number included(number recruited)
Country(number ofcentres)
Definition ofpreterm laboursymptoms
Weeks ofgestation
Dilatationthreshold forexclusion Other exclusion criteria
Cooper (2012)49 Qualitative fFN(unclear whichtest)
349 (366) Canada (2) Symptoms judgedby physician to beindicative of labour
24+0 to34+6
NR Antepartum haemorrhage andchorioamnionitis (active labour)
Danti (2011)50 Cervical length 60 (102) Italy (1) Uterine contractions(≥ 4/20 minutes)
24+0 to32+6
> 3 cm Abruptio placenta, cervical cerclage,fetal abnormalities, intrauterine growthrestriction, multiple gestations, placentapraevia, preeclampsia, uterine anomaliesand vaginal bleeding
Eroglu (2007)51 QuikCheck fFN,cervical length
51 (51) Turkey (1) Uterine contractions(> 10/hour)
24–35 ≥ 3 cm Abruptio placenta, fetal abnormalities,intrauterine growth restriction,multiple gestations, placenta praevia,preeclampsia, sexual intercourse inprevious 24 hours, uterine anomaliesand vaginal bleeding
Goyal (2016)52 Cervical length 60 (95) India (1) Uterine contractions(> 4/20 minutes) andabdominal pain
24–36 NR Fetal abnormalities, fetal growthrestrictions, preeclampsia, multiplegestations and vaginal bleeding
Lembet (2002)53 N/A 36 (36) Turkey (1) Uterine contractions(> 10/hour)
20–36 N/A Fetal abnormality, intrauterine growthrestriction, preeclampsia, multiplegestations, uterine anomalies and vaginalbleeding
Riboni (2011)54 fFN by ELISA 210 Italy (2) Uterine contractions(> 10/hour)
24–34 > 2 cm Fetal abnormalities, multiple gestations,placenta praevia, prior cervicalexamination, sexual intercourse inprevious 24 hours, uterine anomalies andvaginal bleeding
Tanir (2009)55 N/A 68 (121) Turkey (1) Uterine contractions(> 4/20 minutes),changes in cervix, backpain and increaseddischarge
24–37 ≥ 3 cm Asthma, cervical cerclage, diabetesmellitus, digital examination in previous24 hours, hyperthyroidism, multiplegestations, preeclampsia, sexualintercourse in previous 24 hours,tocolytic treatment prior to testing,vaginal bleeding and vaginal douche inprevious 24 hours
ASSESSM
ENTOFTEST
ACCU
RACY
NIHRJournals
Librarywww.journalslibrary.nihr.ac.uk
18
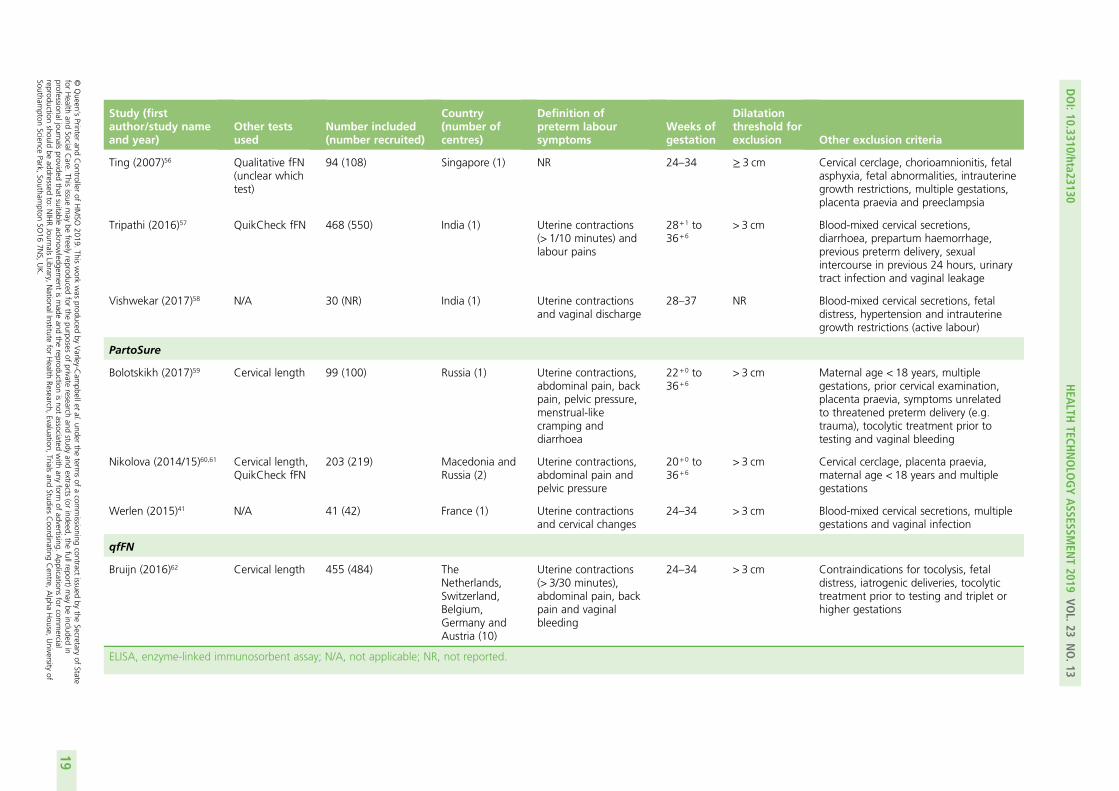
Study (firstauthor/study nameand year)
Other testsused
Number included(number recruited)
Country(number ofcentres)
Definition ofpreterm laboursymptoms
Weeks ofgestation
Dilatationthreshold forexclusion Other exclusion criteria
Ting (2007)56 Qualitative fFN(unclear whichtest)
94 (108) Singapore (1) NR 24–34 ≥ 3 cm Cervical cerclage, chorioamnionitis, fetalasphyxia, fetal abnormalities, intrauterinegrowth restrictions, multiple gestations,placenta praevia and preeclampsia
Tripathi (2016)57 QuikCheck fFN 468 (550) India (1) Uterine contractions(> 1/10 minutes) andlabour pains
28+1 to36+6
> 3 cm Blood-mixed cervical secretions,diarrhoea, prepartum haemorrhage,previous preterm delivery, sexualintercourse in previous 24 hours, urinarytract infection and vaginal leakage
Vishwekar (2017)58 N/A 30 (NR) India (1) Uterine contractionsand vaginal discharge
28–37 NR Blood-mixed cervical secretions, fetaldistress, hypertension and intrauterinegrowth restrictions (active labour)
PartoSure
Bolotskikh (2017)59 Cervical length 99 (100) Russia (1) Uterine contractions,abdominal pain, backpain, pelvic pressure,menstrual-likecramping anddiarrhoea
22+0 to36+6
> 3 cm Maternal age < 18 years, multiplegestations, prior cervical examination,placenta praevia, symptoms unrelatedto threatened preterm delivery (e.g.trauma), tocolytic treatment prior totesting and vaginal bleeding
Nikolova (2014/15)60,61 Cervical length,QuikCheck fFN
203 (219) Macedonia andRussia (2)
Uterine contractions,abdominal pain andpelvic pressure
20+0 to36+6
> 3 cm Cervical cerclage, placenta praevia,maternal age < 18 years and multiplegestations
Werlen (2015)41 N/A 41 (42) France (1) Uterine contractionsand cervical changes
24–34 > 3 cm Blood-mixed cervical secretions, multiplegestations and vaginal infection
qfFN
Bruijn (2016)62 Cervical length 455 (484) TheNetherlands,Switzerland,Belgium,Germany andAustria (10)
Uterine contractions(> 3/30 minutes),abdominal pain, backpain and vaginalbleeding
24–34 > 3 cm Contraindications for tocolysis, fetaldistress, iatrogenic deliveries, tocolytictreatment prior to testing and triplet orhigher gestations
ELISA, enzyme-linked immunosorbent assay; N/A, not applicable; NR, not reported.
DOI:10.3310/hta23130
HEA
LTHTECH
NOLO
GYASSESSM
ENT2019
VOL.23
NO.13
©Queen
’sPrinter
andController
ofHMSO
2019.This
work
was
producedby
Varley-C
ampbellet
al.under
theterm
sof
acom
missioning
contractissued
bythe
Secretaryof
Statefor
Health
andSocialC
are.This
issuemay
befreely
reproducedfor
thepurposes
ofprivate
researchand
studyand
extracts(or
indeed,the
fullreport)may
beincluded
inprofessionaljournals
providedthat
suitableacknow
ledgement
ismade
andthe
reproductionisnot
associatedwith
anyform
ofadvertising.
Applications
forcom
mercial
reproductionshould
beaddressed
to:NIHRJournals
Library,NationalInstitute
forHealth
Research,Evaluation,
Trialsand
StudiesCoordinating
Centre,
Alpha
House,
University
ofSoutham
ptonScience
Park,Southam
ptonSO
167N
S,UK.
19
For Actim Partus, study sizes ranged from 30 in Vishwekar et al.58 to 468 in Tripathi et al.57 and coveredthe following countries: Kuwait,45 Turkey,46,51,53,55 Malaysia,47 Spain,48 Canada,49 Italy,50,54 India52,57,58 andSingapore.56 The three studies assessing PartoSure were conducted in Russia,59 Macedonia60,61 and France41
and the study size ranged from 41 in Werlen et al.41 to 203 in Nikolova et al.61 Finally, the Bruijn study62
assessed qfFN only and recruited 455 participants from 10 centres across Austria, Belgium, Germany, theNetherlands and Switzerland.
Key differences between studiesIt was notable that the prevalence rates of preterm birth differed greatly between studies (see Tables 6and 7). In addition, there were differences between studies in the mode of delivery for included women.The participant inclusion/exclusion criteria also differed between studies. For example, although all studiesincluded women presenting with symptoms of preterm labour with intact membranes, the definition of‘preterm’ (i.e. the number of weeks of gestation) differed between studies. The inclusion/exclusion criteriaof the studies also differed regarding the presenting symptoms of the women, the proportion of womenwith singleton gestations, the risk status of included women, dilatation thresholds applied and otherspecific exclusion criteria.
Differences between studies in prevalence of preterm birthThere was clear variation between studies regarding the prevalence of the reference standard (i.e. theprevalence of preterm birth within 7 days and within 48 hours). Across all 20 studies, prevalence of pretermbirth within 7 days ranged from 1.7% [95% confidence interval (CI) 0.6% to 3.7%] in Cooper et al.49 to73.3% (95% CI 60.3% to 83.9%) in Goyal et al.52 Both of these studies assessed the test accuracy of ActimPartus. Therefore, the studies assessing Actim Partus had a larger range of prevalence (of preterm birthwithin 7 days) than the studies assessing PartoSure and qualitative fFN. However, in the studies assessingPartoSure, prevalence of preterm birth within 7 days still ranged widely (from 2.4%, 95% CI 0.1% to 12.9%in Werlen et al.41 to 17.2%, 95% CI 12.3% to 23.2% in Nikolova et al.61). In the studies assessing qfFN,prevalence of preterm birth within 7 days was slightly higher in APOSTEL-142,43 than in EUIFS62 (19.7%,95% CI 15.7% to 24.3% vs. 10.5%, 95% CI 7.9% to 13.7%, respectively).
Seven studies provided DTA data for the index tests against preterm birth within 48 hours.41,48,52,53,56–58
Across these seven studies, the prevalence of preterm birth within 48 hours ranged from 2.4% (95% CI0.1% to 12.9%) in Werlen et al.41 to 58.3% (95% CI 44.9% to 70.9%) in Goyal et al.52 The study byWerlen et al.41 was the only study assessing PartoSure against preterm birth within 48 hours, with theother six studies48,52,53,56–58 assessing Actim Partus. The lowest prevalence of preterm birth within 48 hourswithin these six Actim Partus studies was 5.3% (95% CI 1.7% to 12.0%) in Ting et al.56
These differences in prevalence displayed between studies are probably attributable to differences in thepopulations recruited into the studies (e.g. differences in gestational age and in presenting symptoms ofpreterm labour; see Differences between studies in inclusion/exclusion criteria) and will also probably havean impact on the DTA data presented in Results of quantitative data synthesis (test accuracy data) and thegeneralisability of these data to the NHS in England.
Differences between studies in mode of deliveryIt is important to know whether women who had non-spontaneous deliveries within the time frame of thereference standard were included or excluded from the test accuracy data; if iatrogenic delivery takes placewithin this time frame, it remains unclear whether or not a spontaneous delivery may have occurred, whichthus makes it impossible to accurately assess the reference standard in these women. Nine of the includedstudies41,45,46,50–52,54,56,57 did not report the mode of delivery (i.e. whether or not birth was spontaneous, orwhether or not there were any planned caesarean sections or inductions).
The other 11 studies42–44,47–49,53,55,58–62 provided some data regarding mode of delivery (Table 4). Four ofthese studies (APOSTEL-1,42,43 Hadzi-Lega et al.,44 EUIFS62 and Bolotskikh et al.59) reported that women whohad a non-spontaneous delivery within the time frame of the reference standard were excluded from the
ASSESSMENT OF TEST ACCURACY
NIHR Journals Library www.journalslibrary.nihr.ac.uk
20
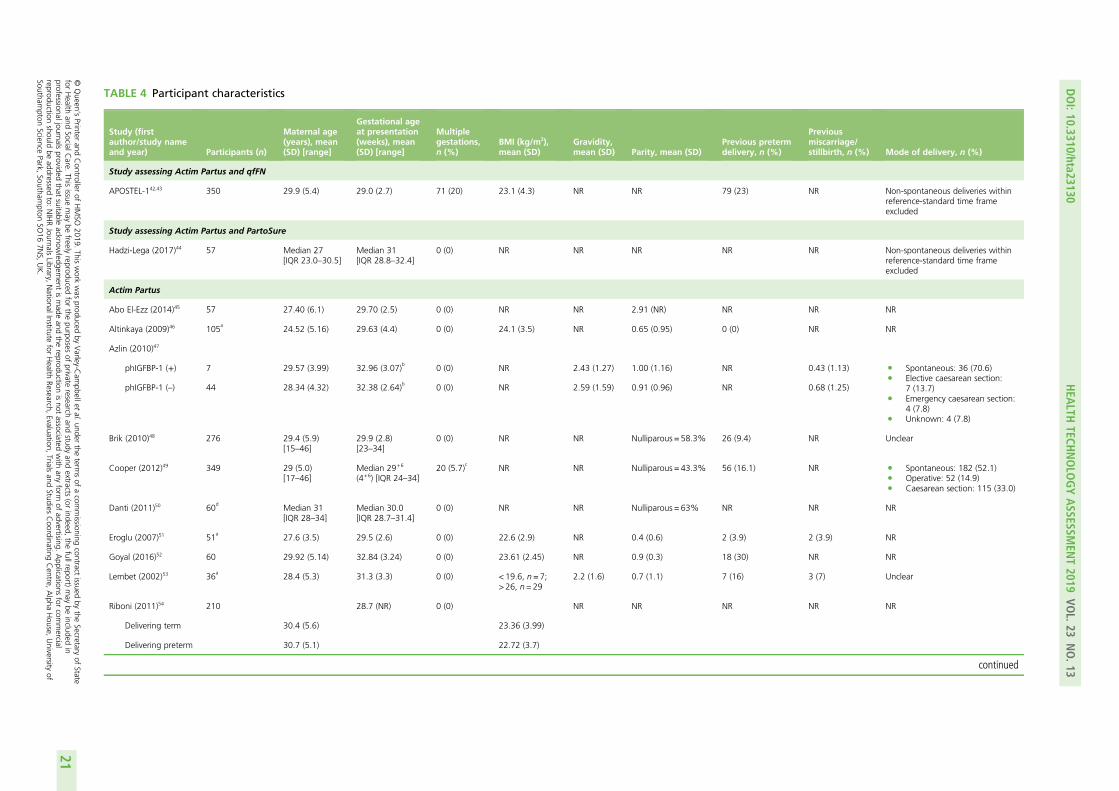
TABLE 4 Participant characteristics
Study (firstauthor/study nameand year) Participants (n)
Maternal age(years), mean(SD) [range]
Gestational ageat presentation(weeks), mean(SD) [range]
Multiplegestations,n (%)
BMI (kg/m2),mean (SD)
Gravidity,mean (SD) Parity, mean (SD)
Previous pretermdelivery, n (%)
Previousmiscarriage/stillbirth, n (%) Mode of delivery, n (%)
Study assessing Actim Partus and qfFN
APOSTEL-142,43 350 29.9 (5.4) 29.0 (2.7) 71 (20) 23.1 (4.3) NR NR 79 (23) NR Non-spontaneous deliveries withinreference-standard time frameexcluded
Study assessing Actim Partus and PartoSure
Hadzi-Lega (2017)44 57 Median 27[IQR 23.0–30.5]
Median 31[IQR 28.8–32.4]
0 (0) NR NR NR NR NR Non-spontaneous deliveries withinreference-standard time frameexcluded
Actim Partus
Abo El-Ezz (2014)45 57 27.40 (6.1) 29.70 (2.5) 0 (0) NR NR 2.91 (NR) NR NR NR
Altinkaya (2009)46 105a
24.52 (5.16) 29.63 (4.4) 0 (0) 24.1 (3.5) NR 0.65 (0.95) 0 (0) NR NR
Azlin (2010)47
phIGFBP-1 (+) 7 29.57 (3.99) 32.96 (3.07)b
0 (0) NR 2.43 (1.27) 1.00 (1.16) NR 0.43 (1.13) l Spontaneous: 36 (70.6)l Elective caesarean section:
7 (13.7)l Emergency caesarean section:
4 (7.8)l Unknown: 4 (7.8)
phIGFBP-1 (–) 44 28.34 (4.32) 32.38 (2.64)b
0 (0) NR 2.59 (1.59) 0.91 (0.96) NR 0.68 (1.25)
Brik (2010)48 276 29.4 (5.9)[15–46]
29.9 (2.8)[23–34]
0 (0) NR NR Nulliparous = 58.3% 26 (9.4) NR Unclear
Cooper (2012)49 349 29 (5.0)[17–46]
Median 29+6
(4+6) [IQR 24–34]20 (5.7)
cNR NR Nulliparous = 43.3% 56 (16.1) NR l Spontaneous: 182 (52.1)
l Operative: 52 (14.9)l Caesarean section: 115 (33.0)
Danti (2011)50 60d
Median 31[IQR 28–34]
Median 30.0[IQR 28.7–31.4]
0 (0) NR NR Nulliparous = 63% NR NR NR
Eroglu (2007)51 51a
27.6 (3.5) 29.5 (2.6) 0 (0) 22.6 (2.9) NR 0.4 (0.6) 2 (3.9) 2 (3.9) NR
Goyal (2016)52 60 29.92 (5.14) 32.84 (3.24) 0 (0) 23.61 (2.45) NR 0.9 (0.3) 18 (30) NR NR
Lembet (2002)53 36a
28.4 (5.3) 31.3 (3.3) 0 (0) < 19.6, n = 7;> 26, n= 29
2.2 (1.6) 0.7 (1.1) 7 (16) 3 (7) Unclear
Riboni (2011)54 210 28.7 (NR) 0 (0) NR NR NR NR NR
Delivering term 30.4 (5.6) 23.36 (3.99)
Delivering preterm 30.7 (5.1) 22.72 (3.7)
continued
DOI:10.3310/hta23130
HEA
LTHTECH
NOLO
GYASSESSM
ENT2019
VOL.23
NO.13
©Queen
’sPrinter
andController
ofHMSO
2019.This
work
was
producedby
Varley-C
ampbellet
al.under
theterm
sof
acom
missioning
contractissued
bythe
Secretaryof
Statefor
Health
andSocialC
are.This
issuemay
befreely
reproducedfor
thepurposes
ofprivate
researchand
studyand
extracts(or
indeed,the
fullreport)may
beincluded
inprofessionaljournals
providedthat
suitableacknow
ledgement
ismade
andthe
reproductionisnot
associatedwith
anyform
ofadvertising.
Applications
forcom
mercial
reproductionshould
beaddressed
to:NIHRJournals
Library,NationalInstitute
forHealth
Research,Evaluation,
Trialsand
StudiesCoordinating
Centre,
Alpha
House,
University
ofSoutham
ptonScience
Park,Southam
ptonSO
167N
S,UK.
21
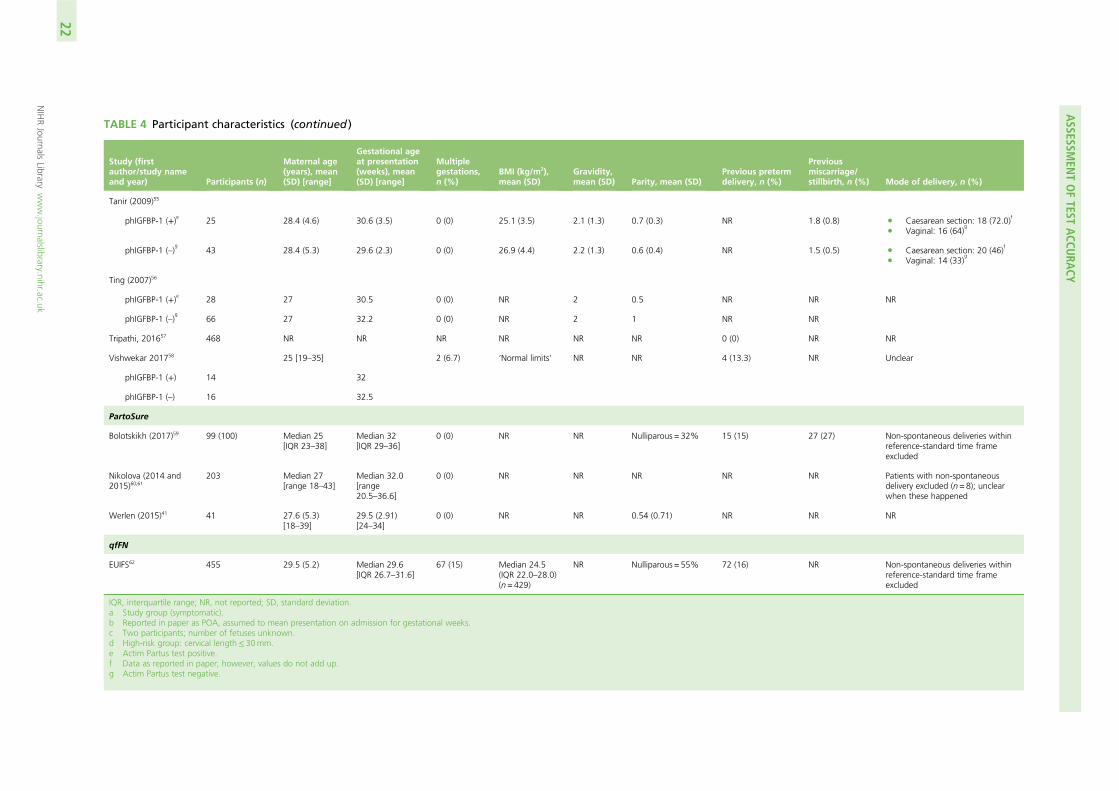
TABLE 4 Participant characteristics (continued )
Study (firstauthor/study nameand year) Participants (n)
Maternal age(years), mean(SD) [range]
Gestational ageat presentation(weeks), mean(SD) [range]
Multiplegestations,n (%)
BMI (kg/m2),mean (SD)
Gravidity,mean (SD) Parity, mean (SD)
Previous pretermdelivery, n (%)
Previousmiscarriage/stillbirth, n (%) Mode of delivery, n (%)
Tanir (2009)55
phIGFBP-1 (+)e 25 28.4 (4.6) 30.6 (3.5) 0 (0) 25.1 (3.5) 2.1 (1.3) 0.7 (0.3) NR 1.8 (0.8) l Caesarean section: 18 (72.0)f
l Vaginal: 16 (64)g
phIGFBP-1 (–)g
43 28.4 (5.3) 29.6 (2.3) 0 (0) 26.9 (4.4) 2.2 (1.3) 0.6 (0.4) NR 1.5 (0.5) l Caesarean section: 20 (46)f
l Vaginal: 14 (33)g
Ting (2007)56
phIGFBP-1 (+)e 28 27 30.5 0 (0) NR 2 0.5 NR NR NR
phIGFBP-1 (–)g
66 27 32.2 0 (0) NR 2 1 NR NR
Tripathi, 201657 468 NR NR NR NR NR NR 0 (0) NR NR
Vishwekar 201758 25 [19–35] 2 (6.7) ‘Normal limits’ NR NR 4 (13.3) NR Unclear
phIGFBP-1 (+) 14 32
phIGFBP-1 (–) 16 32.5
PartoSure
Bolotskikh (2017)59 99 (100) Median 25[IQR 23–38]
Median 32[IQR 29–36]
0 (0) NR NR Nulliparous = 32% 15 (15) 27 (27) Non-spontaneous deliveries withinreference-standard time frameexcluded
Nikolova (2014 and2015)60,61
203 Median 27[range 18–43]
Median 32.0[range20.5–36.6]
0 (0) NR NR NR NR NR Patients with non-spontaneousdelivery excluded (n= 8); unclearwhen these happened
Werlen (2015)41 41 27.6 (5.3)[18–39]
29.5 (2.91)[24–34]
0 (0) NR NR 0.54 (0.71) NR NR NR
qfFN
EUIFS62 455 29.5 (5.2) Median 29.6[IQR 26.7–31.6]
67 (15) Median 24.5(IQR 22.0–28.0)(n= 429)
NR Nulliparous = 55% 72 (16) NR Non-spontaneous deliveries withinreference-standard time frameexcluded
IQR, interquartile range; NR, not reported; SD, standard deviation.a Study group (symptomatic).b Reported in paper as POA, assumed to mean presentation on admission for gestational weeks.c Two participants; number of fetuses unknown.d High-risk group: cervical length≤ 30mm.e Actim Partus test positive.f Data as reported in paper; however, values do not add up.g Actim Partus test negative.
ASSESSM
ENTOFTEST
ACCU
RACY
NIHRJournals
Librarywww.journalslibrary.nihr.ac.uk
22
test accuracy data. Women who had a non-spontaneous delivery outside the time frame of the referencestandard should not be excluded as these women would be considered to be reference-standard negativesin any case (i.e. they did not deliver within 48 hours or within 7 days). In a further three studies (Vishwekaret al.,58 Brik et al.48 and Nikolova et al.60,61), iatrogenic delivery was mentioned as a reason for exclusion,but it is unclear how many of these deliveries took place within the time frame of the reference standard,and in another study (Lembet et al.53) the number of iatrogenic deliveries could not be ascertained.
In three studies,47,49,55 the numbers of spontaneous/iatrogenic deliveries were reported, but no exclusion ofdata from non-spontaneous deliveries was made. In the study by Azlin et al.,47 70.6% of women deliveredspontaneously, 7.8% underwent an emergency caesarean section and for a further 7.8% there were nodata available on mode of delivery. Although 13.7% of women delivered by a planned caesarean section,it is unclear whether or not these took place within the time frame of the reference standard, and thesewomen were not excluded from the test accuracy data.47 In Cooper et al.,49 52.1% of women deliveredspontaneously, 14.9% had an operative delivery and 33.0% had a caesarean section, although, again,it was unclear how many of these procedures were planned and how many took place within the timeframe of the reference standard. Finally, Tanir et al.55 report the proportion of women who delivered bycaesarean section or from vaginal delivery; however, these data do not appear to be correct (see Table 4).
Differences between studies in inclusion/exclusion criteriaThere are several ways in which the participant inclusion/exclusion criteria differed between studies(see Table 3). It is likely that many of these differences had an impact on the prevalence of preterm labourand, thus, test accuracy data. However, insufficient data were provided to fully assess these relationships.
Gestational age Of the 20 included studies, 14 recruited women from 24 weeks’ gestation onwards(see Table 3).41–43,45–52,54–56,62 In these 14 studies, the upper limit of gestation varied widely: eight studiesrecruited women at gestation of up to 34 weeks,41–43,45,46,48,54,56,62 with the upper limit of gestation rangingfrom 32+6 weeks (Danti et al.50) to 37 weeks (Tanir et al.55) in the remaining six studies.
Of the remaining six studies, four recruited women at an earlier gestation: two studies53,61 recruited womenfrom as early as 20 weeks’ gestation and two studies44,59 included women from 22 weeks’ gestation. Two ofthese studies recruited women up until 36+6 weeks,59,61 one recruited women up until 36 weeks53 and theother recruited women up until 34+6 weeks.44 The other two studies57,58 recruited women at a later gestation(i.e. from 28 weeks’ gestation), with both recruiting up until 37 weeks (36+6 weeks for Tripathi et al.57).
None of the studies presented test accuracy data between different gestational cut-off points. It was notpossible, therefore, to make any within-study assessment, for any of the index tests, whether or not testaccuracy differed based on gestation.41–62
Presenting symptoms of preterm labour Other than stating that women had to be symptomatic,all studies except for Ting et al.56 provided some further details about the presenting symptoms of pretermlabour. However, one further study (Cooper et al.49) added only that that ‘symptoms indicative of labourwere to be determined by a physician’.
All other studies reported uterine contractions as a necessary indicator of preterm labour.41–48,50–55,57–62
Ten studies additionally described the rate of uterine contractions necessary for inclusion: a rate of sixcontractions per hour was reported by Tripathi et al.,57 Bruijn62 and APOSTEL-1,42,43 a rate of eightcontractions per hour was reported by Abo El-Ezz et al.,45 a rate of 10 contractions per hour was reportedby Eroglu et al.,51 Riboni et al.54 and Lembet et al.53 and a rate of 12 contractions per hour was reported byDanti et al.,50 Goyal et al.52 and Tanir et al.55
Other commonly reported symptoms included in definitions of preterm labour were abdominal pain(in seven studies42–44,48,52,59–62), back pain (in six studies42,43,45,48,55,59,62), pelvic pressure (in three studies45,59–61),vaginal bleeding (in the APOSTEL-1 and Bruijn studies42,43,62) and vaginal discharge (in three studies45,55,58).
DOI: 10.3310/hta23130 HEALTH TECHNOLOGY ASSESSMENT 2019 VOL. 23 NO. 13
© Queen’s Printer and Controller of HMSO 2019. This work was produced by Varley-Campbell et al. under the terms of a commissioning contract issued by the Secretary of Statefor Health and Social Care. This issue may be freely reproduced for the purposes of private research and study and extracts (or indeed, the full report) may be included inprofessional journals provided that suitable acknowledgement is made and the reproduction is not associated with any form of advertising. Applications for commercialreproduction should be addressed to: NIHR Journals Library, National Institute for Health Research, Evaluation, Trials and Studies Coordinating Centre, Alpha House, University ofSouthampton Science Park, Southampton SO16 7NS, UK.
23

Singleton/multiple pregnancies The majority of included studies were based on samples that onlyincluded women with singleton pregnancies. However, based on the protocol amendment, four studies wereincluded that recruited women with multiple gestation pregnancies. One of these studies assessed two indextests in the same population [APOSTEL-1 (qfFN and Actim Partus)] and 20% of the included pregnancieswere multiple pregnancies.42,43 Two of these studies assessed only Actim Partus, with one (Cooper et al.49)having 6% of included pregnancies as multiple pregnancies and the other (Vishwekar et al.58) having 7% ofincluded pregnancies as multiple pregnancies. The final study that included multiple pregnancies (Bruijn62)only assessed qfFN, and they made up 15% of the population. We are not aware of any published evidenceto suggest that multifetal pregnancies would alter the DTA of either qfFN or Actim Partus.
Risk status of participants Only one of the included studies (Bolotskikh et al.59) clearly reported the riskstatus of included women (i.e. whether or not the women were at high or low risk for preterm labourprior to the onset of symptoms). In this study, the population was described as high risk because 15% ofthe participants had previously experienced preterm labour, 43% had mild preeclampsia and 51% werepreviously hospitalised during the pregnancy.59 However, although none of the other studies explicitlystated that the populations were at high risk of preterm labour, eight additional studies42,43,48,49,51–53,58,62
also recruited some women who had previously experienced preterm delivery (see Table 4). In addition,two studies (APOSTEL-142,43 and Danti et al.50) restricted their population by conducting tests in womenpresenting with a cervical length of < 30 mm. However, this high-risk status is associated with symptomsat presentation rather than the women being high risk prior to the onset of symptoms.
Recruiting high-risk women would be expected to have an impact on the prevalence of preterm birth.However, because almost all studies did not clearly report risk status, it is not possible to properly assess ifor how this had an impact on prevalence rates (and, therefore, test accuracy data).
Dilatation threshold and cervical length All studies except Cooper et al.,49 Goyal et al.,52 Lembetet al.53 and Vishwekar et al.58 included a dilatation threshold for exclusion; typically, the threshold was> 3 cm or ≥ 3 cm. However, Riboni et al.54 had a dilatation threshold of > 2 cm and Altinkaya et al.46
had a threshold of ≥ 2 cm.
Studies were not excluded on the basis of access to cervical length measurement (lack of access was unlikelyto be reported in studies). Indeed, studies that did not report the use of cervical length measurement didnot explicitly cite lack of access or discuss the suitability of cervical length measurement for the includedpopulation. Cervical length measurement was conducted in nine of the included studies.42–44,47,50–52,59–62
In seven of these studies,44,47,51,52,59–62 no selection of women took place in accordance with cervical lengthmeasurement, and, therefore, it is not expected that the women in these studies would substantively differfrom women who would not have access to cervical length measurement in clinical practice. However, inthe other two studies (APOSTEL-142,43 and Danti et al.50), all women included in final analyses of index testdata had a transvaginal cervical length measurement of ≤ 30 mm, which would probably increase theprevalence of preterm birth in these studies. Both of these studies were assessing Actim Partus, withAPOSTEL-1 additionally assessing qfFN.42,43,50
Other exclusion criteria Other criteria for exclusion differed substantially between studies (see Table 3for specific details). Across studies, exclusion criteria included abruptio placenta, antepartum haemorrhage,contraindications for tocolysis, cervical cerclage, cervical incompetence, chorioamnionitis, diabetes mellitus,diarrhoea, digital examination in the previous 24 hours, fetal asphyxia, fetal abnormalities, fetal distress,history of preterm delivery, hypertension, hyperthyroidism, iatrogenic deliveries, intrauterine growthrestriction, maternal age of < 18 years, multiple gestations, placenta praevia, preeclampsia, prior cervicalexamination, sexual intercourse in the previous 24 hours, smokers, symptoms unrelated to threatenedpreterm delivery (e.g. trauma), tocolytic treatment prior to testing, urinary tract infection, uterine anomalies,vaginal bleeding, vaginal douche in the previous 24 hours, vaginal infection and vaginal leakage.41–62
All exclusion criteria were reasonable in the context of the index tests under consideration (see Qualityappraisal summary).
ASSESSMENT OF TEST ACCURACY
NIHR Journals Library www.journalslibrary.nihr.ac.uk
24

Summary of the reference standardIn all studies, the reference standard was preterm birth, within 48 hours and/or within 7 days.41–62
All 20 included studies evaluated the index tests against the 7-day reference standard.41–62 Six of theActim Partus studies48,52,53,56–58 and one PartoSure study41 also evaluated the index test against a 48-hourreference standard. qfFN was not evaluated against the 48-hour reference standard.42,43,62
Summary of test administrationThe manufacturers’ descriptions of the index tests and how they should be used are presented in Table 1.The quantity and quality of reported details regarding how each test was performed within a studyvaried considerably.
Actim PartusIn the 16 studies that used the Actim Partus test,43,45–58 the information provided on how the test wasadministered typically followed the manufacturer’s guidance; however, there were some differences.The reporting of detection-limit thresholds varied between studies, but it is likely that all studies used athreshold of 10 µg/l: eight studies clearly reported a detection limit of 10 µg/ml.45,49,50,52–54,57,58 Twostudies46,51 reported that samples higher than 30 µg/l give ‘a strong positive result’. It is unclear in both ofthese studies whether or not a weak positive at 10 µg/l would have been considered a positive result,although this appears to be the case.46,51 One study48 states that a threshold of 30 µg/l was required for apositive result, and that this shows as two blue lines on the dipstick, but this is incorrect (two blue linesshow at 10 µg/l). Finally, five studies41,43,44,47,55,56 did not report what detection limit they used; however,given the qualitative nature of the test, it appears most likely that a 10-µg/l threshold was used. Indeed,the manufacturer’s guidance indicates that a concentration of ≥ 10 µg/l in the cervical fluid causes apositive Actim Partus test reaction result.
All studies report taking their sample from around the external cervical orifice or cervical os or as a cervicalspecimen.43–58 However, two studies43,56 report that the sample was taken from the posterior fornix.The instructions from the manufacturer state that the sample should be taken from the cervical os. Ourobstetric clinical experts have advised that samples taken from the posterior fornix would probably yield ahigher false-negative rate because the secretion samples differ between the two areas and concentrationsare likely to be weaker from the posterior fornix. A difference in secretion sample concentration betweencervical locations has been demonstrated by Kuhrt et al.,63 although using the qfFN test, it is likely thatActim Partus would be affected in a similar manner.
The manufacturer’s instructions state that if the single (control) line does not appear then the test is invalid.However, one study55 interpreted no visible lines as a positive test result. This was their way of dealing withmissing data owing to invalid results. This is unlikely to greatly alter results as only two tests from 68 resultswere invalid.55 The remaining studies did not report details on how invalid tests were treated.
Two studies43,49 both froze their samples at –20 °C for future analysis. In APOSTEL-1,43 samples werereported to have been transferred and stored at –80 °C within 6 months. It is unknown how long after thetransfer samples remained in storage before testing; however, it is likely that total storage time would haveexceeded 6 months.43 Likewise, in the study by Cooper et al.49 it is unclear how long the tests remainedfrozen before testing. Both of these studies43,49 go on to describe that samples were thawed before theActim Partus test was run. This protocol differs from the manufacturer’s guidance (and, of course, clinicalpractice), in which freezing a sample is not discussed in the instructions for use. We have received clinicalinput from our obstetricians to suggest that freezing is unlikely to affect the sample’s integrity and,therefore, is unlikely to have an impact on test accuracy.
PartoSureAll four studies assessing the PartoSure test appeared to conduct the test in a manner that was consistentwith the manufacturer’s guidance.41,44,59–61 However, Bolotskikh et al.59 did not specifically report thatsamples were collected using a speculum.
DOI: 10.3310/hta23130 HEALTH TECHNOLOGY ASSESSMENT 2019 VOL. 23 NO. 13
© Queen’s Printer and Controller of HMSO 2019. This work was produced by Varley-Campbell et al. under the terms of a commissioning contract issued by the Secretary of Statefor Health and Social Care. This issue may be freely reproduced for the purposes of private research and study and extracts (or indeed, the full report) may be included inprofessional journals provided that suitable acknowledgement is made and the reproduction is not associated with any form of advertising. Applications for commercialreproduction should be addressed to: NIHR Journals Library, National Institute for Health Research, Evaluation, Trials and Studies Coordinating Centre, Alpha House, University ofSouthampton Science Park, Southampton SO16 7NS, UK.
25

Fetal fibronectinOf the two studies that used the qfFN test, one study (Bruijn62) appeared to conduct the test in accordancewith the manufacturer’s guidance. The other study (APOSTEL-142) froze the samples as reported in Studiesevaluating more than one index test. This is not in accordance with the manufacturer’s guidance, whichstates that in order to avoid degradation of the analyte, frozen samples should be assayed within 3 months.
Time to test resultsBased on the manufacturers’ instructions, the maximum time between taking the sample and receiving thetest results (including time for mixing in solvents, etc.) is approximately 6 minutes for Actim Partus andPartoSure, and 12 minutes for qfFN. Some of the studies provided information within their methods relatingto the maximum time that test personnel had to wait before reading the result from the test. This wasalways in accordance with the manufacturers’ guidance.
None of the 20 studies included in our review reported, in the study results, how long it took to conductthe test and receive a result; therefore, no further data can be presented on this outcome.
Test failure ratesOnly two studies (Goyal et al.52 and Tanir et al.55), both of which evaluated Actim Partus, reported informationabout test failures: Goyal et al.52 reported that there were no invalid tests and Tanir et al.55 reported that therewere two cases in which the Actim Partus test failed to show any visible lines. For these two women, the testresult was not assigned as invalid and the tests were not re-run; they were instead assigned as positive ActimPartus results.52,55 It was not clear whether these two women had a preterm delivery within 48 hours or within7 days (i.e. whether they were assigned as true positive or false positive); therefore, it was not possible toconduct sensitivity analyses when these two cases were assigned as negative test results.
Frozen samplesFollowing the protocol amendment to include studies using frozen samples, two additional studies(APOSTEL-142 and Cooper et al.49) were included. Methodological details on freezing of the samples aredescribed in the previous sections Actim Partus and PartoSure, and are further discussed in Quality appraisalof included studies. We have received clinical input from our obstetricians to suggest that freezing of thesample is unlikely to affect the integrity of the sample, even if thawed outside the time frame suggested bythe manufacturer’s guidance, and is, therefore, unlikely to have a major impact on test accuracy. However,it should be noted that we have no published data to verify this.
Description of included participants
Studies evaluating more than one index testThe APOSTEL-1 study, which evaluated both Actim Partus and qfFN in the same population, recruited350 participants.42,43 The characteristics of these participants are reported in Table 4. To summarise, themean maternal age was 29.9 years [standard deviation (SD) 5.4 years] and the mean gestational ageat presentation was 29.0 weeks (SD 2.7 weeks). In this study,42,43 20% of the participants (n = 71) hadmultiple gestations and 23% (n = 79) had previously delivered preterm.
The other study evaluating more than one index test in the same population was a much smallerstudy: Hadzi-Lega et al.44 assessed both Actim Partus and PartoSure and recruited 57 participants. Thecharacteristics of these participants are also reported in Table 4. In this study,44 the median maternal agewas reported as 27 years [interquartile range (IQR) 23.0–30.5 years] and the median gestational age atpresentation was reported as 31 weeks (IQR 28.8–32.4 weeks).
Actim PartusIn the 16 Actim Partus studies (including APOSTEL-142,43 and Hadzi-Lega et al.44),42–44,57,58 sample sizesranged from 30 in Vishwekar et al.58 to 468 in Tripathi et al.57 Reported maternal ages ranged from a meanof 24.5 years (SD 5.16 years) in Altinkaya et al.46 to a median of 31 years (IQR 28–34 years) in Danti et al.50
ASSESSMENT OF TEST ACCURACY
NIHR Journals Library www.journalslibrary.nihr.ac.uk
26
Gestation ranged from a mean of 28.7 weeks (SD not reported) in Riboni et al.54 to 32.8 weeks(SD 3.24 weeks) in Goyal et al.52 Further details describing the participant characteristics in each studyare given in Table 4.
Three43,49,58 of the 16 studies assessing Actim Partus included participants with multiple gestations (20%,n = 71;43 6%, n = 20;49 and 7%, n = 258). Previous preterm delivery was reported in seven studies,43,48,49,51–53,58
and prevalence ranged from 3.9% (n = 2) in Eroglu et al.51 to 30% (n = 18) in Goyal et al.52
PartoSureIn the four PartoSure studies,41,44,59–61 sample sizes ranged from 41 in Werlen et al.41 to 203 in Nikolova et al.61
Reported maternal age ranged from a median of 25 years (IQR 23–38 years) in Bolotskikh et al.59 to a medianof 27 years in Nikolova et al.60,61 (range 18–43 years) and Hadzi-Lega et al.44 (IQR 23–30.5 years). Gestationalages ranged from a mean of 29.5 weeks (SD 2.91 weeks) in Werlen et al.41 to a median of 32 weeks (range20.5–36.6 weeks) in Nikolova et al.60,61 Further details describing the participant characteristics in each studyare given in Table 4.
Quantitative fetal fibronectinIn the two studies assessing qfFN (APOSTEL-142 and Bruijn62), sample sizes were 350 and 455, respectively.Maternal age was similar in these two studies [mean 29.9 years (SD 5.4 years) in APOSTEL-142 and mean29.5 years (SD 5.2 years) in Bruijn62], as was gestation [mean 29.0 weeks (SD 2.7 weeks) in APOSTEL-142 andmedian 29.6 weeks (IQR 26.7–31.6 weeks) in Bruijn62]. The APOSTEL-1 study42 had a higher proportion ofmultiple pregnancies than Bruijn62 [20% (n = 71) in APOSTEL-142 vs. 15% (n = 67) in Bruijn62]. Proportionallymore women had previously delivered preterm in APOSTEL-142 than in Bruijn62 [23% (n = 79) in APOSTEL-142
vs. 16% (n = 72) in Bruijn62]. Further details describing the participant characteristics in each study are givenin Table 4.
Summary of any treatments givenThe index tests of interest are designed to be used before the reference standard (the occurrence ofpreterm delivery within 48 hours and/or 7 days). For this reason, it is important to consider the use ofany treatments that might have an impact on the reference standard and, thus, the test accuracy results.Whether or not a woman received treatment for symptoms of preterm labour varied substantially betweenstudies. This variability was based on (1) the standard treatment protocols used within each study and(2) the test(s) used to initiate treatment within the study (e.g. Actim Partus, PartoSure or qfFN or anothertest that is not being assessed as part of this review, such as transvaginal cervical length). Subsequently,when treatment was given, the number of women receiving treatment was not always reported, particularlywith reference to the results of the diagnostic tests of interest. This means that in several cases it is difficultto ascertain the extent to which treatments may have had an impact on the test accuracy results.
Studies evaluating more than one index testTreatment decisions from the APOSTEL-1 trial42,43 were not based on the test results of Actim Partus orqfFN alone. Instead, treatment decisions were based on the combined results of two tests not beingassessed in this review (cervical length measurement and qfFN with a threshold of 50 ng/ml). In addition, astrict treatment protocol was not used; instead, recommendations were provided. Tocolytics (a choice fromnifedipine, indomethacin, Atosiban and ritodrine) were recommended for women with a cervical length of< 10 mm but not for women with a cervical length of > 30 mm. Women with a cervical length between10 mm and 30 mm and a positive fFN result were encouraged to receive tocolytics, whereas those with anegative fFN result received tocolytics at the discretion of the advising clinician. Corticosteroids werepermitted at the clinician’s discretion. No data were provided on how many women received tocolyticsor corticosteroids.
Treatment decisions from the study by Hadzi-Lega et al.44 (a single-centre study assessing both Actim Partusand PartoSure) followed the standard of care at the hospital. This included hospitalisation, discharge,tocolytics (including beta-mimetics and calcium channel blockers) and corticosteroids (e.g. betamethasone).
DOI: 10.3310/hta23130 HEALTH TECHNOLOGY ASSESSMENT 2019 VOL. 23 NO. 13
© Queen’s Printer and Controller of HMSO 2019. This work was produced by Varley-Campbell et al. under the terms of a commissioning contract issued by the Secretary of Statefor Health and Social Care. This issue may be freely reproduced for the purposes of private research and study and extracts (or indeed, the full report) may be included inprofessional journals provided that suitable acknowledgement is made and the reproduction is not associated with any form of advertising. Applications for commercialreproduction should be addressed to: NIHR Journals Library, National Institute for Health Research, Evaluation, Trials and Studies Coordinating Centre, Alpha House, University ofSouthampton Science Park, Southampton SO16 7NS, UK.
27
Thirty-eight of 57 women (67%) received corticosteroids, four of whom had a preterm birth within 7 days.Thirty-eight of 57 women (67%) received tocolytics (note that not all patients who received corticosteroidsreceived tocolytics), six of whom had a preterm birth within 7 days. No details were provided for either ofthe test results in correlation to treatment administration.44
Actim PartusSixteen studies assessed Actim Partus, two of which (APOSTEL-142,43 and Hadzi-Lega et al.44) also assessedanother index test and have been discussed previously (see Studies evaluating more than one index test).The remaining 14 studies45–58 all report the use of tocolytics and most specify the type (typically Atosiban,calcium channel blockers, nifedipine, ritodrine or magnesium sulphate). All of these studies except Azlinet al.47 report the use of corticosteroids (either betamethasone or dexamethasone, when specified).
One study reports that cervical length measurements were available to managing clinicians and were usedto aid treatment decisions.50 Of the 60 patients in this study, 22 (37%) received tocolytics and 28 (47%)received corticosteroids.
In another study,51 it is reported that patients were admitted to hospital based on frequency of contractionsand digital examination. In this study, women at > 34 weeks’ gestation did not receive any tocolytics orcorticosteroids. In total, 16 out of 51 patients (31%) received tocolytics, eight of whom had a positiveActim Partus result; the study does not report the number of patients who received corticosteroids.51 In afurther four studies,53,54,57,58 treatment decisions were also guided by gestational age. In Lembet et al.53
patients at > 34 weeks’ gestation were not administered tocolytics, those at > 24 weeks’ gestation receivedcorticosteroids and those at < 28 weeks’ gestation received a repeat dose. In this study, 21 out of 36 patients(58%) received tocolytics, eight of whom had a positive Actim Partus test result.53 In Riboni et al.,54 womenat < 34 weeks’ gestation received corticosteroids, and all patients received tocolytics. In the studies by Tripathiet al.57 and Vishwekar et al.,58 women at < 34 weeks’ gestation received tocolytics and corticosteroids. Thestudies by Riboni et al.,54 Tripathi et al.57 and Vishwekar et al.58 do not report the proportion of patients whoreceived these treatments (or the Actim Partus results of these patients).
Five studies state that treatment decisions were based on standard hospital protocol.47–49,52,56 In thesestudies, it is largely unclear whether diagnostic tests, symptoms or maternal characteristics (e.g. gestation)were used to guide decision-making. Four of these studies report details on the proportion of patientsreceiving treatment. In the study by Azlin et al.,47 12 out of 51 patients (24%) received tocolytics (two ofwhom had a positive Actim Partus result), but no details were reported regarding how many patientsreceived corticosteroids. In the study by Brik et al.,48 213 out of 276 patients (77%) received tocolyticsand 200 (73%) received corticosteroids. In the study by Cooper et al.,49 8 out of 349 patients receivedtocolytics (2%) and 56 (16%) received corticosteroids. In the study by Goyal et al.,52 all patients receivedtocolytics and the number receiving corticosteroids was unclear. The number of patients receiving tocolyticsor corticosteroids was not reported in Ting et al.56
The remaining three studies report limited detail regarding how treatment decisions were made.45,46,55
In the studies by Abo El-Ezz et al.45 and Altinkaya et al.,46 all patients were admitted to hospital. Abo El-Ezzet al.45 report that all patients received tocolytics, and it is unclear how many patients received corticosteroids.In the study by Altinkaya et al.,46 patients whose symptoms persisted received tocolytics, and all patientswere administered corticosteroids. Neither of these studies report details regarding the Actim Partus resultsof those receiving treatment. In the study by Tanir et al.,55 63 out of 69 patients (93%) received tocolytictherapy (23 of whom had a positive Actim Partus test result). The number of patients receiving corticosteroidswas not reported.55
PartoSureFour studies assessed PartoSure, one of which44 also assessed another index test and has been discussedpreviously (see Studies evaluating more than one index test).
ASSESSMENT OF TEST ACCURACY
NIHR Journals Library www.journalslibrary.nihr.ac.uk
28

In one of the remaining three studies,59 tocolytics were given irrespective of test outcomes (all admittedwomen were treated). In another study,41 treatment was at the discretion of the investigator in accordancewith the protocol of the department. Of the 41 women in this study, 13 received corticosteroids and25 received tocolytics, but no details were provided for treatment administration in connection with thePartoSure test results. In the remaining study,60,61 no treatment protocols were reported.
Quantitative fetal fibronectinTwo studies assessed qfFN, one of which (APOSTEL-142,43) also assessed another index test and has beendiscussed previously (see Studies evaluating more than one index test).42–44
In the other study (Bruijn62), treatment with tocolytics and steroids was based on a combination of cervicallength and the qfFN result at a threshold of 50 ng/ml, neither of which are index tests in this review.In addition, no data were provided on how many women received treatments.
Quality appraisal of included studiesQuality appraisal was conducted, using phase 3 of the QUADAS-2 tool,39 for all 20 studies. Phase 3 of theQUADAS-2 tool contains four domains: patient selection, index tests, reference standard, and flow andtiming. The APOSTEL-1 study42,43 and the study by Hadzi-Lega et al.44 each assess two index tests (ActimPartus and qfFN, and PartoSure and Actim Partus, respectively). For these two studies, the index testdomain was conducted separately for each test.
It is important to note that the QUADAS-239 tool assesses the likely risk of bias and not the presence ormagnitude of bias. Therefore, any rating of ‘high’ means that the risk of bias is high but does not meanthat there is a high degree of bias, or even that bias has been detected. The quality of the included studiesis discussed in the following sections, and a summary of the QUADAS-2 ratings is provided in Table 5.Further details relating to patient selection, index tests, reference standard, and flow and timing can alsobe found in Table 5.
Quality appraisal summaryAll of the included studies were single-gate DTA studies rather than case–control studies. A key issue tonote is that only two studies (APOSTEL-142,43 and Hadzi-Lega et al.44) evaluated more than one index test inthe same population. Thus, only these two studies allow for a direct comparison between the index tests.Any comparisons made between the tests based on the other studies will be subject to confounding(i.e. owing to differences in the recruited populations, hospitals and other factors that may have an impacton whether or not a woman is likely to have a preterm delivery).
Although all of the included studies recruited appropriate populations, in the majority of studies there wasa lack of clarity regarding recruitment procedures and so an assessment cannot be made regarding whetheror not the selection of women in these studies could have introduced bias. Indeed, only five studies, fourof which were Actim Partus studies47,48,50,58 and one of which was a PartoSure study,60,61 clearly reportedselection procedures.
In almost all of the studies, index tests were conducted in a manner that is consistent with clinical practice.However, both the APOSTEL-1 study42,43 and the study by Cooper et al.49 used frozen samples, whichmeans that the index tests (Actim Partus in both studies and qfFN in APOSTEL-1) were interpreted after thereference standard. Owing to the nature of the tests, this is unlikely to have much impact, although someamount of bias cannot be completely ruled out. In addition, in APOSTEL-142,43 and the study by Ting et al.,56
samples were taken from the posterior fornix of the vagina rather than the external cervical os. This samplingmethod is not compatible with the manufacturer’s guidance for the Actim Partus test.
Furthermore, although not likely to have a major impact on results, in several studies there is potential for‘cross-contamination’ of results from one index test to another and/or from additional tests that are not partof this review (e.g. cervical length measurement). There is also potential, in several studies, for the index test
DOI: 10.3310/hta23130 HEALTH TECHNOLOGY ASSESSMENT 2019 VOL. 23 NO. 13
© Queen’s Printer and Controller of HMSO 2019. This work was produced by Varley-Campbell et al. under the terms of a commissioning contract issued by the Secretary of Statefor Health and Social Care. This issue may be freely reproduced for the purposes of private research and study and extracts (or indeed, the full report) may be included inprofessional journals provided that suitable acknowledgement is made and the reproduction is not associated with any form of advertising. Applications for commercialreproduction should be addressed to: NIHR Journals Library, National Institute for Health Research, Evaluation, Trials and Studies Coordinating Centre, Alpha House, University ofSouthampton Science Park, Southampton SO16 7NS, UK.
29

TABLE 5 Quality appraisal: QUADAS-239
Quality appraisalquestions
Test
Actim Partusand fFN
a
ActimPartus andPartoSure
bActim Partus PartoSure fFN
APOSTEL-142,43
Hadzi-Legaet al.44
(2017)
Abo El-Ezzet al.45
(2014)
Altinkayaet al.46
(2009)
Azlinet al.47
(2010)
Briket al.48
(2010)
Cooperet al.49
(2012)
Dantiet al.50
(2011)
Erogluet al.51
(2007)
Goyalet al.52
(2016)
Lembetet al.53
(2002)
Riboniet al.54
(2011)
Taniret al.55
(2009)
Tinget al.56
(2007)
Tripathiet al.57
(2016)
Vishwekaret al.58
(2017)
Bolotskikhet al.59
(2017)
Nikolovaet al.60,61
(2014 and2015)
Werlenet al.41
(2015) Bruijn62
Patient selection
Was aconsecutive orrandom sampleof patientsenrolled?
U U U U Y Y U Y U U U U U U U Y U Y U U
Was acase–controldesignavoided?
Y Y Y Y Y Y Y Y Y Y Y Y Y Y Y Y Y Y Y Y
Did thestudy avoidinappropriateexclusions?
Y Y Y Y Y Y Y Y Y Y Y Y Y Y Y Y Y Y Y Y
Could theselection ofpatients haveintroducedbias?
U U U U L L U L U U U U U U U L U L U U
Is thereconcern thatthe includedpatients do notmatch thereviewquestion?
L L L L L L L L L L L L L L L L L L L L
Index test 1
Were the indextest resultsinterpretedwithoutknowledge ofthe results ofthe referencestandard?
U Y Y Y Y Y U Y Y Y Y Y Y Y Y Y Y Y Y Y
If a thresholdwas used, wasit prespecified?
Y Y Y Y Y Y Y Y Y Y Y Y Y Y Y Y Y Y Y Y
ASSESSM
ENTOFTEST
ACCU
RACY
NIHRJournals
Librarywww.journalslibrary.nihr.ac.uk
30
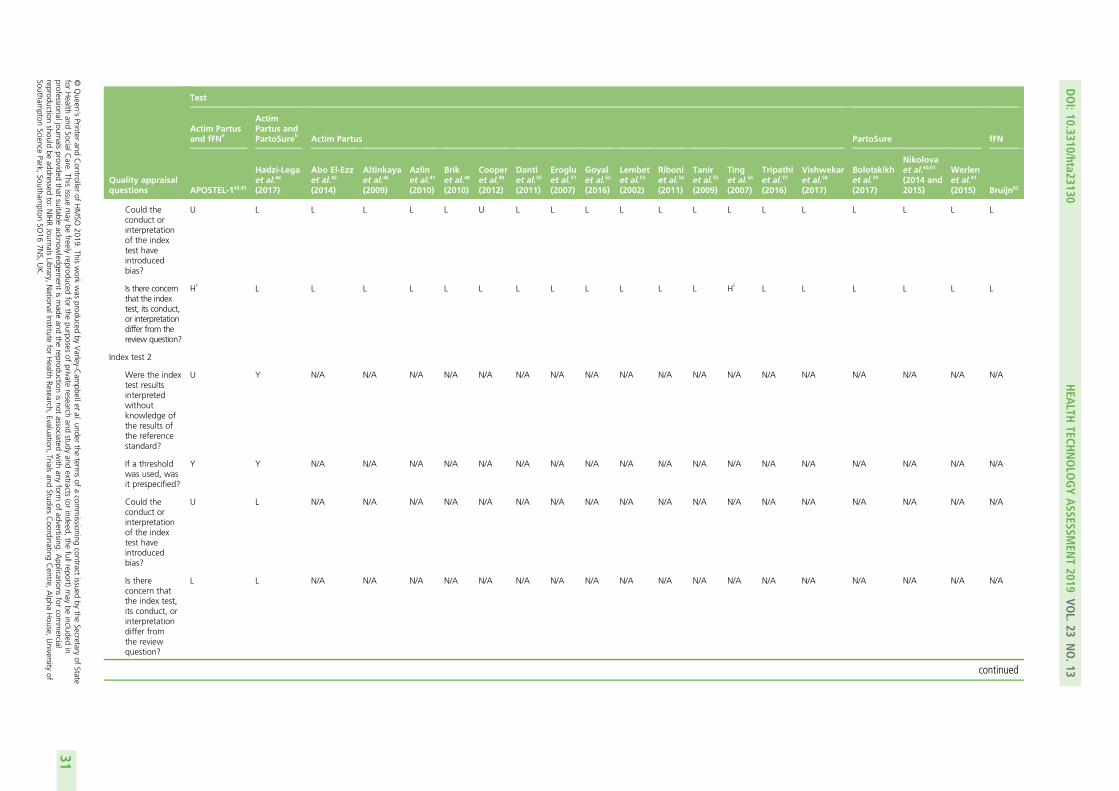
Quality appraisalquestions
Test
Actim Partusand fFN
a
ActimPartus andPartoSure
bActim Partus PartoSure fFN
APOSTEL-142,43
Hadzi-Legaet al.44
(2017)
Abo El-Ezzet al.45
(2014)
Altinkayaet al.46
(2009)
Azlinet al.47
(2010)
Briket al.48
(2010)
Cooperet al.49
(2012)
Dantiet al.50
(2011)
Erogluet al.51
(2007)
Goyalet al.52
(2016)
Lembetet al.53
(2002)
Riboniet al.54
(2011)
Taniret al.55
(2009)
Tinget al.56
(2007)
Tripathiet al.57
(2016)
Vishwekaret al.58
(2017)
Bolotskikhet al.59
(2017)
Nikolovaet al.60,61
(2014 and2015)
Werlenet al.41
(2015) Bruijn62
Could theconduct orinterpretationof the indextest haveintroducedbias?
U L L L L L U L L L L L L L L L L L L L
Is there concernthat the indextest, its conduct,or interpretationdiffer from thereview question?
Hc
L L L L L L L L L L L L Hc
L L L L L L
Index test 2
Were the indextest resultsinterpretedwithoutknowledge ofthe results ofthe referencestandard?
U Y N/A N/A N/A N/A N/A N/A N/A N/A N/A N/A N/A N/A N/A N/A N/A N/A N/A N/A
If a thresholdwas used, wasit prespecified?
Y Y N/A N/A N/A N/A N/A N/A N/A N/A N/A N/A N/A N/A N/A N/A N/A N/A N/A N/A
Could theconduct orinterpretationof the indextest haveintroducedbias?
U L N/A N/A N/A N/A N/A N/A N/A N/A N/A N/A N/A N/A N/A N/A N/A N/A N/A N/A
Is thereconcern thatthe index test,its conduct, orinterpretationdiffer fromthe reviewquestion?
L L N/A N/A N/A N/A N/A N/A N/A N/A N/A N/A N/A N/A N/A N/A N/A N/A N/A N/A
continued
DOI:10.3310/hta23130
HEA
LTHTECH
NOLO
GYASSESSM
ENT2019
VOL.23
NO.13
©Queen
’sPrinter
andController
ofHMSO
2019.This
work
was
producedby
Varley-C
ampbellet
al.under
theterm
sof
acom
missioning
contractissued
bythe
Secretaryof
Statefor
Health
andSocialC
are.This
issuemay
befreely
reproducedfor
thepurposes
ofprivate
researchand
studyand
extracts(or
indeed,the
fullreport)may
beincluded
inprofessionaljournals
providedthat
suitableacknow
ledgement
ismade
andthe
reproductionisnot
associatedwith
anyform
ofadvertising.
Applications
forcom
mercial
reproductionshould
beaddressed
to:NIHRJournals
Library,NationalInstitute
forHealth
Research,Evaluation,
Trialsand
StudiesCoordinating
Centre,
Alpha
House,
University
ofSoutham
ptonScience
Park,Southam
ptonSO
167N
S,UK.
31
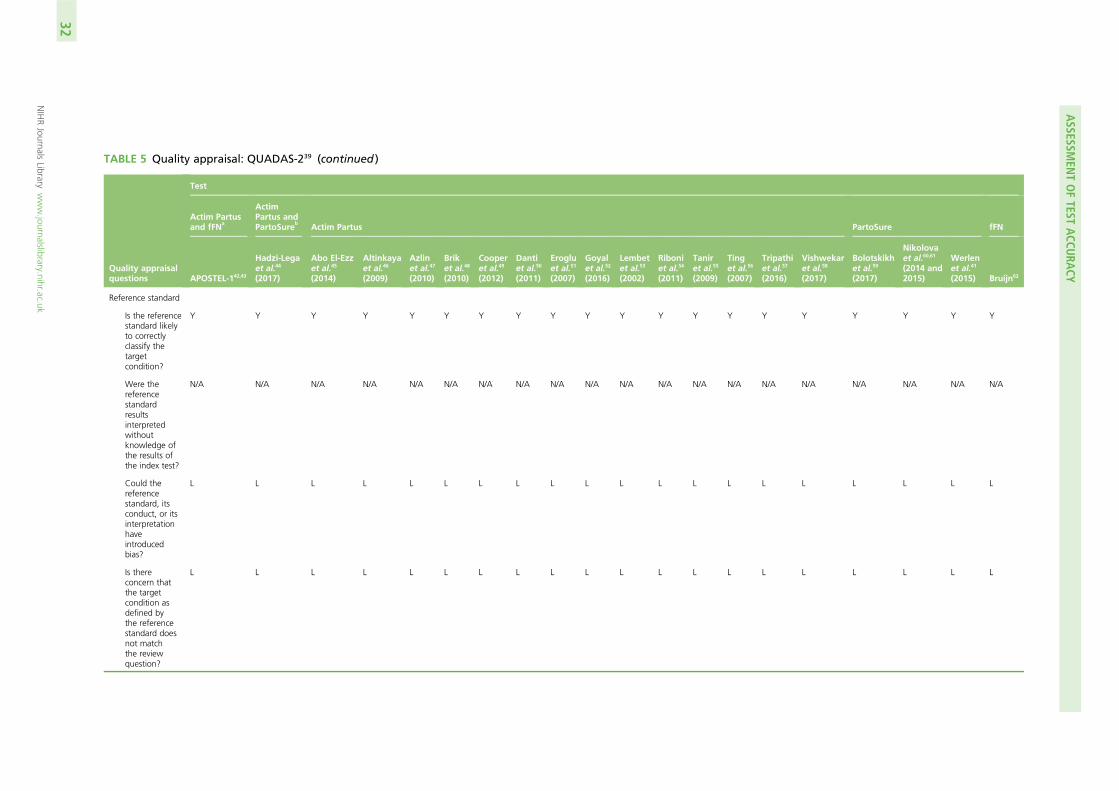
TABLE 5 Quality appraisal: QUADAS-239 (continued )
Quality appraisalquestions
Test
Actim Partusand fFN
a
ActimPartus andPartoSure
bActim Partus PartoSure fFN
APOSTEL-142,43
Hadzi-Legaet al.44
(2017)
Abo El-Ezzet al.45
(2014)
Altinkayaet al.46
(2009)
Azlinet al.47
(2010)
Briket al.48
(2010)
Cooperet al.49
(2012)
Dantiet al.50
(2011)
Erogluet al.51
(2007)
Goyalet al.52
(2016)
Lembetet al.53
(2002)
Riboniet al.54
(2011)
Taniret al.55
(2009)
Tinget al.56
(2007)
Tripathiet al.57
(2016)
Vishwekaret al.58
(2017)
Bolotskikhet al.59
(2017)
Nikolovaet al.60,61
(2014 and2015)
Werlenet al.41
(2015) Bruijn62
Reference standard
Is the referencestandard likelyto correctlyclassify thetargetcondition?
Y Y Y Y Y Y Y Y Y Y Y Y Y Y Y Y Y Y Y Y
Were thereferencestandardresultsinterpretedwithoutknowledge ofthe results ofthe index test?
N/A N/A N/A N/A N/A N/A N/A N/A N/A N/A N/A N/A N/A N/A N/A N/A N/A N/A N/A N/A
Could thereferencestandard, itsconduct, or itsinterpretationhaveintroducedbias?
L L L L L L L L L L L L L L L L L L L L
Is thereconcern thatthe targetcondition asdefined bythe referencestandard doesnot matchthe reviewquestion?
L L L L L L L L L L L L L L L L L L L L
ASSESSM
ENTOFTEST
ACCU
RACY
NIHRJournals
Librarywww.journalslibrary.nihr.ac.uk
32

Quality appraisalquestions
Test
Actim Partusand fFN
a
ActimPartus andPartoSure
bActim Partus PartoSure fFN
APOSTEL-142,43
Hadzi-Legaet al.44
(2017)
Abo El-Ezzet al.45
(2014)
Altinkayaet al.46
(2009)
Azlinet al.47
(2010)
Briket al.48
(2010)
Cooperet al.49
(2012)
Dantiet al.50
(2011)
Erogluet al.51
(2007)
Goyalet al.52
(2016)
Lembetet al.53
(2002)
Riboniet al.54
(2011)
Taniret al.55
(2009)
Tinget al.56
(2007)
Tripathiet al.57
(2016)
Vishwekaret al.58
(2017)
Bolotskikhet al.59
(2017)
Nikolovaet al.60,61
(2014 and2015)
Werlenet al.41
(2015) Bruijn62
Flow and timing
Was there anappropriateintervalbetween indextest(s) andreferencestandard?
N Y Y Y Y Y N Y Y Y Y Y Y Y Y Y Y Y Y Y
Did all patientsreceive areferencestandard?
Y Y Y Y Y Y Y Y Y Y Y Y Y Y Y Y Y Y Y Y
Did patientsreceive thesame referencestandard?
Y Y Y Y Y Y Y Y Y Y Y Y Y Y Y Y Y Y Y Y
Were allpatientsincluded in theanalysis?
N N N U Y N Y Y Y N Y U Y N N Y Y N N N
Could thepatientflow haveintroducedbias?
H H H U L H H L L H L U L H H L L H H H
H, high; L, low; N, no; N/A, not applicable; U, unknown; Y, yes.a Index test 1 =Actim Partus, index test 2 = fFN.b Index test 1 =Actim Partus, index test 2 = PartoSure.c The samples were taken from the posterior fornix of the vagina rather than the external cervical os.
DOI:10.3310/hta23130
HEA
LTHTECH
NOLO
GYASSESSM
ENT2019
VOL.23
NO.13
©Queen
’sPrinter
andController
ofHMSO
2019.This
work
was
producedby
Varley-C
ampbellet
al.under
theterm
sof
acom
missioning
contractissued
bythe
Secretaryof
Statefor
Health
andSocialC
are.This
issuemay
befreely
reproducedfor
thepurposes
ofprivate
researchand
studyand
extracts(or
indeed,the
fullreport)may
beincluded
inprofessionaljournals
providedthat
suitableacknow
ledgement
ismade
andthe
reproductionisnot
associatedwith
anyform
ofadvertising.
Applications
forcom
mercial
reproductionshould
beaddressed
to:NIHRJournals
Library,NationalInstitute
forHealth
Research,Evaluation,
Trialsand
StudiesCoordinating
Centre,
Alpha
House,
University
ofSoutham
ptonScience
Park,Southam
ptonSO
167N
S,UK.
33
results to have influenced the clinical management of patients; approximately half of the studies stated thatthe clinicians involved in patient management were unaware of the index test results.42–44,49–51,53,55,56,60–62
Another point to note is that the index tests are designed to be used before the occurrence of thereference standard, and this was the case in all but two studies (APOSTEL-142,43 and Cooper et al.49).This may inflate false-positive results and deflate true-positive results through the use of tocolytics toprevent the occurrence of the reference standard.
Ten of the studies41–45,48,52,56,57,60–62 were rated as being of high risk of bias regarding not including allwomen in analyses. A high risk of bias does not equate to a high degree of bias, and this should beconsidered here and for other QUADAS-2 items in which a high risk of bias rating has been given(see Table 5).
Results of quantitative data synthesis (test accuracy data)
The 7-day delivery reference standard
Studies evaluating more than one index testTwo studies (APOSTEL-142,43 and Hadzi-Lega et al.44) reported test accuracy data on two index tests. Bothstudies used only the 7-day (and not the 48-hour) delivery reference standard. The prevalence of pretermbirth within 7 days was 19.7% (95% CI 15.7% to 24.3%) in the APOSTEL-1 study42,43 and 10.5%(95% CI 4.0% to 21.5%) in the study by Hadzi-Lega et al.44
The APOSTEL-1 study reports test accuracy from 350 women for both Actim Partus and qfFN (Table 6).42,43
The sensitivity and specificity for Actim Partus, against delivery within 7 days, were 78.3% (95% CI66.7% to 87.3%) and 89.3% (95% CI 85.1% to 92.7%), respectively. As would be expected, in the qfFNresults from the APOSTEL-1 study, lowering the threshold for a positive test result increased sensitivity anddecreased specificity whereas elevating the threshold for a positive test result increased specificity anddecreased sensitivity (see Table 6). The qfFN sensitivity and specificity values that were most similar toActim Partus values for the APOSTEL-1 study were those provided at a threshold of 200 ng/ml, at whichsensitivity was 71.0% (95% CI 58.8% to 83.1%) and specificity was 83.6% (95% CI 78.8% to 87.8%).With regard to the qfFN data from APOSTEL-1, the threshold with the highest PPV was 500 ng/ml (70.7%,95% CI 54.5% to 83.9%) and the threshold with the lowest PPV was 10 ng/ml (28.9%, 95% CI 23.2%to 35.3%). For Actim Partus the PPV of delivery within 7 days was 64.3% (95% CI 53.1% to 74.4%).For qfFN, the highest NPV was at a threshold of 10 ng/ml (97.5%, 95% CI 93.0% to 99.5%) and thelowest at a threshold of 500 ng/ml (87.1%, 95% CI 82.8% to 90.6%). For Actim Partus, NPV was 94.4%(95% CI 90.9% to 96.8%). LRs, concordance and yield were also calculated for this study, and thesevalues are provided in Table 6.
The other study providing data on more than one index test in the same sample was the study byHadzi-Lega et al.,44 in which test accuracy data from 57 women were reported for both Actim Partus andPartoSure (see Table 6). The sensitivity of both Actim Partus and PartoSure for delivery within 7 days was83.3% (95% CI 35.9% to 99.6%), and specificity was higher for PartoSure (90.2%, 95% CI 78.6% to96.7%) than for Actim Partus (76.5%, 95% CI 62.5% to 87.2%). In addition, PPV, LR+ and concordancewere higher for PartoSure than for Actim Partus, although the wide CIs, particularly for PPV, are notable.LR– and NPV were similar for both tests and diagnostic yield was higher for Actim Partus than forPartoSure. Specific values are given in Table 6.
Actim PartusResults for Actim Partus against the 7-day delivery reference standard were provided by 16 studies (Figure 3,and see Table 6). Across these studies, sensitivity ranged from 33.3% (95% CI 4.3% to 77.7%) in the studyby Cooper et al.49 to 94.7% (95% CI 89.9% to 97.7%) in the study by Tripathi et al.57 Specificity of ActimPartus ranged from 50.0% (95% CI 24.7% to 75.3%) in the study by Goyal et al.52 to 93.5% (95% CI
ASSESSMENT OF TEST ACCURACY
NIHR Journals Library www.journalslibrary.nihr.ac.uk
34
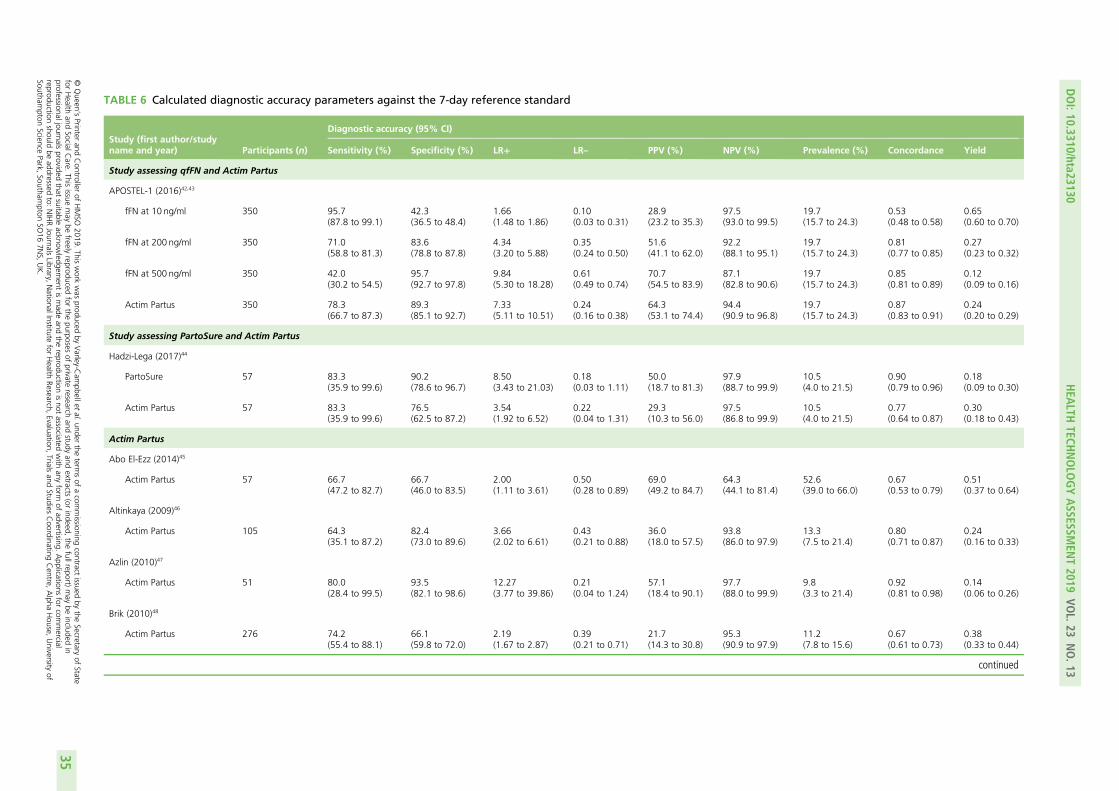
TABLE 6 Calculated diagnostic accuracy parameters against the 7-day reference standard
Study (first author/studyname and year) Participants (n)
Diagnostic accuracy (95% CI)
Sensitivity (%) Specificity (%) LR+ LR– PPV (%) NPV (%) Prevalence (%) Concordance Yield
Study assessing qfFN and Actim Partus
APOSTEL-1 (2016)42,43
fFN at 10 ng/ml 350 95.7(87.8 to 99.1)
42.3(36.5 to 48.4)
1.66(1.48 to 1.86)
0.10(0.03 to 0.31)
28.9(23.2 to 35.3)
97.5(93.0 to 99.5)
19.7(15.7 to 24.3)
0.53(0.48 to 0.58)
0.65(0.60 to 0.70)
fFN at 200 ng/ml 350 71.0(58.8 to 81.3)
83.6(78.8 to 87.8)
4.34(3.20 to 5.88)
0.35(0.24 to 0.50)
51.6(41.1 to 62.0)
92.2(88.1 to 95.1)
19.7(15.7 to 24.3)
0.81(0.77 to 0.85)
0.27(0.23 to 0.32)
fFN at 500 ng/ml 350 42.0(30.2 to 54.5)
95.7(92.7 to 97.8)
9.84(5.30 to 18.28)
0.61(0.49 to 0.74)
70.7(54.5 to 83.9)
87.1(82.8 to 90.6)
19.7(15.7 to 24.3)
0.85(0.81 to 0.89)
0.12(0.09 to 0.16)
Actim Partus 350 78.3(66.7 to 87.3)
89.3(85.1 to 92.7)
7.33(5.11 to 10.51)
0.24(0.16 to 0.38)
64.3(53.1 to 74.4)
94.4(90.9 to 96.8)
19.7(15.7 to 24.3)
0.87(0.83 to 0.91)
0.24(0.20 to 0.29)
Study assessing PartoSure and Actim Partus
Hadzi-Lega (2017)44
PartoSure 57 83.3(35.9 to 99.6)
90.2(78.6 to 96.7)
8.50(3.43 to 21.03)
0.18(0.03 to 1.11)
50.0(18.7 to 81.3)
97.9(88.7 to 99.9)
10.5(4.0 to 21.5)
0.90(0.79 to 0.96)
0.18(0.09 to 0.30)
Actim Partus 57 83.3(35.9 to 99.6)
76.5(62.5 to 87.2)
3.54(1.92 to 6.52)
0.22(0.04 to 1.31)
29.3(10.3 to 56.0)
97.5(86.8 to 99.9)
10.5(4.0 to 21.5)
0.77(0.64 to 0.87)
0.30(0.18 to 0.43)
Actim Partus
Abo El-Ezz (2014)45
Actim Partus 57 66.7(47.2 to 82.7)
66.7(46.0 to 83.5)
2.00(1.11 to 3.61)
0.50(0.28 to 0.89)
69.0(49.2 to 84.7)
64.3(44.1 to 81.4)
52.6(39.0 to 66.0)
0.67(0.53 to 0.79)
0.51(0.37 to 0.64)
Altinkaya (2009)46
Actim Partus 105 64.3(35.1 to 87.2)
82.4(73.0 to 89.6)
3.66(2.02 to 6.61)
0.43(0.21 to 0.88)
36.0(18.0 to 57.5)
93.8(86.0 to 97.9)
13.3(7.5 to 21.4)
0.80(0.71 to 0.87)
0.24(0.16 to 0.33)
Azlin (2010)47
Actim Partus 51 80.0(28.4 to 99.5)
93.5(82.1 to 98.6)
12.27(3.77 to 39.86)
0.21(0.04 to 1.24)
57.1(18.4 to 90.1)
97.7(88.0 to 99.9)
9.8(3.3 to 21.4)
0.92(0.81 to 0.98)
0.14(0.06 to 0.26)
Brik (2010)48
Actim Partus 276 74.2(55.4 to 88.1)
66.1(59.8 to 72.0)
2.19(1.67 to 2.87)
0.39(0.21 to 0.71)
21.7(14.3 to 30.8)
95.3(90.9 to 97.9)
11.2(7.8 to 15.6)
0.67(0.61 to 0.73)
0.38(0.33 to 0.44)
continued
DOI:10.3310/hta23130
HEA
LTHTECH
NOLO
GYASSESSM
ENT2019
VOL.23
NO.13
©Queen
’sPrinter
andController
ofHMSO
2019.This
work
was
producedby
Varley-C
ampbellet
al.under
theterm
sof
acom
missioning
contractissued
bythe
Secretaryof
Statefor
Health
andSocialC
are.This
issuemay
befreely
reproducedfor
thepurposes
ofprivate
researchand
studyand
extracts(or
indeed,the
fullreport)may
beincluded
inprofessionaljournals
providedthat
suitableacknow
ledgement
ismade
andthe
reproductionisnot
associatedwith
anyform
ofadvertising.
Applications
forcom
mercial
reproductionshould
beaddressed
to:NIHRJournals
Library,NationalInstitute
forHealth
Research,Evaluation,
Trialsand
StudiesCoordinating
Centre,
Alpha
House,
University
ofSoutham
ptonScience
Park,Southam
ptonSO
167N
S,UK.
35

TABLE 6 Calculated diagnostic accuracy parameters against the 7-day reference standard (continued )
Study (first author/studyname and year) Participants (n)
Diagnostic accuracy (95% CI)
Sensitivity (%) Specificity (%) LR+ LR– PPV (%) NPV (%) Prevalence (%) Concordance Yield
Cooper (2012)49
Actim Partus 349 33.3(4.3 to 77.7)
74.1(69.1 to 78.6)
1.28(0.41 to 4.04)
0.90(0.51 to 1.59)
2.2(0.3 to 7.7)
98.4(96.1 to 99.6)
1.7(0.6 to 3.7)
0.73(0.68 to 0.78)
0.26(0.22 to 0.31)
Danti (2011)50
Actim Partus 60 50.0(6.8 to 93.2)
69.6(55.9 to 81.2)
1.65(0.57 to 4.74)
0.72(0.27 to 1.94)
10.5(1.3 to 33.1)
95.1(83.5 to 99.4)
6.7(1.8 to 16.2)
0.68(0.55 to 0.80)
0.32(0.20 to 0.45)
Eroglu (2007)51
Actim Partus 51 83.3(35.9 to 99.6)
84.4(70.5 to 93.5)
5.36(2.48 to 11.56)
0.20(0.03 to 1.19)
41.7(15.2 to 72.3)
97.4(86.5 to 99.9)
11.8(4.4 to 23.9)
0.84(0.71 to 0.93)
0.24(0.13 to 0.38)
Goyal (2016)52
Actim Partus 60 59.1(43.2 to 73.7)
50.0(24.7 to 75.3)
1.18(0.68 to 2.04)
0.82(0.45 to 1.50)
76.5(58.8 to 89.3)
30.8(14.3 to 51.8)
73.3(60.3 to 83.9)
0.57(0.43 to 0.69)
0.57(0.43 to 0.69)
Lembet (2002)53
Actim Partus 36 93.8(69.8 to 99.8)
85.0(62.1 to 96.8)
6.25(2.19 to 17.88)
0.07(0.01 to 0.49)
83.3(58.6 to 96.4)
94.4(72.7 to 99.9)
44.4(27.9 to 61.9)
0.89(0.74 to 0.97)
0.50(0.33 to 0.67)
Riboni (2011)54
Actim Partus 210 50.0(15.7 to 84.3)
83.7(77.8 to 88.5)
3.06(1.43 to 6.54)
0.60(0.30 to 1.20)
10.8(3.0 to 25.4)
97.7(94.2 to 99.4)
3.8(1.7 to 7.4)
0.82(0.77 to 0.87)
0.18(0.13 to 0.24)
Tanir (2009)55
Actim Partus 68 93.3(68.1 to 99.8)
79.2(65.9 to 89.2)
4.50(2.61 to 7.74)
0.08(0.01 to 0.56)
56.0(34.9 to 75.6)
97.7(87.7 to 99.9)
22.1(12.9 to 33.8)
0.82(0.71 to 0.91)
0.37(0.25 to 0.49)
Ting (2007)56
Actim Partus 94 70.6(44.0 to 89.7)
77.9(67.0 to 87.6)
3.20(1.90 to 5.38)
0.38(0.18 to 0.80)
41.4(23.5 to 61.1)
92.3(83.0 to 97.5)
18.1(10.9 to 27.4)
0.77(0.67 to 0.85)
0.31(0.22 to 0.41)
Tripathi (2016)57
Actim Partus 468 94.7(89.9 to 97.7)
92.4(88.9 to 95.1)
12.43(8.45 to 18.30)
0.06(0.03 to 0.11)
85.7(79.5 to 90.6)
97.3(94.8 to 98.8)
32.5(28.3 to 37.0)
0.93(0.91 to 0.95)
0.36(0.32 to 0.41)
Vishwekar (2017)58
Actim Partus 30 72.2(46.5 to 90.3)
90.9(58.7 to 99.8)
7.94(1.20 to 52.62)
0.31(0.14 to 0.66)
92.9(66.1 to 99.8)
66.7(38.4 to 88.2)
62.1(42.3 to 79.3)
0.79(0.60 to 0.92)
0.48(0.29 to 0.67)
ASSESSM
ENTOFTEST
ACCU
RACY
NIHRJournals
Librarywww.journalslibrary.nihr.ac.uk
36
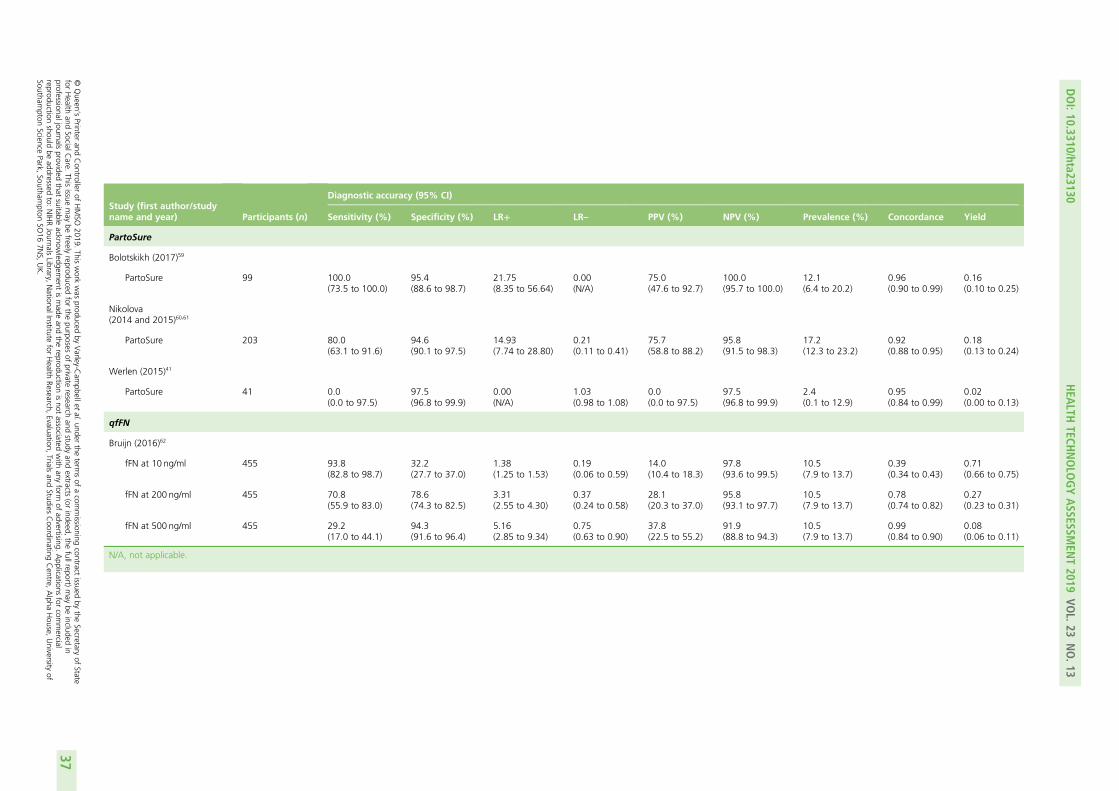
Study (first author/studyname and year) Participants (n)
Diagnostic accuracy (95% CI)
Sensitivity (%) Specificity (%) LR+ LR– PPV (%) NPV (%) Prevalence (%) Concordance Yield
PartoSure
Bolotskikh (2017)59
PartoSure 99 100.0(73.5 to 100.0)
95.4(88.6 to 98.7)
21.75(8.35 to 56.64)
0.00(N/A)
75.0(47.6 to 92.7)
100.0(95.7 to 100.0)
12.1(6.4 to 20.2)
0.96(0.90 to 0.99)
0.16(0.10 to 0.25)
Nikolova(2014 and 2015)60,61
PartoSure 203 80.0(63.1 to 91.6)
94.6(90.1 to 97.5)
14.93(7.74 to 28.80)
0.21(0.11 to 0.41)
75.7(58.8 to 88.2)
95.8(91.5 to 98.3)
17.2(12.3 to 23.2)
0.92(0.88 to 0.95)
0.18(0.13 to 0.24)
Werlen (2015)41
PartoSure 41 0.0(0.0 to 97.5)
97.5(96.8 to 99.9)
0.00(N/A)
1.03(0.98 to 1.08)
0.0(0.0 to 97.5)
97.5(96.8 to 99.9)
2.4(0.1 to 12.9)
0.95(0.84 to 0.99)
0.02(0.00 to 0.13)
qfFN
Bruijn (2016)62
fFN at 10 ng/ml 455 93.8(82.8 to 98.7)
32.2(27.7 to 37.0)
1.38(1.25 to 1.53)
0.19(0.06 to 0.59)
14.0(10.4 to 18.3)
97.8(93.6 to 99.5)
10.5(7.9 to 13.7)
0.39(0.34 to 0.43)
0.71(0.66 to 0.75)
fFN at 200 ng/ml 455 70.8(55.9 to 83.0)
78.6(74.3 to 82.5)
3.31(2.55 to 4.30)
0.37(0.24 to 0.58)
28.1(20.3 to 37.0)
95.8(93.1 to 97.7)
10.5(7.9 to 13.7)
0.78(0.74 to 0.82)
0.27(0.23 to 0.31)
fFN at 500 ng/ml 455 29.2(17.0 to 44.1)
94.3(91.6 to 96.4)
5.16(2.85 to 9.34)
0.75(0.63 to 0.90)
37.8(22.5 to 55.2)
91.9(88.8 to 94.3)
10.5(7.9 to 13.7)
0.99(0.84 to 0.90)
0.08(0.06 to 0.11)
N/A, not applicable.
DOI:10.3310/hta23130
HEA
LTHTECH
NOLO
GYASSESSM
ENT2019
VOL.23
NO.13
©Queen
’sPrinter
andController
ofHMSO
2019.This
work
was
producedby
Varley-C
ampbellet
al.under
theterm
sof
acom
missioning
contractissued
bythe
Secretaryof
Statefor
Health
andSocialC
are.This
issuemay
befreely
reproducedfor
thepurposes
ofprivate
researchand
studyand
extracts(or
indeed,the
fullreport)may
beincluded
inprofessionaljournals
providedthat
suitableacknow
ledgement
ismade
andthe
reproductionisnot
associatedwith
anyform
ofadvertising.
Applications
forcom
mercial
reproductionshould
beaddressed
to:NIHRJournals
Library,NationalInstitute
forHealth
Research,Evaluation,
Trialsand
StudiesCoordinating
Centre,
Alpha
House,
University
ofSoutham
ptonScience
Park,Southam
ptonSO
167N
S,UK.
37
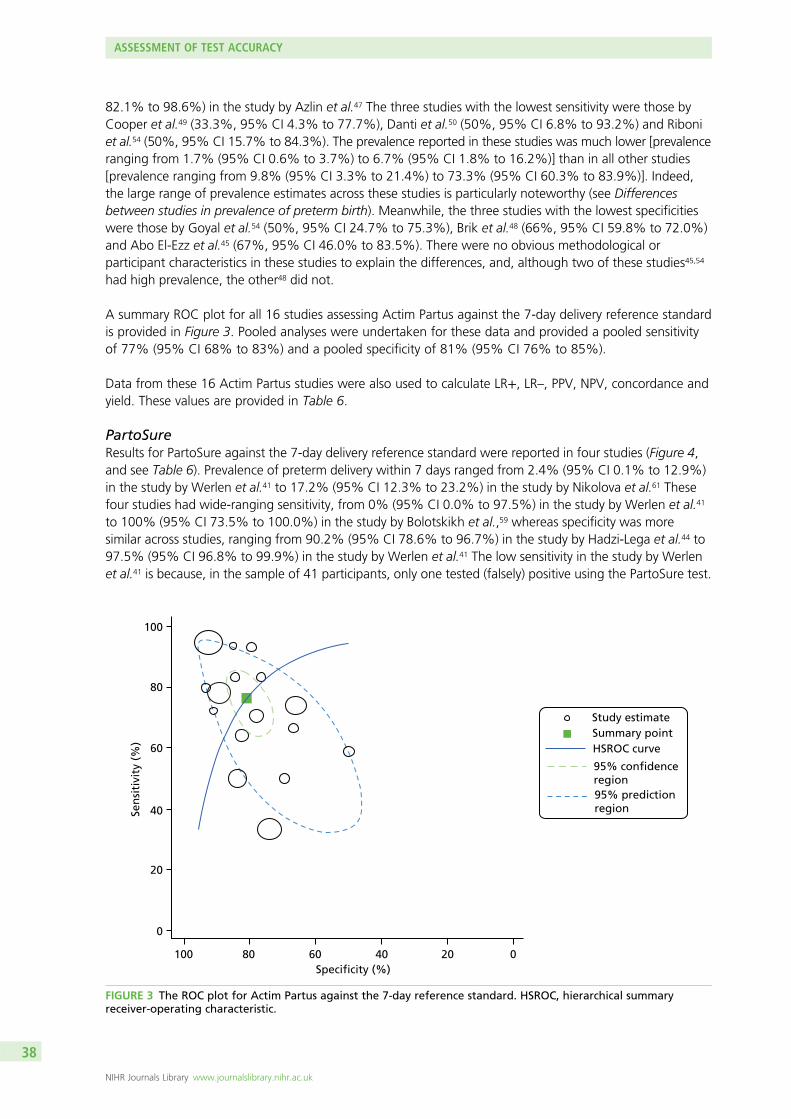
82.1% to 98.6%) in the study by Azlin et al.47 The three studies with the lowest sensitivity were those byCooper et al.49 (33.3%, 95% CI 4.3% to 77.7%), Danti et al.50 (50%, 95% CI 6.8% to 93.2%) and Riboniet al.54 (50%, 95% CI 15.7% to 84.3%). The prevalence reported in these studies was much lower [prevalenceranging from 1.7% (95% CI 0.6% to 3.7%) to 6.7% (95% CI 1.8% to 16.2%)] than in all other studies[prevalence ranging from 9.8% (95% CI 3.3% to 21.4%) to 73.3% (95% CI 60.3% to 83.9%)]. Indeed,the large range of prevalence estimates across these studies is particularly noteworthy (see Differencesbetween studies in prevalence of preterm birth). Meanwhile, the three studies with the lowest specificitieswere those by Goyal et al.54 (50%, 95% CI 24.7% to 75.3%), Brik et al.48 (66%, 95% CI 59.8% to 72.0%)and Abo El-Ezz et al.45 (67%, 95% CI 46.0% to 83.5%). There were no obvious methodological orparticipant characteristics in these studies to explain the differences, and, although two of these studies45,54
had high prevalence, the other48 did not.
A summary ROC plot for all 16 studies assessing Actim Partus against the 7-day delivery reference standardis provided in Figure 3. Pooled analyses were undertaken for these data and provided a pooled sensitivityof 77% (95% CI 68% to 83%) and a pooled specificity of 81% (95% CI 76% to 85%).
Data from these 16 Actim Partus studies were also used to calculate LR+, LR–, PPV, NPV, concordance andyield. These values are provided in Table 6.
PartoSureResults for PartoSure against the 7-day delivery reference standard were reported in four studies (Figure 4,and see Table 6). Prevalence of preterm delivery within 7 days ranged from 2.4% (95% CI 0.1% to 12.9%)in the study by Werlen et al.41 to 17.2% (95% CI 12.3% to 23.2%) in the study by Nikolova et al.61 Thesefour studies had wide-ranging sensitivity, from 0% (95% CI 0.0% to 97.5%) in the study by Werlen et al.41
to 100% (95% CI 73.5% to 100.0%) in the study by Bolotskikh et al.,59 whereas specificity was moresimilar across studies, ranging from 90.2% (95% CI 78.6% to 96.7%) in the study by Hadzi-Lega et al.44 to97.5% (95% CI 96.8% to 99.9%) in the study by Werlen et al.41 The low sensitivity in the study by Werlenet al.41 is because, in the sample of 41 participants, only one tested (falsely) positive using the PartoSure test.
100
80
60
40
20
0
Sen
siti
vity
(%
)
100 80 60 40 20 0Specificity (%)
Study estimateSummary pointHSROC curve
95% predictionregion
region
FIGURE 3 The ROC plot for Actim Partus against the 7-day reference standard. HSROC, hierarchical summaryreceiver-operating characteristic.
ASSESSMENT OF TEST ACCURACY
NIHR Journals Library www.journalslibrary.nihr.ac.uk
38
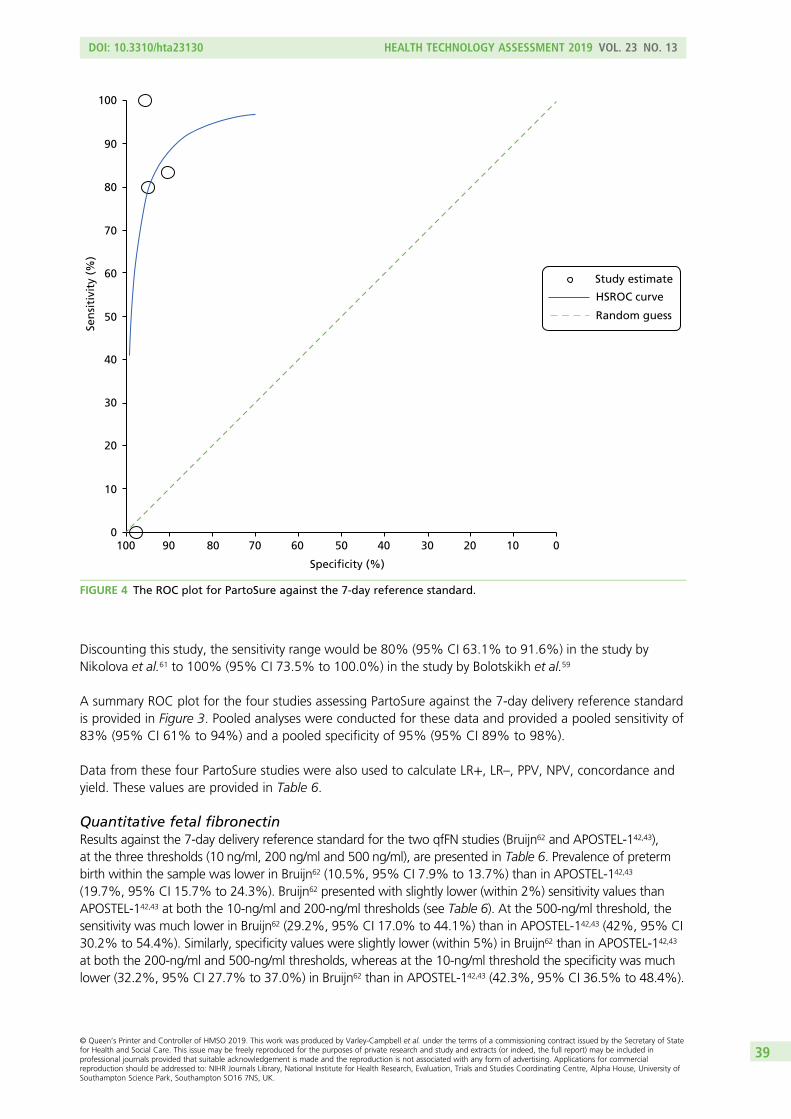
Discounting this study, the sensitivity range would be 80% (95% CI 63.1% to 91.6%) in the study byNikolova et al.61 to 100% (95% CI 73.5% to 100.0%) in the study by Bolotskikh et al.59
A summary ROC plot for the four studies assessing PartoSure against the 7-day delivery reference standardis provided in Figure 3. Pooled analyses were conducted for these data and provided a pooled sensitivity of83% (95% CI 61% to 94%) and a pooled specificity of 95% (95% CI 89% to 98%).
Data from these four PartoSure studies were also used to calculate LR+, LR–, PPV, NPV, concordance andyield. These values are provided in Table 6.
Quantitative fetal fibronectinResults against the 7-day delivery reference standard for the two qfFN studies (Bruijn62 and APOSTEL-142,43),at the three thresholds (10 ng/ml, 200 ng/ml and 500 ng/ml), are presented in Table 6. Prevalence of pretermbirth within the sample was lower in Bruijn62 (10.5%, 95% CI 7.9% to 13.7%) than in APOSTEL-142,43
(19.7%, 95% CI 15.7% to 24.3%). Bruijn62 presented with slightly lower (within 2%) sensitivity values thanAPOSTEL-142,43 at both the 10-ng/ml and 200-ng/ml thresholds (see Table 6). At the 500-ng/ml threshold, thesensitivity was much lower in Bruijn62 (29.2%, 95% CI 17.0% to 44.1%) than in APOSTEL-142,43 (42%, 95% CI30.2% to 54.4%). Similarly, specificity values were slightly lower (within 5%) in Bruijn62 than in APOSTEL-142,43
at both the 200-ng/ml and 500-ng/ml thresholds, whereas at the 10-ng/ml threshold the specificity was muchlower (32.2%, 95% CI 27.7% to 37.0%) in Bruijn62 than in APOSTEL-142,43 (42.3%, 95% CI 36.5% to 48.4%).
100
90
80
70
60
50
40
30
20
10
00100 90 80 70 60 50 40 30 20 10
Specificity (%)
Sen
siti
vity
(%
)
Study estimate
HSROC curve
Random guess
FIGURE 4 The ROC plot for PartoSure against the 7-day reference standard.
DOI: 10.3310/hta23130 HEALTH TECHNOLOGY ASSESSMENT 2019 VOL. 23 NO. 13
© Queen’s Printer and Controller of HMSO 2019. This work was produced by Varley-Campbell et al. under the terms of a commissioning contract issued by the Secretary of Statefor Health and Social Care. This issue may be freely reproduced for the purposes of private research and study and extracts (or indeed, the full report) may be included inprofessional journals provided that suitable acknowledgement is made and the reproduction is not associated with any form of advertising. Applications for commercialreproduction should be addressed to: NIHR Journals Library, National Institute for Health Research, Evaluation, Trials and Studies Coordinating Centre, Alpha House, University ofSouthampton Science Park, Southampton SO16 7NS, UK.
39

Data from the two qfFN studies were also used to calculate LR+, LR–, PPV, NPV, concordance and yield.These values are provided in Table 6.
The 48-hour delivery reference standardSeven of the included studies also provided test accuracy data for the index tests against a 48-hourpreterm delivery reference standard. Six of these studies evaluated Actim Partus48,52,53,56–58 and oneevaluated PartoSure.41
Actim PartusAcross the six studies evaluating Actim Partus against the prevalence of preterm birth within 48 hours,48,52,53,56–58
the prevalence of preterm birth within 48 hours ranged from 5.3% (95% CI 1.7% to 12.0%) in the study byTing et al.56 to 58.3% (95% CI 44.9% to 70.9%) in the study by Goyal et al.52 Sensitivity ranged from 65.7%(95% CI 47.8% to 80.9%) in the study by Goyal et al.52 to 100.0% (95% CI 47.8% to 100.0%) in the studyby Ting et al.56 Specificity ranged from 56.0% (95% CI 34.9% to 75.6%) in the study by Goyal et al.52 to82.4% (95% CI 56.6% to 96.2%) in the study by Vishwekar et al.58
Specific sensitivity and specificity values for all six studies are given in Table 7, in which it can be seen thatthe sensitivity and specificity of Actim Partus for the 48-hour reference standard were lowest in the studiesby Goyal et al.52 and Brik et al.48 compared with the other four studies,53,56–58 which seem more in line witheach other. There were no obvious methodological or participant characteristic differences in these studies(other than that the women in the studies by Goyal et al.52 and Brik et al.48 were, on average, 1 year olderthan those in the other studies). Brik et al.48 did present data for the number of women who receivedtocolytics (77.2%), but the other five studies did not provide this information, so we cannot assesswhether this was particularly high or low in comparison.
A ROC plot for the six studies assessing Actim Partus against the 48-hour delivery reference standard isprovided in Figure 5. Pooled analyses were conducted for these data and provided a pooled sensitivity of87% (95% CI 74% to 94%) and a pooled specificity of 73% (95% CI 62% to 82%).
In the six studies evaluating Actim Partus against the prevalence of preterm birth within 48 hours, the PPVwas lower in the studies by Brik et al.48 and Ting et al.56 [16.0% (95% CI 9.6% to 24.4%) and 17.9% (95% CI6.1% to 36.9%), respectively] than in the other four studies [range 62.1% (95% CI 54.4% to 69.5%) to78.6% (95% CI 49.2% to 95.3%)]. This is likely to be linked to the prevalence also being low in these twostudies (8.3%, 95% CI 5.4% to 12.2% in the study by Brik et al.48 and 5.3%, 95% CI 1.7% to 12.0% in thestudy by Ting et al.56). Conversely, NPV was lowest in the study by Goyal et al.52 (53.8%, 95% CI 33.4% to73.4%), with NPV in the other five studies ranging from 87.5% (95% CI 61.7% to 98.4%) in the study byVishwekar et al.58 to 100% (95% CI 94.6% to 100.0%) in the study by Ting et al.56 Looking at the diagnosticyield, the study by Goyal et al.52 was the only study in which > 50% of the population had a positive ActimPartus result (57%, 95% CI 43% to 69%); all other studies had a diagnostic yield of ≤ 50%. Data from thesesix Actim Partus studies were also used to calculate LR+, LR– and concordance. These values are providedin Table 7.
PartoSureIn the study evaluating PartoSure against the prevalence of preterm birth within 48 hours,41 prevalence ofpreterm birth within 48 hours was lower (2.4%, 95% CI 0.1% to 12.9%) than in any of the Actim Partusstudies discussed in the previous section. Sensitivity was 0.0% (95% CI 0.0% to 97.5%) and specificitywas 97.5% (95% CI 86.8% to 99.9%); the total sample size was 41 and only one test result was positive(a false positive).41 These data, along with calculated values for PPV, NPV, LR+, LR–, concordance and yield,are given in Table 7.
ASSESSMENT OF TEST ACCURACY
NIHR Journals Library www.journalslibrary.nihr.ac.uk
40
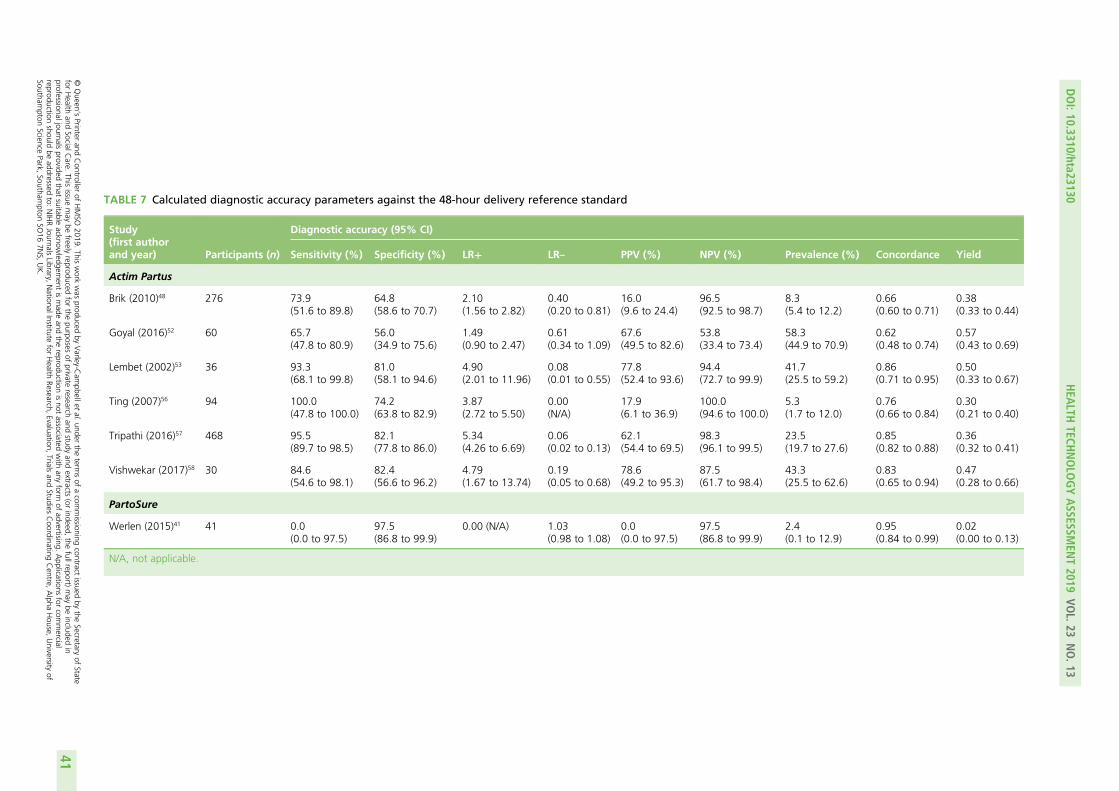
TABLE 7 Calculated diagnostic accuracy parameters against the 48-hour delivery reference standard
Study(first authorand year) Participants (n)
Diagnostic accuracy (95% CI)
Sensitivity (%) Specificity (%) LR+ LR– PPV (%) NPV (%) Prevalence (%) Concordance Yield
Actim Partus
Brik (2010)48 276 73.9(51.6 to 89.8)
64.8(58.6 to 70.7)
2.10(1.56 to 2.82)
0.40(0.20 to 0.81)
16.0(9.6 to 24.4)
96.5(92.5 to 98.7)
8.3(5.4 to 12.2)
0.66(0.60 to 0.71)
0.38(0.33 to 0.44)
Goyal (2016)52 60 65.7(47.8 to 80.9)
56.0(34.9 to 75.6)
1.49(0.90 to 2.47)
0.61(0.34 to 1.09)
67.6(49.5 to 82.6)
53.8(33.4 to 73.4)
58.3(44.9 to 70.9)
0.62(0.48 to 0.74)
0.57(0.43 to 0.69)
Lembet (2002)53 36 93.3(68.1 to 99.8)
81.0(58.1 to 94.6)
4.90(2.01 to 11.96)
0.08(0.01 to 0.55)
77.8(52.4 to 93.6)
94.4(72.7 to 99.9)
41.7(25.5 to 59.2)
0.86(0.71 to 0.95)
0.50(0.33 to 0.67)
Ting (2007)56 94 100.0(47.8 to 100.0)
74.2(63.8 to 82.9)
3.87(2.72 to 5.50)
0.00(N/A)
17.9(6.1 to 36.9)
100.0(94.6 to 100.0)
5.3(1.7 to 12.0)
0.76(0.66 to 0.84)
0.30(0.21 to 0.40)
Tripathi (2016)57 468 95.5(89.7 to 98.5)
82.1(77.8 to 86.0)
5.34(4.26 to 6.69)
0.06(0.02 to 0.13)
62.1(54.4 to 69.5)
98.3(96.1 to 99.5)
23.5(19.7 to 27.6)
0.85(0.82 to 0.88)
0.36(0.32 to 0.41)
Vishwekar (2017)58 30 84.6(54.6 to 98.1)
82.4(56.6 to 96.2)
4.79(1.67 to 13.74)
0.19(0.05 to 0.68)
78.6(49.2 to 95.3)
87.5(61.7 to 98.4)
43.3(25.5 to 62.6)
0.83(0.65 to 0.94)
0.47(0.28 to 0.66)
PartoSure
Werlen (2015)41 41 0.0(0.0 to 97.5)
97.5(86.8 to 99.9)
0.00 (N/A) 1.03(0.98 to 1.08)
0.0(0.0 to 97.5)
97.5(86.8 to 99.9)
2.4(0.1 to 12.9)
0.95(0.84 to 0.99)
0.02(0.00 to 0.13)
N/A, not applicable.
DOI:10.3310/hta23130
HEA
LTHTECH
NOLO
GYASSESSM
ENT2019
VOL.23
NO.13
©Queen
’sPrinter
andController
ofHMSO
2019.This
work
was
producedby
Varley-C
ampbellet
al.under
theterm
sof
acom
missioning
contractissued
bythe
Secretaryof
Statefor
Health
andSocialC
are.This
issuemay
befreely
reproducedfor
thepurposes
ofprivate
researchand
studyand
extracts(or
indeed,the
fullreport)may
beincluded
inprofessionaljournals
providedthat
suitableacknow
ledgement
ismade
andthe
reproductionisnot
associatedwith
anyform
ofadvertising.
Applications
forcom
mercial
reproductionshould
beaddressed
to:NIHRJournals
Library,NationalInstitute
forHealth
Research,Evaluation,
Trialsand
StudiesCoordinating
Centre,
Alpha
House,
University
ofSoutham
ptonScience
Park,Southam
ptonSO
167N
S,UK.
41
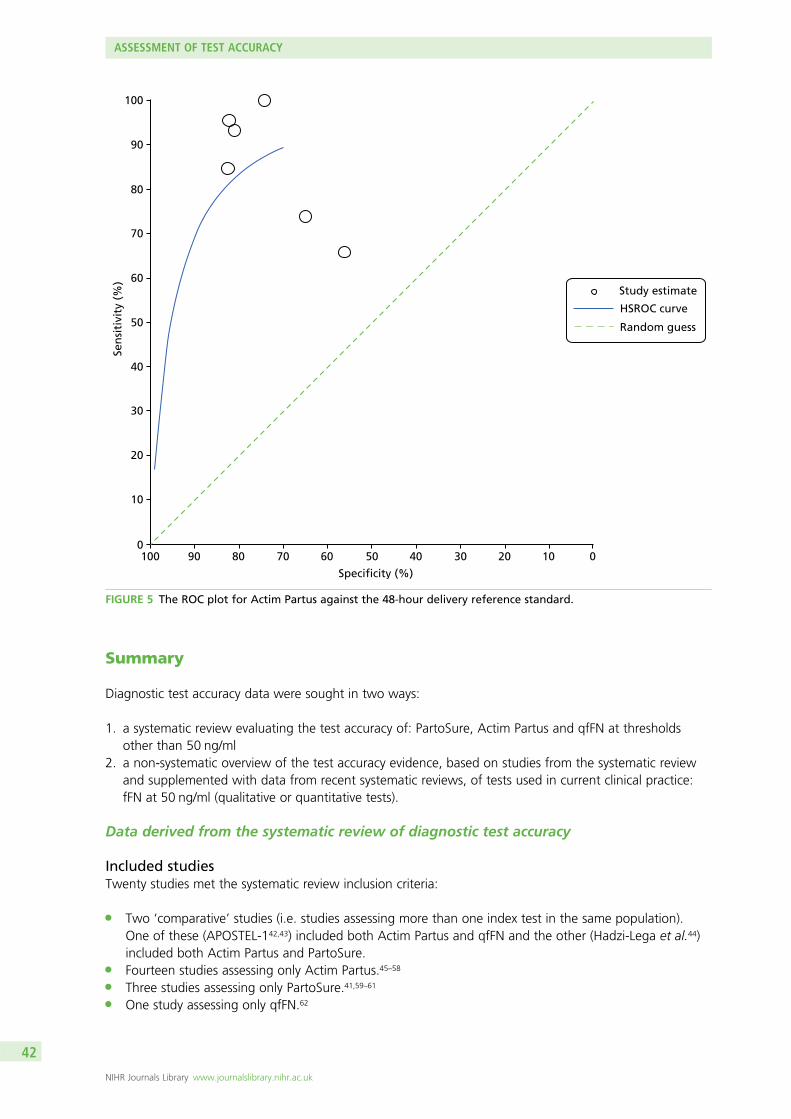
Summary
Diagnostic test accuracy data were sought in two ways:
1. a systematic review evaluating the test accuracy of: PartoSure, Actim Partus and qfFN at thresholdsother than 50 ng/ml
2. a non-systematic overview of the test accuracy evidence, based on studies from the systematic reviewand supplemented with data from recent systematic reviews, of tests used in current clinical practice:fFN at 50 ng/ml (qualitative or quantitative tests).
Data derived from the systematic review of diagnostic test accuracy
Included studiesTwenty studies met the systematic review inclusion criteria:
l Two ‘comparative’ studies (i.e. studies assessing more than one index test in the same population).One of these (APOSTEL-142,43) included both Actim Partus and qfFN and the other (Hadzi-Lega et al.44)included both Actim Partus and PartoSure.
l Fourteen studies assessing only Actim Partus.45–58
l Three studies assessing only PartoSure.41,59–61
l One study assessing only qfFN.62
100
90
80
70
60
50
40
30
20
10
0100 90 80 70 60 50 40 30 20 10 0
Specificity (%)
Sen
siti
vity
(%
)
Study estimate
HSROC curve
Random guess
FIGURE 5 The ROC plot for Actim Partus against the 48-hour delivery reference standard.
ASSESSMENT OF TEST ACCURACY
NIHR Journals Library www.journalslibrary.nihr.ac.uk
42
All 20 studies evaluated DTA against a reference standard of preterm delivery within 7 days.41–62 In sevenstudies (six Actim Partus studies and one PartoSure study), test accuracy was also measured against areference standard of preterm delivery within 48 hours.41,48,52,53,56–58
In the studies assessing two index tests in the same sample, APOSTEL-142,43 and Hadzi-Lega et al.,44 sample sizeswere 350 and 57, respectively. Sample sizes in the other studies ranged from 30 to 468 for Actim Partus57,58
and from 41 to 203 for PartoSure,41,60,61 and the only study evaluating qfFN alone comprised 455 participants.62
In addition, seven ongoing trials were identified that may be relevant to this review question, includingfour trials conducted in the UK (two of which aim to recruit > 1000 participants).
Heterogeneity between studiesThere was substantial methodological, clinical and statistical heterogeneity between studies, including:
l The prevalence of preterm birth – prevalence of preterm delivery within 7 days ranged from 1.7%(95% CI 0.6% to 3.7%) to 73.3% (95% CI 60.3% to 83.9%) and prevalence of preterm delivery within48 hours ranged from 2.4% (95% CI 0.1% to 12.9%) to 58.3% (95% CI 44.9% to 70.9%).41,49,52
l Mode of delivery – four studies reported that women who had a non-spontaneous delivery within thetime frame of the reference standard were excluded from the test accuracy data,42–44,59,62 three furtherstudies mentioned iatrogenic delivery as a reason for exclusion, but it is unclear how many of thesedeliveries took place within the time frame of the reference standard,48,58,60,61 and three studies reportthe number of spontaneous/iatrogenic deliveries but include the data from these women.47,49,55 In theremaining 10 studies, the mode of delivery was not clearly reported.41,45,46,50–54,56,57
l Gestation – the majority of included studies used 24 weeks as the lower limit for gestation atenrolment,41–43,45–52,54–56,62 with the lower limit in the remaining six studies ranging from 20 to28 weeks.44,53,57–61 The upper limit for gestation varied more between studies, ranging from 32.6 to37 weeks.50,55,57,58 No studies reported test accuracy data stratified by gestation.
l Symptoms defined as indicative of preterm labour – all included studies state that women presentedwith symptoms indicative of preterm labour, and all but one study provided further detail regardingthese symptoms.56 All other studies reported uterine contractions as a necessary indicator of pretermlabour;41–48,50–55,57–62 however, there was variation in the rate of uterine contractions necessary forinclusion.42,43,45,50–55,57,62 Other symptoms of preterm labour varied between studies, covering abdominalor back pain, pelvic pressure, vaginal bleeding and/or vaginal discharge.
l Multiple gestations – four studies included women with multifetal pregnancies.1,42,43,49,58,62 In thesestudies, the proportion of study participants with multifetal pregnancies ranged from 6% to 20%.42,43,49
l Risk status – only one study clearly reports the risk status of participants.59 Heterogeneity of studiesregarding the risk status of women is, therefore, unclear.
l Dilatation threshold and cervical length – all but four studies included a dilatation threshold forexclusion.49,52,53,58 Typically, the threshold was > 3 cm or ≥ 3 cm, but two studies had a lower threshold(> 2 cm and ≥ 2 cm).46,54 In two studies, all included women had a transvaginal cervical lengthmeasurement ≤ 30 mm.42,43,50
l Other more specific exclusion criteria also varied between studies (e.g. cervical cerclage, previoustocolytic treatment, recent sexual intercourse, vaginal bleeding and prior cervical examination).
l Participant characteristics also differed between studies. These differences included average maternalage, gestational age at presentation and history of preterm delivery.
Administration of index testsStudies generally followed manufacturers’ guidance on how to administer index tests. Key differences inhow the tests were administered include:
l Two studies used frozen samples in their analysis.42,43,49 It is unclear how long samples were storedbefore testing. This protocol is inconsistent with manufacturer guidance and clinical practice.
l One Actim Partus study included two failed tests (no visible lines) as positive test results.55
DOI: 10.3310/hta23130 HEALTH TECHNOLOGY ASSESSMENT 2019 VOL. 23 NO. 13
© Queen’s Printer and Controller of HMSO 2019. This work was produced by Varley-Campbell et al. under the terms of a commissioning contract issued by the Secretary of Statefor Health and Social Care. This issue may be freely reproduced for the purposes of private research and study and extracts (or indeed, the full report) may be included inprofessional journals provided that suitable acknowledgement is made and the reproduction is not associated with any form of advertising. Applications for commercialreproduction should be addressed to: NIHR Journals Library, National Institute for Health Research, Evaluation, Trials and Studies Coordinating Centre, Alpha House, University ofSouthampton Science Park, Southampton SO16 7NS, UK.
43

l Two Actim Partus studies collected samples from the posterior fornix rather than from the externalcervical os.42,43,56
Provision of treatmentIt should be noted that providing treatment (tocolytics and/or corticosteroids) may have an impact on theoccurrence of the reference standard (i.e. whether or not preterm delivery takes place), and this wouldhave an impact on the test accuracy data.
Whether or not a woman received treatment for symptoms of preterm labour varied substantially betweenstudies. Moreover, the number of women receiving treatment was not always reported, particularly withreference to the results of the index tests.
This means that, in the included studies, it is difficult to ascertain the extent to which treatment may havehad an impact on the test accuracy results.
Quality appraisalPhase 3 of the QUADAS-2 tool was used to evaluate the risk of bias and highlight concerns regardingapplicability. All studies were single-gate DTA studies, and issues regarding risk of bias and concernsregarding applicability were minimal. However, the following key points were noted:
l Overall, there was a lack of detail regarding recruitment methods, with only five studies providingclear details.47,48,50,58,60,61
l Two studies used frozen samples. Therefore, in these studies, the timing of the index tests wasinconsistent with clinical practice and assessors could have potentially been aware of the referencestandard (occurrence of preterm birth within 48 hours or within 7 days).42,43,49 There is also no clearevidence regarding the likely impact of longer-term storage on the tests.
l In eight studies, there was lack of clarity regarding whether or not index test assessors were blinded tothe results of additional diagnostic tests (e.g. cervical length);42,43,50,51,54,56,57,60–62 however, owing to thenature of the index tests, there is little scope for bias to exist in their interpretation.
l In two Actim Partus studies, samples were collected from the posterior fornix rather than the externalcervical os.42,43,56
l The lack of clarity regarding the administration of tocolytics, particularly in reference to test results,precluded a thorough evaluation of the effect of treatment on test accuracy data.
Summary of the data available across the systematic review and overviewTable 8 summarises the results from the systematic review of DTA for the three index tests (PartoSure,Actim Partus and qfFN).
TABLE 8 Summary of evidence and relative accuracy against the 7-day reference standard
Index tests Actim Partus PartoSure
qfFN at
10 ng/ml 200 ng/ml 500 ng/ml
Actim Partus NA
PartoSure No difference (Hadzi-Lega et al., 201744) NA
qfFN at
10 ng/ml Sensitivity of fFN superior, specificityof Actim Partus superior (APOSTEL-142,43)
Indirect evidence only NA
200 ng/ml No difference (APOSTEL-142,43) Indirect evidence only NA
500 ng/ml Sensitivity of Actim Partus superior,specificity of fFN superior (APOSTEL-142,43)
Indirect evidence only NA
NA, not applicable.
ASSESSMENT OF TEST ACCURACY
NIHR Journals Library www.journalslibrary.nihr.ac.uk
44
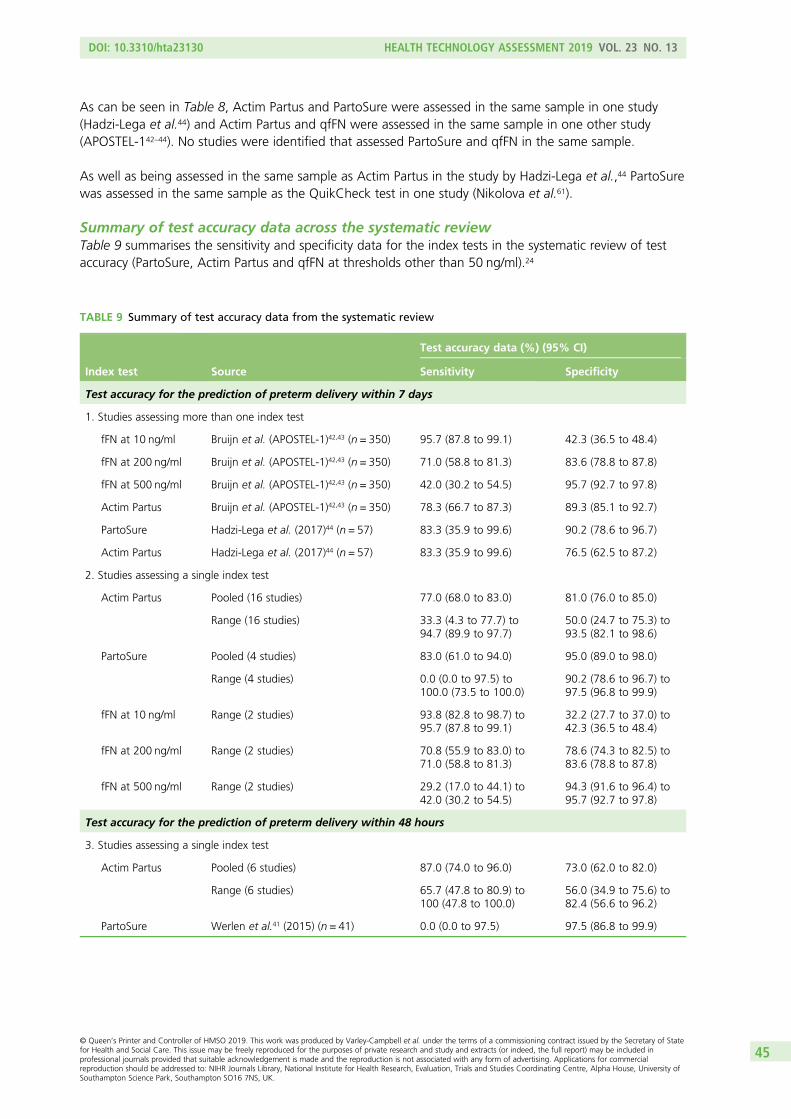
As can be seen in Table 8, Actim Partus and PartoSure were assessed in the same sample in one study(Hadzi-Lega et al.44) and Actim Partus and qfFN were assessed in the same sample in one other study(APOSTEL-142–44). No studies were identified that assessed PartoSure and qfFN in the same sample.
As well as being assessed in the same sample as Actim Partus in the study by Hadzi-Lega et al.,44 PartoSurewas assessed in the same sample as the QuikCheck test in one study (Nikolova et al.61).
Summary of test accuracy data across the systematic reviewTable 9 summarises the sensitivity and specificity data for the index tests in the systematic review of testaccuracy (PartoSure, Actim Partus and qfFN at thresholds other than 50 ng/ml).24
TABLE 9 Summary of test accuracy data from the systematic review
Index test Source
Test accuracy data (%) (95% CI)
Sensitivity Specificity
Test accuracy for the prediction of preterm delivery within 7 days
1. Studies assessing more than one index test
fFN at 10 ng/ml Bruijn et al. (APOSTEL-1)42,43 (n = 350) 95.7 (87.8 to 99.1) 42.3 (36.5 to 48.4)
fFN at 200 ng/ml Bruijn et al. (APOSTEL-1)42,43 (n = 350) 71.0 (58.8 to 81.3) 83.6 (78.8 to 87.8)
fFN at 500 ng/ml Bruijn et al. (APOSTEL-1)42,43 (n = 350) 42.0 (30.2 to 54.5) 95.7 (92.7 to 97.8)
Actim Partus Bruijn et al. (APOSTEL-1)42,43 (n = 350) 78.3 (66.7 to 87.3) 89.3 (85.1 to 92.7)
PartoSure Hadzi-Lega et al. (2017)44 (n = 57) 83.3 (35.9 to 99.6) 90.2 (78.6 to 96.7)
Actim Partus Hadzi-Lega et al. (2017)44 (n = 57) 83.3 (35.9 to 99.6) 76.5 (62.5 to 87.2)
2. Studies assessing a single index test
Actim Partus Pooled (16 studies) 77.0 (68.0 to 83.0) 81.0 (76.0 to 85.0)
Range (16 studies) 33.3 (4.3 to 77.7) to94.7 (89.9 to 97.7)
50.0 (24.7 to 75.3) to93.5 (82.1 to 98.6)
PartoSure Pooled (4 studies) 83.0 (61.0 to 94.0) 95.0 (89.0 to 98.0)
Range (4 studies) 0.0 (0.0 to 97.5) to100.0 (73.5 to 100.0)
90.2 (78.6 to 96.7) to97.5 (96.8 to 99.9)
fFN at 10 ng/ml Range (2 studies) 93.8 (82.8 to 98.7) to95.7 (87.8 to 99.1)
32.2 (27.7 to 37.0) to42.3 (36.5 to 48.4)
fFN at 200 ng/ml Range (2 studies) 70.8 (55.9 to 83.0) to71.0 (58.8 to 81.3)
78.6 (74.3 to 82.5) to83.6 (78.8 to 87.8)
fFN at 500 ng/ml Range (2 studies) 29.2 (17.0 to 44.1) to42.0 (30.2 to 54.5)
94.3 (91.6 to 96.4) to95.7 (92.7 to 97.8)
Test accuracy for the prediction of preterm delivery within 48 hours
3. Studies assessing a single index test
Actim Partus Pooled (6 studies) 87.0 (74.0 to 96.0) 73.0 (62.0 to 82.0)
Range (6 studies) 65.7 (47.8 to 80.9) to100 (47.8 to 100.0)
56.0 (34.9 to 75.6) to82.4 (56.6 to 96.2)
PartoSure Werlen et al.41 (2015) (n = 41) 0.0 (0.0 to 97.5) 97.5 (86.8 to 99.9)
DOI: 10.3310/hta23130 HEALTH TECHNOLOGY ASSESSMENT 2019 VOL. 23 NO. 13
© Queen’s Printer and Controller of HMSO 2019. This work was produced by Varley-Campbell et al. under the terms of a commissioning contract issued by the Secretary of Statefor Health and Social Care. This issue may be freely reproduced for the purposes of private research and study and extracts (or indeed, the full report) may be included inprofessional journals provided that suitable acknowledgement is made and the reproduction is not associated with any form of advertising. Applications for commercialreproduction should be addressed to: NIHR Journals Library, National Institute for Health Research, Evaluation, Trials and Studies Coordinating Centre, Alpha House, University ofSouthampton Science Park, Southampton SO16 7NS, UK.
45

With regard to the reference standard of preterm delivery within 7 days:
l Data set 1 (see Table 9) reports test accuracy data obtained from the two studies that assess two indextests (included in the systematic review).
l Data set 2 (see Table 9) reports the sensitivity and specificity values from all included studies (thoseevaluating only one index test and those evaluating more than one index test); for all index tests,data set 2 (see Table 9) reports the range of sensitivities and specificities across the individual studies.Meta-analyses were conducted to calculate pooled sensitivity and specificity for the 16 studies assessingActim Partus and for the four studies assessing PartoSure. Meta-analyses were not conducted for qfFNbecause only two studies of this test were included.
With regard to the reference standard of preterm delivery within 48 hours:
l Data set 3 (see Table 9) reports the range of sensitivities and specificities across the six Actim Partusstudies included in the systematic review and also reports the sensitivity and specificity derived from theone PartoSure study providing test accuracy data against the 48-hour reference standard. For ActimPartus, meta-analyses were conducted.
ASSESSMENT OF TEST ACCURACY
NIHR Journals Library www.journalslibrary.nihr.ac.uk
46
Chapter 3 Assessment of clinical effectiveness(end-to-end) studies
End-to-end studies investigate the clinical impact of conducting tests by following patients from testing,through treatment to final clinical outcomes. Randomised controlled trials (RCTs) provide the best-quality
end-to-end comparative evidence, providing a direct link between a testing strategy and the clinicaloutcomes of interest. We conducted a systematic review of end-to-end studies, with a particular focus onRCTs but also including other controlled study designs. This review was undertaken following the generalprinciples published by the University of York Centre for Reviews and Dissemination.37 The protocol wasregistered on PROSPERO (reference number CRD42017072696).
Methods for reviewing effectiveness
Identification of studiesThe same searches as for the review of diagnostic accuracy studies were conducted (see Chapter 2,Identification of studies). In brief, these included searches of electronic databases (these were designed toidentify all studies assessing PartoSure, Actim Partus and qfFN), all systematic reviews identified by theelectronic searches, trial registries, Google Advanced Search, reference lists of included DTA studies,studies citing the included DTA studies and industry submissions to NICE.
As with the review of DTA (see Chapter 2, Methods of the systematic review), screening for relevantstudies was in two stages (screening of titles and abstracts and then screening of papers obtained in full).At both stages, screening was conducted concurrently with the screening for the review of test accuracystudies and this was done independently by two reviewers (two of JVC, SD, MB and HC). Prespecifiedinclusion and exclusion criteria were used (see Inclusion and exclusion criteria). Disagreements wereresolved by discussion.
Inclusion and exclusion criteria
PopulationRegarding the population, inclusion criteria were the same as those for the review of test accuracy studies;this includes the protocol amendment in which twin or multiple pregnancies could make up 20% of thetotal population (see Chapter 2, Population).
InterventionsThe interventions under consideration were identical to those in the review of test accuracy (i.e. PartoSure,Actim Partus and qfFN; see Chapter 2, Index tests).
ComparatorsStudies were eligible for inclusion if at least one of the interventions was compared with one or more ofthe following comparators:
l one of the other interventions (with or without an assessment of clinical symptoms)l the qfFN test used with a threshold of 50 ng/ml (with or without an assessment of clinical symptoms)l a qualitative fFN test (with or without an assessment of clinical symptoms)l clinical assessment of symptoms alone.
DOI: 10.3310/hta23130 HEALTH TECHNOLOGY ASSESSMENT 2019 VOL. 23 NO. 13
© Queen’s Printer and Controller of HMSO 2019. This work was produced by Varley-Campbell et al. under the terms of a commissioning contract issued by the Secretary of Statefor Health and Social Care. This issue may be freely reproduced for the purposes of private research and study and extracts (or indeed, the full report) may be included inprofessional journals provided that suitable acknowledgement is made and the reproduction is not associated with any form of advertising. Applications for commercialreproduction should be addressed to: NIHR Journals Library, National Institute for Health Research, Evaluation, Trials and Studies Coordinating Centre, Alpha House, University ofSouthampton Science Park, Southampton SO16 7NS, UK.
47

OutcomesIn accordance with the NICE scope,12 eligible studies should have included one or more of the followingoutcomes in order to be eligible for inclusion:
l perinatal mortalityl neonatal morbidity and mortalityl long-term health problems in the childl maternal morbidity and mortalityl health-related quality of lifel anxiety associated with confidence in the test resultsl number of women admitted to hospitall number of re-presentations to hospital within 48 hours and 7 daysl number of women who have tocolytics/corticosteroidsl length of inpatient hospital stayl number of transfers of pregnant women and neonates between hospitalsl time to delivery from presentationl number of women treated with maternal corticosteroids appropriately (i.e. they deliver within 7 days
following treatment)l number of women treated with maternal corticosteroids inappropriately (i.e. they do not deliver within
7 days following treatment)l impact on neonatal intensive care resource planningl gestational age at birth.
Studies that report data on costs only were not eligible for inclusion in the review of clinical effectiveness.
Study designRandomised controlled trials were primarily sought for this review; however, other controlled designs(prospective or retrospective) were also eligible for inclusion.
Other methodsFurther aspects of the review methods (data extraction strategy, critical appraisal strategy and methods ofdata synthesis) are not described as there were no included studies.
Results
Quantity and quality of research availableAfter screening 2623 items, no studies were identified that met the inclusion criteria for the review of clinicaleffectiveness. This was because none of the studies compared the tests of interest with a comparatorregarding the clinical outcomes of interest; there were no studies identified in which some women receivedone test and some received another and even in the studies identified in the test accuracy review, in whichwomen received more than one test (see Chapter 2, Summary), there was no clear indication that treatmentdecisions were based on the results of one test for some women and based on the results of the other testfor other women. Indeed, these studies did not provide data on the clinical outcomes of interest.
Assessment of effectivenessWe were not able to draw any conclusions on the effectiveness of PartoSure, Actim Partus or fFN from thesystematic review of end-to-end studies.
It is important to consider that this review was looking for evidence from controlled study designs. For thesystematic review of clinical effectiveness, we did not look for evidence of clinical effectiveness from otherdesigns (e.g. uncontrolled pre–post studies). This decision was made because these designs may be tooopen to bias to be worth including in a systematic review of end-to-end studies, even if they provide theonly available evidence.
ASSESSMENT OF CLINICAL EFFECTIVENESS (END-TO-END) STUDIES
NIHR Journals Library www.journalslibrary.nihr.ac.uk
48
Summary
We were not able to draw any conclusions on the effectiveness of PartoSure, Actim Partus or qfFN fromthe systematic review of end-to-end studies.
It is unlikely that we have missed major items of published literature; our broad searches were not restrictedby a study design filter and were focused on identifying all studies of the tests of interest. In order to identifyother (potentially unpublished) literature, and to reduce the likelihood of overlooking any relevant end-to-endstudies, web searches and searches of trial registries were conducted. We also considered conferenceabstracts that were identified in the electronic searches, but from the limited information provided in theseabstracts it did not appear that any useful end-to-end data were available.
It is important to consider that this review was looking for evidence from controlled study designs anddid not look for evidence from other designs (e.g. uncontrolled pre–post studies). Therefore, it is worthconsidering whether or not conducting controlled studies in this area can reasonably be expected. Onbalance, it does not seem unreasonable to expect such studies to be conducted in this population; theprincipal barrier to conducting a RCT would be the potential difficulty of recruiting participants during anacute medical situation (e.g. the time needed to consent and randomise). However, this population andthese tests would also lend themselves well to a RCT design with regards the length of follow-up required(for a number of key outcomes, the length of follow-up could be < 1 year).
Nevertheless, the decision to only include controlled studies was primarily based on the fact thatuncontrolled designs may be too open to bias to be worth including in a systematic review of end-to-endstudies, even if they provide the only available evidence. However, it should be noted that it may benecessary for data from pre–post studies to be used in economic modelling (i.e. to parameterise a modelwhen this is the only available evidence) and these data may, therefore, be obtained from studies thathave not been selected via a systematic reviewing process.
DOI: 10.3310/hta23130 HEALTH TECHNOLOGY ASSESSMENT 2019 VOL. 23 NO. 13
© Queen’s Printer and Controller of HMSO 2019. This work was produced by Varley-Campbell et al. under the terms of a commissioning contract issued by the Secretary of Statefor Health and Social Care. This issue may be freely reproduced for the purposes of private research and study and extracts (or indeed, the full report) may be included inprofessional journals provided that suitable acknowledgement is made and the reproduction is not associated with any form of advertising. Applications for commercialreproduction should be addressed to: NIHR Journals Library, National Institute for Health Research, Evaluation, Trials and Studies Coordinating Centre, Alpha House, University ofSouthampton Science Park, Southampton SO16 7NS, UK.
49


Chapter 4 Data informing the economic modelling
The systematic review produced limited DTA data (see Chapter 2) and no clinical effectiveness data(see Chapter 3) for populating an economic evaluation of diagnostic tests of interest. There was no
single DTA study that evaluated all three index tests, and only two studies (APOSTEL-142,43 and Hadzi-Legaet al.44) compared at least two index tests. There is a high degree of heterogeneity between the revieweddiagnostic accuracy studies in terms of prevalence of preterm birth, mode of delivery, gestational age,definition (symptoms) of preterm labour (including dilatation threshold), multiple gestations, participantcharacteristics and provision of treatments. In the light of this, comparisons among tests on the basisof the results of the meta-analyses presented in Chapter 2 are likely to be biased because the studiesproviding data for meta-analyses are very different both within and between the different tests. Therefore,of the studies identified and reviewed in Chapter 2, only studies that presented results for at least twodifferent index tests in the same patient sample were used for the economic evaluation in Chapter 6. Therewere two such studies: APOSTEL-1,42,43 which assessed both Actim Partus and fFN, and Hadzi-Lega et al.,44
which assessed Actim Partus and PartoSure. In addition, we excluded studies that investigated laboratory-based enzyme-linked immunosorbent assay (ELISA) qualitative (at 50 ng/ml) fFN tests, as this technologyis no longer in use; thus, meta-analysis of the remaining four studies of Actim Partus versus qualitativefFN42,43,51,56,57 provided the DTA results used in the economic evaluation. Details are presented in Chapter 6.
DOI: 10.3310/hta23130 HEALTH TECHNOLOGY ASSESSMENT 2019 VOL. 23 NO. 13
© Queen’s Printer and Controller of HMSO 2019. This work was produced by Varley-Campbell et al. under the terms of a commissioning contract issued by the Secretary of Statefor Health and Social Care. This issue may be freely reproduced for the purposes of private research and study and extracts (or indeed, the full report) may be included inprofessional journals provided that suitable acknowledgement is made and the reproduction is not associated with any form of advertising. Applications for commercialreproduction should be addressed to: NIHR Journals Library, National Institute for Health Research, Evaluation, Trials and Studies Coordinating Centre, Alpha House, University ofSouthampton Science Park, Southampton SO16 7NS, UK.
51

Chapter 5 Systematic review of existingcost-effectiveness evidence
The first part of this chapter presents the results of a systematic review of previous economic studies ofthe diagnostic test interventions. Owing to the limited evidence on economic evaluations evaluating
index tests, the review was extended to include economic evaluation studies of any test identified in oursystematic search of cost-effectiveness studies. The second part of this chapter presents a review of themodelling structures used in previous evaluations of diagnostic tests for the diagnosis of preterm labour insymptomatic women with intact membranes, identified by the same systematic search.
Methods for reviewing economic evaluation studies
Systematic review methods were used to identify previously published economic evaluations of the threetests under consideration: PartoSure, Actim Partus and qfFN. The review was undertaken following thegeneral principles published by the University of York Centre for Reviews and Dissemination.37 The protocolwas registered on PROSPERO (reference number CRD42017072696).
Identification of studiesThe methods followed those reported in Chapter 2, Methods of the systematic review, for study identification.Studies were screened by two reviewers (RMM and JVC).
Inclusion and exclusion criteriaThe population, index test and reference standard matched those reported in Chapter 2, Inclusion andexclusion criteria, and the inclusion criteria include the protocol amendment that twin or multiple pregnanciescould make up 20% of the total population. However, for the review of economic evaluations, the criteria forinclusion permitted studies that reported health-care costs of an index test without restriction in terms of thedesign of the effectiveness study. In the following sections, any reference to exclusions owing to study designmean economic study design (i.e. exclusion of studies that are not economic evaluations).
Data extraction strategyData were extracted by one reviewer (RMM) using standardised data extraction templates.
Critical appraisal strategyThe quality of the studies was assessed in detail by an experienced health economist (RMM) in accordancewith the criteria specified by the Consolidated Health Economic Evaluation Reporting Standards (CHEERS)checklist.64 This represents a deviation from the study protocol, which stated that the Drummond andJefferson’s checklist would be used.65
Methods of data synthesisData were narratively reported. Methods and results were tabulated using the prices and currencies asreported by the identified studies.
Results
Figure 6 shows the study flow diagram of this review. The electronic database search identified 2252records after deduplication. All were screened on title and abstract. Of these 2252 records, 63 citationswere taken to full-text screening. One study met the inclusion criteria; it was a conference abstract67 of aMSc dissertation.68 We contacted the authors and they provided a copy of the dissertation, which is thebasis for this review.
DOI: 10.3310/hta23130 HEALTH TECHNOLOGY ASSESSMENT 2019 VOL. 23 NO. 13
© Queen’s Printer and Controller of HMSO 2019. This work was produced by Varley-Campbell et al. under the terms of a commissioning contract issued by the Secretary of Statefor Health and Social Care. This issue may be freely reproduced for the purposes of private research and study and extracts (or indeed, the full report) may be included inprofessional journals provided that suitable acknowledgement is made and the reproduction is not associated with any form of advertising. Applications for commercialreproduction should be addressed to: NIHR Journals Library, National Institute for Health Research, Evaluation, Trials and Studies Coordinating Centre, Alpha House, University ofSouthampton Science Park, Southampton SO16 7NS, UK.
53
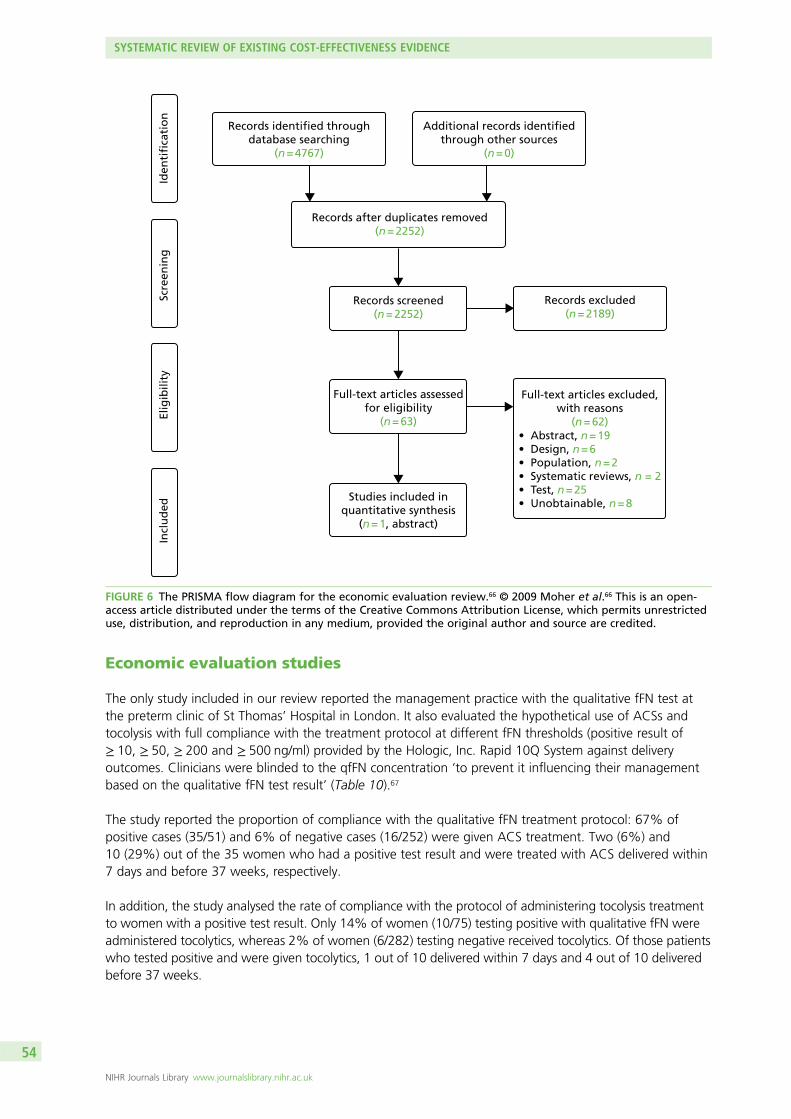
Economic evaluation studies
The only study included in our review reported the management practice with the qualitative fFN test atthe preterm clinic of St Thomas’ Hospital in London. It also evaluated the hypothetical use of ACSs andtocolysis with full compliance with the treatment protocol at different fFN thresholds (positive result of≥ 10, ≥ 50, ≥ 200 and ≥ 500 ng/ml) provided by the Hologic, Inc. Rapid 10Q System against deliveryoutcomes. Clinicians were blinded to the qfFN concentration ‘to prevent it influencing their managementbased on the qualitative fFN test result’ (Table 10).67
The study reported the proportion of compliance with the qualitative fFN treatment protocol: 67% ofpositive cases (35/51) and 6% of negative cases (16/252) were given ACS treatment. Two (6%) and10 (29%) out of the 35 women who had a positive test result and were treated with ACS delivered within7 days and before 37 weeks, respectively.
In addition, the study analysed the rate of compliance with the protocol of administering tocolysis treatmentto women with a positive test result. Only 14% of women (10/75) testing positive with qualitative fFN wereadministered tocolytics, whereas 2% of women (6/282) testing negative received tocolytics. Of those patientswho tested positive and were given tocolytics, 1 out of 10 delivered within 7 days and 4 out of 10 deliveredbefore 37 weeks.
Records identified throughdatabase searching
(n = 4767)
Additional records identifiedthrough other sources
(n = 0)
Records after duplicates removed(n = 2252)
Records screened(n = 2252)
Records excluded(n = 2189)
Full-text articles assessedfor eligibility
(n = 63)
Studies included inquantitative synthesis
(n = 1, abstract)
Full-text articles excluded,with reasons
(n = 62)• Abstract, n = 19• Design, n = 6• Population, n = 2• Systematic reviews, n = 2• Test, n = 25• Unobtainable, n = 8
Iden
tifi
cati
on
Scre
enin
gEl
igib
ility
Incl
ud
ed
FIGURE 6 The PRISMA flow diagram for the economic evaluation review.66 © 2009 Moher et al.66 This is an open-access article distributed under the terms of the Creative Commons Attribution License, which permits unrestricteduse, distribution, and reproduction in any medium, provided the original author and source are credited.
SYSTEMATIC REVIEW OF EXISTING COST-EFFECTIVENESS EVIDENCE
NIHR Journals Library www.journalslibrary.nihr.ac.uk
54
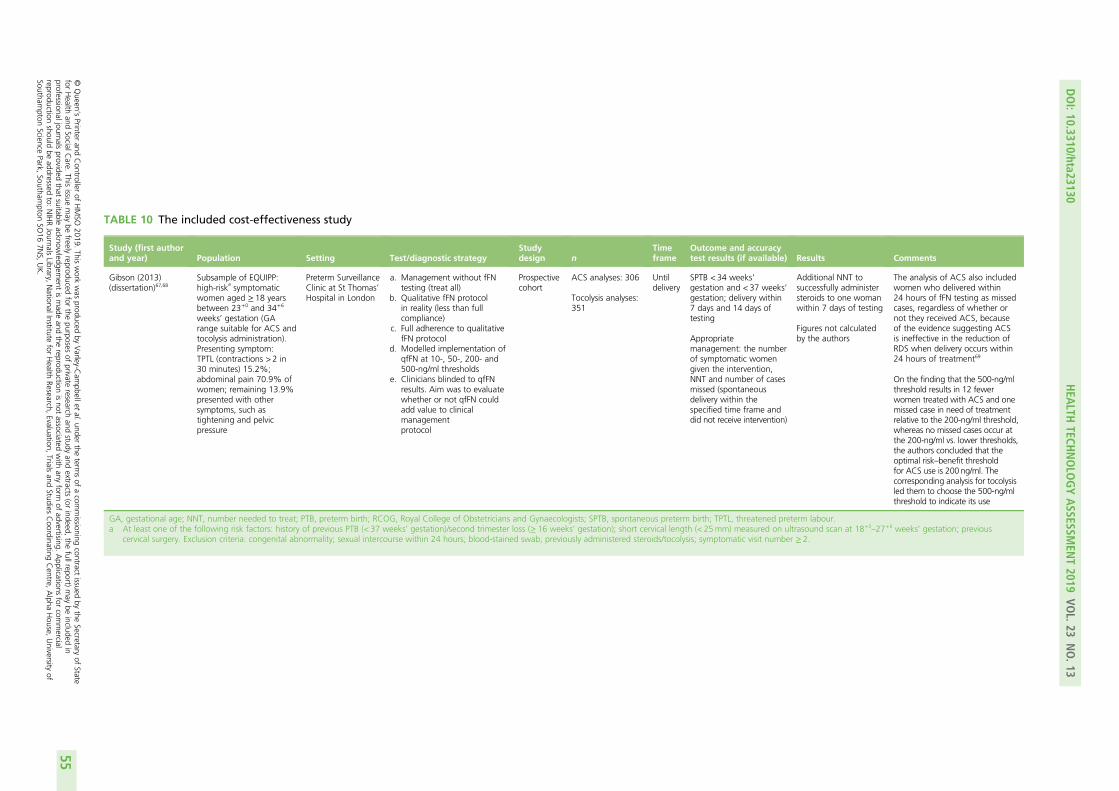
TABLE 10 The included cost-effectiveness study
Study (first authorand year) Population Setting Test/diagnostic strategy
Studydesign n
Timeframe
Outcome and accuracytest results (if available) Results Comments
Gibson (2013)(dissertation)67,68
Subsample of EQUIPP:high-risk
asymptomatic
women aged ≥ 18 yearsbetween 23+0 and 34+6
weeks’ gestation (GArange suitable for ACS andtocolysis administration).Presenting symptom:TPTL (contractions > 2 in30 minutes) 15.2%;abdominal pain 70.9% ofwomen; remaining 13.9%presented with othersymptoms, such astightening and pelvicpressure
Preterm SurveillanceClinic at St Thomas’Hospital in London
a. Management without fFNtesting (treat all)
b. Qualitative fFN protocolin reality (less than fullcompliance)
c. Full adherence to qualitativefFN protocol
d. Modelled implementation ofqfFN at 10-, 50-, 200- and500-ng/ml thresholds
e. Clinicians blinded to qfFNresults. Aim was to evaluatewhether or not qfFN couldadd value to clinicalmanagementprotocol
Prospectivecohort
ACS analyses: 306
Tocolysis analyses:351
Untildelivery
SPTB < 34 weeks’gestation and < 37 weeks’gestation; delivery within7 days and 14 days oftesting
Appropriatemanagement: the numberof symptomatic womengiven the intervention,NNT and number of casesmissed (spontaneousdelivery within thespecified time frame anddid not receive intervention)
Additional NNT tosuccessfully administersteroids to one womanwithin 7 days of testing
Figures not calculatedby the authors
The analysis of ACS also includedwomen who delivered within24 hours of fFN testing as missedcases, regardless of whether ornot they received ACS, becauseof the evidence suggesting ACSis ineffective in the reduction ofRDS when delivery occurs within24 hours of treatment69
On the finding that the 500-ng/mlthreshold results in 12 fewerwomen treated with ACS and onemissed case in need of treatmentrelative to the 200-ng/ml threshold,whereas no missed cases occur atthe 200-ng/ml vs. lower thresholds,the authors concluded that theoptimal risk–benefit thresholdfor ACS use is 200 ng/ml. Thecorresponding analysis for tocolysisled them to choose the 500-ng/mlthreshold to indicate its use
GA, gestational age; NNT, number needed to treat; PTB, preterm birth; RCOG, Royal College of Obstetricians and Gynaecologists; SPTB, spontaneous preterm birth; TPTL, threatened preterm labour.a At least one of the following risk factors: history of previous PTB (< 37 weeks’ gestation)/second trimester loss (≥ 16 weeks’ gestation); short cervical length (< 25mm) measured on ultrasound scan at 18+0
–27+6 weeks’ gestation; previouscervical surgery. Exclusion criteria: congenital abnormality; sexual intercourse within 24 hours; blood-stained swab; previously administered steroids/tocolysis; symptomatic visit number ≥ 2.
DOI:10.3310/hta23130
HEA
LTHTECH
NOLO
GYASSESSM
ENT2019
VOL.23
NO.13
©Queen
’sPrinter
andController
ofHMSO
2019.This
work
was
producedby
Varley-C
ampbellet
al.under
theterm
sof
acom
missioning
contractissued
bythe
Secretaryof
Statefor
Health
andSocialC
are.This
issuemay
befreely
reproducedfor
thepurposes
ofprivate
researchand
studyand
extracts(or
indeed,the
fullreport)may
beincluded
inprofessionaljournals
providedthat
suitableacknow
ledgement
ismade
andthe
reproductionisnot
associatedwith
anyform
ofadvertising.
Applications
forcom
mercial
reproductionshould
beaddressed
to:NIHRJournals
Library,NationalInstitute
forHealth
Research,Evaluation,
Trialsand
StudiesCoordinating
Centre,
Alpha
House,
University
ofSoutham
ptonScience
Park,Southam
ptonSO
167N
S,UK.
55
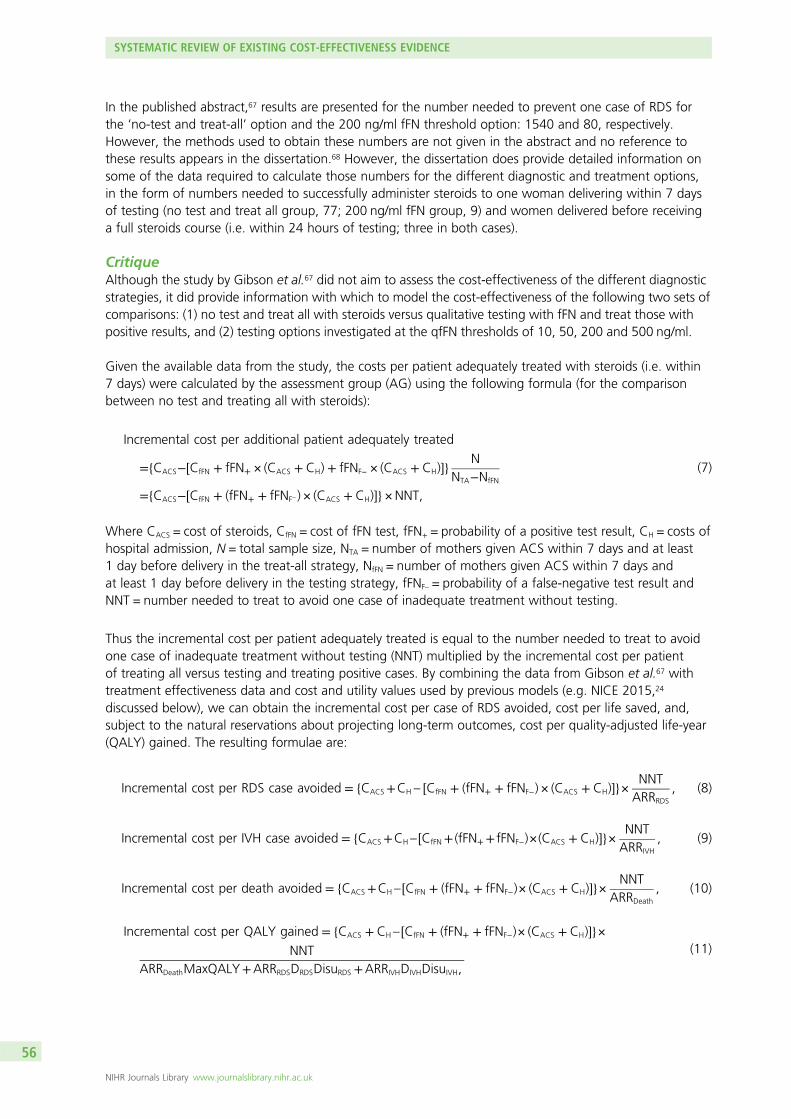
In the published abstract,67 results are presented for the number needed to prevent one case of RDS forthe ‘no-test and treat-all’ option and the 200 ng/ml fFN threshold option: 1540 and 80, respectively.However, the methods used to obtain these numbers are not given in the abstract and no reference tothese results appears in the dissertation.68 However, the dissertation does provide detailed information onsome of the data required to calculate those numbers for the different diagnostic and treatment options,in the form of numbers needed to successfully administer steroids to one woman delivering within 7 daysof testing (no test and treat all group, 77; 200 ng/ml fFN group, 9) and women delivered before receivinga full steroids course (i.e. within 24 hours of testing; three in both cases).
CritiqueAlthough the study by Gibson et al.67 did not aim to assess the cost-effectiveness of the different diagnosticstrategies, it did provide information with which to model the cost-effectiveness of the following two sets ofcomparisons: (1) no test and treat all with steroids versus qualitative testing with fFN and treat those withpositive results, and (2) testing options investigated at the qfFN thresholds of 10, 50, 200 and 500 ng/ml.
Given the available data from the study, the costs per patient adequately treated with steroids (i.e. within7 days) were calculated by the assessment group (AG) using the following formula (for the comparisonbetween no test and treating all with steroids):
Incremental cost per additional patient adequately treated
=fCACS−½CfFN + fFN+ × (CACS + CH) + fFNF− × (CACS + CH)�g NNTA−NfFN
=fCACS−½CfFN + (fFN+ + fFNF− ) × (CACS + CH)�g×NNT,
(7)
Where CACS = cost of steroids, CfFN = cost of fFN test, fFN+ = probability of a positive test result, CH = costs ofhospital admission, N = total sample size, NTA = number of mothers given ACS within 7 days and at least1 day before delivery in the treat-all strategy, NfFN = number of mothers given ACS within 7 days andat least 1 day before delivery in the testing strategy, fFNF– = probability of a false-negative test result andNNT = number needed to treat to avoid one case of inadequate treatment without testing.
Thus the incremental cost per patient adequately treated is equal to the number needed to treat to avoidone case of inadequate treatment without testing (NNT) multiplied by the incremental cost per patientof treating all versus testing and treating positive cases. By combining the data from Gibson et al.67 withtreatment effectiveness data and cost and utility values used by previous models (e.g. NICE 2015,24
discussed below), we can obtain the incremental cost per case of RDS avoided, cost per life saved, and,subject to the natural reservations about projecting long-term outcomes, cost per quality-adjusted life-year(QALY) gained. The resulting formulae are:
Incremental cost per RDS case avoided = fCACS+CH – ½CfFN + (fFN+ + fFNF−) × (CACS + CH)�g× NNTARRRDS
, (8)
Incremental cost per IVH case avoided = fCACS+CH – ½CfFN+ (fFN++ fFNF−)×(CACS + CH)�g× NNTARRIVH
, (9)
Incremental cost per death avoided = fCACS+CH – ½CfFN + (fFN+ + fFNF−)× (CACS + CH)�g× NNTARRDeath
, (10)
Incremental cost per QALY gained = fCACS + CH – ½CfFN + (fFN+ + fFNF−)× (CACS + CH)�g×NNT
ARRDeathMaxQALY+ARRRDSDRDSDisuRDS +ARRIVHDIVHDisuIVH,
(11)
SYSTEMATIC REVIEW OF EXISTING COST-EFFECTIVENESS EVIDENCE
NIHR Journals Library www.journalslibrary.nihr.ac.uk
56
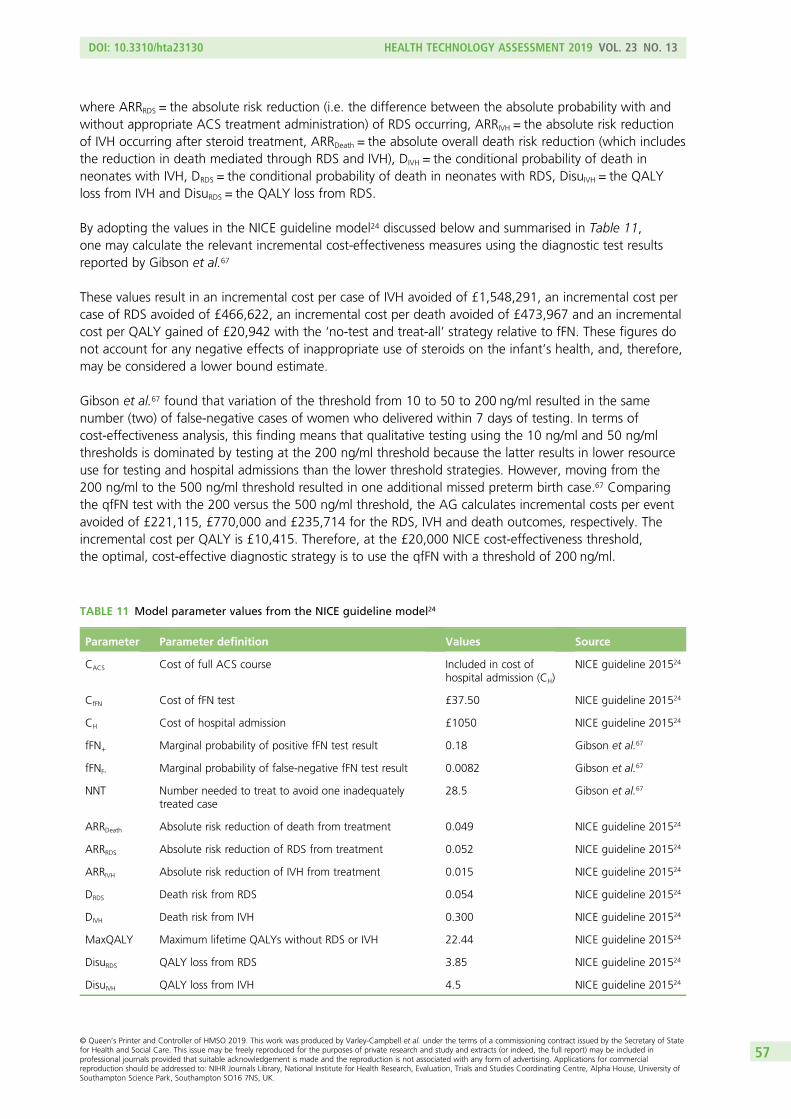
where ARRRDS = the absolute risk reduction (i.e. the difference between the absolute probability with andwithout appropriate ACS treatment administration) of RDS occurring, ARRIVH = the absolute risk reductionof IVH occurring after steroid treatment, ARRDeath = the absolute overall death risk reduction (which includesthe reduction in death mediated through RDS and IVH), DIVH = the conditional probability of death inneonates with IVH, DRDS = the conditional probability of death in neonates with RDS, DisuIVH = the QALYloss from IVH and DisuRDS = the QALY loss from RDS.
By adopting the values in the NICE guideline model24 discussed below and summarised in Table 11,one may calculate the relevant incremental cost-effectiveness measures using the diagnostic test resultsreported by Gibson et al.67
These values result in an incremental cost per case of IVH avoided of £1,548,291, an incremental cost percase of RDS avoided of £466,622, an incremental cost per death avoided of £473,967 and an incrementalcost per QALY gained of £20,942 with the ‘no-test and treat-all’ strategy relative to fFN. These figures donot account for any negative effects of inappropriate use of steroids on the infant’s health, and, therefore,may be considered a lower bound estimate.
Gibson et al.67 found that variation of the threshold from 10 to 50 to 200 ng/ml resulted in the samenumber (two) of false-negative cases of women who delivered within 7 days of testing. In terms ofcost-effectiveness analysis, this finding means that qualitative testing using the 10 ng/ml and 50 ng/mlthresholds is dominated by testing at the 200 ng/ml threshold because the latter results in lower resourceuse for testing and hospital admissions than the lower threshold strategies. However, moving from the200 ng/ml to the 500 ng/ml threshold resulted in one additional missed preterm birth case.67 Comparingthe qfFN test with the 200 versus the 500 ng/ml threshold, the AG calculates incremental costs per eventavoided of £221,115, £770,000 and £235,714 for the RDS, IVH and death outcomes, respectively. Theincremental cost per QALY is £10,415. Therefore, at the £20,000 NICE cost-effectiveness threshold,the optimal, cost-effective diagnostic strategy is to use the qfFN with a threshold of 200 ng/ml.
TABLE 11 Model parameter values from the NICE guideline model24
Parameter Parameter definition Values Source
CACS Cost of full ACS course Included in cost ofhospital admission (CH)
NICE guideline 201524
CfFN Cost of fFN test £37.50 NICE guideline 201524
CH Cost of hospital admission £1050 NICE guideline 201524
fFN+ Marginal probability of positive fFN test result 0.18 Gibson et al.67
fFNF- Marginal probability of false-negative fFN test result 0.0082 Gibson et al.67
NNT Number needed to treat to avoid one inadequatelytreated case
28.5 Gibson et al.67
ARRDeath Absolute risk reduction of death from treatment 0.049 NICE guideline 201524
ARRRDS Absolute risk reduction of RDS from treatment 0.052 NICE guideline 201524
ARRIVH Absolute risk reduction of IVH from treatment 0.015 NICE guideline 201524
DRDS Death risk from RDS 0.054 NICE guideline 201524
DIVH Death risk from IVH 0.300 NICE guideline 201524
MaxQALY Maximum lifetime QALYs without RDS or IVH 22.44 NICE guideline 201524
DisuRDS QALY loss from RDS 3.85 NICE guideline 201524
DisuIVH QALY loss from IVH 4.5 NICE guideline 201524
DOI: 10.3310/hta23130 HEALTH TECHNOLOGY ASSESSMENT 2019 VOL. 23 NO. 13
© Queen’s Printer and Controller of HMSO 2019. This work was produced by Varley-Campbell et al. under the terms of a commissioning contract issued by the Secretary of Statefor Health and Social Care. This issue may be freely reproduced for the purposes of private research and study and extracts (or indeed, the full report) may be included inprofessional journals provided that suitable acknowledgement is made and the reproduction is not associated with any form of advertising. Applications for commercialreproduction should be addressed to: NIHR Journals Library, National Institute for Health Research, Evaluation, Trials and Studies Coordinating Centre, Alpha House, University ofSouthampton Science Park, Southampton SO16 7NS, UK.
57
It is evident from the small numbers of false-negative cases presented above that the findings from thestudy by Gibson et al.67 are highly uncertain. This also highlights the need for evidence synthesis overmultiple studies in order to derive meaningful evidence.
We highlight that the above formulae (equations 7–11) allow for a separate treatment of the costs of hospitaladmission and steroid treatment, in contrast to other models discussed below. This may be importantbecause diagnostic guidelines or protocols being used in some centres [e.g. Guy’s and St Thomas’ Hospital(London)] suggest that the fFN threshold concentrations used by clinicians in the obstetrics department todecide when to admit a patient may be different from those used by them for deciding when to administersteroids. Therefore, the cost of treatment (i.e. the sum of steroid costs, CACS, and hospital costs, CH) may varyacross different qfFN thresholds.
SummaryOne abstract was identified that investigated some measure of costs or cost-effectiveness of the interventionsof interest to this assessment. In this section, we have reviewed the abstract67 and corresponding dissertation68
that reported results in terms of the number needed to treat to achieve a desired neonatal outcome, and wehave shown how these data may be used in conjunction with the literature to derive useful information aboutthe cost-effectiveness of different thresholds for the qfFN test. We note that current treatment protocols insome hospitals may allow for the use of different qfFN thresholds to decide whether or not to administersteroids and admit to hospital.
Observational cost-minimisation studies
A set of studies was identified by one reviewer (RMM) in the systematic search of electronic bibliographicdatabases that investigated the health-care costs of the comparator in this review: qualitative fFN testingversus no test and treat all. These studies tended to date from 8 to 10 or more years ago and includeimplementation evaluations. Although they are not relevant to our main study question (i.e. the evidence onindex tests), these studies provide some background evidence on the role of operational factors in the costsand cost-effectiveness of interventions in routine practice. For details of these studies, see Appendix 4.
Model-based studies
We identified six different model structures presented in modelling studies of diagnostic interventions ofpreterm labour.70–75 We describe these models as presented in their most recent applications found in thepublished literature (Table 12). These are all decision tree models, which vary in four principal aspects. Thefirst is the type of study (cost-minimisation, cost-effectiveness and cost–utility analysis); the only cost–utilitymodel was that developed for the 2015 NICE guidelines24 by the Royal College of Obstetricians andGynaecologists (RCOG). The second aspect is the length of analytical horizon; some models measuredoutcomes until delivery, thus assuming no differences beyond that landmark between diagnosticstrategies, whereas other models assessed outcomes until neonatal death or hospital discharge or in onecase extrapolated neonatal outcomes to lifetime. The third aspect is the obstetrician’s compliance, withthe model assuming perfect compliance with the treatment protocol based on the diagnostic test results(i.e. all positive cases are treated and no negative cases are treated), as opposed to accounting for thebehavioural factors that reduce compliance with those protocols. The fourth characteristic is the treatmentbeing modelled. One model24 assumes that all positive cases are treated with tocolytics, whereas othermodels base their modelling of neonatal health outcomes on the use of steroids independently oftocolytic usage.
A detailed review of model-based studies can be found in Appendix 4. Here, we restrict discussion to asingle study, the 2015 NICE guidelines model,24 as this forms the basis for the independent economicassessment model we develop in Chapter 6.
SYSTEMATIC REVIEW OF EXISTING COST-EFFECTIVENESS EVIDENCE
NIHR Journals Library www.journalslibrary.nihr.ac.uk
58
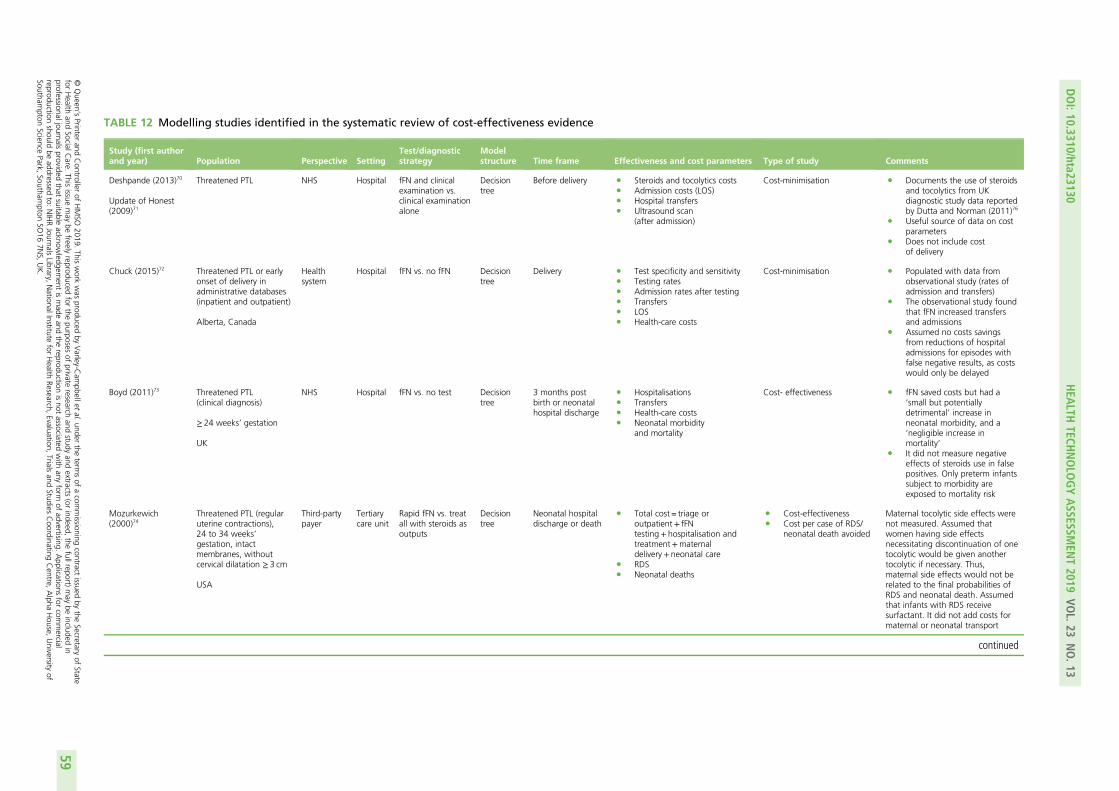
TABLE 12 Modelling studies identified in the systematic review of cost-effectiveness evidence
Study (first authorand year) Population Perspective Setting
Test/diagnosticstrategy
Modelstructure Time frame Effectiveness and cost parameters Type of study Comments
Deshpande (2013)70
Update of Honest(2009)71
Threatened PTL NHS Hospital fFN and clinicalexamination vs.clinical examinationalone
Decisiontree
Before delivery l Steroids and tocolytics costsl Admission costs (LOS)l Hospital transfersl Ultrasound scan
(after admission)
Cost-minimisation l Documents the use of steroidsand tocolytics from UKdiagnostic study data reportedby Dutta and Norman (2011)76
l Useful source of data on costparameters
l Does not include costof delivery
Chuck (2015)72 Threatened PTL or earlyonset of delivery inadministrative databases(inpatient and outpatient)
Alberta, Canada
Healthsystem
Hospital fFN vs. no fFN Decisiontree
Delivery l Test specificity and sensitivityl Testing ratesl Admission rates after testingl Transfersl LOSl Health-care costs
Cost-minimisation l Populated with data fromobservational study (rates ofadmission and transfers)
l The observational study foundthat fFN increased transfersand admissions
l Assumed no costs savingsfrom reductions of hospitaladmissions for episodes withfalse negative results, as costswould only be delayed
Boyd (2011)73 Threatened PTL(clinical diagnosis)
≥ 24 weeks’ gestation
UK
NHS Hospital fFN vs. no test Decisiontree
3 months postbirth or neonatalhospital discharge
l Hospitalisationsl Transfersl Health-care costsl Neonatal morbidity
and mortality
Cost- effectiveness l fFN saved costs but had a‘small but potentiallydetrimental’ increase inneonatal morbidity, and a‘negligible increase inmortality’
l It did not measure negativeeffects of steroids use in falsepositives. Only preterm infantssubject to morbidity areexposed to mortality risk
Mozurkewich(2000)74
Threatened PTL (regularuterine contractions),24 to 34 weeks’gestation, intactmembranes, withoutcervical dilatation ≥ 3 cm
USA
Third-partypayer
Tertiarycare unit
Rapid fFN vs. treatall with steroids asoutputs
Decisiontree
Neonatal hospitaldischarge or death
l Total cost = triage oroutpatient+ fFNtesting+ hospitalisation andtreatment+maternaldelivery+ neonatal care
l RDSl Neonatal deaths
l Cost-effectivenessl Cost per case of RDS/
neonatal death avoided
Maternal tocolytic side effects werenot measured. Assumed thatwomen having side effectsnecessitating discontinuation of onetocolytic would be given anothertocolytic if necessary. Thus,maternal side effects would not berelated to the final probabilities ofRDS and neonatal death. Assumedthat infants with RDS receivesurfactant. It did not add costs formaternal or neonatal transport
continued
DOI:10.3310/hta23130
HEA
LTHTECH
NOLO
GYASSESSM
ENT2019
VOL.23
NO.13
©Queen
’sPrinter
andController
ofHMSO
2019.This
work
was
producedby
Varley-C
ampbellet
al.under
theterm
sof
acom
missioning
contractissued
bythe
Secretaryof
Statefor
Health
andSocialC
are.This
issuemay
befreely
reproducedfor
thepurposes
ofprivate
researchand
studyand
extracts(or
indeed,the
fullreport)may
beincluded
inprofessionaljournals
providedthat
suitableacknow
ledgement
ismade
andthe
reproductionisnot
associatedwith
anyform
ofadvertising.
Applications
forcom
mercial
reproductionshould
beaddressed
to:NIHRJournals
Library,NationalInstitute
forHealth
Research,Evaluation,
Trialsand
StudiesCoordinating
Centre,
Alpha
House,
University
ofSoutham
ptonScience
Park,Southam
ptonSO
167N
S,UK.
59
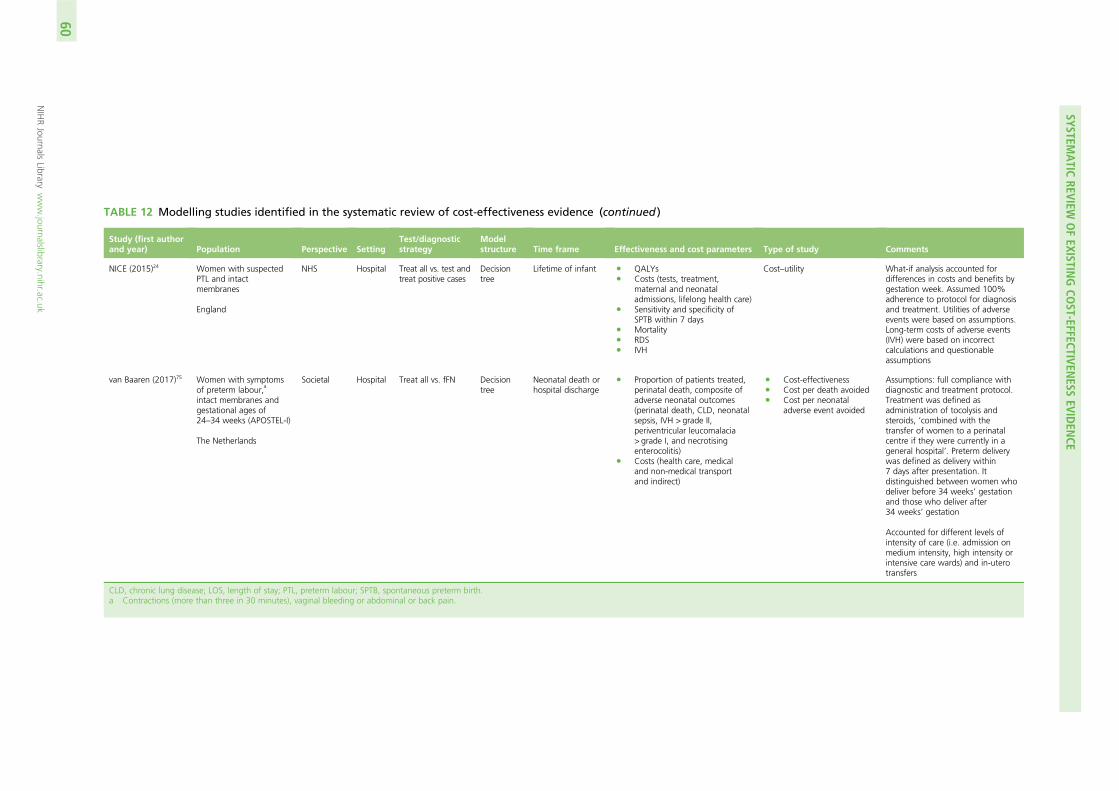
TABLE 12 Modelling studies identified in the systematic review of cost-effectiveness evidence (continued )
Study (first authorand year) Population Perspective Setting
Test/diagnosticstrategy
Modelstructure Time frame Effectiveness and cost parameters Type of study Comments
NICE (2015)24 Women with suspectedPTL and intactmembranes
England
NHS Hospital Treat all vs. test andtreat positive cases
Decisiontree
Lifetime of infant l QALYsl Costs (tests, treatment,
maternal and neonataladmissions, lifelong health care)
l Sensitivity and specificity ofSPTB within 7 days
l Mortalityl RDSl IVH
Cost–utility What-if analysis accounted fordifferences in costs and benefits bygestation week. Assumed 100%adherence to protocol for diagnosisand treatment. Utilities of adverseevents were based on assumptions.Long-term costs of adverse events(IVH) were based on incorrectcalculations and questionableassumptions
van Baaren (2017)75 Women with symptomsof preterm labour,
a
intact membranes andgestational ages of24–34 weeks (APOSTEL-I)
The Netherlands
Societal Hospital Treat all vs. fFN Decisiontree
Neonatal death orhospital discharge
l Proportion of patients treated,perinatal death, composite ofadverse neonatal outcomes(perinatal death, CLD, neonatalsepsis, IVH > grade II,periventricular leucomalacia> grade I, and necrotisingenterocolitis)
l Costs (health care, medicaland non-medical transportand indirect)
l Cost-effectivenessl Cost per death avoidedl Cost per neonatal
adverse event avoided
Assumptions: full compliance withdiagnostic and treatment protocol.Treatment was defined asadministration of tocolysis andsteroids, ‘combined with thetransfer of women to a perinatalcentre if they were currently in ageneral hospital’. Preterm deliverywas defined as delivery within7 days after presentation. Itdistinguished between women whodeliver before 34 weeks’ gestationand those who deliver after34 weeks’ gestation
Accounted for different levels ofintensity of care (i.e. admission onmedium intensity, high intensity orintensive care wards) and in-uterotransfers
CLD, chronic lung disease; LOS, length of stay; PTL, preterm labour; SPTB, spontaneous preterm birth.a Contractions (more than three in 30 minutes), vaginal bleeding or abdominal or back pain.
SYSTEMATIC
REVIEWOFEXISTIN
GCO
ST-EFFECTIVENESS
EVIDEN
CE
NIHRJournals
Librarywww.journalslibrary.nihr.ac.uk
60
The National Institute for Health and Care Excellence 2015 guidelines modelThe RCOG developed a decision-analytic model to inform the NICE 2015 guidelines24 on the diagnosis andtreatment of preterm labour and birth. The authors of this model concluded that the quality of the diagnosticaccuracy data was low for the different tests considered relevant at the time for women presenting withsymptoms of preterm labour (cervical length measurement by ultrasound scan, Actim Partus, qualitative fFN).Consequently, they presented a ‘what-if’ analysis comparing the testing versus the no testing and treat-allstrategies, which consisted of identifying the levels of specificity and sensitivity at which a hypothetical testbecame cost-effective in accordance with the NICE cost-effectiveness threshold of £20,000 per QALY gained.
Unlike previous analyses, the NICE evaluation accounted for the effect of gestational age on the trade-offbetween sensitivity and specificity (i.e. costs of treating more patients unnecessarily versus missing patientsat high risk of neonatal adverse events, including death). This analysis set the cost of the test equal to thatof cervical length measurement, and found that testing was not cost-effective at gestations of < 30 weeks.This served as the basis of the NICE recommendations about the use of testing to rule out preterm labour.
The NICE guidelines model structure is illustrated in Figure 7. In accordance with this model, the causalpathway from diagnostic results to neonatal outcomes is mediated by tocolysis treatment, which can delaypremature delivery by ≥ 48 hours. This would generate a window of opportunity for appropriate steroidadministration (i.e. ≥ 24 hours and up to 7 days before delivery) and transfer to a tertiary hospital, thusreducing the risk of RDS, IVH, and death. The risk reduction parameter values used in this model are basedon treatment effect estimates for calcium channel blockers versus placebo, from three separate networkmeta-analyses of RCTs (one per model outcome) (NICE 2015).24 It is worth noting that two of thesetreatment effect parameters, the odds ratio (OR) for death, 0.62 (95% CI 0.21 to 1.80), and the OR forRDS, 0.81 (95% CI 0.50 to 1.34), are imprecisely estimated. The estimated OR for IVH was 0.40 (95% CI0.21 to 0.74). None of these estimates used data from a direct head-to-head RCT. Furthermore, thesetreatment effects were assumed to be constant across the gestation in the model (24 to 34 weeks), so thatthe absolute risk reduction (ARR = relative risk × baseline risk) for the three types of event with tocolysisvaries by gestation only because the baseline (i.e. without tocolysis) risk declines with gestational age(Figure 8 and see Table 11). IVH and RDS each contribute to the risk of neonatal mortality; the probabilityof death is 0.300 conditional on the former and 0.054 conditional on the latter. Infants who did notdie following these adverse events would contribute additional costs and QALY losses over theirexpected lifetime.
The analysis projected lifelong QALY values based on the neonatal adverse events. Infants who survivedthe neonatal phase and were discharged home were assumed to have average expected QALYs thatvaried with gestational age from 19.92 at 24 weeks to 22.61 at 34 weeks. These were calculated as thegestational age-specific proportion of infants surviving the first year of life multiplied by the expectedQALYs of these infants, which, in turn, was equal to the life expectancy in England and Wales of 80 yearsvalued at the population norm health-state utility of 0.82 and discounted at an annual rate of 3.5%.77
Deaths in the first year of life were assumed to generate zero QALYs. In the event of RDS, an average QALYloss would apply, arbitrarily set at 3.85 (based on RDS providing a slightly lower QALY loss than IVH).The occurrence of IVH incurred an average QALY loss of 4.5, based on the assumption that the IVH wouldincur the same quality-of-life loss as intracranial haemorrhage (ICH), which, in turn, was assumed to incurone-third of the QALY loss of the cerebral palsy value reported by Cahill et al.78
The analysis accounted for the costs of tests, including test acquisition and staff time, drug treatment[nifedipine at a loading dose of 40 mg and subsequent dose of 240 mg, at British National Formulary (BNF)prices of £0.008 per 1 mg, from a 90-capsule pack of 10 mg] and administration (5 minutes of doctor and5 minutes of nurse time) and downstream neonatal hospital costs of adverse events (RDS and IVH). Thedownstream RDS costs were set at the NHS Reference Costs of neonatal intensive care unit (NICU) care[British Association of Perinatal Medicine (BAPM) level 1] with extracorporeal life support/extracorporeal
DOI: 10.3310/hta23130 HEALTH TECHNOLOGY ASSESSMENT 2019 VOL. 23 NO. 13
© Queen’s Printer and Controller of HMSO 2019. This work was produced by Varley-Campbell et al. under the terms of a commissioning contract issued by the Secretary of Statefor Health and Social Care. This issue may be freely reproduced for the purposes of private research and study and extracts (or indeed, the full report) may be included inprofessional journals provided that suitable acknowledgement is made and the reproduction is not associated with any form of advertising. Applications for commercialreproduction should be addressed to: NIHR Journals Library, National Institute for Health Research, Evaluation, Trials and Studies Coordinating Centre, Alpha House, University ofSouthampton Science Park, Southampton SO16 7NS, UK.
61
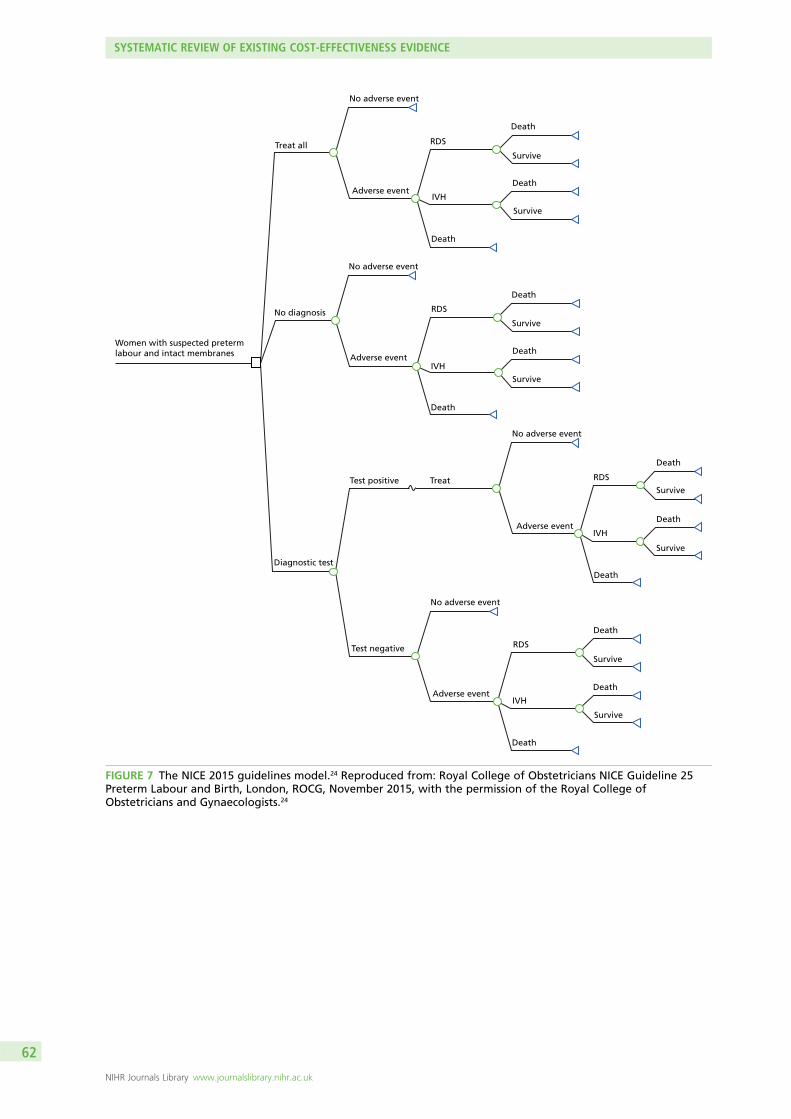
Women with suspected pretermlabour and intact membranes
Treat all
No diagnosis
Diagnostic test
Test positive
Test negative
No adverse event
No adverse event
Adverse event
Adverse event
Treat
No adverse event
No adverse event
Adverse event
Adverse event
Death
Death
Death
Death
Death
Death
Death
Death
Death
Death
Death
Survive
Survive
Survive
Survive
Survive
Survive
Survive
Survive
Death
RDS
IVH
IVH
IVH
IVH
RDS
RDS
RDS
FIGURE 7 The NICE 2015 guidelines model.24 Reproduced from: Royal College of Obstetricians NICE Guideline 25Preterm Labour and Birth, London, ROCG, November 2015, with the permission of the Royal College ofObstetricians and Gynaecologists.24
SYSTEMATIC REVIEW OF EXISTING COST-EFFECTIVENESS EVIDENCE
NIHR Journals Library www.journalslibrary.nihr.ac.uk
62
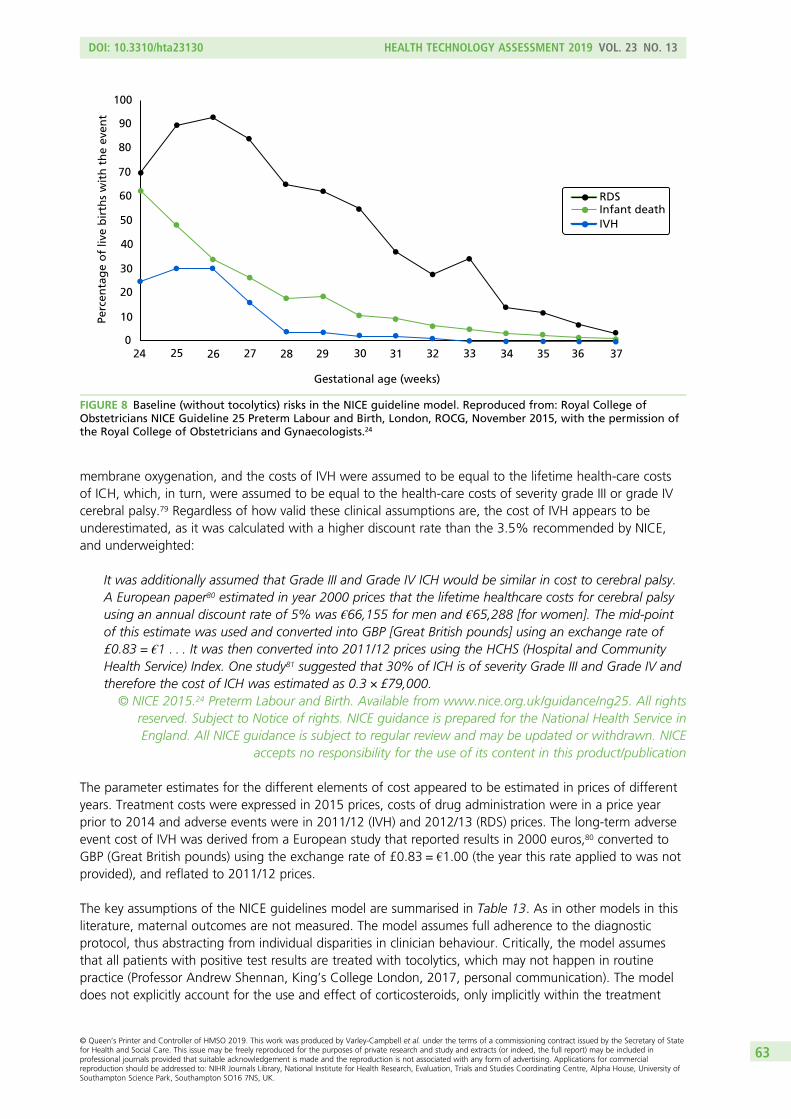
membrane oxygenation, and the costs of IVH were assumed to be equal to the lifetime health-care costsof ICH, which, in turn, were assumed to be equal to the health-care costs of severity grade III or grade IVcerebral palsy.79 Regardless of how valid these clinical assumptions are, the cost of IVH appears to beunderestimated, as it was calculated with a higher discount rate than the 3.5% recommended by NICE,and underweighted:
It was additionally assumed that Grade III and Grade IV ICH would be similar in cost to cerebral palsy.A European paper80 estimated in year 2000 prices that the lifetime healthcare costs for cerebral palsyusing an annual discount rate of 5% was €66,155 for men and €65,288 [for women]. The mid-pointof this estimate was used and converted into GBP [Great British pounds] using an exchange rate of£0.83 = €1 . . . It was then converted into 2011/12 prices using the HCHS (Hospital and CommunityHealth Service) Index. One study81 suggested that 30% of ICH is of severity Grade III and Grade IV andtherefore the cost of ICH was estimated as 0.3 × £79,000.
© NICE 2015.24 Preterm Labour and Birth. Available from www.nice.org.uk/guidance/ng25. All rightsreserved. Subject to Notice of rights. NICE guidance is prepared for the National Health Service inEngland. All NICE guidance is subject to regular review and may be updated or withdrawn. NICE
accepts no responsibility for the use of its content in this product/publication
The parameter estimates for the different elements of cost appeared to be estimated in prices of differentyears. Treatment costs were expressed in 2015 prices, costs of drug administration were in a price yearprior to 2014 and adverse events were in 2011/12 (IVH) and 2012/13 (RDS) prices. The long-term adverseevent cost of IVH was derived from a European study that reported results in 2000 euros,80 converted toGBP (Great British pounds) using the exchange rate of £0.83 = €1.00 (the year this rate applied to was notprovided), and reflated to 2011/12 prices.
The key assumptions of the NICE guidelines model are summarised in Table 13. As in other models in thisliterature, maternal outcomes are not measured. The model assumes full adherence to the diagnosticprotocol, thus abstracting from individual disparities in clinician behaviour. Critically, the model assumesthat all patients with positive test results are treated with tocolytics, which may not happen in routinepractice (Professor Andrew Shennan, King’s College London, 2017, personal communication). The modeldoes not explicitly account for the use and effect of corticosteroids, only implicitly within the treatment
Gestational age (weeks)
100
90
80
70
60
50
40
30
20
10
024 25 26 27 28 29 30 31 32 33 34 35 36 37
Infant deathRDS
IVH
Perc
enta
ge
of
live
bir
ths
wit
h t
he
even
t
FIGURE 8 Baseline (without tocolytics) risks in the NICE guideline model. Reproduced from: Royal College ofObstetricians NICE Guideline 25 Preterm Labour and Birth, London, ROCG, November 2015, with the permission ofthe Royal College of Obstetricians and Gynaecologists.24
DOI: 10.3310/hta23130 HEALTH TECHNOLOGY ASSESSMENT 2019 VOL. 23 NO. 13
© Queen’s Printer and Controller of HMSO 2019. This work was produced by Varley-Campbell et al. under the terms of a commissioning contract issued by the Secretary of Statefor Health and Social Care. This issue may be freely reproduced for the purposes of private research and study and extracts (or indeed, the full report) may be included inprofessional journals provided that suitable acknowledgement is made and the reproduction is not associated with any form of advertising. Applications for commercialreproduction should be addressed to: NIHR Journals Library, National Institute for Health Research, Evaluation, Trials and Studies Coordinating Centre, Alpha House, University ofSouthampton Science Park, Southampton SO16 7NS, UK.
63

effect estimates obtained from the network meta-analysis of tocolysis studies discussed previously in thissection. This feature makes the model less suitable for obtaining generalisable results for situations inwhich the corticosteroids are used without tocolytic therapies. A major limitation of the analysis is the highdegree of uncertainty associated with the calculation of costs and QALYs, which were extrapolated tolifetime values from neonatal morbidity outcomes. Thus, this model’s advantage in terms of producingresults in terms of QALYs for informing NICE decisions may have come at the cost of heroic assumptions
TABLE 13 Key assumptions in the NICE 2015 guidelines model24
Assumption Description Critique
The choice of diagnostic strategy hasno clinically and economicallysignificant effect on the mother
The clinical outcomes, costs andQALYs associated with the mother arenot measured
Implicit is the view that the outcomesof the mother are either irrelevant forthe policy-maker’s decision on how todiagnose preterm labour
Full adherence to the diagnosticprotocol
All individuals testing positive areadmitted to hospital and giventreatment
Audit data from England found that7% of patients testing fFN positivewere not admitted and 32% testingfFN negative were admitted (HealthcareCommission, 2008,82 and Hogg, Penneyand Carmichael, 200783)
The effects of diagnostic testing onneonatal outcomes are mediatedthrough treatment with tocolytics
All individuals are treated withtocolytics
Tocolytics is now being usedinfrequently (Professor AndrewShennan, King’s College London, 2017,personal communication)
Steroid use is not explicitly modelledbut implicit in the tocolytic treatmenteffect values estimated from theliterature
Tocolytics may be given to postponedelivery for at least 48 hours to(1) allow in-utero transfers and/or(2) treat with steroids
Some protocols on the use of qfFN(e.g. London’s Guy’s and St Thomas’NHS Foundation Trust) provide differentguidelines for the decision to admit andthe decision to treat with tocolytics andto treat with steroids
The relative effect of tocolytics areconstant across gestational ages
Tocolysis reduces the risk of adverseneonatal outcomes, including death,at a constant proportion acrossgestational ages
This is an untested assumption drivenby the available data
Neonatal morbidity outcomes aremeasured in terms of RDS and IVH
RDS and IVH are two of the keyoutcomes reported in the evaluationliterature on tocolytics treatment
The network meta-analysis evidence usedto populate the model parameters forthe treatment effects on these outcomesis based entirely on indirect comparisons,and the treatment effect estimates areconsistent with no effect (i.e 95%. ORcredible intervals cross the value of 1)
Neonatal mortality may occur throughthe risk of death associated with RDSor IVH or background risks thatdecline with gestational age
The effect of tocolysis on neonatalmortality is divided between anindirect effect, operated through itseffect on RDS and IVH, and a directeffect through other causes
The network meta-analysis evidence usedto populate the model parameters for thetreatment effects on this outcome wasbased on no head-to-head data for thecomparison of tocolysis vs. no treatment,and the treatment effect estimate isconsistent with no effect (i.e. 95% ORcredible interval crosses the value of 1)
The expected lifetime quality of life ofinfants who survive the first year afterbirth without RDS or IVH is the samefor full-term and preterm infants
Conditional on surviving the firstyear of life and neonatal morbidityoutcomes, lifetime QALYs areindependent of gestational age atbirth
This assumption is questionable in thelight of evidence of long-term healthand behavioural problems associatedwith preterm birth
The expected lifetime costs forpreterm and full-term infants whosurvive the first year without IVH arethe same
Conditional on surviving the first yearof life and IVH occurrence, lifetimecosts are independent of gestationalage at birth
This assumption is questionable in thelight of evidence of long-term healthproblems associated with preterm birth
SYSTEMATIC REVIEW OF EXISTING COST-EFFECTIVENESS EVIDENCE
NIHR Journals Library www.journalslibrary.nihr.ac.uk
64
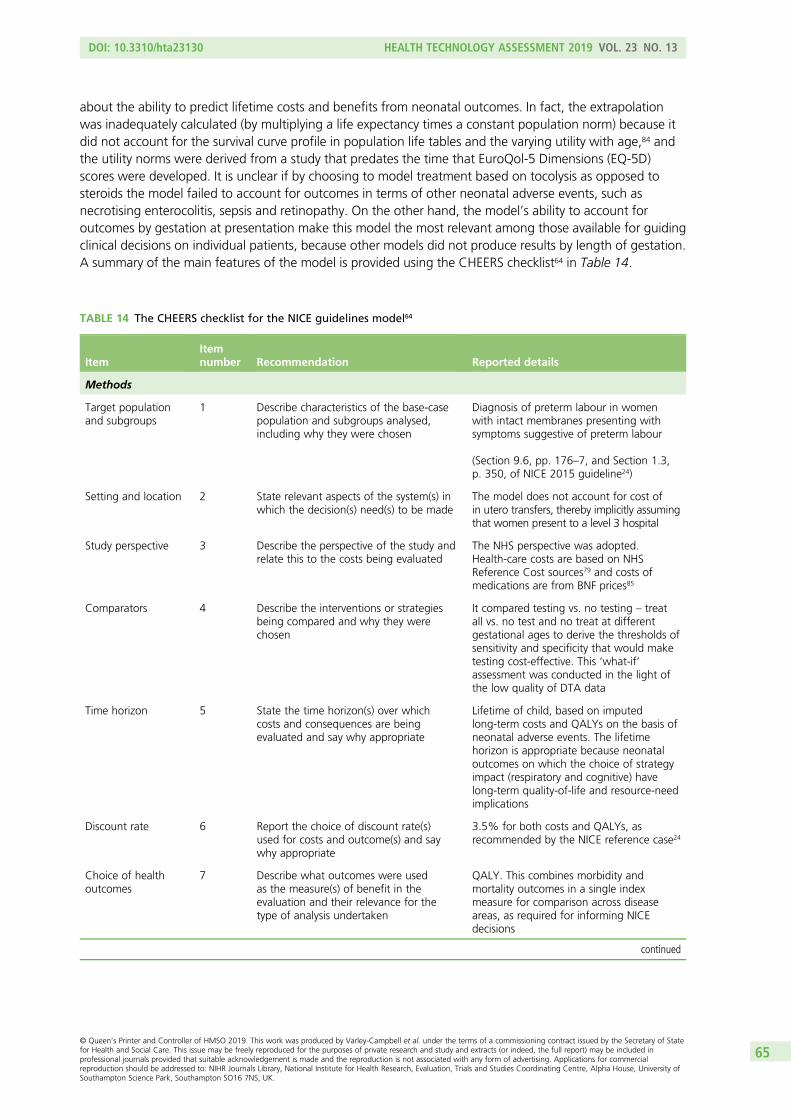
about the ability to predict lifetime costs and benefits from neonatal outcomes. In fact, the extrapolationwas inadequately calculated (by multiplying a life expectancy times a constant population norm) because itdid not account for the survival curve profile in population life tables and the varying utility with age,84 andthe utility norms were derived from a study that predates the time that EuroQol-5 Dimensions (EQ-5D)scores were developed. It is unclear if by choosing to model treatment based on tocolysis as opposed tosteroids the model failed to account for outcomes in terms of other neonatal adverse events, such asnecrotising enterocolitis, sepsis and retinopathy. On the other hand, the model’s ability to account foroutcomes by gestation at presentation make this model the most relevant among those available for guidingclinical decisions on individual patients, because other models did not produce results by length of gestation.A summary of the main features of the model is provided using the CHEERS checklist64 in Table 14.
TABLE 14 The CHEERS checklist for the NICE guidelines model64
ItemItemnumber Recommendation Reported details
Methods
Target populationand subgroups
1 Describe characteristics of the base-casepopulation and subgroups analysed,including why they were chosen
Diagnosis of preterm labour in womenwith intact membranes presenting withsymptoms suggestive of preterm labour
(Section 9.6, pp. 176–7, and Section 1.3,p. 350, of NICE 2015 guideline24)
Setting and location 2 State relevant aspects of the system(s) inwhich the decision(s) need(s) to be made
The model does not account for cost ofin utero transfers, thereby implicitly assumingthat women present to a level 3 hospital
Study perspective 3 Describe the perspective of the study andrelate this to the costs being evaluated
The NHS perspective was adopted.Health-care costs are based on NHSReference Cost sources79 and costs ofmedications are from BNF prices85
Comparators 4 Describe the interventions or strategiesbeing compared and why they werechosen
It compared testing vs. no testing – treatall vs. no test and no treat at differentgestational ages to derive the thresholds ofsensitivity and specificity that would maketesting cost-effective. This ‘what-if’assessment was conducted in the light ofthe low quality of DTA data
Time horizon 5 State the time horizon(s) over whichcosts and consequences are beingevaluated and say why appropriate
Lifetime of child, based on imputedlong-term costs and QALYs on the basis ofneonatal adverse events. The lifetimehorizon is appropriate because neonataloutcomes on which the choice of strategyimpact (respiratory and cognitive) havelong-term quality-of-life and resource-needimplications
Discount rate 6 Report the choice of discount rate(s)used for costs and outcome(s) and saywhy appropriate
3.5% for both costs and QALYs, asrecommended by the NICE reference case24
Choice of healthoutcomes
7 Describe what outcomes were usedas the measure(s) of benefit in theevaluation and their relevance for thetype of analysis undertaken
QALY. This combines morbidity andmortality outcomes in a single indexmeasure for comparison across diseaseareas, as required for informing NICEdecisions
continued
DOI: 10.3310/hta23130 HEALTH TECHNOLOGY ASSESSMENT 2019 VOL. 23 NO. 13
© Queen’s Printer and Controller of HMSO 2019. This work was produced by Varley-Campbell et al. under the terms of a commissioning contract issued by the Secretary of Statefor Health and Social Care. This issue may be freely reproduced for the purposes of private research and study and extracts (or indeed, the full report) may be included inprofessional journals provided that suitable acknowledgement is made and the reproduction is not associated with any form of advertising. Applications for commercialreproduction should be addressed to: NIHR Journals Library, National Institute for Health Research, Evaluation, Trials and Studies Coordinating Centre, Alpha House, University ofSouthampton Science Park, Southampton SO16 7NS, UK.
65
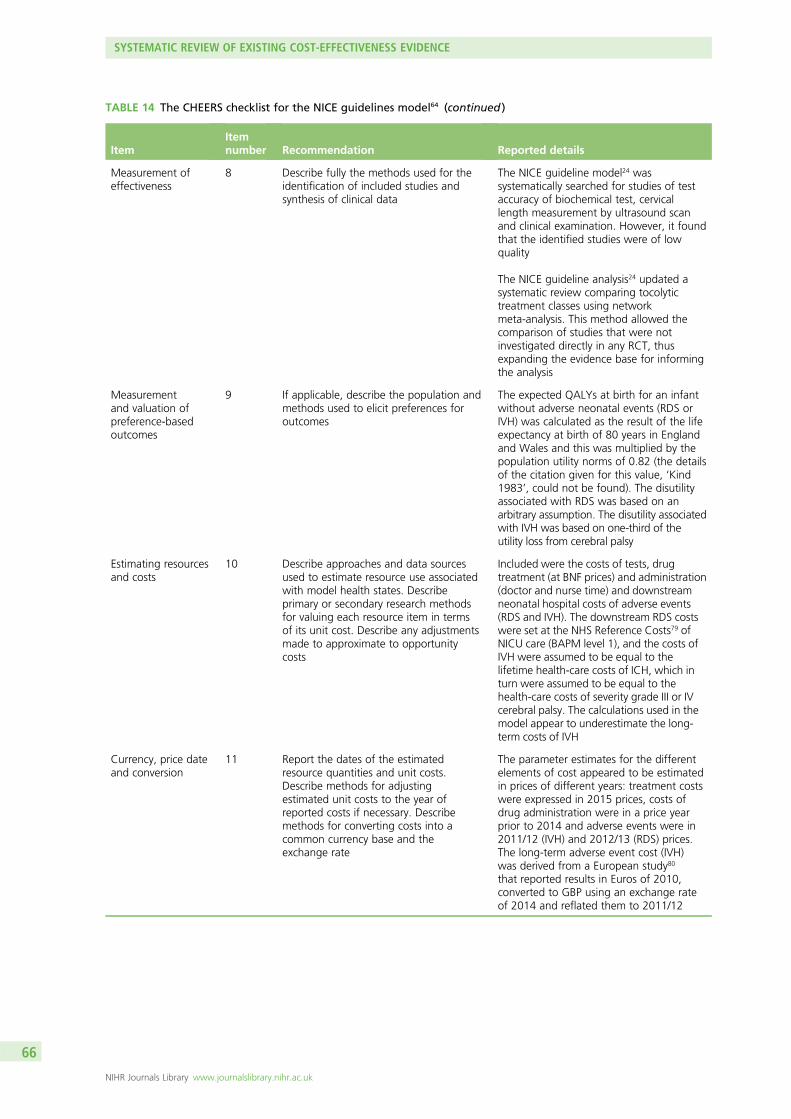
TABLE 14 The CHEERS checklist for the NICE guidelines model64 (continued )
ItemItemnumber Recommendation Reported details
Measurement ofeffectiveness
8 Describe fully the methods used for theidentification of included studies andsynthesis of clinical data
The NICE guideline model24 wassystematically searched for studies of testaccuracy of biochemical test, cervicallength measurement by ultrasound scanand clinical examination. However, it foundthat the identified studies were of lowquality
The NICE guideline analysis24 updated asystematic review comparing tocolytictreatment classes using networkmeta-analysis. This method allowed thecomparison of studies that were notinvestigated directly in any RCT, thusexpanding the evidence base for informingthe analysis
Measurementand valuation ofpreference-basedoutcomes
9 If applicable, describe the population andmethods used to elicit preferences foroutcomes
The expected QALYs at birth for an infantwithout adverse neonatal events (RDS orIVH) was calculated as the result of the lifeexpectancy at birth of 80 years in Englandand Wales and this was multiplied by thepopulation utility norms of 0.82 (the detailsof the citation given for this value, ‘Kind1983’, could not be found). The disutilityassociated with RDS was based on anarbitrary assumption. The disutility associatedwith IVH was based on one-third of theutility loss from cerebral palsy
Estimating resourcesand costs
10 Describe approaches and data sourcesused to estimate resource use associatedwith model health states. Describeprimary or secondary research methodsfor valuing each resource item in termsof its unit cost. Describe any adjustmentsmade to approximate to opportunitycosts
Included were the costs of tests, drugtreatment (at BNF prices) and administration(doctor and nurse time) and downstreamneonatal hospital costs of adverse events(RDS and IVH). The downstream RDS costswere set at the NHS Reference Costs79 ofNICU care (BAPM level 1), and the costs ofIVH were assumed to be equal to thelifetime health-care costs of ICH, which inturn were assumed to be equal to thehealth-care costs of severity grade III or IVcerebral palsy. The calculations used in themodel appear to underestimate the long-term costs of IVH
Currency, price dateand conversion
11 Report the dates of the estimatedresource quantities and unit costs.Describe methods for adjustingestimated unit costs to the year ofreported costs if necessary. Describemethods for converting costs into acommon currency base and theexchange rate
The parameter estimates for the differentelements of cost appeared to be estimatedin prices of different years: treatment costswere expressed in 2015 prices, costs ofdrug administration were in a price yearprior to 2014 and adverse events were in2011/12 (IVH) and 2012/13 (RDS) prices.The long-term adverse event cost (IVH)was derived from a European study80
that reported results in Euros of 2010,converted to GBP using an exchange rateof 2014 and reflated them to 2011/12
SYSTEMATIC REVIEW OF EXISTING COST-EFFECTIVENESS EVIDENCE
NIHR Journals Library www.journalslibrary.nihr.ac.uk
66
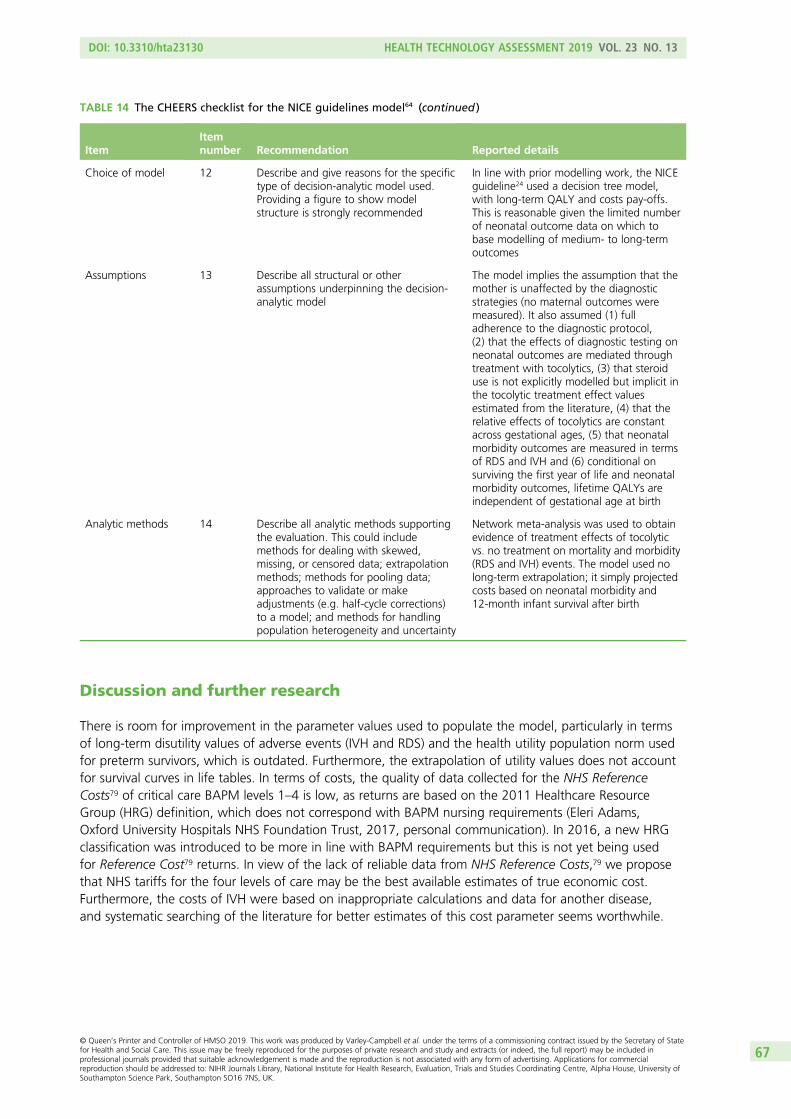
Discussion and further research
There is room for improvement in the parameter values used to populate the model, particularly in termsof long-term disutility values of adverse events (IVH and RDS) and the health utility population norm usedfor preterm survivors, which is outdated. Furthermore, the extrapolation of utility values does not accountfor survival curves in life tables. In terms of costs, the quality of data collected for the NHS ReferenceCosts79 of critical care BAPM levels 1–4 is low, as returns are based on the 2011 Healthcare ResourceGroup (HRG) definition, which does not correspond with BAPM nursing requirements (Eleri Adams,Oxford University Hospitals NHS Foundation Trust, 2017, personal communication). In 2016, a new HRGclassification was introduced to be more in line with BAPM requirements but this is not yet being usedfor Reference Cost79 returns. In view of the lack of reliable data from NHS Reference Costs,79 we proposethat NHS tariffs for the four levels of care may be the best available estimates of true economic cost.Furthermore, the costs of IVH were based on inappropriate calculations and data for another disease,and systematic searching of the literature for better estimates of this cost parameter seems worthwhile.
TABLE 14 The CHEERS checklist for the NICE guidelines model64 (continued )
ItemItemnumber Recommendation Reported details
Choice of model 12 Describe and give reasons for the specifictype of decision-analytic model used.Providing a figure to show modelstructure is strongly recommended
In line with prior modelling work, the NICEguideline24 used a decision tree model,with long-term QALY and costs pay-offs.This is reasonable given the limited numberof neonatal outcome data on which tobase modelling of medium- to long-termoutcomes
Assumptions 13 Describe all structural or otherassumptions underpinning the decision-analytic model
The model implies the assumption that themother is unaffected by the diagnosticstrategies (no maternal outcomes weremeasured). It also assumed (1) fulladherence to the diagnostic protocol,(2) that the effects of diagnostic testing onneonatal outcomes are mediated throughtreatment with tocolytics, (3) that steroiduse is not explicitly modelled but implicit inthe tocolytic treatment effect valuesestimated from the literature, (4) that therelative effects of tocolytics are constantacross gestational ages, (5) that neonatalmorbidity outcomes are measured in termsof RDS and IVH and (6) conditional onsurviving the first year of life and neonatalmorbidity outcomes, lifetime QALYs areindependent of gestational age at birth
Analytic methods 14 Describe all analytic methods supportingthe evaluation. This could includemethods for dealing with skewed,missing, or censored data; extrapolationmethods; methods for pooling data;approaches to validate or makeadjustments (e.g. half-cycle corrections)to a model; and methods for handlingpopulation heterogeneity and uncertainty
Network meta-analysis was used to obtainevidence of treatment effects of tocolyticvs. no treatment on mortality and morbidity(RDS and IVH) events. The model used nolong-term extrapolation; it simply projectedcosts based on neonatal morbidity and12-month infant survival after birth
DOI: 10.3310/hta23130 HEALTH TECHNOLOGY ASSESSMENT 2019 VOL. 23 NO. 13
© Queen’s Printer and Controller of HMSO 2019. This work was produced by Varley-Campbell et al. under the terms of a commissioning contract issued by the Secretary of Statefor Health and Social Care. This issue may be freely reproduced for the purposes of private research and study and extracts (or indeed, the full report) may be included inprofessional journals provided that suitable acknowledgement is made and the reproduction is not associated with any form of advertising. Applications for commercialreproduction should be addressed to: NIHR Journals Library, National Institute for Health Research, Evaluation, Trials and Studies Coordinating Centre, Alpha House, University ofSouthampton Science Park, Southampton SO16 7NS, UK.
67

Other areas of uncertainty that deserve to be explored include:
l the mortality benefits of reducing the rate of false-negative cases for patients, who, depending on thenature of the local hospital (i.e. a level 2/3 vs. a level 1 hospital), may be at increased risk of mortality ifbirth takes place before 32 weeks’ gestation86
l accounting for differences in treatment costs of positive cases in accordance with the level of hospitalof presentation, owing to the costs of in utero transfers for very preterm pregnancies as well as theirrepatriation to the local hospital after neonatal stabilisation
l accounting for compliance with the treatment protocol subsequent to diagnostic test findings.
In Chapter 6, we undertake these revisions to the NICE guideline model and populate them with the DTAevidence from the systematic review in Chapter 2.
SYSTEMATIC REVIEW OF EXISTING COST-EFFECTIVENESS EVIDENCE
NIHR Journals Library www.journalslibrary.nihr.ac.uk
68

Chapter 6 Independent economic assessment
Methods
This chapter presents a de novo evaluation of PartoSure, Actim Partus and fFN at thresholds other than50 ng/ml, relative to fFN at 50 ng/ml as the comparator.
Model structureIn common with all previous studies (see Chapter 5), we used a decision tree to model the economicevaluation of the diagnostic choice problem. As in the model supporting the 2015 NICE guidelines ondiagnosis and treatment of preterm labour,24 the only case that included both of these aspects of patientmanagement, our model includes an initial diagnostic phase followed by treatment and long-termoutcomes. Although our protocol stated the plan to use a decision tree model for the diagnostic phaseand another decision tree for the treatment phase, the available data did not allow us to populate thedecision tree for the treatment phase. Therefore, our model is a decision tree with lifetime costs and QALYpay-offs. The model accounts for the costs incurred starting from the time women present to a maternityhospital with symptoms suggestive of preterm labour, through hospital admission or discharge home, toneonatal discharge or death in hospital. The health consequences to the offspring are measured in termsof QALYs based on neonatal morbidity and mortality outcomes. The main features of our model arethat it:
l accounts for the costs and QALYs of the infant (as well as QALYs for the mother, in a scenario analysis)l differentiates costs and benefits by gestational agel distinguishes between hospital levels of designation – level 3 hospitals have NICUs providing all types
of care to the local population and care for the most severe infants transferred in utero or after birth,level 2 hospitals or local neonatal units provide all types of neonatal care except long-term intensivecare and care for complex cases and level 1 hospitals provide specialised care for their local population,stabilisation and non-invasive monitoring
l accounts for the costs and benefits of steroids and the costs of tocolysis and hospital transfer forneonatal transfers
l determines long-term QALYs and costs by neonatal morbidity (RDS and IVH) and mortality outcomes.
The model builds on that used to inform the NICE 2015 guidelines24 on the diagnosis and treatment ofpreterm labour, as the only prior model allowing for variation in health risks, and thus costs and benefits,of inaccurate diagnosis by gestational age. By adopting this general structure, we are able to account forthe increasing neonatal health risks posed by an attending obstetrician’s failure to identify a woman inpreterm labour earlier in gestation. Unlike the NICE model, which assumed that the diagnosis of pretermlabour was intended to guide the decision of whether or not to administer tocolysis, we model thetreatment pathway following a diagnosis of preterm labour around the decision of whether or not totreat with corticosteroids and/or admit to hospital or discharge home. This methodological variation inour approach is motivated and informed by the very recent evidence quantifying the positive effects ofantenatal corticosteroid (ACS) administration for accelerating the maturation of the fetus’s lungs as afunction of the time of administration relative to delivery, the limited use of tocolysis reported in theliterature and the emerging consensus on its potential risks to the infant and side-effects to themother.30,33,34,87 For example, audit data for the period from September 2016 to May 2017 from the level 2hospital in Exeter show that tocolysis was administered in only one out of nine patients (11%) presentingwith symptoms of preterm labour at 24–34 weeks with fFN of ≥ 50 ng/ml. In our analysis, we assume thattocolysis is used only for all in utero transfers at gestational ages of < 28 weeks (see Results).
DOI: 10.3310/hta23130 HEALTH TECHNOLOGY ASSESSMENT 2019 VOL. 23 NO. 13
© Queen’s Printer and Controller of HMSO 2019. This work was produced by Varley-Campbell et al. under the terms of a commissioning contract issued by the Secretary of Statefor Health and Social Care. This issue may be freely reproduced for the purposes of private research and study and extracts (or indeed, the full report) may be included inprofessional journals provided that suitable acknowledgement is made and the reproduction is not associated with any form of advertising. Applications for commercialreproduction should be addressed to: NIHR Journals Library, National Institute for Health Research, Evaluation, Trials and Studies Coordinating Centre, Alpha House, University ofSouthampton Science Park, Southampton SO16 7NS, UK.
69
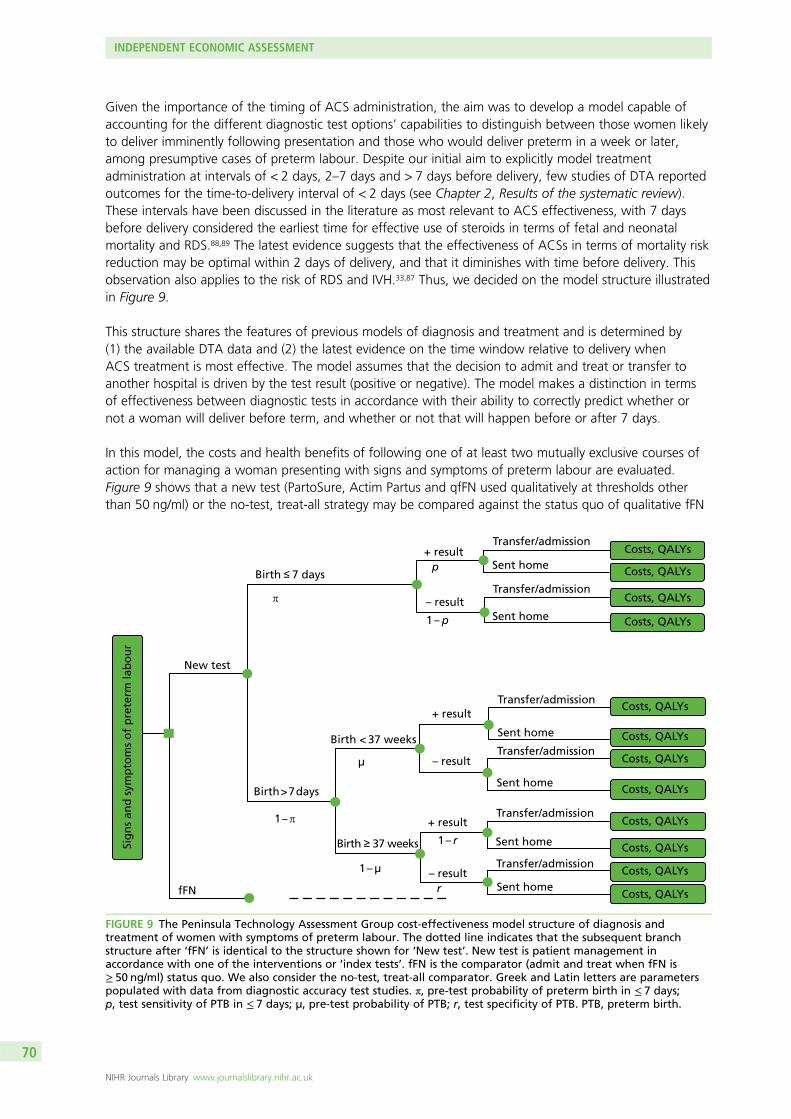
Given the importance of the timing of ACS administration, the aim was to develop a model capable ofaccounting for the different diagnostic test options’ capabilities to distinguish between those women likelyto deliver imminently following presentation and those who would deliver preterm in a week or later,among presumptive cases of preterm labour. Despite our initial aim to explicitly model treatmentadministration at intervals of < 2 days, 2–7 days and > 7 days before delivery, few studies of DTA reportedoutcomes for the time-to-delivery interval of < 2 days (see Chapter 2, Results of the systematic review).These intervals have been discussed in the literature as most relevant to ACS effectiveness, with 7 daysbefore delivery considered the earliest time for effective use of steroids in terms of fetal and neonatalmortality and RDS.88,89 The latest evidence suggests that the effectiveness of ACSs in terms of mortality riskreduction may be optimal within 2 days of delivery, and that it diminishes with time before delivery. Thisobservation also applies to the risk of RDS and IVH.33,87 Thus, we decided on the model structure illustratedin Figure 9.
This structure shares the features of previous models of diagnosis and treatment and is determined by(1) the available DTA data and (2) the latest evidence on the time window relative to delivery whenACS treatment is most effective. The model assumes that the decision to admit and treat or transfer toanother hospital is driven by the test result (positive or negative). The model makes a distinction in termsof effectiveness between diagnostic tests in accordance with their ability to correctly predict whether ornot a woman will deliver before term, and whether or not that will happen before or after 7 days.
In this model, the costs and health benefits of following one of at least two mutually exclusive courses ofaction for managing a woman presenting with signs and symptoms of preterm labour are evaluated.Figure 9 shows that a new test (PartoSure, Actim Partus and qfFN used qualitatively at thresholds otherthan 50 ng/ml) or the no-test, treat-all strategy may be compared against the status quo of qualitative fFN
Sig
ns
and
sym
pto
ms
of
pre
term
lab
ou
r
New test
Birth ≤ 7 days
Birth ≥ 37 weeks
Birth < 37 weeks
Birth > 7 days
π
+ result
– result
+ result
– result
+ result
– result
Transfer/admission
Transfer/admission
Sent home
Transfer/admission
Transfer/admission
Transfer/admission
Transfer/admission
Sent home
Sent home
Sent home
Sent home
Sent home
p
1 – p
µ
1 – µ
1 – π
1 – r
rfFN
Costs, QALYs
Costs, QALYs
Costs, QALYs
Costs, QALYs
Costs, QALYs
Costs, QALYs
Costs, QALYs
Costs, QALYs
Costs, QALYs
Costs, QALYs
Costs, QALYs
Costs, QALYs
FIGURE 9 The Peninsula Technology Assessment Group cost-effectiveness model structure of diagnosis andtreatment of women with symptoms of preterm labour. The dotted line indicates that the subsequent branchstructure after ‘fFN’ is identical to the structure shown for ‘New test’. New test is patient management inaccordance with one of the interventions or ‘index tests’. fFN is the comparator (admit and treat when fFN is≥ 50 ng/ml) status quo. We also consider the no-test, treat-all comparator. Greek and Latin letters are parameterspopulated with data from diagnostic accuracy test studies. π, pre-test probability of preterm birth in ≤ 7 days;p, test sensitivity of PTB in ≤ 7 days; µ, pre-test probability of PTB; r, test specificity of PTB. PTB, preterm birth.
INDEPENDENT ECONOMIC ASSESSMENT
NIHR Journals Library www.journalslibrary.nihr.ac.uk
70
(or qfFN used qualitatively at a 50 ng/ml threshold). The starting point of the model is when the decisionbetween diagnostic strategies is made, that is, immediately after clinical assessment of symptoms that havenot ruled out preterm labour. Thus, in the absence of further testing, all women would be admitted ortransferred to another hospital. A woman tested may deliver a preterm baby within 7 days of testing ormay deliver in more than 7 days from the time of testing; if the latter happens, birth may be preterm(before 37 weeks’ gestation) or full term. Therefore, women may be classified in one of these threesubgroups in accordance with the time of delivery. Within each of these, the results of the new test willdetermine how the patient is managed, and consequently the woman’s ability to benefit from ACStreatment. Thus, if a woman tests positive, the obstetrician would be expected to treat her by admittingher to the hospital and administering steroids (under fFN testing, in some hospitals women may beadmitted for observation above one threshold and admitted and administered steroids at another higherthreshold: we do not consider this case). The model distinguishes the type of hospital setting by level ofspecialisation: if a woman attends a tertiary level hospital at < 28 weeks’ gestation and tests positive, she isadmitted into hospital, whereas if testing takes place at a lower-level hospital, she would be given tocolysis(we assume that tocolysis is considered only for women undergoing in utero transfer at < 28 weeks’gestation) and transferred to a level 3 hospital for her care. Women who test negative are sent homewithout treatment; owing to a lack of any test-specific data on this parameter, we do not allow for partialcompliance with treatment guidelines in contrast with what is suggested in Figure 1. The same structureis assumed for the status quo ‘fFN’ testing option with one and the same threshold for admissionand treatment.
In accordance with the model in Figure 9, a symptomatic woman who goes on to deliver within 7 days hasa positive test result with probability p (the sensitivity of the test) and a negative test result with probability1 – p (the false-negative rate). Among women who deliver after 7 days, the probability of a positive testresult is equal to the false-positive rate (FPR), and the probability of a negative test result equals the testspecificity for delivery within 7 days of testing.
Some women have a positive test result, receive treatment and deliver after 7 days of testing, but before37 weeks of gestation. In the base-case analysis, we assume that ACS produces no benefit when administered> 7 days before preterm birth.88,89 In scenario analyses, these women are assumed to benefit from ACS,but less so than those who are treated within 7 days of preterm delivery33,87 (we assume throughout that nomultiple courses of steroids are given, based on obstetricians’ advice on routine practice and the perceivedlack of proven benefit and risks to the neonate). The frequency of such cases is calculated as:
P(PTB > 7 days and + ve result) = (1 – ρ)×(1 – Specificity7d) – (1 – ρ37w)×(1 – r), (12)
where P(PTB > 7 days and +ve result) is the probability of having a positive test result and deliveringpreterm > 7 days after testing, ρ is the incidence of delivery within 7 days, Specificity7d is the test specificityfor delivery within 7 days and r is the test specificity for delivery at < 37 weeks (i.e. the proportion ofwomen testing negative among those who deliver after 37 weeks), which has an incidence of ρ37w. Thusthe proportion of women who receive treatment more than 7 days before preterm birth (and, therefore,derive partial benefit from ACSs) is equal to the difference between the FPR for delivery within ≤ 7 daysand the FPR for delivery is < 37 weeks, weighted by their respective incidences. The benefit from ACSs forthis group of women is also reduced by the fact that the baseline mortality and adverse event (IVH and RDS)risk of preterm birth is lower, as the infant is delivered at a higher gestational age, than for mothers whodeliver within 7 days. We assume that delivery takes place at the midpoint between gestation at presentationand 36 weeks.
PopulationThe population was defined as women presenting with symptoms of threatened preterm labour(abdominal pain and contractions) with intact membranes between 24 and 36 weeks’ gestation for whoma transvaginal ultrasound scan was not available or acceptable.
DOI: 10.3310/hta23130 HEALTH TECHNOLOGY ASSESSMENT 2019 VOL. 23 NO. 13
© Queen’s Printer and Controller of HMSO 2019. This work was produced by Varley-Campbell et al. under the terms of a commissioning contract issued by the Secretary of Statefor Health and Social Care. This issue may be freely reproduced for the purposes of private research and study and extracts (or indeed, the full report) may be included inprofessional journals provided that suitable acknowledgement is made and the reproduction is not associated with any form of advertising. Applications for commercialreproduction should be addressed to: NIHR Journals Library, National Institute for Health Research, Evaluation, Trials and Studies Coordinating Centre, Alpha House, University ofSouthampton Science Park, Southampton SO16 7NS, UK.
71
Interventions and comparatorsWe evaluated the following diagnostic test strategies immediately following an initial clinical investigationthat had not ruled out preterm labour:
l testing with PartoSurel testing with Actim Partusl testing with qfFN at thresholds of 10, 200 and 500 ng/mll comparator testing with fFN at 50 ng/ml, from quantitative or qualitative versions of the test devicel treat all without testing (i.e. because clinical investigation could not attribute symptoms to other
causes, women are managed as presumptive cases of preterm labour).
These were the options for which evidence was available in the literature. Combinations of these optionswere not considered, as they were not part of the NICE scope.
In addition, we explored the scenarios of evaluating (1) qualitative fFN in accordance with current treatmentprotocols in Guy’s and St Thomas’ women’s hospital, where different thresholds are used to admit tohospital (at 50 ng/ml) and treat with steroids (200 ng/ml), and (2) qfFN (qfFN) as observed at the level 2maternity hospital in Exeter.90 These additional analyses are intended to reflect the spectrum of variation inlocal current practice across the country.
Perspective, time horizon and discountingThe analysis adopted the perspective of the NHS and Personal Social Services. In accordance with therequirements of the NICE methods guide, the time horizon is taken as the entire lifetime, and the projectedlong-term health-care costs and utilities associated with avoiding an adverse neonatal outcome (death, RDSand IVH) were measured.91 All previous models of diagnosis in preterm labour assumed much shorter timehorizons (up to neonatal death or discharge from hospital), except for the model informing the NICE 2015guideline in this area24 (see Chapter 4 for a critique of these models). An annual discount rate of 3.5% forcosts and benefits was used, as set by NICE. We present results limited to neonatal death or discharge fromhospital in scenario analyses.
Model parametersThe model consists of two parts, the diagnostic phase and the treatment phase, each with a characteristicset of parameters and sources of evidence. The diagnostic phase parameters are populated from diagnosticaccuracy studies of the interventions of interest, complemented by data on patient management, such asadmission rates conditional on test results, which are obtained from audit data or modelling studies. Thetreatment phase is derived from large observational studies of the effects of steroids on neonatal healthoutcomes and evidence synthesis of RCTs of ACS treatment. Cost estimates are obtained from detailedcosting studies in individual hospitals or routine national sources, and health-related quality-of-life utilitieshave been obtained from observational and health-state preference elicitation studies.
Treatment effectiveness and extrapolation
Diagnostic test accuracyWe limit our analyses to evaluate the diagnostic tests assessed by individual comparative diagnosticaccuracy studies, as identified in Chapter 2. These studies are:
l APOSTEL-1, comparing Actim Partus with qualitative fFN at the 10, 50, 200 and 500 ng/ml thresholds(Bruijn et al.42,43)
l a comparison of Actim Partus with PartoSure (Hadzi-Lega et al.44).
INDEPENDENT ECONOMIC ASSESSMENT
NIHR Journals Library www.journalslibrary.nihr.ac.uk
72
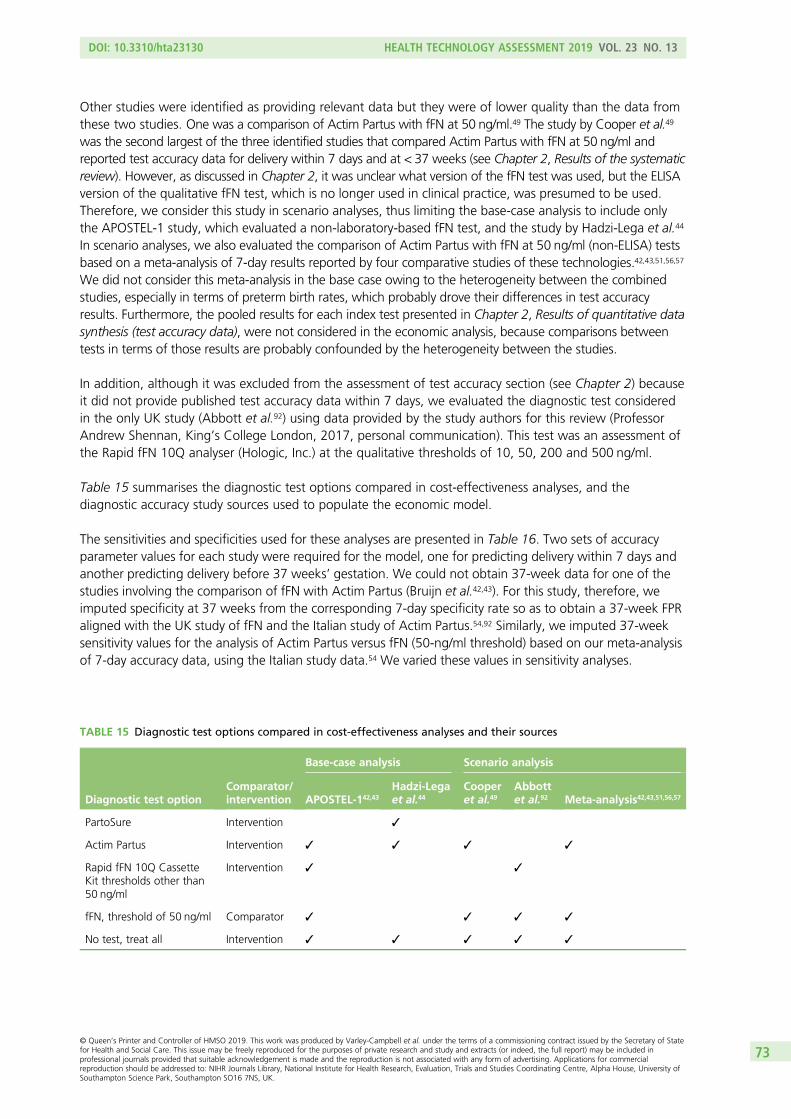
Other studies were identified as providing relevant data but they were of lower quality than the data fromthese two studies. One was a comparison of Actim Partus with fFN at 50 ng/ml.49 The study by Cooper et al.49
was the second largest of the three identified studies that compared Actim Partus with fFN at 50 ng/ml andreported test accuracy data for delivery within 7 days and at < 37 weeks (see Chapter 2, Results of the systematicreview). However, as discussed in Chapter 2, it was unclear what version of the fFN test was used, but the ELISAversion of the qualitative fFN test, which is no longer used in clinical practice, was presumed to be used.Therefore, we consider this study in scenario analyses, thus limiting the base-case analysis to include onlythe APOSTEL-1 study, which evaluated a non-laboratory-based fFN test, and the study by Hadzi-Lega et al.44
In scenario analyses, we also evaluated the comparison of Actim Partus with fFN at 50 ng/ml (non-ELISA) testsbased on a meta-analysis of 7-day results reported by four comparative studies of these technologies.42,43,51,56,57
We did not consider this meta-analysis in the base case owing to the heterogeneity between the combinedstudies, especially in terms of preterm birth rates, which probably drove their differences in test accuracyresults. Furthermore, the pooled results for each index test presented in Chapter 2, Results of quantitative datasynthesis (test accuracy data), were not considered in the economic analysis, because comparisons betweentests in terms of those results are probably confounded by the heterogeneity between the studies.
In addition, although it was excluded from the assessment of test accuracy section (see Chapter 2) becauseit did not provide published test accuracy data within 7 days, we evaluated the diagnostic test consideredin the only UK study (Abbott et al.92) using data provided by the study authors for this review (ProfessorAndrew Shennan, King’s College London, 2017, personal communication). This test was an assessment ofthe Rapid fFN 10Q analyser (Hologic, Inc.) at the qualitative thresholds of 10, 50, 200 and 500 ng/ml.
Table 15 summarises the diagnostic test options compared in cost-effectiveness analyses, and thediagnostic accuracy study sources used to populate the economic model.
The sensitivities and specificities used for these analyses are presented in Table 16. Two sets of accuracyparameter values for each study were required for the model, one for predicting delivery within 7 days andanother predicting delivery before 37 weeks’ gestation. We could not obtain 37-week data for one of thestudies involving the comparison of fFN with Actim Partus (Bruijn et al.42,43). For this study, therefore, weimputed specificity at 37 weeks from the corresponding 7-day specificity rate so as to obtain a 37-week FPRaligned with the UK study of fFN and the Italian study of Actim Partus.54,92 Similarly, we imputed 37-weeksensitivity values for the analysis of Actim Partus versus fFN (50-ng/ml threshold) based on our meta-analysisof 7-day accuracy data, using the Italian study data.54 We varied these values in sensitivity analyses.
TABLE 15 Diagnostic test options compared in cost-effectiveness analyses and their sources
Diagnostic test optionComparator/intervention
Base-case analysis Scenario analysis
APOSTEL-142,43
Hadzi-Legaet al.44
Cooperet al.49
Abbottet al.92 Meta-analysis42,43,51,56,57
PartoSure Intervention ✓
Actim Partus Intervention ✓ ✓ ✓ ✓
Rapid fFN 10Q CassetteKit thresholds other than50 ng/ml
Intervention ✓ ✓
fFN, threshold of 50 ng/ml Comparator ✓ ✓ ✓ ✓
No test, treat all Intervention ✓ ✓ ✓ ✓ ✓
DOI: 10.3310/hta23130 HEALTH TECHNOLOGY ASSESSMENT 2019 VOL. 23 NO. 13
© Queen’s Printer and Controller of HMSO 2019. This work was produced by Varley-Campbell et al. under the terms of a commissioning contract issued by the Secretary of Statefor Health and Social Care. This issue may be freely reproduced for the purposes of private research and study and extracts (or indeed, the full report) may be included inprofessional journals provided that suitable acknowledgement is made and the reproduction is not associated with any form of advertising. Applications for commercialreproduction should be addressed to: NIHR Journals Library, National Institute for Health Research, Evaluation, Trials and Studies Coordinating Centre, Alpha House, University ofSouthampton Science Park, Southampton SO16 7NS, UK.
73
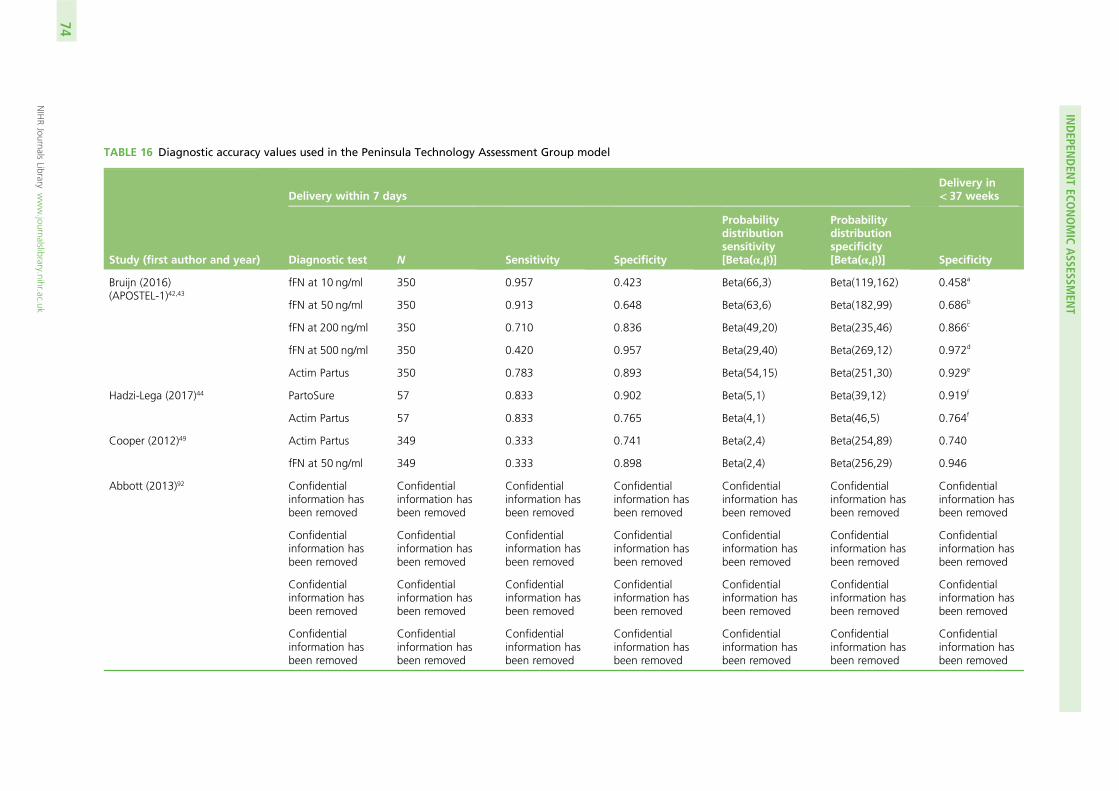
TABLE 16 Diagnostic accuracy values used in the Peninsula Technology Assessment Group model
Study (first author and year)
Delivery within 7 daysDelivery in< 37 weeks
Diagnostic test N Sensitivity Specificity
Probabilitydistributionsensitivity[Beta(α,β)]
Probabilitydistributionspecificity[Beta(α,β)] Specificity
Bruijn (2016)(APOSTEL-1)42,43
fFN at 10 ng/ml 350 0.957 0.423 Beta(66,3) Beta(119,162) 0.458a
fFN at 50 ng/ml 350 0.913 0.648 Beta(63,6) Beta(182,99) 0.686b
fFN at 200 ng/ml 350 0.710 0.836 Beta(49,20) Beta(235,46) 0.866c
fFN at 500 ng/ml 350 0.420 0.957 Beta(29,40) Beta(269,12) 0.972d
Actim Partus 350 0.783 0.893 Beta(54,15) Beta(251,30) 0.929e
Hadzi-Lega (2017)44 PartoSure 57 0.833 0.902 Beta(5,1) Beta(39,12) 0.919f
Actim Partus 57 0.833 0.765 Beta(4,1) Beta(46,5) 0.764f
Cooper (2012)49 Actim Partus 349 0.333 0.741 Beta(2,4) Beta(254,89) 0.740
fFN at 50 ng/ml 349 0.333 0.898 Beta(2,4) Beta(256,29) 0.946
Abbott (2013)92 Confidentialinformation hasbeen removed
Confidentialinformation hasbeen removed
Confidentialinformation hasbeen removed
Confidentialinformation hasbeen removed
Confidentialinformation hasbeen removed
Confidentialinformation hasbeen removed
Confidentialinformation hasbeen removed
Confidentialinformation hasbeen removed
Confidentialinformation hasbeen removed
Confidentialinformation hasbeen removed
Confidentialinformation hasbeen removed
Confidentialinformation hasbeen removed
Confidentialinformation hasbeen removed
Confidentialinformation hasbeen removed
Confidentialinformation hasbeen removed
Confidentialinformation hasbeen removed
Confidentialinformation hasbeen removed
Confidentialinformation hasbeen removed
Confidentialinformation hasbeen removed
Confidentialinformation hasbeen removed
Confidentialinformation hasbeen removed
Confidentialinformation hasbeen removed
Confidentialinformation hasbeen removed
Confidentialinformation hasbeen removed
Confidentialinformation hasbeen removed
Confidentialinformation hasbeen removed
Confidentialinformation hasbeen removed
Confidentialinformation hasbeen removed
INDEPEN
DEN
TECO
NOMIC
ASSESSM
ENT
NIHRJournals
Librarywww.journalslibrary.nihr.ac.uk
74
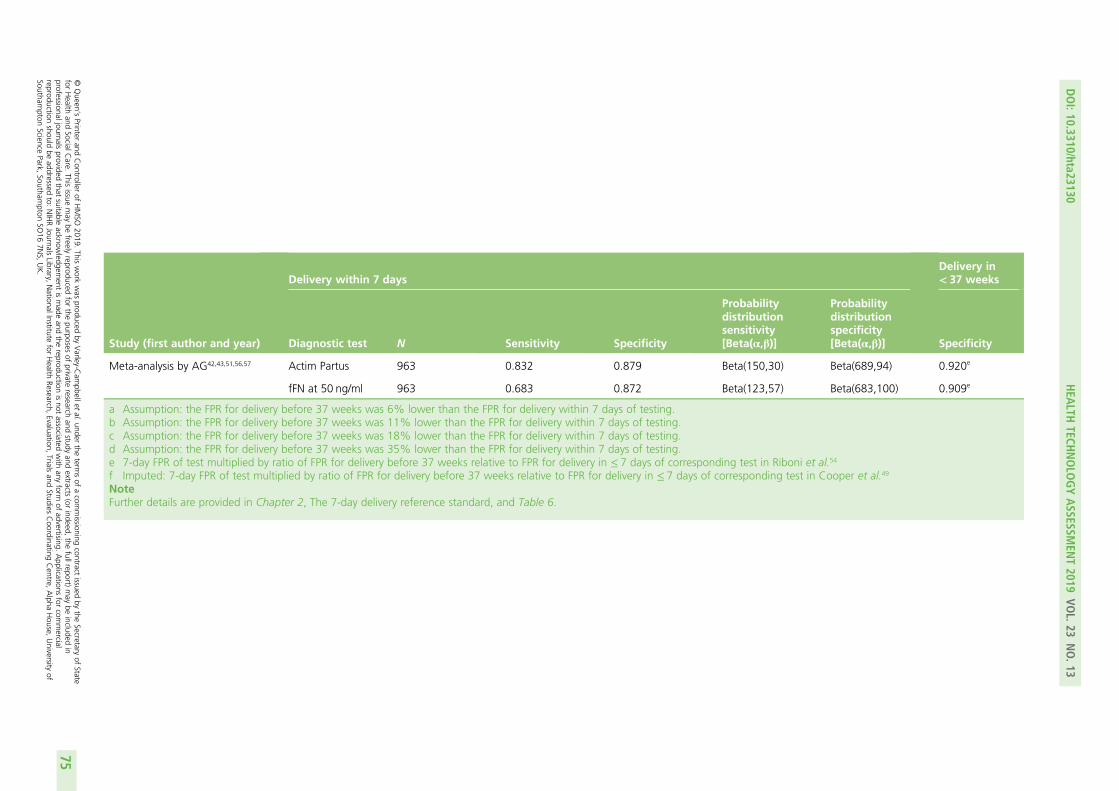
Study (first author and year)
Delivery within 7 daysDelivery in< 37 weeks
Diagnostic test N Sensitivity Specificity
Probabilitydistributionsensitivity[Beta(α,β)]
Probabilitydistributionspecificity[Beta(α,β)] Specificity
Meta-analysis by AG42,43,51,56,57 Actim Partus 963 0.832 0.879 Beta(150,30) Beta(689,94) 0.920e
fFN at 50 ng/ml 963 0.683 0.872 Beta(123,57) Beta(683,100) 0.909e
a Assumption: the FPR for delivery before 37 weeks was 6% lower than the FPR for delivery within 7 days of testing.b Assumption: the FPR for delivery before 37 weeks was 11% lower than the FPR for delivery within 7 days of testing.c Assumption: the FPR for delivery before 37 weeks was 18% lower than the FPR for delivery within 7 days of testing.d Assumption: the FPR for delivery before 37 weeks was 35% lower than the FPR for delivery within 7 days of testing.e 7-day FPR of test multiplied by ratio of FPR for delivery before 37 weeks relative to FPR for delivery in ≤ 7 days of corresponding test in Riboni et al.54
f Imputed: 7-day FPR of test multiplied by ratio of FPR for delivery before 37 weeks relative to FPR for delivery in ≤ 7 days of corresponding test in Cooper et al.49
NoteFurther details are provided in Chapter 2, The 7-day delivery reference standard, and Table 6.
DOI:10.3310/hta23130
HEA
LTHTECH
NOLO
GYASSESSM
ENT2019
VOL.23
NO.13
©Queen
’sPrinter
andController
ofHMSO
2019.This
work
was
producedby
Varley-C
ampbellet
al.under
theterm
sof
acom
missioning
contractissued
bythe
Secretaryof
Statefor
Health
andSocialC
are.This
issuemay
befreely
reproducedfor
thepurposes
ofprivate
researchand
studyand
extracts(or
indeed,the
fullreport)may
beincluded
inprofessionaljournals
providedthat
suitableacknow
ledgement
ismade
andthe
reproductionisnot
associatedwith
anyform
ofadvertising.
Applications
forcom
mercial
reproductionshould
beaddressed
to:NIHRJournals
Library,NationalInstitute
forHealth
Research,Evaluation,
Trialsand
StudiesCoordinating
Centre,
Alpha
House,
University
ofSoutham
ptonScience
Park,Southam
ptonSO
167N
S,UK.
75
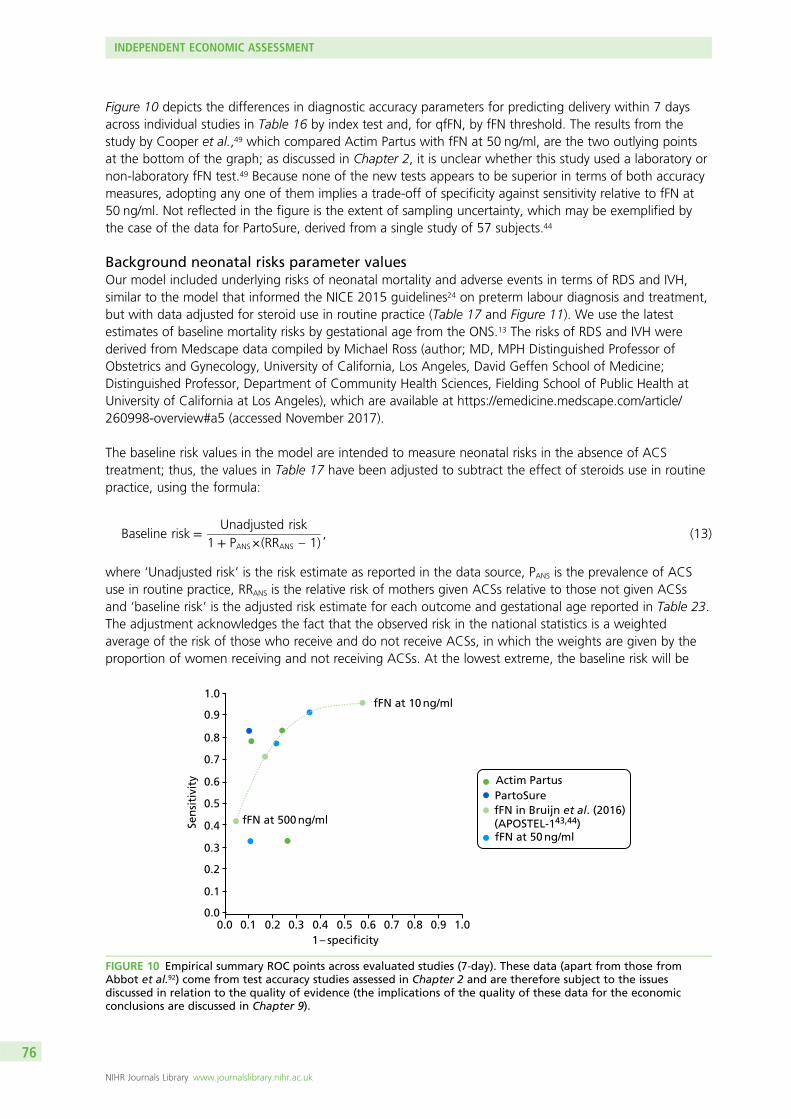
Figure 10 depicts the differences in diagnostic accuracy parameters for predicting delivery within 7 daysacross individual studies in Table 16 by index test and, for qfFN, by fFN threshold. The results from thestudy by Cooper et al.,49 which compared Actim Partus with fFN at 50 ng/ml, are the two outlying pointsat the bottom of the graph; as discussed in Chapter 2, it is unclear whether this study used a laboratory ornon-laboratory fFN test.49 Because none of the new tests appears to be superior in terms of both accuracymeasures, adopting any one of them implies a trade-off of specificity against sensitivity relative to fFN at50 ng/ml. Not reflected in the figure is the extent of sampling uncertainty, which may be exemplified bythe case of the data for PartoSure, derived from a single study of 57 subjects.44
Background neonatal risks parameter valuesOur model included underlying risks of neonatal mortality and adverse events in terms of RDS and IVH,similar to the model that informed the NICE 2015 guidelines24 on preterm labour diagnosis and treatment,but with data adjusted for steroid use in routine practice (Table 17 and Figure 11). We use the latestestimates of baseline mortality risks by gestational age from the ONS.13 The risks of RDS and IVH werederived from Medscape data compiled by Michael Ross (author; MD, MPH Distinguished Professor ofObstetrics and Gynecology, University of California, Los Angeles, David Geffen School of Medicine;Distinguished Professor, Department of Community Health Sciences, Fielding School of Public Health atUniversity of California at Los Angeles), which are available at https://emedicine.medscape.com/article/260998-overview#a5 (accessed November 2017).
The baseline risk values in the model are intended to measure neonatal risks in the absence of ACStreatment; thus, the values in Table 17 have been adjusted to subtract the effect of steroids use in routinepractice, using the formula:
Baseline risk =Unadjusted risk
1 + PANS×(RRANS – 1), (13)
where ‘Unadjusted risk’ is the risk estimate as reported in the data source, PANS is the prevalence of ACSuse in routine practice, RRANS is the relative risk of mothers given ACSs relative to those not given ACSsand ‘baseline risk’ is the adjusted risk estimate for each outcome and gestational age reported in Table 23.The adjustment acknowledges the fact that the observed risk in the national statistics is a weightedaverage of the risk of those who receive and do not receive ACSs, in which the weights are given by theproportion of women receiving and not receiving ACSs. At the lowest extreme, the baseline risk will be
Sen
siti
vity
1.0
0.9
0.8
0.7
0.6
0.5
0.4
0.4 0.5 0.6 0.7 0.8 0.9 1.0
0.3
0.3
0.2
0.2
0.1
0.10.0
0.01 – specificity
fFN at 10 ng/ml
fFN at 500 ng/ml
Actim PartusPartoSurefFN in Bruijn et al. (2016) (APOSTEL-143,44)fFN at 50 ng/ml
FIGURE 10 Empirical summary ROC points across evaluated studies (7-day). These data (apart from those fromAbbot et al.92) come from test accuracy studies assessed in Chapter 2 and are therefore subject to the issuesdiscussed in relation to the quality of evidence (the implications of the quality of these data for the economicconclusions are discussed in Chapter 9).
INDEPENDENT ECONOMIC ASSESSMENT
NIHR Journals Library www.journalslibrary.nihr.ac.uk
76
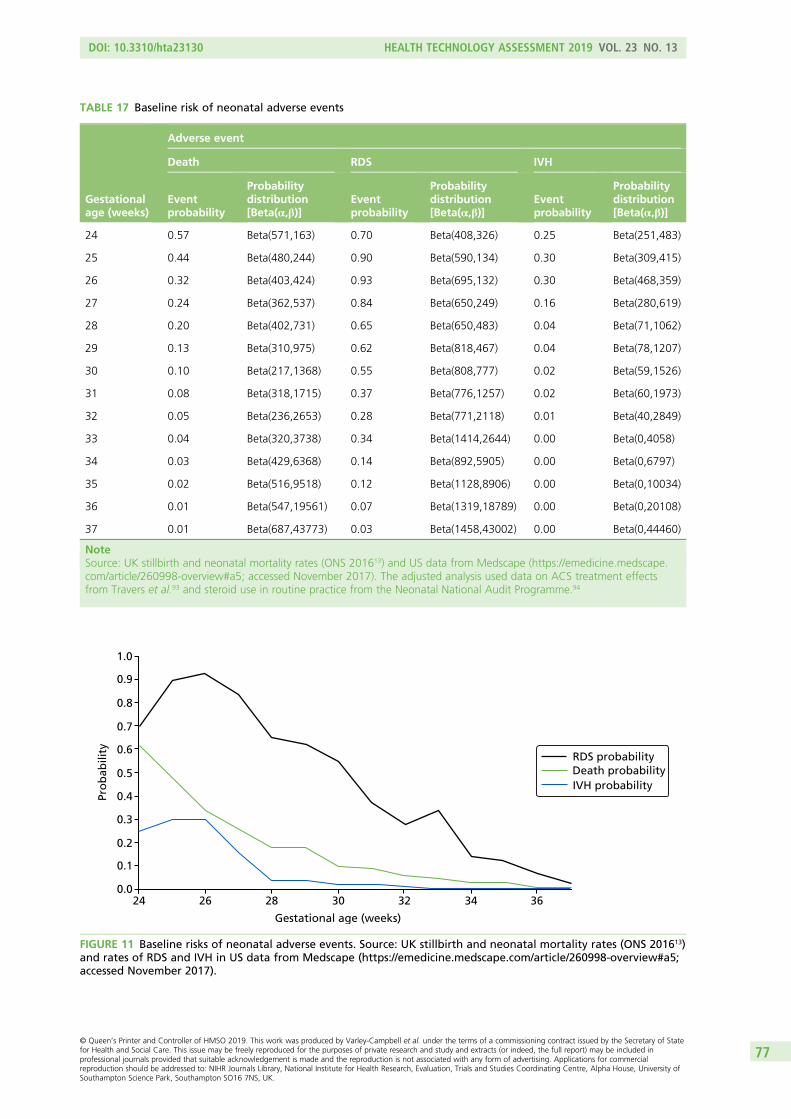
TABLE 17 Baseline risk of neonatal adverse events
Gestationalage (weeks)
Adverse event
Death RDS IVH
Eventprobability
Probabilitydistribution[Beta(α,β)]
Eventprobability
Probabilitydistribution[Beta(α,β)]
Eventprobability
Probabilitydistribution[Beta(α,β)]
24 0.57 Beta(571,163) 0.70 Beta(408,326) 0.25 Beta(251,483)
25 0.44 Beta(480,244) 0.90 Beta(590,134) 0.30 Beta(309,415)
26 0.32 Beta(403,424) 0.93 Beta(695,132) 0.30 Beta(468,359)
27 0.24 Beta(362,537) 0.84 Beta(650,249) 0.16 Beta(280,619)
28 0.20 Beta(402,731) 0.65 Beta(650,483) 0.04 Beta(71,1062)
29 0.13 Beta(310,975) 0.62 Beta(818,467) 0.04 Beta(78,1207)
30 0.10 Beta(217,1368) 0.55 Beta(808,777) 0.02 Beta(59,1526)
31 0.08 Beta(318,1715) 0.37 Beta(776,1257) 0.02 Beta(60,1973)
32 0.05 Beta(236,2653) 0.28 Beta(771,2118) 0.01 Beta(40,2849)
33 0.04 Beta(320,3738) 0.34 Beta(1414,2644) 0.00 Beta(0,4058)
34 0.03 Beta(429,6368) 0.14 Beta(892,5905) 0.00 Beta(0,6797)
35 0.02 Beta(516,9518) 0.12 Beta(1128,8906) 0.00 Beta(0,10034)
36 0.01 Beta(547,19561) 0.07 Beta(1319,18789) 0.00 Beta(0,20108)
37 0.01 Beta(687,43773) 0.03 Beta(1458,43002) 0.00 Beta(0,44460)
NoteSource: UK stillbirth and neonatal mortality rates (ONS 201613) and US data from Medscape (https://emedicine.medscape.com/article/260998-overview#a5; accessed November 2017). The adjusted analysis used data on ACS treatment effectsfrom Travers et al.93 and steroid use in routine practice from the Neonatal National Audit Programme.94
Gestational age (weeks)
Pro
bab
ility
1.0
0.9
0.8
0.7
0.6
0.5
0.4
0.3
0.2
0.1
0.024 26 28 30 32 34 36
Death probabilityRDS probability
IVH probability
FIGURE 11 Baseline risks of neonatal adverse events. Source: UK stillbirth and neonatal mortality rates (ONS 201613)and rates of RDS and IVH in US data from Medscape (https://emedicine.medscape.com/article/260998-overview#a5;accessed November 2017).
DOI: 10.3310/hta23130 HEALTH TECHNOLOGY ASSESSMENT 2019 VOL. 23 NO. 13
© Queen’s Printer and Controller of HMSO 2019. This work was produced by Varley-Campbell et al. under the terms of a commissioning contract issued by the Secretary of Statefor Health and Social Care. This issue may be freely reproduced for the purposes of private research and study and extracts (or indeed, the full report) may be included inprofessional journals provided that suitable acknowledgement is made and the reproduction is not associated with any form of advertising. Applications for commercialreproduction should be addressed to: NIHR Journals Library, National Institute for Health Research, Evaluation, Trials and Studies Coordinating Centre, Alpha House, University ofSouthampton Science Park, Southampton SO16 7NS, UK.
77
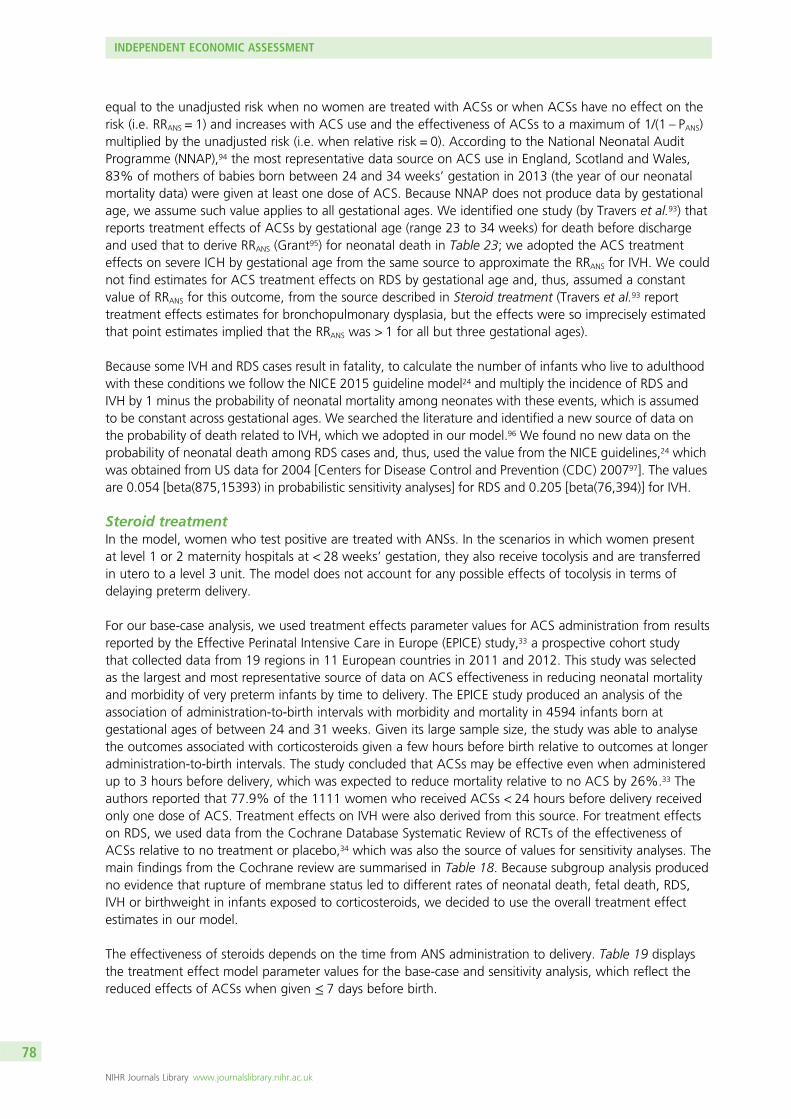
equal to the unadjusted risk when no women are treated with ACSs or when ACSs have no effect on therisk (i.e. RRANS = 1) and increases with ACS use and the effectiveness of ACSs to a maximum of 1/(1 – PANS)multiplied by the unadjusted risk (i.e. when relative risk = 0). According to the National Neonatal AuditProgramme (NNAP),94 the most representative data source on ACS use in England, Scotland and Wales,83% of mothers of babies born between 24 and 34 weeks’ gestation in 2013 (the year of our neonatalmortality data) were given at least one dose of ACS. Because NNAP does not produce data by gestationalage, we assume such value applies to all gestational ages. We identified one study (by Travers et al.93) thatreports treatment effects of ACSs by gestational age (range 23 to 34 weeks) for death before dischargeand used that to derive RRANS (Grant95) for neonatal death in Table 23; we adopted the ACS treatmenteffects on severe ICH by gestational age from the same source to approximate the RRANS for IVH. We couldnot find estimates for ACS treatment effects on RDS by gestational age and, thus, assumed a constantvalue of RRANS for this outcome, from the source described in Steroid treatment (Travers et al.93 reporttreatment effects estimates for bronchopulmonary dysplasia, but the effects were so imprecisely estimatedthat point estimates implied that the RRANS was > 1 for all but three gestational ages).
Because some IVH and RDS cases result in fatality, to calculate the number of infants who live to adulthoodwith these conditions we follow the NICE 2015 guideline model24 and multiply the incidence of RDS andIVH by 1 minus the probability of neonatal mortality among neonates with these events, which is assumedto be constant across gestational ages. We searched the literature and identified a new source of data onthe probability of death related to IVH, which we adopted in our model.96 We found no new data on theprobability of neonatal death among RDS cases and, thus, used the value from the NICE guidelines,24 whichwas obtained from US data for 2004 [Centers for Disease Control and Prevention (CDC) 200797]. The valuesare 0.054 [beta(875,15393) in probabilistic sensitivity analyses] for RDS and 0.205 [beta(76,394)] for IVH.
Steroid treatmentIn the model, women who test positive are treated with ANSs. In the scenarios in which women presentat level 1 or 2 maternity hospitals at < 28 weeks’ gestation, they also receive tocolysis and are transferredin utero to a level 3 unit. The model does not account for any possible effects of tocolysis in terms ofdelaying preterm delivery.
For our base-case analysis, we used treatment effects parameter values for ACS administration from resultsreported by the Effective Perinatal Intensive Care in Europe (EPICE) study,33 a prospective cohort studythat collected data from 19 regions in 11 European countries in 2011 and 2012. This study was selectedas the largest and most representative source of data on ACS effectiveness in reducing neonatal mortalityand morbidity of very preterm infants by time to delivery. The EPICE study produced an analysis of theassociation of administration-to-birth intervals with morbidity and mortality in 4594 infants born atgestational ages of between 24 and 31 weeks. Given its large sample size, the study was able to analysethe outcomes associated with corticosteroids given a few hours before birth relative to outcomes at longeradministration-to-birth intervals. The study concluded that ACSs may be effective even when administeredup to 3 hours before delivery, which was expected to reduce mortality relative to no ACS by 26%.33 Theauthors reported that 77.9% of the 1111 women who received ACSs < 24 hours before delivery receivedonly one dose of ACS. Treatment effects on IVH were also derived from this source. For treatment effectson RDS, we used data from the Cochrane Database Systematic Review of RCTs of the effectiveness ofACSs relative to no treatment or placebo,34 which was also the source of values for sensitivity analyses. Themain findings from the Cochrane review are summarised in Table 18. Because subgroup analysis producedno evidence that rupture of membrane status led to different rates of neonatal death, fetal death, RDS,IVH or birthweight in infants exposed to corticosteroids, we decided to use the overall treatment effectestimates in our model.
The effectiveness of steroids depends on the time from ANS administration to delivery. Table 19 displaysthe treatment effect model parameter values for the base-case and sensitivity analysis, which reflect thereduced effects of ACSs when given ≤ 7 days before birth.
INDEPENDENT ECONOMIC ASSESSMENT
NIHR Journals Library www.journalslibrary.nihr.ac.uk
78
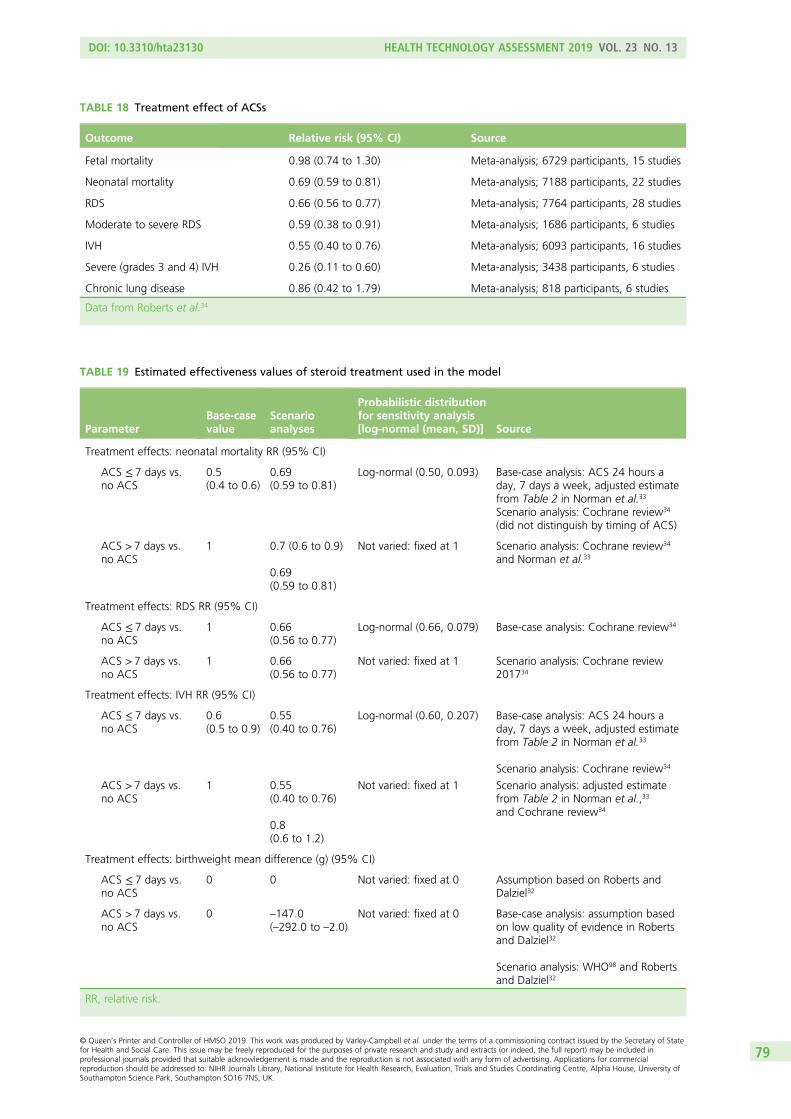
TABLE 18 Treatment effect of ACSs
Outcome Relative risk (95% CI) Source
Fetal mortality 0.98 (0.74 to 1.30) Meta-analysis; 6729 participants, 15 studies
Neonatal mortality 0.69 (0.59 to 0.81) Meta-analysis; 7188 participants, 22 studies
RDS 0.66 (0.56 to 0.77) Meta-analysis; 7764 participants, 28 studies
Moderate to severe RDS 0.59 (0.38 to 0.91) Meta-analysis; 1686 participants, 6 studies
IVH 0.55 (0.40 to 0.76) Meta-analysis; 6093 participants, 16 studies
Severe (grades 3 and 4) IVH 0.26 (0.11 to 0.60) Meta-analysis; 3438 participants, 6 studies
Chronic lung disease 0.86 (0.42 to 1.79) Meta-analysis; 818 participants, 6 studies
Data from Roberts et al.34
TABLE 19 Estimated effectiveness values of steroid treatment used in the model
ParameterBase-casevalue
Scenarioanalyses
Probabilistic distributionfor sensitivity analysis[log-normal (mean, SD)] Source
Treatment effects: neonatal mortality RR (95% CI)
ACS ≤ 7 days vs.no ACS
0.5(0.4 to 0.6)
0.69(0.59 to 0.81)
Log-normal (0.50, 0.093) Base-case analysis: ACS 24 hours aday, 7 days a week, adjusted estimatefrom Table 2 in Norman et al.33
Scenario analysis: Cochrane review34
(did not distinguish by timing of ACS)
ACS > 7 days vs.no ACS
1 0.7 (0.6 to 0.9)
0.69(0.59 to 0.81)
Not varied: fixed at 1 Scenario analysis: Cochrane review34
and Norman et al.33
Treatment effects: RDS RR (95% CI)
ACS ≤ 7 days vs.no ACS
1 0.66(0.56 to 0.77)
Log-normal (0.66, 0.079) Base-case analysis: Cochrane review34
ACS > 7 days vs.no ACS
1 0.66(0.56 to 0.77)
Not varied: fixed at 1 Scenario analysis: Cochrane review201734
Treatment effects: IVH RR (95% CI)
ACS ≤ 7 days vs.no ACS
0.6(0.5 to 0.9)
0.55(0.40 to 0.76)
Log-normal (0.60, 0.207) Base-case analysis: ACS 24 hours aday, 7 days a week, adjusted estimatefrom Table 2 in Norman et al.33
Scenario analysis: Cochrane review34
ACS > 7 days vs.no ACS
1 0.55(0.40 to 0.76)
0.8(0.6 to 1.2)
Not varied: fixed at 1 Scenario analysis: adjusted estimatefrom Table 2 in Norman et al.,33
and Cochrane review34
Treatment effects: birthweight mean difference (g) (95% CI)
ACS ≤ 7 days vs.no ACS
0 0 Not varied: fixed at 0 Assumption based on Roberts andDalziel32
ACS > 7 days vs.no ACS
0 –147.0(–292.0 to –2.0)
Not varied: fixed at 0 Base-case analysis: assumption basedon low quality of evidence in Robertsand Dalziel32
Scenario analysis: WHO98 and Robertsand Dalziel32
RR, relative risk.
DOI: 10.3310/hta23130 HEALTH TECHNOLOGY ASSESSMENT 2019 VOL. 23 NO. 13
© Queen’s Printer and Controller of HMSO 2019. This work was produced by Varley-Campbell et al. under the terms of a commissioning contract issued by the Secretary of Statefor Health and Social Care. This issue may be freely reproduced for the purposes of private research and study and extracts (or indeed, the full report) may be included inprofessional journals provided that suitable acknowledgement is made and the reproduction is not associated with any form of advertising. Applications for commercialreproduction should be addressed to: NIHR Journals Library, National Institute for Health Research, Evaluation, Trials and Studies Coordinating Centre, Alpha House, University ofSouthampton Science Park, Southampton SO16 7NS, UK.
79

Health-related quality of lifeWe conducted a systematic search of the literature for utility values of neonatal outcomes in the model:mortality, RDS and IVH. The details of the search strategy, identification and data extraction from theidentified studies are provided in Appendix 4, in which additional tables highlight the parameter valuesused in the model. In this section, we summarise our findings.
Summary of identified studiesA total of 28 studies were identified from screening full texts as containing information useful forobtaining or deriving utility parameters for the model, given the populations studied (i.e. either pretermchildren or mothers). These studies are broadly summarised in Appendix 4.
Of these 28 studies, 24 assess the outcomes of children born preterm. The details of these studies aresummarised in Appendix 5, Table 39. Nine additional papers were cited as sources for utilities in someof these studies. Parameter values from these additional papers are presented in Appendix 5, Table 40.The remaining four papers assess the outcomes of mothers; these studies are summarised in Appendix 5,Table 41.
Short Form questionnaire-36 items mapping and extraction of utilitiesNone of the studies that were found directly measured utilities based on the EQ-5D. However, variousmapping functions exist that allow Short Form questionnaire-36 items (SF-36)99 summary measures to beconverted into EQ-5D utilities.100 We made use of a mapping function obtained from Rowen et al.101 toundertake this conversion, as it was deemed the most appropriate study based on regression variables andthe population sample used. A more detailed discussion of mapping studies can be found in Appendix 4.
Relevant studies for utilities of intraventricular haemorrhage and respiratory distresssyndrome and for mothersOnly one paper considers the quality of life for preterm children with IVH, separated into two severitygroups: level 0–2 IVH with no periventricular leukomalacia (PVL) and level 2–4 IVH with/without PVL.102
However, a suitable mapping to EQ-5D utility for the health-related quality-of-life measure used in thispaper could not be found.
Likewise, only one paper103 considers quality of life for preterm children with RDS. This study measuresSF-36 scores, but does not report them. We were unable to obtain the SF-36 data after contacting thecorresponding author.
The evidence on the quality of life of mothers of preterm children is sparse. Only two studies considermothers of preterm children specifically.104,105 The first is an abstract that reported only physical and mentalhealth SF-36 mean summary scores,104 and the second reported Maternal Postpartum Quality of Life(MAPP-QOL) scores.105 Neither of these could be reliably mapped to EQ-5D utilities.
Couto et al.106 assessed the quality of life for mothers in Brazil who have had at least one of four previousadverse pregnancy outcomes. Although preterm birth is one of the four outcomes that is an inclusioncriterion (along with early neonatal death, recurrent abortion and fetal death), we are not provided withseparate utilities for each outcome individually.
A more detailed discussion of all reviewed studies for the utilities of preterm survivors, IVH, RDS and mothers,is provided in Appendix 4.
Utilities for reduced birthweightIn order to assess whether or not there is any quality-of-life impact from reduced birthweight as a resultof not receiving treatment, papers that were identified from title and abstract screening were searchedto find studies that contained both sufficient birthweight data and utility data. One study was identified,and the author was able to provide the raw data on request.107
INDEPENDENT ECONOMIC ASSESSMENT
NIHR Journals Library www.journalslibrary.nihr.ac.uk
80

A number of regression specifications were estimated using random-effects estimators, in order to find theeffects of birthweight on utility (see Appendix 5, Statistical analysis of the effects of birthweight on utility).However, the coefficient estimates for birthweight and squared birthweight were not statistically significantat the 5% level in any model. Furthermore, the simplest specification (including only birthweight andsquared birthweight) failed the LR test when compared with a specification that included gestational age,sex and time dummies. Therefore, the analysis found insufficient evidence of a birthweight effect on utility,and so we assumed that there is no utility loss from reduced birthweight alone. Further details of thestatistical analysis can be found in Appendix 5, Statistical analysis of the effects of birthweight on utility.
Utility parameters selected for the economic modelBased on the discussion in Appendix 4, utilities deemed the most appropriate base-case values arereported in Table 20. Proxy utilities for RDS and IVH were obtained from the paper by Carroll andDowns,108 which was the source for the study by Bastek et al.109
In practice, not all children with RDS go on to develop severe persistent asthma (the proxy for RDS used inthe model). Based on feedback from a neonatologist, we applied this proxy utility to 56% of all RDS cases.This figure is from a UK-based study that found that 56% of children born extremely preterm hadabnormal baseline spirometry when they were 11 years old.110 The remaining 44% of RDS cases areassumed to incur no additional QALY loss, relative to a preterm survivor.
For IVH, the proxy used (moderate cerebral palsy) is too severe for infants with IVH grades of below III.On consultation with a clinical expert, long-term outcomes from IVH grades below III are thought to notdiffer greatly from those of preterm survivors in general. Therefore, we apply the utility of moderatecerebral palsy only to incidences of IVH that are at grade III or IV.
The utility for preterm survivors was obtained using mapped SF-36 scores.101 The utility computed from the UKstudy111 was used for the base case, and the minimum and maximum utilities in the remaining papers wereselected to provide a range.112,113 This follows the principles outlined in the NICE technical support document.114
TABLE 20 Utilities selected for the economic model
Variable Subject Source Measure Utility Range
‘Severe’ RDS (severe persistentasthma used as proxy)
Child Carroll and Downs108 TTO 0.85 0.84–0.86a
IVH grades III–IV (moderatecerebral palsy used as proxy)
Child Carroll and Downs108
via Bastek et al.109TTO 0.76 0.66–0.84b
Death Child Assumption. Upper boundfrom Vandenbussche et al.115
SG (upperbound only)
0 0–0.02
Preterm survivor Child Cooke111 SF-36c 0.879 0.846–0.901d
Mother with previous adversechild outcome
Mother Couto et al.106 SF-36c 0.644 0.556–0.652e
Mother with no adverse childoutcome
Mother Couto et al.106 SF-36c 0.834 0.768–0.843e
SG, standard gamble; TTO, time trade-off.a Range calculated as a 95% CI, based on the data from Carroll and Downs.108
b Range taken directly from the study by Bastek et al.109 These represent the minimum and maximum values found in theirliterature search for these utilities.
c SF-36 means for the eight dimensions were mapped onto EQ-5D utilities using a quadratic model.101
d Range taken from two of the five studies reporting SF-36 scores (the minimum and maximum utilities reported amongthe five studies).112,113
e Range is generated by generating a 95% CI for the eight SF-36 means, and mapping all lower bounds and all upperbounds to EQ-5D using a linear model.101 These represent a wider estimate of the range than if a 95% CI was providedfor the EQ-5D measure directly.
DOI: 10.3310/hta23130 HEALTH TECHNOLOGY ASSESSMENT 2019 VOL. 23 NO. 13
© Queen’s Printer and Controller of HMSO 2019. This work was produced by Varley-Campbell et al. under the terms of a commissioning contract issued by the Secretary of Statefor Health and Social Care. This issue may be freely reproduced for the purposes of private research and study and extracts (or indeed, the full report) may be included inprofessional journals provided that suitable acknowledgement is made and the reproduction is not associated with any form of advertising. Applications for commercialreproduction should be addressed to: NIHR Journals Library, National Institute for Health Research, Evaluation, Trials and Studies Coordinating Centre, Alpha House, University ofSouthampton Science Park, Southampton SO16 7NS, UK.
81
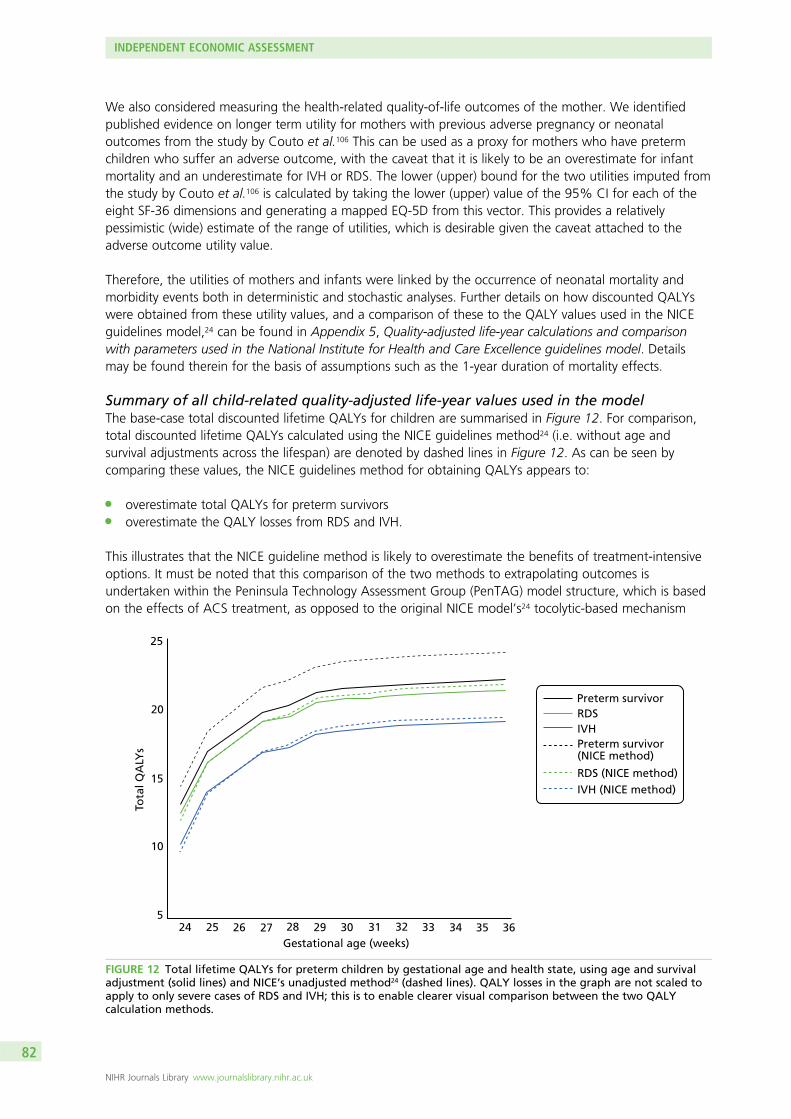
We also considered measuring the health-related quality-of-life outcomes of the mother. We identifiedpublished evidence on longer term utility for mothers with previous adverse pregnancy or neonataloutcomes from the study by Couto et al.106 This can be used as a proxy for mothers who have pretermchildren who suffer an adverse outcome, with the caveat that it is likely to be an overestimate for infantmortality and an underestimate for IVH or RDS. The lower (upper) bound for the two utilities imputed fromthe study by Couto et al.106 is calculated by taking the lower (upper) value of the 95% CI for each of theeight SF-36 dimensions and generating a mapped EQ-5D from this vector. This provides a relativelypessimistic (wide) estimate of the range of utilities, which is desirable given the caveat attached to theadverse outcome utility value.
Therefore, the utilities of mothers and infants were linked by the occurrence of neonatal mortality andmorbidity events both in deterministic and stochastic analyses. Further details on how discounted QALYswere obtained from these utility values, and a comparison of these to the QALY values used in the NICEguidelines model,24 can be found in Appendix 5, Quality-adjusted life-year calculations and comparisonwith parameters used in the National Institute for Health and Care Excellence guidelines model. Detailsmay be found therein for the basis of assumptions such as the 1-year duration of mortality effects.
Summary of all child-related quality-adjusted life-year values used in the modelThe base-case total discounted lifetime QALYs for children are summarised in Figure 12. For comparison,total discounted lifetime QALYs calculated using the NICE guidelines method24 (i.e. without age andsurvival adjustments across the lifespan) are denoted by dashed lines in Figure 12. As can be seen bycomparing these values, the NICE guidelines method for obtaining QALYs appears to:
l overestimate total QALYs for preterm survivorsl overestimate the QALY losses from RDS and IVH.
This illustrates that the NICE guideline method is likely to overestimate the benefits of treatment-intensiveoptions. It must be noted that this comparison of the two methods to extrapolating outcomes isundertaken within the Peninsula Technology Assessment Group (PenTAG) model structure, which is basedon the effects of ACS treatment, as opposed to the original NICE model’s24 tocolytic-based mechanism
Gestational age (weeks)
Tota
l QA
LYs
25
20
15
10
524 25 26 27 28 29 30 31 32 33 34 35 36
Preterm survivorRDSIVHPreterm survivor(NICE method)
RDS (NICE method)IVH (NICE method)
FIGURE 12 Total lifetime QALYs for preterm children by gestational age and health state, using age and survivaladjustment (solid lines) and NICE’s unadjusted method24 (dashed lines). QALY losses in the graph are not scaled toapply to only severe cases of RDS and IVH; this is to enable clearer visual comparison between the two QALYcalculation methods.
INDEPENDENT ECONOMIC ASSESSMENT
NIHR Journals Library www.journalslibrary.nihr.ac.uk
82
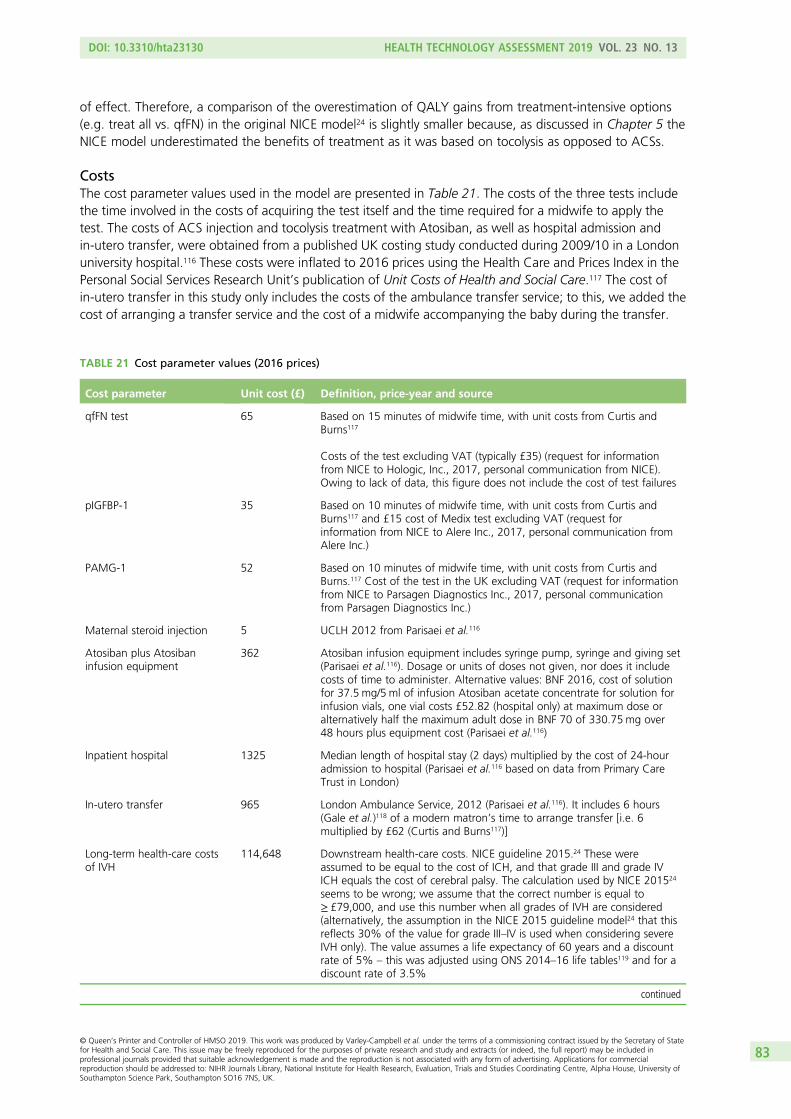
of effect. Therefore, a comparison of the overestimation of QALY gains from treatment-intensive options(e.g. treat all vs. qfFN) in the original NICE model24 is slightly smaller because, as discussed in Chapter 5 theNICE model underestimated the benefits of treatment as it was based on tocolysis as opposed to ACSs.
CostsThe cost parameter values used in the model are presented in Table 21. The costs of the three tests includethe time involved in the costs of acquiring the test itself and the time required for a midwife to apply thetest. The costs of ACS injection and tocolysis treatment with Atosiban, as well as hospital admission andin-utero transfer, were obtained from a published UK costing study conducted during 2009/10 in a Londonuniversity hospital.116 These costs were inflated to 2016 prices using the Health Care and Prices Index in thePersonal Social Services Research Unit’s publication of Unit Costs of Health and Social Care.117 The cost ofin-utero transfer in this study only includes the costs of the ambulance transfer service; to this, we added thecost of arranging a transfer service and the cost of a midwife accompanying the baby during the transfer.
TABLE 21 Cost parameter values (2016 prices)
Cost parameter Unit cost (£) Definition, price-year and source
qfFN test 65 Based on 15 minutes of midwife time, with unit costs from Curtis andBurns117
Costs of the test excluding VAT (typically £35) (request for informationfrom NICE to Hologic, Inc., 2017, personal communication from NICE).Owing to lack of data, this figure does not include the cost of test failures
pIGFBP-1 35 Based on 10 minutes of midwife time, with unit costs from Curtis andBurns117 and £15 cost of Medix test excluding VAT (request forinformation from NICE to Alere Inc., 2017, personal communication fromAlere Inc.)
PAMG-1 52 Based on 10 minutes of midwife time, with unit costs from Curtis andBurns.117 Cost of the test in the UK excluding VAT (request for informationfrom NICE to Parsagen Diagnostics Inc., 2017, personal communicationfrom Parsagen Diagnostics Inc.)
Maternal steroid injection 5 UCLH 2012 from Parisaei et al.116
Atosiban plus Atosibaninfusion equipment
362 Atosiban infusion equipment includes syringe pump, syringe and giving set(Parisaei et al.116). Dosage or units of doses not given, nor does it includecosts of time to administer. Alternative values: BNF 2016, cost of solutionfor 37.5 mg/5 ml of infusion Atosiban acetate concentrate for solution forinfusion vials, one vial costs £52.82 (hospital only) at maximum dose oralternatively half the maximum adult dose in BNF 70 of 330.75 mg over48 hours plus equipment cost (Parisaei et al.116)
Inpatient hospital 1325 Median length of hospital stay (2 days) multiplied by the cost of 24-houradmission to hospital (Parisaei et al.116 based on data from Primary CareTrust in London)
In-utero transfer 965 London Ambulance Service, 2012 (Parisaei et al.116). It includes 6 hours(Gale et al.)118 of a modern matron’s time to arrange transfer [i.e. 6multiplied by £62 (Curtis and Burns117)]
Long-term health-care costsof IVH
114,648 Downstream health-care costs. NICE guideline 2015.24 These wereassumed to be equal to the cost of ICH, and that grade III and grade IVICH equals the cost of cerebral palsy. The calculation used by NICE 201524
seems to be wrong; we assume that the correct number is equal to≥ £79,000, and use this number when all grades of IVH are considered(alternatively, the assumption in the NICE 2015 guideline model24 that thisreflects 30% of the value for grade III–IV is used when considering severeIVH only). The value assumes a life expectancy of 60 years and a discountrate of 5% – this was adjusted using ONS 2014–16 life tables119 and for adiscount rate of 3.5%
continued
DOI: 10.3310/hta23130 HEALTH TECHNOLOGY ASSESSMENT 2019 VOL. 23 NO. 13
© Queen’s Printer and Controller of HMSO 2019. This work was produced by Varley-Campbell et al. under the terms of a commissioning contract issued by the Secretary of Statefor Health and Social Care. This issue may be freely reproduced for the purposes of private research and study and extracts (or indeed, the full report) may be included inprofessional journals provided that suitable acknowledgement is made and the reproduction is not associated with any form of advertising. Applications for commercialreproduction should be addressed to: NIHR Journals Library, National Institute for Health Research, Evaluation, Trials and Studies Coordinating Centre, Alpha House, University ofSouthampton Science Park, Southampton SO16 7NS, UK.
83
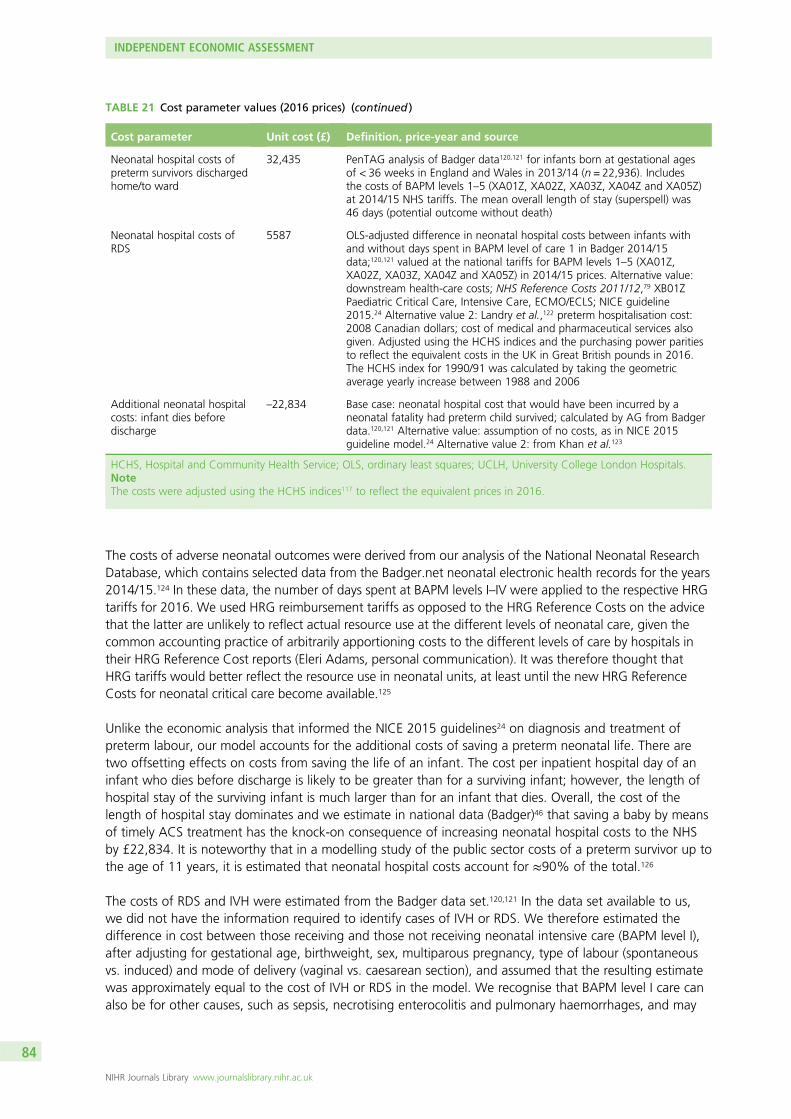
The costs of adverse neonatal outcomes were derived from our analysis of the National Neonatal ResearchDatabase, which contains selected data from the Badger.net neonatal electronic health records for the years2014/15.124 In these data, the number of days spent at BAPM levels I–IV were applied to the respective HRGtariffs for 2016. We used HRG reimbursement tariffs as opposed to the HRG Reference Costs on the advicethat the latter are unlikely to reflect actual resource use at the different levels of neonatal care, given thecommon accounting practice of arbitrarily apportioning costs to the different levels of care by hospitals intheir HRG Reference Cost reports (Eleri Adams, personal communication). It was therefore thought thatHRG tariffs would better reflect the resource use in neonatal units, at least until the new HRG ReferenceCosts for neonatal critical care become available.125
Unlike the economic analysis that informed the NICE 2015 guidelines24 on diagnosis and treatment ofpreterm labour, our model accounts for the additional costs of saving a preterm neonatal life. There aretwo offsetting effects on costs from saving the life of an infant. The cost per inpatient hospital day of aninfant who dies before discharge is likely to be greater than for a surviving infant; however, the length ofhospital stay of the surviving infant is much larger than for an infant that dies. Overall, the cost of thelength of hospital stay dominates and we estimate in national data (Badger)46 that saving a baby by meansof timely ACS treatment has the knock-on consequence of increasing neonatal hospital costs to the NHSby £22,834. It is noteworthy that in a modelling study of the public sector costs of a preterm survivor up tothe age of 11 years, it is estimated that neonatal hospital costs account for ≈90% of the total.126
The costs of RDS and IVH were estimated from the Badger data set.120,121 In the data set available to us,we did not have the information required to identify cases of IVH or RDS. We therefore estimated thedifference in cost between those receiving and those not receiving neonatal intensive care (BAPM level I),after adjusting for gestational age, birthweight, sex, multiparous pregnancy, type of labour (spontaneousvs. induced) and mode of delivery (vaginal vs. caesarean section), and assumed that the resulting estimatewas approximately equal to the cost of IVH or RDS in the model. We recognise that BAPM level I care canalso be for other causes, such as sepsis, necrotising enterocolitis and pulmonary haemorrhages, and may
TABLE 21 Cost parameter values (2016 prices) (continued )
Cost parameter Unit cost (£) Definition, price-year and source
Neonatal hospital costs ofpreterm survivors dischargedhome/to ward
32,435 PenTAG analysis of Badger data120,121 for infants born at gestational agesof < 36 weeks in England and Wales in 2013/14 (n = 22,936). Includesthe costs of BAPM levels 1–5 (XA01Z, XA02Z, XA03Z, XA04Z and XA05Z)at 2014/15 NHS tariffs. The mean overall length of stay (superspell) was46 days (potential outcome without death)
Neonatal hospital costs ofRDS
5587 OLS-adjusted difference in neonatal hospital costs between infants withand without days spent in BAPM level of care 1 in Badger 2014/15data;120,121 valued at the national tariffs for BAPM levels 1–5 (XA01Z,XA02Z, XA03Z, XA04Z and XA05Z) in 2014/15 prices. Alternative value:downstream health-care costs; NHS Reference Costs 2011/12,79 XB01ZPaediatric Critical Care, Intensive Care, ECMO/ECLS; NICE guideline2015.24 Alternative value 2: Landry et al.,122 preterm hospitalisation cost:2008 Canadian dollars; cost of medical and pharmaceutical services alsogiven. Adjusted using the HCHS indices and the purchasing power paritiesto reflect the equivalent costs in the UK in Great British pounds in 2016.The HCHS index for 1990/91 was calculated by taking the geometricaverage yearly increase between 1988 and 2006
Additional neonatal hospitalcosts: infant dies beforedischarge
–22,834 Base case: neonatal hospital cost that would have been incurred by aneonatal fatality had preterm child survived; calculated by AG from Badgerdata.120,121 Alternative value: assumption of no costs, as in NICE 2015guideline model.24 Alternative value 2: from Khan et al.123
HCHS, Hospital and Community Health Service; OLS, ordinary least squares; UCLH, University College London Hospitals.NoteThe costs were adjusted using the HCHS indices117 to reflect the equivalent prices in 2016.
INDEPENDENT ECONOMIC ASSESSMENT
NIHR Journals Library www.journalslibrary.nihr.ac.uk
84

be for reasons as varied as nutrition, surgery, chest drains and congenital abnormalities. However, some ofthese other causes may be affected by ACSs but are not amenable to be formally accounted for in ourmodel owing to a lack of evidence. To that extent, any bias that may result from this assumption may belimited by the extent to which it compensates for those other unmeasured benefits of ACSs in our model.
Base-case analysesIn the base-case analysis, we consider the case of women presenting to a level 2 care hospital. This isbased on level 2 hospitals having the highest frequency of cases, given the mean gestational age atpresentation of 30 weeks. We set the prevalence rate of preterm birth within 7 days of testing at 3.0%and the prevalence rate of preterm birth at < 37 weeks’ gestation at 12.1%.92 In order to derive the costsand QALYs of PartoSure for comparison with fFN at 50 ng/ml (and other options in the full incrementalanalyses), we conducted an indirect comparison whereby the incremental costs and QALYs of PartoSurerelative to fFN at 50 ng/ml based on the test accuracy data from the study by Hadzi-Lega et al.44 wereadded to the costs and QALYs of Actim Partus based on the APOSTEL-1 data.42,43 Table 22 summarises themain model assumptions.
Scenario analysesWe explore the following scenario analyses:
l alternative study sources of test accuracy datal women presenting at tertiary-level unit hospitalsl limiting costs to the neonatal phasel limiting costs to the diagnostic phase (until delivery)l assuming that ACSs have (partial) benefits when administered earlier than 7 days before
preterm deliveryl excluding the neonatal hospital costs of infant deathl including mothers’ QALYs.
Probabilistic sensitivity analysesWe present probabilistic analyses using information on sampling uncertainty for test accuracy, costs andutilities presented in Tables 16, 17 and 19. These analyses are presented in terms of the relative frequencywith which each diagnostic test option had the highest net monetary benefit of all competing options.127
Results
Because our results vary by length of gestation, we present details for the base case of a symptomaticwoman presenting at 30 weeks’ gestation (the average age on diagnostic accuracy studies) and generalresults for longer (33 weeks) and shorter (26 weeks) gestation.
Base-case resultsThe base-case deterministic results are presented in Table 23. These are based on the preferredcomparative studies APOSTEL-142,43 and Hadzi-Lega et al.44 The base case considers women presenting at30 weeks’ gestation to a level 2 hospital. Although all incremental cost-effectiveness ratios (ICERs) arepositive, they should be interpreted with caution because, other than ‘treat all’ and fFN of 10 ng/ml versusfFN of 50 ng/ml, they represent a reduction in both costs and QALYs. Actim Partus results in £56,030 ofcost savings per QALY lost relative to fFN of 50 ng/ml, which are higher than those of fFN of 200 ng/ml(£25,209) and fFN of 500 ng/ml (£17,025). The costs savings and QALY losses for PartoSure versus fFN of50 ng/ml are the result of an indirect comparison between the studies by Bruijn et al.42,43 and Hadzi-Legaet al.,44 because no included study directly compares these two tests. Subject to this caveat, PartoSurewould produce the same QALY loss but more cost savings than Actim Partus, relative to fFN of 50 ng/ml.
DOI: 10.3310/hta23130 HEALTH TECHNOLOGY ASSESSMENT 2019 VOL. 23 NO. 13
© Queen’s Printer and Controller of HMSO 2019. This work was produced by Varley-Campbell et al. under the terms of a commissioning contract issued by the Secretary of Statefor Health and Social Care. This issue may be freely reproduced for the purposes of private research and study and extracts (or indeed, the full report) may be included inprofessional journals provided that suitable acknowledgement is made and the reproduction is not associated with any form of advertising. Applications for commercialreproduction should be addressed to: NIHR Journals Library, National Institute for Health Research, Evaluation, Trials and Studies Coordinating Centre, Alpha House, University ofSouthampton Science Park, Southampton SO16 7NS, UK.
85

TABLE 22 The PenTAG model specifications and assumptions
Model feature/parameterBase-case modelspecification/assumption Comment
Patient population Symptomatic women with intactmembranes presenting to a level 2hospital, who have not been ruled forpreterm labour after clinical examination
Clinical examination is not a relevantcomparator for this population because itprecedes the starting point of the analysis
Scenario analyses consider womenpresenting at level 1 and 2 hospitals
Time horizon Lifetime Scenario analyses limit the horizon todelivery and alternatively to neonatalhospital discharge
Diagnostic test protocol/guideline
Complete adherence of treatmentdecisions to results of diagnostic test
Differences in clinicaloutcomes between testoptions are the result ofdifferences in test sensitivity
Differences in true-positive rates result indifferences in neonatal mortality andneonatal morbidity outcome (and costs)through the timely use (within 7 days ofdelivery) of ACSs. Maternity costs aredependent on test sensitivity [i.e. falsenegatives (i.e. delivering within 7 daysafter a negative test result) are ‘missed’(do not receive ACS)]
We vary this assumption in the scenarioanalysis that limits the analytical horizon todelivery, so that neonatal outcomes andcosts are assumed to be the same acrossstrategies and the only difference is interms of maternity costs (i.e. differencesdepend only on test specificity)
Adverse events includedneonatal mortality andmorbidity
Outcomes considered are neonatal death,RDS and IVH
This is in line with the previous modelinforming the NICE guidelines on pretermlabour diagnosis and treatment (NICE 201524)
Neonatal mortality results innet savings to the NHS
Saving a neonatal life through accuratediagnosis and timely ACS treatment, hasthe consequence of increasing NHS costs,because the infant saved stays longer inneonatal hospital (although at a slightlyless intensive average level of care per day)
In scenario analyses, we explore the impacton results of assuming that saving a childdoes not incur additional costs
ACSs are effective only if givenwithin 7 days of delivery
Infants born more than 7 days aftertesting positive do not benefit from ACSs
In scenario analysis, we allow for partialbenefit from ACSs for those testingpositive and given ACS earlier than 7 daysbefore preterm birth (i.e. at < 37 weeks)
In utero transfers are onlyrequired for womenpresenting to a level 1/2hospital at < 28 weeks’gestation
Transfer to a tertiary hospital This is in line with NICE guidelines24
Tocolysis Only used for in utero transfers; noconsequences on clinical effects, only oncosts
This is intended to reflect emergingconsensus about the benefit–risk profile oftocolysis
Long-term costs Only included those associated with IVH In line with the model informing the NICE2015 guideline24 of preterm labourdiagnosis and treatment
Long-term quality of life Assumed that those who survivebeyond 1 year of life achieve the averagelong-term quality of life in the generalpopulation, regardless of preterm birthstatus
In line with the model informing the NICE2015 guideline24 of preterm labourdiagnosis and treatment; plausibilitysupported with clinical experts’ opinion
INDEPENDENT ECONOMIC ASSESSMENT
NIHR Journals Library www.journalslibrary.nihr.ac.uk
86
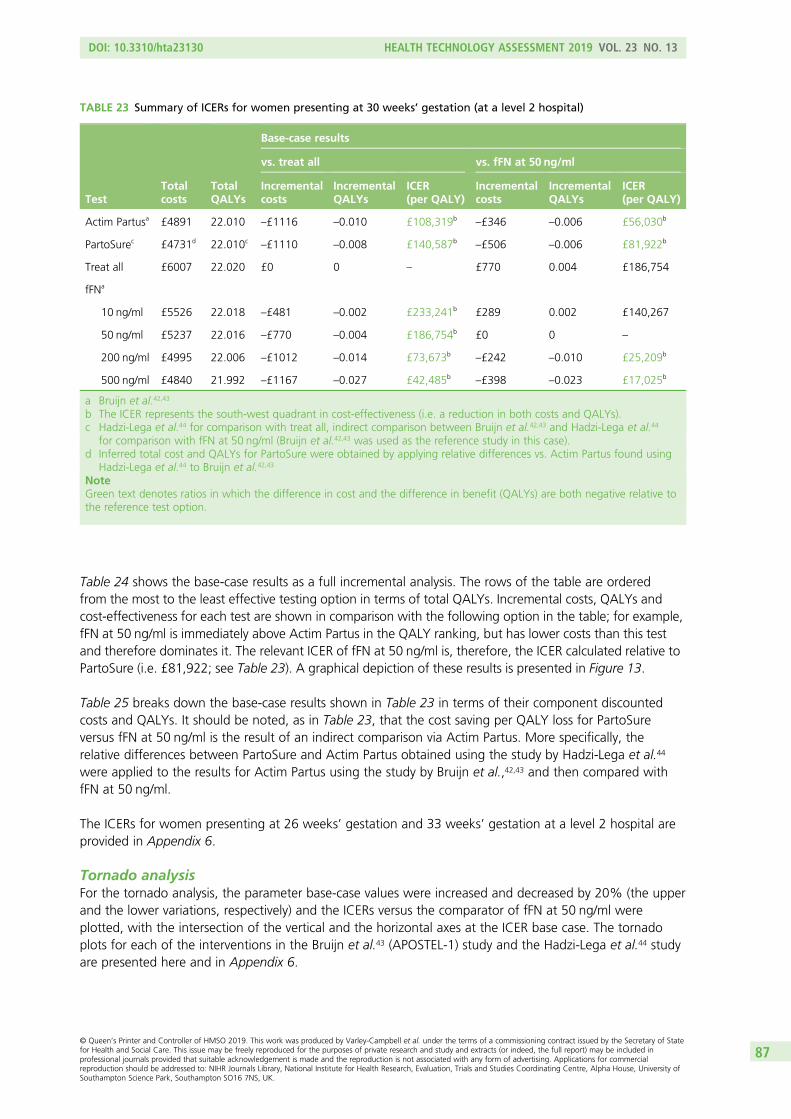
Table 24 shows the base-case results as a full incremental analysis. The rows of the table are orderedfrom the most to the least effective testing option in terms of total QALYs. Incremental costs, QALYs andcost-effectiveness for each test are shown in comparison with the following option in the table; for example,fFN at 50 ng/ml is immediately above Actim Partus in the QALY ranking, but has lower costs than this testand therefore dominates it. The relevant ICER of fFN at 50 ng/ml is, therefore, the ICER calculated relative toPartoSure (i.e. £81,922; see Table 23). A graphical depiction of these results is presented in Figure 13.
Table 25 breaks down the base-case results shown in Table 23 in terms of their component discountedcosts and QALYs. It should be noted, as in Table 23, that the cost saving per QALY loss for PartoSureversus fFN at 50 ng/ml is the result of an indirect comparison via Actim Partus. More specifically, therelative differences between PartoSure and Actim Partus obtained using the study by Hadzi-Lega et al.44
were applied to the results for Actim Partus using the study by Bruijn et al.,42,43 and then compared withfFN at 50 ng/ml.
The ICERs for women presenting at 26 weeks’ gestation and 33 weeks’ gestation at a level 2 hospital areprovided in Appendix 6.
Tornado analysisFor the tornado analysis, the parameter base-case values were increased and decreased by 20% (the upperand the lower variations, respectively) and the ICERs versus the comparator of fFN at 50 ng/ml wereplotted, with the intersection of the vertical and the horizontal axes at the ICER base case. The tornadoplots for each of the interventions in the Bruijn et al.43 (APOSTEL-1) study and the Hadzi-Lega et al.44 studyare presented here and in Appendix 6.
TABLE 23 Summary of ICERs for women presenting at 30 weeks’ gestation (at a level 2 hospital)
TestTotalcosts
TotalQALYs
Base-case results
vs. treat all vs. fFN at 50 ng/ml
Incrementalcosts
IncrementalQALYs
ICER(per QALY)
Incrementalcosts
IncrementalQALYs
ICER(per QALY)
Actim Partusa £4891 22.010 –£1116 –0.010 £108,319b–£346 –0.006 £56,030b
PartoSurec £4731d 22.010c–£1110 –0.008 £140,587b
–£506 –0.006 £81,922b
Treat all £6007 22.020 £0 0 – £770 0.004 £186,754
fFNa
10 ng/ml £5526 22.018 –£481 –0.002 £233,241b £289 0.002 £140,267
50 ng/ml £5237 22.016 –£770 –0.004 £186,754b £0 0 –
200 ng/ml £4995 22.006 –£1012 –0.014 £73,673b–£242 –0.010 £25,209b
500 ng/ml £4840 21.992 –£1167 –0.027 £42,485b–£398 –0.023 £17,025b
a Bruijn et al.42,43
b The ICER represents the south-west quadrant in cost-effectiveness (i.e. a reduction in both costs and QALYs).c Hadzi-Lega et al.44 for comparison with treat all, indirect comparison between Bruijn et al.42,43 and Hadzi-Lega et al.44
for comparison with fFN at 50 ng/ml (Bruijn et al.42,43 was used as the reference study in this case).d Inferred total cost and QALYs for PartoSure were obtained by applying relative differences vs. Actim Partus found using
Hadzi-Lega et al.44 to Bruijn et al.42,43
NoteGreen text denotes ratios in which the difference in cost and the difference in benefit (QALYs) are both negative relative tothe reference test option.
DOI: 10.3310/hta23130 HEALTH TECHNOLOGY ASSESSMENT 2019 VOL. 23 NO. 13
© Queen’s Printer and Controller of HMSO 2019. This work was produced by Varley-Campbell et al. under the terms of a commissioning contract issued by the Secretary of Statefor Health and Social Care. This issue may be freely reproduced for the purposes of private research and study and extracts (or indeed, the full report) may be included inprofessional journals provided that suitable acknowledgement is made and the reproduction is not associated with any form of advertising. Applications for commercialreproduction should be addressed to: NIHR Journals Library, National Institute for Health Research, Evaluation, Trials and Studies Coordinating Centre, Alpha House, University ofSouthampton Science Park, Southampton SO16 7NS, UK.
87
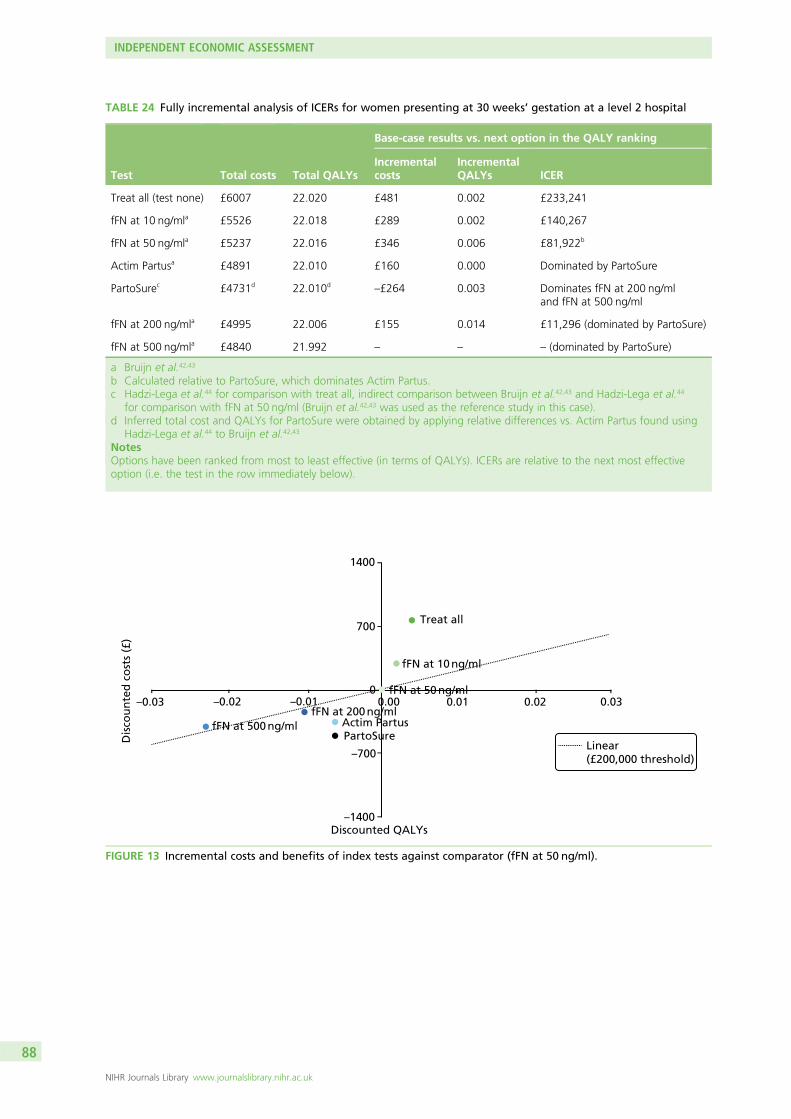
Dis
cou
nte
d c
ost
s (£
)
Discounted QALYs
Linear(£200,000 threshold)
1400
700Treat all
–0.03 –0.02 –0.01
–700
–1400
0.000
0.01 0.02 0.03
fFN at 10 ng/ml
fFN at 50 ng/ml
fFN at 500 ng/mlfFN at 200 ng/ml
Actim PartusPartoSure
FIGURE 13 Incremental costs and benefits of index tests against comparator (fFN at 50 ng/ml).
TABLE 24 Fully incremental analysis of ICERs for women presenting at 30 weeks’ gestation at a level 2 hospital
Test Total costs Total QALYs
Base-case results vs. next option in the QALY ranking
Incrementalcosts
IncrementalQALYs ICER
Treat all (test none) £6007 22.020 £481 0.002 £233,241
fFN at 10 ng/mla £5526 22.018 £289 0.002 £140,267
fFN at 50 ng/mla £5237 22.016 £346 0.006 £81,922b
Actim Partusa £4891 22.010 £160 0.000 Dominated by PartoSure
PartoSurec £4731d 22.010d–£264 0.003 Dominates fFN at 200 ng/ml
and fFN at 500 ng/ml
fFN at 200 ng/mla £4995 22.006 £155 0.014 £11,296 (dominated by PartoSure)
fFN at 500 ng/mla £4840 21.992 – – – (dominated by PartoSure)
a Bruijn et al.42,43
b Calculated relative to PartoSure, which dominates Actim Partus.c Hadzi-Lega et al.44 for comparison with treat all, indirect comparison between Bruijn et al.42,43 and Hadzi-Lega et al.44
for comparison with fFN at 50 ng/ml (Bruijn et al.42,43 was used as the reference study in this case).d Inferred total cost and QALYs for PartoSure were obtained by applying relative differences vs. Actim Partus found using
Hadzi-Lega et al.44 to Bruijn et al.42,43
NotesOptions have been ranked from most to least effective (in terms of QALYs). ICERs are relative to the next most effectiveoption (i.e. the test in the row immediately below).
INDEPENDENT ECONOMIC ASSESSMENT
NIHR Journals Library www.journalslibrary.nihr.ac.uk
88
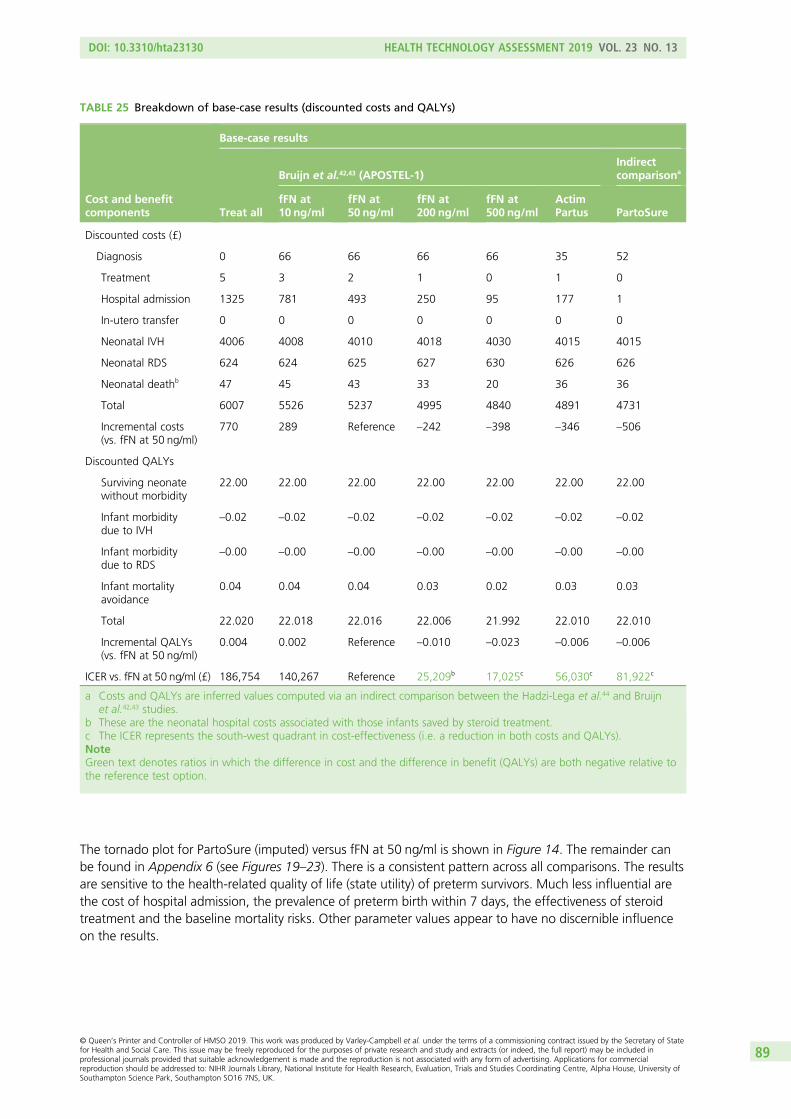
The tornado plot for PartoSure (imputed) versus fFN at 50 ng/ml is shown in Figure 14. The remainder canbe found in Appendix 6 (see Figures 19–23). There is a consistent pattern across all comparisons. The resultsare sensitive to the health-related quality of life (state utility) of preterm survivors. Much less influential arethe cost of hospital admission, the prevalence of preterm birth within 7 days, the effectiveness of steroidtreatment and the baseline mortality risks. Other parameter values appear to have no discernible influenceon the results.
TABLE 25 Breakdown of base-case results (discounted costs and QALYs)
Cost and benefitcomponents
Base-case results
Treat all
Bruijn et al.42,43 (APOSTEL-1)Indirectcomparisona
fFN at10 ng/ml
fFN at50 ng/ml
fFN at200 ng/ml
fFN at500 ng/ml
ActimPartus PartoSure
Discounted costs (£)
Diagnosis 0 66 66 66 66 35 52
Treatment 5 3 2 1 0 1 0
Hospital admission 1325 781 493 250 95 177 1
In-utero transfer 0 0 0 0 0 0 0
Neonatal IVH 4006 4008 4010 4018 4030 4015 4015
Neonatal RDS 624 624 625 627 630 626 626
Neonatal deathb 47 45 43 33 20 36 36
Total 6007 5526 5237 4995 4840 4891 4731
Incremental costs(vs. fFN at 50 ng/ml)
770 289 Reference –242 –398 –346 –506
Discounted QALYs
Surviving neonatewithout morbidity
22.00 22.00 22.00 22.00 22.00 22.00 22.00
Infant morbiditydue to IVH
–0.02 –0.02 –0.02 –0.02 –0.02 –0.02 –0.02
Infant morbiditydue to RDS
–0.00 –0.00 –0.00 –0.00 –0.00 –0.00 –0.00
Infant mortalityavoidance
0.04 0.04 0.04 0.03 0.02 0.03 0.03
Total 22.020 22.018 22.016 22.006 21.992 22.010 22.010
Incremental QALYs(vs. fFN at 50 ng/ml)
0.004 0.002 Reference –0.010 –0.023 –0.006 –0.006
ICER vs. fFN at 50 ng/ml (£) 186,754 140,267 Reference 25,209b 17,025c 56,030c 81,922c
a Costs and QALYs are inferred values computed via an indirect comparison between the Hadzi-Lega et al.44 and Bruijnet al.42,43 studies.
b These are the neonatal hospital costs associated with those infants saved by steroid treatment.c The ICER represents the south-west quadrant in cost-effectiveness (i.e. a reduction in both costs and QALYs).NoteGreen text denotes ratios in which the difference in cost and the difference in benefit (QALYs) are both negative relative tothe reference test option.
DOI: 10.3310/hta23130 HEALTH TECHNOLOGY ASSESSMENT 2019 VOL. 23 NO. 13
© Queen’s Printer and Controller of HMSO 2019. This work was produced by Varley-Campbell et al. under the terms of a commissioning contract issued by the Secretary of Statefor Health and Social Care. This issue may be freely reproduced for the purposes of private research and study and extracts (or indeed, the full report) may be included inprofessional journals provided that suitable acknowledgement is made and the reproduction is not associated with any form of advertising. Applications for commercialreproduction should be addressed to: NIHR Journals Library, National Institute for Health Research, Evaluation, Trials and Studies Coordinating Centre, Alpha House, University ofSouthampton Science Park, Southampton SO16 7NS, UK.
89
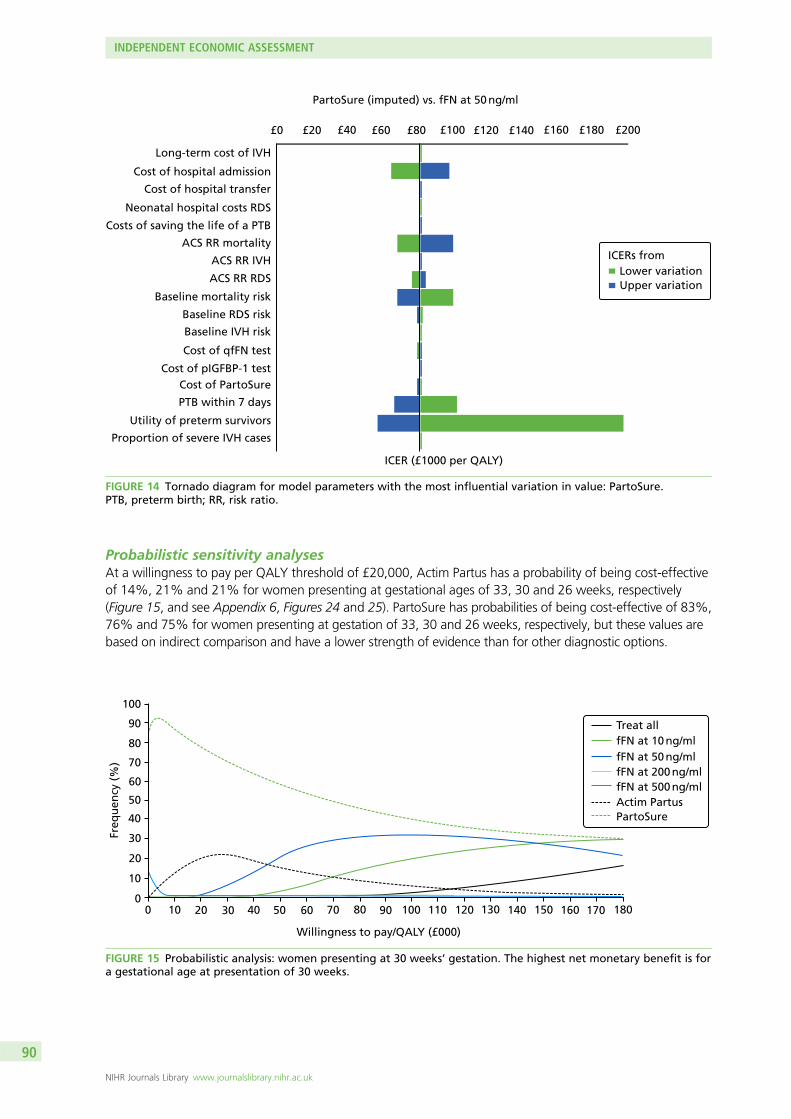
Probabilistic sensitivity analysesAt a willingness to pay per QALY threshold of £20,000, Actim Partus has a probability of being cost-effectiveof 14%, 21% and 21% for women presenting at gestational ages of 33, 30 and 26 weeks, respectively(Figure 15, and see Appendix 6, Figures 24 and 25). PartoSure has probabilities of being cost-effective of 83%,76% and 75% for women presenting at gestation of 33, 30 and 26 weeks, respectively, but these values arebased on indirect comparison and have a lower strength of evidence than for other diagnostic options.
Freq
uen
cy (
%)
100
90
80
70
60
50
40
30
20
10
00 10 20 30 40 50 60 70 80 90 100 110 120 130 140 150 160 170 180
Willingness to pay/QALY (£000)
Treat allfFN at 10 ng/mlfFN at 50 ng/mlfFN at 200 ng/mlfFN at 500 ng/mlActim PartusPartoSure
FIGURE 15 Probabilistic analysis: women presenting at 30 weeks’ gestation. The highest net monetary benefit is fora gestational age at presentation of 30 weeks.
PartoSure (imputed) vs. fFN at 50 ng/ml
Long-term cost of IVH
Cost of hospital admission
Cost of hospital transfer
Neonatal hospital costs RDS
Costs of saving the life of a PTB
ACS RR mortality
ACS RR IVH
ACS RR RDS
Baseline mortality risk
Baseline RDS risk
Baseline IVH risk
Cost of qfFN test
Cost of pIGFBP-1 testCost of PartoSure
PTB within 7 days
Utility of preterm survivors
Proportion of severe IVH cases
ICER (£1000 per QALY)
Lower variationUpper variation
£0 £20 £40 £60 £80 £100 £120 £140 £160 £180 £200
ICERs from
FIGURE 14 Tornado diagram for model parameters with the most influential variation in value: PartoSure.PTB, preterm birth; RR, risk ratio.
INDEPENDENT ECONOMIC ASSESSMENT
NIHR Journals Library www.journalslibrary.nihr.ac.uk
90
The treat-all option has a probability of being cost-effective of 0% at a willingness to pay per QALY thresholdof £20,000 for all women, and becomes the option with the highest likelihood of being cost-effective forwomen presenting at 26 weeks’ gestation only at a willingness to pay per QALY threshold of > £180,000.
Scenario analyses
Alternative diagnostic accuracy dataUsing the DTA results of the study by Cooper et al.,49 which did not include PartoSure, suggests that thefFN at 50 ng/ml test provides lower costs with equal health benefit when compared with Actim Partus.The option of treating all women compared with fFN at 50 ng/ml yields an ICER of £34,508 per QALY.
(Confidential information has been removed.) (See Appendix 6, Table 56.)
When the diagnostic accuracy data from the meta-analysis of the four studies that compared Actim Partuswith fFN at 50 ng/ml were used,42,43,51,56,57 Actim Partus was dominant over fFN at 50 ng/ml as it resulted incost savings of £41 per woman and health benefits of 0.01 more QALYs per woman. The treat-all optionincreased costs and QALYs and resulted in an ICER of £70,468.
Other scenariosIncluding the negative impact on QALY outcomes, the effect of an infant’s death on mothers (which isassumed to last for 10 years) favours options that involve more use of ACS treatment. That is, in Table 26(and see Appendix 6, Tables 63 and 64), the ICER for treat all and fFN at 10 ng/ml under the column ‘withmaternal QALYs for 10 years’ is lower than in the ‘base case’ column. When we limit the analytical horizonto the time of delivery, the assessment becomes in effect a cost-minimisation analysis because our modeldoes not account for health-related quality-of-life outcomes of the mother during the antenatal period.In this scenario, among women presenting at a gestational age of 30 weeks, PartoSure is the least costlyoption, with a £507 reduction in costs per woman, followed by fFN at 500 ng/ml (£400 reduction in costsper woman) and Actim Partus (£347 reduction in costs per woman). As discussed previously, the values forPartoSure need to be considered with caution.
When we allow for partial benefits of ACSs given earlier than 7 days before birth, the ICERs for fFN at10 ng/ml and treat all are £24,420 and £41,625, respectively, among women presenting at 30 weeks’gestation; as for the rest, only PartoSure results in savings per QALY lost of > £20,000 relative to fFN at50 ng/ml (see Table 26). Further details on the analyses of women presenting at a gestational age of26 weeks are presented in Appendix 6, Tables 54–56. Detailed results for women presenting at 33 weeks’gestation are presented in Appendix 6, Tables 57–59. Tornado analyses of these gestational age groupsare presented in Appendix 6, Additional deterministic sensitivity analyses, their associated probabilisticsensitivity analyses are presented in Appendix 6, Additional probabilistic sensitivity analyses, and otherscenarios are presented in Appendix 6, Scenario analyses.
DOI: 10.3310/hta23130 HEALTH TECHNOLOGY ASSESSMENT 2019 VOL. 23 NO. 13
© Queen’s Printer and Controller of HMSO 2019. This work was produced by Varley-Campbell et al. under the terms of a commissioning contract issued by the Secretary of Statefor Health and Social Care. This issue may be freely reproduced for the purposes of private research and study and extracts (or indeed, the full report) may be included inprofessional journals provided that suitable acknowledgement is made and the reproduction is not associated with any form of advertising. Applications for commercialreproduction should be addressed to: NIHR Journals Library, National Institute for Health Research, Evaluation, Trials and Studies Coordinating Centre, Alpha House, University ofSouthampton Science Park, Southampton SO16 7NS, UK.
91
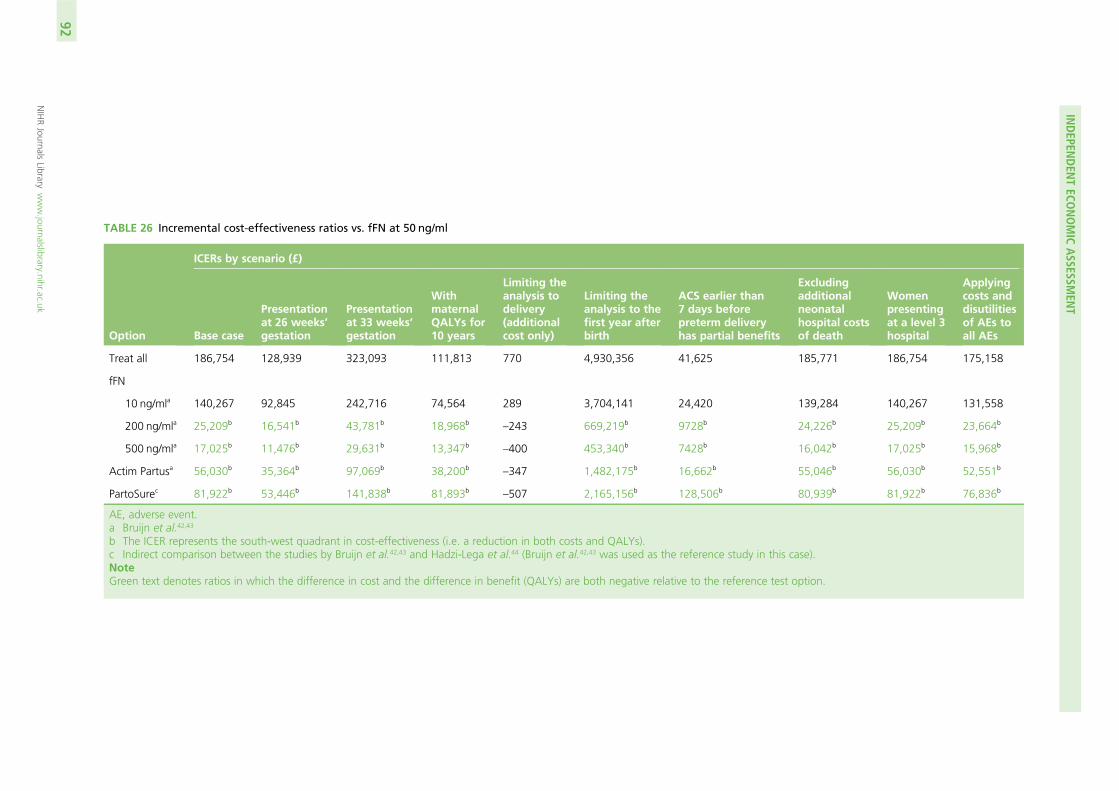
TABLE 26 Incremental cost-effectiveness ratios vs. fFN at 50 ng/ml
Option
ICERs by scenario (£)
Base case
Presentationat 26 weeks’gestation
Presentationat 33 weeks’gestation
WithmaternalQALYs for10 years
Limiting theanalysis todelivery(additionalcost only)
Limiting theanalysis to thefirst year afterbirth
ACS earlier than7 days beforepreterm deliveryhas partial benefits
Excludingadditionalneonatalhospital costsof death
Womenpresentingat a level 3hospital
Applyingcosts anddisutilitiesof AEs toall AEs
Treat all 186,754 128,939 323,093 111,813 770 4,930,356 41,625 185,771 186,754 175,158
fFN
10 ng/mla 140,267 92,845 242,716 74,564 289 3,704,141 24,420 139,284 140,267 131,558
200 ng/mla 25,209b 16,541b 43,781b 18,968b–243 669,219b 9728b 24,226b 25,209b 23,664b
500 ng/mla 17,025b 11,476b 29,631b 13,347b–400 453,340b 7428b 16,042b 17,025b 15,968b
Actim Partusa 56,030b 35,364b 97,069b 38,200b–347 1,482,175b 16,662b 55,046b 56,030b 52,551b
PartoSurec 81,922b 53,446b 141,838b 81,893b–507 2,165,156b 128,506b 80,939b 81,922b 76,836b
AE, adverse event.a Bruijn et al.42,43
b The ICER represents the south-west quadrant in cost-effectiveness (i.e. a reduction in both costs and QALYs).c Indirect comparison between the studies by Bruijn et al.42,43 and Hadzi-Lega et al.44 (Bruijn et al.42,43 was used as the reference study in this case).NoteGreen text denotes ratios in which the difference in cost and the difference in benefit (QALYs) are both negative relative to the reference test option.
INDEPEN
DEN
TECO
NOMIC
ASSESSM
ENT
NIHRJournals
Librarywww.journalslibrary.nihr.ac.uk
92

Chapter 7 Assessment of factors relevant to theNHS and other parties
l The practical considerations when conducting these tests, highlighted to us by our advisingobstetricians, were:
¢ The qfFN swab can be collected at an appropriate time (e.g. when a woman is being examined)and, if the clinician decides it is best to ‘wait and see’ for a few hours, the sample can be stored.Using the pack to collect the sample is free; it is only when the cassette is opened to run the testthat a cost is incurred by the hospital.
¢ Manufacturing guidance from Actim Partus suggests that the swab should be collected fromthe cervical os. Visualising the cervix can sometimes be difficult; therefore, it may not always bepractical to take the sample from the cervical os as advised.
l Some of these tests have a dual purpose because they can be used for other indications (e.g. womenwith multifetal pregnancies, women with ruptured membranes and women not presenting withsymptoms). Our population is not representative of the whole population of women presenting withthreatened preterm labour. However, it is recognised that treatment of these other populations mayinvolve different management strategies.
l It is highlighted that new diagnostic test options for diagnosing preterm labour and predicting pretermbirth are likely to have spillover and feedback effects between maternity and neonatal care services.A proper evaluation of the potential impact of these tests would therefore need to account for thepossibilities offered in the context of more integrated networks of maternity and neonatal services.
l There are potential implications of adopting new biochemical tests on neonatal unit workload andservice planning.
l Health-care service and travel needs and costs are borne by patients and relatives owing to changes inin utero transfer policy resulting from new tests. This includes the effect on the likelihood that a verypreterm infant is born in a hospital with an inadequate level of specialisation, and the cost and healthconsequences associated with postnatal transfers.
l There are effects on resource use in other parts of the public services (e.g. educational services) associatedwith improvements in preterm birth survival rates and avoidance of neonatal long-term morbidity.
l There are long-term parental and societal economic impacts.l There are equity implications of changes in hospital admissions across rural and urban areas.
DOI: 10.3310/hta23130 HEALTH TECHNOLOGY ASSESSMENT 2019 VOL. 23 NO. 13
© Queen’s Printer and Controller of HMSO 2019. This work was produced by Varley-Campbell et al. under the terms of a commissioning contract issued by the Secretary of Statefor Health and Social Care. This issue may be freely reproduced for the purposes of private research and study and extracts (or indeed, the full report) may be included inprofessional journals provided that suitable acknowledgement is made and the reproduction is not associated with any form of advertising. Applications for commercialreproduction should be addressed to: NIHR Journals Library, National Institute for Health Research, Evaluation, Trials and Studies Coordinating Centre, Alpha House, University ofSouthampton Science Park, Southampton SO16 7NS, UK.
93


Chapter 8 Patient and public involvement
Patient and public involvement was not conducted for this project. This research project was part ofthe NICE Diagnostics Assessment programme in which, from the publication of the scope in week 12,
there were 24 weeks in which to prepare the entire report. Regrettably, it was not logistical nor feasibleto recruit and prepare for and report patient and public involvement in this project within the permittedtime frame. Patients and the public were involved in the NICE Diagnostic Advisory Committee meetings,in which recommendations based on this report were made.
DOI: 10.3310/hta23130 HEALTH TECHNOLOGY ASSESSMENT 2019 VOL. 23 NO. 13
© Queen’s Printer and Controller of HMSO 2019. This work was produced by Varley-Campbell et al. under the terms of a commissioning contract issued by the Secretary of Statefor Health and Social Care. This issue may be freely reproduced for the purposes of private research and study and extracts (or indeed, the full report) may be included inprofessional journals provided that suitable acknowledgement is made and the reproduction is not associated with any form of advertising. Applications for commercialreproduction should be addressed to: NIHR Journals Library, National Institute for Health Research, Evaluation, Trials and Studies Coordinating Centre, Alpha House, University ofSouthampton Science Park, Southampton SO16 7NS, UK.
95

Chapter 9 Discussion
Review of test accuracy evidence
This is the first review to systematically review the biomarker tests Actim Partus, PartoSure and qfFN(at thresholds other than 50 ng/ml) together.
A summary of the key findings from the systematic review of test accuracy evidence can be found inChapter 2, Summary. In brief, 20 included studies evaluated an index test against the 7-day referencestandard41–62 and seven studies evaluated an index test against a 48-hour reference standard.41,48,52,53,56–58
There was sufficient evidence for pooling the test accuracy data for Actim Partus and PartoSure onlyagainst the 7-day reference standard and Actim Partus only against the 48-hour reference standard.However, owing to the substantial methodological, clinical and statistical heterogeneity between studiesand large 95% prediction regions (Actim Partus against the 7-day reference standard) and wide 95% CIs(PartoSure against the 7-day reference standard and Actim Partus against the 48-hour reference standard),there are considerable uncertainties surrounding the validity of these results.
The studies that offered the greatest certainty when looking to compare test accuracy results were thosethat assessed two or more different tests within the same population. We identified two such studies:APOSTEL-142,43 (2016; assessing Actim Partus and qfFN) and the study by Hadzi-Lega et al.44 (2017;assessing Actim Partus and PartoSure). No studies assessing qfFN and PartoSure within the samepopulation were identified by our review. From APOSTEL-1, the sensitivity was superior for qfFN at thethresholds of 10 and 50 ng/ml compared with Actim Partus, whereas Actim Partus had a superiorsensitivity compared with qfFN at the 200-ng/ml and 500-ng/ml thresholds. Specificity was superior usingActim Partus compared with qfFN at the thresholds of 10, 50 and 200 ng/ml but not against the thresholdof 500 ng/ml. From the study by Hadzi-Lega et al.,44 the sensitivities were the same for PartoSure andActim Partus, whereas the specificity was superior using PartoSure. However, the CIs for all sensitivity andspecificity data from the two tests assessed within these two studies overlapped considerably (all dataavailable in Table 9).
When looking at the ranges of results for individual tests across studies, substantial heterogeneity betweenthe studies is clearly apparent. For Actim Partus against the 7-day reference standard (16 studies), the studywith the best overall sensitivity and specificity results was that by Tripathi et al.57 [sensitivity 94.7% (95% CI89.9% to 97.7%) and specificity 92.4% (95% CI 88.% to 95.1%)], whereas Cooper et al.49 reported theworst sensitivity [33.3% (95% CI 4.3% to 77.7%)] and specificity [74.1% (95% CI 69.1% to 78.6%)]. Theseare two of the three largest studies identified in our review (Tripathi et al.,57 n = 468; Cooper et al.,49 n = 349).For PartoSure against the 7-day reference standard (four studies), the study with the best overall sensitivityand specificity results was that by Bolotskikh and Borisova59 (2017) [sensitivity 100.0% (95% CI 73.5% to100.0%) and specificity 95.4% (95% CI 88.6% to 98.7%)], whereas Werlen et al.41 reported the worstsensitivity [0.0% (95% CI 0.0% to 97.5%)] and specificity [97.5% (95% CI 96.8% to 99.9%)]. The lowsensitivity from the study by Werlen et al.41 is attributable to only one woman delivering preterm (within7 days) and her testing (falsely) negative within the study sample of size 41. If discounting the results from thestudy by Werlen et al.,41 the next study reporting the worst overall sensitivity and specificity results was thatby Nikolova et al.60,61 (2015) [sensitivity 80.0% (95% CI 63.1% to 91.6%) and specificity 94.6% (95% CI90.1% to 97.5%)]. The fFN at a threshold of 10 ng/ml (two studies) had a sensitivity range of 93.8% (95% CI82.8% to 98.7%) to 95.7% (95% CI 87.8% to 99.1%) and a specificity range of 32.2% (95% CI 27.7% to37.0%) to 42.3% (95% CI 36.5% to 48.4%). At a threshold of 200 ng/ml, fFN had had a sensitivity range of70.8% (95% CI 55.9% to 83.0%) to 71.0% (95% CI 58.8% to 81.3%) and a specificity range of 78.6%(95% CI 74.3% to 82.5%) to 83.6% (95% CI 78.8% to 87.8%). At a threshold of 500 ng/ml, fFN had a
DOI: 10.3310/hta23130 HEALTH TECHNOLOGY ASSESSMENT 2019 VOL. 23 NO. 13
© Queen’s Printer and Controller of HMSO 2019. This work was produced by Varley-Campbell et al. under the terms of a commissioning contract issued by the Secretary of Statefor Health and Social Care. This issue may be freely reproduced for the purposes of private research and study and extracts (or indeed, the full report) may be included inprofessional journals provided that suitable acknowledgement is made and the reproduction is not associated with any form of advertising. Applications for commercialreproduction should be addressed to: NIHR Journals Library, National Institute for Health Research, Evaluation, Trials and Studies Coordinating Centre, Alpha House, University ofSouthampton Science Park, Southampton SO16 7NS, UK.
97
sensitivity range of 29.2% (95% CI 17.0% to 44.1%) to 42.0% (95% CI 30.2% to 54.5%) and a specificityrange of 94.3% (95% CI 91.6% to 96.4%) to 95.7% (95% CI 92.7% to 97.8%). Looking at these data,given the large ranges between studies assessing the same test and the wide CIs, it would be premature toattempt to deduce which test was superior to the 7-day reference standard.
We were able to assess Actim Partus and PartoSure only against the 48-hour reference standard because nostudies were identified for qfFN. From the single PartoSure study (Werlen et al.41), the sensitivity was 0.0%(95% CI 0.0% to 97.5%) and specificity was 97.5% (95% CI 86.8% to 99.9%); the total sample size was41 and only one test result was positive (a false positive). From the six Actim Partus studies, the data could bepooled; however, the same heterogeneity issues as with studies against the 7-day reference standard wererelevant here too. Looking at Actim Partus against the 48-hour reference standard (six studies), the studywith the best overall sensitivity and specificity results was that by Tripathi et al.57 [sensitivity 95.5% (95% CI89.7% to 98.5%) and specificity 82.1% (95% CI 77.8% to 86.0%)], whereas Goyal et al.52 reported theworst sensitivity [65.7% (95% CI 47.8% to 80.9%)] and specificity [56.0% (95% CI 34.9% to 75.6%)].Given that we identified only a single study for PartoSure and the wide range of test accuracy data betweenthe study reporting the best and worst results for Actim Partus, it would be premature to attempt to deducewhich test was superior to the 48-hour reference standard.
We identified two relatively recent systematic reviews128,129 that assessed fFN at a threshold of 50 ng/ml(i.e. current practice). Both of these reviews suffered from similar heterogeneity issues as our review andtheir summary ROC plots displayed large 95% prediction regions. The pooled sensitivities for the reviewsby Boots et al.129 and Sanchez-Ramos et al.128 were 75% (95% CI 69% to 80%) and 76.1% (95% CI69.1% to 81.9%), respectively, and the specificities were 79% (95% CI 76% to 83%) and 81.9% (95% CI78.9% to 84.5%), respectively.
Both the study’s heterogeneity and the uncertainty about the true accuracy of the index tests inevitablycompromise the report’s ability to firmly conclude whether or not the accuracy of the index tests is betterthan current practice.
StrengthsThe strengths of this systematic review are that it was conducted by an independent, experienced researchteam using the latest evidence and working to a prespecified protocol (PROSPERO CRD42017072696) thatfollows a robust methodology.
The search strategy was devised by a dedicated information specialist. The strategy did not restrict by studydesign and included both forward and backward citation chasing, web searching and cross-checking withstudies provided by the companies. The studies were independently screened by two reviewers, with dataextraction and quality appraisal conducted by one reviewer and checked by a second.
WeaknessesThe primary weakness of the review of test accuracy was the substantial methodological and clinicalheterogeneity between included studies. There was considerable heterogeneity in the following areas:prevalence of preterm birth, mode of delivery, gestational age, definition (symptoms) of preterm labour(including dilatation threshold), inclusion of multiple gestations, participant characteristics and provision oftreatments. As a consequence, the reported accuracies of individual tests varied widely, and hence the CIsin the pooled analyses are also wide. Subsequently, we have limited confidence in the mean pooled testaccuracy results.
A limitation to our review was the lack of published studies in which two or more index tests wereadministered to the same population. Such studies allow us to have more confidence in any differencesbetween the accuracy results of the tests as differences would not be attributable to population or studydesign. Only two studies, APOSTEL-142,43 (2016) and Hadzi-Lega et al.44 (2017), assessed the DTA of twodifferent index tests in the same population; APOSTEL-142,43 assessed both Actim Partus and qfFN and
DISCUSSION
NIHR Journals Library www.journalslibrary.nihr.ac.uk
98

Hadzi-Lega et al.44 assessed Actim Partus and PartoSure. We did not identify any studies in which all threetests were used in the same population.
Our review was also limited by the lower number of published studies for qfFN (two studies) and PartoSure(four studies) than for Actim Partus (16 studies) against the 7-day reference standard. In addition, fewerstudies published data against the 48-hour reference standard, with only seven studies being identified(six for Actim Partus and one for PartoSure). Meta-analysis of test accuracy data requires a minimum offour studies; therefore, the scope for meta-analysis was restricted. We are aware of three studies publishedafter our searches were run that assessed PartoSure (Wing et al.,130 Lofti et al.131 and Melchor et al.132) and(confidential information has been removed). We also identified seven relevant ongoing trials, four ofwhich are UK based, of which two plan to enrol > 1000 participants. Personal communications with trialorganisers (Dr Sarah Stock, University of Edinburgh, 2017, and Professor Andrew Shennan, King’s CollegeLondon, 2017) indicated that data from the two large UK trials (QUIDS/QUIDS-2 assessing PartoSure, ActimPartus and qfFN and PETRA assessing qfFN) were expected in 2018. There is the potential, should ouranalyses be re-run using the data from these trials, that the estimates of relative test accuracy may change.
The scope issued by NICE12 asked for an assessment of test accuracy of qfFN at thresholds other than50 ng/ml. Our capabilities to look at different thresholds was limited by those reported in the publishedstudies. The two qfFN studies both used thresholds of 10, 50, 200 and 500 ng/ml. Without access to theindividual patient data, we were unable to assess any other thresholds.
Owing to the paucity of published test accuracy studies, we made two protocol amendments. The first wasto include women with multiple gestations (up to 20% of the total population). Without this amendment,there would have been no includable qfFN studies. The second was to include studies in which testingwas not carried out in line with clinical practice (i.e. the samples were frozen and analysed at a later date).Without this amendment, we would have had only one includable qfFN study (Bruijn et al.62).
Dependent on how the data were reported in each study, we were required to conduct some datamanipulations. Most studies reported the raw true-positive, true-negative, false-positive and false-negativedata, enabling us to calculate additional test accuracy statistics, such as sensitivity, specificity, PPV and NPV.However, four studies48,54,56,57 reported only sensitivity, specificity, PPV and NPV. We back-calculated fromthese statistics to derive the true-positive, true-negative, false-positive and false-negative values, which wererequired in our review. All the raw data as reported in the published studies are available in Appendix 3(see Tables 33 and 34).
Our review limited included studies to those published in the English language. This may be considered alimitation; however, a systematic review assessing the bias of excluding studies that were not in the Englishlanguage found no evidence of bias but that there may have been an impact on precision.133 Our reviewdid include a French study (Werlen et al.41), as a certified translation was received from the manufacturer(Parsagen Diagnostics Inc.).
Areas of uncertaintyThere is considerable uncertainty surrounding the generalisability of the studies to the UK population.Most specifically, none of the included studies was conducted in the UK. In addition, the prevalence ratesof preterm birth in our included studies ranged from 2% to 73%. UK prevalence is approximately 8%.These differences in prevalence between studies are probably attributable to the differences in thepopulations recruited into the studies (e.g. differences in gestational age, in presenting symptoms ofpreterm labour and in recruitment of high- or low-risk women). It is likely that the prevalence of pretermbirth will have an impact on the DTA data presented in Chapter 2, Results of quantitative data synthesis(test accuracy data).134 Indeed, Leeflang et al.134 explored how sensitivity and specificity vary with diseaseprevalence, and suggested using prevalence as a guide when selecting studies that most closely matchthe situation under assessment.
DOI: 10.3310/hta23130 HEALTH TECHNOLOGY ASSESSMENT 2019 VOL. 23 NO. 13
© Queen’s Printer and Controller of HMSO 2019. This work was produced by Varley-Campbell et al. under the terms of a commissioning contract issued by the Secretary of Statefor Health and Social Care. This issue may be freely reproduced for the purposes of private research and study and extracts (or indeed, the full report) may be included inprofessional journals provided that suitable acknowledgement is made and the reproduction is not associated with any form of advertising. Applications for commercialreproduction should be addressed to: NIHR Journals Library, National Institute for Health Research, Evaluation, Trials and Studies Coordinating Centre, Alpha House, University ofSouthampton Science Park, Southampton SO16 7NS, UK.
99

Our ongoing trial searches identified four relevant ongoing UK trials, two of which are very large(> 1000 participants) and their results are anticipated to be published in 2018 (PETRA and QUIDS).
There is some uncertainty around whether or not the studies included in the review will be representativeof women who do not (or cannot) have access to cervical length measurement. No studies were identifiedthat were specifically based on such a population; the majority of studies did not mention access tocervical length measurement, seven studies used (but did not select participants based on) cervical lengthmeasurement and two studies only included women with a transvaginal cervical length measurementof ≤ 30 mm. It is in these final two studies (APOSTEL-142,43 and Danti et al.50) in which there is mostuncertainty; selection based on cervical length measurement would probably increase the prevalence ofpreterm birth in these studies. However, given that 15 of the 20 included studies had a prevalence rateof < 25% and both studies had a prevalence of < 25% (APOSTEL-1,42,43 19.7%; Danti et al.,50 6.7%), it isunlikely that these criteria had an impact on prevalence rates.
There was also uncertainty around whether or not any management strategies (e.g. treatments) wouldincorrectly inflate false-positive rates. As described in Chapter 2, Summary of any treatments given, thetypes of treatments offered to women in threatened preterm labour differed between each study, as didthe level of detail describing what and who received the treatments. More often than not, the treatmentoptions were at the clinician’s discretion. It is most likely that the tocolytic treatments would have thebiggest impact on incorrectly inflating the false-positive rate, as their purpose is to delay delivery.
It is understood that clinicians would use the results of these tests in combination with other clinicalinformation to make clinical decisions. A mobile application called QUIPP is used in local clinical practice toassist with decision-making. The QUIPP app generates a risk score from the following information: whetheror not the mother is symptomatic, number of fetuses, gestation in weeks and days, qfFN value and/orcervical length measurement. In our review, we did not consider combining test results with such clinicaldata, because no studies were identified that assessed this combination.
We also acknowledge four studies of PartoSure and quantitative/qualitative fFN that have been recentlypublished or are due to be published. These studies were published after our searches were run andconsequently were not eligible for the review. The studies are:
l Wing et al.130 (2017), n = 796 – PartoSure and fFN at 50 ng/mll Lofti et al.131 (2017), n = 132 – PartoSurel Melchor et al.132 (2017), n = 420 – PartoSure and fFN at 50 ng/mll (confidential information has been removed).
Review of clinical effectiveness evidence
No studies were identified that met the inclusion criteria of this review.
StrengthsThe review was conducted by an experienced research team and the conducted searches were verysensitive as no study design filters were used. All citations were screened by at least two members of thereview team. The review team worked to a prespecified prospective protocol.
WeaknessesThe review focused on published literature indexed by bibliographic databases, meaning that greyliterature was not identified. The searches were conducted in July 2017, so it is possible that studies havebeen published and indexed subsequently that have not been identified.
DISCUSSION
NIHR Journals Library www.journalslibrary.nihr.ac.uk
100
Areas of uncertaintyBecause no studies were identified for inclusion, we were unable to assess whether or not using thesebiomarker tests for predicting preterm labour is clinically effective (i.e. whether or not they would improvehealth outcomes).
Review of cost-effectiveness evidence
Only one conference abstract was identified that was relevant to our cost-effectiveness review.66
StrengthsOur review was able to highlight the major developments in methodological practice. Studies have evolvedfrom evaluating only the cost differences of diagnostic strategies, so that competing options were selectedsolely on the basis of their ability to rule out cases of unnecessary treatment and admission, to evaluatingthe neonatal health implications of missing the rare cases of true preterm labour. A clear finding from thereview was the limited information that most previous economic analyses provide for guiding decision-making. With one exception (the model that informed the 2015 NICE guidelines24 on diagnosis andtreatment of preterm labour), the previous studies do not account for the gestational age gradient inneonatal mortality and morbidity risk exposure and its consequences for cost-effectiveness.
Furthermore, previous models did not account for the variation in costs and benefits of diagnostic testingacross hospital settings.
Our results also highlight the need to account for the neonatal hospital cost implications of saving apreterm infant, which no previous study has addressed.
Our analysis also suggests that, since the 2015 NICE guidelines24 on preterm labour diagnosis andtreatment, the evidence on the risk–benefit profile for tocolysis and steroids has changed. Tocolysis is nowused sparingly, whereas the importance of providing steroids within 2 days of preterm delivery has gainedconsensus, especially following articles published in 2017. Unlike the NICE guidelines model, which usedtocolysis as the mediator of improved diagnosis and clinical effectiveness in terms of neonatal mortality andmorbidity, cost-effectiveness analysis should be considered with reference to the timing of corticosteroidadministration. Despite the 2015 NICE guideline recommendation that women presenting with symptomsof preterm labour at < 30 weeks’ gestation should be admitted to hospital without testing, current practicehas not followed this recommendation. Instead, the fFN and Actim Partus tests are commonly used to guideadmission and treatment decisions in women as early as 22 weeks’ gestation. The qualitative fFN test thatpreviously produced a binary result has now been replaced with a test that provides a concentration level.Clinicians are using the new test in more flexible ways than the older binary test, in some cases applyingdifferent thresholds for admission and steroid treatment. This warrants new analysis that takes into accountthe emerging evidence and updated testing practices.
WeaknessesWe focused on economic studies in symptomatic women with intact membranes, and did not coverstudies of asymptomatic women, which might have provided important relevant evidence on utilities,costs, epidemiological parameters and modelling methods. For example, we learned that the only studymeasuring generic health-related quality of life for outcomes of mothers (EQ-5D utilities) was a RCT inasymptomatic women [the OPPITIMUM (dOes Progesterone Prophylaxis To prevent preterm labour IMproveoUtcoMe) trial by Norman et al.135 in 2016]. We contacted the authors to request utility data, but thesewere not yet available to external researchers to the trial.
At the time of writing, there is no published full economic evaluation of new index tests. The existingstudies have addressed only the question of the cost-effectiveness of testing versus no testing. We areaware that there is a research article being prepared for publication on the basis of the QUIDDS project that
DOI: 10.3310/hta23130 HEALTH TECHNOLOGY ASSESSMENT 2019 VOL. 23 NO. 13
© Queen’s Printer and Controller of HMSO 2019. This work was produced by Varley-Campbell et al. under the terms of a commissioning contract issued by the Secretary of Statefor Health and Social Care. This issue may be freely reproduced for the purposes of private research and study and extracts (or indeed, the full report) may be included inprofessional journals provided that suitable acknowledgement is made and the reproduction is not associated with any form of advertising. Applications for commercialreproduction should be addressed to: NIHR Journals Library, National Institute for Health Research, Evaluation, Trials and Studies Coordinating Centre, Alpha House, University ofSouthampton Science Park, Southampton SO16 7NS, UK.
101
evaluates the use of qfFN in 1500 individuals across the UK (Dr Sarah Stock, University of Edinburgh, 2017,personal communication). This will constitute the largest known economic study to date on a biochemicaltest in the population of interest to this review, and will enable the investigation of key outcomes for clinicaleffectiveness, such as the ability to predict delivery within 2 days of presentation with symptoms suggestiveof preterm labour. Previous diagnostic studies of fFN tests have provided limited data on such outcomes.
In terms of methodological economic evaluation practice, older studies evaluating the at-the-time standardpractice of treating all symptomatic women assumed that the economic value of diagnostic testingdepended solely on a test’s ability to rule out cases in which patients were not in preterm labour or likelyto deliver within 7 days. More recent studies have extended the analysis from a purely cost-minimisationframework to a cost-effectiveness framework, by recognising that, however few false-negative cases maybe missed by testing, they are placed at a risk relative to the treat-all alternative management option, sothat there is a trade-off between cost savings and increased risks to life and quality of life for a few caseswith testing. The model that informed the 2015 NICE guideline24 on diagnosis and treatment of pretermlabour represented a methodological advance in that it explicitly recognised that such trade-offs varied bygestational age and were more favourable to testing at older gestational ages.
Since the 2015 NICE guidelines24 on the topic, new evidence has emerged on the value of timely use ofACSs, which may still confer benefits on the neonate if given within 1 day of delivery and have a maximumbenefit when given between 1 and 2 days of delivery. However, existing models are ill suited to accountfor this emerging evidence as few diagnostic studies are large enough to include sufficient numbers tomeasure such outcomes reliably. Current clinical guidelines and recommendations maintain that steroidsneed to be given within 7 days of delivery to be effective, although empirical findings published in 2017by separate independent groups of researchers suggest residual beneficial effects when steroids are givenmore than 7 days before delivery.34,35,94 On the other hand, existing studies have not accounted for therisks posed to the neonate by ACSs in terms of birthweight, despite the common perception by healthprofessionals of the importance of these risks as manifested through the existing tendency to not giverepeated courses of ACSs to women who do not deliver within 7 days of an initial course.
Finally, although the screening was carried out by two reviewers, the data extraction and critical appraisalwere conducted by only one. This may increase the risk of bias associated with the findings of this review.
Areas of uncertaintyOur review could not inform the cost-effectiveness of PartoSure, Actim Partus and fFN. The only evidenceavailable was found for fFN in an unpublished study (a MSc dissertation68), which suggests that fFN at athreshold of 50 ng/ml for treatment and hospital admission may be an inefficient use of NHS resources andthat restricting treatment and admission by raising the threshold to 200 ng/ml may be cost-effective. Thesefindings were derived by the AG from the number needed to test to adequately treat a woman with steroids,as reported by the unpublished study of fFN, using a decision tree model and costs and utilities as used bythe NICE 2015 guideline model.24 In view of the limitations of the unpublished model highlighted previously,it is unclear whether or not these findings are robust to sampling and structural model uncertainty.
Key areas of structural uncertainty include the maintained assumption in the NICE model24 that falsenegatives (i.e. those who test negative but deliver within 7 days of testing) miss treatment and, therefore,are placed at increased risk of neonatal death and of experiencing adverse chronic events including RDSand IVH. In fact, some of those ‘missed’ cases are likely to return to the maternity hospital and receiveACSs closer to delivery, thus, paradoxically deriving more benefit from the treatment than if they had beendetected in the first place. Another key unknown is the effect of accounting for neonatal costs on theresults, because previous studies have ignored the costs associated with neonatal deaths and have usedlow-quality data on costs of neonatal morbidity. Better quality data on neonatal hospital costs (length ofstay at different levels of care) are available for the UK from the National Neonatal Research Database.124
DISCUSSION
NIHR Journals Library www.journalslibrary.nihr.ac.uk
102
Independent economic assessment
In order to address some of the key limitations in the evidence base, primarily the lack of any evidenceon the cost-effectiveness of the index tests in question, we developed a de novo model. The modelincorporates the main elements of existing published models, in which a decision tree is used to evaluate thecosts of the diagnostic phase until delivery, and is linked to data on neonatal outcomes and hospital costs thatare mediated by ACS use, which is, in turn, contingent on diagnostic test results. Following the practice inthe model that informed the 2015 NICE guideline on the topic,24 we extrapolated costs and quality-adjustedlife-years to the lifetime of the infant to account for the lasting cost and health-related quality-of-lifeconsequences of neonatal IVH, and the quality of life of infants who survive the first year after birth.
Our analysis compared all index tests (PartoSure, Actim Partus and qfFN at thresholds other than 50 ng/ml)with the comparators (fFN at 50 ng/ml and no testing and treating all) based on the best available diagnosticaccuracy evidence for the tests. This turned out to be from the two available studies that compared at leasttwo index tests in the same patient sample (Bruijn et al.42,43 and Hadzi-Lega et al.44). One study comparedqfFN with Actim Partus in a group of women from the Netherlands (n = 350),42,43 and the other comparedActim Partus with PartoSure in a group of women from Macedonia (n = 37).44 Thus, we presented aneconomic evaluation of those two comparisons and also of the indirect comparison of PartoSure with fFNvia Actim Partus as the common treatment to both studies, and included the no-testing treat-all and fFN at50 ng/ml comparators using the data from the Dutch study.
In women presenting at 30 weeks’ gestation, PartoSure was cheaper and had the same effectivenessas Actim Partus, which, in turn, saved costs at the expense of inferior health outcomes (fewer QALYs)relative to fFN at 50 ng/ml. ‘No testing treat all’ and fFN at 10 ng/ml had ICERs of > £100,000 relative to fFNat 50 ng/ml, and fFN at 200 ng/ml and fFN at 500 ng/ml each produced less cost savings per unit of QALYlost relative to fFN at 50 ng/ml than Actim Partus. Probabilistic sensitivity analysis shows that the willingnessto pay per QALY would need to be > £100,000 for a test other than PartoSure to become the option mostlikely to be cost-effective. Similar results apply to women presenting at different gestational ages.
It must be noted that these results are based on two studies from non-UK populations. This is importantbecause diagnostic accuracy results may vary with the prevalence rate and the only UK study (n = 299;Abbott et al.92) reported a 7-day prevalence rate of 3%, compared with 19.7% (n = 350; APOSTEL-1,Bruijn et al.42,43) and 10.5% (n = 57; Hadzi-Lega et al.44) reported by the studies used in the base-caseeconomic analysis. Subject to this strong caveat, our result that Actim Partus saves more costs per QALYlost relative to fFN at 50 ng/ml than qfFN at 200 ng/ml and 500 ng/ml is robust to different assumptions.The only scenario when this result did not apply was when we used data from a Canadian study (Cooperet al.49); however, this appears to have used a qualitative fFN test technology that is no longer in use.
In contrast to the results reported by the economic analysis that informed the 2015 NICE guidelines onpreterm labour diagnosis and treatment,24 we found that the policy of not testing and treating all womenpresenting at ≤ 30 weeks of gestation had ICERs well above the £20,000-per-QALY-gained level. There areimportant differences between our model and that used by NICE, primarily in terms of the test accuracydata used, which were not available to NICE at the time, and the fact that in our model the mechanismfrom test results to clinical outcomes operated through the use of ACSs. NICE assumed that the benefitswere accrued through the use of tocolysis and populated its treatment effectiveness parameters fromneonatal outcomes reported by RCTs of tocolytics, whereas we populated treatment effectiveness withthe latest evidence on steroids effectiveness. There were also differences in terms of the measured costs,because we included the costs to the NHS generated by infants whose lives were saved by ACS use,which NICE assumed to be zero. Although we used the same source of national statistics on neonatal andadverse event mortality data, we used more recent data than NICE. On the other hand, we adjusted thebaseline risk values derived from those data for the fact that ACSs are now highly prevalent, with 83%of preterm infants born in the UK being given at least one ACS dose; the model used by NICE did notadjust for such prevalent use of ACS and, thus, may have underestimated the QALY benefits fromtreatment-intensive options.
DOI: 10.3310/hta23130 HEALTH TECHNOLOGY ASSESSMENT 2019 VOL. 23 NO. 13
© Queen’s Printer and Controller of HMSO 2019. This work was produced by Varley-Campbell et al. under the terms of a commissioning contract issued by the Secretary of Statefor Health and Social Care. This issue may be freely reproduced for the purposes of private research and study and extracts (or indeed, the full report) may be included inprofessional journals provided that suitable acknowledgement is made and the reproduction is not associated with any form of advertising. Applications for commercialreproduction should be addressed to: NIHR Journals Library, National Institute for Health Research, Evaluation, Trials and Studies Coordinating Centre, Alpha House, University ofSouthampton Science Park, Southampton SO16 7NS, UK.
103
StrengthsWe provide new evidence on the cost-effectiveness of new and existing diagnostic tests in use in the NHS.We model the costs and benefits of diagnostic testing on the basis of recent evidence on the optimaltime-to-delivery intervals for effective ACS administration in terms of neonatal mortality and morbidity(RDS and IVH). Furthermore, we adopted the best modelling practice in the field and introduced someinnovations by accounting for:
l gestational agel hospital setting (level 1, 2 or 3)l costs of in utero transfers at very preterm gestationl neonatal hospital costs of saving a preterm infantl long-term QALYs and costs of additional preterm birth survivors with and without adverse events
(RDS and IVH)l mothers’ QALYs (in exploratory analysis).
We also conducted extensive scenario analysis and probabilistic analysis to reflect sampling uncertainty inmodel parameter values.
WeaknessesWe were unable to consider multipurpose uses of some of the tests (i.e. relevant for other indications). Inour analysis, we did not account for the effect of costs of any deals offered by suppliers for the purchasingof combinations of diagnostic tests or in bulk over a hospital network.
The scope of our analysis is limited by the fact that we do not consider diagnostic strategies involvingcombinations of tests. The population was defined as women for whom a transvaginal ultrasound scanwas not indicated or who were attending maternity hospitals in which it was unavailable.
We had to approximate the neonatal hospital costs of RDS and IVH, assuming that they are the same andequal to the additional neonatal hospital costs incurred by infants who were admitted to BAPM level 1care (this led to costs similar to those used by the NICE 2015 guideline model24).
Critically, the evidence on accuracy was limited to two comparative studies, one of which may be consideredtoo small (n = 57) to reliably detect differences between index tests; in fact, the study found PartoSure andActim Partus to have the same sensitivity, which in our model determines clinical effectiveness. Therefore, ourfindings must be considered with caution and point to the need to conduct further research before drawingany conclusions on the relative cost-effectiveness of Actim Partus and PartoSure. On firmer ground are thefindings that, relative to fFN at 50 ng/ml, Actim Partus produced larger savings per QALY lost than fFN at200 ng/ml and fFN at 500 ng/ml, whereas ‘treat all’ and fFN at 10 ng/ml had ICERs above the £80,000 markin women presenting at 24–34 weeks’ gestation; these results are based on diagnostic accuracy data fromone study42,43 in 350 women. However, it must be noted that our results were based on the assumption thatthe overall test accuracy reported in these studies is the same across gestational ages, owing to a lack of databy length of gestation.
It is worth noting that the only UK diagnostic study was a non-comparative study of qfFN, in which fFN at200 ng/ml and at 500 ng/ml resulted in the same sensitivity as that of fFN at 50 ng/ml. This was consideredin scenario analyses, and fully incremental analysis suggests that lowering the fFN threshold for diagnosingpreterm labour from 500 to 200 ng/ml has an ICER of < £20,000, whereas lowering it from 200 to 50 ng/mlhas an ICER of > £20,000.
There is an absolute lack of evidence on the outcomes of the status quo diagnostic test, qfFN, in routinepractice. Our analysis was largely based on the modelling of the strict adherence to local hospitals’treatment guidelines with fFN. We were able to obtain audit data on treatment practice over 6 months
DISCUSSION
NIHR Journals Library www.journalslibrary.nihr.ac.uk
104
(2016–17) in a local level 2 hospital (n = 75); however, this is too small an administrative sample to drawdefinitive conclusions.
A methodological limitation of our analysis is the working assumption that false-negative cases misstreatment altogether with the associated increased exposure to risks of neonatal mortality and morbidity.It may be argued that at least some false negatives may actually end up benefiting from being ‘missed’because they may deliver between 2 and 7 days and, therefore, as an unintended consequence get thechance to return before delivery and closer to the target optimal window for ACS administration of 1 to2 days before delivery.33 Thus, many if not most false negatives may possibly end up having the same clinicaloutcomes as true positives. This would appear to justify applying a simpler modelling approach that focusedonly on costs (i.e. cost-minimisation analysis) or perhaps on 48-hour as opposed to 7-day diagnostic outcomes.Given the limited existing data and large sample sizes required to measure 48-hour diagnostic outcomes, thecost-minimisation analysis may seem the only practicable alternative and we conducted scenario analyses thatlimited the analytical horizon to the time of delivery, effectively providing a cost-minimisation analysis of thedecision problem of interest (i.e. because we do not measure any clinical outcomes for the diagnostic phase).This scenario analysis also favoured Actim Partus and suggested that PartoSure may be cost-effective subjectto the strong caveat discussed previously. Another argument in support of cost minimisation is provided bythe perceived harm of multiple courses of ACSs; in this case, the key diagnostic outcome measure for clinicaleffectiveness would be the FPR because not only would it result in ineffective use of ACSs to start with but itwould measure the extent to which women were precluded from any use of ACSs and thus exposed to therisk of adverse neonatal health outcomes. This suggests that the cost-minimisation analysis may be thought ofas a conservative alternative scenario to the base case.
We found no reliable data to account for the side effects of ACSs in terms of birthweight. The only sourceof data on long-term quality-of-life outcomes by birthweight that we identified was from a Canadian studyby Saigal et al.,107 which involved measured quality-of-life outcomes in 286 extremely low-birthweightsurvivors at adolescence and young and mature adulthood. Our analysis showed that data produced nodetectable relationship between birthweight and quality of life, which may be attributed to the samplebeing too small to reliably measure long-term outcome differences by gestational age at birth.
There was little evidence on quality-of-life outcomes of mothers, and we could conduct only someexploratory analysis of results including such evidence. Another limitation is that costs and utility valueswere independent of gestational age at birth; for example, we assumed that, provided a preterm infantsurvives until their first birthday, they will experience the same long-term quality of life as in the averagepopulation. Owing to a lack of data on the quality-of-life effects of IVH, we had to use utility values fromother patient populations (i.e. individuals with ICH).
The mapping algorithm that we used to derive EQ-5D utility values from SF-36 produced predicted EQ-5Dutilities that were consistently higher than (overpredicted) actual EQ-5D utilities for more severe EQ-5Dstates;101 however, this prediction error is large only for health-state utilities of < 0.25. The lowest mappedutility we consider is 0.64, which was for mothers, and not used in base-case analysis. The only mappedutilities included in the base case were for preterm survivors, and these were all > 0.8. Therefore, althoughthere is certainly a limitation with the mapping function, we do not believe that the limitation is a concerngiven the ranges of utility values we deal with in this review.
Areas of uncertaintyThere is a high degree of uncertainty associated with the costs and health benefits of PartoSure relative toother tests, as we had access to only one comparative study of this test, which involved < 100 individuals.A study of this size is unlikely to provide reliable results on diagnostic accuracy on delivery outcomes at48 hours and 7 days. The uncertainty of our findings is compounded by the lack of a study of all relevanttests in the same patient sample, which led us to resort to indirect comparisons using a commoncomparator (i.e. Actim Partus) approach.
DOI: 10.3310/hta23130 HEALTH TECHNOLOGY ASSESSMENT 2019 VOL. 23 NO. 13
© Queen’s Printer and Controller of HMSO 2019. This work was produced by Varley-Campbell et al. under the terms of a commissioning contract issued by the Secretary of Statefor Health and Social Care. This issue may be freely reproduced for the purposes of private research and study and extracts (or indeed, the full report) may be included inprofessional journals provided that suitable acknowledgement is made and the reproduction is not associated with any form of advertising. Applications for commercialreproduction should be addressed to: NIHR Journals Library, National Institute for Health Research, Evaluation, Trials and Studies Coordinating Centre, Alpha House, University ofSouthampton Science Park, Southampton SO16 7NS, UK.
105

More generally, as discussed previously, the ability to predict delivery within 48 hours has become critical,given recent evidence on the importance of good neonatal outcomes of administering ACSs within such ashort period before birth. In addition to prediction within 7 days, we aimed to differentiate in our modelfor the ability of a test to predict delivery within 48 hours but we abandoned that analysis owing to a lackof the required data for the great majority of studies. Further DTA studies in preterm labour should beundertaken with sufficiently large samples to measure and report diagnostic outcomes for the within48 hours delivery end point in addition to the conventional 7-day outcomes.
Given the importance of this element for the cost-effectiveness of diagnostic options, further research iswarranted to produce the data required to calculate more precise measures of long-term QALYs gainedby saving a neonatal life, which distinguishes by the gestational age at birth. Furthermore, evidence isrequired on the long-term implications of birthweight reductions on quality of life, so that an adequatepicture of the implications of the benefit–risk profile of ACSs may be accounted for in economic assessments.
There is a high degree of heterogeneity in the evidence on DTA, as illustrated by the very differentprevalence of preterm birth between the largest comparative study (APOSTEL-1,42,43 20% delivery within7 days) and the UK study (Abbott et al.,92 3% delivery within 7 days), which is not explained by the formerstudy’s inclusion and the latter’s exclusion of non-spontaneous preterm births. More obvious differences inthe selection of patients for study participation is also a problem, as highlighted by the high preterm birthprevalence in one of the four available studies comparing Actim Partus and fFN at 50 ng/ml,57 which, byincluding patients at gestational ages of 28–36 weeks, rather than the more common 24- to 34-weekrange, led to a 7-day prevalence of preterm birth of 32.5% versus 19.7% in the largest comparative studyof these tests (APOSTEL-1) (see Chapter 2, Differences between studies in mode of delivery).
We did not conduct a value-of-information analysis because, as with any model of intervention at birth,there is a degree of structural uncertainty associated with the need to extrapolate from neonatal to lifetimeoutcomes that would render parameter uncertainty meaningless. Thus, probabilistic sensitivity analysisneeds to be considered as exploratory and value of information could not be considered reliable ininforming research priorities.
Some of the uncertainties discussed previously may be addressed by the findings of two large (> 1000participants) ongoing trials of the predictive utility of qfFN (PETRA) and qfFN, PartoSure and Actim Partus(QUIDS 2) in the UK. Until these new data become available, the value of PartoSure is unlikely to besettled. This and other studies may also address a key issue of uncertainty in our analysis, namely whetheror not the use of the new tests do affect routine patient management. Our model was limited by the lackof these data and the consequently simplifying assumption that mothers were treated in strict accordancewith the test results, which we know does not happen with the current status quo test (fFN at 50 ng/ml).
Other relevant factors
In these analyses, we have not allowed for the complicated treatment protocols and guidelines thathave been implemented in some hospitals whereby, for example, some women may be admitted with aconcentration level above one fFN threshold but not given ACSs unless that level is above another, higher,threshold. This type of more complicated decision algorithm may work to optimise the status quo, but maymore reasonably be evaluated using actual data on its operation and results rather than, as has been donehere, modelled on the assumption of full adherence.
DISCUSSION
NIHR Journals Library www.journalslibrary.nihr.ac.uk
106
Chapter 10 Conclusions
A lthough evidence was identified relating to the test accuracy of the three biomarker tests, there wastoo much uncertainty in the results to be able to draw any clear conclusions on the relative accuracies
of the tests. With the imminent publication of relevant UK-based data from large studies, it may beadvisable to wait for these data to be published.
We identified no trials that followed patients from testing to ultimate health outcomes. Therefore, wefound no direct evidence on whether or not the use of the biomarker tests for predicting preterm labourled to improved health outcomes. Instead, we used modelling for this purpose.
The limited evidence from DTA studies in patient populations from non-UK countries suggests that ActimPartus may result in a discounted QALY loss of 0.006 per women tested but reduces discounted healthcare costs by > £30,000 per QALY lost relative to the status quo (the qfFN at 50 ng/ml test). This ratioof savings per QALY lost is larger than that achieved by other options that restrict treatment relative tostandard practice (qfFN at 50 ng/ml) (i.e. qfFN at 200 ng/ml and qfFN at 500 ng/ml). In contrast, optionsthat increase access to treatment (i.e. qfFN at 10 ng/ml and the policy of no testing and treat all) increaseQALYs and costs and have ICERs in excess of £100,000 relative to qfFN at 50 ng/ml. As for PartoSure, theevidence is inconclusive owing to the small number of patients in the only comparative study of the test.These findings warrant reconsideration in the light of forthcoming evidence from large ongoing diagnosticstudies of these tests in UK populations. Our results suggest that the current NICE-recommended policyof treating all symptomatic women presenting at < 30 weeks’ gestation without testing may not becost-effective.
Suggested research priorities
The primary research priority would be for DTA studies to assess more than one of the index tests withinthe same trial. Given the practical limitations of comparative studies in this area, a feasible study wouldgive all new tests to the same mothers and compare diagnostic accuracy results with those of the localstandard practice. This would allow for a more robust comparison between tests, because populationdifferences between trials would not be an issue. It is probable that these types of studies are currentlyunder way, because some of the index tests are, comparatively speaking, in their infancy of use andto date have been predominantly compared with older (qualitative fFN) or not commonly used (cervicallength) tests. We are aware of four ongoing comparative studies, three in the UK and one in France.The publication of these studies will greatly help us compare the DTA between the tests, given that thesample population and hospital treatment protocols will be standardised.
New diagnostic studies involving larger samples are required to investigate the differences in available testsin terms of test accuracy outcomes defined relative to delivery within 48 days of testing. Few previousstudies have reported these outcomes, which is probably a reflection of the fact that they have includedvery small samples to reliably measure such outcomes. The importance of this question is highlighted bythe emerging evidence documenting the first 48 hours as the target window to optimise ACS treatment.
Studies that follow mothers and babies from testing through to final health outcomes are required. Ideally,such studies would also compare tests. The available evidence includes only observational before-and-afterstudies of changes in local practice from a policy of managing women in accordance with no testing (treat all)to one based on the results of fFN at 50-ng/ml testing. Similar evidence may be obtained by taking advantageof variation in practice across the UK, where one of fFN or Actim Partus may be used routinely.
More evidence is required about the side effects of ACS treatment. Despite the perceived risks of steroidsin terms of neonatal outcomes, there is little evidence on the effects of inappropriate use of the treatment.
DOI: 10.3310/hta23130 HEALTH TECHNOLOGY ASSESSMENT 2019 VOL. 23 NO. 13
© Queen’s Printer and Controller of HMSO 2019. This work was produced by Varley-Campbell et al. under the terms of a commissioning contract issued by the Secretary of Statefor Health and Social Care. This issue may be freely reproduced for the purposes of private research and study and extracts (or indeed, the full report) may be included inprofessional journals provided that suitable acknowledgement is made and the reproduction is not associated with any form of advertising. Applications for commercialreproduction should be addressed to: NIHR Journals Library, National Institute for Health Research, Evaluation, Trials and Studies Coordinating Centre, Alpha House, University ofSouthampton Science Park, Southampton SO16 7NS, UK.
107

There is practically no evidence on the mothers’ health-related quality-of-life outcomes after diagnostictesting for preterm labour, both before and after birth and over the long term. Observational studiesmay be able to provide some of these data, particularly in relation to long-term outcomes, using existingrepresentative surveys of birth cohorts.
Improving on the costs of cognitive, respiratory and intestinal neonatal adverse events is also warranted,using electronic records from the Badger data set,120,121 such as that extracted by the National NeonatalResearch Database. This would allow the more precise assessment of the costs to the NHS from keyneonatal outcomes affected by diagnostic testing.
CONCLUSIONS
NIHR Journals Library www.journalslibrary.nihr.ac.uk
108
Acknowledgements
We are grateful for the administrative assistance of Sue Whiffin and Jenny Lowe (including documentretrieval). We thank Sophie Robinson for her assistance with running additional searches.
Contributions of authors
Jo Varley-Campbell led and contributed to all aspects of the protocol and systematic review of DTA andclinical effectiveness. She assisted with the systematic review of economic models and drafting of thebackground. She provided overall project management. She contributed to the writing and editing ofthe report.
Rubén Mújica-Mota contributed to designing the protocol, led the economic evaluation, developed themodel and conducted the review of cost-effectiveness studies. He contributed to the writing and editing ofthe report.
Helen Coelho contributed to all aspects of the systematic review of DTA and clinical effectiveness.She contributed to the writing and editing of the report.
Neel Ocean conducted the review of health-state utility studies and extracted relevant parameters.He contributed to model development and checking, and to the writing and editing of the report.
Max Barnish contributed to all aspects of the systematic review of DTA and clinical effectiveness. He ledthe statistical synthesis and meta-analysis. He contributed to the writing and editing of the report.
David Packman conducted a review of the cost of adverse events and extracted relevant data.He contributed to model development and to the writing and editing of the report.
Sophie Dodman contributed to all aspects of the systematic reviews. She drafted the background section.She assisted with the identification of parameter values for the economic evaluation. She contributed tothe writing and editing of the report.
Chris Cooper contributed to designing the protocol. He developed and conducted the literature searchesfor the systematic reviews of DTA, economic evaluations and review of utilities. He contributed to thewriting and editing of the report.
Tristan Snowsill contributed to the development of the protocol and to the meta-analysis of diagnosticaccuracy results. He contributed to the writing and editing of the report.
Tracey Kay advised on current clinical practice and scientific understanding of preterm labour.She provided individual patient data collected at the Royal Devon and Exeter Hospital. She contributed tothe writing and editing of the report.
Neil Liversedge advised on current clinical practice and scientific understanding of preterm labour.He contributed to the writing and editing of the report.
Michelle Parr advised on current clinical practice and scientific understanding of preterm labour.She contributed to the writing and editing of the report.
DOI: 10.3310/hta23130 HEALTH TECHNOLOGY ASSESSMENT 2019 VOL. 23 NO. 13
© Queen’s Printer and Controller of HMSO 2019. This work was produced by Varley-Campbell et al. under the terms of a commissioning contract issued by the Secretary of Statefor Health and Social Care. This issue may be freely reproduced for the purposes of private research and study and extracts (or indeed, the full report) may be included inprofessional journals provided that suitable acknowledgement is made and the reproduction is not associated with any form of advertising. Applications for commercialreproduction should be addressed to: NIHR Journals Library, National Institute for Health Research, Evaluation, Trials and Studies Coordinating Centre, Alpha House, University ofSouthampton Science Park, Southampton SO16 7NS, UK.
109
Lisa Knight advised on current clinical practice and scientific understanding of preterm labour.She provided individual patient data collected at the Royal Devon and Exeter Hospital. She contributed tothe writing and editing of the report.
Chris Hyde was the project director up to June 2017. He provided DTA advice for both the systematicreview and the economic evaluation. He contributed to the writing and editing of the report.
Andrew Shennan advised on current clinical practice and scientific understanding of preterm labour.He provided individual patient data from previous research. He contributed to the writing and editingof the report.
Martin Hoyle was the project director from June 2017 to completion. He contributed to model checkingand advised on model construction. He contributed to the writing and editing of the report.
Data-sharing statement
Access to the executable economic model developed within this study can be requested and is subject toappropriate agreements being in place. All queries should be submitted to the corresponding author.
Patient data
This work uses data provided by patients and collected by the NHS as part of their care and support. Usingpatient data is vital to improve health and care for everyone. There is huge potential to make better use ofinformation from people’s patient records, to understand more about disease, develop new treatments,monitor safety, and plan NHS services. Patient data should be kept safe and secure, to protect everyone’sprivacy, and it’s important that there are safeguards to make sure that it is stored and used responsibly.Everyone should be able to find out about how patient data are used. #datasaveslives You can find outmore about the background to this citation here: https://understandingpatientdata.org.uk/data-citation.
ACKNOWLEDGEMENTS
NIHR Journals Library www.journalslibrary.nihr.ac.uk
110
References
1. World Health Organization. Preterm Birth. URL: www.who.int/mediacentre/factsheets/fs363/en/(accessed December 2017).
2. Beck S, Wojdyla D, Say L, Betran AP, Merialdi M, Requejo JH, et al. The worldwide incidence ofpreterm birth: a systematic review of maternal mortality and morbidity. Bull World Health Organ2010;88:31–8. https://doi.org/10.2471/BLT.08.062554
3. Behrman RE, Butler AS. Mortality and Acute Complications in Preterm Infants. Washington, DC:National Academies Press; 2007.
4. Moutquin JM. Classification and heterogeneity of preterm birth. BJOG 2003;110(Suppl. 20):30–3.https://doi.org/10.1046/j.1471-0528.2003.00021.x
5. Romero R, Dey SK, Fisher SJ. Preterm labor: one syndrome, many causes. Science 2014;345:760–5.https://doi.org/10.1126/science.1251816
6. Goldenberg RL, Culhane JF, Iams JD, Romero R. Epidemiology and causes of preterm birth.Lancet 2008;371:75–84. https://doi.org/10.1016/S0140-6736(08)60074-4
7. Halimi AAA, Safari S, Parvareshi Hamrah M. Epidemiology and related risk factors of preterm laboras an obstetrics emergency. Emerg 2017;5:e3.
8. Goffinet F. Primary predictors of preterm labour. BJOG 2005;112(Suppl. 1):38–47. https://doi.org/10.1111/j.1471-0528.2005.00583.x
9. March of Dimes. Signs and Symptoms of Preterm Labor. 2017. URL: www.marchofdimes.org/complications/signs-and-symptoms-of-preterm-labor.aspx (accessed October 2017).
10. Ross M, Ridout A, Shennan A. Promising recent advances in preterm birth management.Front Womens Health 2016;1:27–33.
11. Peaceman AM, Andrews WW, Thorp JM, Cliver SP, Lukes A, Iams JD, et al. Fetal fibronectin as apredictor of preterm birth in patients with symptoms: a multicenter trial. Am J Obstet Gynecol1997;177:13–18. https://doi.org/10.1016/S0002-9378(97)70431-9
12. NICE. DAP40: Biomarker Tests to Help Diagnose Preterm Labour in Women with Intact Membranes –Final Scope. London: NICE; 2017.
13. Office for National Statistics. Birth Characteristics in England and Wales: 2016. London: ONS; 2017.
14. Smith LK, Draper ES, Manktelow BN, Dorling JS, Field DJ. Socioeconomic inequalities in verypreterm birth rates. Arch Dis Child Fetal Neonatal Ed 2007;92:F11–14. https://doi.org/10.1136/adc.2005.090308
15. Field D, Boyle E, Draper E, Evans A, Johnson S, Khan K, et al. Towards reducing variations ininfant mortality and morbidity: a population-based approach. PGfAR 2016;4(1).
16. Blencowe H, Cousens S, Chou D, Oestergaard M, Say L, Moller AB, et al. Born too soon:the global epidemiology of 15 million preterm births. Reprod Health 2013;10(Suppl. 1):2.https://doi.org/10.1186/1742-4755-10-S1-S2
17. Liu L, Johnson HL, Cousens S, Perin J, Scott S, Lawn JE, et al. Global, regional, and nationalcauses of child mortality: an updated systematic analysis for 2010 with time trends since 2000.Lancet 2012;379:2151–61. https://doi.org/10.1016/S0140-6736(12)60560-1
18. Doyle LW, Ford G, Davis N. Health and hospitalisations after discharge in extremely low birthweight infants. Semin Neonatol 2003;8:137–45. https://doi.org/10.1016/S1084-2756(02)00221-X
DOI: 10.3310/hta23130 HEALTH TECHNOLOGY ASSESSMENT 2019 VOL. 23 NO. 13
© Queen’s Printer and Controller of HMSO 2019. This work was produced by Varley-Campbell et al. under the terms of a commissioning contract issued by the Secretary of Statefor Health and Social Care. This issue may be freely reproduced for the purposes of private research and study and extracts (or indeed, the full report) may be included inprofessional journals provided that suitable acknowledgement is made and the reproduction is not associated with any form of advertising. Applications for commercialreproduction should be addressed to: NIHR Journals Library, National Institute for Health Research, Evaluation, Trials and Studies Coordinating Centre, Alpha House, University ofSouthampton Science Park, Southampton SO16 7NS, UK.
111

19. Wood NS, Marlow N, Costeloe K, Gibson AT, Wilkinson AR. Neurologic and developmentaldisability after extremely preterm birth. EPICure Study Group. N Engl J Med 2000;343:378–84.https://doi.org/10.1056/NEJM200008103430601
20. Saigal S, Doyle LW. An overview of mortality and sequelae of preterm birth from infancy toadulthood. Lancet 2008;371:261–9. https://doi.org/10.1016/S0140-6736(08)60136-1
21. Gregory KE, Deforge CE, Natale KM, Phillips M, Van Marter LJ. Necrotizing enterocolitis in thepremature infant: neonatal nursing assessment, disease pathogenesis, and clinical presentation.Adv Neonatal Care 2011;11:155–64. https://doi.org/10.1097/ANC.0b013e31821baaf4
22. Melville JM, Moss TJ. The immune consequences of preterm birth. Front Neurosci 2013;7:79.https://doi.org/10.3389/fnins.2013.00079
23. Hodek JM, von der Schulenburg JM, Mittendorf T. Measuring economic consequences of pretermbirth - Methodological recommendations for the evaluation of personal burden on children andtheir caregivers. Health Econ Rev 2011;1:6. https://doi.org/10.1186/2191-1991-1-6
24. NICE. NG25: Preterm Labour and Birth (Full Guideline). London: NICE; 2015.
25. Lee SM, Romero R, Park JW, Kim SM, Park CW, Korzeniewski SJ, et al. The clinical significance ofa positive Amnisure test in women with preterm labor and intact membranes. J Matern FetalNeonatal Med 2012;25:1690–8. https://doi.org/10.3109/14767058.2012.657279
26. Alere Inc. Alere Actim Partus Test: Instructions for Use. 2017. URL: www.medixbiochemica.com/wp-content/uploads/2017/06/K%C3%A4ytt%C3%B6ohje-Actim-Partus-OACE31931_LR.pdf(accessed January 2019).
27. Parsagen Diagnostics Inc. PartoSure, Assess the Risk of Preterm Birth: Instructions for Use. 2015.URL: https://pdfs.semanticscholar.org/4108/6bda6c63812435f007586a38aa41b53f9d99.pdf(accessed January 2019).
28. Hologic, Inc. Rapid fFN 10Q Cassette Kit: Instructions for Use. 2016. URL: www.hologic.com/sites/default/files/package-insert/AW-09202-002_002_02.pdf (accessed January 2019).
29. Hologic, Inc. QuikCheck fFN Sheet. URL: www.hologic.com/sites/default/files/2018-05/AW-05842-002_004_02.pdf (accessed January 2019).
30. Haas DM, Caldwell DM, Kirkpatrick P, McIntosh JJ, Welton NJ. Tocolytic therapy for pretermdelivery: systematic review and network meta-analysis. BMJ 2012;345:e6226. https://doi.org/10.1136/bmj.e6226
31. Elliott JP, Morrison JC, Bofill JA. Risks and benefits of magnesium sulfate tocolysis in preterm labor(PTL). AIMS Public Health 2016;3:348–56. https://doi.org/10.3934/publichealth.2016.2.348
32. Roberts D, Dalziel S. Antenatal corticosteroids for accelerating fetal lung maturation for women atrisk of preterm birth. Cochrane Database Syst Rev 2006;3:CD004454. https://doi.org/10.1002/14651858.CD004454.pub2
33. Norman M, Piedvache A, Børch K, Huusom LD, Bonamy AE, Howell EA, et al. Association of shortantenatal corticosteroid administration-to-birth intervals with survival and morbidity among verypreterm infants: results from the EPICE cohort. JAMA Pediatr 2017;171:678–86. https://doi.org/10.1001/jamapediatrics.2017.0602
34. Roberts D, Brown J, Medley N, Dalziel SR. Antenatal corticosteroids for accelerating fetal lungmaturation for women at risk of preterm birth. Cochrane Database Syst Rev 2017;3:CD004454.https://doi.org/10.1002/14651858.CD004454.pub3
35. Crowther CA, Doyle LW, Anderson P, Harding JE, Haslam RR, Hiller JE, et al. Repeat dose(s)of prenatal corticosteroids for women at risk of preterm birth: early school-age outcomes(6 to 8 years) for children in the ACTORDS trial. J Paediatr Child Health 2011;47:52–3.
REFERENCES
NIHR Journals Library www.journalslibrary.nihr.ac.uk
112

36. Nelson KB, Grether JK. Can magnesium sulfate reduce the risk of cerebral palsy in very lowbirthweight infants? Pediatrics 1995;95:263–9.
37. NHS Centre for Reviews and Dissemination. Systematic Reviews: CRD’s Guidance for UndertakingReviews in Health Care. 3rd edn. York: Centre for Reviews and Dissemination; 2009.
38. Whiting P, Westwood M, Beynon R, Burke M, Sterne JA, Glanville J. Inclusion of methodologicalfilters in searches for diagnostic test accuracy studies misses relevant studies. J Clin Epidemiol2011;64:602–7. https://doi.org/10.1016/j.jclinepi.2010.07.006
39. Whiting PF, Rutjes AW, Westwood ME, Mallett S, Deeks JJ, Reitsma JB, et al. QUADAS-2:a revised tool for the quality assessment of diagnostic accuracy studies. Ann Intern Med2011;155:529–36. https://doi.org/10.7326/0003-4819-155-8-201110180-00009
40. Deeks J, Bossuyt P, Gatsonis C. Cochrane Handbook for Systematic Reviews of Diagnostic TestAccuracy. Version 10. London: The Cochrane Collaboration; 2010.
41. Werlen S, Raia T, Di Bartolomeo A, Chauleur C. [Preterm labor: Reproducibility of detection testof PAMG-1 before and after digital examination, and transvaginal ultrasound cervical length.]Gynecol Obstet Fertil 2015;43:640–5. https://doi.org/10.1016/j.gyobfe.2015.07.002
42. Bruijn M, Vis JY, Wilms FF, Oudijk MA, Kwee A, Porath MM, et al. Quantitative fetal fibronectintesting in combination with cervical length measurement in the prediction of spontaneouspreterm delivery in symptomatic women. BJOG 2016;123:1965–71. https://doi.org/10.1111/1471-0528.13752
43. Bruijn MM, Vis JY, Wilms FF, Oudijk MA, Kwee A, Porath MM, et al. Comparison of the ActimPartus test and the fetal fibronectin test in the prediction of spontaneous preterm birth insymptomatic women undergoing cervical length measurement. Eur J Obstet Gynecol Reprod Biol2016;206:220–4. https://doi.org/10.1016/j.ejogrb.2016.09.018
44. Hadzi-Lega M, Maier JT, Helmer H, Hellmeyer L, Markova AD, Poposka A. Comparison of PAMG-1and phIGFBP-1 tests for the prediction of preterm delivery in patients with preterm labor. Open JObstet Gynecol 2017;7:11. https://doi.org/10.4236/ojog.2017.73037
45. Abo El-Ezz AE, Askar AE. Predictive value of phosphorylated insulin-like growth factor bindingprotein-1 (PIGFBP-1) (bedside test) in preterm labor. J Egypt Soc Parasitol 2014;44:525–30.https://doi.org/10.12816/0006491
46. Altinkaya O, Gungor T, Ozat M, Danisman N, Mollamahmutoglu L. Cervical phosphorylatedinsulin-like growth factor binding protein-1 in prediction of preterm delivery. Arch Gynecol Obstet2009;279:279–83. https://doi.org/10.1007/s00404-008-0703-7
47. Azlin MI, Bang HK, An LJ, Mohamad SN, Mansor NA, Yee BS, et al. Role of phIGFBP-1 andultrasound cervical length in predicting pre-term labour. J Obstet Gynaecol 2010;30:456–9.https://doi.org/10.3109/01443615.2010.489162
48. Brik M, Hernández AI, Pedraz CC, Perales A. Phosphorylated insulin-like growth factor bindingprotein-1 and cervical measurement in women with threatening preterm birth. Acta ObstetGynecol Scand 2010;89:268–74. https://doi.org/10.3109/00016340903443668
49. Cooper S, Lange I, Wood S, Tang S, Miller L, Ross S. Diagnostic accuracy of rapid phIGFBP-I assayfor predicting preterm labor in symptomatic patients. J Perinatol 2012;32:460–5. https://doi.org/10.1038/jp.2011.133
50. Danti L, Prefumo F, Lojacono A, Corini S, Testori A, Frusca T. The combination of short cervicallength and phIGFBP-1 in the prediction of preterm delivery in symptomatic women. J Matern FetalNeonatal Med 2011;24:1262–6. https://doi.org/10.3109/14767058.2010.547962
DOI: 10.3310/hta23130 HEALTH TECHNOLOGY ASSESSMENT 2019 VOL. 23 NO. 13
© Queen’s Printer and Controller of HMSO 2019. This work was produced by Varley-Campbell et al. under the terms of a commissioning contract issued by the Secretary of Statefor Health and Social Care. This issue may be freely reproduced for the purposes of private research and study and extracts (or indeed, the full report) may be included inprofessional journals provided that suitable acknowledgement is made and the reproduction is not associated with any form of advertising. Applications for commercialreproduction should be addressed to: NIHR Journals Library, National Institute for Health Research, Evaluation, Trials and Studies Coordinating Centre, Alpha House, University ofSouthampton Science Park, Southampton SO16 7NS, UK.
113

51. Eroglu D, Yanik F, Oktem M, Zeyneloglu HB, Kuscu E. Prediction of preterm delivery amongwomen with threatened preterm labor. Gynecol Obstet Invest 2007;64:109–16. https://doi.org/10.1159/000100120
52. Goyal M, Kriplani A, Kachhawa G, Badiger S. Prediction of preterm labor by a rapid bedsidetest detecting phosphorylated insulin-like growth factor-binding protein 1 in cervical secretions.Int J Gynaecol Obstet 2016;134:165–8. https://doi.org/10.1016/j.ijgo.2016.01.019
53. Lembet A, Eroglu D, Ergin T, Kuscu E, Zeyneloglu H, Batioglu S, Haberal A. New rapid bed-sidetest to predict preterm delivery: phosphorylated insulin-like growth factor binding protein-1 incervical secretions. Acta Obstet Gynecol Scand 2002;81:706–12. https://doi.org/10.1034/j.1600-0412.2002.810804.x
54. Riboni F, Vitulo A, Dell’avanzo M, Plebani M, Battagliarin G, Paternoster D. Biochemical markerspredicting pre-term delivery in symptomatic patients: phosphorylated insulin-like growth factorbinding protein-1 and fetal fibronectin. Arch Gynecol Obstet 2011;284:1325–9. https://doi.org/10.1007/s00404-011-1839-4
55. Tanir HM, Sener T, Yildiz Z. Cervical phosphorylated insulin-like growth factor binding protein-1for the prediction of preterm delivery in symptomatic cases with intact membranes. J ObstetGynaecol Res 2009;35:66–72. https://doi.org/10.1111/j.1447-0756.2008.00833.x
56. Ting HS, Chin PS, Yeo GS, Kwek K. Comparison of bedside test kits for prediction of pretermdelivery: phosphorylated insulin-like growth factor binding protein-1 (pIGFBP-1) test and fetalfibronectin test. Ann Acad Med Singap 2007;36:399–402.
57. Tripathi R, Tyagi S, Mala YM, Singh N, Pandey NB, Yadav P. Comparison of rapid bedside testsfor phosphorylated insulin-like growth factor-binding protein 1 and fetal fibronectin to predictpreterm birth. Int J Gynaecol Obstet 2016;135:47–50. https://doi.org/10.1016/j.ijgo.2016.03.030
58. Vishwekar PS, Chauhan AR, Turakhia N. Prediction of preterm delivery with a novel bedsidetest. Int J Reprod Contracept Obstet Gynecol 2017;6:3366–71. https://doi.org/10.18203/2320-1770.ijrcog20173372
59. Bolotskikh V, Borisova V. Combined value of placental alpha microglobulin-1 detection andcervical length via transvaginal ultrasound in the diagnosis of preterm labor in symptomaticpatients. J Obstet Gynaecol Res 2017;43:1263–9. https://doi.org/10.1111/jog.13366
60. Nikolova T, Bayev O, Nikolova N, Di Renzo GC. Evaluation of a novel placental alpha microglobulin-1(PAMG-1) test to predict spontaneous preterm delivery. J Perinat Med 2014;42:473–7. https://doi.org/10.1515/jpm-2013-0234
61. Nikolova T, Bayev O, Nikolova N, Di Renzo GC. Comparison of a novel test for placental alphamicroglobulin-1 with fetal fibronectin and cervical length measurement for the prediction ofimminent spontaneous preterm delivery in patients with threatened preterm labor. J Perinat Med2015;43:395–402. https://doi.org/10.1515/jpm-2014-0300
62. Bruijn MM, Kamphuis EI, Hoesli IM, Martinez de Tejada B, Loccufier AR, Kühnert M, et al.The predictive value of quantitative fibronectin testing in combination with cervical lengthmeasurement in symptomatic women. Am J Obstet Gynecol 2016;215:793.e1–793.e8.https://doi.org/10.1016/j.ajog.2016.08.012
63. Kuhrt K, Unwin C, Hezelgrave N, Seed P, Shennan A. Endocervical and high vaginal quantitativefetal fibronectin in predicting preterm birth. J Matern Fetal Neonatal Med 2014;27:1576–9.https://doi.org/10.3109/14767058.2013.870550
REFERENCES
NIHR Journals Library www.journalslibrary.nihr.ac.uk
114

64. Husereau D, Drummond M, Petrou S, Carswell C, Moher D, Greenberg D, et al. ConsolidatedHealth Economic Evaluation Reporting Standards (CHEERS) – explanation and elaboration:a report of the ISPOR Health Economic Evaluation Publication Guidelines Good ReportingPractices Task Force. Value Health 2013;16:231–50. https://doi.org/10.1016/j.jval.2013.02.002
65. Drummond MF, Jefferson TO. Guidelines for authors and peer reviewers of economic submissionsto the BMJ. The BMJ Economic Evaluation Working Party. BMJ 1996;313:275–83. https://doi.org/10.1136/bmj.313.7052.275
66. Moher D, Liberati A, Tetzlaff J, Altman DG, PRISMA Group. Preferred reporting items forsystematic reviews and meta-analyses: the PRISMA statement. PLOS Med 2009;6:e1000097.https://doi.org/10.1371/journal.pmed.1000097
67. Gibson S, Hezelgrave NL, Shennan AH. The impact of quantitative fetal fibronectin on the clinicalmanagement of women symptomatic of preterm labour. Arch Dis Child Fetal Neonatal Ed2014;99:A151–5. https://doi.org/10.1136/archdischild-2014-306576.445
68. Gibson S. Implementing Quantitative Fetal Fibronectin into Clinical Practice. MSc thesis. London:King’s College London; 2013.
69. Royal College of Obstetricians and Gynaecologists. Antenatal Corticosteroids to Reduce NeonatalMorbidity (Green-top 7). URL: www.rcog.org.uk/womens-health/clinical-guidance/antenatal-corticosteroids-prevent-respiratory-distress-syndrome-gree (accessed 7 April 2013).
70. Deshpande SN, van Asselt AD, Tomini F, Armstrong N, Allen A, Noake C, et al. Rapid fetal fibronectintesting to predict preterm birth in women with symptoms of premature labour: a systematic reviewand cost analysis. Health Technol Assess 2013;17(40). https://doi.org/10.3310/hta17400
71. Honest H, Forbes CA, Durée KH, Norman G, Duffy SB, Tsourapas A, et al. Screening to preventspontaneous preterm birth: systematic reviews of accuracy and effectiveness literature witheconomic modelling. Health Technol Assess 2009;13(43). https://doi.org/10.3310/hta13430
72. Chuck A, Nguyen T. Post Policy Implementation Review (PPIR) of Rapid Fetal Fibronectin Testingfor Preterm Labour in Alberta. Edmonton, AB: Institute of Health Economics; 2015.
73. Boyd KA, Briggs AH, Fenwick E, Norrie J, Stock S. Power and sample size for cost-effectivenessanalysis: fFN neonatal screening. Contemp Clin Trials 2011;32:893–901. https://doi.org/10.1016/j.cct.2011.07.007
74. Mozurkewich EL, Naglie G, Krahn MD, Hayashi RH. Predicting preterm birth: a cost-effectivenessanalysis. Am J Obstet Gynecol 2000;182:1589–98. https://doi.org/10.1067/mob.2000.106855
75. van Baaren GJ, Vis JY, Wilms FF, Oudijk MA, Kwee A, Porath MM, et al. Cost-effectiveness ofdiagnostic testing strategies including cervical length measurement and fibronectin testing inwomen with symptoms of preterm labor. Ultrasound Obstet Gynecol 2017;51:596–603.https://doi.org/10.1002/uog.17481
76. Dutta D, Norman JE. Pilot study into the efficacy of foetal fibronectin testing in minimisinghospital admissions in women presenting with symptoms of preterm labour: a randomisedcontrolled trial of obstetric and neonatal outcomes. Arch Gynecol Obstet 2011;284:559–65.https://doi.org/10.1007/s00404-010-1712-x
77. Kind P. A comparison of two models for scaling health indicators. Int J Epidemiol 1982;11:271–5.https://doi.org/10.1093/ije/11.3.271
78. Cahill AG, Odibo AO, Stout MJ, Grobman WA, Macones GA, Caughey AB. Magnesium sulfatetherapy for the prevention of cerebral palsy in preterm infants: a decision-analytic and economicanalysis. Am J Obstet Gynecol 2011;205:542.e1–7. https://doi.org/10.1016/j.ajog.2011.09.004
DOI: 10.3310/hta23130 HEALTH TECHNOLOGY ASSESSMENT 2019 VOL. 23 NO. 13
© Queen’s Printer and Controller of HMSO 2019. This work was produced by Varley-Campbell et al. under the terms of a commissioning contract issued by the Secretary of Statefor Health and Social Care. This issue may be freely reproduced for the purposes of private research and study and extracts (or indeed, the full report) may be included inprofessional journals provided that suitable acknowledgement is made and the reproduction is not associated with any form of advertising. Applications for commercialreproduction should be addressed to: NIHR Journals Library, National Institute for Health Research, Evaluation, Trials and Studies Coordinating Centre, Alpha House, University ofSouthampton Science Park, Southampton SO16 7NS, UK.
115

79. Department of Health and Social Care (DHSC). NHS Reference Costs 2011–12. London: DHSC; 2012.URL: www.gov.uk/government/publications/nhs-reference-costs-financial-year-2011-to-2012(accessed January 2019).
80. Kruse M, Michelsen SI, Flachs EM, Brønnum-Hansen H, Madsen M, Uldall P. Lifetime costs of cerebralpalsy. Dev Med Child Neurol 2009;51:622–8. https://doi.org/10.1111/j.1469-8749.2008.03190.x
81. Alvarez MD, Villamil M, Reyes G. Predictive factors in the genesis of intraventricular hemorrhagein premature infants. P R Health Sci J 1994;13:251–4.
82. Healthcare Commission. Towards Better Births – A Review of Maternity Services in England.Commission for Healthcare Audit and Inspection; 2008. URL: www.healthcarecommission.org.uk
83. Hogg M, Penney G, Carmichael J. Audit of Care Provided and Outcomes Achieved by CommunityMaternity Units in Scotland 2005. Scottish Programme for Clinical Effectiveness in ReproductiveHealth; Aberdeen: 2007.
84. Ara R, Brazier JE. Populating an economic model with health state utility values: moving towardbetter practice. Value Health 2010;13:509–18. https://doi.org/10.1111/j.1524-4733.2010.00700.x
85. British Medical Association (BMA), Royal Pharmaceutical Society of Great Britain (RPS). BritishNational Formulary No. 62, September 2011. London: BMA and RPS; 2011. URL: http://bnf.org/
86. Villeneuve E, Landa P, Allen M, Spencer A, Prosser S, Gibson A, et al. A framework to address keyissues of neonatal service configuration in England: the NeoNet multimethods study. Health ServDeliv Res 2018;6(35).
87. Norberg H, Kowalski J, Marsál K, Norman M. Timing of antenatal corticosteroid administrationand survival in extremely preterm infants: a national population-based cohort study. BJOG2017;124:1567–74. https://doi.org/10.1111/1471-0528.14545
88. Sarri G, Davies M, Gholitabar M, Norman JE, Guideline Development Group. Preterm labour:summary of NICE guidance. BMJ 2015;351:h6283. https://doi.org/10.1136/bmj.h6283
89. Ridout A, Watson H, Shennan A. Antenatal corticosteroids in perspective: rationalising currentpractice. BJOG 2016;123:1070. https://doi.org/10.1111/1471-0528.13929
90. Shennan A, Carter J. Threatened Preterm Labour: Guideline for Management. London: Guy’s andSt Thomas’ NHS Foundation Trust; 2017.
91. NICE. Guide to the Methods of Technology Appraisal 2013. London: NICE; 2013.
92. Abbott DS, Radford SK, Seed PT, Tribe RM, Shennan AH. Evaluation of a quantitative fetalfibronectin test for spontaneous preterm birth in symptomatic women. Am J Obstet Gynecol2013;208:122.e1–6. https://doi.org/10.1016/j.ajog.2012.10.890
93. Travers CP, Clark RH, Spitzer AR, Das A, Garite TJ, Carlo WA. Exposure to any antenatalcorticosteroids and outcomes in preterm infants by gestational age: prospective cohort study.BMJ 2017;356:j1039. https://doi.org/10.1136/bmj.j1039
94. Royal College of Paediatrics and Child Health (RCPCH). National Neonatal Audit Programme 2016Annual Report on 2015 Data. London: RCPCH; 2016.
95. Grant RL. Converting an odds ratio to a range of plausible relative risks for better communicationof research findings. BMJ 2014;348:f7450. https://doi.org/10.1136/bmj.f7450
96. Radic JA, Vincer M, McNeely PD. Outcomes of intraventricular hemorrhage and posthemorrhagichydrocephalus in a population-based cohort of very preterm infants born to residents of NovaScotia from 1993 to 2010. J Neurosurg Pediatr 2015;15:580–8. https://doi.org/10.3171/2014.11.PEDS14364
REFERENCES
NIHR Journals Library www.journalslibrary.nihr.ac.uk
116
97. Centers for Disease Control and Prevention, National Center for Health Statistics, National VitalStatistics Reports. Lifetime costs of cerebral palsy. Deaths: Final Data for 2004. 2007;55(19).
98. WHO. WHO Recommendations on Interventions to Improve Preterm Birth Outcomes. Geneva:WHO; 2015.
99. Ware JE, Sherbourne CD. The MOS 36-item short-form health survey (SF-36). I. Conceptualframework and item selection. Med Care 1992;30:473–83. https://doi.org/10.1097/00005650-199206000-00002
100. Brooks R. EuroQol: the current state of play. Health Policy 1996;37:53–72. https://doi.org/10.1016/0168-8510(96)00822-6
101. Rowen D, Brazier J, Roberts J. Mapping SF-36 onto the EQ-5D index: how reliable is therelationship? Health Qual Life Outcomes 2009;7:27. https://doi.org/10.1186/1477-7525-7-27
102. Feingold E, Sheir-Neiss G, Melnychuk J, Bachrach S, Paul D. HRQL and severity of brain ultrasoundfindings in a cohort of adolescents who were born preterm. J Adolesc Health 2002;31:234–9.https://doi.org/10.1016/S1054-139X(01)00407-4
103. Beaudoin S, Tremblay GM, Croitoru D, Benedetti A, Landry JS. Healthcare utilization andhealth-related quality of life of adult survivors of preterm birth complicated by bronchopulmonarydysplasia. Acta Paediatr 2013;102:607–12. https://doi.org/10.1111/apa.12217
104. Alemdaroglu I, Kepenek Varol B, Tanriverdi M, Guler S, Iscan A. Comparison of the level ofdepression and quality of life of mothers who have low birth weight premature infants with orwithout intracranial/intraventricular hemorrhage. Fizyoterapi Rehabilitasyon 2015;26:S81.
105. Hill PD, Aldag JC. Maternal perceived quality of life following childbirth. J Obstet GynecolNeonatal Nurs 2007;36:328–34. https://doi.org/10.1111/j.1552-6909.2007.00164.x
106. Couto ER, Couto E, Vian B, Gregório Z, Nomura ML, Zaccaria R, Passini R. Quality of life,depression and anxiety among pregnant women with previous adverse pregnancy outcomes.Sao Paulo Med J 2009;127:185–9. https://doi.org/10.1590/S1516-31802009000400002
107. Saigal S, Ferro MA, Van Lieshout RJ, Schmidt LA, Morrison KM, Boyle MH. Health-RelatedQuality of Life Trajectories of Extremely Low Birth Weight Survivors into Adulthood. J Pediatr2016;179:68–73.e1. https://doi.org/10.1016/j.jpeds.2016.08.018
108. Carroll AE, Downs SM. Improving decision analyses: parent preferences (utility values) for pediatrichealth outcomes. J Pediatr 2009;155:21–5.e5. https://doi.org/10.1016/j.jpeds.2009.01.040
109. Bastek JA, Langmuir H, Kondapalli LA, Paré E, Adamczak JE, Srinivas SK. Antenatal corticosteroidsfor late-preterm infants: a decision-analytic and economic analysis. ISRN Obstet Gynecol2012;2012:491595. https://doi.org/10.5402/2012/491595
110. Fawke J, Lum S, Kirkby J, Hennessy E, Marlow N, Rowell V, et al. Lung function and respiratorysymptoms at 11 years in children born extremely preterm: the EPICure study. Am J Respir CritCare Med 2010;182:237–45. https://doi.org/10.1164/rccm.200912-1806OC
111. Cooke RW. Health, lifestyle, and quality of life for young adults born very preterm. Arch Dis Child2004;89:201–6. https://doi.org/10.1136/adc.2003.030197
112. Båtsvik B, Vederhus BJ, Halvorsen T, Wentzel-Larsen T, Graue M, Markestad T. Health-relatedquality of life may deteriorate from adolescence to young adulthood after extremely pretermbirth. Acta Paediatr 2015;104:948–55. https://doi.org/10.1111/apa.13069
113. Lund LK, Vik T, Lydersen S, Løhaugen GC, Skranes J, Brubakk AM, Indredavik MS. Mental health,quality of life and social relations in young adults born with low birth weight. Health Qual LifeOutcomes 2012;10:146. https://doi.org/10.1186/1477-7525-10-146
DOI: 10.3310/hta23130 HEALTH TECHNOLOGY ASSESSMENT 2019 VOL. 23 NO. 13
© Queen’s Printer and Controller of HMSO 2019. This work was produced by Varley-Campbell et al. under the terms of a commissioning contract issued by the Secretary of Statefor Health and Social Care. This issue may be freely reproduced for the purposes of private research and study and extracts (or indeed, the full report) may be included inprofessional journals provided that suitable acknowledgement is made and the reproduction is not associated with any form of advertising. Applications for commercialreproduction should be addressed to: NIHR Journals Library, National Institute for Health Research, Evaluation, Trials and Studies Coordinating Centre, Alpha House, University ofSouthampton Science Park, Southampton SO16 7NS, UK.
117

114. Papaioannou D, Brazier J, Paisley S. NICE DSU Technical Support Document 9: The Identification,Review and Synthesis of Health State Utility Values from the Literature. London: NICE; 2010.
115. Vandenbussche FP, De Jong-Potjer LC, Stiggelbout AM, Le Cessie S, Keirse MJ. Differences inthe valuation of birth outcomes among pregnant women, mothers, and obstetricians. Birth1999;26:178–83. https://doi.org/10.1046/j.1523-536x.1999.00178.x
116. Parisaei M, Currie J, O’Gorman N, Morris S, David AL. Implementation of foetal fibronectin testing:Admissions, maternal interventions and costs at 1 year. J Obstet Gynaecol 2016;36:888–92.https://doi.org/10.3109/01443615.2016.1168374
117. Curtis L, Burns A. Unit Costs of Health and Social Care 2016. Canterbury: Personal Social ServicesResearch Unit, University of Kent; 2016.
118. Gale C, Hay A, Philipp C, Khan R, Santhakumaran S, Ratnavel N. In-utero transfer is too difficult:results from a prospective study. Early Hum Dev 2012;88:147–50. https://doi.org/10.1016/j.earlhumdev.2011.07.016
119. Office for National Statistics. National Life Tables UK: 2014–2016. URL: www.ons.gov.uk/peoplepopulationandcommunity/birthsdeathsandmarriages/lifeexpectancies/bulletins/nationallifetablesunitedkingdom/2014to2016
120. Battersby C, Statnikov Y, Santhakumaran S, Gray D, Modi N, Costeloe K, et al. The United KingdomNational Neonatal Research Database: a validation study. PLOS ONE 2018;13:e0201815. https://doi.org/10.1371/journal.pone.0201815
121. Villeneuve E, Landa P, Allen M, Spencer A, Prosser S, Gibson A, et al. A framework to address keyissues of neonatal service configuration in England: the NeoNet multimethods study. Health ServDeliv Res 2018;6(35). https://doi.org/10.3310/hsdr06350
122. Landry JS, Croitoru D, Jin Y, Schwartzman K, Benedetti A, Menzies D. Health care utilizationby preterm infants with respiratory complications in Quebec. Can Respir J 2012;19:255–60.https://doi.org/10.1155/2012/606507
123. Khan KA, Petrou S, Dritsaki M, Johnson SJ, Manktelow B, Draper ES, et al. Economic costsassociated with moderate and late preterm birth: a prospective population-based study.BJOG 2015;122:1495–505. https://doi.org/10.1111/1471-0528.13515
124. Gale C, Morris I, Neonatal Data Analysis Unit (NDAU) Steering Board. The UK National NeonatalResearch Database: using neonatal data for research, quality improvement and more. Arch DisChild Educ Pract Ed 2016;101:216–18. https://doi.org/10.1136/archdischild-2015-309928
125. Adams E. The New NCCMDS, Neonatal HRGs 2016 and Reference Costs: A Guide for Clinicians.National Casemix Office, NHS England; London: 2016.
126. Mangham LJ, Petrou S, Doyle LW, Draper ES, Marlow N. The cost of preterm birth throughoutchildhood in England and Wales. Pediatrics 2009;123:e312–27. https://doi.org/10.1542/peds.2008-1827
127. Briggs A, Sculpher M, Claxton K. Decision Modelling for Health Economic Evaluation. Oxford:Oxford University Press; 2006.
128. Sanchez-Ramos L, Delke I, Zamora J, Kaunitz AM. Fetal fibronectin as a short-term predictor ofpreterm birth in symptomatic patients: a meta-analysis. Obstet Gynecol 2009;114:631–40.https://doi.org/10.1097/AOG.0b013e3181b47217
129. Boots AB, Sanchez-Ramos L, Bowers DM, Kaunitz AM, Zamora J, Schlattmann P. The short-termprediction of preterm birth: a systematic review and diagnostic meta-analysis. Am J ObstetGynecol 2014;210:54.e1–10. https://doi.org/10.1016/j.ajog.2013.09.004
REFERENCES
NIHR Journals Library www.journalslibrary.nihr.ac.uk
118

130. Wing DA, Haeri S, Silber AC, Roth CK, Weiner CP, Echebiri NC, et al. Placental alpha microglobulin-1compared with fetal fibronectin to predict preterm delivery in symptomatic women. Obstet Gynecol2017;130:1183–91. https://doi.org/10.1097/AOG.0000000000002367
131. Lotfi G, Faraz S, Nasir R, Somini S, Abdeldayem RM, Koratkar R, et al. Comparison of theeffectiveness of a PAMG-1 test and standard clinical assessment in the prediction of preterm birthand reduction of unnecessary hospital admissions. J Matern Fetal Neonatal Med 2017;26:1–5.https://doi.org/10.1080/14767058.2017.1391782
132. Melchor JC, Navas H, Marcos M, Iza A, de Diego M, Rando D, et al. Retrospective cohort study ofPAMG-1 and fetal fibronectin test performance in assessing spontaneous preterm birth risk insymptomatic women attending an emergency obstetrical unit. Ultrasound Obstet Gynecol2017;52(5):644–9. https://doi.org/10.1002/uog.18892
133. Morrison A, Polisena J, Husereau D, Moulton K, Clark M, Fiander M, et al. The effect ofEnglish-language restriction on systematic review-based meta-analyses: a systematic review ofempirical studies. Int J Technol Assess Health Care 2012;28:138–44. https://doi.org/10.1017/S0266462312000086
134. Leeflang MM, Rutjes AW, Reitsma JB, Hooft L, Bossuyt PM. Variation of a test’s sensitivity andspecificity with disease prevalence. CMAJ 2013;185:E537–44. https://doi.org/10.1503/cmaj.121286
135. Norman JE, Marlow N, Messow CM, Shennan A, Bennett PR, Thornton S, et al. Vaginalprogesterone prophylaxis for preterm birth (the OPPTIMUM study): a multicentre, randomised,double-blind trial. Lancet 2016;387:2106–16. https://doi.org/10.1016/S0140-6736(16)00350-0
136. Abenhaim HA, Morin L, Benjamin A. Does availability of fetal fibronectin testing in themanagement of threatened preterm labour affect the utilization of hospital resources? J ObstetGynaecol Can 2005;27:689–94. https://doi.org/10.1016/S1701-2163(16)30547-3
137. Joffe GM, Jacques D, Bemis-Heys R, Burton R, Skram B, Shelburne P. Impact of the fetal fibronectinassay on admissions for preterm labor. Am J Obstet Gynecol 1999;180:581–6. https://doi.org/10.1016/S0002-9378(99)70258-9
138. Berghella V, Saccone G. Fetal fibronectin testing for prevention of preterm birth in singletonpregnancies with threatened preterm labor: a systematic review and meta-analysis of randomizedcontrolled trials. Am J Obstet Gynecol 2016;215:431–8. https://doi.org/10.1016/j.ajog.2016.04.038
139. Lee GT, Burwick R, Zork N, Kjos S. Does the use of fetal fibronectin in an algorithm for pretermlabor reduce triage evaluation times? J Matern Fetal Neonatal Med 2013;26:706–9. https://doi.org/10.3109/14767058.2012.750291
140. Duley L, Bennett P. Tocolysis for Women in Preterm labour. Green-top Guideline No. 1b. London:Royal College of Obstetricians and Gynaecologists; 2011. URL: www.rcog.org.uk/files/rcog-corp/GTG1b26072011.pdf (cited 14 February 2012).
141. Roberts D. Antenatal Corticosteroids to Reduce Neonatal Morbidity and Mortality. Green-topGuideline No. 7. London: Royal College of Obstetricians and Gynaecologists; 2010.URL: www.rcog.org.uk/files/rcog-corp/GTG%207.pdf (cited 14 February 2012).
142. Sedgwick P. What is a non-inferiority trial? BMJ 2013;347:f6853. https://doi.org/10.1136/bmj.f6853
143. Healthcare Commission. Towards Better Births – A Review of Maternity Services in England.London: Commission for Healthcare Audit and Inspection; 2008.
144. Kenyon SL, Taylor DJ, Tarnow-Mordi W, ORACLE Collaborative Group. Broad-spectrum antibioticsfor spontaneous preterm labour: the ORACLE II randomised trial. ORACLE Collaborative Group.Lancet 2001;357:989–94. https://doi.org/10.1016/S0140-6736(00)04234-3
DOI: 10.3310/hta23130 HEALTH TECHNOLOGY ASSESSMENT 2019 VOL. 23 NO. 13
© Queen’s Printer and Controller of HMSO 2019. This work was produced by Varley-Campbell et al. under the terms of a commissioning contract issued by the Secretary of Statefor Health and Social Care. This issue may be freely reproduced for the purposes of private research and study and extracts (or indeed, the full report) may be included inprofessional journals provided that suitable acknowledgement is made and the reproduction is not associated with any form of advertising. Applications for commercialreproduction should be addressed to: NIHR Journals Library, National Institute for Health Research, Evaluation, Trials and Studies Coordinating Centre, Alpha House, University ofSouthampton Science Park, Southampton SO16 7NS, UK.
119

145. Information Services Division. Scottish Perinatal Infant Morbidity and Mortality Report 2008.NHS Scotland; 2009. URL: www.isdscotland.org/isd/3112.html
146. Macintyre-Beon C, Skeoch C, Jackson L, Boot P, Cameron A. Perinatal Collaborative TransportStudy (CoTS) Final Report. NHS Quality Improvement Scotland; 2007.
147. Gyetvai K, Hannah ME, Hodnett ED, Ohlsson A. Tocolytics for preterm labor: a systematic review.Obstet Gynecol 1999;94:869–77. https://doi.org/10.1097/00006250-199911001-00043
148. Moutquin JM, Effer SB, Milner RA, Mohide PT, Sauve RS, Sinclair JC, et al. Treatment of pretermlabor with the beta-adrenergic agonist ritodrine. New Engl J Med 1992;327:308–12. https://doi.org/10.1056/NEJM199207303270503
149. Crowley PA. Antenatal corticosteroid therapy: a meta-analysis of the randomized trials, 1972 to1994. Am J Obstet Gynecol 1995;173:322–35. https://doi.org/10.1016/0002-9378(95)90222-8
150. Roos C, Spaanderman ME, Schuit E, Bloemenkamp KW, Bolte AC, Cornette J, et al. Effect ofmaintenance tocolysis with nifedipine in threatened preterm labor on perinatal outcomes:a randomized controlled trial. JAMA 2013;309:41–7. https://doi.org/10.1001/jama.2012.153817
151. Vis JY, van Baaren GJ, Wilms FF, Oudijk MA, Kwee A, Porath MM, et al. Randomized comparisonof nifedipine and placebo in fibronectin-negative women with symptoms of preterm laborand a short cervix (APOSTEL-I Trial). Am J Perinatol 2015;32:451–60. https://doi.org/10.1055/s-0034-1390346
152. van Baaren GJ, Vis JY, Wilms FF, Oudijk MA, Kwee A, Porath MM, et al. Predictive value ofcervical length measurement and fibronectin testing in threatened preterm labor. Obstet Gynecol2014;123:1185–92. https://doi.org/10.1097/AOG.0000000000000229
153. Baumgardt M, Bucher HU, Mieth RA, Fauchère JC. Health-related quality of life of formervery preterm infants in adulthood. Acta Paediatr 2012;101:e59–63. https://doi.org/10.1111/j.1651-2227.2011.02422.x
154. Berbis J, Einaudi MA, Simeoni MC, Brévaut-Malaty V, Auquier P, d’Ercole C, Gire C. Quality of lifeof early school-age French children born preterm: a cohort study. Eur J Obstet Gynecol ReprodBiol 2012;162:38–44. https://doi.org/10.1016/j.ejogrb.2012.02.006
155. Bianco F, Cremonesi G, Montirosso R, Borgatt R. Are preterm infants likely to have the samequality of life as those born at term? Do preterm infants treated with surfactant have the samerespiratory outcome as those not treated? Results from the NEO-ACQUA study. Neonatology2011;99:371–2.
156. Ketharanathan N, Lee W, de Mol AC. Health-related quality of life, emotional and behavioralproblems in mild to moderate prematures at (pre-)school age. Early Hum Dev 2011;87:705–9.https://doi.org/10.1016/j.earlhumdev.2011.05.011
157. Gray R, Petrou S, Hockley C, Gardner F. Self-reported health status and health-related quality oflife of teenagers who were born before 29 weeks’ gestational age. Pediatrics 2007;120:e86–93.https://doi.org/10.1542/peds.2006-2034
158. Petrou S, Abangma G, Johnson S, Wolke D, Marlow N. Costs and health utilities associated withextremely preterm birth: evidence from the EPICure study. Value Health 2009;12:1124–34.https://doi.org/10.1111/j.1524-4733.2009.00580.x
159. Roberts G, Burnett AC, Lee KJ, Cheong J, Wood SJ, Anderson PJ, et al. Quality of life andfunctional outcomes in extremely preterm or extremely low birth weight 18-year-olds born in thepost-surfactant – a regional study. J Paediatr Child Health 2013;49:22–3.
REFERENCES
NIHR Journals Library www.journalslibrary.nihr.ac.uk
120

160. van Lunenburg A, van der Pal SM, van Dommelen P, van der Pal-de Bruin KM, BennebroekGravenhorst J, Verrips GH. Changes in quality of life into adulthood after very preterm birth and/orvery low birth weight in the Netherlands. Health Qual Life Outcomes 2013;11:51. https://doi.org/10.1186/1477-7525-11-51
161. Verrips E, Vogels T, Saigal S, Wolke D, Meyer R, Hoult L, Verloove-Vanhorick SP. Health-relatedquality of life for extremely low birth weight adolescents in Canada, Germany, and theNetherlands. Pediatrics 2008;122:556–61. https://doi.org/10.1542/peds.2007-1043
162. Wolke D. Born Extremely Low Birth Weight and Health Related Quality of Life into Adulthood.J Pediatr 2016;179:11–12.e1. https://doi.org/10.1016/j.jpeds.2016.09.012
163. Wolke D, Chernova J, Eryigit-Madzwamuse S, Samara M, Zwierzynska K, Petrou S. Self andparent perspectives on health-related quality of life of adolescents born very preterm. J Pediatr2013;163:1020–6.e2. https://doi.org/10.1016/j.jpeds.2013.04.030
164. Zwicker JG, Harris SR. Quality of life of formerly preterm and very low birth weight infants frompreschool age to adulthood: a systematic review. Pediatrics 2008;121:e366–76. https://doi.org/10.1542/peds.2007-0169
165. Korvenranta E, Linna M, Rautava L, Andersson S, Gissler M, Hallman M, et al. Hospital costs andquality of life during 4 years after very preterm birth. Arch Pediatr Adolesc Med 2010;164:657–63.https://doi.org/10.1001/archpediatrics.2010.99
166. Rautava L, Häkkinen U, Korvenranta E, Andersson S, Gissler M, Hallman M, et al. Health-relatedquality of life in 5-year-old very low birth weight infants. J Pediatr 2009;155:338–43.e1–3.https://doi.org/10.1016/j.jpeds.2009.03.061
167. Lehtonen L, Rautava L, Korvenranta E, Korvenranta H, Peltola M, Hakkinen U. PERFECT preterm infantstudy. Annals of Medicine 2011;43:S47–53. https://doi.org/10.3109/07853890.2011.586359
168. Dalziel SR, Lim VK, Lambert A, McCarthy D, Parag V, Rodgers A, Harding JE. Psychologicalfunctioning and health-related quality of life in adulthood after preterm birth. Dev Med ChildNeurol 2007;49:597–602. https://doi.org/10.1111/j.1469-8749.2007.00597.x
169. Husby IM, Stray KM, Olsen A, Lydersen S, Indredavik MS, Brubakk AM, et al. Long-term follow-upof mental health, health-related quality of life and associations with motor skills in young adultsborn preterm with very low birth weight. Health Qual Life Outcomes 2016;14:56. https://doi.org/10.1186/s12955-016-0458-y
170. Einerson BD, Grobman WA, Miller ES. Cost-effectiveness of risk-based screening for cervicallength to prevent preterm birth. Am J Obstet Gynecol 2016;215:100.e1–7. https://doi.org/10.1016/j.ajog.2016.01.192
171. Torrance GW, Furlong W, Feeny D, Boyle M. Multi-attribute preference functions. PharmacoEconomics1995;7:503–20. https://doi.org/10.2165/00019053-199507060-00005
172. Tengs TO, Wallace A. One thousand health-related quality-of-life estimates. Med Care2000;38:583–637. https://doi.org/10.1097/00005650-200006000-00004
173. Coyle SB. Maternal concern, social support, and health-related quality of life across childhood.Res Nurs Health 2011;34:297–309. https://doi.org/10.1002/nur.20438
174. Pham CT, Crowther CA. Birth outcomes: utility values that postnatal women, midwives andmedical staff express. BJOG 2003;110:121–7. https://doi.org/10.1046/j.1471-0528.2003.02021.x
175. Feeny D, Furlong W, Torrance GW, Goldsmith CH, Zhu Z, DePauw S, et al. Multiattribute andsingle-attribute utility functions for the health utilities index mark 3 system. Med Care2002;40:113–28. https://doi.org/10.1097/00005650-200202000-00006
DOI: 10.3310/hta23130 HEALTH TECHNOLOGY ASSESSMENT 2019 VOL. 23 NO. 13
© Queen’s Printer and Controller of HMSO 2019. This work was produced by Varley-Campbell et al. under the terms of a commissioning contract issued by the Secretary of Statefor Health and Social Care. This issue may be freely reproduced for the purposes of private research and study and extracts (or indeed, the full report) may be included inprofessional journals provided that suitable acknowledgement is made and the reproduction is not associated with any form of advertising. Applications for commercialreproduction should be addressed to: NIHR Journals Library, National Institute for Health Research, Evaluation, Trials and Studies Coordinating Centre, Alpha House, University ofSouthampton Science Park, Southampton SO16 7NS, UK.
121

176. Furlong W, Feeny D, Torrance G, Goldsmith C, DePauw S, Zhu Z, et al. Multiplicative Multi-attributeUtility Function for the Health Utilities Index Mark 3 (HUI3) System: A Technical Report. Hamilton,ON: Centre for Health Economics and Policy Analysis, McMaster University; 1998.
177. Saigal S, Feeny D, Furlong W, Rosenbaum P, Burrows E, Torrance G. Comparison of thehealth-related quality of life of extremely low birth weight children and a reference groupof children at age eight years. J Pediatr 1994;125:418–25. https://doi.org/10.1016/S0022-3476(05)83289-5
178. Saigal S, Rosenbaum P, Stoskopf B, Hoult L, Furlong W, Feeny D, et al. Comprehensiveassessment of the health status of extremely low birth weight children at eight years of age:comparison with a reference group. J Pediatr 1994;125:411–17. https://doi.org/10.1016/S0022-3476(05)83288-3
179. Saigal S, Feeny D, Rosenbaum P, Furlong W, Burrows E, Stoskopf B. Self-perceived health statusand health-related quality of life of extremely low-birth-weight infants at adolescence. JAMA1996;276:453–9. https://doi.org/10.1001/jama.1996.03540060029031
180. Saigal S, Rosenbaum PL, Feeny D, Burrows E, Furlong W, Stoskopf BL, et al. Parental perspectivesof the health status and health-related quality of life of teen-aged children who were extremelylow birth weight and term controls. Pediatrics 2000;105:569–74. https://doi.org/10.1542/peds.105.3.569
181. Saigal S, Stoskopf B, Pinelli J, Streiner D, Hoult L, Paneth N, Goddeeris J. Self-perceivedhealth-related quality of life of former extremely low birth weight infants at young adulthood.Pediatrics 2006;118:1140–8. https://doi.org/10.1542/peds.2006-0119
182. Kim SH, Kim SO, Lee SI, Jo MW. Deriving a mapping algorithm for converting SF-36 scores to EQ-5Dutility score in a Korean population. Health Qual Life Outcomes 2014;12:145. https://doi.org/10.1186/s12955-014-0145-9
183. Dakin H. Review of studies mapping from quality of life or clinical measures to EQ-5D: an onlinedatabase. Health Qual Life Outcomes 2013;11:151. https://doi.org/10.1186/1477-7525-11-151
184. Kwon J, Kim SW, Ungar WJ, Tsiplova K, Madan J, Petrou S. A systematic review and meta-analysisof childhood health utilities. Med Decis Making 2018;38:277–305. https://doi.org/10.1177/0272989X17732990
185. Wolke D, Baumann N, Busch B, Bartmann P. Very preterm birth and parents’ quality of life27 years later. Pediatrics 2017;140:e20171263. https://doi.org/10.1542/peds.2017-1263
186. Office for National Statistics. Pregnancy and Ethnic Factors Influencing Births and Infant Mortality.London: ONS; 2015.
187. Crump C, Sundquist K, Sundquist J, Winkleby MA. Gestational age at birth and mortality inyoung adulthood. JAMA 2011;306:1233–40. https://doi.org/10.1001/jama.2011.1331
188. Swamy GK, Ostbye T, Skjaerven R. Association of preterm birth with long-term survival,reproduction, and next-generation preterm birth. JAMA 2008;299:1429–36. https://doi.org/10.1001/jama.299.12.1429
189. Adeza Biomedical. Adeza Biomedical Fetal Fibronectin Enzyme Immunoassay and Rapid fFN forthe TLiIQ system: Information for Healthcare Providers. 2003. URL: http://labmed.ucsf.edu/labmanual/db/resource/FFN_Product_Insert.pdf (accessed December 2017).
REFERENCES
NIHR Journals Library www.journalslibrary.nihr.ac.uk
122

Appendix 1 Literature search strategies
Database searches
MEDLINEHost: Ovid.
Data parameters: Ovid MEDLINE(R) Epub Ahead of Print, In-Process & Other Non-Indexed Citations, OvidMEDLINE(R) Daily, Ovid MEDLINE and Versions(R).
Date range searched: inception to 24 July 2017.
Date searched: 24 July 2017.
Searcher: Chris Cooper.
Search checked by: Jo Varley-Campbell.
Hits: 916.
Search strategy
1. (PartoSure or Parto Sure or PartoSureR or Parto SureR).ti,ab,kw. (3)2. ((Placental alpha adj5 test$) or PAMG-1).ti,ab,kw. (44)3. (Actim Partus or Actim PartusR or “insulin-like growth factor-binding protein 1 test” or phIGFBP-1 or
(IGFBP-1 adj5 test$)).ti,ab,kw. (103)4. (((Fetal or foetal) adj5 fibronectin$) or fFN).ti,ab,kw. (787)5. 1 or 2 or 3 or 4 (916)
Notes: not applicable.
File name: PartoSure MEDLINE 916 RIS.txt
EMBASEHost: Ovid.
Data parameters: 1974 to 21 July 2017.
Date range searched: inception to 24 July 2017.
Date searched: 24 July 2017.
Searcher: Chris Cooper.
Search checked by: Jo Varley-Campbell.
Hits: 1270.
DOI: 10.3310/hta23130 HEALTH TECHNOLOGY ASSESSMENT 2019 VOL. 23 NO. 13
© Queen’s Printer and Controller of HMSO 2019. This work was produced by Varley-Campbell et al. under the terms of a commissioning contract issued by the Secretary of Statefor Health and Social Care. This issue may be freely reproduced for the purposes of private research and study and extracts (or indeed, the full report) may be included inprofessional journals provided that suitable acknowledgement is made and the reproduction is not associated with any form of advertising. Applications for commercialreproduction should be addressed to: NIHR Journals Library, National Institute for Health Research, Evaluation, Trials and Studies Coordinating Centre, Alpha House, University ofSouthampton Science Park, Southampton SO16 7NS, UK.
123

Search strategy
1. (PartoSure or Parto Sure or PartoSureR or Parto SureR).ti,ab,kw. (13)2. ((Placental alpha adj5 test$) or PAMG-1).ti,ab,kw. (75)3. (Actim Partus or Actim PartusR or “insulin-like growth factor-binding protein 1 test” or phIGFBP-1 or
(IGFBP-1 adj5 test$)).ti,ab,kw. or *actim partus test/ (158)4. (((Fetal or foetal) adj5 fibronectin$) or fFN).ti,ab,kw. (1080)5. 1 or 2 or 3 or 4 (1270)
Notes: not applicable.
File name: PartoSure Embase 1270 RIS.
The Cochrane Library (Cochrane Database of Systematic Reviews, Cochrane CentralRegister of Controlled Trials, Database of Abstracts of Reviews of Effects, HealthTechnology Assessment and NHS Economic Evaluation Database)Host: Wiley Interface.
Data parameters: (CDSR: issue 7 of 12, July 2017; DARE: issue 2 of 4, April 2015; CENTRAL: issue 6 of 12,June 2017; HTA issue 4 of 4, October 2016; and NHS EED issue 2 of 4, April 2015).
Date range searched: inception to 24 July 2017.
Date searched: 24 July 2017.
Searcher: Chris Cooper.
Search checked by: Jo Varley-Campbell.
Hits: 159 [note: 164 hits were identified. 159 study records were downloaded and five records from themethods register (3) and Cochrane groups register (2) were not downloaded (totalling 164). NHS EED andDARE were searched as an archive because they have not been updated since 2015]: CDSR 36, DARE 13,CENTRAL 91, HTA 14 and NHS EED 5.
Search strategy
#1 (PartoSure or Parto Sure or PartoSureR or Parto SureR) (17)#2 ((Placental alpha near/5 test*) or (PAMG-1)) (15)#3 (Actim Partus or Actim PartusR or “insulin-like growth factor-binding protein 1 test” or phIGFBP-1 or(IGFBP-1 near/5 test*)) (13)#4 (((Fetal or foetal) near/5 fibronectin*) or fFN) (125)#5 #1 or #2 or #3 or #4 (164)
BioSciences Information ServiceHost: Clarivate Analytics.
Data parameters: 1969–2017.
Date range searched: inception to 24 July 2017.
Date searched: 24 July 2017.
Searcher: Chris Cooper.
APPENDIX 1
NIHR Journals Library www.journalslibrary.nihr.ac.uk
124

Search checked by: Jo Varley-Campbell.
Hits: 806.
Search strategy
(PartoSure or Parto Sure or PartoSureR or Parto SureR) (2)((Placental alpha near/6 test*) or (PAMG-1)) (25)(Actim Partus or Actim PartusR or “insulin-like growth factor-binding protein 1 test” or phIGFBP-1 or(IGFBP-1 near/6 test*)) (80)(((Fetal or foetal) near/6 fibronectin*) or fFN) (716)
Notes: not applicable.
File name: PartoSure BIOSIS 806 RIS.
Web of ScienceHost: Clarivate Analytics.
Data parameters: 1900–2017.
Date range searched: inception to 24 July 2017.
Date searched: 24 July 2017.
Searcher: Chris Cooper.
Search checked by: Jo Varley-Campbell.
Hits: 1358.
Search strategy
(PartoSure or Parto Sure or PartoSureR or Parto SureR) (3)((Placental alpha near/6 test*) or (PAMG-1)) (45)(Actim Partus or Actim PartusR or “insulin-like growth factor-binding protein 1 test” or phIGFBP-1 or(IGFBP-1 near/6 test*)) (124)(((Fetal or foetal) near/6 fibronectin*) or fFN) (1226)
Notes: not applicable.
File name: PartoSure WoS 1358 RIS.
Cumulative Index to Nursing and Allied Health LiteratureHost: EBSCOhost.
Data parameters: 1937–2017.
Date range searched: inception to 24 July 2017.
Date searched: 24 July 2017.
Searcher: Chris Cooper.
DOI: 10.3310/hta23130 HEALTH TECHNOLOGY ASSESSMENT 2019 VOL. 23 NO. 13
© Queen’s Printer and Controller of HMSO 2019. This work was produced by Varley-Campbell et al. under the terms of a commissioning contract issued by the Secretary of Statefor Health and Social Care. This issue may be freely reproduced for the purposes of private research and study and extracts (or indeed, the full report) may be included inprofessional journals provided that suitable acknowledgement is made and the reproduction is not associated with any form of advertising. Applications for commercialreproduction should be addressed to: NIHR Journals Library, National Institute for Health Research, Evaluation, Trials and Studies Coordinating Centre, Alpha House, University ofSouthampton Science Park, Southampton SO16 7NS, UK.
125

Search checked by: Jo Varley-Campbell.
Hits: 258.
Search strategy
(PartoSure or Parto Sure or PartoSureR or Parto SureR) (4)((Placental alpha N6 test*) or (PAMG-1)) (22)(Actim Partus or Actim PartusR or “insulin-like growth factor-binding protein 1 test” or phIGFBP-1 or(IGFBP-1 N6 test*)) (25)(((Fetal or foetal) N6 fibronectin*) or fFN) (221)
Notes: not applicable.
File name: PartoSure CINAHL 258 RIS.
Trial registry searching
Date range searched: inception to 29 August 2017.
Date searched: 29 August 2017.
Searcher: Sophie Dodman.
ClinicalTrials.gov (https://clinicaltrials.gov/ct2/home)Search terms, enumerated as four different searches:
1. Parto Sure2. Actim Partus3. Fetal fibronectin4. Foetal fibronectin
ISRCTN (www.isrctn.com/editAdvancedSearch)
1. Parto Sure2. Actim Partus3. Fetal fibronectin4. Foetal fibronectin
Web searching
Date searched: 17 September 2017.
Searcher: Chris Cooper.
The first 50 pages were searched in each instance.
APPENDIX 1
NIHR Journals Library www.journalslibrary.nihr.ac.uk
126

Search strategy
1. PartoSure2. PartoSure filetype:pdf3. “Actim Partus”4. “Actim Partus” filetype:pdf5. “Fetal fibronectin”6. “Fetal fibronectin” filetype:pdf
Utilities database searches
Ovid MEDLINE(R) Epub Ahead of Print, In-Process & Other Non-Indexed Citations,Ovid MEDLINE(R) Daily and Ovid MEDLINE(R) 1946 to PresentDate range searched: inception to 11 September 2017.
Date searched: 11 September 2017.
Search strategy
# Searches Results
1 exp Obstetric Labor, Premature/ 23,638
2 ((Pre term or preterm or premature or early or immature) adj5 (labo?r or birth$ or childbirth$ or deliver$or partu$ or baby or babies or child$ or infant$ or toddler$ or postnatal or neonatal)).ti,ab,ot,hw.
188,755
3 (PROM or PPROM or PROM or PTB).ti,ab,ot. 7439
4 ((Short$ or reduced or multiple) adj4 gestation$).ti,ab,ot. 4711
5 (low$ adj3 birth weight).ti,ab,kw. 26,742
6 1 or 2 or 3 or 4 or 5 210,020
7 (euroqol or euro qol or eq5d or eq 5d or EQ-5D or EQ-5D-Y or EQ-5D-5L).ti,ab,kw. 7897
8 (sf6 or sf 6 or short form 6 or shortform 6 or sf six or sfsix or shortform six or short form six).ti,ab,kw. 1831
9 (sf10 or sf 10 or short form 10 or shortform 10 or sf ten or sften or shortform ten or short formten).ti,ab,kw.
102
10 (sf12 or sf 12 or short form 12 or shortform 12 or sf twelve of sftwelve or shortform twelve or short formtwelve).ti,ab,kw.
4702
11 (sf16 or sf 16 or short form 16 or shortform 16 or sf sixteen or sfsixteen or shortform sixteen or shortform sixteen).ti,ab,kw.
28
12 (sf20 or sf 20 or short form 20 or shortform 20 or sf twenty of sftwenty or shortform twenty of shortform twenty).ti,ab,kw.
390
13 (sf36 or sf 36 or short form 36 or shortform 36 or sf thirtysix or sf thirty six or shortform thirstysix orshortform thirty six or short form thirty six or short form thirtysix or short form thirty six).ti,ab,kw.
22,677
14 (health utilities index$ or (hui or hui1 or hui2 or hui3 or hui4 or hui-4 or hui-1 or hui-2 or hui-3)).ti,ab,kw. 1483
15 (“time trade off” or “time tradeoff” or TTO).ti,ab,kw. 1668
16 standard gamble$.ti,ab,kw. 849
17 (QWB or “quality of wellbeing” or “quality of well being” or “quality of well-being” or (index adj3wellbeing)).ti,ab,kw.
570
18 "discrete choice".ti,ab,kw. 1359
19 (AQoL or “Assessment of Quality of Life”).ti,ab,kw. 1679
20 (HYE or HYES or health$1 year$1 equivalent$1).ti,ab,kw. 79
DOI: 10.3310/hta23130 HEALTH TECHNOLOGY ASSESSMENT 2019 VOL. 23 NO. 13
© Queen’s Printer and Controller of HMSO 2019. This work was produced by Varley-Campbell et al. under the terms of a commissioning contract issued by the Secretary of Statefor Health and Social Care. This issue may be freely reproduced for the purposes of private research and study and extracts (or indeed, the full report) may be included inprofessional journals provided that suitable acknowledgement is made and the reproduction is not associated with any form of advertising. Applications for commercialreproduction should be addressed to: NIHR Journals Library, National Institute for Health Research, Evaluation, Trials and Studies Coordinating Centre, Alpha House, University ofSouthampton Science Park, Southampton SO16 7NS, UK.
127

# Searches Results
21 ((quality adj2 life) or HRQoL or HRQL or QoL or (quality adjusted or adjusted life year$) or QALY* or qald$or QTIME$ or qale$ or qtime$ or daly*).ti,ab,kw. or Quality of life/ or Quality adjusted life years/
287,614
22 (health state or health status).ti,ab,kw. or Health status/ or Health status indicators/ 127,992
23 Value of Life/ 5752
24 ((utilit$ or disutilit$) adj3 (health$ or score$1 or scoring or valu$ or measur$ or evaluat$ or scale$1 orinstrument$1 or weight or weights or weighting or information or data or unit or units or life or estimat$or elicit$ or disease$ or mean or cost$ or expenditure$1 or gain or gains or loss or losses or lost oranalysis or index$ or indices or overall or reported or calculat$ or range$ or increment$ or state or statesor status)).ti,ab,kw.
29,499
25 7 or 8 or 9 or 10 or 11 or 12 or 13 or 14 or 15 or 16 or 17 or 18 or 19 or 20 or 21 or 22 or 23 or 24 422,994
26 (Parental Stressor Scale or PSS:NICU or Edinburgh Postpartum Depression Scale or EPDS or SpielbergerState-Trait Anxiety Inventory or STAI or “Family Adaptability and Cohesion Evaluation Scale II” or FACES IIor “The Impact of Bronchiolitis Hospitalization Questionnaire” or IBHQ or “Preschool Children Quality ofLife Questionnaire” or TNO AZL or TAPQOL or “Pediatric Quality of Life Inventory” or “Child HealthQuestionnaire” or CHQ or “The Preterm Birth Experience and Satisfaction Scale”).ti,ab,kw.
6377
27 25 or 26 427,211
28 6 and 27 4129
29 limit 28 to english language 3700
EMBASEDate range searched: 1974 to 8 September 2017.
Date searched: 11 September 2017.
Search strategy
# Searches Results
1 exp Obstetric Labor, Premature/ 40,189
2 ((Pre term or preterm or premature or early or immature) adj5 (labo?r or birth$ or childbirth$ or deliver$or partu$ or baby or babies or child$ or infant$ or toddler$ or postnatal or neonatal)).ti,ab,ot,hw.
208,972
3 (PROM or PPROM or PROM or PTB).ti,ab,ot. 10,995
4 ((Short$ or reduced or multiple) adj4 gestation$).ti,ab,ot. 6592
5 (low$ adj3 birth weight).ti,ab,kw. 33,872
6 1 or 2 or 3 or 4 or 5 238,680
7 (euroqol or euro qol or eq5d or eq 5d or EQ-5D or EQ-5D-Y or EQ-5D-5L).ti,ab,kw. 13,620
8 (sf6 or sf 6 or short form 6 or shortform 6 or sf six or sfsix or shortform six or short form six).ti,ab,kw. 1929
9 (sf10 or sf 10 or short form 10 or shortform 10 or sf ten or sften or shortform ten or short formten).ti,ab,kw.
149
10 (sf12 or sf 12 or short form 12 or shortform 12 or sf twelve of sftwelve or shortform twelve or short formtwelve).ti,ab,kw.
7188
11 (sf16 or sf 16 or short form 16 or shortform 16 or sf sixteen or sfsixteen or shortform sixteen or shortform sixteen).ti,ab,kw.
47
12 (sf20 or sf 20 or short form 20 or shortform 20 or sf twenty of sftwenty or shortform twenty of shortform twenty).ti,ab,kw.
381
13 (sf36 or sf 36 or short form 36 or shortform 36 or sf thirtysix or sf thirty six or shortform thirstysix orshortform thirty six or short form thirty six or short form thirtysix or short form thirty six).ti,ab,kw.
33,894
14 (health utilities index$ or (hui or hui1 or hui2 or hui3 or hui4 or hui-4 or hui-1 or hui-2 or hui-3)).ti,ab,kw. 2047
15 (“time trade off” or “time tradeoff” or TTO).ti,ab,kw. 2242
16 standard gamble$.ti,ab,kw. 992
APPENDIX 1
NIHR Journals Library www.journalslibrary.nihr.ac.uk
128

# Searches Results
17 (QWB or “quality of wellbeing” or “quality of well being” or “quality of well-being” or (index adj3wellbeing)).ti,ab,kw.
680
18 "discrete choice".ti,ab,kw. 1938
19 (AQoL or “Assessment of Quality of Life”).ti,ab,kw. 2465
20 (HYE or HYES or health$1 year$1 equivalent$1).ti,ab,kw. 135
21 ((quality adj2 life) or HRQoL or HRQL or QoL or (quality adjusted or adjusted life year$) or QALY* or qald$or QTIME$ or qale$ or qtime$ or daly*).ti,ab,kw. or Quality of life/ or Quality adjusted life years/
464,722
22 (health state or health status).ti,ab,kw. or Health status/ or Health status indicators/ 136,100
23 Value of Life/ 124,596
24 ((utilit$ or disutilit$) adj3 (health$ or score$1 or scoring or valu$ or measur$ or evaluat$ or scale$1 orinstrument$1 or weight or weights or weighting or information or data or unit or units or life or estimat$or elicit$ or disease$ or mean or cost$ or expenditure$1 or gain or gains or loss or losses or lost oranalysis or index$ or indices or overall or reported or calculat$ or range$ or increment$ or state or statesor status)).ti,ab,kw.
42,607
25 7 or 8 or 9 or 10 or 11 or 12 or 13 or 14 or 15 or 16 or 17 or 18 or 19 or 20 or 21 or 22 or 23 or 24 726,333
26 (Parental Stressor Scale or PSS:NICU or Edinburgh Postpartum Depression Scale or EPDS or SpielbergerState-Trait Anxiety Inventory or STAI or “Family Adaptability and Cohesion Evaluation Scale II” or FACES IIor “The Impact of Bronchiolitis Hospitalization Questionnaire” or IBHQ or “Preschool Children Quality ofLife Questionnaire” or TNO AZL or TAPQOL or “Pediatric Quality of Life Inventory” or “Child HealthQuestionnaire” or CHQ or “The Preterm Birth Experience and Satisfaction Scale”).ti,ab,kw.
9565
27 25 or 26 732,723
28 6 and 27 8472
29 limit 28 to english language 7634
NHS Economic Evaluation Database, Issue 2 of 4Date range searched: inception to April 2015.
Date searched: April 2015.
Date run: 11 September 2017.
Search strategy
#1 MeSH descriptor: [Obstetric Labor, Premature] explode all trees (1317)#2 ((Pre term or preterm or premature or early or immature) near/3 (labor or labour or birth* or childbirth*or deliver* or partu* or baby or babies or child* or infant* or toddler* or postnatal or neonatal)) (15,146)#3 (PROM or PPROM or PROM or PTB) (775)#4 ((Short* or reduced or multiple) near/4 gestation*) ((Short* or reduced or multiple) near/4gestation*) (563)#5 (low* near/3 birth weight) (low* near/3 birth weight) (4485)#6 #1 or #2 or #3 or #4 or #5 (17,627)
NHS EEDs, n = 250.
The School of Health and Related Research Health Utilities Database was hand-searched.
DOI: 10.3310/hta23130 HEALTH TECHNOLOGY ASSESSMENT 2019 VOL. 23 NO. 13
© Queen’s Printer and Controller of HMSO 2019. This work was produced by Varley-Campbell et al. under the terms of a commissioning contract issued by the Secretary of Statefor Health and Social Care. This issue may be freely reproduced for the purposes of private research and study and extracts (or indeed, the full report) may be included inprofessional journals provided that suitable acknowledgement is made and the reproduction is not associated with any form of advertising. Applications for commercialreproduction should be addressed to: NIHR Journals Library, National Institute for Health Research, Evaluation, Trials and Studies Coordinating Centre, Alpha House, University ofSouthampton Science Park, Southampton SO16 7NS, UK.
129

Adverse events database searches
MEDLINEDate searched: September 2017.
Search strategy
1. exp Obstetric Labor, Premature/
2. ((Pre term or preterm or premature or early or immature) adj5 (labo?r or birth$ or childbirth$ or deliver$ or partu$ orbaby or babies or child$ or infant$ or toddler$ or postnatal or neonatal)).ti,ab,ot,hw.
3. (PROM or PPROM or PROM or PTB).ti,ab,ot.
4. ((Short$ or reduced or multiple) adj4 gestation$).ti,ab,ot.
5. (low$ adj3 birth weight).ti,ab,kw.
6. 1 or 2 or 3 or 4 or 5
7. (cost$ or healthcare utilisation or healthcare utilization or expend$ or price$ or pricing or budget$ or value$).ti,ab,kw.
8. ((neonat$ or newborn$) and (mortality or death)).ti,ab,kw.
9. respiratory distress syndrome.ti,ab,kw.
10. intraventricular haemorrhage.ti,ab,kw.
11. 8 or 9 or 10
12. 6 and 7 and 11
13. limit 15 to english language
APPENDIX 1
NIHR Journals Library www.journalslibrary.nihr.ac.uk
130
Appendix 2 Additional details for qualityappraisal for the diagnostic test accuracy review
Patient selection
All included studies were single-gate DTA studies, and thus avoided the use of a case–control design (i.e. therewere no studies that selected a group of women who had delivered preterm and a group of control groupwomen who did not deliver preterm).41–62 In addition, all included studies avoided inappropriate exclusionof participants in terms of their participant inclusion and exclusion criteria. However, only 5 of the 20included studies47,48,50,58,60,61 were rated as having a low risk of bias due to patient selection (four assessingActim Partus and one assessing PartoSure). These studies reported that eligible women were enrolled intothe study consecutively.47,48,50,58,60,61 For the remaining 15 studies, it was unclear whether or not patientselection could have introduced bias because it was unclear whether a consecutive or random sample ofparticipants was recruited.
For all studies included in the review, there were no concerns about whether or not the includedparticipants matched the review question (see Table 5). However, it should be reiterated that in twostudies (APOSTEL-142,43 and Danti et al.50), all women included in the final analyses of index test data had atransvaginal cervical length measurement of ≤ 30 mm, which would probably increase the prevalence ofpreterm birth in these studies.
Index tests
Two of the included studies enable a direct comparison between two of the index tests of interest, byevaluating both index tests in the same population: the APOSTEL-1 study42,43 evaluated both Actim Partus andqfFN and the study by Hadzi-Lega et al.44 evaluated both Actim Partus and PartoSure. The other 18 studiesall evaluated only one of the index tests of interest, with three of the studies evaluating only PartoSure,41,59–61
the Bruijn study only evaluating qfFN62 and the remaining 14 studies evaluating only Actim Partus.
In all studies included in the review, except for the APOSTEL-1 study42,43 and the study by Cooper et al.,49
the risk that the conduct and interpretation of the test could have introduced bias was rated as low(see Table 5). This is because all studies either clearly reported prespecified thresholds for the test (qfFN) orused a test with a standardised threshold (Actim Partus or PartoSure), and owing to the timing of the tests,all studies other than APOSTEL-142,43 and the study by Cooper et al.49 interpreted the index tests withoutknowledge of the reference standard (the tests were conducted before the occurrence of preterm birth).In both the APOSTEL-1 study and the study by Cooper et al.,49 frozen samples were used (see Chapter 2,Frozen samples). In both studies, although samples were collected prior to the assessment of the referencestandard, the index tests (Actim Partus and qfFN in APOSTEL-142,43 and Actim Partus in Cooper et al.49)were interpreted after the assessment of the reference standard. For these index tests, it is unclear whetheror not these interpretations were made blind to whether or not preterm birth had occurred.42,43,49 It shouldbe noted, however, that this is unlikely to lead to a high risk of bias for either test because there is limitedneed for any subjective interpretation of the test results.
Although not covered by QUADAS-2, it should also be considered, in the studies assessing more than onetest (APOSTEL-142,43 and that by Hadzi-Lega et al.44) and in those that included a clinical assessment or atest not included in this review (e.g. transvaginal cervical length), whether clinicians were blinded tothis information when interpreting the index test. This is to mitigate any ‘cross-contamination’ of testresults (i.e. bias in the interpretation of the test owing to prior knowledge from another test or otherclinical information).
DOI: 10.3310/hta23130 HEALTH TECHNOLOGY ASSESSMENT 2019 VOL. 23 NO. 13
© Queen’s Printer and Controller of HMSO 2019. This work was produced by Varley-Campbell et al. under the terms of a commissioning contract issued by the Secretary of Statefor Health and Social Care. This issue may be freely reproduced for the purposes of private research and study and extracts (or indeed, the full report) may be included inprofessional journals provided that suitable acknowledgement is made and the reproduction is not associated with any form of advertising. Applications for commercialreproduction should be addressed to: NIHR Journals Library, National Institute for Health Research, Evaluation, Trials and Studies Coordinating Centre, Alpha House, University ofSouthampton Science Park, Southampton SO16 7NS, UK.
131
Even though, as previously mentioned, there is limited scope for bias to occur in the interpretation of anyof the index test results, it should be noted that the qfFN test does not require any subjective judgementof the test result, whereas both the Actim Partus and PartoSure tests require some judgement (albeitlimited). In the use of the Actim Partus test, the potential for bias when interpreting results is still greaterthan for the qfFN test when no subjective interpretation is required. For this reason, in the APOSTEL-1study, the Actim Partus test was conducted before the qfFN test.42,43 However, additional tests were alsocarried out in the APOSTEL-1 study (qualitative fFN and cervical length measurement) and these wereconducted before the index tests; it is unclear whether or not the index tests were interpreted blind to theresults from the qualitative fFN test or the cervical length measurement. It is therefore unclear whether ornot any ‘cross-contamination’ of results may have taken place between the two tests, although, again,owing to the nature of the tests the scope for such bias is very limited. In the study by Hadzi-Lega et al.,44
in which both the PartoSure and Actim Partus tests were conducted, it was unclear which test was carriedout first, or indeed whether or not the tests were carried out in a predetermined order.44 The authors dostate that the reader of the index tests was blind to the results of ultrasound and digital examinations, andthis would mitigate any ‘cross-contamination’, however limited, between these assessments and the indextest results.
In four of the remaining studies, three assessing Actim Partus47,49,52 and one assessing PartoSure,59
it was reported that the index test was interpreted blind to the results of transvaginal cervical lengthmeasurements47,49,52 or qualitative fFN.59 In the studies by Azlin et al.,47 Bolotskikh et al.59 and Goyal et al.,52
this was because the cervical length measurement was conducted after the index test and in the studyby Cooper et al.59 it was stated that the Actim Partus test was conducted blind to the qualitative fFNmeasurement. In an additional study,48 it was stated that the sample was collected before the cervicallength measurement and that the Actim Partus test was conducted immediately, so it is likely that theindex test was interpreted before the cervical length measurement. In a further seven studies,50,51,54,56,57,60–62
additional tests or assessments (qualitative fFN and/or cervical length measurement) were reported, but itwas unclear whether or not the index tests were interpreted blind to the results of these additional tests.In the remaining six studies,41,45,46,53,55,58 there was no reported use of other tests or clinical assessments.
In all of the studies included in the review, except for the APOSTEL-1 study42,43 and the study by Tinget al.,56 there were no concerns that the conduct or interpretation of either of the index tests was differentfrom the review question (see Table 5). However, in APOSTEL-142,43 and the study by Ting et al.,56 the testwas conducted in a way that may have had an impact on the results because samples were taken from theposterior fornix of the vagina rather than the external cervical os.
Reference standard
In all of the included studies, the reference standard was whether or not preterm birth took place within48 hours and/or within 7 days.41–62 For this reason, the reference standard and the target condition wereidentical. Similarly, there were no concerns (in any of the studies) that the target condition, as defined bythe reference standard (preterm birth), did not match the review question (see Table 5).
In addition, because the reference standard was the occurrence of preterm birth rather than a diagnostictest, no assessment was made regarding whether or not the reference standard results were interpretedwithout knowledge of the results of the index test (i.e. because the reference standard was not somethingthat involved interpretation). For this reason, there were no concerns in any of the included studies regardingwhether the reference standard, its conduct or its interpretation could have introduced bias (see Table 5).
APPENDIX 2
NIHR Journals Library www.journalslibrary.nihr.ac.uk
132

Flow and timing
Of course, in all of the included studies, all participants ‘received’ a reference standard.41–62 Because thereference standard was the occurrence or otherwise of preterm delivery by 48 hours and/or by 7 days,this was the same for all participants in all of the included studies (see Table 5).
It is important to note that because the index tests in this review (PartoSure, Actim Partus and qfFN) aredesigned to be conducted before the occurrence of the reference standard, this in itself may introduce bias(through the use of treatments to prevent the occurrence of the reference standard). It is likely that use oftocolytics, although indicated, may inflate false-positive results and deflate true-positive results.
For all but two of the included studies (APOSTEL-142,43 and Cooper et al.49), the timing of the index test wasas per the manufacturers’ instructions. For both of these studies, the timing of the index tests may haveintroduced bias because frozen samples were used and it is unclear when the samples were thawed andused.42,43,49 However, this is unlikely to have had a large impact on the test results (see Chapter 2, Frozensamples, for further details).
Related to this, and outside the core QUADAS-2 questions, we also assessed blinding of clinical staff to theresults of the index test. Awareness of test results may necessarily influence treatment decisions, but mayalso lead to unintentional differences between those with positive and negative test results in the way inwhich a patient is managed. On the other hand, when treatment decisions are influenced by a test otherthan the index test, it may not be possible to ascertain from the literature whether or not index test positivesand negatives received different patterns of clinical management. In fact, only two of the included studiesreported that the managing clinicians were aware of the test results (Azlin et al.47 and Riboni et al.54),although in the study by Riboni et al.54 it was stated that clinical management was not altered by thisknowledge. In six of the studies,42–44,49,50,60–62 it was reported that clinical management personnel wereunaware of the index tests (management was based on qualitative fFN results and/or cervical length). In fourof the studies,51,53,55,56 clinical management personnel were blinded to the results of all tests reported in thestudy and, therefore, it was unclear on what basis clinical decisions were made. In the remaining eightstudies,41,45,46,48,52,57–59 it was not clearly reported whether or not clinical personnel were blinded to the indextest results.
Regarding missing data, it was clear that in 10 of the included studies41–45,48,52,56,57,60–62 some of theparticipants were excluded from the analysis (see Table 5). This may lead to bias because it was not clearfrom the study reports whether or not the women who were not included systematically differed fromthose whose data were analysed. In fact, only eight studies47,49–51,53,55,58,59 clearly specify that data wereanalysed from all participants who received tests, although it should be noted that, in the study byTanir et al.,55 two participants with failed tests were coded as test positives.
DOI: 10.3310/hta23130 HEALTH TECHNOLOGY ASSESSMENT 2019 VOL. 23 NO. 13
© Queen’s Printer and Controller of HMSO 2019. This work was produced by Varley-Campbell et al. under the terms of a commissioning contract issued by the Secretary of Statefor Health and Social Care. This issue may be freely reproduced for the purposes of private research and study and extracts (or indeed, the full report) may be included inprofessional journals provided that suitable acknowledgement is made and the reproduction is not associated with any form of advertising. Applications for commercialreproduction should be addressed to: NIHR Journals Library, National Institute for Health Research, Evaluation, Trials and Studies Coordinating Centre, Alpha House, University ofSouthampton Science Park, Southampton SO16 7NS, UK.
133


Appendix 3 Supplementary citations and data
Included systematic reviews
Corabian P. The Actim™ Partus versus the TLiIQ® System as rapid response tests to aid in diagnosingpreterm labour in symptomatic women (Structured abstract). Health Technol Assess 2008;(4).URL: http://onlinelibrary.wiley.com/o/cochrane/clhta/articles/HTA-32008100231/frame.html(accessed September 2017).
Corabian P, Guo B, Chojecki D, Wodinski L, Wanke M, Nguyen T, Chuck A. Post policy implementationreview (PPIR) of rapid fetal fibronectin testing for preterm labour in Alberta (Structured abstract). HealthTechnol Assess 2015;(4). URL: http://onlinelibrary.wiley.com/o/cochrane/clhta/articles/HTA-32015001020/frame.html (accessed September 2017).
Conde-Agudelo A, Romero R. Cervical phosphorylated insulin-like growth factor binding protein-1 test forthe prediction of preterm birth: a systematic review and metaanalysis. Am J Obstet Gynecol 2016;214:57–73.https://doi.org/10.1016/j.ajog.2015.06.060
Honest H, Bachmann LM, Gupta JK, Kleijnen J, Khan KS. Accuracy of cervicovaginal fetal fibronectin test inpredicting risk of spontaneous preterm birth: systematic review. BMJ 2002;325:301.
Leitich H, Kaider A. Fetal fibronectin – how useful is it in the prediction of preterm birth? BJOG2003;110(Suppl. 20):66–70.
Lucaroni F, Morciano L, Rizzo G, D’Antonio F, Buonuomo E, Palombi L, et al. Biomarkers for predictingspontaneous preterm birth: an umbrella systematic review. J Matern Fetal Neonatal Med 2017;31:1–9.
Menon R, Torloni MR, Voltolini C, Torricelli M, Merialdi M, Betrán AP, et al. Biomarkers of spontaneouspreterm birth: an overview of the literature in the last four decades. Reprod Sci 2011;18:1046–70.https://doi.org/10.1177/1933719111415548
Sanchez-Ramos L, Delke I, Kaunitz A. Cervico-vaginal fetal fibronectin as a short-term predictor of pretermbirth in symptomatic patients: A meta-analysis of diagnostic accuracy. Am J Obstet Gynecol 2007;197:S198-S.
Sanchez-Ramos L, Delke I, Zamora J, Kaunitz AM. Fetal fibronectin as a short-term predictor of pretermbirth in symptomatic patients: a meta-analysis. Obstet Gynecol 2009;114:631–40. https://doi.org/10.1097/AOG.0b013e3181b47217
Smith V, Devane D, Begley CM, Clarke M, Higgins S. A systematic review and quality assessment ofsystematic reviews of fetal fibronectin and transvaginal length for predicting preterm birth. Eur J ObstetGynecol Reprod Biol 2007;133:134–42.
Vis JY, Wilms FF, Oudijk MA, Bossuyt PM, van der Post JA, Grobman WA, Mol BW. Why were the resultsof randomized trials on the clinical utility of fetal fibronectin negative? A systematic review of their studydesigns. Am J Perinatol 2011;28:145–50. https://doi.org/10.1055/s-0030-1263297
DOI: 10.3310/hta23130 HEALTH TECHNOLOGY ASSESSMENT 2019 VOL. 23 NO. 13
© Queen’s Printer and Controller of HMSO 2019. This work was produced by Varley-Campbell et al. under the terms of a commissioning contract issued by the Secretary of Statefor Health and Social Care. This issue may be freely reproduced for the purposes of private research and study and extracts (or indeed, the full report) may be included inprofessional journals provided that suitable acknowledgement is made and the reproduction is not associated with any form of advertising. Applications for commercialreproduction should be addressed to: NIHR Journals Library, National Institute for Health Research, Evaluation, Trials and Studies Coordinating Centre, Alpha House, University ofSouthampton Science Park, Southampton SO16 7NS, UK.
135

Included citations
TABLE 27 Included citations
ReferenceFull text orabstract
Abo El-Ezz AE, Askar AE. Predictive value of phosphorylated insulin-like growth factor binding protein-1(PIGFBP-1) (bedside test) in preterm labor. J Egypt Soc Parasitol 2014;44:525–30
FT
Altinkaya O, Gungor T, Ozat M, Danisman N, Mollamahmutoglu L. Cervical phosphorylated insulin-likegrowth factor binding protein-1 in prediction of preterm delivery. Arch Gynecol Obstet 2009;279:279–83.https://doi.org/10.1007/s00404-008-0703-7
FT
Azlin MI, Bang HK, An LJ, Mohamad SN, Mansor NA, Yee BS, et al. Role of phIGFBP-1 and ultrasoundcervical length in predicting pre-term labour. J Obstet Gynaecol 2010;30:456–9. https://doi.org/10.3109/01443615.2010.489162
FT
Azlin MN, Kee BH, Low JA, Mohamad SN, Mansor NA, Bee SY, et al. Role of phIGFBP-1 and cervical lengthin predicting preterm labor. J Maternal Fetal Neonatal Med 2010;23:100
Ab
Bolotskikh V, Borisova V. Combined value of placental alpha microglobulin-1 detection and cervical lengthvia transvaginal ultrasound in the diagnosis of preterm labor in symptomatic patients. J Obstet Gynaecol Res2017;43:1263–9. https://doi.org/10.1111/jog.13366
FT
Brik M, Hernández AI, Pedraz CC, Perales A. Phosphorylated insulin-like growth factor binding protein-1and cervical measurement in women with threatening preterm birth. Acta Obstet Gynecol Scand2010;89:268–74. https://doi.org/10.3109/00016340903443668
FT
Bruijn M, Kamphuis E, Hoesli I, de Tejada BM, Loccufier A, Jacquemyn Y, et al. Does quantitativefetal fibronectin testing add to cervical length measurement and qualitative fetal fibronectin testing;(I) Identification of low risk women with threatened preterm labor (EUFIS study). Am J Obstet Gynecol2015;212(Suppl. S):S190–1
Ab
Bruijn M, Kamphuis E, Hoesli I, de Tejada BM, Loccufier A, Jacquemyn Y, et al. Does quantitative fetalfibronectin testing add to cervical length measurement and qualitative fetal fibronectin testing; (II) absoluteprobability of preterm delivery < 7 days in women with threatened preterm labor (EUFIS study). Am J ObstetGynecol 2015;212:S191–2
Ab
Bruijn M, van Baaren G-J, Vis J, van Straalen J, Wilms F, Oudijk M, et al. Does quantitative fetal fibronectintesting improve the prediction of spontaneous preterm delivery as compared to qualitative fetal fibronectintesting in symptomatic women: a post-hoc analysis. Am J Obstet Gynecol 2014;210(Suppl. S):S364
Ab
Bruijn M, van Baaren G-J, Vis J, van Straalen J, Wilms F, Oudijk M, et al. Comparison of the Actim Partustest and fetal fibronectin test in combination with cervical length in the prediction of spontaneous pretermdelivery in symptomatic women: a post-hoc analysis. Am J Obstet Gynecol 2014;210(Suppl. S):S363–4
Ab
Bruijn M, Vis JY, Wilms FF, Oudijk MA, Kwee A, Porath MM, et al. Quantitative fetal fibronectin testingin combination with cervical length measurement in the prediction of spontaneous preterm delivery insymptomatic women. BJOG 2016;123:1965–71. https://doi.org/10.1111/1471-0528.13752
FT
Bruijn MM, Kamphuis EI, Hoesli IM, Martinez de Tejada B, Loccufier AR, Kühnert M, et al. The predictivevalue of quantitative fibronectin testing in combination with cervical length measurement in symptomaticwomen. Am J Obstet Gynecol 2016;215:793.e1–793.e8
FT
Bruijn MM, Vis JY, Wilms FF, Oudijk MA, Kwee A, Porath MM, et al. Comparison of the Actim Partus testand the fetal fibronectin test in the prediction of spontaneous preterm birth in symptomatic womenundergoing cervical length measurement. Eur J Obstet Gynecol Reprod Biol 2016;206:220–4
FT
Cooper S, Lange I, Wood S, Tang S, Miller L, Ross S. Diagnostic accuracy of rapid phIGFBP-I assay forpredicting preterm labor in symptomatic patients. J Perinatol 2012;32:460–5. https://doi.org/10.1038/jp.2011.133
FT
Danti L, Prefumo F, Lojacono A, Corini S, Testori A, Frusca T. The combination of short cervical length andphIGFBP-1 in the prediction of preterm delivery in symptomatic women. J Matern Fetal Neonatal Med2011;24:1262–6. https://doi.org/10.3109/14767058.2010.547962
FT
Eroglu D, Yanik F, Oktem M, Zeyneloglu HB, Kuscu E. Prediction of preterm delivery among women withthreatened preterm labor. Gynecol Obstet Invest 2007;64:109–16
FT
APPENDIX 3
NIHR Journals Library www.journalslibrary.nihr.ac.uk
136

TABLE 27 Included citations (continued )
ReferenceFull text orabstract
Goyal M, Kriplani A, Kachhawa G, Badiger S. Prediction of preterm labor by a rapid bedside test detectingphosphorylated insulin-like growth factor-binding protein 1 in cervical secretions. Int J Gynaecol Obstet2016;134:165–8. https://doi.org/10.1016/j.ijgo.2016.01.019
FT
Hadzi-Lega M, Daneva A, Girevski V. EP18.02: Comparison of PartoSure (PAMG-1) and Actim Partus(phlGFBP-1) for the prediction of preterm delivery in patients with preterm labour and a short cervix.Ultrasound Obstet Gynecol 2016;48:345–6
Ab
Hadzi-Lega M, Hellmeyer L, Hanns H, Josefine M, Poposka A, Daneva Markova A. Comparison of PartoSure(PAMG-1) and Actim Partus (phLGFBP-1) for the prediction of preterm delivery in patients with pretermlabor and a short cervix. J Maternal Fetal Neonatal Med 2016;29:55
Ab
Hadzi-Lega M, Maier JT, Helmer H, Hellmeyer L, Markova AD, Poposka A. Comparison of PAMG-1 andphIGFBP-1 tests for the prediction of preterm delivery in patients with preterm labor. Open J Obstet Gynecol2017;7:11
FT
Lembet A, Eroglu D, Ergin T, Kuscu E, Haberal A, Gaddipati S. A new bed-side test for the prediction ofpreterm delivery: Phosphorylated insulin-like growth factor binding protein-1 in cervical secretions. Am JObstet Gynecol 2001;185(Suppl. 6):S147
Ab
Lembet A, Eroglu D, Ergin T, Kuscu E, Zeyneloglu H, Batioglu S, Haberal A. New rapid bed-side test topredict preterm delivery: phosphorylated insulin-like growth factor binding protein-1 in cervical secretions.Acta Obstet Gynecol Scand 2002;81:706–12
FT
Nikolova T, Bayev O, Nikolova N, Di Renzo GC. Evaluation of a novel PAMG-1 test (partosurea TTD test) topredict time to delivery in patients with preterm labor. Abstract number 1731. Moscow: 11th WorldCongress of Perinatal Medicine; 2013
Ab
Nikolova T, Bayev O, Nikolova N, Di Renzo GC. Evaluation of a novel placental alpha microglobulin-1(PAMG-1) test to predict spontaneous preterm delivery. J Perinat Med 2014;42:473–7. https://doi.org/10.1515/jpm-2013-0234
FT
Nikolova T, Bayev O, Nikolova N, Di Renzo GC. Comparison of a novel test for placental alphamicroglobulin-1 with fetal fibronectin and cervical length measurement for the prediction of imminentspontaneous preterm delivery in patients with threatened preterm labor. J Perinat Med 2015;43:395–402.https://doi.org/10.1515/jpm-2014-0300
FT
Riboni F, Vitulo A, Dell’avanzo M, Plebani M, Battagliarin G, Paternoster D. Biochemical markers predictingpre-term delivery in symptomatic patients: phosphorylated insulin-like growth factor binding protein-1 andfetal fibronectin. Arch Gynecol Obstet 2011;284:1325–9. https://doi.org/10.1007/s00404-011-1839-4
FT
Tanir HM, Sener T, Yildiz Z. Cervical phosphorylated insulin-like growth factor binding protein-1 for theprediction of preterm delivery in symptomatic cases with intact membranes. J Obstet Gynaecol Res2009;35:66–72. https://doi.org/10.1111/j.1447-0756.2008.00833.x
FT
Ting HS, Chin PS, Yeo GS, Kwek K. Comparison of bedside test kits for prediction of preterm delivery:phosphorylated insulin-like growth factor binding protein-1 (pIGFBP-1) test and fetal fibronectin test.Ann Acad Med Singap 2007;36:399–402
FT
Tripathi R, Tyagi S, Mala YM, Singh N, Pandey NB, Yadav P. Comparison of rapid bedside tests forphosphorylated insulin-like growth factor-binding protein 1 and fetal fibronectin to predict preterm birth.Int J Gynaecol Obstet 2016;135:47–50. https://doi.org/10.1016/j.ijgo.2016.03.030
FT
Vishwekar PS, Chauhan AR, Turakhia N. Prediction of preterm delivery with a novel bedside test. Int JReprod Contracept Obstet Gynecol 2017;6:3366–71
FT
Werlen S, Raia T, Di Bartolomeo A, Chauleur C. [Preterm labor: Reproducibility of detection test of PAMG-1before and after digital examination, and transvaginal ultrasound cervical length.] Gynecol Obstet Fertil2015;43:640–5. https://doi.org/10.1016/j.gyobfe.2015.07.002
FT
Ab, abstract; FT, full text.
DOI: 10.3310/hta23130 HEALTH TECHNOLOGY ASSESSMENT 2019 VOL. 23 NO. 13
© Queen’s Printer and Controller of HMSO 2019. This work was produced by Varley-Campbell et al. under the terms of a commissioning contract issued by the Secretary of Statefor Health and Social Care. This issue may be freely reproduced for the purposes of private research and study and extracts (or indeed, the full report) may be included inprofessional journals provided that suitable acknowledgement is made and the reproduction is not associated with any form of advertising. Applications for commercialreproduction should be addressed to: NIHR Journals Library, National Institute for Health Research, Evaluation, Trials and Studies Coordinating Centre, Alpha House, University ofSouthampton Science Park, Southampton SO16 7NS, UK.
137

Alere Inc. (Actim Partus) submitted citations
TABLE 28 Alere Inc. (Actim Partus) submitted citations
CitationReason forexclusion Further detail
Adeyemi O, Osoba L. The role of phosphorylated insulin-like growth factorbinding protein-1 in predicting pre-term labour in twin pregnancies. J ObstetGynaecol 2010;30:571–3. https://doi.org/10.3109/01443615.2010.494203
Population Twin pregnancies
Akercan F, Kazandi M, Sendag F, Cirpan T, Mgoyi L, Terek MC, Sagol S. Valueof cervical phosphorylated insulinlike growth factor binding protein-1 in theprediction of preterm labor. J Reprod Med 2004;49:368–72
Comparator Outcome at 37 weeks
Altinkaya O, Gungor T, Ozat M, Danisman N, Mollamahmutoglu L. Cervicalphosphorylated insulin-like growth factor binding protein-1 in prediction ofpreterm delivery. Arch Gynecol Obstet 2009;279:279–83. https://doi.org/10.1007/s00404-008-0703-7
Included
Azlin MI, Bang HK, An LJ, Mohamad SN, Mansor NA, Yee BS, et al. Roleof phIGFBP-1 and ultrasound cervical length in predicting pre-term labour.J Obstet Gynaecol 2010;30:456–9. https://doi.org/10.3109/01443615.2010.489162
Included
Balic D, Latifagic A, Hudic I. Insulin-like growth factor-binding protein-1(IGFBP-1) in cervical secretions as a predictor of preterm delivery. J MaternFetal Neonatal Med 2008;21:297–300. https://doi.org/10.1080/14767050802037613
Population Asymptomatic population
Bittar RE, da Fonseca EB, de Carvalho MH, Martinelli S, Zugaib M. Predictingpreterm delivery in asymptomatic patients with prior preterm delivery bymeasurement of cervical length and phosphorylated insulin-like growthfactor-binding protein-1. Ultrasound Obstet Gynecol 2007;29:562–7.https://doi.org/10.1002/uog.3989
Population Asymptomatic population
Brik M, Hernández AI, Pedraz CC, Perales A. Phosphorylated insulin-likegrowth factor binding protein-1 and cervical measurement in women withthreatening preterm birth. Acta Obstet Gynecol Scand 2010;89:268–74.https://doi.org/10.3109/00016340903443668
Included
Bruijn MM, Vis JY, Wilms FF, Oudijk MA, Kwee A, Porath MM, et al.Comparison of the Actim Partus test and the fetal fibronectin test inthe prediction of spontaneous preterm birth in symptomatic womenundergoing cervical length measurement. Eur J Obstet Gynecol Reprod Biol2016;206:220–4
Included
Cooper S, Lange I, Wood S, Tang S, Miller L, Ross S. Diagnostic accuracy ofrapid phIGFBP-I assay for predicting preterm labor in symptomatic patients.J Perinatol 2012;32:460–5. https://doi.org/10.1038/jp.2011.133
Included
Danti L, Prefumo F, Lojacono A, Corini S, Testori A, Frusca T. The combinationof short cervical length and phIGFBP-1 in the prediction of preterm deliveryin symptomatic women. J Matern Fetal Neonatal Med 2011;24:1262–6.https://doi.org/10.3109/14767058.2010.547962
Included
Dögl M, Skogvoll E, Heimstad R. Cervical insulin-like growth factor bindingprotein-1 (IGFBP-1) to predict spontaneous onset of labor and inductionto delivery interval in post-term pregnancy. Acta Obstet Gynecol Scand2011;90:57–62. https://doi.org/10.1111/j.1600-0412.2010.01018.x
Population Post-term pregnancies
Elizur SE, Yinon Y, Epstein GS, Seidman DS, Schiff E, Sivan E. Insulin-likegrowth factor binding protein-1 detection in preterm labor: evaluationof a bedside test. Am J Perinatol 2005;22:305–9. https://doi.org/10.1055/s-2005-870895
Population Not clear if multifetal,also outcome at35 weeks
APPENDIX 3
NIHR Journals Library www.journalslibrary.nihr.ac.uk
138
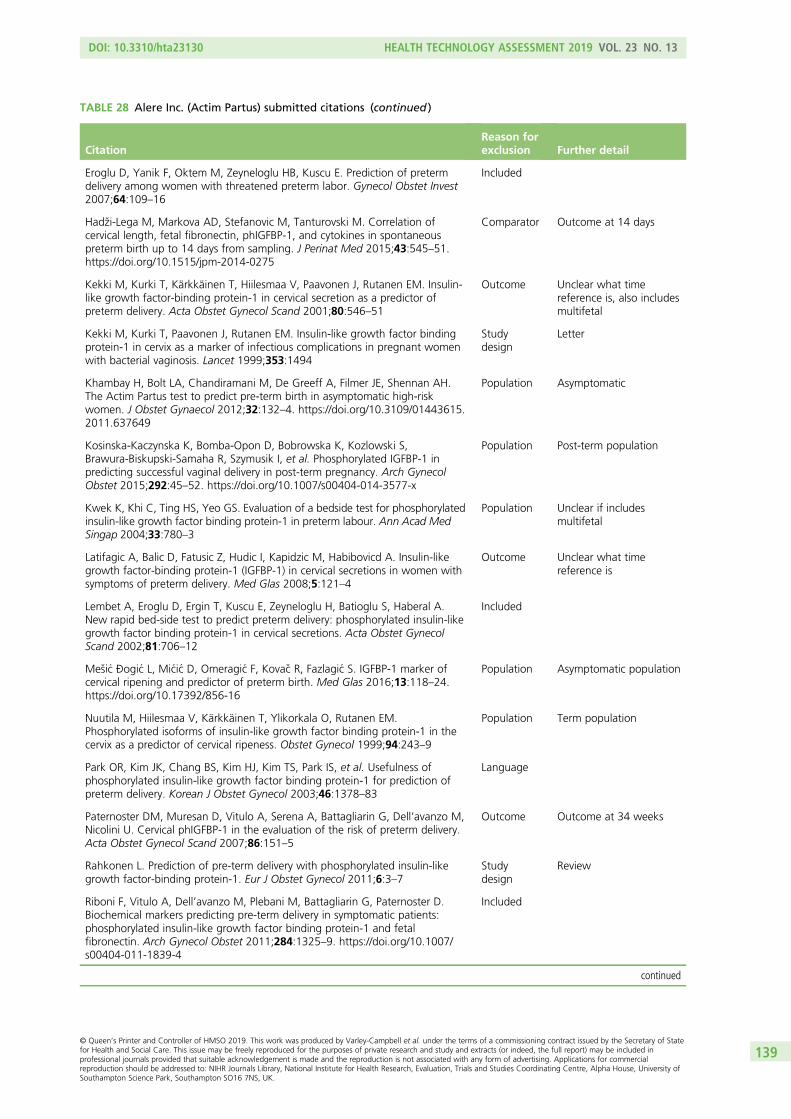
TABLE 28 Alere Inc. (Actim Partus) submitted citations (continued )
CitationReason forexclusion Further detail
Eroglu D, Yanik F, Oktem M, Zeyneloglu HB, Kuscu E. Prediction of pretermdelivery among women with threatened preterm labor. Gynecol Obstet Invest2007;64:109–16
Included
Hadzi-Lega M, Markova AD, Stefanovic M, Tanturovski M. Correlation ofcervical length, fetal fibronectin, phIGFBP-1, and cytokines in spontaneouspreterm birth up to 14 days from sampling. J Perinat Med 2015;43:545–51.https://doi.org/10.1515/jpm-2014-0275
Comparator Outcome at 14 days
Kekki M, Kurki T, Kärkkäinen T, Hiilesmaa V, Paavonen J, Rutanen EM. Insulin-like growth factor-binding protein-1 in cervical secretion as a predictor ofpreterm delivery. Acta Obstet Gynecol Scand 2001;80:546–51
Outcome Unclear what timereference is, also includesmultifetal
Kekki M, Kurki T, Paavonen J, Rutanen EM. Insulin-like growth factor bindingprotein-1 in cervix as a marker of infectious complications in pregnant womenwith bacterial vaginosis. Lancet 1999;353:1494
Studydesign
Letter
Khambay H, Bolt LA, Chandiramani M, De Greeff A, Filmer JE, Shennan AH.The Actim Partus test to predict pre-term birth in asymptomatic high-riskwomen. J Obstet Gynaecol 2012;32:132–4. https://doi.org/10.3109/01443615.2011.637649
Population Asymptomatic
Kosinska-Kaczynska K, Bomba-Opon D, Bobrowska K, Kozlowski S,Brawura-Biskupski-Samaha R, Szymusik I, et al. Phosphorylated IGFBP-1 inpredicting successful vaginal delivery in post-term pregnancy. Arch GynecolObstet 2015;292:45–52. https://doi.org/10.1007/s00404-014-3577-x
Population Post-term population
Kwek K, Khi C, Ting HS, Yeo GS. Evaluation of a bedside test for phosphorylatedinsulin-like growth factor binding protein-1 in preterm labour. Ann Acad MedSingap 2004;33:780–3
Population Unclear if includesmultifetal
Latifagic A, Balic D, Fatusic Z, Hudic I, Kapidzic M, Habibovicd A. Insulin-likegrowth factor-binding protein-1 (IGFBP-1) in cervical secretions in women withsymptoms of preterm delivery. Med Glas 2008;5:121–4
Outcome Unclear what timereference is
Lembet A, Eroglu D, Ergin T, Kuscu E, Zeyneloglu H, Batioglu S, Haberal A.New rapid bed-side test to predict preterm delivery: phosphorylated insulin-likegrowth factor binding protein-1 in cervical secretions. Acta Obstet GynecolScand 2002;81:706–12
Included
Mesic Ðogic L, Micic D, Omeragic F, Kovac R, Fazlagic S. IGFBP-1 marker ofcervical ripening and predictor of preterm birth. Med Glas 2016;13:118–24.https://doi.org/10.17392/856-16
Population Asymptomatic population
Nuutila M, Hiilesmaa V, Kärkkäinen T, Ylikorkala O, Rutanen EM.Phosphorylated isoforms of insulin-like growth factor binding protein-1 in thecervix as a predictor of cervical ripeness. Obstet Gynecol 1999;94:243–9
Population Term population
Park OR, Kim JK, Chang BS, Kim HJ, Kim TS, Park IS, et al. Usefulness ofphosphorylated insulin-like growth factor binding protein-1 for prediction ofpreterm delivery. Korean J Obstet Gynecol 2003;46:1378–83
Language
Paternoster DM, Muresan D, Vitulo A, Serena A, Battagliarin G, Dell’avanzo M,Nicolini U. Cervical phIGFBP-1 in the evaluation of the risk of preterm delivery.Acta Obstet Gynecol Scand 2007;86:151–5
Outcome Outcome at 34 weeks
Rahkonen L. Prediction of pre-term delivery with phosphorylated insulin-likegrowth factor-binding protein-1. Eur J Obstet Gynecol 2011;6:3–7
Studydesign
Review
Riboni F, Vitulo A, Dell’avanzo M, Plebani M, Battagliarin G, Paternoster D.Biochemical markers predicting pre-term delivery in symptomatic patients:phosphorylated insulin-like growth factor binding protein-1 and fetalfibronectin. Arch Gynecol Obstet 2011;284:1325–9. https://doi.org/10.1007/s00404-011-1839-4
Included
continued
DOI: 10.3310/hta23130 HEALTH TECHNOLOGY ASSESSMENT 2019 VOL. 23 NO. 13
© Queen’s Printer and Controller of HMSO 2019. This work was produced by Varley-Campbell et al. under the terms of a commissioning contract issued by the Secretary of Statefor Health and Social Care. This issue may be freely reproduced for the purposes of private research and study and extracts (or indeed, the full report) may be included inprofessional journals provided that suitable acknowledgement is made and the reproduction is not associated with any form of advertising. Applications for commercialreproduction should be addressed to: NIHR Journals Library, National Institute for Health Research, Evaluation, Trials and Studies Coordinating Centre, Alpha House, University ofSouthampton Science Park, Southampton SO16 7NS, UK.
139
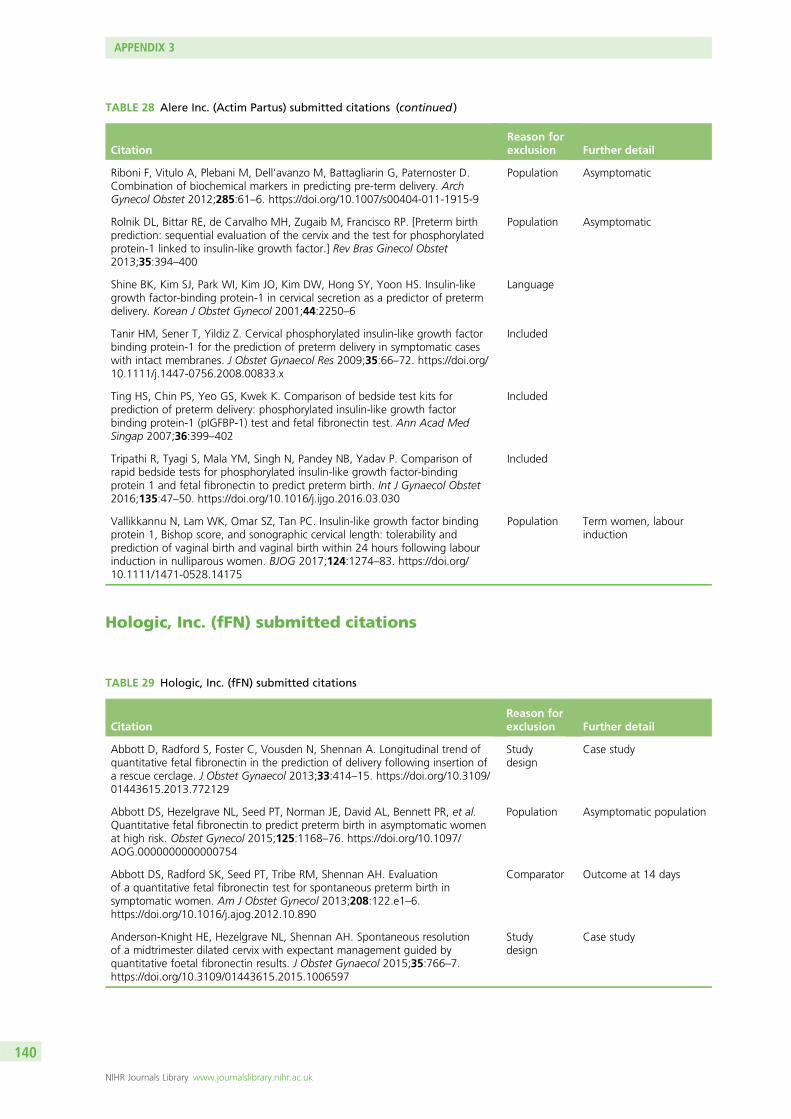
Hologic, Inc. (fFN) submitted citations
TABLE 28 Alere Inc. (Actim Partus) submitted citations (continued )
CitationReason forexclusion Further detail
Riboni F, Vitulo A, Plebani M, Dell’avanzo M, Battagliarin G, Paternoster D.Combination of biochemical markers in predicting pre-term delivery. ArchGynecol Obstet 2012;285:61–6. https://doi.org/10.1007/s00404-011-1915-9
Population Asymptomatic
Rolnik DL, Bittar RE, de Carvalho MH, Zugaib M, Francisco RP. [Preterm birthprediction: sequential evaluation of the cervix and the test for phosphorylatedprotein-1 linked to insulin-like growth factor.] Rev Bras Ginecol Obstet2013;35:394–400
Population Asymptomatic
Shine BK, Kim SJ, Park WI, Kim JO, Kim DW, Hong SY, Yoon HS. Insulin-likegrowth factor-binding protein-1 in cervical secretion as a predictor of pretermdelivery. Korean J Obstet Gynecol 2001;44:2250–6
Language
Tanir HM, Sener T, Yildiz Z. Cervical phosphorylated insulin-like growth factorbinding protein-1 for the prediction of preterm delivery in symptomatic caseswith intact membranes. J Obstet Gynaecol Res 2009;35:66–72. https://doi.org/10.1111/j.1447-0756.2008.00833.x
Included
Ting HS, Chin PS, Yeo GS, Kwek K. Comparison of bedside test kits forprediction of preterm delivery: phosphorylated insulin-like growth factorbinding protein-1 (pIGFBP-1) test and fetal fibronectin test. Ann Acad MedSingap 2007;36:399–402
Included
Tripathi R, Tyagi S, Mala YM, Singh N, Pandey NB, Yadav P. Comparison ofrapid bedside tests for phosphorylated insulin-like growth factor-bindingprotein 1 and fetal fibronectin to predict preterm birth. Int J Gynaecol Obstet2016;135:47–50. https://doi.org/10.1016/j.ijgo.2016.03.030
Included
Vallikkannu N, Lam WK, Omar SZ, Tan PC. Insulin-like growth factor bindingprotein 1, Bishop score, and sonographic cervical length: tolerability andprediction of vaginal birth and vaginal birth within 24 hours following labourinduction in nulliparous women. BJOG 2017;124:1274–83. https://doi.org/10.1111/1471-0528.14175
Population Term women, labourinduction
TABLE 29 Hologic, Inc. (fFN) submitted citations
CitationReason forexclusion Further detail
Abbott D, Radford S, Foster C, Vousden N, Shennan A. Longitudinal trend ofquantitative fetal fibronectin in the prediction of delivery following insertion ofa rescue cerclage. J Obstet Gynaecol 2013;33:414–15. https://doi.org/10.3109/01443615.2013.772129
Studydesign
Case study
Abbott DS, Hezelgrave NL, Seed PT, Norman JE, David AL, Bennett PR, et al.Quantitative fetal fibronectin to predict preterm birth in asymptomatic womenat high risk. Obstet Gynecol 2015;125:1168–76. https://doi.org/10.1097/AOG.0000000000000754
Population Asymptomatic population
Abbott DS, Radford SK, Seed PT, Tribe RM, Shennan AH. Evaluationof a quantitative fetal fibronectin test for spontaneous preterm birth insymptomatic women. Am J Obstet Gynecol 2013;208:122.e1–6.https://doi.org/10.1016/j.ajog.2012.10.890
Comparator Outcome at 14 days
Anderson-Knight HE, Hezelgrave NL, Shennan AH. Spontaneous resolutionof a midtrimester dilated cervix with expectant management guided byquantitative foetal fibronectin results. J Obstet Gynaecol 2015;35:766–7.https://doi.org/10.3109/01443615.2015.1006597
Studydesign
Case study
APPENDIX 3
NIHR Journals Library www.journalslibrary.nihr.ac.uk
140

TABLE 29 Hologic, Inc. (fFN) submitted citations (continued )
CitationReason forexclusion Further detail
Bolt LA, Chandiramani M, De Greeff A, Seed P, Shennan AH. Does fetalfibronectin testing change patient management in women at risk of pretermlabour? Eur J Obstet Gynecol Reprod Biol 2009;146:180–3. https://doi.org/10.1016/j.ejogrb.2009.06.021
Comparator Outcome at 14 days
Bolt LA, Chandiramani M, De Greeff A, Seed PT, Kurtzman J, Shennan AH.The value of combined cervical length measurement and fetal fibronectintesting to predict spontaneous preterm birth in asymptomatic high-riskwomen. J Matern Fetal Neonatal Med 2011;24:928–32. https://doi.org/10.3109/14767058.2010.535872
Population Asymptomatic population
Bolt LA, Morrison K, Shennan AH. The use of fetal fibronectin testingand cervical length measurement in the prediction of delivery of tripletpregnancies. Eur J Obstet Gynecol Reprod Biol 2012;164:236–7.https://doi.org/10.1016/j.ejogrb.2012.06.012
Population Triplet pregnancies
Bruijn M, Vis JY, Wilms FF, Oudijk MA, Kwee A, Porath MM, et al. Quantitativefetal fibronectin testing in combination with cervical length measurement inthe prediction of spontaneous preterm delivery in symptomatic women.BJOG 2016;123:1965–71. https://doi.org/10.1111/1471-0528.13752
Included
Bruijn MM, Kamphuis EI, Hoesli IM, Martinez de Tejada B, Loccufier AR,Kühnert M, et al. The predictive value of quantitative fibronectin testingin combination with cervical length measurement in symptomatic women.Am J Obstet Gynecol 2016;215:793.e1–793.e8
Included
Centra M, Coata G, Picchiassi E, Alfonsi L, Meniconi S, Bini V, et al. Evaluationof quantitative fFn test in predicting the risk of preterm birth. J Perinat Med2017;45:91–8. https://doi.org/10.1515/jpm-2015-0414
Comparator Outcome at 14 days
Fiorini F, Isted A, Hezelgrave NL, Shennan AH. Quantitative fetal fibronectinpredicts preterm birth in women with bulging fetal membranes. Eur J ObstetGynecol Reprod Biol 2016;203:127–31. https://doi.org/10.1016/j.ejogrb.2016.05.046
Comparator Outcome at 14 days
Foster C, Shennan AH. Fetal fibronectin as a biomarker of preterm labor:a review of the literature and advances in its clinical use. Biomark Med2014;8:471–84. https://doi.org/10.2217/bmm.14.28
Studydesign
Literature review
Gibson S, Hezelgrave NL, Shennan AH. Management of vasa praevia:a potential role for cervical length and quantitative fetal fibronectinmeasurement. J Obstet Gynaecol 2013;33:905–6. https://doi.org/10.3109/01443615.2013.834309
Studydesign
Case study
Goepfert AR, Goldenberg RL, Mercer B, Iams J, Meis P, Moawad A, et al.The preterm prediction study: quantitative fetal fibronectin values and theprediction of spontaneous preterm birth. The National Institute of ChildHealth and Human Development Maternal-Fetal Medicine Units Network.Am J Obstet Gynecol 2000;183:1480–3
Population Asymptomatic population
Goldenberg RL, Iams JD, Mercer BM, Meis PJ, Moawad AH, Copper RL, et al.The preterm prediction study: the value of new vs standard risk factors inpredicting early and all spontaneous preterm births. NICHD MFMU Network.Am J Public Health 1998;88:233–8
Population Asymptomatic population
Goldenberg RL, Klebanoff M, Carey JC, Macpherson C, Leveno KJ,Moawad AH, et al. Vaginal fetal fibronectin measurements from 8to 22 weeks’ gestation and subsequent spontaneous preterm birth.Am J Obstet Gynecol 2000;183:469–75
Population Asymptomatic population
Goldenberg RL, Mercer BM, Meis PJ, Copper RL, Das A, McNellis D. Thepreterm prediction study: fetal fibronectin testing and spontaneous pretermbirth; NICHD maternal fetal medicine units network. Obstet Gynecol1996;87:643–8
Population Asymptomatic population
continued
DOI: 10.3310/hta23130 HEALTH TECHNOLOGY ASSESSMENT 2019 VOL. 23 NO. 13
© Queen’s Printer and Controller of HMSO 2019. This work was produced by Varley-Campbell et al. under the terms of a commissioning contract issued by the Secretary of Statefor Health and Social Care. This issue may be freely reproduced for the purposes of private research and study and extracts (or indeed, the full report) may be included inprofessional journals provided that suitable acknowledgement is made and the reproduction is not associated with any form of advertising. Applications for commercialreproduction should be addressed to: NIHR Journals Library, National Institute for Health Research, Evaluation, Trials and Studies Coordinating Centre, Alpha House, University ofSouthampton Science Park, Southampton SO16 7NS, UK.
141
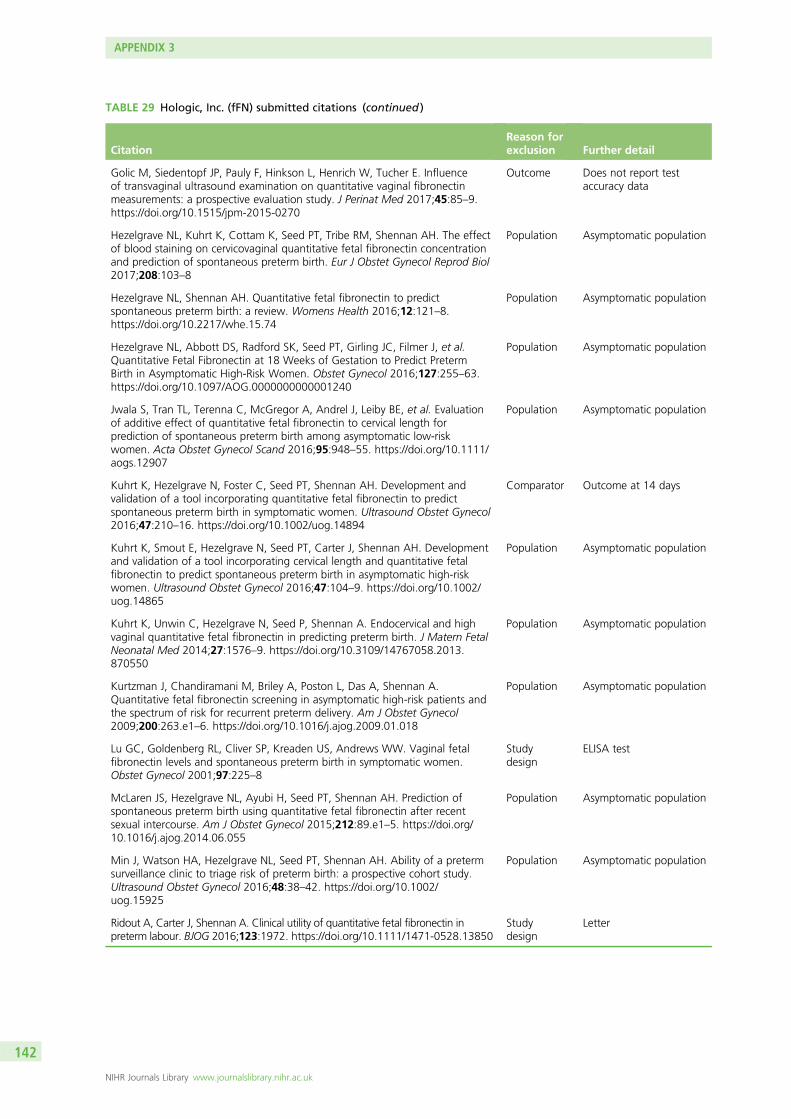
TABLE 29 Hologic, Inc. (fFN) submitted citations (continued )
CitationReason forexclusion Further detail
Golic M, Siedentopf JP, Pauly F, Hinkson L, Henrich W, Tucher E. Influenceof transvaginal ultrasound examination on quantitative vaginal fibronectinmeasurements: a prospective evaluation study. J Perinat Med 2017;45:85–9.https://doi.org/10.1515/jpm-2015-0270
Outcome Does not report testaccuracy data
Hezelgrave NL, Kuhrt K, Cottam K, Seed PT, Tribe RM, Shennan AH. The effectof blood staining on cervicovaginal quantitative fetal fibronectin concentrationand prediction of spontaneous preterm birth. Eur J Obstet Gynecol Reprod Biol2017;208:103–8
Population Asymptomatic population
Hezelgrave NL, Shennan AH. Quantitative fetal fibronectin to predictspontaneous preterm birth: a review. Womens Health 2016;12:121–8.https://doi.org/10.2217/whe.15.74
Population Asymptomatic population
Hezelgrave NL, Abbott DS, Radford SK, Seed PT, Girling JC, Filmer J, et al.Quantitative Fetal Fibronectin at 18 Weeks of Gestation to Predict PretermBirth in Asymptomatic High-Risk Women. Obstet Gynecol 2016;127:255–63.https://doi.org/10.1097/AOG.0000000000001240
Population Asymptomatic population
Jwala S, Tran TL, Terenna C, McGregor A, Andrel J, Leiby BE, et al. Evaluationof additive effect of quantitative fetal fibronectin to cervical length forprediction of spontaneous preterm birth among asymptomatic low-riskwomen. Acta Obstet Gynecol Scand 2016;95:948–55. https://doi.org/10.1111/aogs.12907
Population Asymptomatic population
Kuhrt K, Hezelgrave N, Foster C, Seed PT, Shennan AH. Development andvalidation of a tool incorporating quantitative fetal fibronectin to predictspontaneous preterm birth in symptomatic women. Ultrasound Obstet Gynecol2016;47:210–16. https://doi.org/10.1002/uog.14894
Comparator Outcome at 14 days
Kuhrt K, Smout E, Hezelgrave N, Seed PT, Carter J, Shennan AH. Developmentand validation of a tool incorporating cervical length and quantitative fetalfibronectin to predict spontaneous preterm birth in asymptomatic high-riskwomen. Ultrasound Obstet Gynecol 2016;47:104–9. https://doi.org/10.1002/uog.14865
Population Asymptomatic population
Kuhrt K, Unwin C, Hezelgrave N, Seed P, Shennan A. Endocervical and highvaginal quantitative fetal fibronectin in predicting preterm birth. J Matern FetalNeonatal Med 2014;27:1576–9. https://doi.org/10.3109/14767058.2013.870550
Population Asymptomatic population
Kurtzman J, Chandiramani M, Briley A, Poston L, Das A, Shennan A.Quantitative fetal fibronectin screening in asymptomatic high-risk patients andthe spectrum of risk for recurrent preterm delivery. Am J Obstet Gynecol2009;200:263.e1–6. https://doi.org/10.1016/j.ajog.2009.01.018
Population Asymptomatic population
Lu GC, Goldenberg RL, Cliver SP, Kreaden US, Andrews WW. Vaginal fetalfibronectin levels and spontaneous preterm birth in symptomatic women.Obstet Gynecol 2001;97:225–8
Studydesign
ELISA test
McLaren JS, Hezelgrave NL, Ayubi H, Seed PT, Shennan AH. Prediction ofspontaneous preterm birth using quantitative fetal fibronectin after recentsexual intercourse. Am J Obstet Gynecol 2015;212:89.e1–5. https://doi.org/10.1016/j.ajog.2014.06.055
Population Asymptomatic population
Min J, Watson HA, Hezelgrave NL, Seed PT, Shennan AH. Ability of a pretermsurveillance clinic to triage risk of preterm birth: a prospective cohort study.Ultrasound Obstet Gynecol 2016;48:38–42. https://doi.org/10.1002/uog.15925
Population Asymptomatic population
Ridout A, Carter J, Shennan A. Clinical utility of quantitative fetal fibronectin inpreterm labour. BJOG 2016;123:1972. https://doi.org/10.1111/1471-0528.13850
Studydesign
Letter
APPENDIX 3
NIHR Journals Library www.journalslibrary.nihr.ac.uk
142

Parsagen Diagnostics Inc. (PartoSure) submitted citations
TABLE 29 Hologic, Inc. (fFN) submitted citations (continued )
CitationReason forexclusion Further detail
Ross GN, Ridout AE, Shennan AH. Optimal clinical risk prediction can beachieved by combining quantitative fetal fibronectin and cervical length, andavoiding thresholds. Acta Obstet Gynecol Scand 2016;95:956. https://doi.org/10.1111/aogs.12922
Studydesign
Letter
Schindhelm RK, Hoogenberg J, de Vos MT, Tegelaers FP. Analyticalperformance of quantitative fetal fibronectin assay. Ultrasound Obstet Gynecol2016;47:127. https://doi.org/10.1002/uog.15824
Studydesign
Letter
van der Krogt L, Hezelgrave NL, Seed PT, Shennan AH. Prediction ofspontaneous preterm birth using fetal fibronectin in women with a low-lyingplacenta. J Matern Fetal Neonatal Med 2017;30:313–16. https://doi.org/10.3109/14767058.2016.1171837
Population Asymptomatic population
Vandermolen BI, Hezelgrave NL, Smout EM, Abbott DS, Seed PT, Shennan AH.Quantitative fetal fibronectin and cervical length to predict preterm birth inasymptomatic women with previous cervical surgery. Am J Obstet Gynecol2016;215:480.e1–480.e10. https://doi.org/10.1016/j.ajog.2016.05.020
Population Asymptomatic population
Watson HA, Carter J, Seed PT, Tribe RM, Shennan AH. The QUIPP app: a safealternative to a treat-all strategy for threatened preterm labour. UltrasoundObstet Gynecol 2017;50:342–6
Abstract Use of telephoneapplication
Zhou MX, Zhou J, Bao Y, Chen YQ, Cai C. Evaluation of the ability of cervicallength and fetal fibronectin measurement to predict preterm delivery inasymptomatic women with risk factors. J Matern Fetal Neonatal Med2015;28:153–7. https://doi.org/10.3109/14767058.2014.909801
Population Asymptomatic population
TABLE 30 Parsagen Diagnostics Inc. (PartoSure) submitted citations
CitationReason forexclusion Further detail
Bolotskikh V, Borisova V. Combined value of placental alpha microglobulin-1detection and cervical length via transvaginal ultrasound in the diagnosisof preterm labor in symptomatic patients. J Obstet Gynaecol Res2017;43:1263–9. https://doi.org/10.1111/jog.13366
Included
Echebiri NC, McDoom MM, Aalto M, Pullen J, Doyle NM. Placentalalpha-microglobulin-1 and combined traditional diagnostic test: a cost–benefitanalysis. Am J Obstet Gynecol 2014;123:3S-S
Population Ruptured membranes
Echebiri NC, McDoom MM, Pullen JA, Aalto MM, Patel NN, Doyle NM.Placental alpha-microglobulin-1 and combined traditional diagnostic test: acost-benefit analysis. Am J Obstet Gynecol 2015;212:77.e1–10. https://doi.org/10.1016/j.ajog.2014.07.028
Population Ruptured membranes
Fatkullin I, Akhmetgaliev A, Matveeva E, Seeger S. Utilization of a novelbiomarker test (PARTOSURE PAMG-1) to reduce the length of stay in patientswith threatened preterm labor and a short cervix. J Matern Fetal Neonatal Med2016;29(Suppl. 1):283
Abstract Not enough information
Hadzi-Lega M, Maier JT, Helmer H, Hellmeyer L, Markova AD, Poposka A.Comparison of PAMG-1 and phIGFBP-1 tests for the prediction of pretermdelivery in patients with preterm labor. Open J Obstet Gynecol 2017;7:358–68
Included
continued
DOI: 10.3310/hta23130 HEALTH TECHNOLOGY ASSESSMENT 2019 VOL. 23 NO. 13
© Queen’s Printer and Controller of HMSO 2019. This work was produced by Varley-Campbell et al. under the terms of a commissioning contract issued by the Secretary of Statefor Health and Social Care. This issue may be freely reproduced for the purposes of private research and study and extracts (or indeed, the full report) may be included inprofessional journals provided that suitable acknowledgement is made and the reproduction is not associated with any form of advertising. Applications for commercialreproduction should be addressed to: NIHR Journals Library, National Institute for Health Research, Evaluation, Trials and Studies Coordinating Centre, Alpha House, University ofSouthampton Science Park, Southampton SO16 7NS, UK.
143

TABLE 30 Parsagen Diagnostics Inc. (PartoSure) submitted citations (continued )
CitationReason forexclusion Further detail
Heverhagen A. Placental alpha microglobulin-1 in combination withtransvaginal ultrasound for prediction of preterm birth. J Perinat Med2015;43(Suppl. 1):240
Abstract Not enough information
Konoplyannikov A, Lysyuk I, Sokolyan A, Pipia N, Apresyan S, Karasova A, et al.PAMG-1 biomarker test (PARTOSURE) in combination with transvaginalultrasound for improved assessment of spontaneous preterm birth inpatients with threatened preterm labor. J Matern Fetal Neonatal Med2016;29(Suppl. 1):278
Abstract Not enough information
Lotfi G, Faraz S, Al Swalhee N, Nasir R, Somini S, Abdeldayem R, et al.Evaluation of PAMG-1 for the prediction of preterm birth in patientssymptomatic of preterm labour. J Perinat Med 2015;43(Suppl. 1):250
Abstract Not enough information
Lou YY, Ajay B. Is PartoSure effective in assessing preterm birth? BJOG2016;123(Suppl. 2):89
Abstract Not enough information
Ravi M, Beljorie M, El Masry K. Evaluation of the quantitative fetal fibronectintest And PartoSure™ (placental alpha microglobulin-1 [PAMG-1]) for theprediction of spontaneous preterm birth (SPTB) in patients with signs andsymptoms suggestive of preterm labor. Journal of Pediatric and NeonatalIndividualized Medicine 2017;6:ABS50
Abstract Not enough information
Nikolova T, Bayev O, Nikolova N, Di Renzo GC. Evaluation of a novel placentalalpha microglobulin-1 (PAMG-1) test to predict spontaneous preterm delivery.J Perinat Med 2014;42:473–7. https://doi.org/10.1515/jpm-2013-0234
Included
Nikolova T, Bayev O, Nikolova N, Di Renzo GC. Comparison of a novel testfor placental alpha microglobulin-1 with fetal fibronectin and cervical lengthmeasurement for the prediction of imminent spontaneous preterm delivery inpatients with threatened preterm labor. J Perinat Med 2015;43:395–402.https://doi.org/10.1515/jpm-2014-0300
Included
Nikolova T, Uotila J, Nikolova N, Borisova VY, Bolotskikh VM. 16: Do PAMG-1or phIGFBP-1 biomarkers improve the prediction of imminent spontaneouspreterm delivery in PTL symptomatic women with non-obvious cervical length(CL)? Am J Obstet Gynecol 2017;216:S11–12
Abstract Not enough information
Melchor JC, Navas H, Marcos M, Iza A, de Diego M, Rando D, Burgos J.Retrospective Analysis on the Efficacy of the PAMG-1 Test and the FetalFibronectin Test in Assessing Preterm Birth in Symptomatic Women Attendingan Emergency Obstetric Unit. Conference: 1st World Congress on MaternalFetal Neonatal Medicine. London, April 2017
Abstract Not enough information
Van Holsbeke C, Dam K, Staelens A, Mesens T, Corremans A. Comparisonof the fetal fibronectin (Rapid fFN) and placental alpha microglobulin-1(PartoSure) tests for predicting imminent spontaneous preterm birth.Ultrasound Obstet Gynecol 2016;48:84
Abstract Not enough information
Wing D, Haeri S, Silber A, Roth C, Echebiri N, Franco A, Pappas L, et al.PAMG-1 (PARTOSURE™) vs. fFN to Assess Risk of Preterm Delivery inSymptomatic Women. Conference: KU Medical Centre/UC Irvine HealthInstitute. PartoSure GA Analysis
Abstract Not enough information
APPENDIX 3
NIHR Journals Library www.journalslibrary.nihr.ac.uk
144

Studies excluded at full-text review, with reasons
TABLE 31 Studies excluded at full-text review, with reasons
CitationReason forexclusion
Caroline VH, Annick C. Comparison of the fetal fibronectin (rapid FFN) and placental alpha microglobulin-1(partosure) tests for predicting imminent spontaneous preterm birth in patients with threatened pretermlabor. J Perinat Med Conference: 12th World Congress of Perinatal Medicine 2015;43(no pagination)
Abstract
Desjardins PR, Dansereau J, Hoag GN. Comparing the clinical effectiveness of Fetal Fibronectin andIGFBP-1 measurements in cervico-vaginal secretions, in predicting preterm deliveries. Clinical Chemistry2008;54:A39–40
Abstract
Ehsanipoor RM, Swank M, Jwa SC, Wing DA, Tarabulsi G, Blakemore KJ. Placental alpha-microglobulin-1in vaginal secretions as a predictor of preterm birth in women with evidence of preterm labor. Reprod Sci2014;1:155A
Abstract
Fatkullin I, Akhmetgaliev A, Matveeva E, Seeger S. Utilization of a novel biomarker test (PARTOSURE PAMG-1)to reduce the length of stay in patients with threatened preterm labor and a short cervix. J Matern FetalNeonatal Med 2016;29:283
Abstract
Grobman W, Welshman E, Calhoun E. Does fetal fibronectin use in the diagnosis of preterm labor affectphysician behavior and health care costs? A randomized trial. Am J Obstet Gynecol 2002;187(Suppl. 6):S80
Abstract
Grobman WA, Welshman EE, Calhoun EA, Ramsey PS. Fetal fibronectin results did not reduce medicalresource use for women with preterm uterine contractions. Evidence-based Obstetrics and Gynecology2005;7:118–9
Abstract
Hansen W, Lowe M, Zimmerman B. Effect of the fetal fibronectin assay on preterm labor management.Am J Obstet Gynecol 2001;185(Suppl. 6):S136. URL: http://onlinelibrary.wiley.com/o/cochrane/clcentral/articles/596/CN-00387596/frame.html (accessed September 2017)
Abstract
Heverhagen A. Placental alphamicroglobulin-1 in combination with transvaginal ultrasound for prediction ofpreterm birth. J Perinat Med Conference: 12th World Congress of Perinatal Medicine 2015;43(no pagination)
Abstract
Heverhagen A, Baumann M, Raio L, Surbek D. Placental alpha-microglobulin-1 in combination withtransvaginal ultrasound for prediction of preterm birth. Am J Obstet Gynecol 2015;212(Suppl. 1):S81
Abstract
Heverhagen A, Muller M, Schleussner E, Deruelle P, Raio L, Surbek D. The prediction of preterm birthusing placental alpha-microglobulin-1 in combination with transvaginal ultrasound. Reprod Sci2016;1:131A–2A
Abstract
Hillman-Cooper C, Ghag K, Dempsey A, Denbow M, Lopez Bernal A. Actim Partus-the first year atSt. Michael’s Hospital, Bristol. Arch Dis Child Fetal Neonatal Ed 2014;99:A158–9
Abstract
Holmgren C, Lacoursiere DY, Esplin MS. Clinical predictors of a false negative fetal fibronectin (FFN).Am J Obstet Gynecol 2007;197:S204-S
Abstract
Kang JH, Lee SE, Park C-W, Jun JK, Romero R, Yoon BH. Cervical fetal fibronectin: An index ofintra-amniotic inflammation, histologic chorioamnionitis and impending preterm delivery in patients withpreterm labor and intact membranes. Am J Obstet Gynecol 2007;197(Suppl. 6):S47
Abstract
Karunakaran B, Berry J, Parasuraman R. Can we raise the threshold for negative fetal fibronectin result?Arch Dis Child Fetal Neonatal Ed 2012;97:A89
Abstract
Konoplyannikov A, Lysyuk I, Sokolyan A, Pipia N, Apresyan S, Karasova A. PAMG-1 biomarkertest (PARTOSURE) in combination with transvaginal ultrasound for improved assessment of spontaneouspreterm birth in patients with threatened preterm labor. J Matern Fetal Neonatal Med Conference: 25thEuropean Congress of Perinatal Medicine, the Netherlands 2016;29:278. URL: http://onlinelibrary.wiley.com/o/cochrane/clcentral/articles/387/CN-01214387/frame.html (accessed September 2017)
Abstract
continued
DOI: 10.3310/hta23130 HEALTH TECHNOLOGY ASSESSMENT 2019 VOL. 23 NO. 13
© Queen’s Printer and Controller of HMSO 2019. This work was produced by Varley-Campbell et al. under the terms of a commissioning contract issued by the Secretary of Statefor Health and Social Care. This issue may be freely reproduced for the purposes of private research and study and extracts (or indeed, the full report) may be included inprofessional journals provided that suitable acknowledgement is made and the reproduction is not associated with any form of advertising. Applications for commercialreproduction should be addressed to: NIHR Journals Library, National Institute for Health Research, Evaluation, Trials and Studies Coordinating Centre, Alpha House, University ofSouthampton Science Park, Southampton SO16 7NS, UK.
145

TABLE 31 Studies excluded at full-text review, with reasons (continued )
CitationReason forexclusion
Kuhnert M. Individual management of preterm labour by using rapid fetal fibronectintesta. J Matern FetalNeonatal Med 2014;27:392–3
Abstract
Kung RWK, Northridge R, Nicoll AE. Fetal fibronectin (FFN) and iatrogenic pre-term birth. Arch Dis ChildFetal Neonatal Ed 2012;97:A80–1
Abstract
Lawin-O’Brien A, Jesner O, Biswas C. Evaluation of fetal fibronectin testing, subsequent management andoutcomes in a London teaching hospital. Arch Dis Child Fetal Neonatal Ed 2014;99:A119
Abstract
Lega MH. Prediction of preterm delivery in patients in preterm labor. J Perinat Med Conference:12th World Congress of Perinatal Medicine 2015;43(no pagination)
Abstract
Lotfi G, Faraz S, Al Swalhee N, Nasir R, Somini S, Abdeldayem R, et al. Evaluation of PAMG-1 for theprediction of preterm birth in patients symptomatic of preterm labor. J Perinat Med Conference:12th World Congress of Perinatal Medicine 2015;43(no pagination)
Abstract
Lou YY, Ajay B. Is PartoSure effective in assessing preterm birth? BJOG 2016;123:89 Abstract
Mahavarker S, Osman MW, Ten-Hof J. Phosphorylated insulin-like growth factor binding protein-1(ACTIM PARTUS) testing in management of threatened preterm labour. Arch Dis Child Fetal Neonatal Ed2012;97:A99–100
Abstract
Nikolova N, Nikolova T, Jovchevski S, Micevska M. Phosphorylated insulin-like growth factor bindingprotein-1 in the prediction of preterm delivery in patients with preterm labor. J Matern Fetal Neonatal Med2016;29:56
Abstract
Nikolova N, Nikolova T, Jovchevski S, Micevska M, Nikolovski S. A comparison between thephosphorylated insulin-like growth factor binding protein-1 and the cervical length in prediction ofsampling to delivery time in patients with preterm labor. J Matern Fetal Neonatal Med 2016;29:56
Abstract
Nikolova T, Uotila J, Nikolova N, Borisova V, Bolotskikh V. Do PAMG-1 or phIGFBP-1 biomarkers improvethe prediction of imminent spontaneous preterm delivery in PTL symptomatic women with non-obviouscervical length (CL)? Am J Obstet Gynecol Conference: 37th annual meeting of the society for maternal-fetal medicine: the pregnancy meeting United States 2017;216(Suppl. 1):S11–2. URL: http://onlinelibrary.wiley.com/o/cochrane/clcentral/articles/156/CN-01304156/frame.html (accessed September 2017)
Abstract
Northridge R, Liu H, Youssef R, Nicoll AE. Predicting pre-term birth using fetal fibronectin (FFN) inNinewells Hospital, Dundee. Arch Dis Child Fetal Neonatal Ed 2011;96:Fa69
Abstract
Ponnusamy V, Farrer K. Impact of antenatal tests on acute in-utero transfers. Arch Dis Child Fetal NeonatalEd 2012;97:A87
Abstract
Radford S, Costa F, Junior E, Sheehan P. Clinical application of quantitative fetal fibronectin for the prediction ofpreterm birth in symptomatic women. BJOG: Conference: RCOG World Congress 2016, UK 2016;123:158–9.URL: http://onlinelibrary.wiley.com/o/cochrane/clcentral/articles/043/CN-01179043/frame.html(accessed September 2017)
Abstract
Randhawa TS, Kwek K. Assessment of the predictive value of phosphorylated insulinlike growth factorbinding protein-1 for preterm delivery. J Matern Fetal Neonatal Med 2010;23:294
Abstract
Spyroulis C, Tsitlakidis C. Prospective study of the Actim Partus test to predict preterm delivery between24–34 weeks of gestation in Glan Clwyd Hospital. Period of study between August 2014–February 2015.BJOG 2016;123:8
Abstract
Thandayathany V, Yassin MAJM, Omar MH, Ismail NAM, Tamil AM, Kampan NC. Fetal fibronectin rapidtest versus phosphorylated insulin-like growth factor-1 (phIGFBP-1) as bedside test kits for prediction ofpreterm delivery in the clinical setting. BJOG 2012;119:5
Abstract
Van Holsbeke C, Dam K, Staelens A, Mesens T, Corremans A. OP11.04: Comparison of the fetalfibronectin (Rapid fFN) and placental alpha microglobulin-1 (PartoSure) tests for predicting imminentspontaneous preterm birth. Ultrasound Obstet Gynecol 2016;48:84
Abstract
Sophie W, Tiphaine B, Celine C, Aurelie DB. Preterm labor: Reliability of the partosure test before andafter digital and transvaginal ultrasound examinations. J Perinat Med Conference: 12th World Congress ofPerinatal Medicine 2015;43(no pagination)
Abstract
APPENDIX 3
NIHR Journals Library www.journalslibrary.nihr.ac.uk
146

TABLE 31 Studies excluded at full-text review, with reasons (continued )
CitationReason forexclusion
Bare T, Mitre A, Shahinaj R, Bakiri F. Fetal fibronectin and cericometry in patients at increased risk for prematurebirth. J Perinat Med Conference: 12th World Congress of Perinatal Medicine 2015;43(no pagination)
Abstract
Benson J, Ghidini A, Landy H, Gilo N, Drassinower D, Poggi S. Fetal fibronectin for evaluation of pretermlabor in the setting of cervical cerclage. Am J Obstet Gynecol 2009;201:S68–S9
Abstract
Berghella V, Hayes E, Visintine J, Baxter JK. Fetal fibronectin testing for reducing the risk of preterm birth.Cochrane Database Syst Rev 2008;4:CD006843. https://doi.org/10.1002/14651858.CD006843.pub2
Abstract
Burrus DR, Ernest JM, Veille JC. Efficacy of four markers of preterm labor (PTL) at predicting preterm delivery(PTD) in a population presenting with contractions and cervical change. Am J Obstet Gynecol 1995;172:405
Abstract
Burrus DR, Ernest JM, Veille JC. Efficacy of four markers of preterm labor (PTL) at predicting latency (LAT)in a population receiving tocolytic therapy. Am J Obstet Gynecol 1995;172:405
Abstract
Goepfert AR, Network NM. The preterm prediction study: Quantitative fetal fibronectin (FFN) values andthe prediction of spontaneous preterm birth (SPTB). Am J Obstet Gynecol 1997;176:S52
Abstract
Goldenberg RL. Vaginal fetal fibronectin (V-fFN) levels at 8–22 weeks and subsequent spontaneouspreterm birth (SPB). Am J Obstet Gynecol 2000;182:S32
Abstract
Greenhagen JB, Van Wagoner J, Dudley D, Hunter C, Mitchell M, Casal D, et al. The value of fetalfibronectin as a predictor of preterm delivery in low risk women. Am J Obstet Gynecol 1996;174:471
Abstract
Grover CM. Use of the fetal fibronectin assay to avert unnecessary hospitalization and bedrest in patientswith preterm labor symptoms: a cost analysis. Prim Care Update Ob Gyns 1998;5:178–9
Abstract
Hadzi-Lega M, Daneva Markova A, Micevska M, Atanasovska Bosku A, Gjirevski V. Cervical length andphosphorilated insulin like growth factor binding protein-1 as a predictors of spontaneus preterm deliveryin symptomatic women. J Matern Fetal Neonatal Med 2014;27:399
Abstract
Hedriana HL, Bliss MC, Gilbert WM. Implementation of fetal fibronectin (FFN) testing in a large privatepractice hospital is safe and effective for the diagnosis and management of preterm labor (PTL).Am J Obstet Gynecol 2005;193:S52-S
Abstract
Henrich W. Cervicometry and fibronectin role. J Matern Fetal Neonatal Med 2010;23:39 Abstract
Hillman-Cooper C, Denbow M, Lopez Bernal A. Identification and quantification of maternal plasmaproteins that predict preterm labour. BJOG 2013;120:160–1
Abstract
Hillman-Cooper CS, Denbow M, Bernal AL. Identification and quantification of maternal plasma proteinsthat predict preterm labour. Endocrine Reviews Conference: 95th Annual Meeting and Expo of theEndocrine Society, ENDO 2013;34(Suppl. 1)
Abstract
Hong J-S, Yoon BH, Romero R, Shim S-S, Sohn Y-K, Park C-W, et al. Patients with a positive cervicalfetal fibronectin followed by a negative test have a reduced likelihood of spontaneous preterm delivery.Am J Obstet Gynecol 2003;189(Suppl. 6):S173
Abstract
Iriye B, Hancock J, Wold S, Huang W, Gorski L, Hancock L. Fetal fibronectin (fFN) testing in symptomaticpatients for preterm labor and McDonald cerclage. Am J Obstet Gynecol 2004;191:S111-S
Abstract
Joffe G. The use & cost benefit of fetal fibronectin testing in an integrated health care system. Clinical Chemistry1999;45:S32–S3
Abstract
Kay S, McKie L, Ajoku K, Roberts N. Fetal fibronectin testing in a district general hospital setting – Are wechanging our management of women with symptomatic preterm labour? BJOG 2015;122:186
Abstract
Khizar SBK, Vallabu S. How to introduce a new service in clinical practice. BJOG 2013;120:96 Abstract
Kiefer D, Keeler S, Rust O, Demishev M, Muscat J, Bornstein E, et al. Is fetal fibronectin (FFN) a marker ofintra-amniotic inflammation in patients with midtrimester short cervix? Am J Obstet Gynecol 2009;201:S60-S
Abstract
Knee A, Belisle E, Markenson G, Malshe A, Plevyak M, Bsat F, et al. Do pregnancies complicated bypreterm births with a negative fetal fibronectin screen have different characteristics compared to thosethat have positive fibronectin results? Am J Obstet Gynecol 2011;204:S190-S
Abstract
continued
DOI: 10.3310/hta23130 HEALTH TECHNOLOGY ASSESSMENT 2019 VOL. 23 NO. 13
© Queen’s Printer and Controller of HMSO 2019. This work was produced by Varley-Campbell et al. under the terms of a commissioning contract issued by the Secretary of Statefor Health and Social Care. This issue may be freely reproduced for the purposes of private research and study and extracts (or indeed, the full report) may be included inprofessional journals provided that suitable acknowledgement is made and the reproduction is not associated with any form of advertising. Applications for commercialreproduction should be addressed to: NIHR Journals Library, National Institute for Health Research, Evaluation, Trials and Studies Coordinating Centre, Alpha House, University ofSouthampton Science Park, Southampton SO16 7NS, UK.
147

TABLE 31 Studies excluded at full-text review, with reasons (continued )
CitationReason forexclusion
Knight B, Smith H, Tregarthen A, Lapointe J, Shennan A, Taylor MJO, et al. Quantitative fetal fibronectin as apredictor of time to delivery in women undergoing induction of labour: a pilot study. BJOG 2016;123:E5-E
Abstract
Kreaden U, Sheldon L, Lockhart T, Paulson M, Shorter S, Martinez R, et al. Natural distribution of fetalfibronectin (fFN) among symptomatic and asymptomatic pregnant women. Clinical Chemistry 1999;45:A86–7
Abstract
Krems J, McGregor J, Hastings C, Hanson J. Fetal fibronectin in cervical secretions: An aid for predictingdelivery in women at high risk from preterm delivery. Am J Obstet Gynecol 1995;172:406
Abstract
Kuhrt K, Seed P, Smout E, Hezelgrave N, Shennan A. The development and validation of a new tool topredict spontaneous preterm birth in high-risk women using quantitative fetal fibronectin and cervicallength. BJOG 2013;120:14–15
Abstract
Kurtzman J, Chandiramani M, Riley A, Poston L, Das A, Shennan A. Quantitative fetal fibronectinscreening at 24 weeks delineates the risk of spontaneous preterm delivery in asymptomatic patients with aprior history of preterm premature rupture of membranes (PPROM). Am J Obstet Gynecol 2009;1:S227
Abstract
Kurtzman J, Jimenez-Solis G, Rosalesortiz S, Martinez-Alvarez O, Das A, Antonio AMJ. Cervical lengthsignificantly modifies the risk of preterm delivery in low risk patients with symptomatic preterm labor anda positive fetal fibronectin. Am J Obstet Gynecol 2008;199:S212-S
Abstract
Levine LD, Romero JA, Pappas H, Weber AL, Elovitz MA. A prospective blinded cohort study evaluatingfetal fibronectin and cervical length in predicting preterm birth in symptomatic women. Am J ObstetGynecol 2016;214:S441–2
Abstract
Luzzi V, Hankins K, Gronowski AM. Accuracy of the rapid fetal fibronectin TLi system in predicting pretermdelivery. Clin Chem 2003;49:501–2
Abstract
Maharajan P, Elliot J, Thampi P. Efficacy of fibronectin and its impact on the use of atosiban-cost implication.Arch Dis Child Fetal Neonatal Ed 2012;97:A92
Abstract
Mancuso M, Biggio J, Owen J. Fetal fibronectin and latency period in women with arrested preterm labor.Am J Obstet Gynecol 2013;208:S221-S
Abstract
Mateus J, Pereira L, Baxter J, Berghella V, Cheku B, Tolosa JE. Fetal fibronectin compared to cervicaldilation in clinical practice. Am J Obstet Gynecol 2003;189:S165-S
Abstract
McKenna DS, Chung K, Shubert P, Iams JD. The effect of digital examination on the expression of fetalfibronectin. Am J Obstet Gynecol 1998;178:S188
Abstract
Merriam A, Sciscione A, Daniel L. A prospective evaluation of the effectiveness of vaginal fetal fibronectinto predict preterm birth in women with symptoms of preterm labor in the outpatient setting. Am J ObstetGynecol 2014;210:S224-S
Abstract
Mogami H, Kondo E, Fujita K, Chigusa Y, Nishimura F, Ujita M, et al. Fetal fibronectin is a pathogenicfactor of preterm PROM and preterm birth. Placenta 2013;34:A4-A
Abstract
Morrison JC, Naefi RWI, Botti JJ, Katz M, Belluomini JM. Uterine activity and fetal fibronectin areindependent and combined predictors of spontaneous preterm birth. Am J Obstet Gynecol 1995;172:406
Abstract
Muller A, McCullough M, Obican S, Norton H, Carter J, Gonzalez-Quintero VH. ‘false’ positive fetalfibronectin and rates of adverse obstetrical outcomes. Am J Obstet Gynecol 2006;195:S233-S
Abstract
Muzaffar S, Behrens R, Barns F, Walker S. Quantitative fetal fibronectin and preterm delivery. BJOG2013;120:595–6
Abstract
Myint H, Singh V, Roberts NJ. Introducing fetal fibronectin testing to a District General Hospital in womenwith symptoms of preterm labour. Arch Dis Child Fetal Neonatal Ed 2011;96:Fa83
Abstract
Myint HH, Ciopec A, Roberts N, Sinha P. Use of fetal fibronectin testing in a district general hospital inwomen with symptoms of preterm labour. BJOG 2013;120:41–2
Abstract
Ness A, Airoldi J, Modena A, Baxter J, Berghella V. Triage of women with possible preterm labor usingtransvaginal ultrasound cervical length and fetal fibronectin. Am J Obstet Gynecol 2005;193:S58-S
Abstract
APPENDIX 3
NIHR Journals Library www.journalslibrary.nihr.ac.uk
148

TABLE 31 Studies excluded at full-text review, with reasons (continued )
CitationReason forexclusion
O’Brien J, Mercer B, Pitts DW, Sibai BM. A comparison of fetal fibronectin, prolactin, and cervicalexamination for the prediction of preterm delivery in symptomatic patients. Am J Obstet Gynecol1995;172:406
Abstract
O’Byrne L, Daly S. Audit of fetal fibronectin use in a tertiary referral hospital in the triaging of threatenedpreterm labour. BJOG 2016;123:13–14
Abstract
Osorio M, Neiva R, Montes L, Silva J, Pinelo S, Pinho M, et al. The Impact of Fetal Fibronectin Assay onPreterm Labor Management: A Randomized Controlled Trial. In Puertas A, Montoya F, Romero J, Hurtado J,Manzanares S, editors. Granada: European Congress, Advances in Perinatal Medicine; 2010
Abstract
Osorio M, Neiva R, Montes L, Silva J, Pinelo S, Pinho M, et al. The impact of fetal fibronectin assay onpreterm labor management: A randomized controlled trial. J Matern Fetal Neonatal Med 2010;23:304–5
Abstract
Peaceman AM, Andrews WW, Thorp JM, Cliver SP, Lukes A, Group FFS. Fetal fibronectin as a predictor ofpreterm birth in symptomatic patients: A multicenter trial. Am J Obstet Gynecol 1996;174:303
Abstract
Pilpel S, Markenson G, Hoffman D. A comparison of fetal fibronectin testing in predicting preterm birth intwin verses singleton gestations. Am J Obstet Gynecol 2002;187(Suppl. 6):S120
Abstract
Pradhan-Drews M, Drews F, Goddard R. Audit on preterm labour. BJOG 2013;120:431–2 Abstract
Radford S, Abbott D, Seed P, Kemp J, Shennan A. Quantitative fetal fibronectin for the prediction ofpreterm birth in symptomatic women. Arch Dis Child Fetal Neonatal Ed 2012;97:A73
Abstract
Radford S, Smith J, Shennan A, Wallace EM. Interhospital transfers of women in threatened pretermlabour to Victorian level 6 hospitals. J Paediatr Child Health 2015;51:51
Abstract
Ray D, Dyson D. Fetal fibronectin as a predictor of preterm delivery in symptomatic patients. Am J ObstetGynecol 2001;184:S37
Abstract
Rebarber A, Sfakianaki AK, Kuczynski E, Paidas M, Russo K, Maturi J, et al. Fetal fibronectin is a validpredictor of spontaneous preterm delivery in patients with cervical cerclages. Am J Obstet Gynecol2001;185(Suppl. 6):S128
Abstract
Revah A, Sue-A-Quan A, Hannah M. Fetal fibronectin as a predictor of preterm birth: A systematic reviewof the literature. Am J Obstet Gynecol 1997;176:S53
Abstract
Richards KM, Troeger KA, Petrilla A, Agatep B, Johnsrud M, Blackwell SC. Burden of preterm labor in thetexas medicaid population. Value in Health 2016;19:A178
Abstract
Rizzo G, Capponi A, Arduini D, Romanini C. The prognostic value of interleukin-8 and fetal fibronectinconcentrations in cervical secretions in patients with preterm labor. Am J Obstet Gynecol 1997;176:S6
Abstract
Roman AS, Koklanaris N, Roshan D, Paidas M, Mulholland J, Levitz M, et al. ‘Blind’ vaginal fetal fibronectinas a predictor of spontaneous preterm delivery: A novel sampling technique. J Soc Gynecol Investig2004;11:204A–5A
Abstract
Rosenblatt KP, Nicolaides KH, Romero R, Bryant-Greenwood PK, Syngelaki A, Menon R, et al. Proteomicderived biomarker panel for first trimester identification of patients at risk for pre-term delivery. Reprod Sci2013;1:80A
Abstract
Salari K, Treadwell M, Thompson K. Predictors of preterm birth: a comparison of cervical length, fetalfibronectin and fetal adrenal gland enlargement. Am J Obstet Gynecol 2015;212:S179–80
Abstract
Sasson I, Triche EW, Azpurua H, Romano M, Paidas M. Short cervix and negative fetal fibronectin: low riskof delivery within 2 weeks of screening. Am J Obstet Gynecol 2008;199:S49-S
Abstract
Schmiedel D, Fischer T, Von Tucher E, Henrich W, Slowinski T, Thomas A. Combination of cervicalsonoelastography with cervical length measurement and fetal fibronectin to improve prediction of pretermbirth. Ultraschall in der Medizin, Supplement Conference: Ultraschall 2013;34(no pagination)
Abstract
Simhan H. Comparison of self-collected vs speculum-collected measurement of quantitative fetal fibronectin.Am J Obstet Gynecol 2016;214:S310–1
Abstract
continued
DOI: 10.3310/hta23130 HEALTH TECHNOLOGY ASSESSMENT 2019 VOL. 23 NO. 13
© Queen’s Printer and Controller of HMSO 2019. This work was produced by Varley-Campbell et al. under the terms of a commissioning contract issued by the Secretary of Statefor Health and Social Care. This issue may be freely reproduced for the purposes of private research and study and extracts (or indeed, the full report) may be included inprofessional journals provided that suitable acknowledgement is made and the reproduction is not associated with any form of advertising. Applications for commercialreproduction should be addressed to: NIHR Journals Library, National Institute for Health Research, Evaluation, Trials and Studies Coordinating Centre, Alpha House, University ofSouthampton Science Park, Southampton SO16 7NS, UK.
149

TABLE 31 Studies excluded at full-text review, with reasons (continued )
CitationReason forexclusion
Stern V, Amabebe E, Anumba D. The association between cervicovaginal fetal fibronectin, the metabolicmarkers of the vaginal microbiome, and preterm birth. BJOG 2016;123:79–80
Abstract
Stern V, Anumba D. Screening for preterm birth with serial cervical length measurement and fetalfibronectin quantification – does rate of change predict early delivery? BJOG 2016;123:80
Abstract
Stern V, Anumba DOC. Predicting preterm birth – the performance of ultrasound cervical length,quantitative fetal fibronectin and vaginal fluid pH differs by risk of preterm birth and symptoms of pretermlabour. Reprod Sci 2016;23:106A-A
Abstract
Stern V, Healey J, Brown B, Anumba D. Assessing the risk of spontaneous premature birth by electricalimpedance spectroscopy of the cervix: The ecclippx study. Reprod Sci 2015;22:331A
Abstract
Stern V, Healey J, Jones G, Dixon S, Walters S, Brown B, et al. The ECCLIPPx study: Electrical impedanceprediction of preterm birth. Arch Dis Child Fetal Neonatal Ed 2014;99:A113–6
Abstract
Swamy G, Simhan H, Seglin H, Heine P. The clinical utility of fetal fibronectin. Am J Obstet Gynecol2001;185(Suppl. 6):S136
Abstract
Swancoat S. ‘Recent vaginal exam’ no longer a contraindication to fetal fibronectin sampling:A prospective study. Obstetrics and Gynecology 2016;127:16S-S
Abstract
Thompson KG, Vaillancourt C, Moore S. Air medical transfer of patients in preterm labour: currenttreatments and tocolytics provided in Ontario. Canadian Journal of Emergency Medicine 2013;15:S6
Abstract
Turitz AL, Ananth C, Gyamfi-Bannerman C. A comparison of quantitative pre- and post-vaginal manipulationfetal fibronectin. Am J Obstet Gynecol 2017;216(Suppl. 1):S197
Abstract
van Baaren GJ, Bruijn M, Vis J, Wilms F, Oudijk M, Kwee A, et al. False-positive, false-negative anduninterpretable results in fetal fibronectin testing during the APOSTEL1 study; which factors docontribute? Am J Obstet Gynecol 2014;210:S395-S
Abstract
van der Krogt L, Hezelgrave N, Seed P, Shennan A. Prediction of spontaneous preterm birth using fetalfibronectin in women with a low-lying placenta. BJOG 2016;123:85
Abstract
Vanner T, Rooney M, Blackburn S. Trends in In-utero transfer: Royal Wolverhampton Hospitals NHS Trust2007 to 2010. Arch Dis Child Fetal Neonatal Ed 2011;96:Fa38
Abstract
Watson H, Carter J, Tribe RM, Shennan AH. The QUIPP app: A safe alternative to a treat-all strategy forthreatened preterm labour. BJOG 2017;124:30–1
Abstract
Watson HA, Ridout A, Ross G, Shennan AH. Decision-making about preterm birth using the QUIPP app:A survey of women’s experiences. BJOG 2017;124:132
Abstract
Akercan F, Cirpan T, Kazandi M, Terek MC, Mgoyi L, Ozkinay E. The value of the insulin-like growth factorbinding protein-1 in the cervical-vaginal secretion detected by immunochromatographic dipstick test inthe prediction of delivery in women with clinically unconfirmed preterm premature rupture of membranes.Eur J Obstet Gynecol Reprod Biol 2005;121:159–63
Comparator
Akercan F, Kazandi M, Sendag F, Cirpan T, Mgoyi L, Terek MC, Sagol S. Value of cervical phosphorylatedinsulinlike growth factor binding protein-1 in the prediction of preterm labor. J Reprod Med 2004;49:368–72
Comparator
Gibson S, Hezelgrave NL, Shennan AH. The impact of quantitative fetal fibronectin on the clinicalmanagement of women symptomatic of preterm labour. Arch Dis Child Fetal Neonatal Ed2014;99:A151–5
Comparator
Kuhrt K, Hezelgrave N, Foster C, Seed PT, Shennan AH. Development and validation of a toolincorporating quantitative fetal fibronectin to predict spontaneous preterm birth in symptomatic women.Ultrasound Obstet Gynecol 2016;47:210–16. https://doi.org/10.1002/uog.14894
Comparator
Honest H, Bachmann LM, Gupta JK, Kleijnen J, Khan KS. Cervicovaginal fetal fibronectin test for predictingrisk of spontaneous preterm birth. ACOG Clinical Review 2002;7:3–4
Design
ACOG Committee. Management of preterm labor. Int J Gynaecol Obstet 2003;82:127–35 Design
Burwick R, Zork N, Lee G, Ross M, Kjos S. Cervilenz assessment of cervical length compared to fetalfibronectinin the prediction of preterm delivery in women with threatened preterm labor. J Matern FetalMed 2011;24:127–31. https://doi.org/10.3109/14767058.2010.529201. [Erratum published in J MaternFetal Med 2016;29:3212.]
Design
APPENDIX 3
NIHR Journals Library www.journalslibrary.nihr.ac.uk
150

TABLE 31 Studies excluded at full-text review, with reasons (continued )
CitationReason forexclusion
Abbott D, Radford S, Foster C, Vousden N, Shennan A. Longitudinal trend of quantitative fetal fibronectinin the prediction of delivery following insertion of a rescue cerclage. J Obstet Gynaecol 2013;33:414–15.https://doi.org/10.3109/01443615.2013.772129
Design
Adams TM, Kinzler WL, Chavez MR, Fazzari MJ, Vintzileos AM. Practice patterns in the timing of antenatalcorticosteroids for fetal lung maturity. J Matern Fetal Neonatal Med 2015;28:1598–601. https://doi.org/10.3109/14767058.2014.962508
Design
Afify E, Pasupathy D, Briley A, Seed P, Poston L, Shennan A. The effect of maternal obesity on pretermdelivery in a high risk cohort. Am J Obstet Gynecol 2011;204(Suppl. 1):S224
Design
Barnard EP. Fetal fibronectin testing for prevention of preterm birth in singleton pregnancies withthreatened preterm labor: A systematic review and metaanalysis of randomized controlled trials.Obstetrics and Gynecology 2016;128:404
Design
Bernhardt J, Dorman K. Pre-term birth risk assessment tools. Exploring fetal fibronectin and cervical lengthfor validating risk. AWHONN Lifelines 2004;8:38–44
Design
Brink S, Chetwynd J, Mannix M. A telling test for early birth . . . use of a vaginal smear to detect fetalfibronectin. US News & World Report 1995;119:86
Design
Bruijn MMC, Hermans FJR, Vis JY, Wilms FF, Oudijk MA, Kwee A, et al. Which factors contributeto false-positive, false-negative, and invalid results in fetal fibronectin testing in women with symptoms ofpreterm labor? Am J Perinatol 2017;34:234–9
Design
Chandiramani M, Di Renzo GC, Gottschalk E, Helmer H, Henrich W, Hoesli I, et al. Fetal fibronectinas a predictor of spontaneous preterm birth: a European perspective. J Matern Fetal Neonatal Med2011;24:330–6. https://doi.org/10.3109/14767058.2010.496879
Design
Chien PFW, Khan KS, Ogston S, Owen P. How useful is cervico-vaginal fetal fibronectin in predictingpreterm labour – Evidence from an overview. J Obstet Gynecol 1998;18:95
Design
Colombo DF. Predicting spontaneous preterm birth – Fetal fibronectin and ultrasonography help to ruleout labour, not rule it in. BMJ 2002;325:289–90
Design
Crawshaw SE, Briley AL. Clinical. A new strategy to tackle preterm labour: PREMET trial. RCM MidwivesJournal 1999;2:122–4
Design
Daskalakis GJ, Papantoniou NE, Koutsodimas NB, Papapanagiotou A, Antsaklis AJ. Fetal fibronectin as apredictor of preterm birth. J Obstet Gynaecol 2000;20:347–53
Design
Decimoni TC, Sansone D, Etto H, Santos AM, Araujo G, Fonseca ES, et al. Systematic literature reviewand cost-effectiveness analysis of fetal fibronectin test for predicting preterm in Brazil. Value Health2013;16:A333–4
Design
Deshpande S, Asselt A, Tomini F, Armstrong N, Allen A, Noake C, et al. Rapid fetal fibronectin (fFN)testing to predict pre-term birth in women with symptoms of premature labour: A systematic review andcost-effectiveness analysis. Health Technol Assess 2013;17(4). URL: http://onlinelibrary.wiley.com/o/cochrane/clhta/articles/HTA-32012000531/frame.html (accessed September 2017)
Design
Elliott JP, Miller HS, Coleman S, Rhea D, Abril D, Hallbauer K, et al. A randomized multicenter study todetermine the efficacy of activity restriction for preterm labor management in patients testing negativefor fetal fibronectin. J Perinatol 2005;25:626–30
Design
Evantash E. Vaginal Fetal Fibronectin to Predict Spontaneous Preterm Birth. JAMA 2017;318:198–9.https://doi.org/10.1001/jama.2017.7133
Design
Faron G, Boulvain M, Irion O. Fetal fibronectin for prediction of preterm delivery: A meta-analysis.Am J Obstet Gynecol 1996;174:471
Design
Feinberg RF, Kliman HJ. Fetal fibronectin and preterm labor. N Engl J Med 1992;326:708. https://doi.org/10.1056/NEJM199203053261013
Design
French L. Fetal fibronectin to predict preterm delivery. J Fam Pract 1998;47:250–1 Design
continued
DOI: 10.3310/hta23130 HEALTH TECHNOLOGY ASSESSMENT 2019 VOL. 23 NO. 13
© Queen’s Printer and Controller of HMSO 2019. This work was produced by Varley-Campbell et al. under the terms of a commissioning contract issued by the Secretary of Statefor Health and Social Care. This issue may be freely reproduced for the purposes of private research and study and extracts (or indeed, the full report) may be included inprofessional journals provided that suitable acknowledgement is made and the reproduction is not associated with any form of advertising. Applications for commercialreproduction should be addressed to: NIHR Journals Library, National Institute for Health Research, Evaluation, Trials and Studies Coordinating Centre, Alpha House, University ofSouthampton Science Park, Southampton SO16 7NS, UK.
151
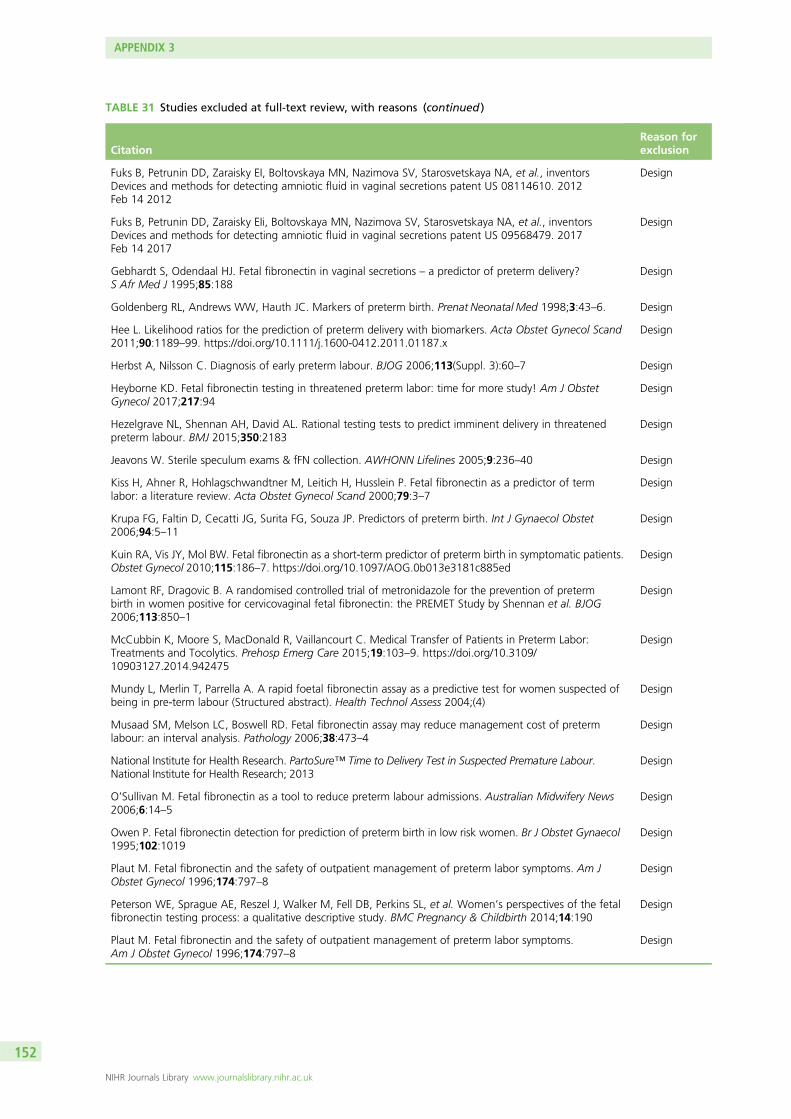
TABLE 31 Studies excluded at full-text review, with reasons (continued )
CitationReason forexclusion
Fuks B, Petrunin DD, Zaraisky EI, Boltovskaya MN, Nazimova SV, Starosvetskaya NA, et al., inventorsDevices and methods for detecting amniotic fluid in vaginal secretions patent US 08114610. 2012Feb 14 2012
Design
Fuks B, Petrunin DD, Zaraisky EIi, Boltovskaya MN, Nazimova SV, Starosvetskaya NA, et al., inventorsDevices and methods for detecting amniotic fluid in vaginal secretions patent US 09568479. 2017Feb 14 2017
Design
Gebhardt S, Odendaal HJ. Fetal fibronectin in vaginal secretions – a predictor of preterm delivery?S Afr Med J 1995;85:188
Design
Goldenberg RL, Andrews WW, Hauth JC. Markers of preterm birth. Prenat Neonatal Med 1998;3:43–6. Design
Hee L. Likelihood ratios for the prediction of preterm delivery with biomarkers. Acta Obstet Gynecol Scand2011;90:1189–99. https://doi.org/10.1111/j.1600-0412.2011.01187.x
Design
Herbst A, Nilsson C. Diagnosis of early preterm labour. BJOG 2006;113(Suppl. 3):60–7 Design
Heyborne KD. Fetal fibronectin testing in threatened preterm labor: time for more study! Am J ObstetGynecol 2017;217:94
Design
Hezelgrave NL, Shennan AH, David AL. Rational testing tests to predict imminent delivery in threatenedpreterm labour. BMJ 2015;350:2183
Design
Jeavons W. Sterile speculum exams & fFN collection. AWHONN Lifelines 2005;9:236–40 Design
Kiss H, Ahner R, Hohlagschwandtner M, Leitich H, Husslein P. Fetal fibronectin as a predictor of termlabor: a literature review. Acta Obstet Gynecol Scand 2000;79:3–7
Design
Krupa FG, Faltin D, Cecatti JG, Surita FG, Souza JP. Predictors of preterm birth. Int J Gynaecol Obstet2006;94:5–11
Design
Kuin RA, Vis JY, Mol BW. Fetal fibronectin as a short-term predictor of preterm birth in symptomatic patients.Obstet Gynecol 2010;115:186–7. https://doi.org/10.1097/AOG.0b013e3181c885ed
Design
Lamont RF, Dragovic B. A randomised controlled trial of metronidazole for the prevention of pretermbirth in women positive for cervicovaginal fetal fibronectin: the PREMET Study by Shennan et al. BJOG2006;113:850–1
Design
McCubbin K, Moore S, MacDonald R, Vaillancourt C. Medical Transfer of Patients in Preterm Labor:Treatments and Tocolytics. Prehosp Emerg Care 2015;19:103–9. https://doi.org/10.3109/10903127.2014.942475
Design
Mundy L, Merlin T, Parrella A. A rapid foetal fibronectin assay as a predictive test for women suspected ofbeing in pre-term labour (Structured abstract). Health Technol Assess 2004;(4)
Design
Musaad SM, Melson LC, Boswell RD. Fetal fibronectin assay may reduce management cost of pretermlabour: an interval analysis. Pathology 2006;38:473–4
Design
National Institute for Health Research. PartoSure™ Time to Delivery Test in Suspected Premature Labour.National Institute for Health Research; 2013
Design
O’Sullivan M. Fetal fibronectin as a tool to reduce preterm labour admissions. Australian Midwifery News2006;6:14–5
Design
Owen P. Fetal fibronectin detection for prediction of preterm birth in low risk women. Br J Obstet Gynaecol1995;102:1019
Design
Plaut M. Fetal fibronectin and the safety of outpatient management of preterm labor symptoms. Am JObstet Gynecol 1996;174:797–8
Design
Peterson WE, Sprague AE, Reszel J, Walker M, Fell DB, Perkins SL, et al. Women’s perspectives of the fetalfibronectin testing process: a qualitative descriptive study. BMC Pregnancy & Childbirth 2014;14:190
Design
Plaut M. Fetal fibronectin and the safety of outpatient management of preterm labor symptoms.Am J Obstet Gynecol 1996;174:797–8
Design
APPENDIX 3
NIHR Journals Library www.journalslibrary.nihr.ac.uk
152

TABLE 31 Studies excluded at full-text review, with reasons (continued )
CitationReason forexclusion
Pucillo K, Munneke S. Fetal fibronectin as predictor of preterm delivery in women with symptoms ofpreterm labor: women with negative FFN test results are unlikely to deliver in the following 2 weeks;observation is still warranted, but expensive interventions may be unnecessary. Evidence-Based Practice2008;11:11–12
Design
Rizzo G, Arduini D. Obstetrical Markes for Very Premature Delivery. In Bevilacqua G, editor.Florence: 8th World Congress of Perinatal Medicine; 2007
Design
Rizzo G, Capponi A, Angelini E, Muscatello A. Ultrasonographic and Biochemical Markers of Preterm Birth.In Carrera JM, Cabero L, Baraibar R, editors. Barcelona: 5th World Congress of Perinatal Medicine; 2007
Design
Ross GN, Ridout AE, Shennan AH. Optimal clinical risk prediction can be achieved by combiningquantitative fetal fibronectin and cervical length, and avoiding thresholds. Acta Obstet Gynecol Scand2016;95:956. https://doi.org/10.1111/aogs.12922
Design
Sanchez-Ramos L. The preterm labor index and fetal fibronectin for prediction of preterm delivery withintact membranes. Obstet Gynecol 2003;102:196
Design
Schindhelm RK, Hoogenberg J, de Vos MT, Tegelaers FP. Analytical performance of quantitative fetalfibronectin assay. Ultrasound Obstet Gynecol 2016;47:127. https://doi.org/10.1002/uog.15824
Design
Siassakos D, O’Brien K, Draycott T. Healthcare evaluation of the use of atosiban and fibronectin forthe management of pre-term labour. J Obstet Gynaecol 2009;29:507–11. https://doi.org/10.1080/01443610903003191
Design
Vis JY, Wilms FF, Oudijk MA, Porath MM, Scheepers HC, Bloemenkamp KW, et al. Cost-effectiveness offibronectin testing in a triage in women with threatened preterm labor: alleviation of pregnancy outcome bysuspending tocolysis in early labor (APOSTEL-I trial). BMC Pregnancy Childbirth 2009;9:38. https://doi.org/10.1186/1471-2393-9-38
Design
Vivanti AJ, Benachi A, Rouzier R. ‘Individualized assessment of preterm birth risk using two modifiedprediction models’ from M. Mailath-Pokorny and colleagues. Eur J Obstet Gynecol Reprod Biol2015;188:136–7. https://doi.org/10.1016/j.ejogrb.2015.03.013
Design
White K. Rapid test for fetal fibronectin measures preterm risk for women. Journal of Womens Health1998;7:1076
Design
Wiqvist N. Fetal fibronectin and preterm birth. Acta Obstetricia Et Gynecologica Scandinavica 1993;72:507–8 Design
Bastek JA, Sammel MD, Srinivas SK, McShea MA, Foreman MN, Elovitz MA, et al. Clinical prediction rules forpreterm birth can risk stratify patients presenting with preterm labor. Am J Obstet Gynecol 2012;1:S219–20
Design
Bastek JA, Sammel MD, Srinivas SK, McShea MA, Foreman MN, Elovitz MA, Metlay JP. Clinical predictionrules for preterm birth in patients presenting with preterm labor. Obstet Gynecol 2012;119:1119–28.https://doi.org/10.1097/AOG.0b013e31825503e5
Design
Tan H, Wen SW, Chen XK, Demissie K, Walker M. Early prediction of preterm birth for singleton, twin,and triplet pregnancies. Eur J Obstet Gynecol Reprod Biol 2007;131:132–7
Design
Abdelazim IA, Al-Sherbeeny MM, Ibrahim MEM, Fahmy AA, Rabei NH, Aziz Khalifa AA. Insulin-like growthfactor binding protein-1/alpha-fetoprotein versus placental alpha microglobulin-1 for diagnosis of prematurefetal membranes rupture. Acta Medica International 2016;3:69–74
Design
Akhmetgaliev AR, Fatkullin IF, Munavirova AA, Fatkullin FI. Algorithm to identify the signs of threatenedpreterm labour. Kazanskii Meditsinskii Zhurnal 2017;98:132–6
Language
Benoist G. [Prediction of preterm delivery in symptomatic women (preterm labor).] J Gynecol Obstet BiolReprod 2016;45:1346–63
Language
Di Renzo GC, Giardina I, Coata G, Di Tommaso M, Facchinetti F, Petraglia F, et al. [Identification ofpreterm labor: the role of the fibronectin and ultrasound cervicometry and their association.] MinervaGinecol 2011;63:477–83
Language
Florjanski J, Kłósek A, Zalewski J, Tomiałowicz M, Fuchs T, Heimrath J, Pajak J. [Ultrasonographicassessment of cervical length and measurement of fetal fibronectin level in cervical secretion of pregnantwomen in prophylaxis of premature deliveries.] Ginekol Pol 2001;72:1139–43
Language
continued
DOI: 10.3310/hta23130 HEALTH TECHNOLOGY ASSESSMENT 2019 VOL. 23 NO. 13
© Queen’s Printer and Controller of HMSO 2019. This work was produced by Varley-Campbell et al. under the terms of a commissioning contract issued by the Secretary of Statefor Health and Social Care. This issue may be freely reproduced for the purposes of private research and study and extracts (or indeed, the full report) may be included inprofessional journals provided that suitable acknowledgement is made and the reproduction is not associated with any form of advertising. Applications for commercialreproduction should be addressed to: NIHR Journals Library, National Institute for Health Research, Evaluation, Trials and Studies Coordinating Centre, Alpha House, University ofSouthampton Science Park, Southampton SO16 7NS, UK.
153

TABLE 31 Studies excluded at full-text review, with reasons (continued )
CitationReason forexclusion
Hampl M, Friese K, Hofmann I, Melchert F. [Quantitative determination of fetal fibronectin in cervicalsmears: a new marker for evaluating the risk of premature labor.] Geburtshilfe Frauenheilkd1994;54:685–90. https://doi.org/10.1055/s-2007-1023624
Language
Hampl M, Hofmann I, Gallati H, Melchert F, Friese K. Fetal fibronectin, tumor-necrosis-factor andinterleukin-6 – new diagnosis of preterm delivery and rupture of the membranes. Arch Gynecol Obstet1993;254:1470–2
Language
Helmer H, Brunbauer M, Schatten C, Rohrmeister K, Husslein P. Treatment with the oxytocin receptorantagonist atosiban in patients with risk of pre-term delivery. Geburtshilfe Und Frauenheilkunde2001;61:755–60
Language
Hincz P, Wilczynski J, Pawłowicz P, Borowski D, Krekora M, Szaflik K. [Fetal fibronectin as a predictor ofpreterm delivery in patients with preterm contractions and cervical changes.] Ginekol Pol 2000;71:728–32
Language
Lorenz-Eberhardt G, Weiss PAM, Haas J, Puerstner P, Adelwoehrer NE. Premature delivery and fetalfibronectin in the cervical and vaginal secretion. Geburtshilfe und Frauenheilkunde 1994;54:414–6
Language
Mansouri A, Tadjerouni A, El Rabiey G, Baube S, Garnier G, Tribalat S. [Is fetal fibronectin a valid testpredictive of premature labor?.] Contracept Fertil Sex 1997;25:380–4
Language
Roubille M, Mailliavin A, Biguet-Vernier B, Bon C, Golfier F, Pichot JC. [Fetal fibronectin as predictor ofpreterm birth.] Ann Biol Clin 1999;57:93–7
Language
Surbek D, Bösiger H, Pavic N, Huber P, Almendral AC, Holzgreve W. [Fetal fibronectin as a marker ofprematurity in a high risk patient sample.] Z Geburtshilfe Neonatol 1997;201:15–20
Language
Tchobroutsky C. Fetal fibronectin in cervical and vaginal secretions as a predictor of preterm delivery.Contraception Fertilite Sexualite 1998;26:23–5
Language
Velasco JG, Gonzalez AG. Febronectin and prevention of preterm delivery. Medicina Clinica1995;105:54–5
Language
Werlen S, Raia T, Di Bartolomeo A, Chauleur C. [Preterm labor: Reproducibility of detection testof PAMG-1 before and after digital examination, and transvaginal ultrasound cervical length.] GynecolObstet Fertil 2015;43:640–5. https://doi.org/10.1016/j.gyobfe.2015.07.002
Language
Wilms FF, van Stralen G, Porath MM, Papatsonis DN, Oei SG, Mol BW, Scherjon S. [Predicating imminentpreterm labour based on a determination of foetal fibronectin in a vaginal smear.] Ned Tijdschr Geneeskd2009;153:B398
Language
Abbott DS, Radford SK, Seed PT, Tribe RM, Shennan AH. Evaluation of a quantitative fetal fibronectintest for spontaneous preterm birth in symptomatic women. Am J Obstet Gynecol 2013;208:122.e1–6.https://doi.org/10.1016/j.ajog.2012.10.890
Outcome
Amabebe E, Reynolds S, Stern V, Stafford G, Paley M, Anumba DO. Cervicovaginal Fluid Acetate:A Metabolite Marker of Preterm Birth in Symptomatic Pregnant Women. Front Med 2016;3:48.https://doi.org/10.3389/fmed.2016.00048
Outcome
Asakura H, Fukami T, Kurashina R, Tateyama N, Doi D, Takeshita T. Significance of cervical gland area inpredicting preterm birth for patients with threatened preterm delivery: comparison with cervical lengthand fetal fibronectin. Gynecol Obstet Invest 2009;68:1–8. https://doi.org/10.1159/000209394
Outcome
Ben-Haroush A, Poran E, Yogev Y, Glezerman M. Vaginal fetal fibronectin evaluation before and immediatelyafter ultrasonographic vaginal cervical length measurements in symptomatic women at risk of preterm birth:a pilot study. J Matern Fetal Neonatal Med 2010;23:854–6. https://doi.org/10.3109/14767050903300977
Outcome
Blackwell S, Shen X, Petrilla AA, Sullivan E, Troeger K. 404: Utilization of fetal fibronectin testing and timingof delivery among emergency department admissions with symptoms of preterm labor. Am J Obstet Gynecol2017;216:S241-S
Outcome
Bogavac M, Simin N, Ranisavljevic M, Budisic L. The role of insulin-like growth factor in prediction andprevention of preterm delivery. Vojnosanit Pregl 2010;67:883–6
Outcome
Bolt LA, Chandiramani M, De Greeff A, Seed P, Shennan AH. Does fetal fibronectin testing change patientmanagement in women at risk of preterm labour? Eur J Obstet Gynecol Reprod Biol 2009;146:180–3
Outcome
APPENDIX 3
NIHR Journals Library www.journalslibrary.nihr.ac.uk
154

TABLE 31 Studies excluded at full-text review, with reasons (continued )
CitationReason forexclusion
Bredaki FE, Lawin-O’Brien A, Jesner O, Forya F, Biswas C, David AL. Quantitative fetal fibronectin to triagewomen with threatened preterm labour in clinical practice. BJOG 2015;122:104
Outcome
Browne H, Jassel I, Dhanji A, Bonney E, Simpson N. Use of quantitative fetal fibronectin may improve riskassessment in symptomatic women at risk of preterm birth. Arch Dis Child Fetal Neonatal Ed Conference:16th Annual Conference of the British Maternal and Fetal Medicine Society Dublin Ireland ConferencePublication 2013;98(no pagination)
Outcome
Chandiramani M, De Greeff A, Filmer J, Bolt LA, Smout E, Shennan AH. The affirm study: Assessment offetal fibronectin testing to improve preterm management. Arch Dis Child Fetal Neonatal Ed 2011;96:Fa65–6
Outcome
Echebiri NC, McDoom MM, Aalto M, Pullen J, Doyle NM. Placental alpha-microglobulin-1 and combinedtraditional diagnostic test: a cost–benefit analysis. Obstetrics & Gynecology 2014;123:3S-S
Outcome
Elizur SE, Yinon Y, Epstein GS, Seidman DS, Schiff E, Sivan E. Insulin-like growth factor binding protein-1detection in preterm labor: evaluation of a bedside test. Am J Perinatol 2005;22:305–9. https://doi.org/10.1055/s-2005-870895
Outcome
Fiorini F, Isted A, Hezelgrave NL, Shennan AH. Prediction of spontaneous preterm birth with quantitativefetal fibronectin in patients with bulging fetal membranes. BJOG 2015;122:123
Outcome
Fiorini F, Isted A, Hezelgrave NL, Shennan AH. Quantitative fetal fibronectin predicts preterm birthin women with bulging fetal membranes. Eur J Obstet Gynecol Reprod Biol 2016;203:127–31.https://doi.org/10.1016/j.ejogrb.2016.05.046
Outcome
Gardner M, Rouse D, Joffe G. Cost–benefit analysis of fetal fibronectin screening. Am J Obstet Gynecol1998;178:S121
Outcome
Giles W, Knox M, Madsen G, Bisits A, Smith R. The effect of fetal fibronectin usage on admissions to atertiary maternal fetal medicine unit and cost savings. Am J Obstet Gynecol 1998;178:S121
Outcome
Goepfert AR, Goldenberg RL, Andrews WW, Hauth JC, Mercer B, Iams J, et al. The Preterm PredictionStudy: Association between cervical interleukin 6 concentration and spontaneous preterm birth. Am JObstet Gynecol 2001;184:483–8
Outcome
Gomez R, Romero R, Montiel C, Magendzo A, Pino P, Nien J, et al. Cervico-vaginal fetal fibronectinimproves the prediction of preterm delivery estimated by sonographic cervical length in patients withpreterm labor and intact membranes. Am J Obstet Gynecol 2002;187(Suppl. 6):S80
Outcome
Hadzi Lega M, Daneva Markova A, Girevski V. Correlation of cervical length and different biochemicalmarkers in spontaneus preterm birth up to 7 days in symptomatic patients. J Perinat Med Conference:12th World Congress of Perinatal Medicine 2015;43(no pagination)
Outcome
Hadzi Lega M, Daneva Markova A, Stefanovic M, Tanturovski M. Interleukin 6 and fetal fibronectin as apredictors of preterm delivery in symptomatic patients. Bosnian journal of basic medical sciences/Udruzenjebasicnih mediciniskih znanosti = Association of Basic Medical Sciences 2015;15:51–6
Outcome
Hadzi Lega M, Daneva Markova A, Tanturovski M. Interleukin 6 and fetal fibronectin in prediction ofpreterm delivery in symptomatic patients. J Matern Fetal Neonatal Med 2014;27:373
Outcome
Hadzi-Lega M, Markova AD, Stefanovic M, Tanturovski M. Combination of selected biochemical markersand cervical length in the prediction of impending preterm delivery in symptomatic patients. Clin ExpObstet Gynecol 2016;43:154–60
Outcome
Hadzi-Lega M, Markova AD, Stefanovic M, Tanturovski M. Correlation of cervical length, fetal fibronectin,phIGFBP-1, and cytokines in spontaneous preterm birth up to 14 days from sampling. J Perinat Med2015;43:545–51. https://doi.org/10.1515/jpm-2014-0275
Outcome
Kekki M, Kurki T, Kärkkäinen T, Hiilesmaa V, Paavonen J, Rutanen EM. Insulin-like growth factor-bindingprotein-1 in cervical secretion as a predictor of preterm delivery. Acta Obstet Gynecol Scand2001;80:546–51
Outcome
Latifagic A, Balic D, Fatusic Z, Hudic I, Kapidzic M, Habibovic A. Insulin-like growth factor-binding protein-1(IGFBP-1) in cervical secretions in women with symptoms of preterm delivery.Medicinski Glasnik 2008;5:121–4
Outcome
continued
DOI: 10.3310/hta23130 HEALTH TECHNOLOGY ASSESSMENT 2019 VOL. 23 NO. 13
© Queen’s Printer and Controller of HMSO 2019. This work was produced by Varley-Campbell et al. under the terms of a commissioning contract issued by the Secretary of Statefor Health and Social Care. This issue may be freely reproduced for the purposes of private research and study and extracts (or indeed, the full report) may be included inprofessional journals provided that suitable acknowledgement is made and the reproduction is not associated with any form of advertising. Applications for commercialreproduction should be addressed to: NIHR Journals Library, National Institute for Health Research, Evaluation, Trials and Studies Coordinating Centre, Alpha House, University ofSouthampton Science Park, Southampton SO16 7NS, UK.
155

TABLE 31 Studies excluded at full-text review, with reasons (continued )
CitationReason forexclusion
Paternoster D, Riboni F, Vitulo A, Plebani M, Dell’Avanzo M, Battagliarin G, et al. Phosphorylated insulin-likegrowth factor binding protein-1 in cervical secretions and sonographic cervical length in the prediction ofspontaneous preterm delivery. Ultrasound Obstet Gynecol 2009;34:437–40. https://doi.org/10.1002/uog.6428
Outcome
Paternoster DM, Cardascia L, Narne S, Parise A, De Paoli M, Plebani M, et al. Predictive Markers of PretermLabour. In Cosmi EV, editor. Alghero: 2nd International Congress New Technologies in ReproductiveMedicine, Neonatology and Gynecology; 1999
Outcome
Paternoster DM, Muresan D, Vitulo A, Serena A, Battagliarin G, Dell’avanzo M, Nicolini U. CervicalphIGFBP-1 in the evaluation of the risk of preterm delivery. Acta Obstet Gynecol Scand 2007;86:151–5
Outcome
Rahkonen L, Unkila-Kallio L, Nuutila M, Sainio S, Saisto T, Rutanen EM, Paavonen J. Cervical lengthmeasurement and cervical phosphorylated insulin-like growth factor binding protein-1 testing in predictionof preterm birth in patients reporting uterine contractions. Acta Obstet Gynecol Scand 2009;88:901–8.https://doi.org/10.1080/00016340903104281
Outcome
Vetr M, Kudela M, Prásilová J. Fetal fibronectin in patients at increased risk for premature birth. Acta UnivPalacki Olomuc Fac Med 1996;140:55–7
Outcome
Centra M, Coata G, Picchiassi E, Alfonsi L, Meniconi S, Bini V, et al. Evaluation of quantitative fFn test inpredicting the risk of preterm birth. J Perinat Med 2017;45:91–8. https://doi.org/10.1515/jpm-2015-0414
Outcome
Anonymous. fFN testing not always so accurate. Contemporary OB/GYN 2009;54:18 Population
Abbott D, Chandiramani M, Seed P, Tribe R, Shennan A. Quantification of fetal fibronectin improves theaccuracy of prediction of spontaneous preterm birth in high risk asymptomatic women. Reprod Sci2013;20:124A-A
Population
Abbott D, Hezelgrave N, Seed P, Bennett P, Chandiramani M, David A, et al. EQUIPP: Evaluation of fetalfibronectin with a novel bedside quantitative instrument for the prediction of preterm birth. J Matern FetalNeonatal Med 2014;27:368–9
Population
Abbott D, Smout E, Foster C, Van der Westhuizen M, Seed P, Shennan AH. The development andvalidation of a prediction tool for spontaneous preterm birth incorporating fetal fibronectin and cervicallength. BJOG 2012;119:e1-e
Population
Audibert F, Fortin S, Delvin E, Djemli A, Brunet S, Dubé J, Fraser WD. Contingent use of fetal fibronectintesting and cervical length measurement in women with preterm labour. J Obstet Gynaecol Can2010;32:307–12
Population
Calvert B, Hezelgrave N, Seed P, Shennan A. Quantitative fetal fibronectin and birth outcome in womenwith previous cervical surgery and a short cervix. BJOG 2015;122:102–3
Population
Esplin M. 6: The use of serial cervical length and quantitative fetal fibronectin to identify nulliparouswomen at risk of subsequent spontaneous preterm birth. Am J Obstet Gynecol 2016;214:S4–5
Population
Esplin MS, Elovitz MA, Iams JD, Parker CB, Wapner RJ, Grobman WA, et al. Predictive accuracy of serialtransvaginal cervical lengths and quantitative vaginal fetal fibronectin levels for spontaneous preterm birthamong nulliparous women. JAMA 2017;317:1047–56. https://doi.org/10.1001/jama.2017.1373
Population
Goldenberg R, Iams J, Mercer M, Meis P, Mowad A, Copper R, et al. Fetal fibronectin and spontaneouspreterm birth. Am J Obstet Gynecol 1995;172:254
Population
Goldenberg RI. The preterm prediction study: Patterns of cervicovaginal fetal fibronectin (FFN) as predictorsof subsequent FFN and spontaneous preterm delivery (SPD). Am J Obstet Gynecol 1997;176:S53
Population
Goldenberg RL. The preterm prediction study: Sequential cervical length and fetal fibronectin testing forthe prediction of spontaneous preterm birth (SPB). Am J Obstet Gynecol 1999;180:S27
Population
Hughes K, Sim S, Roman A, Michalak K, Kane S, Sheehan P. Outcomes and predictive tests from adedicated specialist clinic for women at high risk of preterm labour: A ten year audit. Aust N Z J ObstetGynaecol 2017;57:405–11. https://doi.org/10.1111/ajo.12610
Population
Jeurgens-Borst AJ, Bekkers RL, Sporken JM, van den Berg PP. Use of insulin like growth factor bindingprotein-1 in the diagnosis of ruptured fetal membranes. Eur J Obstet Gynecol Reprod Biol 2002;102:11–14
Population
APPENDIX 3
NIHR Journals Library www.journalslibrary.nihr.ac.uk
156

TABLE 31 Studies excluded at full-text review, with reasons (continued )
CitationReason forexclusion
Kalafat E, Yuce T, Tanju O, Koc A. Preterm premature rupture of membrane assessment via transperinealultrasonography: a diagnostic accuracy study. J Matern Fetal Neonatal Med 2016;29:3690–4. https://doi.org/10.3109/14767058.2016.1140742
Population
Kwek K, Khi C, Ting HS, Yeo GS. Evaluation of a bedside test for phosphorylated insulin-like growth factorbinding protein-1 in preterm labour. Ann Acad Med Singap 2004;33:780–3
Population
Mesic Ðogic L, Micic D, Omeragic F, Kovac R, Fazlagic S. IGFBP-1 marker of cervical ripening and predictorof preterm birth. Med Glas 2016;13:118–24. https://doi.org/10.17392/856-16
Population
Paternoster D, Pignatara R, Grella P. Insulin-like Growth Factor Protein Test (IGFBP-1) in Predicting PretermDelivery. Cosmi EV, editor. Rome: 2nd World Congress on Labour and Delivery; May 1997
Population
Paternoster DM, Pignataro R, Stella A, Bertoldini M, Bracciante M. New Biotechnologies in the Predictionof Preterm Birth. Cosmi EV, editor. Fiuggi: 16th International Congress on the Fetus as a Patient; 2000
Population
Sheehan A, Brennecke S, Boland R, Smith J. The use of fetal fibronectin testing in clinical practice:an audit of referrals for threatened preterm labour to the Victorian perinatal emergency retrieval servicefrom non-tertiary hospitals. J Pediatr Child Health 2017;53:90
Test
Abbott D, Radford S, Seed P, Shennan AH. The first report of a quantitative fetal fibronectin bedsideanalyser in the prediction of preterm birth in symptomatic women. BJOG 2012;119:e1–2
Test
Abenhaim HA, Morin L, Benjamin A. Does availability of fetal firbonectin testing in the managementof threatened preterm labour affect the utilization of hospital resources? Obstet Gynaecol Can2005;27:689–94
Test
Ai F, Li GQ, Jiang J, Dong XD. Neutrophil elastase and fetal fibronectin levels as predictors of single-birthprematurity. Exp Ther Med 2015;10:665–70. https://doi.org/10.3892/etm.2015.2508
Test
Akers A, Jarzembowski JA, Johnson CT, Lieberman RW, Dalton VK. Examining the relationship betweenpositive mid-gestational fetal fibronectin assays and histological evidence of acute placental inflammation.J Perinat Med 2007;35:36–42. https://doi.org/10.1515/JPM.2007.005
Test
Allen KA, Kiwi R. Clinical utilization of a rapid fetal fibronectin assay. Ann Clin Lab Sci 2000;30:323–4 Test
Andersen HF. Use of fetal fibronectin in women at risk for preterm delivery. Clin Obstet Gynecol2000;43:746–58
Test
Anwar A, Lindow SW, Greaves L, Hall S, Jha R. The use of fetal fibronectin in suspected pre-term labour.J Obstet Gynaecol 2014;34:45–7. https://doi.org/10.3109/01443615.2013.823923
Test
Armson A, Dodds L, Dooley K, Howlett A, McPhee A, Scott H. Fetal fibronectin testing for suspectedpreterm labour in Nova Scotia. Am J Obstet Gynecol 2004;191:S115-S
Test
Ayala-Mendez JA, Kurtzman J, Rosales-Ortiz S, Martinez-Alvarez O, Das A, Jimenez-Solis G. Fetalfibronectin status markedly modifies the risk of preterm delivery in low risk patients with symptomaticpreterm labor and cervical shortening. Am J Obstet Gynecol 2008;199:S235-S
Test
Bare T, Manoku N. Fetal fibronectin and cericometry in patients at increased risk for premature birth.Acta Microbiologica Hellenica 2015;60:186
Test
Bartnicki J, Casal D, Kreaden US, Saling E, Vetter K. Fetal fibronectin in vaginal specimens predicts pretermdelivery and very-low-birth-weight infants. Am J Obstet Gynecol 1996;174:971–4
Test
Bayar E, Wietek N, Page L, Girling J. A service evaluation of quantitative fetal fibronectin (qfFN)in symptomatic women as a predictor of preterm birth at West Middlesex University Hospital (WMUH):potential to reduce bed occupancy further. BJOG 2015;122:97
Test
Benson JE, Landy HJ, Ghidini A, Drassinower D, Poggi SH. Fetal fibronectin for evaluation of preterm laborin the setting of cervical cerclage. J Matern Fetal Neonatal Med 2012;25:2330–2. https://doi.org/10.3109/14767058.2012.695820
Test
Berghella V, Hayes E, Visintine J, Baxter JK. Fetal fibronectin testing for reducing the risk of preterm birth.Cochrane Database Syst Rev 2008;4:CD006843. https://doi.org/10.1002/14651858.CD006843.pub2
Test
continued
DOI: 10.3310/hta23130 HEALTH TECHNOLOGY ASSESSMENT 2019 VOL. 23 NO. 13
© Queen’s Printer and Controller of HMSO 2019. This work was produced by Varley-Campbell et al. under the terms of a commissioning contract issued by the Secretary of Statefor Health and Social Care. This issue may be freely reproduced for the purposes of private research and study and extracts (or indeed, the full report) may be included inprofessional journals provided that suitable acknowledgement is made and the reproduction is not associated with any form of advertising. Applications for commercialreproduction should be addressed to: NIHR Journals Library, National Institute for Health Research, Evaluation, Trials and Studies Coordinating Centre, Alpha House, University ofSouthampton Science Park, Southampton SO16 7NS, UK.
157

TABLE 31 Studies excluded at full-text review, with reasons (continued )
CitationReason forexclusion
Berghella V, Saccone G. Fetal fibronectin testing for prevention of preterm birth in singleton pregnancieswith threatened preterm labor: a systematic review and metaanalysis of randomized controlled trials.Am J Obstet Gynecol 2016;215:431–8. https://doi.org/10.1016/j.ajog.2016.04.038
Test
Bolt L, Chandiramani M, De Greeff A, Shennan A. Does fetal fibronectin testing change patientmanagement in women at risk of pre-term labour? Int J Gynecol Obstet 2009;107:S527–8
Test
Boots AB, Sanchez-Ramos L, Bowers DM, Kaunitz AM, Zamora J, Schlattmann P. The short-term prediction ofpreterm birth: a systematic review and diagnostic metaanalysis. Am J Obstet Gynecol 2014;210:54.e1–54.e10.https://doi.org/10.1016/j.ajog.2013.09.004
Test
Bruijn M, Vis J, Wilms F, Oudijk M, Kwee A, Porath M, et al. The contribution of vaginal examination to riskstratification of women with signs of preterm labor before 34 weeks gestation: the APOSTEL1-cohort.Am J Obstet Gynecol 2014;210(Suppl. 1):S362–3
Test
Burrus D, Adair D, Aptel K, Ernest J, Frye A, Veille J. The effect of digital cervical exam on measured levelsof fetal fibronectin. Am J Obstet Gynecol 1996;174:352
Test
Burrus DR, Ernest JM, Veille JC. Fetal fibronectin, interleukin-6, and C-reactive protein are useful inestablishing prognostic subcategories of idiopathic preterm labor. Am J Obstet Gynecol 1995;173:1258–62
Test
Burwick RM, Zork NM, Lee GT, Ross MG, Kjos SL. Cervilenz assessment of cervical length compared tofetal fibronectin in the prediction of preterm delivery in women with threatened preterm labor. J MaternFetal Neonatal Med 2011;24:127–31. https://doi.org/10.3109/14767058.2010.529201
Test
Chandiramani M, Das A, Bolt LA, de Greeff A, Filmer J, Shennan A. Assessment of fetal fibronectin testingto improve preterm birth management. Reprod Sci 2014;21:151A–2A
Test
Cheung KW, Ngu SF, Lee CP. Fetal fibronectin test on Chinese women with symptoms of preterm labour:a pilot study. Hong Kong Med J 2013;19:424–8. https://doi.org/10.12809/hkmj133861
Test
Chien PF, Khan KS, Ogston S, Owen P. The diagnostic accuracy of cervico-vaginal fetal fibronectin inpredicting preterm delivery: an overview (Structured abstract). Br J Obstet Gynaecol 1997;104:436–44.URL: http://onlinelibrary.wiley.com/o/cochrane/cldare/articles/DARE-11997000650/frame.html(accessed September 2017)
Test
Clock C, Kurtzman J. Positive fetal fibronectin status is associated with dynamic cervical shortening inpatients with normal baseline cervical length and symptomatic contractions. Am J Obstet Gynecol2007;197:S199-S
Test
Coleman MAG, Keelan JA, McCowan LME, Townend KM, Mitchell MD. Predicting preterm delivery:comparison of cervicovaginal interleukin (IL)-1 beta, IL-6 and IL-8 with fetal fibronectin and cervicaldilatation. Eur J Obstet Gynecol Reprod Biol 2001;95:154–8
Test
Cox S, Little B, Dax J, Leveno K. Fetal fibronectin and preterm delivery. Am J Obstet Gynecol1996;174:306
Test
DeFranco EA, Lewis DF, Odibo AO. Improving the screening accuracy for preterm labor: is the combinationof fetal fibronectin and cervical length in symptomatic patients a useful predictor of preterm birth? Asystematic review. Am J Obstet Gynecol 2013;208:233.e1–6. https://doi.org/10.1016/j.ajog.2012.12.015
Test
Deshpande SN, van Asselt AD, Tomini F, Armstrong N, Allen A, Noake C, et al. Rapid fetal fibronectintesting to predict preterm birth in women with symptoms of premature labour: a systematic review andcost analysis. Health Technol Assess 2013;17(40). https://doi.org/10.3310/hta17400
Test
Díaz J, Chedraui P, Hidalgo L, Medina M. The clinical utility of fetal fibronectin in the prediction ofpre-term birth in a low socio-economic setting hospital in Ecuador. J Matern Fetal Neonatal Med2009;22:89–93. https://doi.org/10.1080/14767050802464551
Test
Dutta D, Norman JE. Pilot study into the efficacy of foetal fibronectin testing in minimising hospital admissionsin women presenting with symptoms of preterm labour: a randomised controlled trial of obstetric andneonatal outcomes. Arch Gynecol Obstet 2011;284:559–65. https://doi.org/10.1007/s00404-010-1712-x
Test
APPENDIX 3
NIHR Journals Library www.journalslibrary.nihr.ac.uk
158

TABLE 31 Studies excluded at full-text review, with reasons (continued )
CitationReason forexclusion
Ehsanipoor RM, Swank ML, Jwa SC, Wing DA, Tarabulsi G, Blakemore KJ. Placental α-microglobulin-1in vaginal secretions of women with evidence of preterm labor. Am J Perinatol 2016;33:208–13.https://doi.org/10.1055/s-0035-1563710
Test
Elliot J, Maharajan P, Thampi P. Test that predicts premature labour: efficacy of foetal fibronectin test andits cost implications. Arch Dis Child Fetal Neonatal Ed 2012;97:A19–20
Test
Farag AH, Mohammed MM, Ellaithy MI, Salama HA. Blind vaginal fetal fibronectin swab for prediction ofpreterm birth. J Obstet Gynaecol Res 2015;41:1009–17. https://doi.org/10.1111/jog.12666
Test
Fell DB, Sprague AE, Grimshaw JM, Yasseen AS, Coyle D, Dunn SI, et al. Evaluation of the impact of fetalfibronectin test implementation on hospital admissions for preterm labour in Ontario: a multiple baselinetime-series design. BJOG 2014;121:438–46. https://doi.org/10.1111/1471-0528.12511
Test
Foong E, Chye Chuah S. Clinical application of quantitative fetal fibronectin testing in the management ofpreterm labour at a regional hospital. Aust N Z J Obstet Gynaecol 2016;56:37–8
Test
Foxman EF, Jarolim P. Use of the fetal fibronectin test in decisions to admit to hospital for preterm labor.Clin Chem 2004;50:663–5. https://doi.org/10.1373/clinchem.2003.028720
Test
Franco R, Shaw K, Williams C, Hickok D. Risk of preterm delivery with a positive fetal fibronectin test resultand a normal cervical length. Obstet Gynecol 2005;105:114S-S
Test
Fricke E. A quality analysis of the evaluation of preterm labor. Am J Obstet Gynecol 2015;1:S66 Test
Gaikwad VA, Rajput UG, Puri MS. Cervico vaginal fluid fibronectin level in assessing risk of preterm labour.Res J Pharm Biol Chem Sci 2014;5:156–62
Test
Gao L, Zhang JP, Chen H, Guo ZJ, Chen LB, Tan JP, et al. Fetal fibronectin detection for preterm birthprediction. Genet Mol Res 2014;13:1323–8. https://doi.org/10.4238/2014.February.28.4
Test
Garite T, Lucah AC, Williams C, Bobritchi B, Lapointe J. A comparison of speculum andnon-speculum collection of cervicovaginal SWAB specimens for fetal fibronectin testing. Am J ObstetGynecol 2005;193:S52-S
Test
Giles W, Bisits A, Knox M, Madsen G, Smith R. The effect of fetal fibronectin testing on admissions to atertiary maternal-fetal medicine unit and cost savings. Am J Obstet Gynecol 2000;182:439–42
Test
Goepfert AR, Andrews WW. The preterm prediction study: association between cervical interleukin-6 (IL-6),fetal fibronectin (FFN), and spontaneous preterm birth (SPTB). Am J Obstet Gynecol 1997;176:S6
Test
Rossel Goffeng A, Holst E, Milsom I, Lindstedt G, Lundberg PA, Andersch B. Factors influencing vaginalfetal fibronectin concentrations during pregnancy. Gynecol Obstet Invest 1999;47:83–8
Test
Goffinet F, Kayem G, Maillard F, Trébéden H, Cabrol D, Weill B, Batteux F. Detection of interleukin 6mRNA by RT-PCR in vaginal secretions: association with preterm delivery and neonatal infection in womenwith preterm labour and intact membranes. Eur J Obstet Gynecol Reprod Biol 2005;123:167–73
Test
Golic M, Siedentopf JP, Pauly F, Hinkson L, Henrich W, Tucher E. Influence of transvaginal ultrasoundexamination on quantitative vaginal fibronectin measurements: a prospective evaluation study. J PerinatMed 2017;45:85–9. https://doi.org/10.1515/jpm-2015-0270
Test
Grobman WA, Welshman EE, Calhoun EA. Does fetal fibronectin use in the diagnosis of pretermlabor affect physician behavior and health care costs? A randomized trial. Am J Obstet Gynecol2004;191:235–40. https://doi.org/10.1016/j.ajog.2003.11.034
Test
Groom KM, Liu E, Allenby K. The impact of fetal fibronectin testing for women with symptoms of pretermlabour in routine clinical practice within a New Zealand population. Aust N Z J Obstet Gynaecol2006;46:440–5
Test
Harstall C. Using fetal fibronectin to diagnose pre-term labour: the role of rapid fetal fibronectin assay inthe management of spontaneous preterm labour (Structured abstract). Health Technol Assess 2008(4).URL: http://onlinelibrary.wiley.com/o/cochrane/clhta/articles/HTA-32008100049/frame.html(accessed September 2017)
Test
continued
DOI: 10.3310/hta23130 HEALTH TECHNOLOGY ASSESSMENT 2019 VOL. 23 NO. 13
© Queen’s Printer and Controller of HMSO 2019. This work was produced by Varley-Campbell et al. under the terms of a commissioning contract issued by the Secretary of Statefor Health and Social Care. This issue may be freely reproduced for the purposes of private research and study and extracts (or indeed, the full report) may be included inprofessional journals provided that suitable acknowledgement is made and the reproduction is not associated with any form of advertising. Applications for commercialreproduction should be addressed to: NIHR Journals Library, National Institute for Health Research, Evaluation, Trials and Studies Coordinating Centre, Alpha House, University ofSouthampton Science Park, Southampton SO16 7NS, UK.
159

TABLE 31 Studies excluded at full-text review, with reasons (continued )
CitationReason forexclusion
Helmer H, Brunbauer M, Rohrmeister K. Exploring the role of Tractocile in everyday clinical practice.BJOG 2003;110(Suppl. 20):113–15
Test
Heng YJ, Pennell CE, Chua HN, Perkins JE, Lye SJ. Whole blood gene expression profile associatedwith spontaneous preterm birth in women with threatened preterm labor. PLOS ONE 2014;9:e96901.https://doi.org/10.1371/journal.pone.0096901
Test
Hermans FJR, Bruijn MMC, Vis JY, Wilms FF, Oudijk MA, Porath MM, et al. Risk stratification with cervicallength and fetal fibronectin in women with threatened preterm labor before 34 weeks and not deliveringwithin 7 days. Acta Obstetricia Et Gynecologica Scandinavica 2015;94:715–21
Test
Hincz P, Wilczynski J, Kozarzewski M, Borowski D, Krekora M, Szaflik K. Two-step test: Fetal fibronectinand sonographic examination of the uterine cervix in patients presenting with preterm contractions.Am J Obstet Gynecol 2000;182:S44
Test
Hincz P, Wilczynski J, Kozarzewski M, Szaflik K. Two-step test: the combined use of fetal fibronectin andsonographic examination of the uterine cervix for prediction of preterm delivery in symptomatic patients.Acta Obstet Gynecol Scand 2002;81:58–63
Test
Honest H, Forbes CA, Durée KH, Norman G, Duffy SB, Tsourapas A, et al. Screening to preventspontaneous preterm birth: systematic reviews of accuracy and effectiveness literature with economicmodelling. Health Technol Assess 2009;13(43). https://doi.org/10.3310/hta13430
Test
Iams JD, Casal D, McGregor JA, Goodwin TM, Kreaden US, Lowensohn R, Lockitch G. Fetal fibronectinimproves the accuracy of diagnosis of preterm labor. Am J Obstet Gynecol 1995;173:141–5
Test
Ibrahim MI, Sherif A, El-Kady M, Ellaithy M, Husseiny A, Kamal M, El-Din NN. Can three-dimensionalultrasound measurement of fetal adrenal gland enlargement predict preterm birth? Arch Gynecol Obstet2015;292:569–78. https://doi.org/10.1007/s00404-015-3668-3
Test
Incerti M, Ghidini A, Korker V, Pezzullo JC. Performance of cervicovaginal fetal fibronectin in a communityhospital setting. Arch Gynecol Obstet 2007;275:347–51. https://doi.org/10.1007/s00404-006-0267-3
Test
Joffe G, Jacques D, Burton B, Bemis-Heys R, Shelburne P, Lovelace. Impact of fetal fibronectin assay onadmissions for preterm labor. Am J Obstet Gynecol. 1998;178(1 PART 2):S11
Test
Joffe GM, Jacques D, Bemis-Heys R, Burton R, Skram B, Shelburne P. Impact of the fetal fibronectin assayon admissions for preterm labor. Am J Obstet Gynecol 1999;180:581–6
Test
Karamisheva V, Ivanov S, Nachev A. Comparison of two rapid strip tests based on ffn and pamg-1 for theprediction of imminent spontaneous preterm delivery. Comptes Rendus De L Academie Bulgare DesSciences 2016;69:661–6
Test
Keeler S, Roman A, Coletta J, Kiefer D, Rust O. Fetal fibronectin testing prior to ultrasound-indicated CERC1age: can it predict procedure success? Am J Obstet Gynecol 2007;197:S199-S
Test
Keeler SM, Roman AS, Coletta JM, Kiefer DG, Feuerman M, Rust OA, et al. Fetal fibronectin testing inpatients with short cervix in the midtrimester: can it identify optimal candidates for ultrasound-indicatedcerclage? Am J Obstet Gynecol 2009;200:158.e1–6
Test
Langer B, Boudier E, Schlaeder G. Cervico-vaginal fetal fibronectin: predictive value during false labor.Acta Obstet Gynecol Scand 1997;76:218–21
Test
Lee G, Burwick R, Zork N, Kjos S. Does the use of fetal fibronectin in an algorithm for preterm laborreduce triage evaluation times? J Matern Fetal Neonatal Med: the Official Journal of the EuropeanAssociation of Perinatal Medicine, the Federation of Asia and Oceania Perinatal Societies, the InternationalSociety of Perinatal Obstetricians 2013;26:706–9. URL: http://onlinelibrary.wiley.com/o/cochrane/clcentral/articles/772/CN-00966772/frame.html (accessed September 2017)
Test
Lee SM, Romero R, Park JW, Kim SM, Park CW, Korzeniewski SJ, et al. The clinical significanceof a positive Amnisure test in women with preterm labor and intact membranes. J Matern Fetal NeonatalMed 2012;25:1690–8. https://doi.org/10.3109/14767058.2012.657279
Test
Leitich H, Egarter C, Kaider A, Hohlagschwandtner M, Berghammer P, Husslein P. Cervicovaginal fetalfibronectin as a marker for preterm delivery: a meta-analysis. Am J Obstet Gynecol 1999;180:1169–76
Test
APPENDIX 3
NIHR Journals Library www.journalslibrary.nihr.ac.uk
160

TABLE 31 Studies excluded at full-text review, with reasons (continued )
CitationReason forexclusion
Lopez RL, Francis JA, Garite TJ, Dubyak JM. Fetal fibronectin detection as a predictor of preterm birth inactual clinical practice. Am J Obstet Gynecol 2000;182:1103–6
Test
Lowe MP, Zimmerman B, Hansen W. Prospective randomized controlled trial of fetal fibronectin onpreterm labor management in a tertiary care center. Am J Obstet Gynecol 2004;190:358–62. https://doi.org/10.1016/j.ajog.2003.08.041
Test
Lu GC, Goldenberg RL, Cliver SP, Kreaden US, Andrews WW. Vaginal fetal fibronectin levels andspontaneous preterm birth in symptomatic women. Obstet Gynecol 2001;97:225–8
Test
MacDonald WA, Bender M, Saxton A. Use of fetal fibronectin in the management of preterm labour inNunavut. Alaska Med 2007;49(Suppl. 2):215–17
Test
Malak TM, Sizmur F, Bell SC, Taylor DJ. Fetal fibronectin in cervicovaginal secretions as a predictor ofpreterm birth. Br J Obstet Gynaecol 1996;103:648–53
Test
Marvin KW, Keelan JA, Coleman MA, McCowan LM, Zhou RL, Mitchell MD. Intercellular adhesion molecule-1 (ICAM-1) in cervicovaginal fluid of women presenting with preterm labor: predictive value for pretermdelivery. Am J Reprod Immunol 2000;43:264–71
Test
Mateus J, Pereira L, Baxter J, Berghella V, Tolosa J. Effectiveness of fetal fibronectin testing compared withdigital cervical assessment of women with preterm contractions. Am J Perinatol 2007;24:381–5. https://doi.org/10.1055/s-2007-981849
Test
Morrison JC, Allbert JR, McLaughlin BN, Whitworth NS, Roberts WE, Martin RW. Oncofetal fibronectin inpatients with false labor as a predictor of preterm delivery. Am J Obstet Gynecol 1993;168:538–42
Test
Most O, Langer O, Kerner R, David GB, Calderon I. Can myometrial electrical activity identify patients inpreterm labor? Am J Obstet Gynecol 2008;199:378.e1–6. https://doi.org/10.1016/j.ajog.2008.08.003
Test
Musaad SM, Melson CL, Boswell DR. Assessment of the impact of introducing fetal fibronectin assay inthe management of preterm labour at Middlemore Hospital, New Zealand. Pathology 2005;37:226–30
Test
Ness A, Visintine J, Ricci E, Berghella V. Does knowledge of cervical length and fetal fibronectin affectmanagement of women with threatened preterm labor? A randomized trial. Am J Obstet Gynecol2007;197:426.e1–7
Test
Ness A, Visintine J, Ricci E, Boyle K, Berghella V. Use of fetal fibronectin and transvaginal ultrasoundcervical length to triage women with suspected preterm labor: a randomized trial. Am J ObstetGynecol 2006;195(Suppl. 1):S67. URL: http://onlinelibrary.wiley.com/o/cochrane/clcentral/articles/777/CN-00582777/frame.html (accessed September 2017)
Test
Nguyen T. The cost-effectiveness of fetal fibronectin testing in suspected preterm labor: a randomizedtrial. Obstet Gynecol 2002;99(Suppl. 4):97s. URL: http://onlinelibrary.wiley.com/o/cochrane/clcentral/articles/633/CN-00387633/frame.html (accessed September 2017)
Test
Owen P, Scott A. Can fetal fibronectin testing improve the management of preterm labour?Clin Exp Obstet Gynecol 1997;24:19–22
Test
Parisaei M, Currie J, O’Gorman N, Morris S, David AL. Implementation of foetal fibronectin testing:admissions, maternal interventions and costs at 1 year. J Obstet Gynaecol 2016;36:888–92
Test
Parker J, Bell R, Brennecke S. Fetal fibronectin in the cervicovaginal fluid of women with threatenedpreterm labour as a predictor of delivery before 34 weeks’ gestation. Aust N Z J Obstet Gynaecol1995;35:257–61
Test
Parry E, Singh TG, Dow D, Noovao F. Improved management in threatened preterm labour with rapid fetalfibronectin testing. Aust N Z J Obstet Gynaecol 2006;46:240–1
Test
Plaut MM, Smith W, Kennedy K. Fetal fibronectin: the impact of a rapid test on the treatment of womenwith preterm labor symptoms. Am J Obstet Gynecol 2003;188:1588–93
Test
Revah A, Hannah ME, Sue-A-Quan AK. Fetal fibronectin as a predictor of preterm birth: an overview.Am J Perinatol 1998;15:613–21. https://doi.org/10.1055/s-2007-994079
Test
continued
DOI: 10.3310/hta23130 HEALTH TECHNOLOGY ASSESSMENT 2019 VOL. 23 NO. 13
© Queen’s Printer and Controller of HMSO 2019. This work was produced by Varley-Campbell et al. under the terms of a commissioning contract issued by the Secretary of Statefor Health and Social Care. This issue may be freely reproduced for the purposes of private research and study and extracts (or indeed, the full report) may be included inprofessional journals provided that suitable acknowledgement is made and the reproduction is not associated with any form of advertising. Applications for commercialreproduction should be addressed to: NIHR Journals Library, National Institute for Health Research, Evaluation, Trials and Studies Coordinating Centre, Alpha House, University ofSouthampton Science Park, Southampton SO16 7NS, UK.
161

TABLE 31 Studies excluded at full-text review, with reasons (continued )
CitationReason forexclusion
Rinehart BK, Terrone DA, Isler CM, Barrilleaux PS, Bufkin L, Morrison JC. Pregnancy outcomein women with preterm labor symptoms without cervical change. Am J Obstet Gynecol 2001;184:1004–7
Test
Rizzo G, Capponi A, Arduini D, Lorido C, Romanini C. The value of fetal fibronectin in cervicaland vaginal secretions and of ultrasonographic examination of the uterine cervix in predicting prematuredelivery for patients with preterm labor and intact membranes. Am J Obstet Gynecol 1996;175:1146–51
Test
Roman AS, Koklanaris N, Paidas MJ, Mulholland J, Levitz M, Rebarber A. ‘Blind’ vaginal fetal fibronectin asa predictor of spontaneous preterm delivery. Obstet Gynecol 2005;105:285–9
Test
Roos C, Schuit E, Scheepers HC, Bloemenkamp KW, Bolte AC, Duvekot HJ, et al. Predictive factorsfor delivery within 7 days after successful 48-hour treatment of threatened preterm labor. AJP Rep2015;5:e141–9. https://doi.org/10.1055/s-0035-1552930
Test
Roos C, Vis JY, Scheepers HC, Bloemenkamp KW, Duvekot HJ, van Eyck J, et al. Fetal fibronectin statusand cervical length in women with threatened preterm labor and the effectiveness of maintenancetocolysis. J Matern Fetal Neonatal Med 2016;29:1556–61. https://doi.org/10.3109/14767058.2015.1053863
Test
Rose CH, McWeeney DT, Brost BC, Davies NP, Watson WJ. Cost-effective standardization of preterm laborevaluation. Am J Obstet Gynecol 2010;203:250.e1–5. https://doi.org/10.1016/j.ajog.2010.06.037
Test
Rossel Goffeng A, Holst E, Milsom I, Lindstedt G, Lundberg PA, Andersch B. Factors influencing vaginalfetal fibronectin concentrations during pregnancy. Gynecol Obstet Invest 1999;47:83–8
Test
Rozenberg P, Goffinet F, Malagrida L, Giudicelli Y, Perdu M, Houssin I, et al. Evaluating the risk of pretermdelivery: a comparison of fetal fibronectin and transvaginal ultrasonographic measurement of cervicallength. Am J Obstet Gynecol 1997;176:196–9
Test
Sakai M, Sasaki Y, Yamagishi N, Tanebe K, Yoneda S, Saito S. The preterm labor index and fetalfibronectin for prediction of preterm delivery with intact membranes. Obstet Gynecol 2003;101:123–8
Test
Salcedo A, Kurtzman J. Digital cervical exam characteristics stratify the risk of preterm birth based on fetalfibronectin status. Am J Obstet Gynecol 2013;208:S203-S
Test
Senden IP, Owen P. Comparison of cervical assessment, fetal fibronectin and fetal breathing in the diagnosisof preterm labour. Clin Exp Obstet Gynecol 1996;23:5–9
Test
Skoll A, St Louis P, Amiri N, Delisle MF, Lalji S. The evaluation of the fetal fibronectin test for prediction ofpreterm delivery in symptomatic patients. J Obstet Gynaecol Can 2006;28:206–13
Test
Stevens AO, Chauhan SP, Magann EF, Martin RW, Bofill JA, Cushman JL, Morrison JC. Fetal fibronectinand bacterial vaginosis are associated with preterm birth in women who are symptomatic for pretermlabor. Am J Obstet Gynecol 2004;190:1582–7. https://doi.org/10.1016/j.ajog.2004.03.059
Test
Stuart RW, Jones RO, Underwood F, Kryka R, Bodor GS. The utility of fetal fibronectin in preterm labordecision making. Am J Clin Path 2007;128:513–4
Test
Sukchaya K, Phupong V. A comparative study of positive rate of placental α-microglobulin-1 test inpre-term pregnant women with and without uterine contraction. J Obstet Gynaecol 2013;33:566–8.https://doi.org/10.3109/01443615.2013.807786
Test
Sullivan A, Hueppchen NA, Satin AJ. Cost effectiveness of bedside fetal fibronectin testing varies accordingto treatment algorithm. J Matern Fetal Med 2001;10:380–4
Test
Sunagawa S, Takagi K, Ono K, Miyachi K, Kikuchi A. Comparison of biochemical markers and cervicallength for predicting preterm delivery. J Obstet Gynaecol Res 2008;34:812–19. https://doi.org/10.1111/j.1447-0756.2008.00844.x
Test
Swamy GK, Simhan HN, Gammill HS, Heine RP. Clinical utility of fetal fibronectin for predicting pretermbirth. J Reprod Med 2005;50:851–6
Test
Tanir HM, Sener T, Yildiz Z. Cervicovaginal fetal fibronectin (FFN) for prediction of preterm delivery insymptomatic cases: a prospective study. Clin Exp Obstet Gynecol 2008;35:61–4
Test
APPENDIX 3
NIHR Journals Library www.journalslibrary.nihr.ac.uk
162

TABLE 31 Studies excluded at full-text review, with reasons (continued )
CitationReason forexclusion
Tekesin I, Eberhart LH, Schaefer V, Wallwiener D, Schmidt S. Evaluation and validation of a newrisk score (CLEOPATRA score) to predict the probability of premature delivery for patients with threatenedpreterm labor. Ultrasound Obstet Gynecol 2005;26:699–706. https://doi.org/10.1002/uog.2633
Test
Tekesin I, Marek S, Hellmeyer L, Reitz D, Schmidt S. Assessment of rapid fetal fibronectin in predictingpreterm delivery. Obstet Gynecol 2005;105:280–4
Test
Tekesin I, Wallwiener D, Schmidt S. The value of quantitative ultrasound tissue characterization of thecervix and rapid fetal fibronectin in predicting preterm delivery. J Perinat Med 2005;33:383–91.https://doi.org/10.1515/JPM.2005.070
Test
Triana H, Saldivar D, Contreras N, Guzman A, Soria A, Farran I, et al. Fetal Fibronectin in the Diagnosis ofPreterm Labor. In Cabero L, Carrera JM, editors. Perinatology 2001 Volumes 1 and 2. Bologna: MonduzziInternational Proceedings Division; 2001. pp. 599–602
Test
Tsoi E, Akmal S, Geerts L, Jeffery B, Nicolaides KH. Sonographic measurement of cervical length and fetalfibronectin testing in threatened preterm labor. Ultrasound Obstet Gynecol 2006;27:368–72. https://doi.org/10.1002/uog.2723
Test
Tsoi E, Akmal S, Geerts L, Jeffery B, Nicolaides KH. Sonographic measurement of cervical length and fetalfibronectin testing in threatened preterm labor. Obstet Gynecol Surv 2006;61:441–2
Test
Tsourapas A, Roberts T, Barton P, Honest H, Forbes C, Hyde C, et al. An economic evaluation of alternativetest-intervention strategies to prevent spontaneous pre-term birth in singleton pregnancies (Structuredabstract). Acta Obstetricia et Gynecologica Scandinavica 2009;88:1319–30. URL: http://onlinelibrary.wiley.com/o/cochrane/cleed/articles/NHSEED-22010000199/frame.html (accessed September 2017)
Test
van Baaren GJ, Vis JY, Wilms FF, Oudijk MA, Kwee A, Porath MM, et al. Cost-effectiveness of diagnostictesting strategies including cervical length measurement and fibronectin testing in women with symptomsof preterm labor. Ultrasound Obstet Gynecol 2018;51:596–603
Test
van Baaren G-J, Vis J, Wilms F, Oudijk M, Kwee A, Porath M, et al. The risk of preterm delivery in womenwith signs of preterm labor before 34 weeks who do not deliver within 7 days: the APOSTEL-1 cohort.Am J Obstet Gynecol 2014;210(Suppl. 1):S375
Test
Voluménie JL, Guibourdenche J, Doridot V, Sibony O, Oury JF, Blot P, Luton D. Failure of cervicalfibronectin to predict premature delivery in a population of monofetal pregnancies with idiopathic pretermlabor. Eur J Obstet Gynecol Reprod Biol 2001;97:35–9
Test
von Schöning D, Fischer T, von Tucher E, Slowinski T, Weichert A, Henrich W, Thomas A. Cervicalsonoelastography for improving prediction of preterm birth compared with cervical length measurementand fetal fibronectin test. J Perinat Med 2015;43:531–6. https://doi.org/10.1515/jpm-2014-0356
Test
Watson DL, Kim SJ, Humphrey MD. Study of cervicovaginal fetal fibronectin status to guide treatment ofthreatened preterm labour. Aust N Z J Obstet Gynaecol 1998;38:185–7
Test
Watson HA, Carter J, Seed PT, Tribe RM, Shennan AH. The QUIPP app: a safe alternative to a treat-allstrategy for threatened preterm labour. Ultrasound Obstet Gynecol 2017:24
Test
Wilms FF, van Baaren GJ, Vis JY, Oudijk MA, Kwee A, Porath MM, et al. Prescribing patterns of antenatalcorticosteroids in women with threatened preterm labor. Eur J Obstet Gynecol Reprod Biol 2015;192:47–53https://doi.org/10.1016/j.ejogrb.2015.06.008
Test
Wilms FF, Vis JY, de Wit-Zuurendonk L, Porath MM, Mol BW. What is the risk of preterm delivery afterarrested preterm labor? Am J Perinatol 2015;32:63–70. https://doi.org/10.1055/s-0034-1374818
Test
Woodworth A, Moore J, G’Sell C, Verdoes A, Snyder JA, Morris L, et al. Diagnostic accuracy ofcervicovaginal interleukin-6 and interleukin-6: albumin ratio as markers of preterm delivery. Clin Chem2007;53:1534–40
Test
Yoneda S, Sakai M, Sasaki Y, Shiozaki A, Hidaka T, Saito S. Interleukin-8 and glucose in amniotic fluid,fetal fibronectin in vaginal secretions and preterm labor index based on clinical variables are optimalpredictive markers for preterm delivery in patients with intact membranes. J Obstet Gynaecol Res2007;33:38–44
Test
continued
DOI: 10.3310/hta23130 HEALTH TECHNOLOGY ASSESSMENT 2019 VOL. 23 NO. 13
© Queen’s Printer and Controller of HMSO 2019. This work was produced by Varley-Campbell et al. under the terms of a commissioning contract issued by the Secretary of Statefor Health and Social Care. This issue may be freely reproduced for the purposes of private research and study and extracts (or indeed, the full report) may be included inprofessional journals provided that suitable acknowledgement is made and the reproduction is not associated with any form of advertising. Applications for commercialreproduction should be addressed to: NIHR Journals Library, National Institute for Health Research, Evaluation, Trials and Studies Coordinating Centre, Alpha House, University ofSouthampton Science Park, Southampton SO16 7NS, UK.
163

TABLE 31 Studies excluded at full-text review, with reasons (continued )
CitationReason forexclusion
Yoneda S, Shiozaki A, Yoneda N, Shima T, Ito M, Yamanaka M, et al. Prediction of exact delivery time inpatients with preterm labor and intact membranes at admission by amniotic fluid interleukin-8 level andpreterm labor index. J Obstet Gynaecol Res 2011;37:861–6. https://doi.org/10.1111/j.1447-0756.2010.01453.x
Test
Yoneyama K, Kimura A, Kogo M, Kiuchi Y, Morimoto T, Okai T. Clinical predictive factors for pretermbirth in women with threatened preterm labour or preterm premature ruptured membranes? Aust N Z JObstet Gynaecol 2009;49:16–21
Test
Magro-Malosso E, Seravalli V, Cozzolino M, Spitaleri M, Susini T, Di Tommaso M. Prediction of pretermdelivery by fetal fibronectin in symptomatic and asymptomatic women with cervical length ≤ 20mm.J Matern Fetal Neonatal Med 2017;30:294–7. https://doi.org/10.3109/14767058.2016.1171309
Test
Management of preterm labour. Volume 1: Evidence report and appendices; Volume 2: Evidence tables(Structured abstract). Health Technol Assess 2000;1(4). URL: http://onlinelibrary.wiley.com/o/cochrane/clhta/articles/HTA-32001000946/frame.html (accessed September 2017)
Unobtainable
Fetal fibronectin for the prediction of preterm labor (Structured abstract). Health Technol Assess 2000(4). Unobtainable
Fetal fibronectin point of care test (project record). Health Technol Assess 2006(2). URL: http://onlinelibrary.wiley.com/o/cochrane/clhta/articles/HTA-32006000075/frame.html
Unobtainable
Actim Partus test (project record). Health Technol Assess 2010(4). URL: http://onlinelibrary.wiley.com/o/cochrane/clhta/articles/HTA-32010001243/frame.html
Unobtainable
Aboulenien W, Azzam A, Saleh F, Abollo M, Soliman A. Insulin-like growth factor binding protein-1 incervico-vaginal secretions as an indicator of premature rupture of membranes: Comparison with nitrazinetest and amniotic fluid index. Int J Gynecol Obstet 2009;107:S413
Unobtainable
American College of Obstetricians and Gynecologists. Fetal fibronectin preterm labor risk test.Int J Gynecol Obstet 1997;59:164
Unobtainable
Anonymous. Fetal fibronectin measurement to predict preterm delivery. Am Fam Physician 1992;45:287 Unobtainable
Bare T, Mitre A, Vata E, Shkurti E, Hoxhaj O, Manoku N. Biomarkers and cervical length to predictspontaneous preterm birth in high-risk women. IJEES 2015;5:29–34
Unobtainable
Basak S, Babbur V. Audit of in-utero transfers following introduction of rapid fetal fibronectin test forassessment of preterm labour in a district general hospital in United Kingdom. Int J Gynecol Obstet2012;119:S291
Unobtainable
Bertani D, Beski L, Tagliavini M, Benassi L. Prognostic Role of Fetal Fibronectin in Threatened PretermDelivery. Merialdi A, Cavatorta E, Gramellini D, editors. Parma: 18th Meeting on Prenatal Medicine; 1993
Unobtainable
Bianco M, Depew C, Meisel R. A fetal fibronectin assay for detection of rupture of membranes.Am J Obstet Gynecol 1993;168:435
Unobtainable
Burwick R, York N, Lee, Ross M, Kjos S. Cervilenz assessment of cervical length is equivalent to fetalfibronectin in the prediction of preterm delivery. American College of Obstetricians and Gynecologists’Annual Meeting, San Francisco, CA, 17–19 May 2010. URL: http://onlinelibrary.wiley.com/o/cochrane/clcentral/articles/741/CN-00755741/frame.html (accessed September 2017)
Unobtainable
Crane J, Armson BA, Dodds L, Kennedy W, Feinberg R. Predictors of preterm delivery. Am J ObstetGynecol 1998;178:S189
Unobtainable
Gervasi MT, Marsoni V, Reveane A, Serra MM, Bracalente G, Darin G. Role of Fetal Fibronectin in theDiagnosis of Preterm Delivery. Cosmi EV, editor. Spoleto: 6th National Congress–Societa Italiana DiMedicina Perinatale; 1996
Unobtainable
Ghidini A, Poggi SH, Korker V. Perfomance of vaginal fetal fibronectin as predictor of preterm delivery in acommunity hospital. J Soc Gynecol Investig 2006;13:338A-A
Unobtainable
Gottschalk EM, Wenzel S, Salomon NS, Dudenhausen JW, Henrich W. Importance of cervical lengthmeasurement and fetal Fibronectin (fFN) to the prediction of lower premature birth rate. Geburtshilfe UndFrauenheilkunde 2008;68:S25-S
Unobtainable
Hayes, Inc. Fetal fibronectin test in women with symptoms of preterm labor (Structured abstract). HealthTechnol Assess 2006(4). URL: http://onlinelibrary.wiley.com/o/cochrane/clhta/articles/HTA-32006001571/frame.html (accessed September 2017)
Unobtainable
APPENDIX 3
NIHR Journals Library www.journalslibrary.nihr.ac.uk
164

TABLE 31 Studies excluded at full-text review, with reasons (continued )
CitationReason forexclusion
Klee GG, Arnold SE, Heise RH. Fetal fibronectin as a risk predictor of preterm delivery. Clinical Chemistry2000;46:A65-A
Unobtainable
Lu GC, Goldenberg RL, Cliver SP, Kreaden US, Andrews WW. Quantitative fetal fibronectin levels and theprediction of spontaneous preterm birth in symptomatic women. Am J Obstet Gynecol 2000;182:S53
Unobtainable
Luzzi VI, Hankins K, Gronowski AM. Predictive value of fetal fibronectin as a biochemical marker ofpreterm delivery using the rapid fFN TLiTM system. Clinical Chemistry 2002;48:A121-A
Unobtainable
Macones GA, Stamilio D. Fetal fibronectin testing: the cost for false negative/positive results acrossgestational ages. Am J Obstet Gynecol 2000;182:S46
Unobtainable
Marzolf G, Kreaden U, Lockhart T, Cooper M, Paulson M, Sheldon L, et al. Effect of time delay betweenspecimen collection and testing with rapid fetal fibronectin (fFN) for the Adeza TLi (TM) System. ClinicalChemistry 1999;45:A94-A
Unobtainable
Mims O, Taylor S, Sundaram S, Stevens M, Manimekalai S, Goldstein PJ. Fetal fibronectin assay to predictpre term labor. Clinical Chemistry 1999;45:A72-A
Unobtainable
Min DL, Haberman S, McCalla S. The impact of the rapid fetal fibronectin assay on the management ofpreterm labor. Obstetrics and Gynecology 2004;103:73S-S
Unobtainable
Morgan BR. Clinical performance of the Adeza biomedical TLi Rapid Fetal Fibronectin Test at amultispecialty clinic. Clinical Chemistry 2001;47:A145-A
Unobtainable
Nishida N, Asakura H, Yonezawa M, Tateyama N, Doi D, Fukami T. Prediction of preterm birth in comparisonof TVS findings to those with positive fetal fibronectin (fFN). Int J Gynecol Obstet 2009;107:S468
Unobtainable
Oyelese Y, Peters S, Ananth CV, Kinzler W, Smulian JC. The utility of fetal fibronectin in predicting pretermbirth in clinical practice. J Soc Gynecol Investig 2006;13:123A-A
Unobtainable
Paternoster DM, Lazzarin L, Stella A, Pignataro R. Fetal Fibronectin and Determination of Blood FerritinLevels in Preterm Delivery. Cosmi EV, editor. Spoleto: 6th National Congress–Societa Italiana Di MedicinaPerinatale; 1996
Unobtainable
Pates JA, Lattu AL, Nielsen PE. The value of fetal fibronectin in predicting the onset of labor before41 weeks of gestation. Obstetrics and Gynecology 2008;111:102S-S
Unobtainable
Paulson MC, Lapointe J, Sheldon E, Mason R, Hernandez O. Elimination of sample warming for rapid fFNtesting. Clinical Chemistry 2002;48:A194-A
Unobtainable
Paulson MC, Sheldon EL. A Comparison of rapid fFN for the TLi system and the rapid fFN for the TLi IQsystem. Clinical Chemistry 2001;47:A111-A
Unobtainable
Quintieri F, Paternoster D, Depaoli M, Grella PV, Plebani M. Fetal Fibronectin in Early Diagnosis of PretermBirths. Merialdi A, Cavatorta E, Gramellini D, editors. Parma: 18th Meeting on Prenatal Medicine; 1993
Unobtainable
Ray D, Dyson D, Hendershott C, Field R, Walton D, Newman L, et al. A comparison of rapid fFN on theTLiTM system to the fFN enzyme immunoassay in symptomatic women. Am J Obstet Gynecol 2000;182:S44
Unobtainable
Reveane A, Marsoni V, Gervasi MT, Amici G, Serra M, Marzolini M. Correlation between fetal fibronectinlevels and the risk of premature delivery. Cosmi EV, editor. Spoleto: 6th National Congress–Societa ItalianaDi Medicina Perinatale; 1996
Unobtainable
Rinehart BK, Terrone DA, Isler CM, Barrilleaux PS, Bufkin LK, Morrison JC. Patients with false labor symptomsand positive fetal fibronectin are more likely to deliver preterm. Am J Obstet Gynecol 2000;182:S49
Unobtainable
Sheldon EL, Paulson MC, Hernandez O. The effect of yeast on rapid fFN for the TLi(tm) system.Clinical Chemistry 2001;47:A184-A
Unobtainable
Sheldon EL, Paulson MC, Lockhart T, Marzolf G. Analytical evaluation of Rapid Fetal Fibronectin (fFN) forthe Adeza Tli((TM)) System. Clinical Chemistry 2000;46:A4-A
Unobtainable
Siddiqa M, Haloob R. An audit of fetal fibronectin test. Int J Gynecol Obstet 2012;119:S752 Unobtainable
Volpogni C, Facchinetti F, Martinez F, Genazzani AR. Fetal Fibronectin as Predictor of Preterm Birth.In Merialdi A, Cavatorta E, Gramellini D, editors. Parma: 18th Meeting on Prenatal Medicine; 1993
Unobtainable
DOI: 10.3310/hta23130 HEALTH TECHNOLOGY ASSESSMENT 2019 VOL. 23 NO. 13
© Queen’s Printer and Controller of HMSO 2019. This work was produced by Varley-Campbell et al. under the terms of a commissioning contract issued by the Secretary of Statefor Health and Social Care. This issue may be freely reproduced for the purposes of private research and study and extracts (or indeed, the full report) may be included inprofessional journals provided that suitable acknowledgement is made and the reproduction is not associated with any form of advertising. Applications for commercialreproduction should be addressed to: NIHR Journals Library, National Institute for Health Research, Evaluation, Trials and Studies Coordinating Centre, Alpha House, University ofSouthampton Science Park, Southampton SO16 7NS, UK.
165

Raw rest accuracy data as reported in the papers
TABLE 32 The DTA values for prediction of delivery within 48 hours
Study (first authorand year) N
Truepositive
Falsepositive
Truenegative
Falsenegative Sensitivity (%) Specificity (%) PPV (%) NPV (%) +LR (95% CI) –LR (95% CI)
Actim Partus
Brik (2010)48 276 NR NR NR NR 73.7 64.9 16.1 96.4 2.10(1.52 to 2.91)
0.41(0.19 to 0.87)
Goyal (2016)52 60 23 11 14 12 NR NR NR NR NR NR
Lembet (2002)53 36 14 4 17 1 93.3 81 77.8 94.4 4.9(2.0 to 11.9)
0.08(0.01 to 0.50)
Ting (2007)56 94 NR NR NR NR 100 74 18 100 NR NR
Tripathi (2016)57 468 NR NR NR NR 95.4 82.2 61.7 98.3 NR NR
aVishwekar (2017)58 30 11 3 14 2 73.3 64.3 68.8 69.2 NR NR
PartoSure
Werlen (2015)41 41 0 1 39 1 NR NR NR NR NR NR
NR, not reported.a One patient with a negative result absconded so delivery details could not be obtained.
APPEN
DIX
3
NIHRJournals
Librarywww.journalslibrary.nihr.ac.uk
166
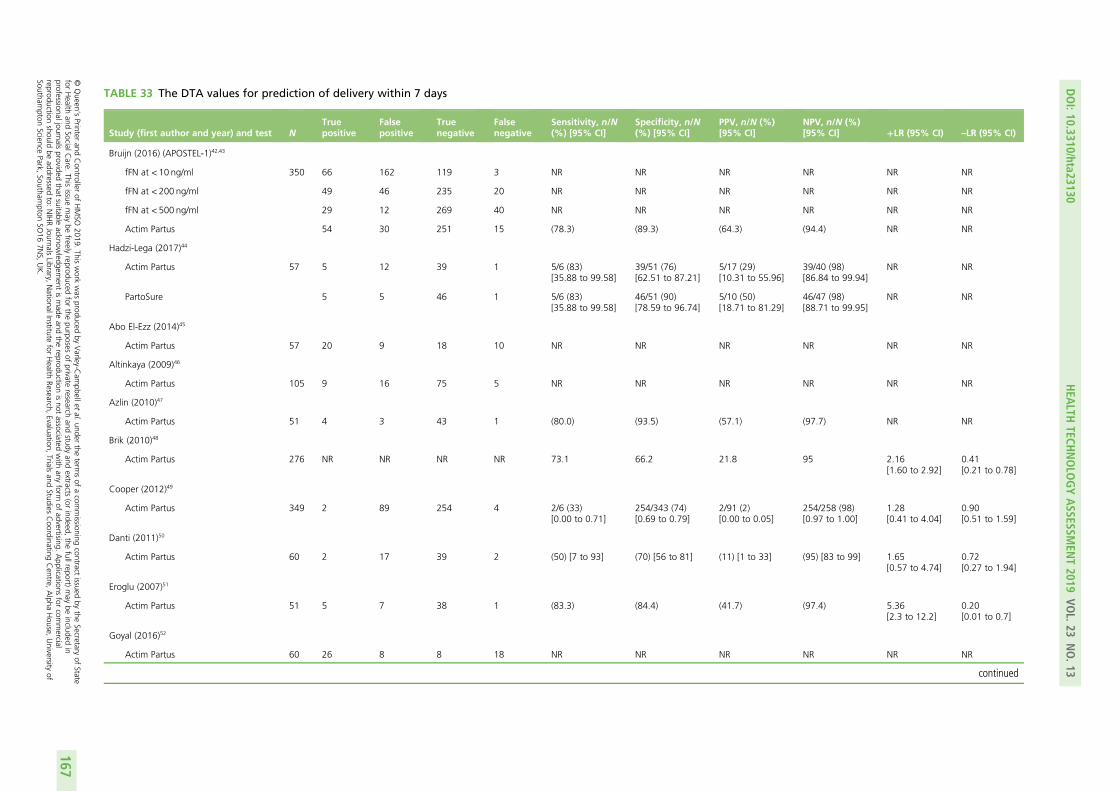
TABLE 33 The DTA values for prediction of delivery within 7 days
Study (first author and year) and test NTruepositive
Falsepositive
Truenegative
Falsenegative
Sensitivity, n/N(%) [95% CI]
Specificity, n/N(%) [95% CI]
PPV, n/N (%)[95% CI]
NPV, n/N (%)[95% CI] +LR (95% CI) –LR (95% CI)
Bruijn (2016) (APOSTEL-1)42,43
fFN at < 10 ng/ml 350 66 162 119 3 NR NR NR NR NR NR
fFN at < 200 ng/ml 49 46 235 20 NR NR NR NR NR NR
fFN at < 500 ng/ml 29 12 269 40 NR NR NR NR NR NR
Actim Partus 54 30 251 15 (78.3) (89.3) (64.3) (94.4) NR NR
Hadzi-Lega (2017)44
Actim Partus 57 5 12 39 1 5/6 (83)[35.88 to 99.58]
39/51 (76)[62.51 to 87.21]
5/17 (29)[10.31 to 55.96]
39/40 (98)[86.84 to 99.94]
NR NR
PartoSure 5 5 46 1 5/6 (83)[35.88 to 99.58]
46/51 (90)[78.59 to 96.74]
5/10 (50)[18.71 to 81.29]
46/47 (98)[88.71 to 99.95]
NR NR
Abo El-Ezz (2014)45
Actim Partus 57 20 9 18 10 NR NR NR NR NR NR
Altinkaya (2009)46
Actim Partus 105 9 16 75 5 NR NR NR NR NR NR
Azlin (2010)47
Actim Partus 51 4 3 43 1 (80.0) (93.5) (57.1) (97.7) NR NR
Brik (2010)48
Actim Partus 276 NR NR NR NR 73.1 66.2 21.8 95 2.16[1.60 to 2.92]
0.41[0.21 to 0.78]
Cooper (2012)49
Actim Partus 349 2 89 254 4 2/6 (33)[0.00 to 0.71]
254/343 (74)[0.69 to 0.79]
2/91 (2)[0.00 to 0.05]
254/258 (98)[0.97 to 1.00]
1.28[0.41 to 4.04]
0.90[0.51 to 1.59]
Danti (2011)50
Actim Partus 60 2 17 39 2 (50) [7 to 93] (70) [56 to 81] (11) [1 to 33] (95) [83 to 99] 1.65[0.57 to 4.74]
0.72[0.27 to 1.94]
Eroglu (2007)51
Actim Partus 51 5 7 38 1 (83.3) (84.4) (41.7) (97.4) 5.36[2.3 to 12.2]
0.20[0.01 to 0.7]
Goyal (2016)52
Actim Partus 60 26 8 8 18 NR NR NR NR NR NR
continued
DOI:10.3310/hta23130
HEA
LTHTECH
NOLO
GYASSESSM
ENT2019
VOL.23
NO.13
©Queen
’sPrinter
andController
ofHMSO
2019.This
work
was
producedby
Varley-C
ampbellet
al.under
theterm
sof
acom
missioning
contractissued
bythe
Secretaryof
Statefor
Health
andSocialC
are.This
issuemay
befreely
reproducedfor
thepurposes
ofprivate
researchand
studyand
extracts(or
indeed,the
fullreport)may
beincluded
inprofessionaljournals
providedthat
suitableacknow
ledgement
ismade
andthe
reproductionisnot
associatedwith
anyform
ofadvertising.
Applications
forcom
mercial
reproductionshould
beaddressed
to:NIHRJournals
Library,NationalInstitute
forHealth
Research,Evaluation,
Trialsand
StudiesCoordinating
Centre,
Alpha
House,
University
ofSoutham
ptonScience
Park,Southam
ptonSO
167N
S,UK.
167
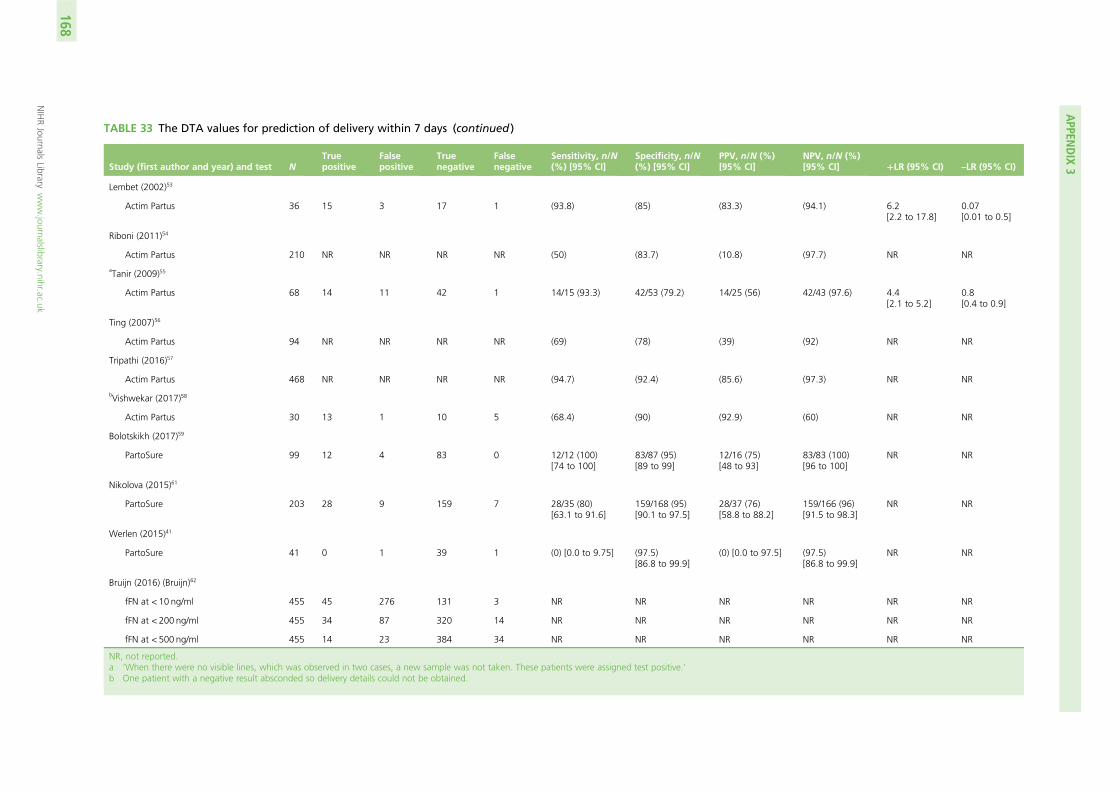
TABLE 33 The DTA values for prediction of delivery within 7 days (continued )
Study (first author and year) and test NTruepositive
Falsepositive
Truenegative
Falsenegative
Sensitivity, n/N(%) [95% CI]
Specificity, n/N(%) [95% CI]
PPV, n/N (%)[95% CI]
NPV, n/N (%)[95% CI] +LR (95% CI) –LR (95% CI)
Lembet (2002)53
Actim Partus 36 15 3 17 1 (93.8) (85) (83.3) (94.1) 6.2[2.2 to 17.8]
0.07[0.01 to 0.5]
Riboni (2011)54
Actim Partus 210 NR NR NR NR (50) (83.7) (10.8) (97.7) NR NR
aTanir (2009)55
Actim Partus 68 14 11 42 1 14/15 (93.3) 42/53 (79.2) 14/25 (56) 42/43 (97.6) 4.4[2.1 to 5.2]
0.8[0.4 to 0.9]
Ting (2007)56
Actim Partus 94 NR NR NR NR (69) (78) (39) (92) NR NR
Tripathi (2016)57
Actim Partus 468 NR NR NR NR (94.7) (92.4) (85.6) (97.3) NR NR
bVishwekar (2017)58
Actim Partus 30 13 1 10 5 (68.4) (90) (92.9) (60) NR NR
Bolotskikh (2017)59
PartoSure 99 12 4 83 0 12/12 (100)[74 to 100]
83/87 (95)[89 to 99]
12/16 (75)[48 to 93]
83/83 (100)[96 to 100]
NR NR
Nikolova (2015)61
PartoSure 203 28 9 159 7 28/35 (80)[63.1 to 91.6]
159/168 (95)[90.1 to 97.5]
28/37 (76)[58.8 to 88.2]
159/166 (96)[91.5 to 98.3]
NR NR
Werlen (2015)41
PartoSure 41 0 1 39 1 (0) [0.0 to 9.75] (97.5)[86.8 to 99.9]
(0) [0.0 to 97.5] (97.5)[86.8 to 99.9]
NR NR
Bruijn (2016) (Bruijn)62
fFN at < 10 ng/ml 455 45 276 131 3 NR NR NR NR NR NR
fFN at < 200 ng/ml 455 34 87 320 14 NR NR NR NR NR NR
fFN at < 500 ng/ml 455 14 23 384 34 NR NR NR NR NR NR
NR, not reported.a ‘When there were no visible lines, which was observed in two cases, a new sample was not taken. These patients were assigned test positive.’b One patient with a negative result absconded so delivery details could not be obtained.
APPEN
DIX
3
NIHRJournals
Librarywww.journalslibrary.nihr.ac.uk
168
Appendix 4 Additional information on existingcost-effectiveness studies
Further detail on observational cost-minimisation studies
The study by Abenhaim et al.136 describes the cost implications for the addition of Rapid fFN to clinicalexamination in a tertiary university hospital in Montreal, Canada. The diagnostic protocol of clinicalevaluation of women presenting with symptoms of threatened preterm labour followed by fFN testing inpregnant women without a confirmed (i.e. cervix dilated > 3 cm in presence of contraction) or ruled out(cervix was closed and uneffaced and monitoring revealed no palpable or measured contractions) pretermlabour diagnosis by clinical examination was compared with clinical examination alone.
This study evaluated fFN in a setting in which cervical length measurement has not been incorporatedas part of the assessment of patients presenting to a labour and delivery unit with preterm contractions.The fFN group was a prospective cohort of 116 pregnant women, of whom 36 were tested for fFN. Threepatients had a positive test result, of whom one delivered within 7 days after admission (33% PPV) and theother two were eventually discharged from hospital without delivery. Thirty-three pregnant women had anegative test result, none of whom delivered within 2 weeks (100% NPV); however, three of these women(9%) were admitted to hospital. The latter finding is one of the major strengths of this study, given thepaucity of evidence on the effect of testing on patient management in this area.
The authors136 acknowledged the absence of pharmaceutical and radiological and laboratory costs as alimitation of their study. In this regard, the study does not provide evidence on the proportion of womenwho were adequately managed with corticosteroid treatment (i.e. within 7 days of delivery) or, indeed,on the overall proportion of preterm deliveries including those beyond 2 weeks after testing. The authorsalso state that fFN was overused during the study period, thus preventing an accurate assessment of theproportion of women who would have required additional evaluation if testing had been unavailable.
A US study137 compared the number of hospital admissions in the year after the adoption of a laboratory-based fFN protocol with the baseline 12-month period in a single provider and its tertiary referral centre,covering the period from July 1995 to June 1997. The protocol specified that those with a negative testresult should be asked to return 2 weeks later for re-examination and testing. Adopting fFN reduced thepercentage of admissions from 28.1% to 17%, the mean number of preterm labour admissions perpatient from 1.8 to 1.6 (p = 0.002) and the proportion of patients with tocolytic therapy from 10% to7.9% (p = 0.030). This study also reported neonatal outcomes (i.e. percentage of NICU admissions, mediandays of NICU length of stay, ventilation duration and percentage of steroid administration among infantsadmitted to NICU), but these were not reported in a manner useful to our purposes. In any case, the fFNtesting protocol in this study is outdated because it was based on a laboratory assay (as opposed to theRapid fFN test commonly used these days) and required mothers testing negative to return 2 weeks laterfor fFN retesting.
Other studies with relevant outcomesBerghella and Saccone138 systematically reviewed the RCT evidence on fFN and found that it resulted in anincreasing trend towards admission to NICU (risk ratio 2.48, 95% CI 0.96 to 6.46) relative to clinical examinationalone (blinded to fFN results), which had a 7.45% prevalence across the two RCTs reporting this outcome.76,139
DOI: 10.3310/hta23130 HEALTH TECHNOLOGY ASSESSMENT 2019 VOL. 23 NO. 13
© Queen’s Printer and Controller of HMSO 2019. This work was produced by Varley-Campbell et al. under the terms of a commissioning contract issued by the Secretary of Statefor Health and Social Care. This issue may be freely reproduced for the purposes of private research and study and extracts (or indeed, the full report) may be included inprofessional journals provided that suitable acknowledgement is made and the reproduction is not associated with any form of advertising. Applications for commercialreproduction should be addressed to: NIHR Journals Library, National Institute for Health Research, Evaluation, Trials and Studies Coordinating Centre, Alpha House, University ofSouthampton Science Park, Southampton SO16 7NS, UK.
169
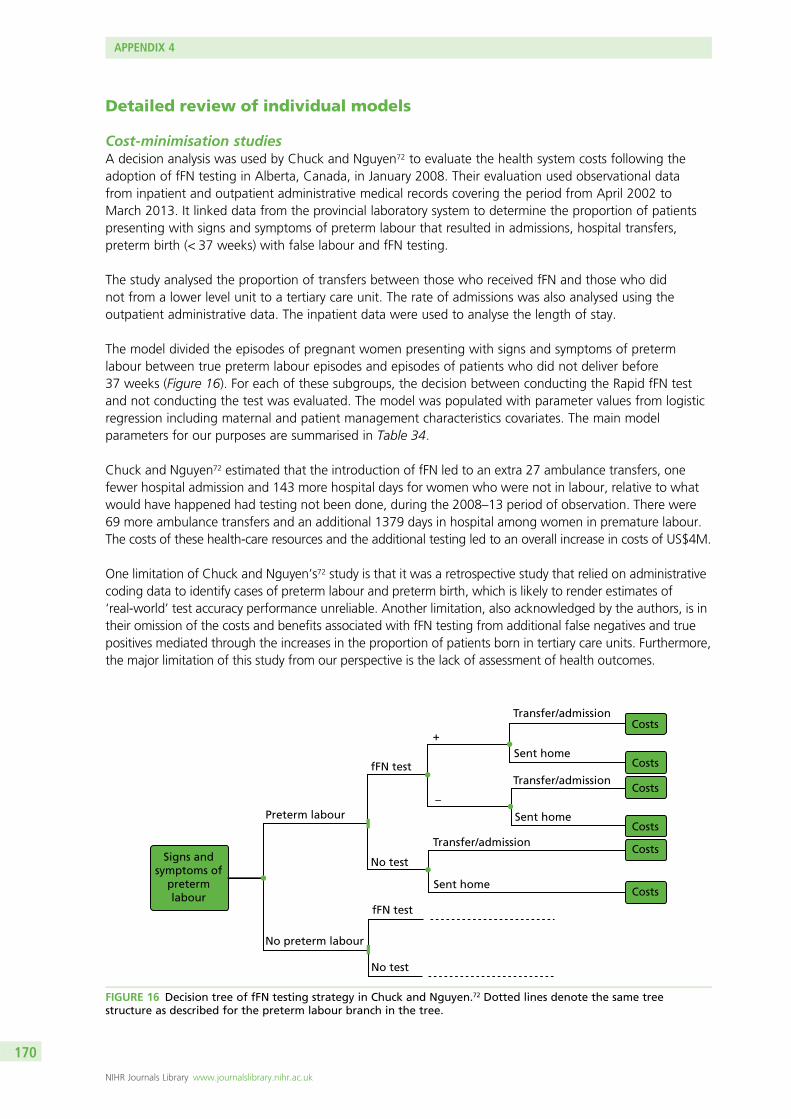
Detailed review of individual models
Cost-minimisation studiesA decision analysis was used by Chuck and Nguyen72 to evaluate the health system costs following theadoption of fFN testing in Alberta, Canada, in January 2008. Their evaluation used observational datafrom inpatient and outpatient administrative medical records covering the period from April 2002 toMarch 2013. It linked data from the provincial laboratory system to determine the proportion of patientspresenting with signs and symptoms of preterm labour that resulted in admissions, hospital transfers,preterm birth (< 37 weeks) with false labour and fFN testing.
The study analysed the proportion of transfers between those who received fFN and those who didnot from a lower level unit to a tertiary care unit. The rate of admissions was also analysed using theoutpatient administrative data. The inpatient data were used to analyse the length of stay.
The model divided the episodes of pregnant women presenting with signs and symptoms of pretermlabour between true preterm labour episodes and episodes of patients who did not deliver before37 weeks (Figure 16). For each of these subgroups, the decision between conducting the Rapid fFN testand not conducting the test was evaluated. The model was populated with parameter values from logisticregression including maternal and patient management characteristics covariates. The main modelparameters for our purposes are summarised in Table 34.
Chuck and Nguyen72 estimated that the introduction of fFN led to an extra 27 ambulance transfers, onefewer hospital admission and 143 more hospital days for women who were not in labour, relative to whatwould have happened had testing not been done, during the 2008–13 period of observation. There were69 more ambulance transfers and an additional 1379 days in hospital among women in premature labour.The costs of these health-care resources and the additional testing led to an overall increase in costs of US$4M.
One limitation of Chuck and Nguyen’s72 study is that it was a retrospective study that relied on administrativecoding data to identify cases of preterm labour and preterm birth, which is likely to render estimates of‘real-world’ test accuracy performance unreliable. Another limitation, also acknowledged by the authors, is intheir omission of the costs and benefits associated with fFN testing from additional false negatives and truepositives mediated through the increases in the proportion of patients born in tertiary care units. Furthermore,the major limitation of this study from our perspective is the lack of assessment of health outcomes.
Signs andsymptoms of
pretermlabour
Preterm labour
fFN test
fFN test
+
Transfer/admission
Sent home
Sent home
Sent home
Transfer/admission
Transfer/admission
No test
No test
–
No preterm labour
Costs
Costs
Costs
Costs
Costs
Costs
FIGURE 16 Decision tree of fFN testing strategy in Chuck and Nguyen.72 Dotted lines denote the same treestructure as described for the preterm labour branch in the tree.
APPENDIX 4
NIHR Journals Library www.journalslibrary.nihr.ac.uk
170
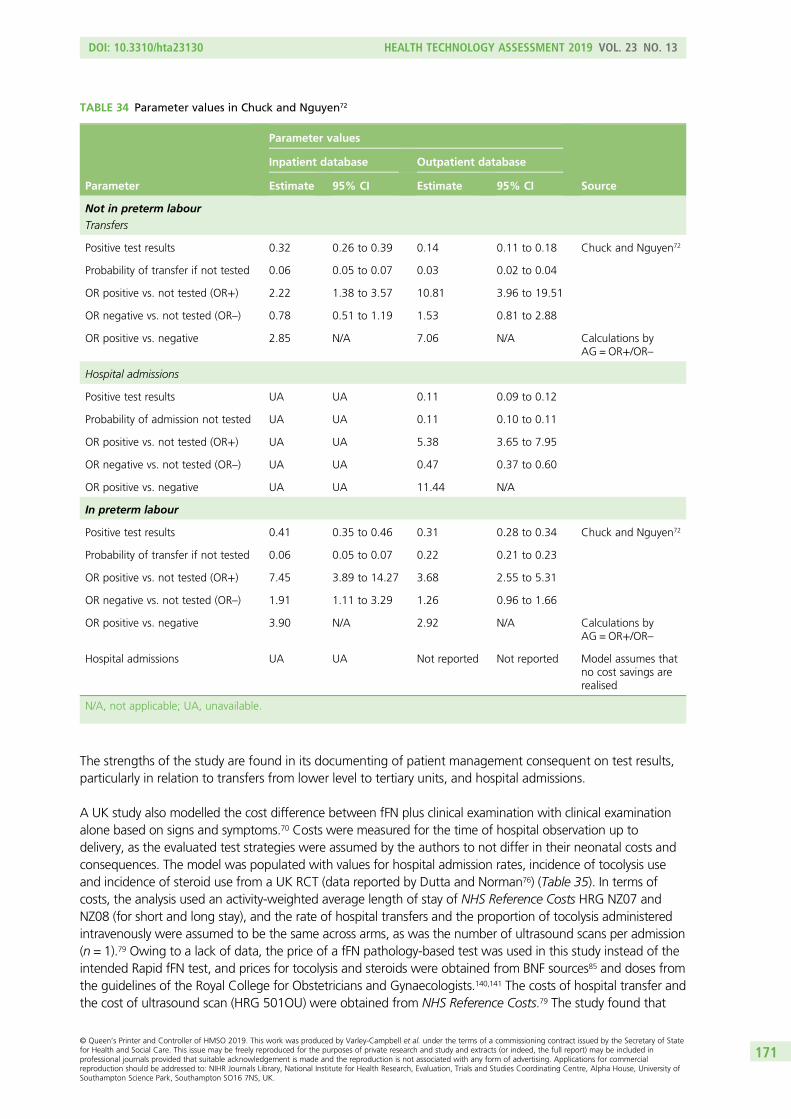
The strengths of the study are found in its documenting of patient management consequent on test results,particularly in relation to transfers from lower level to tertiary units, and hospital admissions.
A UK study also modelled the cost difference between fFN plus clinical examination with clinical examinationalone based on signs and symptoms.70 Costs were measured for the time of hospital observation up todelivery, as the evaluated test strategies were assumed by the authors to not differ in their neonatal costs andconsequences. The model was populated with values for hospital admission rates, incidence of tocolysis useand incidence of steroid use from a UK RCT (data reported by Dutta and Norman76) (Table 35). In terms ofcosts, the analysis used an activity-weighted average length of stay of NHS Reference Costs HRG NZ07 andNZ08 (for short and long stay), and the rate of hospital transfers and the proportion of tocolysis administeredintravenously were assumed to be the same across arms, as was the number of ultrasound scans per admission(n = 1).79 Owing to a lack of data, the price of a fFN pathology-based test was used in this study instead of theintended Rapid fFN test, and prices for tocolysis and steroids were obtained from BNF sources85 and doses fromthe guidelines of the Royal College for Obstetricians and Gynaecologists.140,141 The costs of hospital transfer andthe cost of ultrasound scan (HRG 501OU) were obtained from NHS Reference Costs.79 The study found that
TABLE 34 Parameter values in Chuck and Nguyen72
Parameter
Parameter values
Source
Inpatient database Outpatient database
Estimate 95% CI Estimate 95% CI
Not in preterm labour
Transfers
Positive test results 0.32 0.26 to 0.39 0.14 0.11 to 0.18 Chuck and Nguyen72
Probability of transfer if not tested 0.06 0.05 to 0.07 0.03 0.02 to 0.04
OR positive vs. not tested (OR+) 2.22 1.38 to 3.57 10.81 3.96 to 19.51
OR negative vs. not tested (OR–) 0.78 0.51 to 1.19 1.53 0.81 to 2.88
OR positive vs. negative 2.85 N/A 7.06 N/A Calculations byAG = OR+/OR–
Hospital admissions
Positive test results UA UA 0.11 0.09 to 0.12
Probability of admission not tested UA UA 0.11 0.10 to 0.11
OR positive vs. not tested (OR+) UA UA 5.38 3.65 to 7.95
OR negative vs. not tested (OR–) UA UA 0.47 0.37 to 0.60
OR positive vs. negative UA UA 11.44 N/A
In preterm labour
Positive test results 0.41 0.35 to 0.46 0.31 0.28 to 0.34 Chuck and Nguyen72
Probability of transfer if not tested 0.06 0.05 to 0.07 0.22 0.21 to 0.23
OR positive vs. not tested (OR+) 7.45 3.89 to 14.27 3.68 2.55 to 5.31
OR negative vs. not tested (OR–) 1.91 1.11 to 3.29 1.26 0.96 to 1.66
OR positive vs. negative 3.90 N/A 2.92 N/A Calculations byAG = OR+/OR–
Hospital admissions UA UA Not reported Not reported Model assumes thatno cost savings arerealised
N/A, not applicable; UA, unavailable.
DOI: 10.3310/hta23130 HEALTH TECHNOLOGY ASSESSMENT 2019 VOL. 23 NO. 13
© Queen’s Printer and Controller of HMSO 2019. This work was produced by Varley-Campbell et al. under the terms of a commissioning contract issued by the Secretary of Statefor Health and Social Care. This issue may be freely reproduced for the purposes of private research and study and extracts (or indeed, the full report) may be included inprofessional journals provided that suitable acknowledgement is made and the reproduction is not associated with any form of advertising. Applications for commercialreproduction should be addressed to: NIHR Journals Library, National Institute for Health Research, Evaluation, Trials and Studies Coordinating Centre, Alpha House, University ofSouthampton Science Park, Southampton SO16 7NS, UK.
171
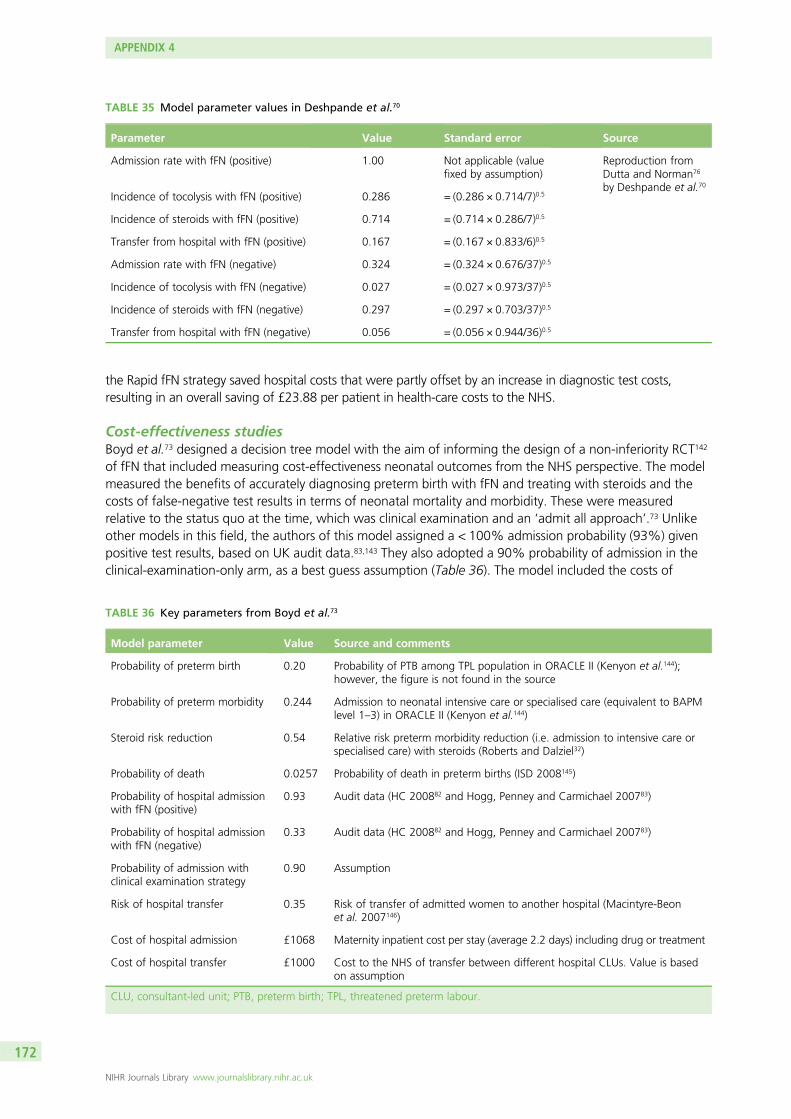
the Rapid fFN strategy saved hospital costs that were partly offset by an increase in diagnostic test costs,resulting in an overall saving of £23.88 per patient in health-care costs to the NHS.
Cost-effectiveness studiesBoyd et al.73 designed a decision tree model with the aim of informing the design of a non-inferiority RCT142
of fFN that included measuring cost-effectiveness neonatal outcomes from the NHS perspective. The modelmeasured the benefits of accurately diagnosing preterm birth with fFN and treating with steroids and thecosts of false-negative test results in terms of neonatal mortality and morbidity. These were measuredrelative to the status quo at the time, which was clinical examination and an ‘admit all approach’.73 Unlikeother models in this field, the authors of this model assigned a < 100% admission probability (93%) givenpositive test results, based on UK audit data.83,143 They also adopted a 90% probability of admission in theclinical-examination-only arm, as a best guess assumption (Table 36). The model included the costs of
TABLE 35 Model parameter values in Deshpande et al.70
Parameter Value Standard error Source
Admission rate with fFN (positive) 1.00 Not applicable (valuefixed by assumption)
Reproduction fromDutta and Norman76
by Deshpande et al.70Incidence of tocolysis with fFN (positive) 0.286 = (0.286 × 0.714/7)0.5
Incidence of steroids with fFN (positive) 0.714 = (0.714 × 0.286/7)0.5
Transfer from hospital with fFN (positive) 0.167 = (0.167 × 0.833/6)0.5
Admission rate with fFN (negative) 0.324 = (0.324 × 0.676/37)0.5
Incidence of tocolysis with fFN (negative) 0.027 = (0.027 × 0.973/37)0.5
Incidence of steroids with fFN (negative) 0.297 = (0.297 × 0.703/37)0.5
Transfer from hospital with fFN (negative) 0.056 = (0.056 × 0.944/36)0.5
TABLE 36 Key parameters from Boyd et al.73
Model parameter Value Source and comments
Probability of preterm birth 0.20 Probability of PTB among TPL population in ORACLE II (Kenyon et al.144);however, the figure is not found in the source
Probability of preterm morbidity 0.244 Admission to neonatal intensive care or specialised care (equivalent to BAPMlevel 1–3) in ORACLE II (Kenyon et al.144)
Steroid risk reduction 0.54 Relative risk preterm morbidity reduction (i.e. admission to intensive care orspecialised care) with steroids (Roberts and Dalziel32)
Probability of death 0.0257 Probability of death in preterm births (ISD 2008145)
Probability of hospital admissionwith fFN (positive)
0.93 Audit data (HC 200882 and Hogg, Penney and Carmichael 200783)
Probability of hospital admissionwith fFN (negative)
0.33 Audit data (HC 200882 and Hogg, Penney and Carmichael 200783)
Probability of admission withclinical examination strategy
0.90 Assumption
Risk of hospital transfer 0.35 Risk of transfer of admitted women to another hospital (Macintyre-Beonet al. 2007146)
Cost of hospital admission £1068 Maternity inpatient cost per stay (average 2.2 days) including drug or treatment
Cost of hospital transfer £1000 Cost to the NHS of transfer between different hospital CLUs. Value is basedon assumption
CLU, consultant-led unit; PTB, preterm birth; TPL, threatened preterm labour.
APPENDIX 4
NIHR Journals Library www.journalslibrary.nihr.ac.uk
172
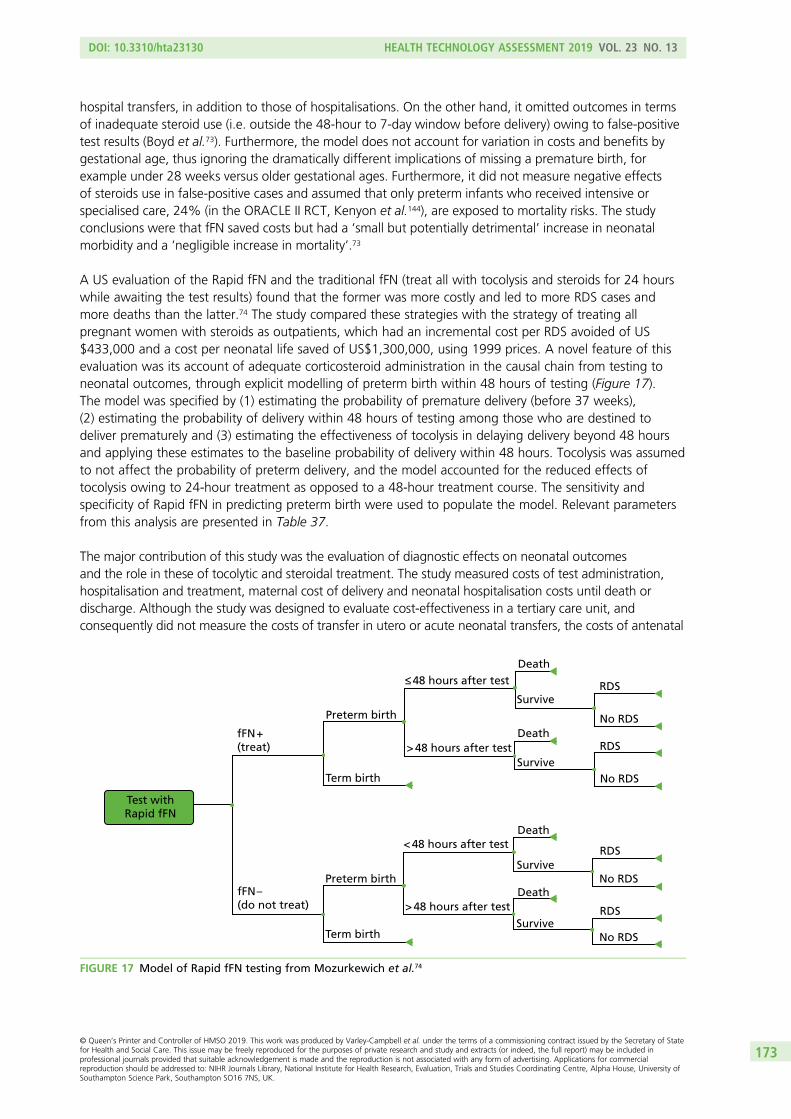
hospital transfers, in addition to those of hospitalisations. On the other hand, it omitted outcomes in termsof inadequate steroid use (i.e. outside the 48-hour to 7-day window before delivery) owing to false-positivetest results (Boyd et al.73). Furthermore, the model does not account for variation in costs and benefits bygestational age, thus ignoring the dramatically different implications of missing a premature birth, forexample under 28 weeks versus older gestational ages. Furthermore, it did not measure negative effectsof steroids use in false-positive cases and assumed that only preterm infants who received intensive orspecialised care, 24% (in the ORACLE II RCT, Kenyon et al.144), are exposed to mortality risks. The studyconclusions were that fFN saved costs but had a ‘small but potentially detrimental’ increase in neonatalmorbidity and a ‘negligible increase in mortality’.73
A US evaluation of the Rapid fFN and the traditional fFN (treat all with tocolysis and steroids for 24 hourswhile awaiting the test results) found that the former was more costly and led to more RDS cases andmore deaths than the latter.74 The study compared these strategies with the strategy of treating allpregnant women with steroids as outpatients, which had an incremental cost per RDS avoided of US$433,000 and a cost per neonatal life saved of US$1,300,000, using 1999 prices. A novel feature of thisevaluation was its account of adequate corticosteroid administration in the causal chain from testing toneonatal outcomes, through explicit modelling of preterm birth within 48 hours of testing (Figure 17).The model was specified by (1) estimating the probability of premature delivery (before 37 weeks),(2) estimating the probability of delivery within 48 hours of testing among those who are destined todeliver prematurely and (3) estimating the effectiveness of tocolysis in delaying delivery beyond 48 hoursand applying these estimates to the baseline probability of delivery within 48 hours. Tocolysis was assumedto not affect the probability of preterm delivery, and the model accounted for the reduced effects oftocolysis owing to 24-hour treatment as opposed to a 48-hour treatment course. The sensitivity andspecificity of Rapid fFN in predicting preterm birth were used to populate the model. Relevant parametersfrom this analysis are presented in Table 37.
The major contribution of this study was the evaluation of diagnostic effects on neonatal outcomesand the role in these of tocolytic and steroidal treatment. The study measured costs of test administration,hospitalisation and treatment, maternal cost of delivery and neonatal hospitalisation costs until death ordischarge. Although the study was designed to evaluate cost-effectiveness in a tertiary care unit, andconsequently did not measure the costs of transfer in utero or acute neonatal transfers, the costs of antenatal
Death≤ 48 hours after test
< 48 hours after test
> 48 hours after test
> 48 hours after test
RDSSurvive
No RDS
Death
RDSSurvive
No RDSDeath
RDSSurvive
No RDS
DeathRDS
SurviveNo RDS
Preterm birth
Term birth
fFN +(treat)
fFN –(do not treat)
Preterm birth
Term birth
Test withRapid fFN
FIGURE 17 Model of Rapid fFN testing from Mozurkewich et al.74
DOI: 10.3310/hta23130 HEALTH TECHNOLOGY ASSESSMENT 2019 VOL. 23 NO. 13
© Queen’s Printer and Controller of HMSO 2019. This work was produced by Varley-Campbell et al. under the terms of a commissioning contract issued by the Secretary of Statefor Health and Social Care. This issue may be freely reproduced for the purposes of private research and study and extracts (or indeed, the full report) may be included inprofessional journals provided that suitable acknowledgement is made and the reproduction is not associated with any form of advertising. Applications for commercialreproduction should be addressed to: NIHR Journals Library, National Institute for Health Research, Evaluation, Trials and Studies Coordinating Centre, Alpha House, University ofSouthampton Science Park, Southampton SO16 7NS, UK.
173
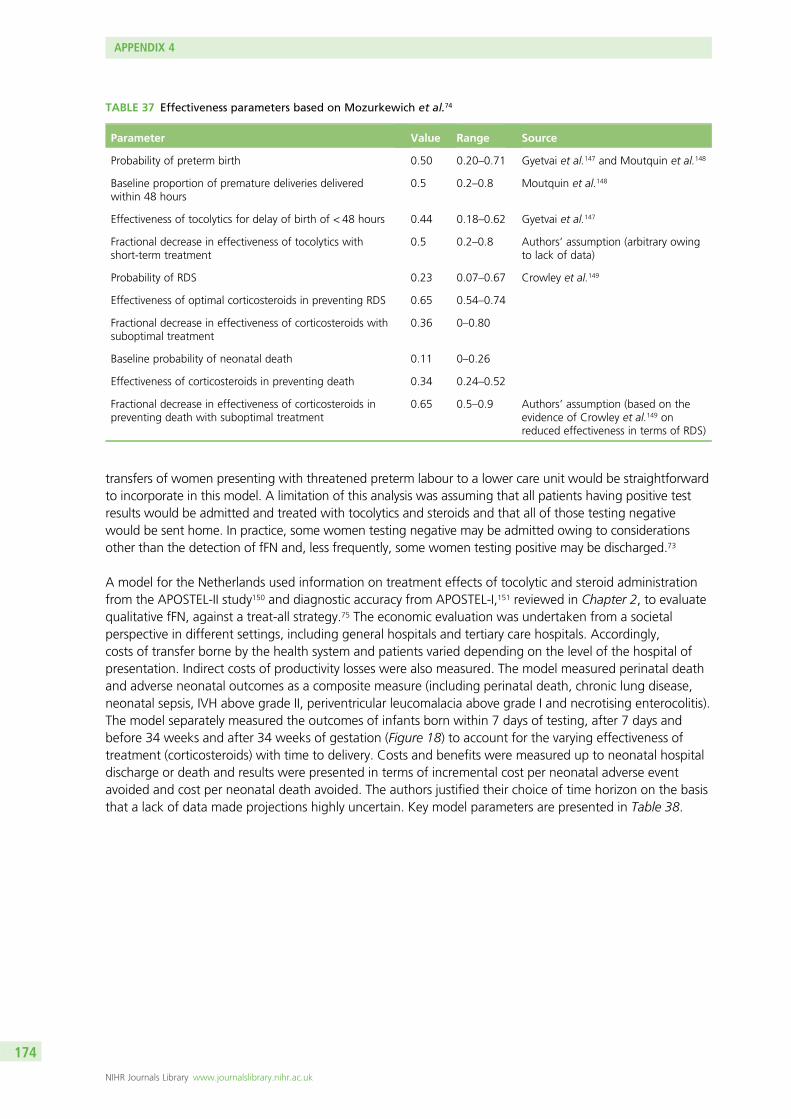
transfers of women presenting with threatened preterm labour to a lower care unit would be straightforwardto incorporate in this model. A limitation of this analysis was assuming that all patients having positive testresults would be admitted and treated with tocolytics and steroids and that all of those testing negativewould be sent home. In practice, some women testing negative may be admitted owing to considerationsother than the detection of fFN and, less frequently, some women testing positive may be discharged.73
A model for the Netherlands used information on treatment effects of tocolytic and steroid administrationfrom the APOSTEL-II study150 and diagnostic accuracy from APOSTEL-I,151 reviewed in Chapter 2, to evaluatequalitative fFN, against a treat-all strategy.75 The economic evaluation was undertaken from a societalperspective in different settings, including general hospitals and tertiary care hospitals. Accordingly,costs of transfer borne by the health system and patients varied depending on the level of the hospital ofpresentation. Indirect costs of productivity losses were also measured. The model measured perinatal deathand adverse neonatal outcomes as a composite measure (including perinatal death, chronic lung disease,neonatal sepsis, IVH above grade II, periventricular leucomalacia above grade I and necrotising enterocolitis).The model separately measured the outcomes of infants born within 7 days of testing, after 7 days andbefore 34 weeks and after 34 weeks of gestation (Figure 18) to account for the varying effectiveness oftreatment (corticosteroids) with time to delivery. Costs and benefits were measured up to neonatal hospitaldischarge or death and results were presented in terms of incremental cost per neonatal adverse eventavoided and cost per neonatal death avoided. The authors justified their choice of time horizon on the basisthat a lack of data made projections highly uncertain. Key model parameters are presented in Table 38.
TABLE 37 Effectiveness parameters based on Mozurkewich et al.74
Parameter Value Range Source
Probability of preterm birth 0.50 0.20–0.71 Gyetvai et al.147 and Moutquin et al.148
Baseline proportion of premature deliveries deliveredwithin 48 hours
0.5 0.2–0.8 Moutquin et al.148
Effectiveness of tocolytics for delay of birth of < 48 hours 0.44 0.18–0.62 Gyetvai et al.147
Fractional decrease in effectiveness of tocolytics withshort-term treatment
0.5 0.2–0.8 Authors’ assumption (arbitrary owingto lack of data)
Probability of RDS 0.23 0.07–0.67 Crowley et al.149
Effectiveness of optimal corticosteroids in preventing RDS 0.65 0.54–0.74
Fractional decrease in effectiveness of corticosteroids withsuboptimal treatment
0.36 0–0.80
Baseline probability of neonatal death 0.11 0–0.26
Effectiveness of corticosteroids in preventing death 0.34 0.24–0.52
Fractional decrease in effectiveness of corticosteroids inpreventing death with suboptimal treatment
0.65 0.5–0.9 Authors’ assumption (based on theevidence of Crowley et al.149 onreduced effectiveness in terms of RDS)
APPENDIX 4
NIHR Journals Library www.journalslibrary.nihr.ac.uk
174
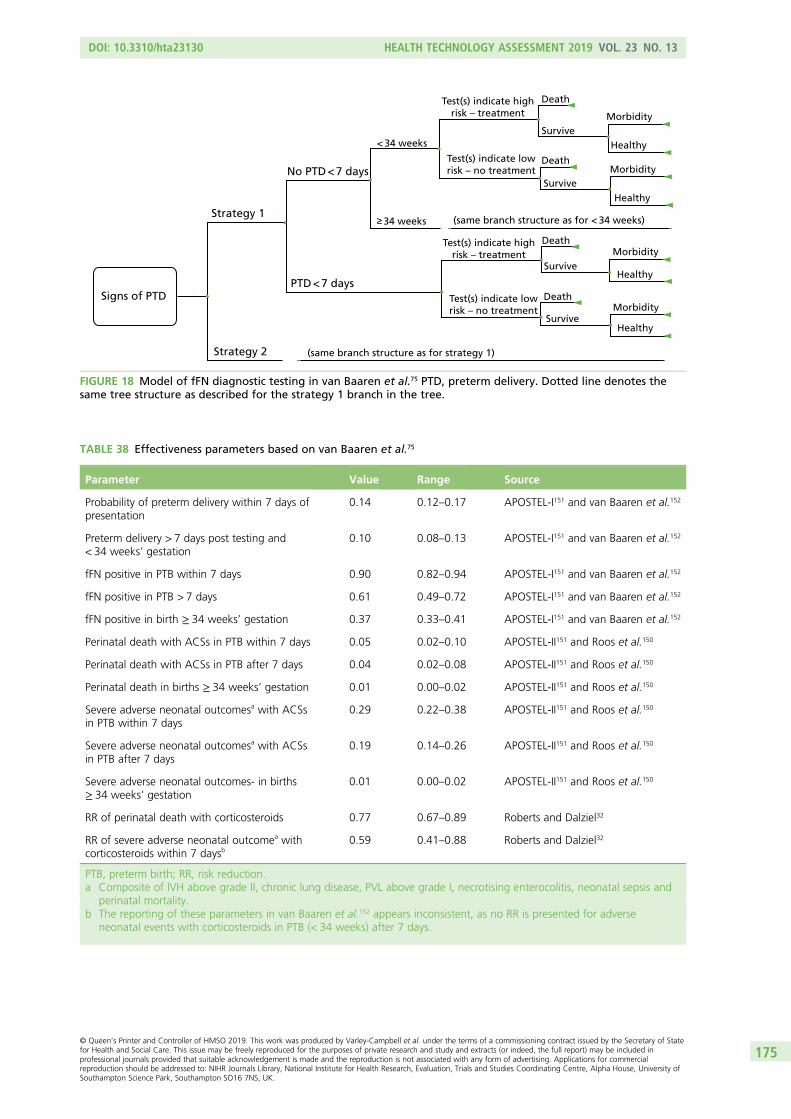
Signs of PTD
Strategy 1
Strategy 2
No PTD < 7 days
PTD < 7 days
< 34 weeks
≥ 34 weeks
Test(s) indicate highrisk – treatment
Test(s) indicate highrisk – treatment
Test(s) indicate lowrisk – no treatment
Test(s) indicate lowrisk – no treatment
Death
Death
Survive
Survive
Death
Survive
Death
Survive
Morbidity
Healthy
Morbidity
Healthy
Morbidity
Healthy
Morbidity
Healthy
(same branch structure as for < 34 weeks)
(same branch structure as for strategy 1)
FIGURE 18 Model of fFN diagnostic testing in van Baaren et al.75 PTD, preterm delivery. Dotted line denotes thesame tree structure as described for the strategy 1 branch in the tree.
TABLE 38 Effectiveness parameters based on van Baaren et al.75
Parameter Value Range Source
Probability of preterm delivery within 7 days ofpresentation
0.14 0.12–0.17 APOSTEL-I151 and van Baaren et al.152
Preterm delivery > 7 days post testing and< 34 weeks’ gestation
0.10 0.08–0.13 APOSTEL-I151 and van Baaren et al.152
fFN positive in PTB within 7 days 0.90 0.82–0.94 APOSTEL-I151 and van Baaren et al.152
fFN positive in PTB > 7 days 0.61 0.49–0.72 APOSTEL-I151 and van Baaren et al.152
fFN positive in birth ≥ 34 weeks’ gestation 0.37 0.33–0.41 APOSTEL-I151 and van Baaren et al.152
Perinatal death with ACSs in PTB within 7 days 0.05 0.02–0.10 APOSTEL-II151 and Roos et al.150
Perinatal death with ACSs in PTB after 7 days 0.04 0.02–0.08 APOSTEL-II151 and Roos et al.150
Perinatal death in births ≥ 34 weeks’ gestation 0.01 0.00–0.02 APOSTEL-II151 and Roos et al.150
Severe adverse neonatal outcomesa with ACSsin PTB within 7 days
0.29 0.22–0.38 APOSTEL-II151 and Roos et al.150
Severe adverse neonatal outcomesa with ACSsin PTB after 7 days
0.19 0.14–0.26 APOSTEL-II151 and Roos et al.150
Severe adverse neonatal outcomes- in births≥ 34 weeks’ gestation
0.01 0.00–0.02 APOSTEL-II151 and Roos et al.150
RR of perinatal death with corticosteroids 0.77 0.67–0.89 Roberts and Dalziel32
RR of severe adverse neonatal outcomea withcorticosteroids within 7 daysb
0.59 0.41–0.88 Roberts and Dalziel32
PTB, preterm birth; RR, risk reduction.a Composite of IVH above grade II, chronic lung disease, PVL above grade I, necrotising enterocolitis, neonatal sepsis and
perinatal mortality.b The reporting of these parameters in van Baaren et al.152 appears inconsistent, as no RR is presented for adverse
neonatal events with corticosteroids in PTB (< 34 weeks) after 7 days.
DOI: 10.3310/hta23130 HEALTH TECHNOLOGY ASSESSMENT 2019 VOL. 23 NO. 13
© Queen’s Printer and Controller of HMSO 2019. This work was produced by Varley-Campbell et al. under the terms of a commissioning contract issued by the Secretary of Statefor Health and Social Care. This issue may be freely reproduced for the purposes of private research and study and extracts (or indeed, the full report) may be included inprofessional journals provided that suitable acknowledgement is made and the reproduction is not associated with any form of advertising. Applications for commercialreproduction should be addressed to: NIHR Journals Library, National Institute for Health Research, Evaluation, Trials and Studies Coordinating Centre, Alpha House, University ofSouthampton Science Park, Southampton SO16 7NS, UK.
175

Appendix 5 Supplementary discussion and tablesfor the systematic review and selection of utilities
Quality-of-life outcomes for preterm children
Studies concerning the quality-of-life outcomes of preterm children are summarised in Table 39. Of the24 papers shortlisted, seven were deemed as lower priority, because they either use non-standard measuresof quality of life or do not report their quality-of-life figures in a usable format. One study does not reportSF-36 mean scores apart from in the form of a graph.153 A second study measures but does not report anySF-36 scores.103 Four studies use quality-of-life measures that do not have mapping functions that allow forconversion to utilities.102,154–156 Finally, another study measures utilities for 140 15- to 16-year-olds that had agestational age pf < 29 weeks using the Health Utilities Index version 3 (HUI3);157 however, this was only anabstract, and it did not report any values.
Of the remaining 17 papers (authors marked as bold in Table 39),103,110,114,161–167,170–175 12 provide directmeasures of utility.110,161,164–167,170–175 Seven of these studies use a version of the HUI.158–164 One of thesestudies is a systematic review of quality of life and also reports utilities drawn from other sources.161
Three studies from Finland use the 17D measure.165–167 Five studies reported means and SDs for the SF-36measure of health-related quality of life.111–113,168,169 The remaining two studies are modelling papers thatmake use of utilities drawn from other sources.109,170
Many studies in Table 39 that were model based cited sources for the utilities they used. These sourcepapers were collated and are summarised in Table 40. The majority of these studies used either the HUI2domains, which had been converted into a utility using a multiattribute health status utility function,171
or a direct utility measure based on standard gamble. The study by Carroll and Downs108 and some of thestudies reported in Tengs and Wallace172 also used time trade-off methods of utility elicitation.
Quality-of-life outcomes for mothers
Studies concerning the quality-of-life outcomes for mothers are summarised in Table 41. Of these fourstudies, one was not used because its measure of quality of life cannot be mapped into a utility value.105
The remaining three studies report summary scores for the SF-36.104,106,173
DOI: 10.3310/hta23130 HEALTH TECHNOLOGY ASSESSMENT 2019 VOL. 23 NO. 13
© Queen’s Printer and Controller of HMSO 2019. This work was produced by Varley-Campbell et al. under the terms of a commissioning contract issued by the Secretary of Statefor Health and Social Care. This issue may be freely reproduced for the purposes of private research and study and extracts (or indeed, the full report) may be included inprofessional journals provided that suitable acknowledgement is made and the reproduction is not associated with any form of advertising. Applications for commercialreproduction should be addressed to: NIHR Journals Library, National Institute for Health Research, Evaluation, Trials and Studies Coordinating Centre, Alpha House, University ofSouthampton Science Park, Southampton SO16 7NS, UK.
177
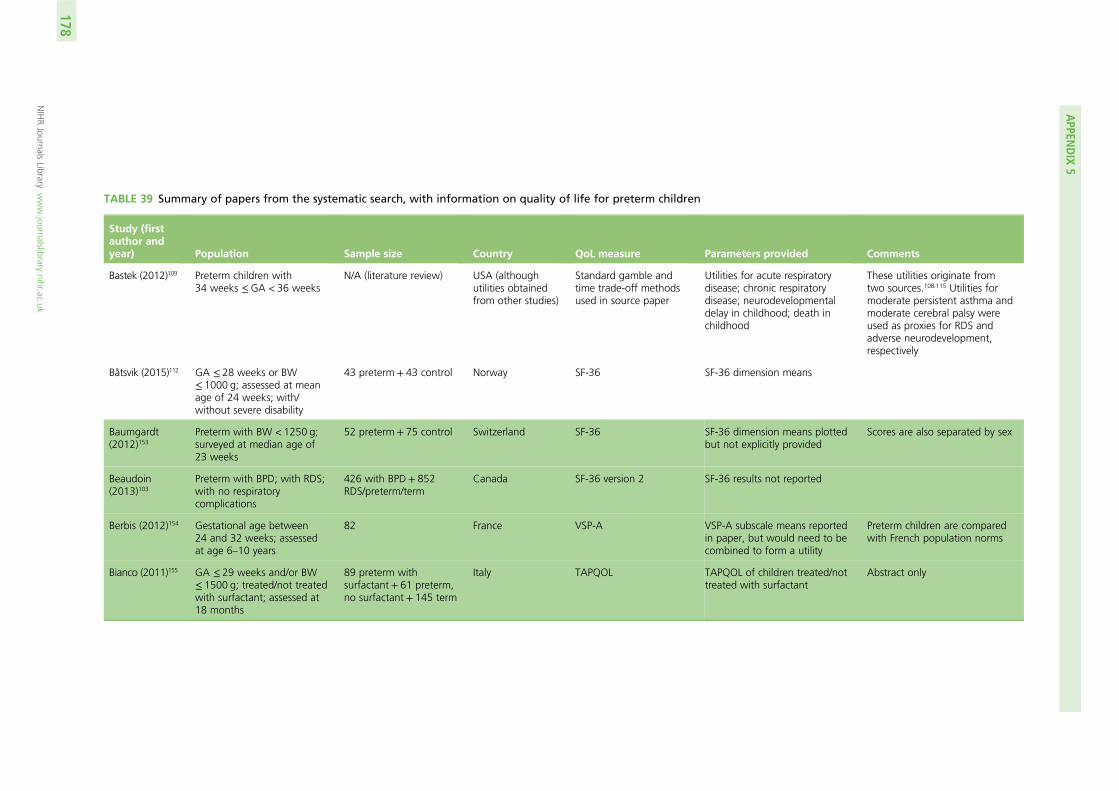
TABLE 39 Summary of papers from the systematic search, with information on quality of life for preterm children
Study (firstauthor andyear) Population Sample size Country QoL measure Parameters provided Comments
Bastek (2012)109 Preterm children with34 weeks ≤GA < 36 weeks
N/A (literature review) USA (althoughutilities obtainedfrom other studies)
Standard gamble andtime trade-off methodsused in source paper
Utilities for acute respiratorydisease; chronic respiratorydisease; neurodevelopmentaldelay in childhood; death inchildhood
These utilities originate fromtwo sources.108,115 Utilities formoderate persistent asthma andmoderate cerebral palsy wereused as proxies for RDS andadverse neurodevelopment,respectively
Båtsvik (2015)112 GA ≤ 28 weeks or BW≤ 1000 g; assessed at meanage of 24 weeks; with/without severe disability
43 preterm + 43 control Norway SF-36 SF-36 dimension means
Baumgardt(2012)153
Preterm with BW < 1250 g;surveyed at median age of23 weeks
52 preterm + 75 control Switzerland SF-36 SF-36 dimension means plottedbut not explicitly provided
Scores are also separated by sex
Beaudoin(2013)103
Preterm with BPD; with RDS;with no respiratorycomplications
426 with BPD+ 852RDS/preterm/term
Canada SF-36 version 2 SF-36 results not reported
Berbis (2012)154 Gestational age between24 and 32 weeks; assessedat age 6–10 years
82 France VSP-A VSP-A subscale means reportedin paper, but would need to becombined to form a utility
Preterm children are comparedwith French population norms
Bianco (2011)155 GA ≤ 29 weeks and/or BW≤ 1500 g; treated/not treatedwith surfactant; assessed at18 months
89 preterm withsurfactant+ 61 preterm,no surfactant + 145 term
Italy TAPQOL TAPQOL of children treated/nottreated with surfactant
Abstract only
APPEN
DIX
5
NIHRJournals
Librarywww.journalslibrary.nihr.ac.uk
178

Study (firstauthor andyear) Population Sample size Country QoL measure Parameters provided Comments
Cooke (2004)111 Preterm VLBW infants,assessed at age 19–22 years(mean 20)
79 preterm + 71 term UK SF-36 SF-36 dimension meansreported for both males andfemales
The paper also reports additionalinformation on social/behaviouraloutcomes, depression andphysical size
Dalziel et al.(2007)168
Preterm and term children,assessed at age 31 years
126 preterm+ 66 term New Zealand SF-36 SF-36 dimension means
Einerson(2016)170
N/A – paper presents acost-effectiveness model forcervical length screening
N/A – see source paperinformation in Table 40
USA (althoughutilities obtainedfrom other studies)
Standard gamble andtime trade-off methodsused in source papers
Utilities for neonatal death;severe neonatal morbidity;healthy neonate
Utilities for death andmorbidity obtained from threesources.115,172,174 It is not clearexactly which figures have beenused, or how they may havebeen combined
Feingold(2002)102
BW < 1501 g and GA< 33 weeks, assessedat age 18–19 years
43 IVH 0–2, nocysts+ 10 IVH 3–4and/or cysts
USA HRQoL from CDC Means of four dimensions ofHRQoL reported, separated intotwo IVH severity level groups(0–2, no PVL; and 3–4, with/without PVL)
Unclear how to derive utilitiesfrom the HRQoL means
Gray (2007)157 GA < 29 weeks, assessed atage 15–16 years
140 preterm+ 108control
UK HUI3 No figures provided Abstract only – relativedifferences are reported but notabsolute utilities
Husby (2016)169 Preterm with BW ≤ 1500 g,assessed at age 23 years
35 preterm + 37 control Norway SF-36 SF-36 dimension meansprovided for those VLBWchildren without cerebral palsyor low IQs, as well as thosewith one or more of the above
Additional results find lower riskof alcohol abuse, 5 times higherlikelihood of depression, andpoorer motor skills
Ketharanathan(2011)156
32 weeks ≤GA < 36 weeks,assessed at preschool age(2–5 years)
218 responders The Netherlands TAPQOL TAPQOL dimension meansare provided
Unclear how to derive utilitiesfrom the TAPQOL means. Studyalso reports prevalence of variousbehavioural problems
continued
DOI:10.3310/hta23130
HEA
LTHTECH
NOLO
GYASSESSM
ENT2019
VOL.23
NO.13
©Queen
’sPrinter
andController
ofHMSO
2019.This
work
was
producedby
Varley-C
ampbellet
al.under
theterm
sof
acom
missioning
contractissued
bythe
Secretaryof
Statefor
Health
andSocialC
are.This
issuemay
befreely
reproducedfor
thepurposes
ofprivate
researchand
studyand
extracts(or
indeed,the
fullreport)may
beincluded
inprofessionaljournals
providedthat
suitableacknow
ledgement
ismade
andthe
reproductionisnot
associatedwith
anyform
ofadvertising.
Applications
forcom
mercial
reproductionshould
beaddressed
to:NIHRJournals
Library,NationalInstitute
forHealth
Research,Evaluation,
Trialsand
StudiesCoordinating
Centre,
Alpha
House,
University
ofSoutham
ptonScience
Park,Southam
ptonSO
167N
S,UK.
179
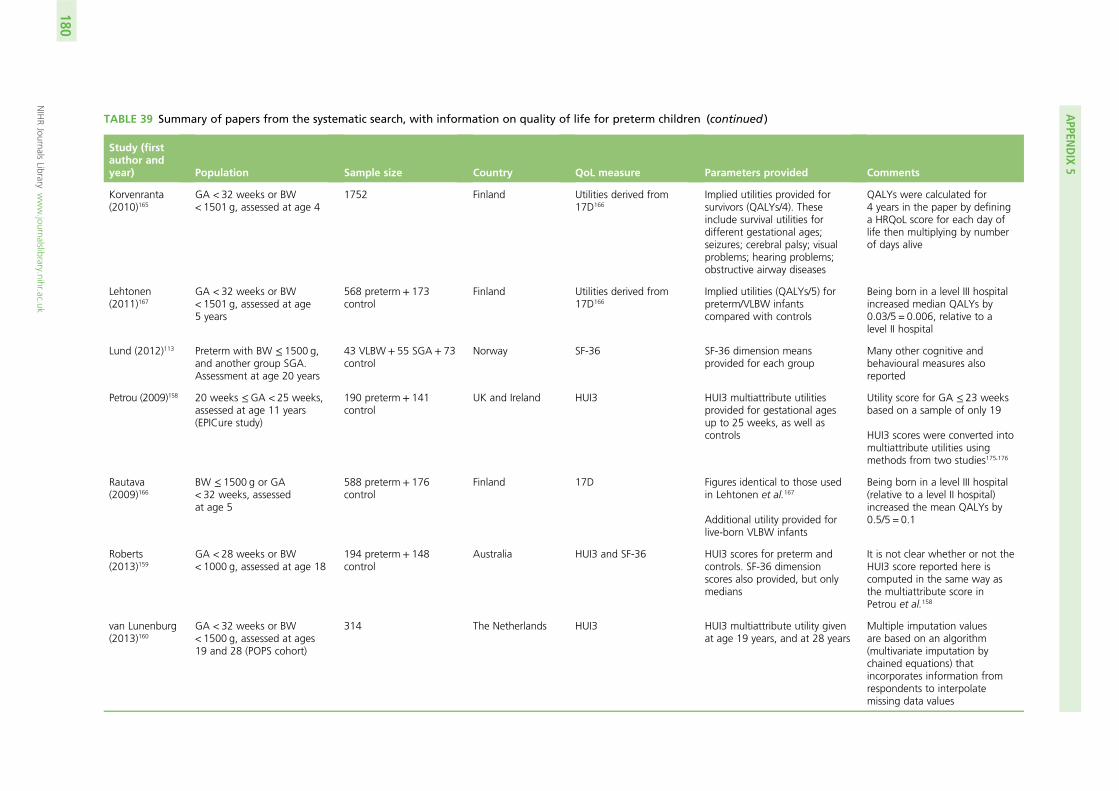
TABLE 39 Summary of papers from the systematic search, with information on quality of life for preterm children (continued )
Study (firstauthor andyear) Population Sample size Country QoL measure Parameters provided Comments
Korvenranta(2010)165
GA < 32 weeks or BW< 1501 g, assessed at age 4
1752 Finland Utilities derived from17D166
Implied utilities provided forsurvivors (QALYs/4). Theseinclude survival utilities fordifferent gestational ages;seizures; cerebral palsy; visualproblems; hearing problems;obstructive airway diseases
QALYs were calculated for4 years in the paper by defininga HRQoL score for each day oflife then multiplying by numberof days alive
Lehtonen(2011)167
GA < 32 weeks or BW< 1501 g, assessed at age5 years
568 preterm+ 173control
Finland Utilities derived from17D166
Implied utilities (QALYs/5) forpreterm/VLBW infantscompared with controls
Being born in a level III hospitalincreased median QALYs by0.03/5 = 0.006, relative to alevel II hospital
Lund (2012)113 Preterm with BW ≤ 1500 g,and another group SGA.Assessment at age 20 years
43 VLBW+ 55 SGA+ 73control
Norway SF-36 SF-36 dimension meansprovided for each group
Many other cognitive andbehavioural measures alsoreported
Petrou (2009)158 20 weeks ≤GA < 25 weeks,assessed at age 11 years(EPICure study)
190 preterm+ 141control
UK and Ireland HUI3 HUI3 multiattribute utilitiesprovided for gestational agesup to 25 weeks, as well ascontrols
Utility score for GA ≤ 23 weeksbased on a sample of only 19
HUI3 scores were converted intomultiattribute utilities usingmethods from two studies175,176
Rautava(2009)166
BW ≤ 1500 g or GA< 32 weeks, assessedat age 5
588 preterm+ 176control
Finland 17D Figures identical to those usedin Lehtonen et al.167
Additional utility provided forlive-born VLBW infants
Being born in a level III hospital(relative to a level II hospital)increased the mean QALYs by0.5/5 = 0.1
Roberts(2013)159
GA < 28 weeks or BW< 1000 g, assessed at age 18
194 preterm+ 148control
Australia HUI3 and SF-36 HUI3 scores for preterm andcontrols. SF-36 dimensionscores also provided, but onlymedians
It is not clear whether or not theHUI3 score reported here iscomputed in the same way asthe multiattribute score inPetrou et al.158
van Lunenburg(2013)160
GA < 32 weeks or BW< 1500 g, assessed at ages19 and 28 (POPS cohort)
314 The Netherlands HUI3 HUI3 multiattribute utility givenat age 19 years, and at 28 years
Multiple imputation valuesare based on an algorithm(multivariate imputation bychained equations) thatincorporates information fromrespondents to interpolatemissing data values
APPEN
DIX
5
NIHRJournals
Librarywww.journalslibrary.nihr.ac.uk
180
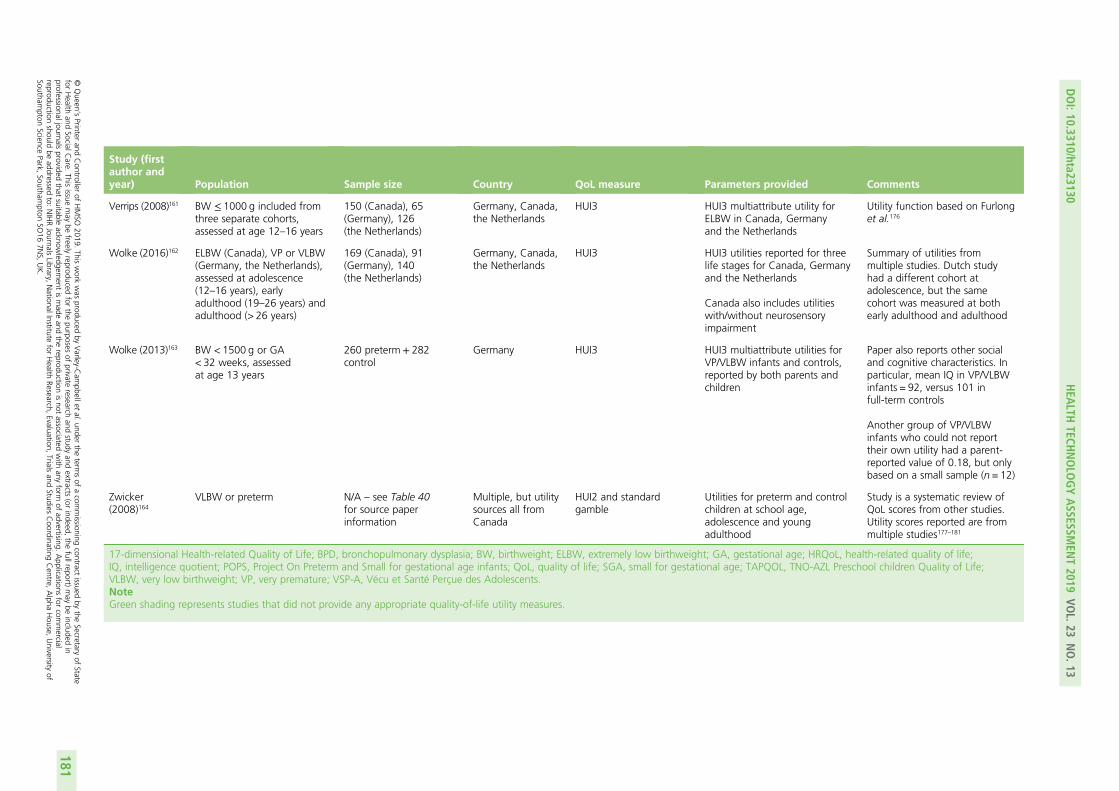
Study (firstauthor andyear) Population Sample size Country QoL measure Parameters provided Comments
Verrips (2008)161 BW ≤ 1000 g included fromthree separate cohorts,assessed at age 12–16 years
150 (Canada), 65(Germany), 126(the Netherlands)
Germany, Canada,the Netherlands
HUI3 HUI3 multiattribute utility forELBW in Canada, Germanyand the Netherlands
Utility function based on Furlonget al.176
Wolke (2016)162 ELBW (Canada), VP or VLBW(Germany, the Netherlands),assessed at adolescence(12–16 years), earlyadulthood (19–26 years) andadulthood (> 26 years)
169 (Canada), 91(Germany), 140(the Netherlands)
Germany, Canada,the Netherlands
HUI3 HUI3 utilities reported for threelife stages for Canada, Germanyand the Netherlands
Canada also includes utilitieswith/without neurosensoryimpairment
Summary of utilities frommultiple studies. Dutch studyhad a different cohort atadolescence, but the samecohort was measured at bothearly adulthood and adulthood
Wolke (2013)163 BW < 1500 g or GA< 32 weeks, assessedat age 13 years
260 preterm+ 282control
Germany HUI3 HUI3 multiattribute utilities forVP/VLBW infants and controls,reported by both parents andchildren
Paper also reports other socialand cognitive characteristics. Inparticular, mean IQ in VP/VLBWinfants = 92, versus 101 infull-term controls
Another group of VP/VLBWinfants who could not reporttheir own utility had a parent-reported value of 0.18, but onlybased on a small sample (n = 12)
Zwicker(2008)164
VLBW or preterm N/A – see Table 40for source paperinformation
Multiple, but utilitysources all fromCanada
HUI2 and standardgamble
Utilities for preterm and controlchildren at school age,adolescence and youngadulthood
Study is a systematic review ofQoL scores from other studies.Utility scores reported are frommultiple studies177–181
17-dimensional Health-related Quality of Life; BPD, bronchopulmonary dysplasia; BW, birthweight; ELBW, extremely low birthweight; GA, gestational age; HRQoL, health-related quality of life;IQ, intelligence quotient; POPS, Project On Preterm and Small for gestational age infants; QoL, quality of life; SGA, small for gestational age; TAPQOL, TNO-AZL Preschool children Quality of Life;VLBW, very low birthweight; VP, very premature; VSP-A, Vécu et Santé Perçue des Adolescents.NoteGreen shading represents studies that did not provide any appropriate quality-of-life utility measures.
DOI:10.3310/hta23130
HEA
LTHTECH
NOLO
GYASSESSM
ENT2019
VOL.23
NO.13
©Queen
’sPrinter
andController
ofHMSO
2019.This
work
was
producedby
Varley-C
ampbellet
al.under
theterm
sof
acom
missioning
contractissued
bythe
Secretaryof
Statefor
Health
andSocialC
are.This
issuemay
befreely
reproducedfor
thepurposes
ofprivate
researchand
studyand
extracts(or
indeed,the
fullreport)may
beincluded
inprofessionaljournals
providedthat
suitableacknow
ledgement
ismade
andthe
reproductionisnot
associatedwith
anyform
ofadvertising.
Applications
forcom
mercial
reproductionshould
beaddressed
to:NIHRJournals
Library,NationalInstitute
forHealth
Research,Evaluation,
Trialsand
StudiesCoordinating
Centre,
Alpha
House,
University
ofSoutham
ptonScience
Park,Southam
ptonSO
167N
S,UK.
181

TABLE 40 Secondary sources for utilities (referenced by papers found in the systematic search)
Study (first authorand year) Sample Country Utility measure Utilities reported Comments
Carroll (2009)108 4016 (> 18 years, had atleast 1 child)
USA Standard gamble and timetrade-off
Utilities for 30 medical statesprovided (including perfect health)
Implicitly uses Von Neumann–Morgensternexpected utility assumptions. Bothelicitation methods assume risk neutrality
Pham (2003)174 180 (90 postnatal,59 midwives, 31 medicalstaff)
Australia Standard gamble Perfect health; jaundice requiringphototherapy; admission to neonatalnursery; shoulder dystocia; nervepalsy; transient neurologicalsymptoms; permanent neurologicalsequelae; perinatal death
Health outcomes do not seem relevant tocurrent model. Mothers of prematurebabies were excluded from the study
Saigal (1994)177 156 ELBW + 145 controls Canada HUI2 transformed using a MAHSutility function
Utilities are provided for differentattribute score combinations on asix-dimension quality-of-life scale,for children at age 8 years
Originally excluded in full-text screening asit focused on low birthweight only
Utilities provided are for a combination ofsubjective health states, and do notcorrespond to any particular condition
Saigal (1994)178 156 ELBW + 145 controls Canada HUI2 transformed using a MAHSutility function
Study identifies unique health statesrequired to classify the ELBW andcontrol children, but does not reportutilities explicitly
This study appears to be supplemental tothe previous study in this table, ratherthan providing new utility data
Saigal (1996)179 141 ELBW + 145 controls Canada HUI2 (actual and for hypotheticalstates), standard gamble
Mean utilities for age 12–16 yearsreported, for own health states aswell as four hypothetical scenarios
Sensitivity analysis results also provided.Provides average utility for ELBW, but notfor specific medical conditions in isolation
Saigal (2000)180 149 (parents of ELBW) +126 (parents of controls)
Canada HUI2 (actual states), visualanalogue scale and standardgamble (hypothetical states)
Parental perspectives of child’s(12–16 years) utility, andperspectives for four hypotheticalscenarios
Originally excluded in full-text screening asit focused on low birthweight only. Datafor child’s impression exists, so parent’sassessment may be unnecessary
Saigal (2006)181 143 ELBW + 130 controls Canada Standard gamble (quality of life,and hypothetical states)
Utilities for young adults (≈23 years)with/without neurosensoryimpairments
Originally excluded in full-text screening asit focused on low birthweight only
Results of sensitivity analyses also provided
APPEN
DIX
5
NIHRJournals
Librarywww.journalslibrary.nihr.ac.uk
182
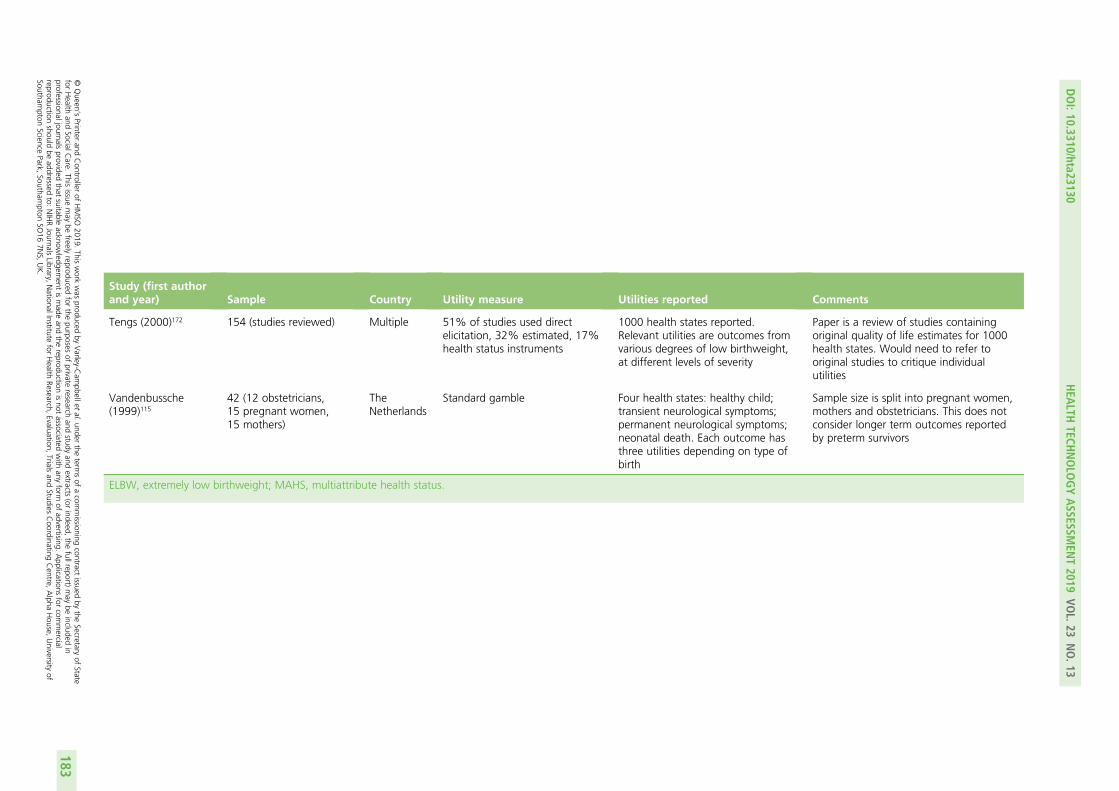
Study (first authorand year) Sample Country Utility measure Utilities reported Comments
Tengs (2000)172 154 (studies reviewed) Multiple 51% of studies used directelicitation, 32% estimated, 17%health status instruments
1000 health states reported.Relevant utilities are outcomes fromvarious degrees of low birthweight,at different levels of severity
Paper is a review of studies containingoriginal quality of life estimates for 1000health states. Would need to refer tooriginal studies to critique individualutilities
Vandenbussche(1999)115
42 (12 obstetricians,15 pregnant women,15 mothers)
TheNetherlands
Standard gamble Four health states: healthy child;transient neurological symptoms;permanent neurological symptoms;neonatal death. Each outcome hasthree utilities depending on type ofbirth
Sample size is split into pregnant women,mothers and obstetricians. This does notconsider longer term outcomes reportedby preterm survivors
ELBW, extremely low birthweight; MAHS, multiattribute health status.
DOI:10.3310/hta23130
HEA
LTHTECH
NOLO
GYASSESSM
ENT2019
VOL.23
NO.13
©Queen
’sPrinter
andController
ofHMSO
2019.This
work
was
producedby
Varley-C
ampbellet
al.under
theterm
sof
acom
missioning
contractissued
bythe
Secretaryof
Statefor
Health
andSocialC
are.This
issuemay
befreely
reproducedfor
thepurposes
ofprivate
researchand
studyand
extracts(or
indeed,the
fullreport)may
beincluded
inprofessionaljournals
providedthat
suitableacknow
ledgement
ismade
andthe
reproductionisnot
associatedwith
anyform
ofadvertising.
Applications
forcom
mercial
reproductionshould
beaddressed
to:NIHRJournals
Library,NationalInstitute
forHealth
Research,Evaluation,
Trialsand
StudiesCoordinating
Centre,
Alpha
House,
University
ofSoutham
ptonScience
Park,Southam
ptonSO
167N
S,UK.
183
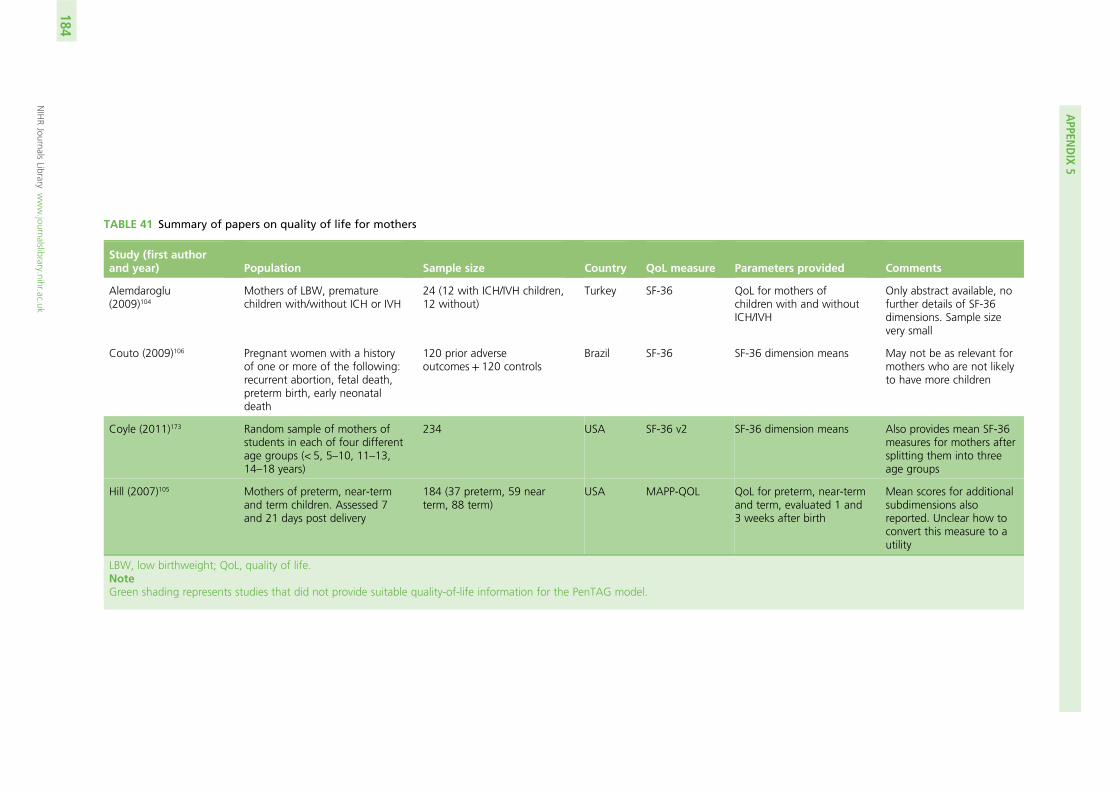
TABLE 41 Summary of papers on quality of life for mothers
Study (first authorand year) Population Sample size Country QoL measure Parameters provided Comments
Alemdaroglu(2009)104
Mothers of LBW, prematurechildren with/without ICH or IVH
24 (12 with ICH/IVH children,12 without)
Turkey SF-36 QoL for mothers ofchildren with and withoutICH/IVH
Only abstract available, nofurther details of SF-36dimensions. Sample sizevery small
Couto (2009)106 Pregnant women with a historyof one or more of the following:recurrent abortion, fetal death,preterm birth, early neonataldeath
120 prior adverseoutcomes + 120 controls
Brazil SF-36 SF-36 dimension means May not be as relevant formothers who are not likelyto have more children
Coyle (2011)173 Random sample of mothers ofstudents in each of four differentage groups (< 5, 5–10, 11–13,14–18 years)
234 USA SF-36 v2 SF-36 dimension means Also provides mean SF-36measures for mothers aftersplitting them into threeage groups
Hill (2007)105 Mothers of preterm, near-termand term children. Assessed 7and 21 days post delivery
184 (37 preterm, 59 nearterm, 88 term)
USA MAPP-QOL QoL for preterm, near-termand term, evaluated 1 and3 weeks after birth
Mean scores for additionalsubdimensions alsoreported. Unclear how toconvert this measure to autility
LBW, low birthweight; QoL, quality of life.NoteGreen shading represents studies that did not provide suitable quality-of-life information for the PenTAG model.
APPEN
DIX
5
NIHRJournals
Librarywww.journalslibrary.nihr.ac.uk
184
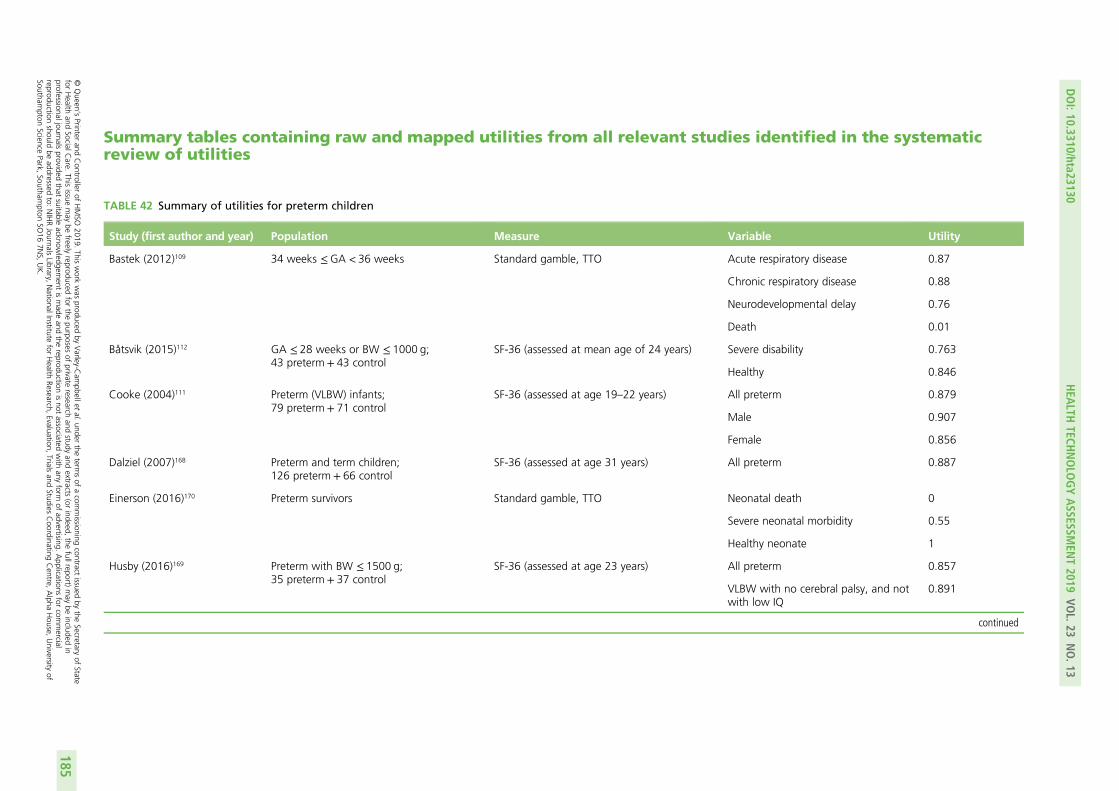
Summary tables containing raw and mapped utilities from all relevant studies identified in the systematicreview of utilities
TABLE 42 Summary of utilities for preterm children
Study (first author and year) Population Measure Variable Utility
Bastek (2012)109 34 weeks ≤GA < 36 weeks Standard gamble, TTO Acute respiratory disease 0.87
Chronic respiratory disease 0.88
Neurodevelopmental delay 0.76
Death 0.01
Båtsvik (2015)112 GA ≤ 28 weeks or BW ≤ 1000 g;43 preterm + 43 control
SF-36 (assessed at mean age of 24 years) Severe disability 0.763
Healthy 0.846
Cooke (2004)111 Preterm (VLBW) infants;79 preterm + 71 control
SF-36 (assessed at age 19–22 years) All preterm 0.879
Male 0.907
Female 0.856
Dalziel (2007)168 Preterm and term children;126 preterm + 66 control
SF-36 (assessed at age 31 years) All preterm 0.887
Einerson (2016)170 Preterm survivors Standard gamble, TTO Neonatal death 0
Severe neonatal morbidity 0.55
Healthy neonate 1
Husby (2016)169 Preterm with BW ≤ 1500 g;35 preterm + 37 control
SF-36 (assessed at age 23 years) All preterm 0.857
VLBW with no cerebral palsy, and notwith low IQ
0.891
continued
DOI:10.3310/hta23130
HEA
LTHTECH
NOLO
GYASSESSM
ENT2019
VOL.23
NO.13
©Queen
’sPrinter
andController
ofHMSO
2019.This
work
was
producedby
Varley-C
ampbellet
al.under
theterm
sof
acom
missioning
contractissued
bythe
Secretaryof
Statefor
Health
andSocialC
are.This
issuemay
befreely
reproducedfor
thepurposes
ofprivate
researchand
studyand
extracts(or
indeed,the
fullreport)may
beincluded
inprofessionaljournals
providedthat
suitableacknow
ledgement
ismade
andthe
reproductionisnot
associatedwith
anyform
ofadvertising.
Applications
forcom
mercial
reproductionshould
beaddressed
to:NIHRJournals
Library,NationalInstitute
forHealth
Research,Evaluation,
Trialsand
StudiesCoordinating
Centre,
Alpha
House,
University
ofSoutham
ptonScience
Park,Southam
ptonSO
167N
S,UK.
185
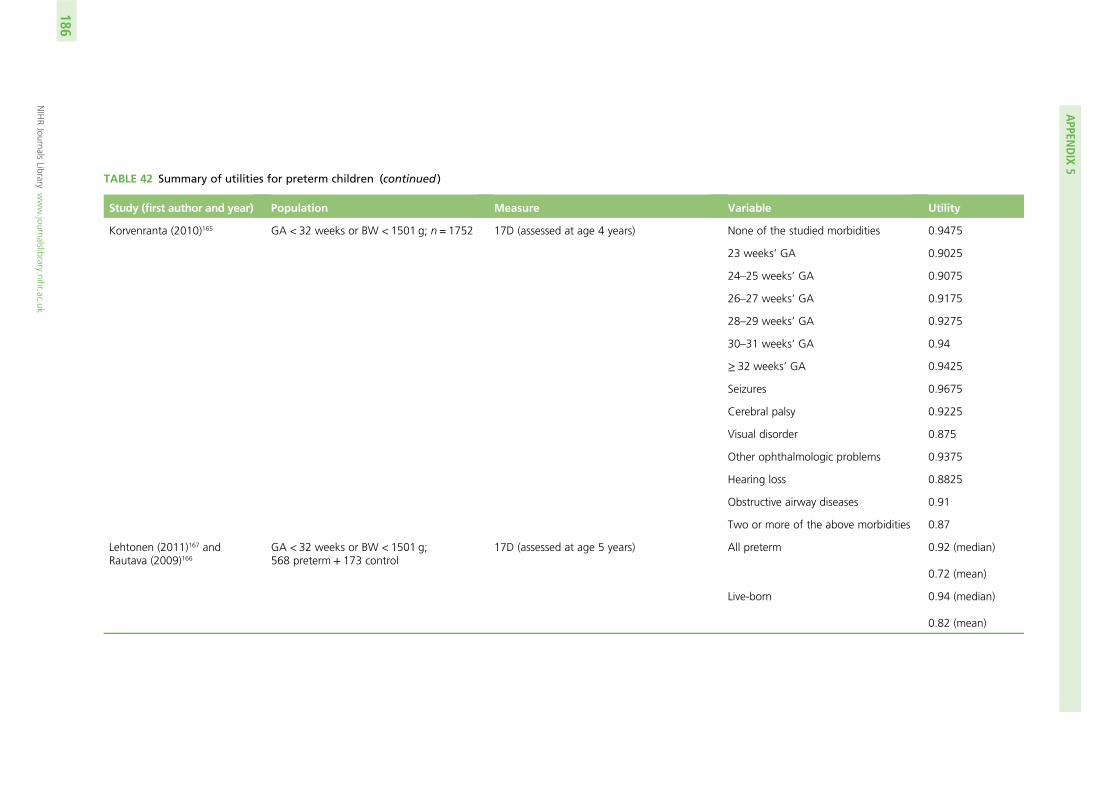
TABLE 42 Summary of utilities for preterm children (continued )
Study (first author and year) Population Measure Variable Utility
Korvenranta (2010)165 GA < 32 weeks or BW < 1501 g; n = 1752 17D (assessed at age 4 years) None of the studied morbidities 0.9475
23 weeks’ GA 0.9025
24–25 weeks’ GA 0.9075
26–27 weeks’ GA 0.9175
28–29 weeks’ GA 0.9275
30–31 weeks’ GA 0.94
≥ 32 weeks’ GA 0.9425
Seizures 0.9675
Cerebral palsy 0.9225
Visual disorder 0.875
Other ophthalmologic problems 0.9375
Hearing loss 0.8825
Obstructive airway diseases 0.91
Two or more of the above morbidities 0.87
Lehtonen (2011)167 andRautava (2009)166
GA < 32 weeks or BW < 1501 g;568 preterm + 173 control
17D (assessed at age 5 years) All preterm 0.92 (median)
0.72 (mean)
Live-born 0.94 (median)
0.82 (mean)
APPEN
DIX
5
NIHRJournals
Librarywww.journalslibrary.nihr.ac.uk
186
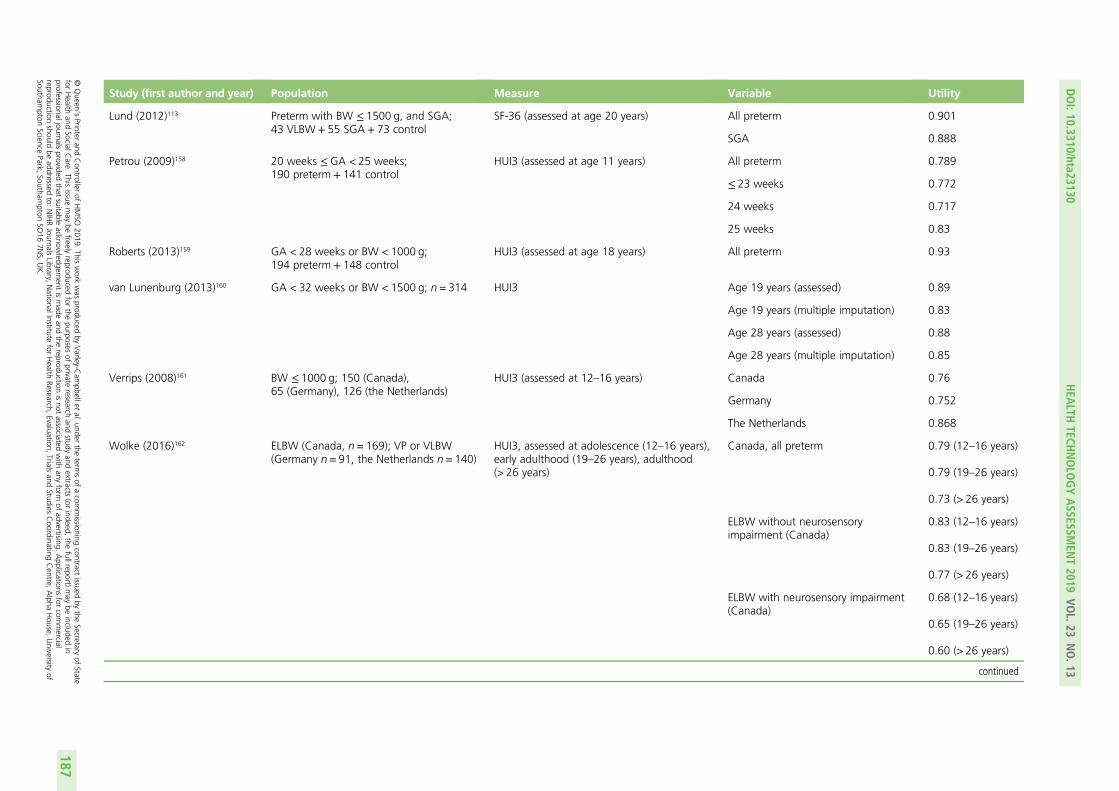
Study (first author and year) Population Measure Variable Utility
Lund (2012)113 Preterm with BW ≤ 1500 g, and SGA;43 VLBW + 55 SGA + 73 control
SF-36 (assessed at age 20 years) All preterm 0.901
SGA 0.888
Petrou (2009)158 20 weeks ≤GA < 25 weeks;190 preterm + 141 control
HUI3 (assessed at age 11 years) All preterm 0.789
≤ 23 weeks 0.772
24 weeks 0.717
25 weeks 0.83
Roberts (2013)159 GA < 28 weeks or BW < 1000 g;194 preterm + 148 control
HUI3 (assessed at age 18 years) All preterm 0.93
van Lunenburg (2013)160 GA < 32 weeks or BW < 1500 g; n = 314 HUI3 Age 19 years (assessed) 0.89
Age 19 years (multiple imputation) 0.83
Age 28 years (assessed) 0.88
Age 28 years (multiple imputation) 0.85
Verrips (2008)161 BW ≤ 1000 g; 150 (Canada),65 (Germany), 126 (the Netherlands)
HUI3 (assessed at 12–16 years) Canada 0.76
Germany 0.752
The Netherlands 0.868
Wolke (2016)162 ELBW (Canada, n = 169); VP or VLBW(Germany n = 91, the Netherlands n = 140)
HUI3, assessed at adolescence (12–16 years),early adulthood (19–26 years), adulthood(> 26 years)
Canada, all preterm 0.79 (12–16 years)
0.79 (19–26 years)
0.73 (> 26 years)
ELBW without neurosensoryimpairment (Canada)
0.83 (12–16 years)
0.83 (19–26 years)
0.77 (> 26 years)
ELBW with neurosensory impairment(Canada)
0.68 (12–16 years)
0.65 (19–26 years)
0.60 (> 26 years)
continued
DOI:10.3310/hta23130
HEA
LTHTECH
NOLO
GYASSESSM
ENT2019
VOL.23
NO.13
©Queen
’sPrinter
andController
ofHMSO
2019.This
work
was
producedby
Varley-C
ampbellet
al.under
theterm
sof
acom
missioning
contractissued
bythe
Secretaryof
Statefor
Health
andSocialC
are.This
issuemay
befreely
reproducedfor
thepurposes
ofprivate
researchand
studyand
extracts(or
indeed,the
fullreport)may
beincluded
inprofessionaljournals
providedthat
suitableacknow
ledgement
ismade
andthe
reproductionisnot
associatedwith
anyform
ofadvertising.
Applications
forcom
mercial
reproductionshould
beaddressed
to:NIHRJournals
Library,NationalInstitute
forHealth
Research,Evaluation,
Trialsand
StudiesCoordinating
Centre,
Alpha
House,
University
ofSoutham
ptonScience
Park,Southam
ptonSO
167N
S,UK.
187

TABLE 42 Summary of utilities for preterm children (continued )
Study (first author and year) Population Measure Variable Utility
Germany, all preterm 0.82 (12–16 years)
0.82 (19–26 years)
The Netherlands, assessed 0.87 (12–16 years)
0.89 (19–26 years)
0.88 (> 26 years)
The Netherlands, imputed 0.83 (19–26 years)
0.85 (> 26 years)
Wolke (2013)163 GA < 32 weeks or BW < 1500 g;260 preterm + 282 control
HUI3 (assessed at age 13 years) Parent reported 0.88
Child self-reported 0.84
Zwicker (2008)164 VLBW or preterm HUI2 and standard gamble School-age 0.82
Adolescents (study 1) 0.87
Adolescents (study 2) 0.91
Young adults 0.85
ELBW, extremely low birthweight; GA, gestational age; SGA, small for gestational age; TTO, time trade-off; VLBW, very low birthweight; VP, very premature.
APPEN
DIX
5
NIHRJournals
Librarywww.journalslibrary.nihr.ac.uk
188
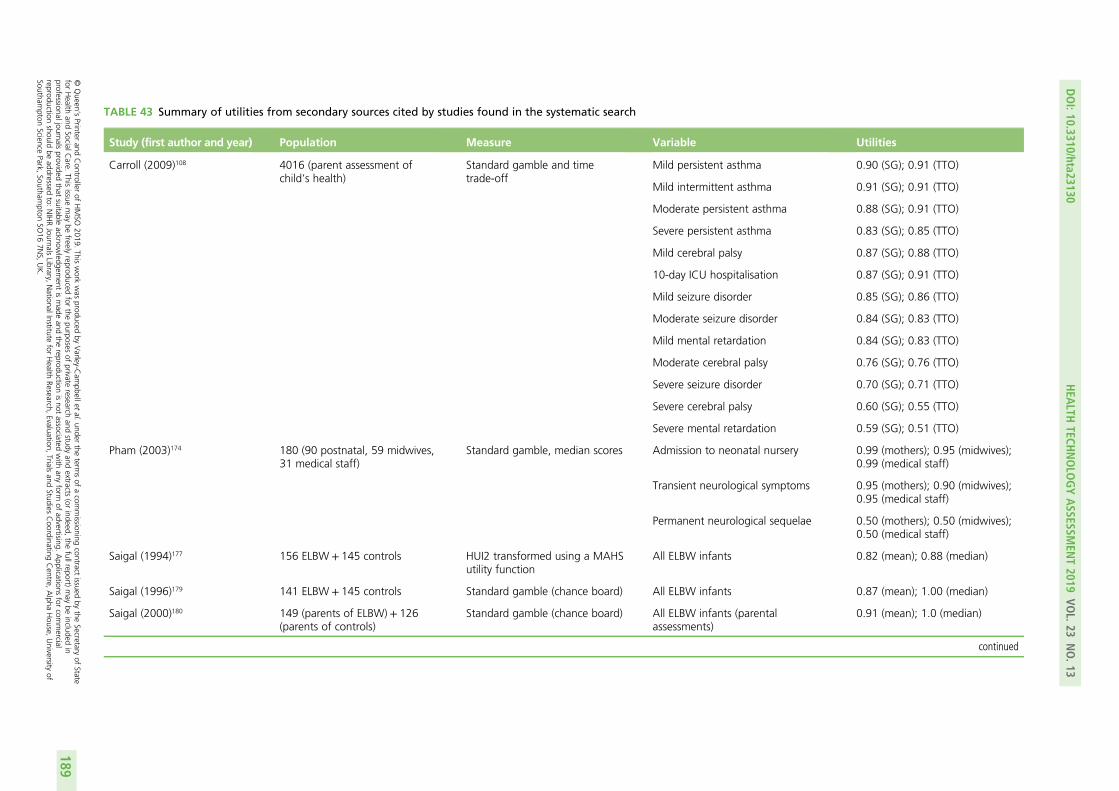
TABLE 43 Summary of utilities from secondary sources cited by studies found in the systematic search
Study (first author and year) Population Measure Variable Utilities
Carroll (2009)108 4016 (parent assessment ofchild’s health)
Standard gamble and timetrade-off
Mild persistent asthma 0.90 (SG); 0.91 (TTO)
Mild intermittent asthma 0.91 (SG); 0.91 (TTO)
Moderate persistent asthma 0.88 (SG); 0.91 (TTO)
Severe persistent asthma 0.83 (SG); 0.85 (TTO)
Mild cerebral palsy 0.87 (SG); 0.88 (TTO)
10-day ICU hospitalisation 0.87 (SG); 0.91 (TTO)
Mild seizure disorder 0.85 (SG); 0.86 (TTO)
Moderate seizure disorder 0.84 (SG); 0.83 (TTO)
Mild mental retardation 0.84 (SG); 0.83 (TTO)
Moderate cerebral palsy 0.76 (SG); 0.76 (TTO)
Severe seizure disorder 0.70 (SG); 0.71 (TTO)
Severe cerebral palsy 0.60 (SG); 0.55 (TTO)
Severe mental retardation 0.59 (SG); 0.51 (TTO)
Pham (2003)174 180 (90 postnatal, 59 midwives,31 medical staff)
Standard gamble, median scores Admission to neonatal nursery 0.99 (mothers); 0.95 (midwives);0.99 (medical staff)
Transient neurological symptoms 0.95 (mothers); 0.90 (midwives);0.95 (medical staff)
Permanent neurological sequelae 0.50 (mothers); 0.50 (midwives);0.50 (medical staff)
Saigal (1994)177 156 ELBW + 145 controls HUI2 transformed using a MAHSutility function
All ELBW infants 0.82 (mean); 0.88 (median)
Saigal (1996)179 141 ELBW + 145 controls Standard gamble (chance board) All ELBW infants 0.87 (mean); 1.00 (median)
Saigal (2000)180 149 (parents of ELBW) + 126(parents of controls)
Standard gamble (chance board) All ELBW infants (parentalassessments)
0.91 (mean); 1.0 (median)
continued
DOI:10.3310/hta23130
HEA
LTHTECH
NOLO
GYASSESSM
ENT2019
VOL.23
NO.13
©Queen
’sPrinter
andController
ofHMSO
2019.This
work
was
producedby
Varley-C
ampbellet
al.under
theterm
sof
acom
missioning
contractissued
bythe
Secretaryof
Statefor
Health
andSocialC
are.This
issuemay
befreely
reproducedfor
thepurposes
ofprivate
researchand
studyand
extracts(or
indeed,the
fullreport)may
beincluded
inprofessionaljournals
providedthat
suitableacknow
ledgement
ismade
andthe
reproductionisnot
associatedwith
anyform
ofadvertising.
Applications
forcom
mercial
reproductionshould
beaddressed
to:NIHRJournals
Library,NationalInstitute
forHealth
Research,Evaluation,
Trialsand
StudiesCoordinating
Centre,
Alpha
House,
University
ofSoutham
ptonScience
Park,Southam
ptonSO
167N
S,UK.
189

TABLE 43 Summary of utilities from secondary sources cited by studies found in the systematic search (continued )
Study (first author and year) Population Measure Variable Utilities
Saigal et al. (2006)181 149 (parents of ELBW) + 126(parents of controls)
Standard gamble All ELBW infants 0.85 (mean, ELBW);0.95 (median, ELBW)
ELBW infants with neurosensoryimpairments
0.85
ELBW infants without neurosensoryimpairments
0.85
Tengs and Wallace (2000)172 140 experts Standard gamble Cerebrovascular disease, intracranialaneurysm, good but incompleterecovery, normal life with minorneurological and psychologicaldeficits
0.85
Cerebrovascular disease, intracranialaneurysm, moderate disability,independent daily living
0.63
Cerebrovascular disease, intracranialaneurysm, persistent vegetativestate, unresponsive and speechlessuntil death after acute brain damage
0.08
Cerebrovascular disease, intracranialaneurysm, severe disability,dependent on others for dailysupport owing to mental and/orphysical disability
0.26
156 patient proxies HUI ELBW infants (501–1000 g),assessed at age 8 years
0.82
24 patients Standard gamble Lung disease, chronic (e.g. chronicbronchitis, emphysema, cysticfibrosis, on waiting list fortransplant)
0.65
Lung disease, chronic (e.g. chronicbronchitis, emphysema, cysticfibrosis, transplant)
0.8
APPEN
DIX
5
NIHRJournals
Librarywww.journalslibrary.nihr.ac.uk
190

Study (first author and year) Population Measure Variable Utilities
Vandenbussche et al. (1999)115 42 (12 obstetricians,15 pregnant women,15 mothers)
Standard gamble, medianutilities
Healthy child, spontaneous birth 1
Transient neurological symptoms,spontaneous birth
0.99
Permanent neurological symptoms,spontaneous birth
0.5 (pregnant women);0.35 (mothers); 0.05 (obstetricians)
Neonatal death, spontaneous birth 0.01 (pregnant women, mothers);0.23 (obstetricians)
ELBW, extremely low birth weight; ICU, intensive care unit; MAHS, multiattribute health status; TTO, time trade-off.
DOI:10.3310/hta23130
HEA
LTHTECH
NOLO
GYASSESSM
ENT2019
VOL.23
NO.13
©Queen
’sPrinter
andController
ofHMSO
2019.This
work
was
producedby
Varley-C
ampbellet
al.under
theterm
sof
acom
missioning
contractissued
bythe
Secretaryof
Statefor
Health
andSocialC
are.This
issuemay
befreely
reproducedfor
thepurposes
ofprivate
researchand
studyand
extracts(or
indeed,the
fullreport)may
beincluded
inprofessionaljournals
providedthat
suitableacknow
ledgement
ismade
andthe
reproductionisnot
associatedwith
anyform
ofadvertising.
Applications
forcom
mercial
reproductionshould
beaddressed
to:NIHRJournals
Library,NationalInstitute
forHealth
Research,Evaluation,
Trialsand
StudiesCoordinating
Centre,
Alpha
House,
University
ofSoutham
ptonScience
Park,Southam
ptonSO
167N
S,UK.
191
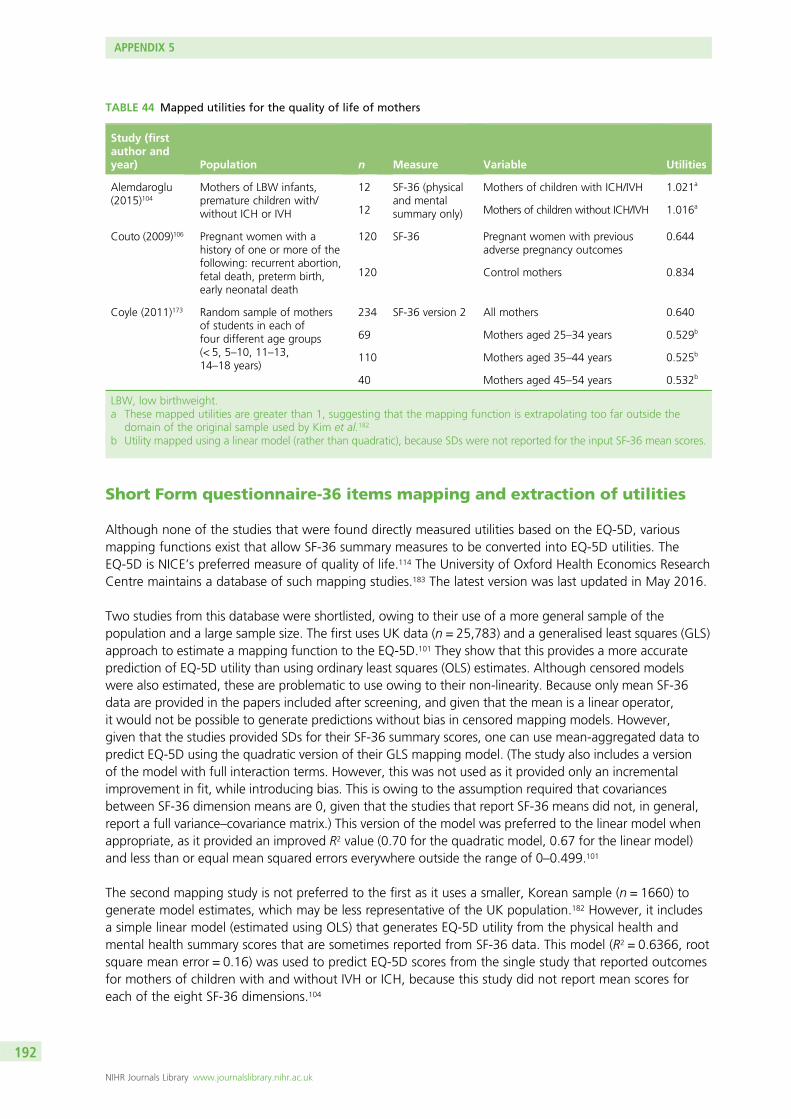
Short Form questionnaire-36 items mapping and extraction of utilities
Although none of the studies that were found directly measured utilities based on the EQ-5D, variousmapping functions exist that allow SF-36 summary measures to be converted into EQ-5D utilities. TheEQ-5D is NICE’s preferred measure of quality of life.114 The University of Oxford Health Economics ResearchCentre maintains a database of such mapping studies.183 The latest version was last updated in May 2016.
Two studies from this database were shortlisted, owing to their use of a more general sample of thepopulation and a large sample size. The first uses UK data (n = 25,783) and a generalised least squares (GLS)approach to estimate a mapping function to the EQ-5D.101 They show that this provides a more accurateprediction of EQ-5D utility than using ordinary least squares (OLS) estimates. Although censored modelswere also estimated, these are problematic to use owing to their non-linearity. Because only mean SF-36data are provided in the papers included after screening, and given that the mean is a linear operator,it would not be possible to generate predictions without bias in censored mapping models. However,given that the studies provided SDs for their SF-36 summary scores, one can use mean-aggregated data topredict EQ-5D using the quadratic version of their GLS mapping model. (The study also includes a versionof the model with full interaction terms. However, this was not used as it provided only an incrementalimprovement in fit, while introducing bias. This is owing to the assumption required that covariancesbetween SF-36 dimension means are 0, given that the studies that report SF-36 means did not, in general,report a full variance–covariance matrix.) This version of the model was preferred to the linear model whenappropriate, as it provided an improved R2 value (0.70 for the quadratic model, 0.67 for the linear model)and less than or equal mean squared errors everywhere outside the range of 0–0.499.101
The second mapping study is not preferred to the first as it uses a smaller, Korean sample (n = 1660) togenerate model estimates, which may be less representative of the UK population.182 However, it includesa simple linear model (estimated using OLS) that generates EQ-5D utility from the physical health andmental health summary scores that are sometimes reported from SF-36 data. This model (R2 = 0.6366, rootsquare mean error = 0.16) was used to predict EQ-5D scores from the single study that reported outcomesfor mothers of children with and without IVH or ICH, because this study did not report mean scores foreach of the eight SF-36 dimensions.104
TABLE 44 Mapped utilities for the quality of life of mothers
Study (firstauthor andyear) Population n Measure Variable Utilities
Alemdaroglu(2015)104
Mothers of LBW infants,premature children with/without ICH or IVH
12 SF-36 (physicaland mentalsummary only)
Mothers of children with ICH/IVH 1.021a
12 Mothers of children without ICH/IVH 1.016a
Couto (2009)106 Pregnant women with ahistory of one or more of thefollowing: recurrent abortion,fetal death, preterm birth,early neonatal death
120 SF-36 Pregnant women with previousadverse pregnancy outcomes
0.644
120 Control mothers 0.834
Coyle (2011)173 Random sample of mothersof students in each offour different age groups(< 5, 5–10, 11–13,14–18 years)
234 SF-36 version 2 All mothers 0.640
69 Mothers aged 25–34 years 0.529b
110 Mothers aged 35–44 years 0.525b
40 Mothers aged 45–54 years 0.532b
LBW, low birthweight.a These mapped utilities are greater than 1, suggesting that the mapping function is extrapolating too far outside the
domain of the original sample used by Kim et al.182
b Utility mapped using a linear model (rather than quadratic), because SDs were not reported for the input SF-36 mean scores.
APPENDIX 5
NIHR Journals Library www.journalslibrary.nihr.ac.uk
192

These SF-36-to-EQ-5D mapped utilities are tabulated in this appendix, along with the other relevantutilities extracted directly from papers (where available) as follows: Table 42 contains all relevant utilitiesfrom studies of preterm children, Table 43 contains all relevant utilities from studies that were identified assecondary sources of utility data and Table 44 contains all relevant utilities from the studies of mothers.
Study discussion
Studies of preterm childrenThe majority of the studies identified utilities (either directly or via the SF-36) for children born preterm orat a reduced birthweight, at various stages of life. Of these, only two studies used a UK/Ireland-basedpopulation.111,158
Two studies provide utilities for children born at different gestational ages.158,165 Petrou et al.158 only studychildren born between the gestational ages of 20 and 25 weeks, but assess utility using the HUI3 at11 years of age in a UK and Ireland population. Korvenranta et al.165 study Finnish children at 4 years of age,but provide utilities using the 17D measure for all gestational ages of preterm birth from 23 weeks onwards.
The largest studies are from Finland, and all three make use of the 17D quality-of-life measure.165–167
These studies report QALYs rather than utilities, but because they are computed linearly, implied utilitiesare derived by dividing the QALY value by the overall time horizon (4 years in Korvenranta et al.,165 5 yearsin Lehtonen et al.167). No mapping studies from the 17D to the EQ-5D were found in the current Universityof Oxford Health Economics Research Centre database.183 A Google Scholar search for the term ‘17DEQ-5D’ was undertaken, but no mapping studies between the two were found.
Only one paper considers the quality of life for preterm children with IVH, separated into two severitygroups: level 0–2 IVH with no PVL and level 2–4 IVH with/without PVL.102 The health-related quality-of-lifemeasure they used, developed by the CDC, does not have a suitable mapping to EQ-5D utility. However,those with more severe IVH do, in most cases, report a significantly lower quality of life at age 18–19 years.
Likewise, only one paper considers quality of life for preterm children with RDS. The authors measure,but do not provide, SF-36 scores in their paper.103 However, they do explain that there was no significantdifference in SF-36 means between different groups of children, when assessed as adults. This study isdiscussed further in Utilities for respiratory distress syndrome.
Although other studies do not measure quality of life for children with IVH or RDS, some do make use ofrelated utility measures as proxies for these conditions. The best example of this109 identifies utilities (originallyderived from two other studies108,115) for acute/chronic respiratory disease, and neurodevelopmental delay.The utilities from the study by Carroll and Downs108 are considered particularly reliable, as they are the result ofusing both the standard gamble and the time trade-off methods of elicitation for 4016 US parent (or guardian)assessments of a child’s hypothetical health state.108 The utilities from this paper are used by Bastek et al.109 fortheir model of ACSs, a treatment which is relevant to the economic model devised for this report. This study isdiscussed further in Utilities for respiratory distress syndrome and Utilities for intraventricular haemorrhage.
We received a forthcoming paper in confidence after contacting Dr Stavros Petrou (University of Warwick,2017, personal communication), a health economist who has previously studied childhood outcomes.184 Thisstudy includes a meta-analysis of utilities for preterm birth, as well as for other complications that may berelated to RDS and IVH. This may provide more reliable quality-of-life estimates than selecting one study alone,but has the disadvantage of only providing utilities classified into more general health states than those foundin individual studies. For example, they provide a weighted average utility score for chronic lower respiratorydisease and for combined disorders of the respiratory system, but not specific utilities for RDS. In addition,there are no average utilities for children born preterm measured by EQ-5D or SF-36/SF-6D. Finally, this studyexcluded papers with a mean or median assessment age of > 18 years, which may be problematic whenextrapolating over the entire lifespan.
DOI: 10.3310/hta23130 HEALTH TECHNOLOGY ASSESSMENT 2019 VOL. 23 NO. 13
© Queen’s Printer and Controller of HMSO 2019. This work was produced by Varley-Campbell et al. under the terms of a commissioning contract issued by the Secretary of Statefor Health and Social Care. This issue may be freely reproduced for the purposes of private research and study and extracts (or indeed, the full report) may be included inprofessional journals provided that suitable acknowledgement is made and the reproduction is not associated with any form of advertising. Applications for commercialreproduction should be addressed to: NIHR Journals Library, National Institute for Health Research, Evaluation, Trials and Studies Coordinating Centre, Alpha House, University ofSouthampton Science Park, Southampton SO16 7NS, UK.
193
Studies of mothersThe quality of evidence on the quality of life of mothers of preterm children is low. Only two studies considermothers of preterm children specifically.104,105 The first is an abstract that reports only physical and mentalhealth SF-36 mean summary scores. It is taken from a small Turkish sample of 24 mothers (12 who havelow-birthweight preterm children with ICH or IVH and 12 who have low-birthweight preterm childrenwithout ICH or IVH), which may not be representative of mothers in the UK. Furthermore, given that themapping function (derived from subjects in Korea) applicable to physical and mental summary SF-36 scoresused OLS,182 it yields utilities of > 1 (see Table 44) when applied to the data from Alemdaroglu et al.104
Hence, we are not able to use this paper to generate appropriate utilities for the economic model.
The second study reported MAPP-QOL scores for mothers in the USA.105 This study could not be mappedinto utilities, and only provides quality of life for mothers of preterm, near-term and term children 1 and3 weeks postpartum. However, it does not contain information on mothers of preterm children with adversebirth conditions. Likewise, the utility mapped from the SF-36 means of a random sample of US mothers byCoyle173 could have been considered as a baseline for the quality of life of mothers whose children do notexperience adverse health outcomes, but there is no corresponding quality-of-life information for mothersof children who have adverse health outcomes. Therefore, neither of these studies provide usable utilitiesfor the economic model.
The final study of mothers, by Couto et al.,106 captures the quality of life of mothers in Brazil who havehad at least one of four previous adverse pregnancy outcomes. Although preterm birth is one of thefour outcomes that is an inclusion criterion (along with early neonatal death, recurrent abortion and fetaldeath), we are not provided with separate utilities for each outcome individually. The death outcomes arelikely to skew the utility measure lower than if only mothers with a history of preterm birth were includedin the population. It may be useful to treat this utility as a proxy for any adverse outcomes resulting frompreterm labour, with the caveat that the utility would be an underestimate for mothers of preterm childrenwho develop conditions but do not die and an overestimate for mothers of preterm children who die.
A recent study (that was not included in the shortlist) suggests that whether a child is born very pretermor not may not have much of an effect on longer term parent quality of life.185 We also consulted withProfessor Dieter Wolke (University of Warwick, 2017, personal communication), an expert on the outcomesof preterm and low birthweight children, on this matter. He confirmed that, on the whole, data on theoutcomes of parents with preterm children is very limited.
Utilities for respiratory distress syndrome
There is only one study identified that measured quality-of-life outcomes for preterm children with RDS.103
The study compares four groups of subjects:
1. born preterm (gestational age < 37 weeks) who developed bronchopulmonary dysplasia without infant RDS2. born preterm with RDS but no subsequent bronchopulmonary dysplasia3. born preterm without respiratory complications4. born at term without respiratory complications.
The study uses a Canadian sample to whom questionnaires were administered containing the SF-36version 2 via post. A total of 233 of the responses were from preterm individuals with RDS, measuredat a mean age of 20.04 years. However, SF-36 scores were not reported in the paper. The correspondingauthor was contacted to request these data, but was unable to provide it. The study claims thathealth-related quality of life did not differ between the four groups studied.
In their modelling study for ACSs, Bastek et al.109 utilise proxy utilities for acute and chronic respiratory disease.They argue that a utility value for a 10-day intensive care unit (ICU) admission was an acceptable proxy for
APPENDIX 5
NIHR Journals Library www.journalslibrary.nihr.ac.uk
194
acute respiratory disease, because infants with RDS are managed in NICUs. The utility corresponding to thisoutcome is 0.87.108 In Table 43, we see that Carroll and Downs108 obtained this utility using the standardgamble method. Because NICE uses the UK time trade-off value set to obtain utilities from the EQ-5D, timetrade-off utilities obtained by Carroll and Downs108 are preferred to those obtained by standard gamble.114
In the study by Carroll and Downs,108 the time trade-off utility for 10-day ICU admission is 0.91.
Bastek et al.109 report a utility for chronic respiratory disease of 0.88, which was taken from the study byCarroll and Downs108 as the utility of moderate persistent asthma. In Table 43, we see that this utility wasobtained using the standard gamble method. The time trade-off equivalent from the study by Carroll andDowns108 is 0.91. However, given that this utility is higher than the value used for preterm survivors, weopted to use the utility for severe persistent asthma from the study by Carroll and Downs.108 This is 0.85,as elicited using the time trade-off method.
Utilities for intraventricular haemorrhage
As discussed in Study discussion, only one study measured quality-of-life outcomes for children with IVHspecifically.102 This study uses four health-related quality-of-life questions from the CDC. One of these ismeasured on a 5-point scale, while the remaining three ask for a number of days over the past 30 daysthat a particular health state (e.g. poor mental health) was not good. There is no clear mapping for thesemeasures to provide a single measure of utility.
Therefore, the study by Bastek et al.109 again provides the best available estimate of a utility value. Theyuse the utility for moderate cerebral palsy from the study by Carroll and Downs108 as a proxy for adverseneurodevelopment. In Table 43, we see that this utility of 0.76 is identical for both the standard gambleand time trade-off methods of elicitation.
Utilities for preterm survivors
The NICE-preferred measure of health-related quality of life in adults is the EQ-5D;114 however, given thatwe do not have any such data, the second-best option is to use SF-36 scores mapped onto the EQ-5D.Five studies provide utilities for children that were obtained from mapping the SF-36 mean dimension scoresonto the EQ-5D.111–113,168,169 Although many other studies provide utilities using the HUI and 17D, thesemeasures are less desirable than the mapped SF-36 for populating a NICE reference case analysis. In addition,the SF-36 studies, on average, measured outcomes later in life than the 17D or HUI studies, suggesting thatthe utilities obtained from these studies would be more relevant when extrapolated across the lifespan.
Three of these five studies are Norwegian.112,113,169 One study restricts its population to gestation of≤ 28 weeks or a birthweight of ≤ 1000 g.112 This appears too limiting to capture the outcomes of allpreterm children. The other two studies consider a more generous birthweight range of ≤ 1500 g, buthave small preterm sample sizes of 35113 and 43.169
Of the remaining two studies, one has SF-36 measures for a very low-birthweight sample of 79 participantsfrom the UK (assessed between ages 19 and 22 years).111 The other uses a larger sample of 126 pretermchildren from New Zealand (assessed at age 31 years) whose mothers were participants in the AucklandSteroid Trial.168 Of these individuals, 21 had RDS in infancy, which may lead to a small downwards bias inthe quality-of-life scores, although it is possible that this bias had been diminished by the time theparticipants were assessed.
In summary, the five studies that report SF-36 quality-of-life scores provide mapped EQ-5D utilities that canbe used for preterm survivors. The studies that used the 17D or HUI measures were seen as less desirable,as they cannot be mapped in a straightforward way to EQ-5D utilities.
DOI: 10.3310/hta23130 HEALTH TECHNOLOGY ASSESSMENT 2019 VOL. 23 NO. 13
© Queen’s Printer and Controller of HMSO 2019. This work was produced by Varley-Campbell et al. under the terms of a commissioning contract issued by the Secretary of Statefor Health and Social Care. This issue may be freely reproduced for the purposes of private research and study and extracts (or indeed, the full report) may be included inprofessional journals provided that suitable acknowledgement is made and the reproduction is not associated with any form of advertising. Applications for commercialreproduction should be addressed to: NIHR Journals Library, National Institute for Health Research, Evaluation, Trials and Studies Coordinating Centre, Alpha House, University ofSouthampton Science Park, Southampton SO16 7NS, UK.
195

Statistical analysis of the effects of birthweight on utility
In order to determine whether or not it was necessary to incorporate a utility reduction for lower birthweight,regression analysis was carried out on a data set obtained from one of the authors of a Canadian study.107
The data contained utility, as measured by HUI3, assessed at three life stages (adolescence, young adulthoodand mature adulthood). Along with this, we were supplied with data on birthweight, sex and gestational age.Data from 290 individuals were provided, although some had missing sex information and many participantsdid not respond in all three life stages. The mean birthweight in the sample was 2047.9 g (minimum =560 g, maximum = 4734 g) and the mean gestational age was 33.2 weeks (minimum = 23 weeks,maximum = 40 weeks).
A random-effects GLS panel data estimator was used to estimate the following general model (the ‘between’estimator was also used, but results are not reported as they did not differ substantially from the GLS estimates,and because random-effects GLS is a more efficient estimator in general):
uit = α + βBi + γXi + θDt + νi + ϵit, (14)
where u = utility, B = a vector containing birthweight and squared birthweight, X = a vector containing sexand gestational age, D = a vector of time dummies, ν = an unobservable fixed effect and ε = theidiosyncratic error term. Table 45 shows the estimates of five different model specifications.
TABLE 45 Random-effects GLS estimates of utility on birthweight
Explanatory variable
Dependent variable: utility (HUI3)
(1) (2) (3) (4) (5)
Birthweight (g) 9 × 10⁻⁵ 9.07 × 10–5* 0.00011 0.00011 0.0000292
(4.96 × 10⁻⁵) (4.96 × 10⁻⁵) (9.06 × 10⁻⁵) (9.05 × 10⁻⁵) (2.20 × 10⁻⁵)
Birthweight squared –1.08 × 10⁻⁸ –1.11 × 10⁻⁸ –1.4 × 10⁻⁸ –1.4 × 10⁻⁸
(1.10 × 10⁻⁸) (1.10 × 10⁻⁸) (1.52 × 10⁻⁸) (1.52 × 10⁻⁸)
Young adult 0.00196 0.00216
(0.0144) (0.0145)
Mature adult –0.0531*** –0.0517*** –0.0528***
(0.0167) (0.0167) (0.0149)
Gestational age (weeks) –0.0015 –0.0014 0.00246
(0.00605) (0.00605) (0.00436)
Male 0.0463** 0.0440** 0.0446**
(0.0198) (0.0198) (0.0198)
Constant 0.705*** 0.716*** 0.711*** 0.721*** 0.676***
(0.0397) (0.0403) (0.116) (0.116) (0.105)
Observations 714 714 713 713 713
Number of individuals 287 287 286 286 286
*p < 0.1, **p < 0.05, ***p < 0.01.NoteStandard errors are in brackets.
APPENDIX 5
NIHR Journals Library www.journalslibrary.nihr.ac.uk
196

The coefficient for birthweight squared was not significantly different from 0 in any of the five specifications.Specification (5) was performed as a result of removing the non-significant young adult dummy and thesquared birthweight variable from (4) in order to compare model fit. A LR test comparing these two models[these had to be re-estimated using maximum likelihood estimation (MLE) in order to obtain the log-likelihoodsnecessary to calculate the LR test statistic; the parameter estimates were identical when using MLE and GLS]resulted in a χ2 statistic of 0.9 (p = 0.6368). Therefore, there is insufficient evidence for a quadratic relationshipbetween birthweight and utility. As shown in (5), the marginal impact of a 150-g reduction in birthweight is autility reduction of 0.004.
The linear birthweight coefficient was significantly different from 0 at the 10% level only in specifications inwhich sex and gestational age were not included. In order to test whether or not the simple specification(1) is equally as valid as (4), another LR test was conducted. The test statistic of 18.16 (p = 0.0011) suggeststhat we should reject that specification (1) is equally as suitable as specification (4).
We also ran preliminary non-parametric (local polynomial) regressions that are consistent with the findingsjust described. These results suggest that the sample size available for analysis is too small to detect asmall, if existent at all, effect of birthweight on utility, as measured by the HUI3 instrument.
Based on this analysis, we conclude that there is insufficient evidence of a strong enough birthweighteffect on utility to warrant inclusion in the economic model.
Quality-adjusted life-year calculations and comparison with parametersused in the National Institute for Health and Care Excellenceguidelines model
Preterm survivors
National Institute for Health and Care Excellence guidelinesThe model used for tocolytic treatment in the 2015 NICE guidelines for preterm labour24 provides utilitiesfor preterm survivors through the gestational age range of 24 to 34 weeks. The assumption made was thatthose surviving to the age of 1 year would live for 80 years (based on life expectancy in 2015 in England andWales) at a utility value of 0.82 per year (based on a UK population norm) [the NICE guidelines state thatthis norm was established in either 1982 or 1983 (two different years are stated at different places in theevidence report24); therefore, it is somewhat outdated]. This was then discounted by the standard rate of3.5% and multiplied by the probability of survival at each gestational age. Therefore, the utility of pretermsurvivors in the guideline model was not based on data specifically from individuals born preterm.
Peninsula Technology Assessment Group modelIn contrast, the utility selected for our model is based on the mapped SF-36 score of preterm survivorsassessed between ages 19 and 22 years.111 The range is generated by taking the minimum and maximummapped SF-36 values out of four other SF-36 follow-up studies of preterm individuals, assessed at a similarpoint in the life cycle (from 20 to 31 years of age).112,113,168,169
Rather than assuming fixed life expectancy, our model uses ONS 2014–16 life tables119 for survival. Theseare multiplied by baseline population utilities for each age, which are derived from a regression equationby Ara and Brazier.84 These baseline utilities account for the natural decline in health-related quality of lifewith ageing. Some extrapolation was necessary at the beginning and end of the life horizon, as the lifetables cover the age range 0–100, and the Ara and Brazier84 regression equation was obtained by fittingto data with an age range of 16–98 years. Finally, the utilities for each health state from Table 20 aremultiplied to these baseline utilities at each age.
DOI: 10.3310/hta23130 HEALTH TECHNOLOGY ASSESSMENT 2019 VOL. 23 NO. 13
© Queen’s Printer and Controller of HMSO 2019. This work was produced by Varley-Campbell et al. under the terms of a commissioning contract issued by the Secretary of Statefor Health and Social Care. This issue may be freely reproduced for the purposes of private research and study and extracts (or indeed, the full report) may be included inprofessional journals provided that suitable acknowledgement is made and the reproduction is not associated with any form of advertising. Applications for commercialreproduction should be addressed to: NIHR Journals Library, National Institute for Health Research, Evaluation, Trials and Studies Coordinating Centre, Alpha House, University ofSouthampton Science Park, Southampton SO16 7NS, UK.
197
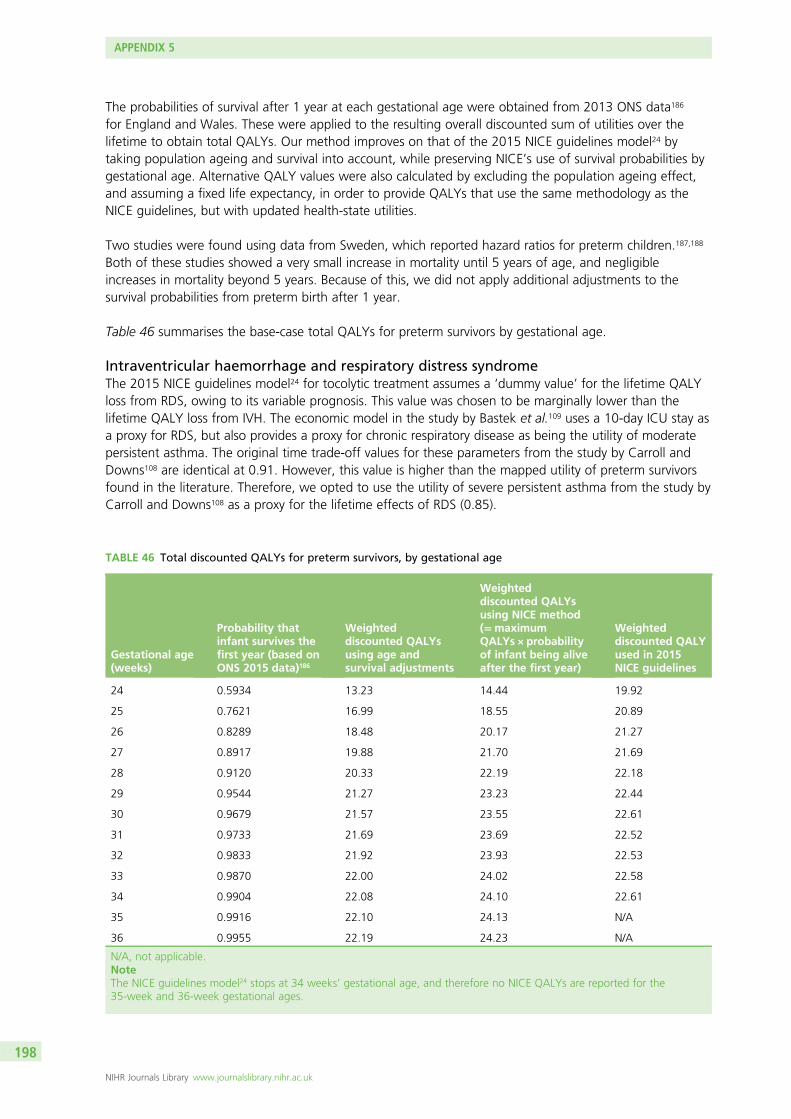
The probabilities of survival after 1 year at each gestational age were obtained from 2013 ONS data186
for England and Wales. These were applied to the resulting overall discounted sum of utilities over thelifetime to obtain total QALYs. Our method improves on that of the 2015 NICE guidelines model24 bytaking population ageing and survival into account, while preserving NICE’s use of survival probabilities bygestational age. Alternative QALY values were also calculated by excluding the population ageing effect,and assuming a fixed life expectancy, in order to provide QALYs that use the same methodology as theNICE guidelines, but with updated health-state utilities.
Two studies were found using data from Sweden, which reported hazard ratios for preterm children.187,188
Both of these studies showed a very small increase in mortality until 5 years of age, and negligibleincreases in mortality beyond 5 years. Because of this, we did not apply additional adjustments to thesurvival probabilities from preterm birth after 1 year.
Table 46 summarises the base-case total QALYs for preterm survivors by gestational age.
Intraventricular haemorrhage and respiratory distress syndromeThe 2015 NICE guidelines model24 for tocolytic treatment assumes a ‘dummy value’ for the lifetime QALYloss from RDS, owing to its variable prognosis. This value was chosen to be marginally lower than thelifetime QALY loss from IVH. The economic model in the study by Bastek et al.109 uses a 10-day ICU stay asa proxy for RDS, but also provides a proxy for chronic respiratory disease as being the utility of moderatepersistent asthma. The original time trade-off values for these parameters from the study by Carroll andDowns108 are identical at 0.91. However, this value is higher than the mapped utility of preterm survivorsfound in the literature. Therefore, we opted to use the utility of severe persistent asthma from the study byCarroll and Downs108 as a proxy for the lifetime effects of RDS (0.85).
TABLE 46 Total discounted QALYs for preterm survivors, by gestational age
Gestational age(weeks)
Probability thatinfant survives thefirst year (based onONS 2015 data)186
Weighteddiscounted QALYsusing age andsurvival adjustments
Weighteddiscounted QALYsusing NICE method(=maximumQALYs × probabilityof infant being aliveafter the first year)
Weighteddiscounted QALYused in 2015NICE guidelines
24 0.5934 13.23 14.44 19.92
25 0.7621 16.99 18.55 20.89
26 0.8289 18.48 20.17 21.27
27 0.8917 19.88 21.70 21.69
28 0.9120 20.33 22.19 22.18
29 0.9544 21.27 23.23 22.44
30 0.9679 21.57 23.55 22.61
31 0.9733 21.69 23.69 22.52
32 0.9833 21.92 23.93 22.53
33 0.9870 22.00 24.02 22.58
34 0.9904 22.08 24.10 22.61
35 0.9916 22.10 24.13 N/A
36 0.9955 22.19 24.23 N/A
N/A, not applicable.NoteThe NICE guidelines model24 stops at 34 weeks’ gestational age, and therefore no NICE QALYs are reported for the35-week and 36-week gestational ages.
APPENDIX 5
NIHR Journals Library www.journalslibrary.nihr.ac.uk
198
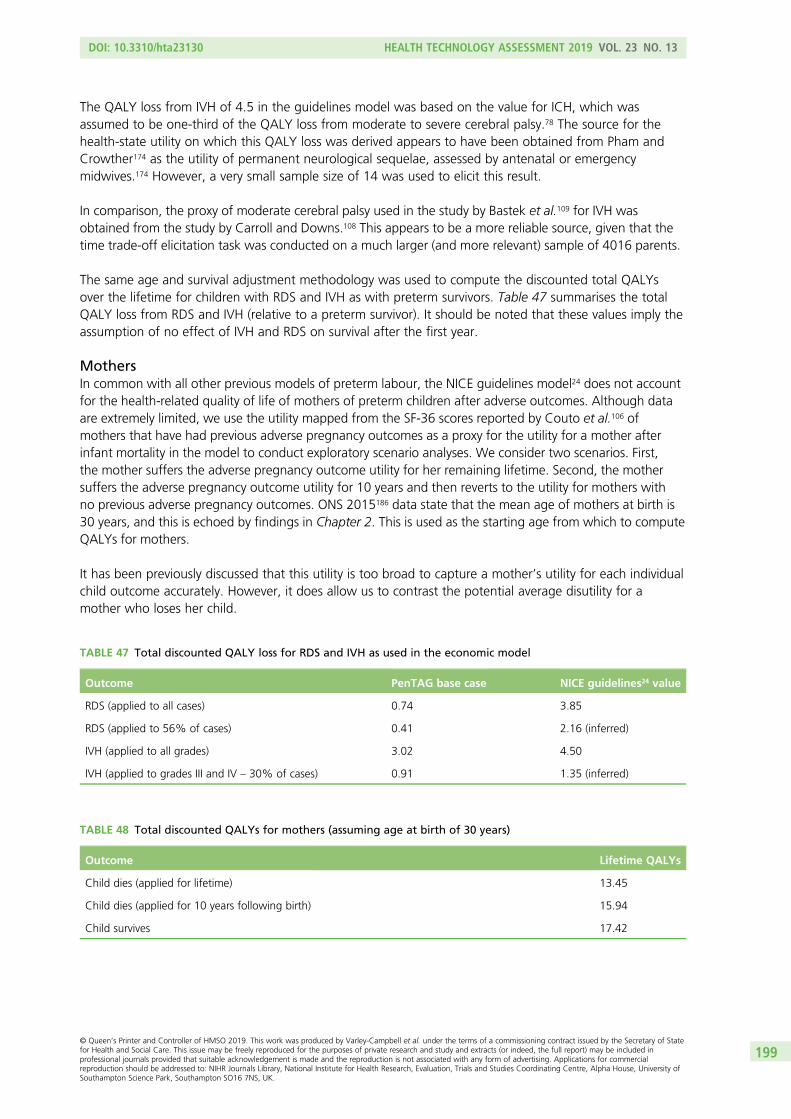
The QALY loss from IVH of 4.5 in the guidelines model was based on the value for ICH, which wasassumed to be one-third of the QALY loss from moderate to severe cerebral palsy.78 The source for thehealth-state utility on which this QALY loss was derived appears to have been obtained from Pham andCrowther174 as the utility of permanent neurological sequelae, assessed by antenatal or emergencymidwives.174 However, a very small sample size of 14 was used to elicit this result.
In comparison, the proxy of moderate cerebral palsy used in the study by Bastek et al.109 for IVH wasobtained from the study by Carroll and Downs.108 This appears to be a more reliable source, given that thetime trade-off elicitation task was conducted on a much larger (and more relevant) sample of 4016 parents.
The same age and survival adjustment methodology was used to compute the discounted total QALYsover the lifetime for children with RDS and IVH as with preterm survivors. Table 47 summarises the totalQALY loss from RDS and IVH (relative to a preterm survivor). It should be noted that these values imply theassumption of no effect of IVH and RDS on survival after the first year.
MothersIn common with all other previous models of preterm labour, the NICE guidelines model24 does not accountfor the health-related quality of life of mothers of preterm children after adverse outcomes. Although dataare extremely limited, we use the utility mapped from the SF-36 scores reported by Couto et al.106 ofmothers that have had previous adverse pregnancy outcomes as a proxy for the utility for a mother afterinfant mortality in the model to conduct exploratory scenario analyses. We consider two scenarios. First,the mother suffers the adverse pregnancy outcome utility for her remaining lifetime. Second, the mothersuffers the adverse pregnancy outcome utility for 10 years and then reverts to the utility for mothers withno previous adverse pregnancy outcomes. ONS 2015186 data state that the mean age of mothers at birth is30 years, and this is echoed by findings in Chapter 2. This is used as the starting age from which to computeQALYs for mothers.
It has been previously discussed that this utility is too broad to capture a mother’s utility for each individualchild outcome accurately. However, it does allow us to contrast the potential average disutility for amother who loses her child.
TABLE 47 Total discounted QALY loss for RDS and IVH as used in the economic model
Outcome PenTAG base case NICE guidelines24 value
RDS (applied to all cases) 0.74 3.85
RDS (applied to 56% of cases) 0.41 2.16 (inferred)
IVH (applied to all grades) 3.02 4.50
IVH (applied to grades III and IV – 30% of cases) 0.91 1.35 (inferred)
TABLE 48 Total discounted QALYs for mothers (assuming age at birth of 30 years)
Outcome Lifetime QALYs
Child dies (applied for lifetime) 13.45
Child dies (applied for 10 years following birth) 15.94
Child survives 17.42
DOI: 10.3310/hta23130 HEALTH TECHNOLOGY ASSESSMENT 2019 VOL. 23 NO. 13
© Queen’s Printer and Controller of HMSO 2019. This work was produced by Varley-Campbell et al. under the terms of a commissioning contract issued by the Secretary of Statefor Health and Social Care. This issue may be freely reproduced for the purposes of private research and study and extracts (or indeed, the full report) may be included inprofessional journals provided that suitable acknowledgement is made and the reproduction is not associated with any form of advertising. Applications for commercialreproduction should be addressed to: NIHR Journals Library, National Institute for Health Research, Evaluation, Trials and Studies Coordinating Centre, Alpha House, University ofSouthampton Science Park, Southampton SO16 7NS, UK.
199

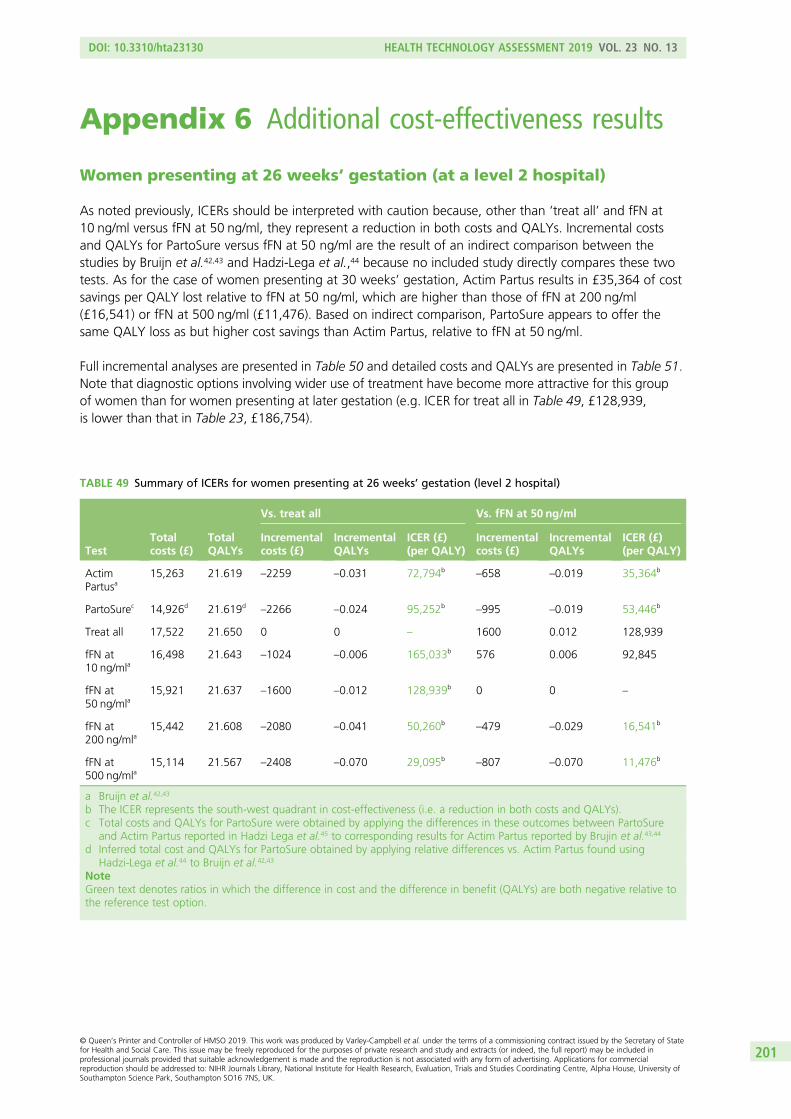
Appendix 6 Additional cost-effectiveness results
Women presenting at 26 weeks’ gestation (at a level 2 hospital)
As noted previously, ICERs should be interpreted with caution because, other than ‘treat all’ and fFN at10 ng/ml versus fFN at 50 ng/ml, they represent a reduction in both costs and QALYs. Incremental costsand QALYs for PartoSure versus fFN at 50 ng/ml are the result of an indirect comparison between thestudies by Bruijn et al.42,43 and Hadzi-Lega et al.,44 because no included study directly compares these twotests. As for the case of women presenting at 30 weeks’ gestation, Actim Partus results in £35,364 of costsavings per QALY lost relative to fFN at 50 ng/ml, which are higher than those of fFN at 200 ng/ml(£16,541) or fFN at 500 ng/ml (£11,476). Based on indirect comparison, PartoSure appears to offer thesame QALY loss as but higher cost savings than Actim Partus, relative to fFN at 50 ng/ml.
Full incremental analyses are presented in Table 50 and detailed costs and QALYs are presented in Table 51.Note that diagnostic options involving wider use of treatment have become more attractive for this groupof women than for women presenting at later gestation (e.g. ICER for treat all in Table 49, £128,939,is lower than that in Table 23, £186,754).
TABLE 49 Summary of ICERs for women presenting at 26 weeks’ gestation (level 2 hospital)
TestTotalcosts (£)
TotalQALYs
Vs. treat all Vs. fFN at 50 ng/ml
Incrementalcosts (£)
IncrementalQALYs
ICER (£)(per QALY)
Incrementalcosts (£)
IncrementalQALYs
ICER (£)(per QALY)
ActimPartusa
15,263 21.619 –2259 –0.031 72,794b–658 –0.019 35,364b
PartoSurec 14,926d 21.619d–2266 –0.024 95,252b
–995 –0.019 53,446b
Treat all 17,522 21.650 0 0 – 1600 0.012 128,939
fFN at10 ng/mla
16,498 21.643 –1024 –0.006 165,033b 576 0.006 92,845
fFN at50 ng/mla
15,921 21.637 –1600 –0.012 128,939b 0 0 –
fFN at200 ng/mla
15,442 21.608 –2080 –0.041 50,260b–479 –0.029 16,541b
fFN at500 ng/mla
15,114 21.567 –2408 –0.070 29,095b–807 –0.070 11,476b
a Bruijn et al.42,43
b The ICER represents the south-west quadrant in cost-effectiveness (i.e. a reduction in both costs and QALYs).c Total costs and QALYs for PartoSure were obtained by applying the differences in these outcomes between PartoSure
and Actim Partus reported in Hadzi Lega et al.45 to corresponding results for Actim Partus reported by Brujin et al.43,44
d Inferred total cost and QALYs for PartoSure obtained by applying relative differences vs. Actim Partus found usingHadzi-Lega et al.44 to Bruijn et al.42,43
NoteGreen text denotes ratios in which the difference in cost and the difference in benefit (QALYs) are both negative relative tothe reference test option.
DOI: 10.3310/hta23130 HEALTH TECHNOLOGY ASSESSMENT 2019 VOL. 23 NO. 13
© Queen’s Printer and Controller of HMSO 2019. This work was produced by Varley-Campbell et al. under the terms of a commissioning contract issued by the Secretary of Statefor Health and Social Care. This issue may be freely reproduced for the purposes of private research and study and extracts (or indeed, the full report) may be included inprofessional journals provided that suitable acknowledgement is made and the reproduction is not associated with any form of advertising. Applications for commercialreproduction should be addressed to: NIHR Journals Library, National Institute for Health Research, Evaluation, Trials and Studies Coordinating Centre, Alpha House, University ofSouthampton Science Park, Southampton SO16 7NS, UK.
201
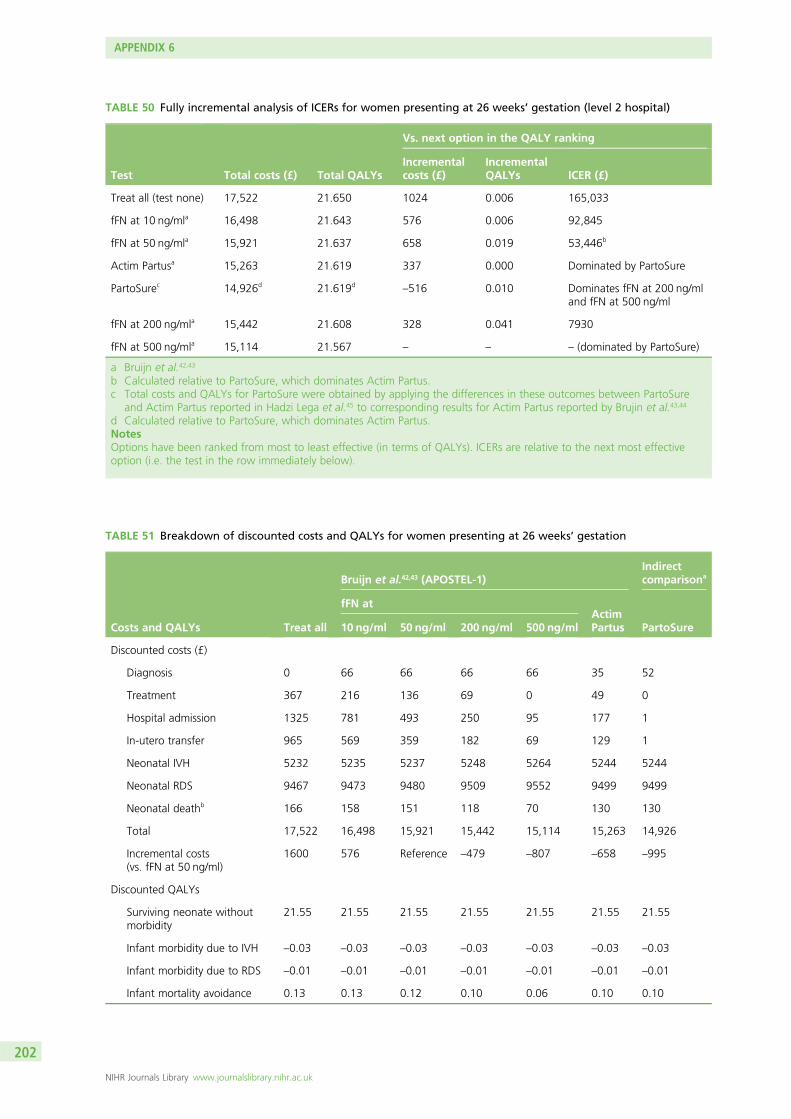
TABLE 50 Fully incremental analysis of ICERs for women presenting at 26 weeks’ gestation (level 2 hospital)
Test Total costs (£) Total QALYs
Vs. next option in the QALY ranking
Incrementalcosts (£)
IncrementalQALYs ICER (£)
Treat all (test none) 17,522 21.650 1024 0.006 165,033
fFN at 10 ng/mla 16,498 21.643 576 0.006 92,845
fFN at 50 ng/mla 15,921 21.637 658 0.019 53,446b
Actim Partusa 15,263 21.619 337 0.000 Dominated by PartoSure
PartoSurec 14,926d 21.619d–516 0.010 Dominates fFN at 200 ng/ml
and fFN at 500 ng/ml
fFN at 200 ng/mla 15,442 21.608 328 0.041 7930
fFN at 500 ng/mla 15,114 21.567 – – – (dominated by PartoSure)
a Bruijn et al.42,43
b Calculated relative to PartoSure, which dominates Actim Partus.c Total costs and QALYs for PartoSure were obtained by applying the differences in these outcomes between PartoSure
and Actim Partus reported in Hadzi Lega et al.45 to corresponding results for Actim Partus reported by Brujin et al.43,44
d Calculated relative to PartoSure, which dominates Actim Partus.NotesOptions have been ranked from most to least effective (in terms of QALYs). ICERs are relative to the next most effectiveoption (i.e. the test in the row immediately below).
TABLE 51 Breakdown of discounted costs and QALYs for women presenting at 26 weeks’ gestation
Costs and QALYs Treat all
Bruijn et al.42,43 (APOSTEL-1)Indirectcomparisona
fFN atActimPartus PartoSure10 ng/ml 50 ng/ml 200 ng/ml 500 ng/ml
Discounted costs (£)
Diagnosis 0 66 66 66 66 35 52
Treatment 367 216 136 69 0 49 0
Hospital admission 1325 781 493 250 95 177 1
In-utero transfer 965 569 359 182 69 129 1
Neonatal IVH 5232 5235 5237 5248 5264 5244 5244
Neonatal RDS 9467 9473 9480 9509 9552 9499 9499
Neonatal deathb 166 158 151 118 70 130 130
Total 17,522 16,498 15,921 15,442 15,114 15,263 14,926
Incremental costs(vs. fFN at 50 ng/ml)
1600 576 Reference –479 –807 –658 –995
Discounted QALYs
Surviving neonate withoutmorbidity
21.55 21.55 21.55 21.55 21.55 21.55 21.55
Infant morbidity due to IVH –0.03 –0.03 –0.03 –0.03 –0.03 –0.03 –0.03
Infant morbidity due to RDS –0.01 –0.01 –0.01 –0.01 –0.01 –0.01 –0.01
Infant mortality avoidance 0.13 0.13 0.12 0.10 0.06 0.10 0.10
APPENDIX 6
NIHR Journals Library www.journalslibrary.nihr.ac.uk
202
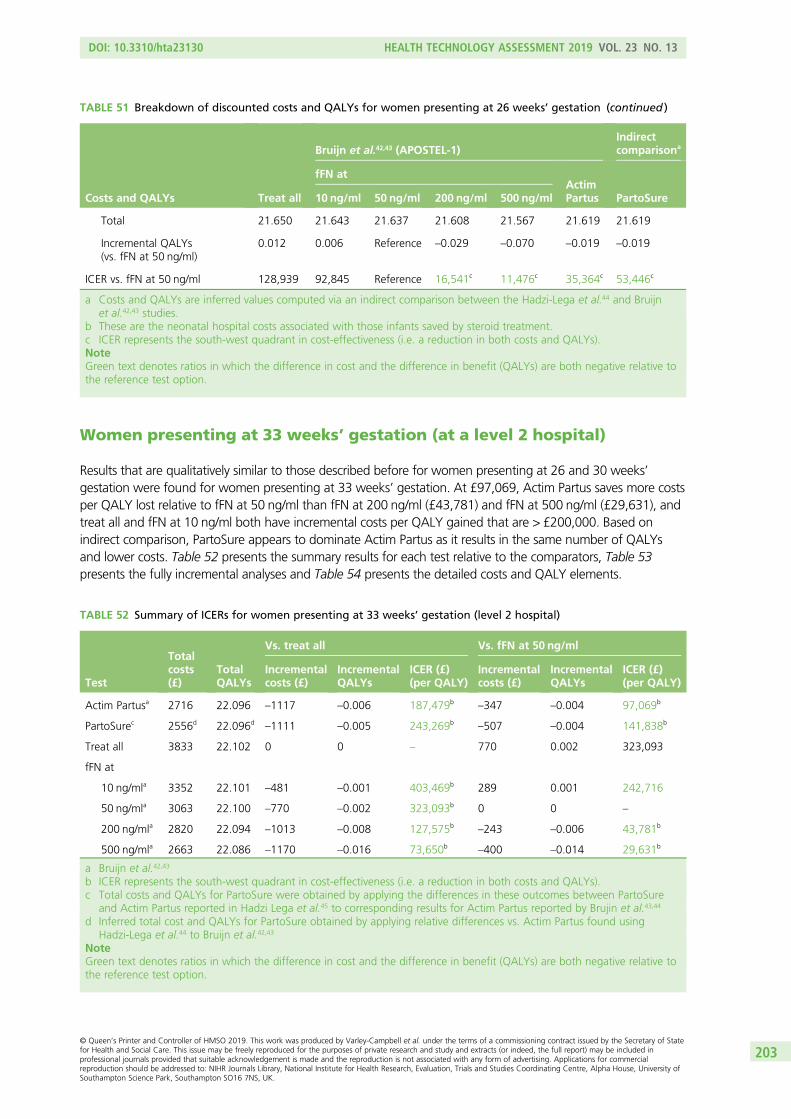
Women presenting at 33 weeks’ gestation (at a level 2 hospital)
Results that are qualitatively similar to those described before for women presenting at 26 and 30 weeks’gestation were found for women presenting at 33 weeks’ gestation. At £97,069, Actim Partus saves more costsper QALY lost relative to fFN at 50 ng/ml than fFN at 200 ng/ml (£43,781) and fFN at 500 ng/ml (£29,631), andtreat all and fFN at 10 ng/ml both have incremental costs per QALY gained that are > £200,000. Based onindirect comparison, PartoSure appears to dominate Actim Partus as it results in the same number of QALYsand lower costs. Table 52 presents the summary results for each test relative to the comparators, Table 53presents the fully incremental analyses and Table 54 presents the detailed costs and QALY elements.
TABLE 52 Summary of ICERs for women presenting at 33 weeks’ gestation (level 2 hospital)
Test
Totalcosts(£)
TotalQALYs
Vs. treat all Vs. fFN at 50 ng/ml
Incrementalcosts (£)
IncrementalQALYs
ICER (£)(per QALY)
Incrementalcosts (£)
IncrementalQALYs
ICER (£)(per QALY)
Actim Partusa 2716 22.096 –1117 –0.006 187,479b–347 –0.004 97,069b
PartoSurec 2556d 22.096d–1111 –0.005 243,269b
–507 –0.004 141,838b
Treat all 3833 22.102 0 0 – 770 0.002 323,093
fFN at
10 ng/mla 3352 22.101 –481 –0.001 403,469b 289 0.001 242,716
50 ng/mla 3063 22.100 –770 –0.002 323,093b 0 0 –
200 ng/mla 2820 22.094 –1013 –0.008 127,575b–243 –0.006 43,781b
500 ng/mla 2663 22.086 –1170 –0.016 73,650b–400 –0.014 29,631b
a Bruijn et al.42,43
b ICER represents the south-west quadrant in cost-effectiveness (i.e. a reduction in both costs and QALYs).c Total costs and QALYs for PartoSure were obtained by applying the differences in these outcomes between PartoSure
and Actim Partus reported in Hadzi Lega et al.45 to corresponding results for Actim Partus reported by Brujin et al.43,44
d Inferred total cost and QALYs for PartoSure obtained by applying relative differences vs. Actim Partus found usingHadzi-Lega et al.44 to Bruijn et al.42,43
NoteGreen text denotes ratios in which the difference in cost and the difference in benefit (QALYs) are both negative relative tothe reference test option.
TABLE 51 Breakdown of discounted costs and QALYs for women presenting at 26 weeks’ gestation (continued )
Costs and QALYs Treat all
Bruijn et al.42,43 (APOSTEL-1)Indirectcomparisona
fFN atActimPartus PartoSure10 ng/ml 50 ng/ml 200 ng/ml 500 ng/ml
Total 21.650 21.643 21.637 21.608 21.567 21.619 21.619
Incremental QALYs(vs. fFN at 50 ng/ml)
0.012 0.006 Reference –0.029 –0.070 –0.019 –0.019
ICER vs. fFN at 50 ng/ml 128,939 92,845 Reference 16,541c 11,476c 35,364c 53,446c
a Costs and QALYs are inferred values computed via an indirect comparison between the Hadzi-Lega et al.44 and Bruijnet al.42,43 studies.
b These are the neonatal hospital costs associated with those infants saved by steroid treatment.c ICER represents the south-west quadrant in cost-effectiveness (i.e. a reduction in both costs and QALYs).NoteGreen text denotes ratios in which the difference in cost and the difference in benefit (QALYs) are both negative relative tothe reference test option.
DOI: 10.3310/hta23130 HEALTH TECHNOLOGY ASSESSMENT 2019 VOL. 23 NO. 13
© Queen’s Printer and Controller of HMSO 2019. This work was produced by Varley-Campbell et al. under the terms of a commissioning contract issued by the Secretary of Statefor Health and Social Care. This issue may be freely reproduced for the purposes of private research and study and extracts (or indeed, the full report) may be included inprofessional journals provided that suitable acknowledgement is made and the reproduction is not associated with any form of advertising. Applications for commercialreproduction should be addressed to: NIHR Journals Library, National Institute for Health Research, Evaluation, Trials and Studies Coordinating Centre, Alpha House, University ofSouthampton Science Park, Southampton SO16 7NS, UK.
203
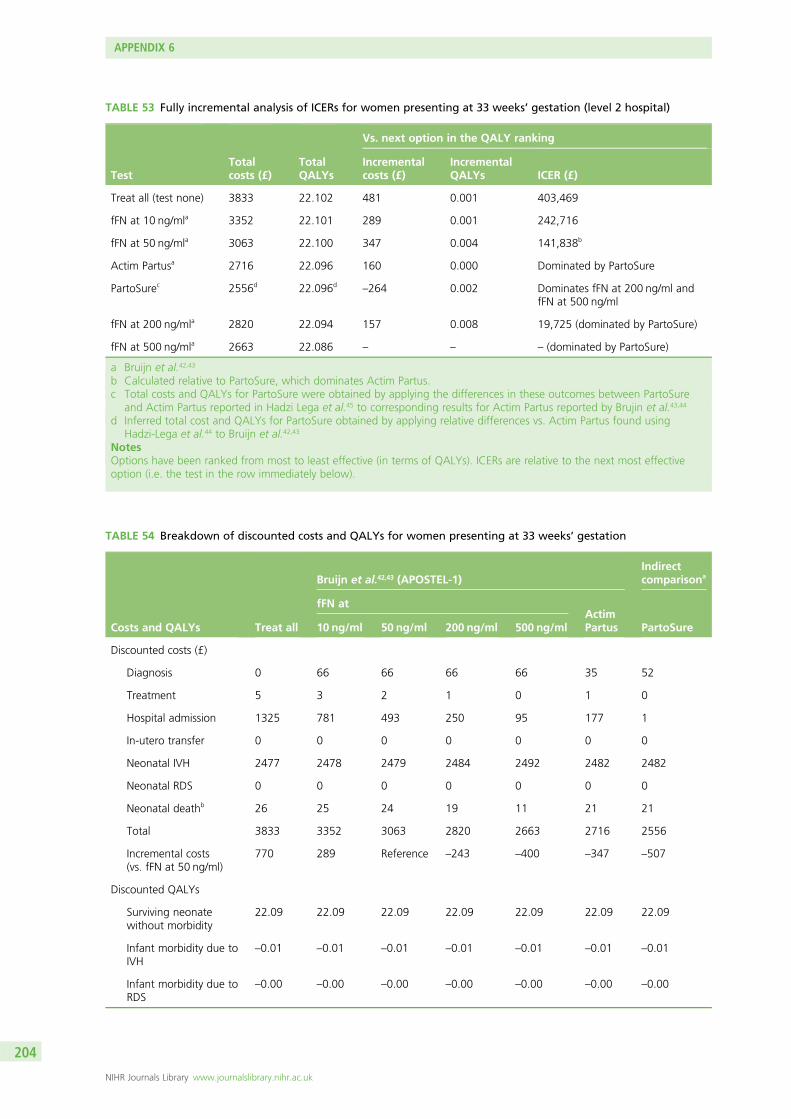
TABLE 53 Fully incremental analysis of ICERs for women presenting at 33 weeks’ gestation (level 2 hospital)
TestTotalcosts (£)
TotalQALYs
Vs. next option in the QALY ranking
Incrementalcosts (£)
IncrementalQALYs ICER (£)
Treat all (test none) 3833 22.102 481 0.001 403,469
fFN at 10 ng/mla 3352 22.101 289 0.001 242,716
fFN at 50 ng/mla 3063 22.100 347 0.004 141,838b
Actim Partusa 2716 22.096 160 0.000 Dominated by PartoSure
PartoSurec 2556d 22.096d–264 0.002 Dominates fFN at 200 ng/ml and
fFN at 500 ng/ml
fFN at 200 ng/mla 2820 22.094 157 0.008 19,725 (dominated by PartoSure)
fFN at 500 ng/mla 2663 22.086 – – – (dominated by PartoSure)
a Bruijn et al.42,43
b Calculated relative to PartoSure, which dominates Actim Partus.c Total costs and QALYs for PartoSure were obtained by applying the differences in these outcomes between PartoSure
and Actim Partus reported in Hadzi Lega et al.45 to corresponding results for Actim Partus reported by Brujin et al.43,44
d Inferred total cost and QALYs for PartoSure obtained by applying relative differences vs. Actim Partus found usingHadzi-Lega et al.44 to Bruijn et al.42,43
NotesOptions have been ranked from most to least effective (in terms of QALYs). ICERs are relative to the next most effectiveoption (i.e. the test in the row immediately below).
TABLE 54 Breakdown of discounted costs and QALYs for women presenting at 33 weeks’ gestation
Costs and QALYs Treat all
Bruijn et al.42,43 (APOSTEL-1)Indirectcomparisona
fFN atActimPartus PartoSure10 ng/ml 50 ng/ml 200 ng/ml 500 ng/ml
Discounted costs (£)
Diagnosis 0 66 66 66 66 35 52
Treatment 5 3 2 1 0 1 0
Hospital admission 1325 781 493 250 95 177 1
In-utero transfer 0 0 0 0 0 0 0
Neonatal IVH 2477 2478 2479 2484 2492 2482 2482
Neonatal RDS 0 0 0 0 0 0 0
Neonatal deathb 26 25 24 19 11 21 21
Total 3833 3352 3063 2820 2663 2716 2556
Incremental costs(vs. fFN at 50 ng/ml)
770 289 Reference –243 –400 –347 –507
Discounted QALYs
Surviving neonatewithout morbidity
22.09 22.09 22.09 22.09 22.09 22.09 22.09
Infant morbidity due toIVH
–0.01 –0.01 –0.01 –0.01 –0.01 –0.01 –0.01
Infant morbidity due toRDS
–0.00 –0.00 –0.00 –0.00 –0.00 –0.00 –0.00
APPENDIX 6
NIHR Journals Library www.journalslibrary.nihr.ac.uk
204
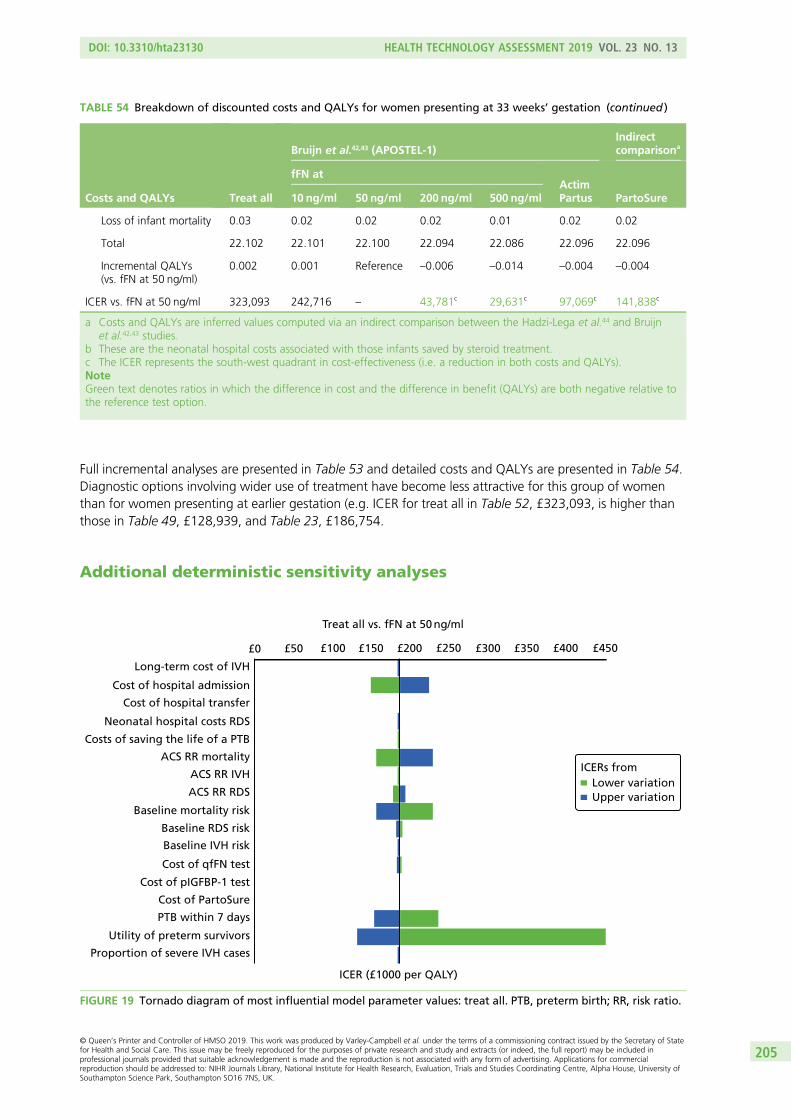
Full incremental analyses are presented in Table 53 and detailed costs and QALYs are presented in Table 54.Diagnostic options involving wider use of treatment have become less attractive for this group of womenthan for women presenting at earlier gestation (e.g. ICER for treat all in Table 52, £323,093, is higher thanthose in Table 49, £128,939, and Table 23, £186,754.
Additional deterministic sensitivity analyses
Treat all vs. fFN at 50 ng/ml
Long-term cost of IVH
Cost of hospital admission
Cost of hospital transfer
Neonatal hospital costs RDS
Costs of saving the life of a PTB
ACS RR mortality
ACS RR IVH
ACS RR RDS
Baseline mortality risk
Baseline RDS risk
Baseline IVH risk
Cost of qfFN test
Cost of pIGFBP-1 test
Cost of PartoSure
PTB within 7 days
Utility of preterm survivors
Proportion of severe IVH cases
ICER (£1000 per QALY)
Lower variationUpper variation
£0 £50 £100 £150 £200 £250 £300 £350 £400 £450
ICERs from
FIGURE 19 Tornado diagram of most influential model parameter values: treat all. PTB, preterm birth; RR, risk ratio.
TABLE 54 Breakdown of discounted costs and QALYs for women presenting at 33 weeks’ gestation (continued )
Costs and QALYs Treat all
Bruijn et al.42,43 (APOSTEL-1)Indirectcomparisona
fFN atActimPartus PartoSure10 ng/ml 50 ng/ml 200 ng/ml 500 ng/ml
Loss of infant mortality 0.03 0.02 0.02 0.02 0.01 0.02 0.02
Total 22.102 22.101 22.100 22.094 22.086 22.096 22.096
Incremental QALYs(vs. fFN at 50 ng/ml)
0.002 0.001 Reference –0.006 –0.014 –0.004 –0.004
ICER vs. fFN at 50 ng/ml 323,093 242,716 – 43,781c 29,631c 97,069c 141,838c
a Costs and QALYs are inferred values computed via an indirect comparison between the Hadzi-Lega et al.44 and Bruijnet al.42,43 studies.
b These are the neonatal hospital costs associated with those infants saved by steroid treatment.c The ICER represents the south-west quadrant in cost-effectiveness (i.e. a reduction in both costs and QALYs).NoteGreen text denotes ratios in which the difference in cost and the difference in benefit (QALYs) are both negative relative tothe reference test option.
DOI: 10.3310/hta23130 HEALTH TECHNOLOGY ASSESSMENT 2019 VOL. 23 NO. 13
© Queen’s Printer and Controller of HMSO 2019. This work was produced by Varley-Campbell et al. under the terms of a commissioning contract issued by the Secretary of Statefor Health and Social Care. This issue may be freely reproduced for the purposes of private research and study and extracts (or indeed, the full report) may be included inprofessional journals provided that suitable acknowledgement is made and the reproduction is not associated with any form of advertising. Applications for commercialreproduction should be addressed to: NIHR Journals Library, National Institute for Health Research, Evaluation, Trials and Studies Coordinating Centre, Alpha House, University ofSouthampton Science Park, Southampton SO16 7NS, UK.
205
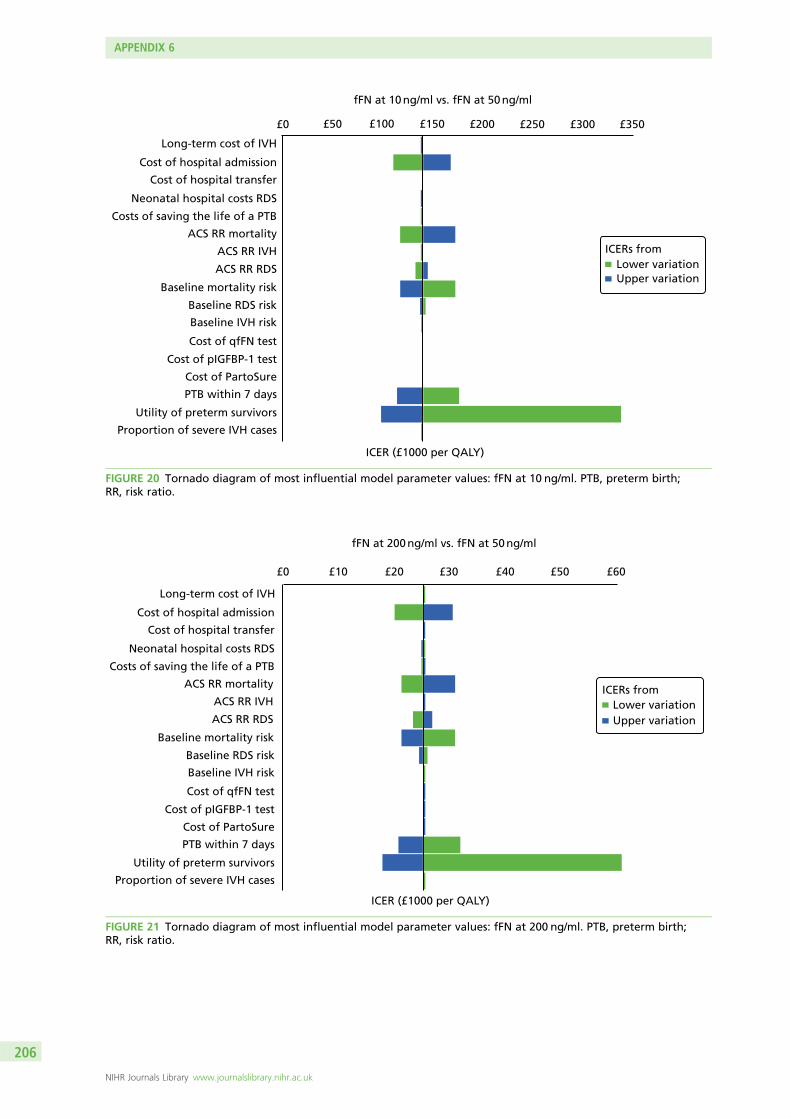
fFN at 10 ng/ml vs. fFN at 50 ng/ml
Long-term cost of IVH
Cost of hospital admission
Cost of hospital transfer
Neonatal hospital costs RDS
Costs of saving the life of a PTB
ACS RR mortality
ACS RR IVH
ACS RR RDS
Baseline mortality risk
Baseline RDS risk
Baseline IVH risk
Cost of qfFN test
Cost of pIGFBP-1 test
Cost of PartoSure
PTB within 7 days
Utility of preterm survivors
Proportion of severe IVH cases
ICER (£1000 per QALY)
Lower variationUpper variation
£0 £50 £100 £150 £200 £250 £300 £350
ICERs from
FIGURE 20 Tornado diagram of most influential model parameter values: fFN at 10 ng/ml. PTB, preterm birth;RR, risk ratio.
fFN at 200 ng/ml vs. fFN at 50 ng/ml
Long-term cost of IVH
Cost of hospital admission
Cost of hospital transfer
Neonatal hospital costs RDS
Costs of saving the life of a PTB
ACS RR mortality
ACS RR IVH
ACS RR RDS
Baseline mortality risk
Baseline RDS risk
Baseline IVH risk
Cost of qfFN test
Cost of pIGFBP-1 test
Cost of PartoSure
PTB within 7 days
Utility of preterm survivors
Proportion of severe IVH cases
ICER (£1000 per QALY)
Lower variationUpper variation
£0 £10 £20 £30 £40 £50 £60
ICERs from
FIGURE 21 Tornado diagram of most influential model parameter values: fFN at 200 ng/ml. PTB, preterm birth;RR, risk ratio.
APPENDIX 6
NIHR Journals Library www.journalslibrary.nihr.ac.uk
206
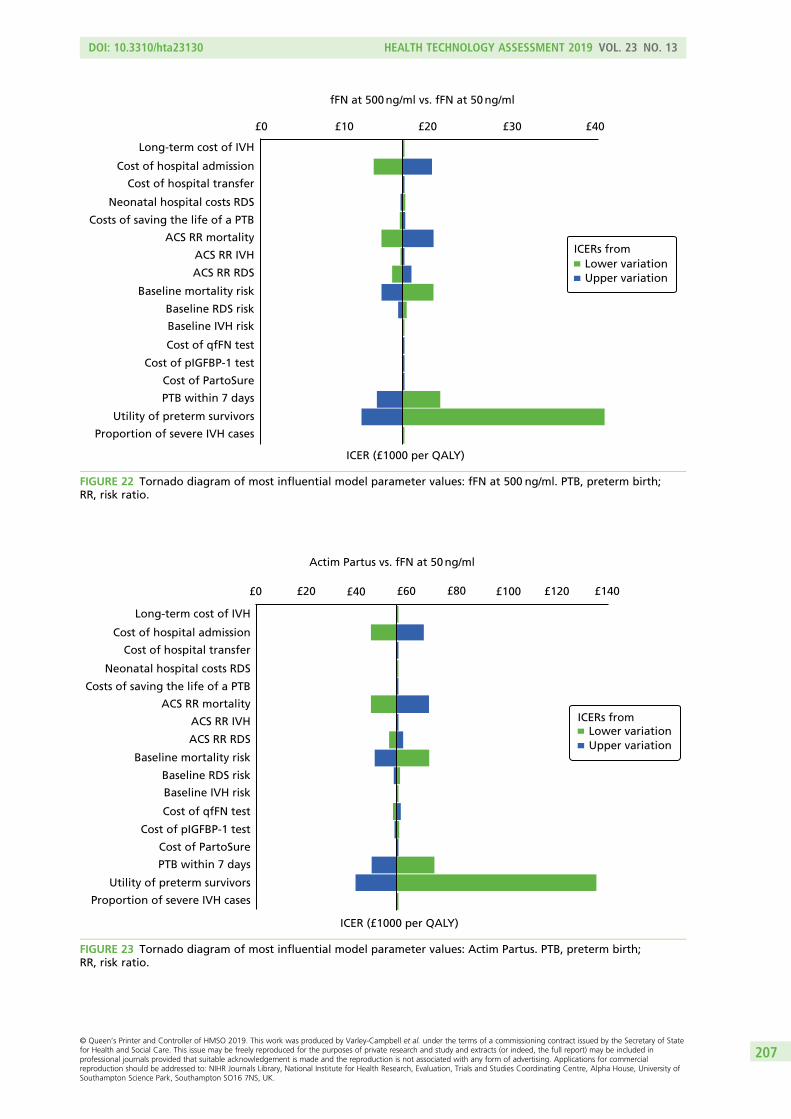
fFN at 500 ng/ml vs. fFN at 50 ng/ml
Long-term cost of IVH
Cost of hospital admission
Cost of hospital transfer
Neonatal hospital costs RDS
Costs of saving the life of a PTB
ACS RR mortality
ACS RR IVH
ACS RR RDS
Baseline mortality risk
Baseline RDS risk
Baseline IVH risk
Cost of qfFN test
Cost of pIGFBP-1 test
Cost of PartoSure
PTB within 7 days
Utility of preterm survivors
Proportion of severe IVH cases
ICER (£1000 per QALY)
Lower variationUpper variation
£0 £10 £20 £30 £40
ICERs from
FIGURE 22 Tornado diagram of most influential model parameter values: fFN at 500 ng/ml. PTB, preterm birth;RR, risk ratio.
Actim Partus vs. fFN at 50 ng/ml
Long-term cost of IVH
Cost of hospital admission
Cost of hospital transfer
Neonatal hospital costs RDS
Costs of saving the life of a PTB
ACS RR mortality
ACS RR IVH
ACS RR RDS
Baseline mortality risk
Baseline RDS risk
Baseline IVH risk
Cost of qfFN test
Cost of pIGFBP-1 test
Cost of PartoSure
PTB within 7 days
Utility of preterm survivors
Proportion of severe IVH cases
ICER (£1000 per QALY)
£0 £20 £40 £60 £80 £100 £120 £140
Lower variationUpper variation
ICERs from
FIGURE 23 Tornado diagram of most influential model parameter values: Actim Partus. PTB, preterm birth;RR, risk ratio.
DOI: 10.3310/hta23130 HEALTH TECHNOLOGY ASSESSMENT 2019 VOL. 23 NO. 13
© Queen’s Printer and Controller of HMSO 2019. This work was produced by Varley-Campbell et al. under the terms of a commissioning contract issued by the Secretary of Statefor Health and Social Care. This issue may be freely reproduced for the purposes of private research and study and extracts (or indeed, the full report) may be included inprofessional journals provided that suitable acknowledgement is made and the reproduction is not associated with any form of advertising. Applications for commercialreproduction should be addressed to: NIHR Journals Library, National Institute for Health Research, Evaluation, Trials and Studies Coordinating Centre, Alpha House, University ofSouthampton Science Park, Southampton SO16 7NS, UK.
207
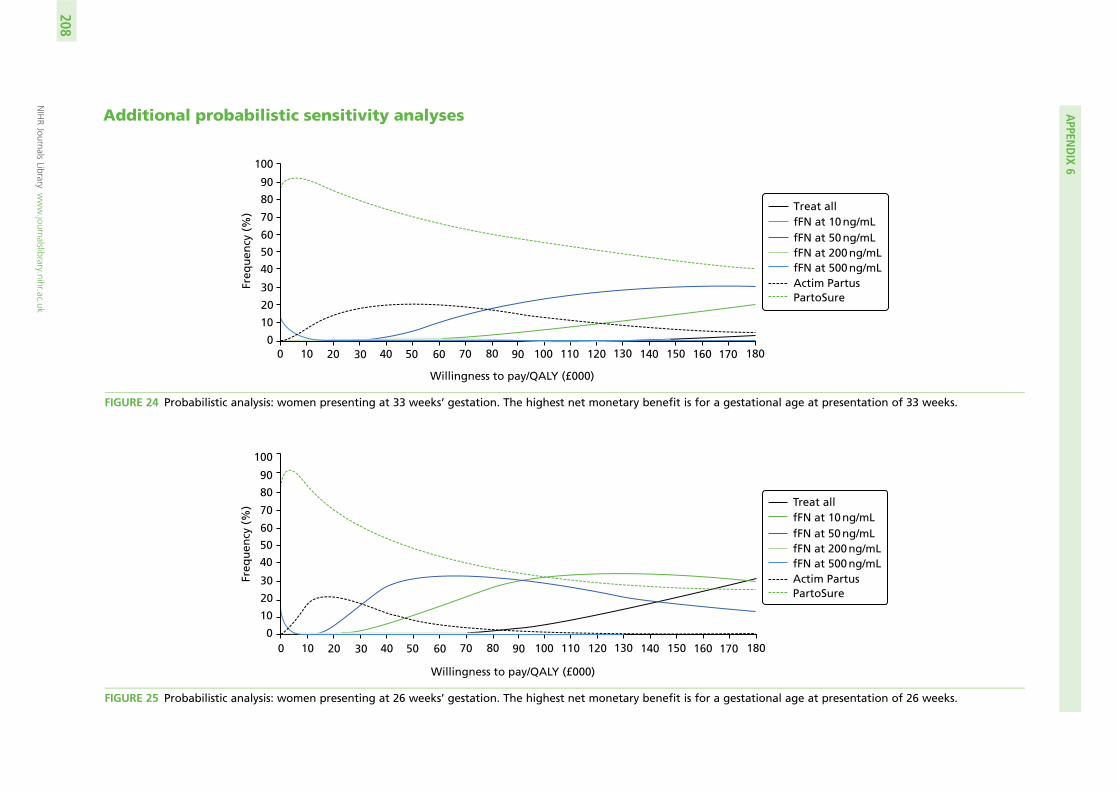
Additional probabilistic sensitivity analyses
Freq
uen
cy (
%)
100
90
80
70
60
50
40
30
20
10
00 10 20 30 40 50 60 70 80 90 100 110 120 130 140 150 160 170 180
Willingness to pay/QALY (£000)
Treat allfFN at 10 ng/mLfFN at 50 ng/mLfFN at 200 ng/mLfFN at 500 ng/mLActim PartusPartoSure
FIGURE 24 Probabilistic analysis: women presenting at 33 weeks’ gestation. The highest net monetary benefit is for a gestational age at presentation of 33 weeks.
Freq
uen
cy (
%)
100
90
80
70
60
50
40
30
20
10
00 10 20 30 40 50 60 70 80 90 100 110 120 130 140 150 160 170 180
Willingness to pay/QALY (£000)
Treat allfFN at 10 ng/mLfFN at 50 ng/mLfFN at 200 ng/mLfFN at 500 ng/mLActim PartusPartoSure
FIGURE 25 Probabilistic analysis: women presenting at 26 weeks’ gestation. The highest net monetary benefit is for a gestational age at presentation of 26 weeks.
APPEN
DIX
6
NIHRJournals
Librarywww.journalslibrary.nihr.ac.uk
208
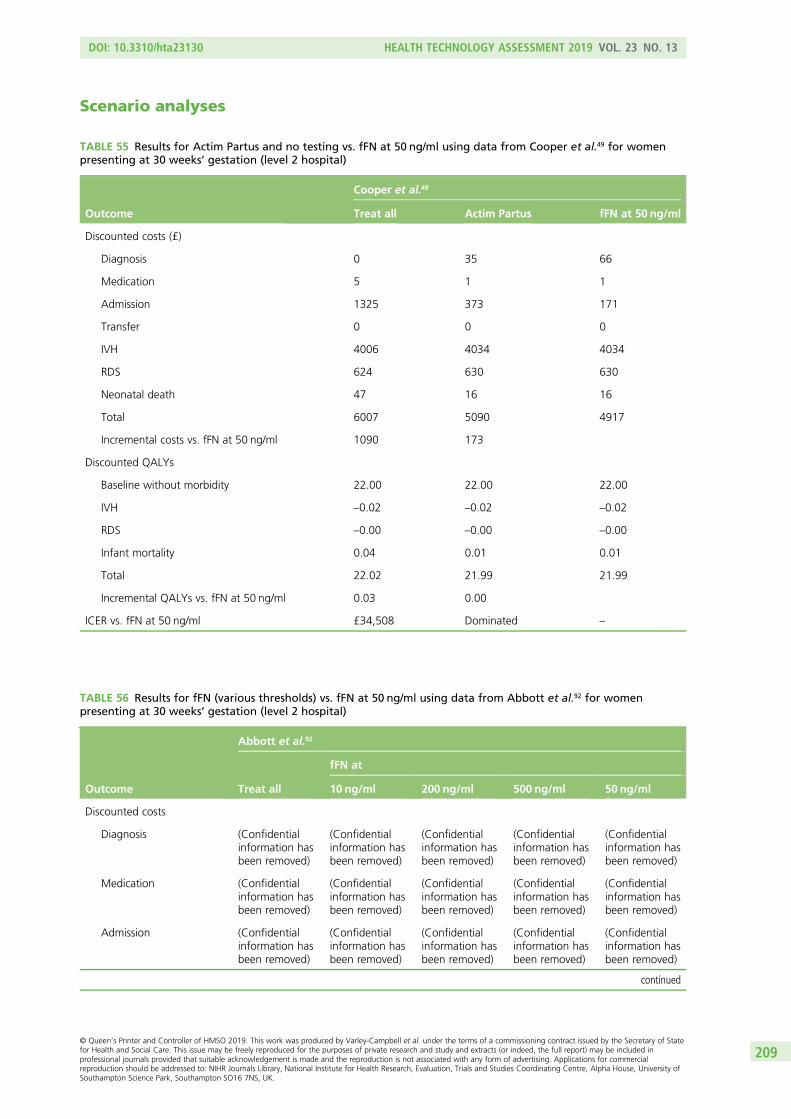
Scenario analyses
TABLE 55 Results for Actim Partus and no testing vs. fFN at 50 ng/ml using data from Cooper et al.49 for womenpresenting at 30 weeks’ gestation (level 2 hospital)
Outcome
Cooper et al.49
Treat all Actim Partus fFN at 50 ng/ml
Discounted costs (£)
Diagnosis 0 35 66
Medication 5 1 1
Admission 1325 373 171
Transfer 0 0 0
IVH 4006 4034 4034
RDS 624 630 630
Neonatal death 47 16 16
Total 6007 5090 4917
Incremental costs vs. fFN at 50 ng/ml 1090 173
Discounted QALYs
Baseline without morbidity 22.00 22.00 22.00
IVH –0.02 –0.02 –0.02
RDS –0.00 –0.00 –0.00
Infant mortality 0.04 0.01 0.01
Total 22.02 21.99 21.99
Incremental QALYs vs. fFN at 50 ng/ml 0.03 0.00
ICER vs. fFN at 50 ng/ml £34,508 Dominated –
TABLE 56 Results for fFN (various thresholds) vs. fFN at 50 ng/ml using data from Abbott et al.92 for womenpresenting at 30 weeks’ gestation (level 2 hospital)
Outcome
Abbott et al.92
Treat all
fFN at
10 ng/ml 200 ng/ml 500 ng/ml 50 ng/ml
Discounted costs
Diagnosis (Confidentialinformation hasbeen removed)
(Confidentialinformation hasbeen removed)
(Confidentialinformation hasbeen removed)
(Confidentialinformation hasbeen removed)
(Confidentialinformation hasbeen removed)
Medication (Confidentialinformation hasbeen removed)
(Confidentialinformation hasbeen removed)
(Confidentialinformation hasbeen removed)
(Confidentialinformation hasbeen removed)
(Confidentialinformation hasbeen removed)
Admission (Confidentialinformation hasbeen removed)
(Confidentialinformation hasbeen removed)
(Confidentialinformation hasbeen removed)
(Confidentialinformation hasbeen removed)
(Confidentialinformation hasbeen removed)
continued
DOI: 10.3310/hta23130 HEALTH TECHNOLOGY ASSESSMENT 2019 VOL. 23 NO. 13
© Queen’s Printer and Controller of HMSO 2019. This work was produced by Varley-Campbell et al. under the terms of a commissioning contract issued by the Secretary of Statefor Health and Social Care. This issue may be freely reproduced for the purposes of private research and study and extracts (or indeed, the full report) may be included inprofessional journals provided that suitable acknowledgement is made and the reproduction is not associated with any form of advertising. Applications for commercialreproduction should be addressed to: NIHR Journals Library, National Institute for Health Research, Evaluation, Trials and Studies Coordinating Centre, Alpha House, University ofSouthampton Science Park, Southampton SO16 7NS, UK.
209
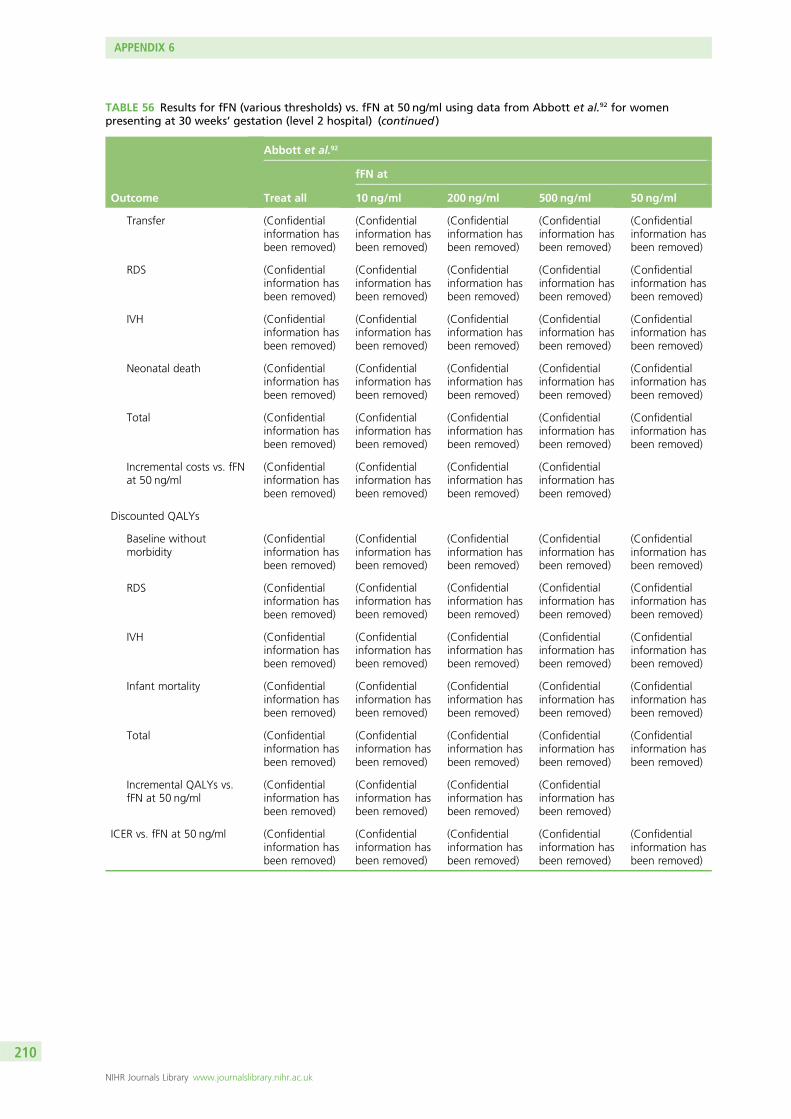
TABLE 56 Results for fFN (various thresholds) vs. fFN at 50 ng/ml using data from Abbott et al.92 for womenpresenting at 30 weeks’ gestation (level 2 hospital) (continued )
Outcome
Abbott et al.92
Treat all
fFN at
10 ng/ml 200 ng/ml 500 ng/ml 50 ng/ml
Transfer (Confidentialinformation hasbeen removed)
(Confidentialinformation hasbeen removed)
(Confidentialinformation hasbeen removed)
(Confidentialinformation hasbeen removed)
(Confidentialinformation hasbeen removed)
RDS (Confidentialinformation hasbeen removed)
(Confidentialinformation hasbeen removed)
(Confidentialinformation hasbeen removed)
(Confidentialinformation hasbeen removed)
(Confidentialinformation hasbeen removed)
IVH (Confidentialinformation hasbeen removed)
(Confidentialinformation hasbeen removed)
(Confidentialinformation hasbeen removed)
(Confidentialinformation hasbeen removed)
(Confidentialinformation hasbeen removed)
Neonatal death (Confidentialinformation hasbeen removed)
(Confidentialinformation hasbeen removed)
(Confidentialinformation hasbeen removed)
(Confidentialinformation hasbeen removed)
(Confidentialinformation hasbeen removed)
Total (Confidentialinformation hasbeen removed)
(Confidentialinformation hasbeen removed)
(Confidentialinformation hasbeen removed)
(Confidentialinformation hasbeen removed)
(Confidentialinformation hasbeen removed)
Incremental costs vs. fFNat 50 ng/ml
(Confidentialinformation hasbeen removed)
(Confidentialinformation hasbeen removed)
(Confidentialinformation hasbeen removed)
(Confidentialinformation hasbeen removed)
Discounted QALYs
Baseline withoutmorbidity
(Confidentialinformation hasbeen removed)
(Confidentialinformation hasbeen removed)
(Confidentialinformation hasbeen removed)
(Confidentialinformation hasbeen removed)
(Confidentialinformation hasbeen removed)
RDS (Confidentialinformation hasbeen removed)
(Confidentialinformation hasbeen removed)
(Confidentialinformation hasbeen removed)
(Confidentialinformation hasbeen removed)
(Confidentialinformation hasbeen removed)
IVH (Confidentialinformation hasbeen removed)
(Confidentialinformation hasbeen removed)
(Confidentialinformation hasbeen removed)
(Confidentialinformation hasbeen removed)
(Confidentialinformation hasbeen removed)
Infant mortality (Confidentialinformation hasbeen removed)
(Confidentialinformation hasbeen removed)
(Confidentialinformation hasbeen removed)
(Confidentialinformation hasbeen removed)
(Confidentialinformation hasbeen removed)
Total (Confidentialinformation hasbeen removed)
(Confidentialinformation hasbeen removed)
(Confidentialinformation hasbeen removed)
(Confidentialinformation hasbeen removed)
(Confidentialinformation hasbeen removed)
Incremental QALYs vs.fFN at 50 ng/ml
(Confidentialinformation hasbeen removed)
(Confidentialinformation hasbeen removed)
(Confidentialinformation hasbeen removed)
(Confidentialinformation hasbeen removed)
ICER vs. fFN at 50 ng/ml (Confidentialinformation hasbeen removed)
(Confidentialinformation hasbeen removed)
(Confidentialinformation hasbeen removed)
(Confidentialinformation hasbeen removed)
(Confidentialinformation hasbeen removed)
APPENDIX 6
NIHR Journals Library www.journalslibrary.nihr.ac.uk
210
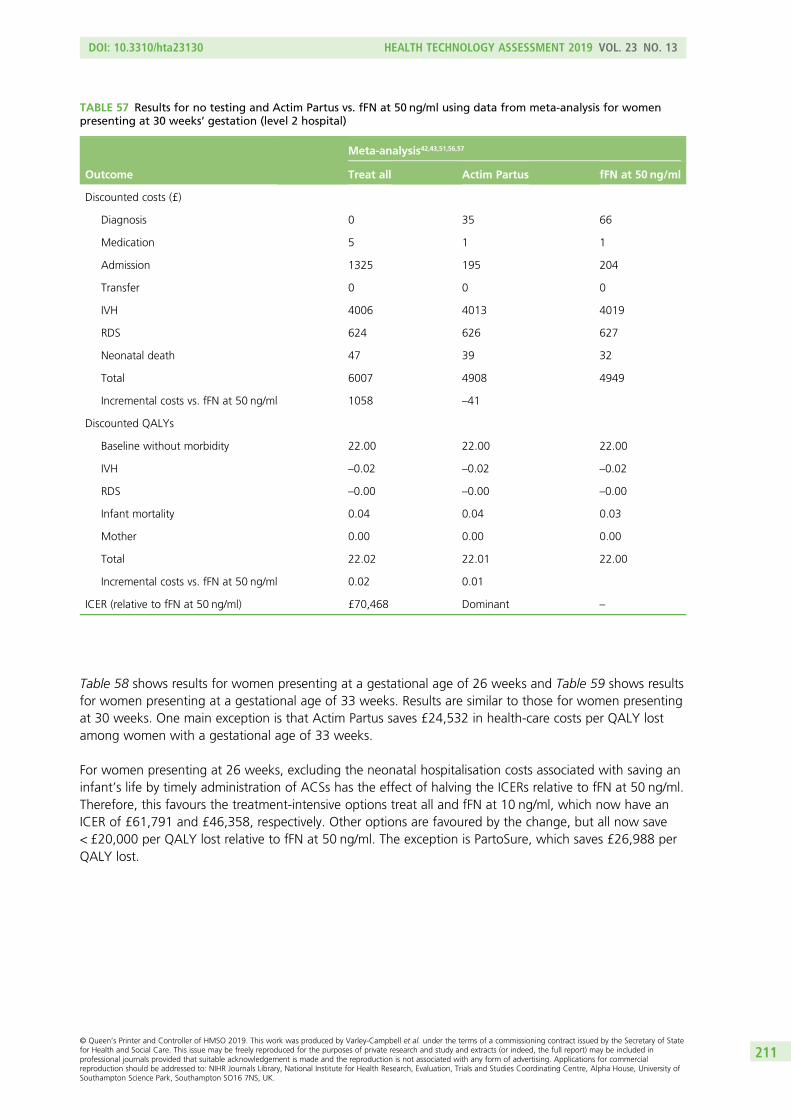
Table 58 shows results for women presenting at a gestational age of 26 weeks and Table 59 shows resultsfor women presenting at a gestational age of 33 weeks. Results are similar to those for women presentingat 30 weeks. One main exception is that Actim Partus saves £24,532 in health-care costs per QALY lostamong women with a gestational age of 33 weeks.
For women presenting at 26 weeks, excluding the neonatal hospitalisation costs associated with saving aninfant’s life by timely administration of ACSs has the effect of halving the ICERs relative to fFN at 50 ng/ml.Therefore, this favours the treatment-intensive options treat all and fFN at 10 ng/ml, which now have anICER of £61,791 and £46,358, respectively. Other options are favoured by the change, but all now save< £20,000 per QALY lost relative to fFN at 50 ng/ml. The exception is PartoSure, which saves £26,988 perQALY lost.
TABLE 57 Results for no testing and Actim Partus vs. fFN at 50 ng/ml using data from meta-analysis for womenpresenting at 30 weeks’ gestation (level 2 hospital)
Outcome
Meta-analysis42,43,51,56,57
Treat all Actim Partus fFN at 50 ng/ml
Discounted costs (£)
Diagnosis 0 35 66
Medication 5 1 1
Admission 1325 195 204
Transfer 0 0 0
IVH 4006 4013 4019
RDS 624 626 627
Neonatal death 47 39 32
Total 6007 4908 4949
Incremental costs vs. fFN at 50 ng/ml 1058 –41
Discounted QALYs
Baseline without morbidity 22.00 22.00 22.00
IVH –0.02 –0.02 –0.02
RDS –0.00 –0.00 –0.00
Infant mortality 0.04 0.04 0.03
Mother 0.00 0.00 0.00
Total 22.02 22.01 22.00
Incremental costs vs. fFN at 50 ng/ml 0.02 0.01
ICER (relative to fFN at 50 ng/ml) £70,468 Dominant –
DOI: 10.3310/hta23130 HEALTH TECHNOLOGY ASSESSMENT 2019 VOL. 23 NO. 13
© Queen’s Printer and Controller of HMSO 2019. This work was produced by Varley-Campbell et al. under the terms of a commissioning contract issued by the Secretary of Statefor Health and Social Care. This issue may be freely reproduced for the purposes of private research and study and extracts (or indeed, the full report) may be included inprofessional journals provided that suitable acknowledgement is made and the reproduction is not associated with any form of advertising. Applications for commercialreproduction should be addressed to: NIHR Journals Library, National Institute for Health Research, Evaluation, Trials and Studies Coordinating Centre, Alpha House, University ofSouthampton Science Park, Southampton SO16 7NS, UK.
211
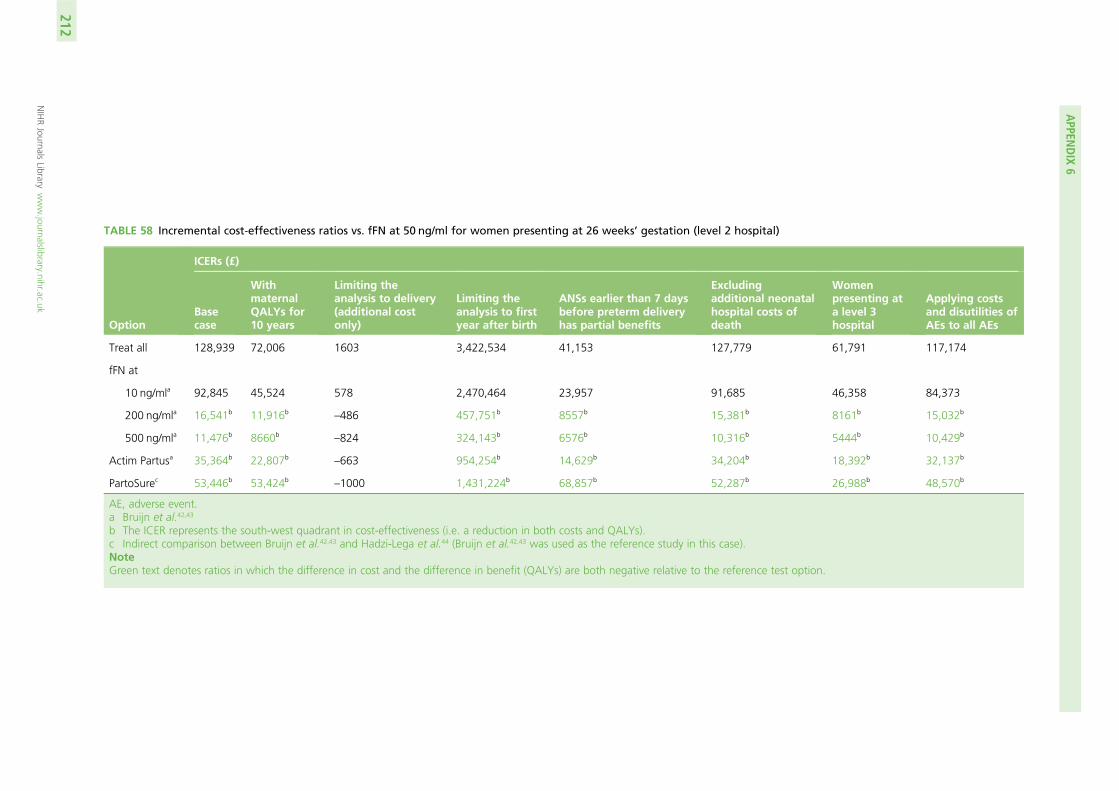
TABLE 58 Incremental cost-effectiveness ratios vs. fFN at 50 ng/ml for women presenting at 26 weeks’ gestation (level 2 hospital)
Option
ICERs (£)
Basecase
WithmaternalQALYs for10 years
Limiting theanalysis to delivery(additional costonly)
Limiting theanalysis to firstyear after birth
ANSs earlier than 7 daysbefore preterm deliveryhas partial benefits
Excludingadditional neonatalhospital costs ofdeath
Womenpresenting ata level 3hospital
Applying costsand disutilities ofAEs to all AEs
Treat all 128,939 72,006 1603 3,422,534 41,153 127,779 61,791 117,174
fFN at
10 ng/mla 92,845 45,524 578 2,470,464 23,957 91,685 46,358 84,373
200 ng/mla 16,541b 11,916b–486 457,751b 8557b 15,381b 8161b 15,032b
500 ng/mla 11,476b 8660b–824 324,143b 6576b 10,316b 5444b 10,429b
Actim Partusa 35,364b 22,807b–663 954,254b 14,629b 34,204b 18,392b 32,137b
PartoSurec 53,446b 53,424b–1000 1,431,224b 68,857b 52,287b 26,988b 48,570b
AE, adverse event.a Bruijn et al.42,43
b The ICER represents the south-west quadrant in cost-effectiveness (i.e. a reduction in both costs and QALYs).c Indirect comparison between Bruijn et al.42,43 and Hadzi-Lega et al.44 (Bruijn et al.42,43 was used as the reference study in this case).NoteGreen text denotes ratios in which the difference in cost and the difference in benefit (QALYs) are both negative relative to the reference test option.
APPEN
DIX
6
NIHRJournals
Librarywww.journalslibrary.nihr.ac.uk
212
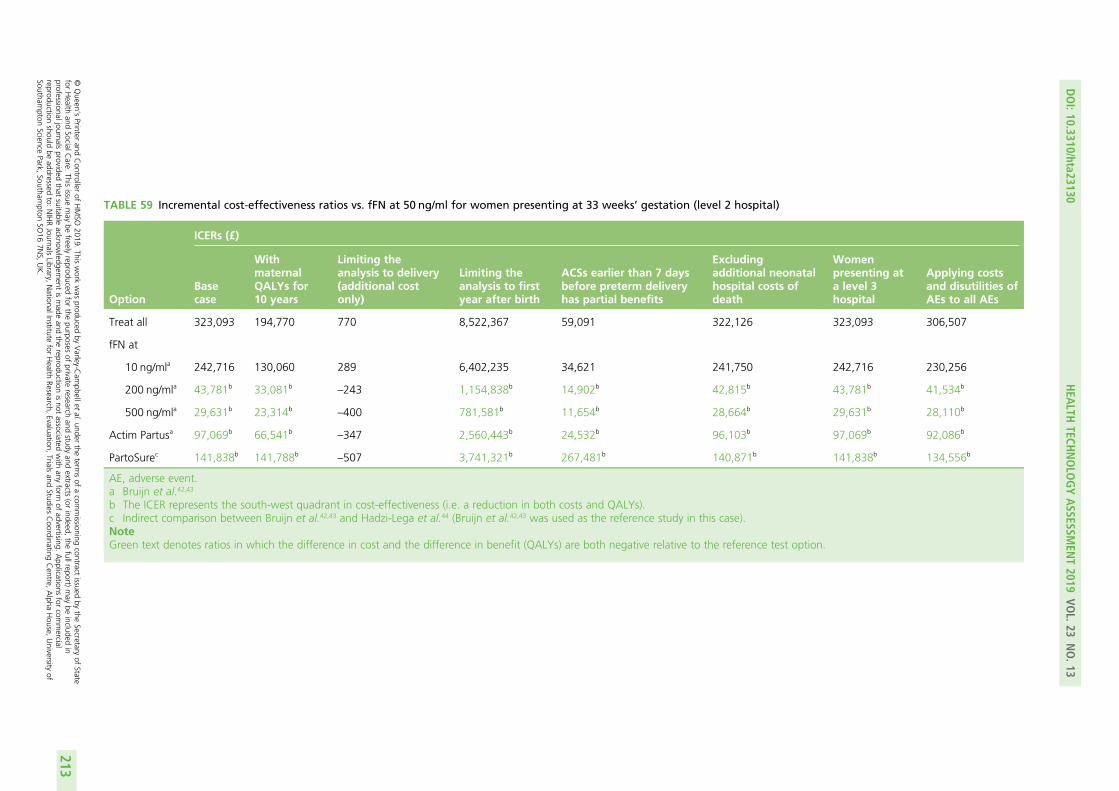
TABLE 59 Incremental cost-effectiveness ratios vs. fFN at 50 ng/ml for women presenting at 33 weeks’ gestation (level 2 hospital)
Option
ICERs (£)
Basecase
WithmaternalQALYs for10 years
Limiting theanalysis to delivery(additional costonly)
Limiting theanalysis to firstyear after birth
ACSs earlier than 7 daysbefore preterm deliveryhas partial benefits
Excludingadditional neonatalhospital costs ofdeath
Womenpresenting ata level 3hospital
Applying costsand disutilities ofAEs to all AEs
Treat all 323,093 194,770 770 8,522,367 59,091 322,126 323,093 306,507
fFN at
10 ng/mla 242,716 130,060 289 6,402,235 34,621 241,750 242,716 230,256
200 ng/mla 43,781b 33,081b–243 1,154,838b 14,902b 42,815b 43,781b 41,534b
500 ng/mla 29,631b 23,314b–400 781,581b 11,654b 28,664b 29,631b 28,110b
Actim Partusa 97,069b 66,541b–347 2,560,443b 24,532b 96,103b 97,069b 92,086b
PartoSurec 141,838b 141,788b–507 3,741,321b 267,481b 140,871b 141,838b 134,556b
AE, adverse event.a Bruijn et al.42,43
b The ICER represents the south-west quadrant in cost-effectiveness (i.e. a reduction in both costs and QALYs).c Indirect comparison between Bruijn et al.42,43 and Hadzi-Lega et al.44 (Bruijn et al.42,43 was used as the reference study in this case).NoteGreen text denotes ratios in which the difference in cost and the difference in benefit (QALYs) are both negative relative to the reference test option.
DOI:10.3310/hta23130
HEA
LTHTECH
NOLO
GYASSESSM
ENT2019
VOL.23
NO.13
©Queen
’sPrinter
andController
ofHMSO
2019.This
work
was
producedby
Varley-C
ampbellet
al.under
theterm
sof
acom
missioning
contractissued
bythe
Secretaryof
Statefor
Health
andSocialC
are.This
issuemay
befreely
reproducedfor
thepurposes
ofprivate
researchand
studyand
extracts(or
indeed,the
fullreport)may
beincluded
inprofessionaljournals
providedthat
suitableacknow
ledgement
ismade
andthe
reproductionisnot
associatedwith
anyform
ofadvertising.
Applications
forcom
mercial
reproductionshould
beaddressed
to:NIHRJournals
Library,NationalInstitute
forHealth
Research,Evaluation,
Trialsand
StudiesCoordinating
Centre,
Alpha
House,
University
ofSoutham
ptonScience
Park,Southam
ptonSO
167N
S,UK.
213
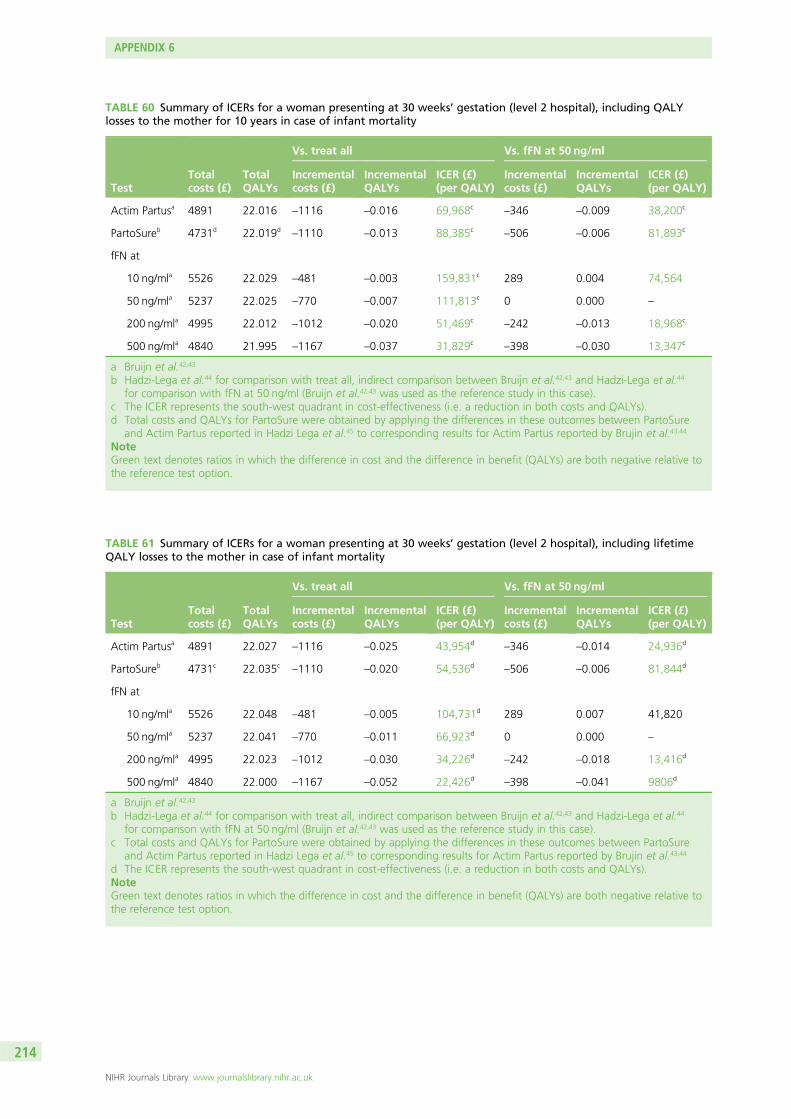
TABLE 60 Summary of ICERs for a woman presenting at 30 weeks’ gestation (level 2 hospital), including QALYlosses to the mother for 10 years in case of infant mortality
TestTotalcosts (£)
TotalQALYs
Vs. treat all Vs. fFN at 50 ng/ml
Incrementalcosts (£)
IncrementalQALYs
ICER (£)(per QALY)
Incrementalcosts (£)
IncrementalQALYs
ICER (£)(per QALY)
Actim Partusa 4891 22.016 –1116 –0.016 69,968c–346 –0.009 38,200c
PartoSureb 4731d 22.019d–1110 –0.013 88,385c
–506 –0.006 81,893c
fFN at
10 ng/mla 5526 22.029 –481 –0.003 159,831c 289 0.004 74,564
50 ng/mla 5237 22.025 –770 –0.007 111,813c 0 0.000 –
200 ng/mla 4995 22.012 –1012 –0.020 51,469c–242 –0.013 18,968c
500 ng/mla 4840 21.995 –1167 –0.037 31,829c–398 –0.030 13,347c
a Bruijn et al.42,43
b Hadzi-Lega et al.44 for comparison with treat all, indirect comparison between Bruijn et al.42,43 and Hadzi-Lega et al.44
for comparison with fFN at 50 ng/ml (Bruijn et al.42,43 was used as the reference study in this case).c The ICER represents the south-west quadrant in cost-effectiveness (i.e. a reduction in both costs and QALYs).d Total costs and QALYs for PartoSure were obtained by applying the differences in these outcomes between PartoSure
and Actim Partus reported in Hadzi Lega et al.45 to corresponding results for Actim Partus reported by Brujin et al.43,44
NoteGreen text denotes ratios in which the difference in cost and the difference in benefit (QALYs) are both negative relative tothe reference test option.
TABLE 61 Summary of ICERs for a woman presenting at 30 weeks’ gestation (level 2 hospital), including lifetimeQALY losses to the mother in case of infant mortality
TestTotalcosts (£)
TotalQALYs
Vs. treat all Vs. fFN at 50 ng/ml
Incrementalcosts (£)
IncrementalQALYs
ICER (£)(per QALY)
Incrementalcosts (£)
IncrementalQALYs
ICER (£)(per QALY)
Actim Partusa 4891 22.027 –1116 –0.025 43,954d–346 –0.014 24,936d
PartoSureb 4731c 22.035c–1110 –0.020 54,536d
–506 –0.006 81,844d
fFN at
10 ng/mla 5526 22.048 –481 –0.005 104,731d 289 0.007 41,820
50 ng/mla 5237 22.041 –770 –0.011 66,923d 0 0.000 –
200 ng/mla 4995 22.023 –1012 –0.030 34,226d–242 –0.018 13,416d
500 ng/mla 4840 22.000 –1167 –0.052 22,426d–398 –0.041 9806d
a Bruijn et al.42,43
b Hadzi-Lega et al.44 for comparison with treat all, indirect comparison between Bruijn et al.42,43 and Hadzi-Lega et al.44
for comparison with fFN at 50 ng/ml (Bruijn et al.42,43 was used as the reference study in this case).c Total costs and QALYs for PartoSure were obtained by applying the differences in these outcomes between PartoSure
and Actim Partus reported in Hadzi Lega et al.45 to corresponding results for Actim Partus reported by Brujin et al.43,44
d The ICER represents the south-west quadrant in cost-effectiveness (i.e. a reduction in both costs and QALYs).NoteGreen text denotes ratios in which the difference in cost and the difference in benefit (QALYs) are both negative relative tothe reference test option.
APPENDIX 6
NIHR Journals Library www.journalslibrary.nihr.ac.uk
214

Appendix 7 Additional diagnostic test accuracydata on cervical length
Methods of the overview
In addition to the systematic review described in Chapter 2, Methods of the systematic review, an overviewof studies that assess the DTA of at least one of the index tests (PartoSure, Actim Partus and qfFN), inaddition to a qualitative fFN test, qfFN at 50 ng/ml and/or transvaginal cervical length measurement, wasprovided because these are the tests currently recommended by NICE guidance.24
These data were extracted, when available, from the studies included in the systematic review of PartoSure,Actim Partus and qfFN (see Chapter 2, Results of the systematic review). For this reason, studies included inthe systematic review that also provided test accuracy data for a qualitative fFN test, qfFN at 50 ng/ml and/ortransvaginal cervical length measurement, were included in this overview. Test accuracy data for qualitativefFN, qfFN at 50 ng/ml and/or transvaginal cervical length measurement were extracted, tabulated andanalysed following the same methods and principles described in Chapter 2, Methods of the systematicreview, although only sensitivity, specificity, PPV and NPV are summarised (and no meta-analyses wereconducted). These test accuracy data are compared (in tables and text) with the test accuracy data forPartoSure, Actim Partus and qfFN, obtained from the same studies.
It should be noted that, because only ‘comparative’ DTA studies are summarised (i.e. studies providing datafor both an index test and one or more of qualitative fFN, qfFN at 50 ng/ml and/or transvaginal cervicallength measurement), this summary does not systematically cover the full breadth of DTA evidence on theseadditional tests. [These studies are not comparative in the strictest sense, rather they evaluate more thanone test within the same population (but do not directly compare the tests). This applies throughout thisappendix.] In order to ensure that the test accuracy data for qualitative fFN, qfFN at 50 ng/ml and/ortransvaginal cervical length measurement included here are largely representative of all data available forthese tests, recent systematic reviews of DTA studies for these tests were sought and assessed.
Results of the overview: fetal fibronectinIn this section, we present an overview of studies that assess the DTA of at least one of the index tests(PartoSure, Actim Partus and qfFN), in addition to a qualitative fFN test and/or qfFN at 50-ng/ml test.In a similar manner, a further overview incorporating cervical length is given in Appendix 2.
The reasons for presenting these additional data are twofold. First, fFN at 50 ng/ml is recommended in the NICEguidelines for current practice.24 Second, these tests are also comparators in our review of clinical effectiveness(end-to-end studies) but no such studies were found (see Chapter 3). However, it is important to highlight herethat, because fFN at 50 ng/ml was not an index test in the test accuracy review, the data are presented forinformation only and do not form part of the systematic review of test accuracy. Nevertheless, only datapresented in those studies that were included in the systematic review are included in this overview. Owing tothis, these data are not exhaustive of all data available for qualitative fFN or qfFN at 50 ng/ml (because severalstudies only reporting such data would have been excluded from the systematic review). To ensure that thedata presented here are similar to the wider available evidence, we also identified, for comparison, recentsystematic reviews of test accuracy data for qualitative fFN or qfFN at 50 ng/ml.
In this overview, DTA data, against a reference standard of preterm birth within 7 days, are provided forfFN, at a threshold of 50 ng/ml (qualitative or quantitative test). These data are presented in Chapter 2,Results of the systematic review, together with test accuracy data for index tests from the same studies(i.e. data from index tests produced for the systematic review of PartoSure, Actim Partus and qfFN atthresholds other than 50 ng/ml).
DOI: 10.3310/hta23130 HEALTH TECHNOLOGY ASSESSMENT 2019 VOL. 23 NO. 13
© Queen’s Printer and Controller of HMSO 2019. This work was produced by Varley-Campbell et al. under the terms of a commissioning contract issued by the Secretary of Statefor Health and Social Care. This issue may be freely reproduced for the purposes of private research and study and extracts (or indeed, the full report) may be included inprofessional journals provided that suitable acknowledgement is made and the reproduction is not associated with any form of advertising. Applications for commercialreproduction should be addressed to: NIHR Journals Library, National Institute for Health Research, Evaluation, Trials and Studies Coordinating Centre, Alpha House, University ofSouthampton Science Park, Southampton SO16 7NS, UK.
215

TABLE 62 Test accuracy results (against preterm birth within 7 days) for index tests, cervical length measurementand fFN at 50 ng/ml
Study (studyname/first authorand year) and test
Number ofparticipants
Test accuracy results (%) (95% CI)
Sensitivity Specificity PPV NPV
Azlin (2010)47
CL < 25mm 51 80.0 (28.4 to 99.5) 71.7 (56.5 to 84.0) 23.5 (6.8 to 49.9) 97.1 (84.7 to 99.9)
Actim Partus 51 80.0 (28.4 to 99.5) 93.5 (82.1 to 98.6) 57.1 (18.4 to 90.1) 97.7 (88.0 to 99.9)
Bolotskikh (2017)59
CL < 15mma 99 33.3 (9.9 to 65.1) 98.9 (93.8 to 100.0) 80.0 (28.4 to 99.5) 91.5 (83.9 to 96.3)
PartoSure 99 100.0 (73.5 to 100.0) 95.4 (88.6 to 98.7) 75.0 (47.6 to 92.7) 100.0 (95.7 to 100.0)
APOSTEL-1 (2016)42,43
CL < 15mma 350 72.5 (60.4 to 82.5) 83.3 (78.4 to 87.4) 51.5 (41.2 to 61.8) 92.5 (88.5 to 95.4)
fFN at 10 ng/ml 350 95.7 (87.8 to 99.1) 42.3 (36.5 to 48.4) 28.9 (23.2 to 35.3) 97.5 (93.0 to 99.5)
fFN at 50 ng/mlb 350 91.3 (82.0 to 96.7) 64.8 (58.9 to 70.3) 38.9 (31.3 to 46.9) 96.8 (93.2 to 98.8)
fFN at 200 ng/ml 350 71.0 (58.8 to 81.3) 83.6 (78.8 to 87.8) 51.6 (41.1 to 62.0) 92.2 (88.1 to 95.1)
fFN at 500 ng/ml 350 42.0 (30.2 to 54.5) 95.7 (92.7 to 97.8) 70.7 (54.5 to 83.9) 87.1 (82.8 to 90.6)
Actim Partus 350 78.3 (66.7 to 87.3) 89.3 (85.1 to 92.7) 64.3 (53.1 to 74.4) 94.4 (90.9 to 96.8)
Bruijn (2016)62
CL < 15mma 450 51.3 (34.8 to 67.6) 81.8 (77.7 to 85.4) 21.3 (13.5 to 30.9) 94.6 (91.7 to 96.7)
fFN at 10 ng/ml 455 93.8 (82.8 to 98.7) 32.2 (27.7 to 37.0) 14.0 (10.4 to 18.3) 97.8 (93.6 to 99.5)
fFN at 50 ng/mlb 455 89.6 (77.3 to 96.5) 62.2 (57.3 to 66.9) 21.8 (16.3 to 28.3) 98.1 (95.5 to 99.4)
fFN at 200 ng/ml 455 70.8 (55.9 to 83.0) 78.6 (74.3 to 82.5) 28.1 (20.3 to 37.0) 95.8 (93.1 to 97.7)
fFN at 500 ng/ml 455 29.2 (17.0 to 44.1) 94.3 (91.6 to 96.4) 37.8 (22.5 to 55.2) 91.9 (88.8 to 94.3)
Cooper (2012)49
fFN at 50 ng/mlc 291 33.3 (4.3 to 77.7) 89.8 (85.7 to 93.1) 6.5 (0.8 to 21.4) 98.5 (96.1 to 99.6)
Actim Partus 349 33.3 (4.3 to 77.7) 74.1 (69.1 to 78.6) 2.2 (0.3 to 7.7) 98.4 (96.1 to 99.6)
Danti (2011)50
CL < 20mma
(sample 1)60 75.0 (19.4 to 99.4) 71.4 (57.8 to 82.7) 15.8 (3.4 to 39.6) 97.6 (87.1 to 99.9)
CL < 20mma
(sample 2)102 75.0 (19.4 to 99.4) 83.7 (74.8 to 90.4) 15.8 (3.4 to 39.6) 98.8 (93.5 to 100.0)
Actim Partus 60 50.0 (6.8 to 93.2) 69.6 (55.9 to 81.2) 10.5 (1.3 to 33.1) 95.1 (83.5 to 99.4)
Eroglu (2007)51
fFN at 50 ng/mld 51 83.3 (35.9 to 99.6) 80.0 (65.4 to 90.4) 35.7 (12.8 to 64.9) 97.3 (85.8 to 99.9)
Actim Partus 51 83.3 (35.9 to 99.6) 84.4 (70.5 to 93.5) 41.7 (15.2 to 72.3) 97.4 (86.5 to 99.9)
CL < 20mm 51 66.7 (22.3 to 95.7) 95.6 (84.9 to 99.5) 66.7 (22.3 to 95.7) 95.6 (84.9 to 99.5)
Goyal (2016)52
CL < 25mme 60 80.5 (65.1 to 91.2) 31.6 (12.6 to 56.6) 71.7 (56.5 to 84.0) 42.9 (17.7 to 71.1)
Actim Partus 60 59.1 (43.2 to 73.7) 50.0 (24.7 to 75.3) 76.5 (58.8 to 89.3) 30.8 (14.3 to 51.8)
APPENDIX 7
NIHR Journals Library www.journalslibrary.nihr.ac.uk
216

Test accuracy data for fetal fibronectin at 50 ng/ml
Quantity and quality of the data available for fetal fibronectin at 50 ng/mlAs can be seen in Table 63, eight of the 20 included studies42,43,49,51,54,56,57,60–62 report DTA data for fFNmeasured at a 50-ng/ml threshold (in addition to data for at least one index test).
Two studies (APOSTEL-142,43 and Bruijn62) used the qfFN test and report data at 50 ng/ml. The APOSTEL-1study did additionally use a qualitative version of the fFN test (Rapid fFN for TLiIQ system test), but datafor this test are not provided in the included papers.42,43 Three studies51,57,60,61 used the QuikCheck versionof the qualitative fFN test. One further study54 used the ELISA laboratory technique. The remaining twostudies49,56 did not report which test was used. More specifically, Ting et al.56 only state that the test usedwas a bedside test that was ‘qualitatively reported’. Cooper et al.49 report using a fFN test manufacturedby Adeza Biochemical Corporation, but as this company produces both an ELISA testing method and theRapid fFN for TLiIQ system test,189 it remains unclear which test was used.
TABLE 62 Test accuracy results (against preterm birth within 7 days) for index tests, cervical length measurementand fFN at 50 ng/ml (continued )
Study (studyname/first authorand year) and test
Number ofparticipants
Test accuracy results (%) (95% CI)
Sensitivity Specificity PPV NPV
Hadzi-Lega (2017)44
CL < 25mm 57 100.0 (54.1 to 100.0) 70.6 (56.2 to 82.5) 28.6 (11.3 to 52.2) 100.0 (90.3 to 100.0)
Actim Partus 57 83.3 (35.9 to 99.6) 76.5 (62.5 to 87.2) 29.4 (10.3 to 56.0) 97.5 (86.8 to 99.9)
PartoSure 57 83.3 (35.9 to 99.6) 90.2 (78.6 to 96.7) 50.0 (18.7 to 81.3) 97.9 (88.7 to 99.9)
Nikolova (2014 and 2015)60,61
CL < 25mm 203 57.1 (39.4 to 73.7) 72.6 (65.2 to 79.2) 30.3 (19.6 to 42.9) 89.1 (82.6 to 93.7)
fFN at 50 ng/mld 66 50.0 (21.1 to 78.9) 72.2 (58.4 to 83.5) 28.6 (11.3 to 52.2) 86.7 (73.2 to 94.9)
PartoSure 203 80.0 (63.1 to 91.6) 94.6 (90.1 to 97.5) 75.7 (58.8 to 88.2) 95.8 (91.5 to 98.3)
Riboni (2011)54
fFN at 50 ng/mlf 210 50.0 (15.7 to 84.3) 80.2 (74.0 to 85.5) 9.1 (2.5 to 21.7) 97.6 (93.9 to 99.3)
Actim Partus 210 50.0 (15.7 to 84.3) 83.7 (77.8 to 88.5) 10.8 (3.0 to 25.4) 97.7 (94.2 to 99.4)
Ting (2007)56
fFN at 50 ng/mlc 94 56.3 (29.9 to 80.2) 75.6 (64.6 to 84.7) 32.1 (15.9 to 52.4) 89.4 (79.4 to 95.6)
Actim Partus 94 70.6 (44.0 to 89.7) 77.9 (67.0 to 86.6) 41.4 (23.5 to 61.1) 92.3 (83.0 to 97.5)
Tripathi (2016)57
fFN at 50 ng/mld 468 23.8 (17.3 to 31.4) 99.1 (97.3 to 99.8) 92.3 (79.1 to 98.4) 73.2 (68.7 to 77.3)
Actim Partus 467 94.7 (89.9 to 97.7) 92.4 (88.9 to 95.1) 85.7 (79.5 to 90.6) 97.3 (94.8 to 98.8)
CL, cervical length.a Other cut-off points available.b Quantitative Rapid fFN 10Q Cassette.c fFN testing method unclear.d QuikCheck fFN.e Raw data back calculated from sensitivity, specificity, PPV and NPV.f fFN measured by ELISA.
DOI: 10.3310/hta23130 HEALTH TECHNOLOGY ASSESSMENT 2019 VOL. 23 NO. 13
© Queen’s Printer and Controller of HMSO 2019. This work was produced by Varley-Campbell et al. under the terms of a commissioning contract issued by the Secretary of Statefor Health and Social Care. This issue may be freely reproduced for the purposes of private research and study and extracts (or indeed, the full report) may be included inprofessional journals provided that suitable acknowledgement is made and the reproduction is not associated with any form of advertising. Applications for commercialreproduction should be addressed to: NIHR Journals Library, National Institute for Health Research, Evaluation, Trials and Studies Coordinating Centre, Alpha House, University ofSouthampton Science Park, Southampton SO16 7NS, UK.
217
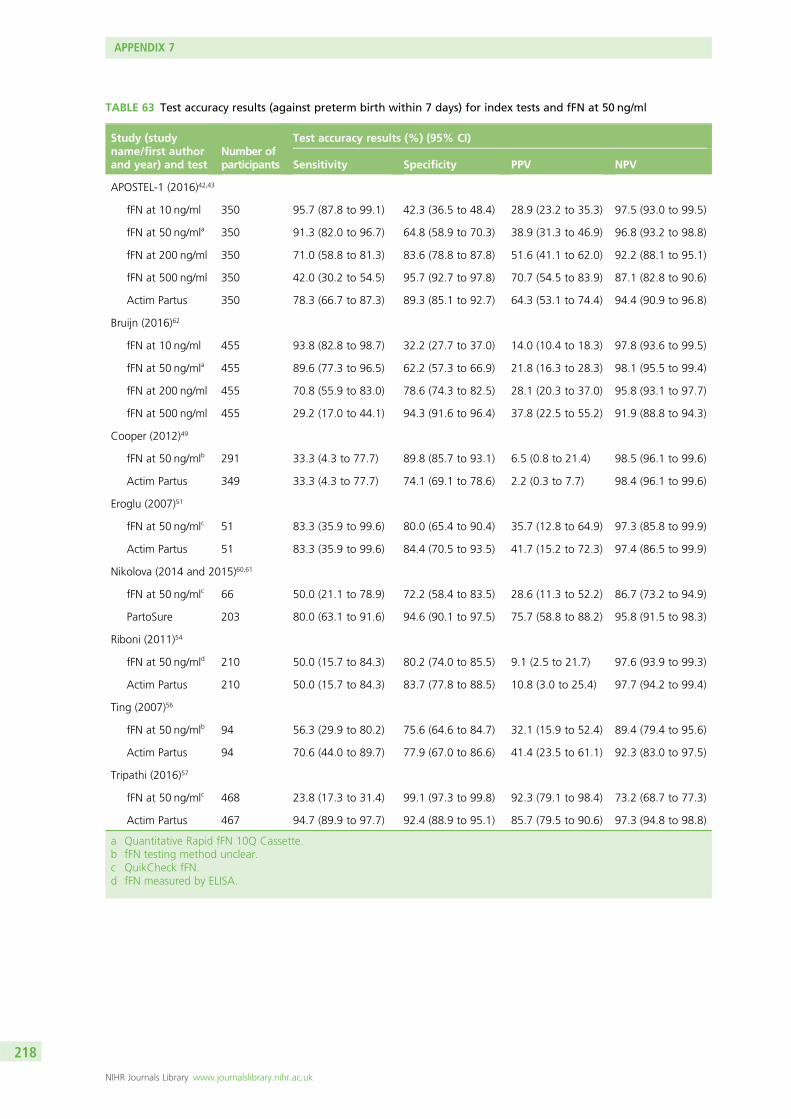
TABLE 63 Test accuracy results (against preterm birth within 7 days) for index tests and fFN at 50 ng/ml
Study (studyname/first authorand year) and test
Number ofparticipants
Test accuracy results (%) (95% CI)
Sensitivity Specificity PPV NPV
APOSTEL-1 (2016)42,43
fFN at 10 ng/ml 350 95.7 (87.8 to 99.1) 42.3 (36.5 to 48.4) 28.9 (23.2 to 35.3) 97.5 (93.0 to 99.5)
fFN at 50 ng/mla 350 91.3 (82.0 to 96.7) 64.8 (58.9 to 70.3) 38.9 (31.3 to 46.9) 96.8 (93.2 to 98.8)
fFN at 200 ng/ml 350 71.0 (58.8 to 81.3) 83.6 (78.8 to 87.8) 51.6 (41.1 to 62.0) 92.2 (88.1 to 95.1)
fFN at 500 ng/ml 350 42.0 (30.2 to 54.5) 95.7 (92.7 to 97.8) 70.7 (54.5 to 83.9) 87.1 (82.8 to 90.6)
Actim Partus 350 78.3 (66.7 to 87.3) 89.3 (85.1 to 92.7) 64.3 (53.1 to 74.4) 94.4 (90.9 to 96.8)
Bruijn (2016)62
fFN at 10 ng/ml 455 93.8 (82.8 to 98.7) 32.2 (27.7 to 37.0) 14.0 (10.4 to 18.3) 97.8 (93.6 to 99.5)
fFN at 50 ng/mla 455 89.6 (77.3 to 96.5) 62.2 (57.3 to 66.9) 21.8 (16.3 to 28.3) 98.1 (95.5 to 99.4)
fFN at 200 ng/ml 455 70.8 (55.9 to 83.0) 78.6 (74.3 to 82.5) 28.1 (20.3 to 37.0) 95.8 (93.1 to 97.7)
fFN at 500 ng/ml 455 29.2 (17.0 to 44.1) 94.3 (91.6 to 96.4) 37.8 (22.5 to 55.2) 91.9 (88.8 to 94.3)
Cooper (2012)49
fFN at 50 ng/mlb 291 33.3 (4.3 to 77.7) 89.8 (85.7 to 93.1) 6.5 (0.8 to 21.4) 98.5 (96.1 to 99.6)
Actim Partus 349 33.3 (4.3 to 77.7) 74.1 (69.1 to 78.6) 2.2 (0.3 to 7.7) 98.4 (96.1 to 99.6)
Eroglu (2007)51
fFN at 50 ng/mlc 51 83.3 (35.9 to 99.6) 80.0 (65.4 to 90.4) 35.7 (12.8 to 64.9) 97.3 (85.8 to 99.9)
Actim Partus 51 83.3 (35.9 to 99.6) 84.4 (70.5 to 93.5) 41.7 (15.2 to 72.3) 97.4 (86.5 to 99.9)
Nikolova (2014 and 2015)60,61
fFN at 50 ng/mlc 66 50.0 (21.1 to 78.9) 72.2 (58.4 to 83.5) 28.6 (11.3 to 52.2) 86.7 (73.2 to 94.9)
PartoSure 203 80.0 (63.1 to 91.6) 94.6 (90.1 to 97.5) 75.7 (58.8 to 88.2) 95.8 (91.5 to 98.3)
Riboni (2011)54
fFN at 50 ng/mld 210 50.0 (15.7 to 84.3) 80.2 (74.0 to 85.5) 9.1 (2.5 to 21.7) 97.6 (93.9 to 99.3)
Actim Partus 210 50.0 (15.7 to 84.3) 83.7 (77.8 to 88.5) 10.8 (3.0 to 25.4) 97.7 (94.2 to 99.4)
Ting (2007)56
fFN at 50 ng/mlb 94 56.3 (29.9 to 80.2) 75.6 (64.6 to 84.7) 32.1 (15.9 to 52.4) 89.4 (79.4 to 95.6)
Actim Partus 94 70.6 (44.0 to 89.7) 77.9 (67.0 to 86.6) 41.4 (23.5 to 61.1) 92.3 (83.0 to 97.5)
Tripathi (2016)57
fFN at 50 ng/mlc 468 23.8 (17.3 to 31.4) 99.1 (97.3 to 99.8) 92.3 (79.1 to 98.4) 73.2 (68.7 to 77.3)
Actim Partus 467 94.7 (89.9 to 97.7) 92.4 (88.9 to 95.1) 85.7 (79.5 to 90.6) 97.3 (94.8 to 98.8)
a Quantitative Rapid fFN 10Q Cassette.b fFN testing method unclear.c QuikCheck fFN.d fFN measured by ELISA.
APPENDIX 7
NIHR Journals Library www.journalslibrary.nihr.ac.uk
218

As previously mentioned, in the APOSTEL-1 study, samples for the qfFN test (at 50 ng/ml) were collectedand frozen for later analysis (this was not the case for the Rapid fFN for TLiIQ system test). This couldpotentially introduce a risk of bias as investigators may have known the outcome of the reference standardwhen interpreting the test.42,43 However, as previously noted, owing to the nature of the test, the potentialfor interpretation bias is minimal. For all other studies reporting fFN data at 50 ng/ml, the tests wereconducted and results analysed at the point of admission, before the reference standard of delivery within7 days had occurred. However, for three of the studies,51,54,57 it is unclear whether or not assessors wereaware of the Actim Partus test results when analysing fFN tests. Again, although ‘cross-contamination’between tests cannot be completely ruled out, the potential for such bias in these types of test is minimal.
One study (Riboni et al.54) uses the ELISA technique to determine fFN status (and possibly Cooper et al.49
as well, although this is unclear). ELISA is a quantitative technique that was used in a qualitative capacityusing 50 ng/ml as the threshold; this is the standard threshold, suggesting that in this study the thresholdwas established a priori.54 However, neither Riboni et al.54 nor Cooper et al.49 explicitly report prespecificationof the threshold for this test. Of course, the APOSTEL-1 study also uses a qfFN test, but multiple prespecifiedthresholds were used.42,43
An additional consideration in these 50-ng/ml fFN data is that one study60,61 reports fFN at 50-ng/mlaccuracy data for only 66 out of the 203 patients recruited and included in the PartoSure analyses.The reasons for this are unclear.
Test accuracy of 50-ng/ml threshold for fetal fibronectinDiagnostic test accuracy data for fFN at a threshold of 50 ng/ml (against the 7-day delivery reference standard)are provided in Table 63. Sensitivity of fFN at the 50-ng/ml threshold ranged from 23.8% (95% CI 17.3% to31.4%) in the study by Tripathi et al.57 to 91.3% (95% CI 82.0% to 96.7%) in APOSTEL-142,43 (qfFN data at50 ng/ml). Specificity ranged from 62.2% (95% CI 57.3% to 66.9%) in Bruijn62 to 99.1% (95% CI 97.3% to99.8%) in Tripathi et al.57 Values for PPV and NPV were also calculated and are presented in Table 63.
Again, it should be noted that these data do not cover all available evidence regarding test accuracy of fFNat a threshold of 50 ng/ml and are based only on data reported by studies included in our systematicreview of Actim Partus, PartoSure and qfFN at thresholds other than 50 ng/ml.
Comparison of fetal fibronectin at 50-ng/ml test and index testsIn six studies,42,43,49,51,54,56,57 both fFN at a threshold of 50 ng/ml and Actim Partus were assessed in the samesample. One study60,61 assessed fFN at a threshold of 50 ng/ml and PartoSure in the same sample, andtwo studies42,43,62 assessed fFN at a threshold of 50 ng/ml and fFN at other thresholds in the same sample.Note that the APOSTEL-1 study assessed more than one index test, in addition to fFN at 50 ng/ml, in thesame sample.42,43
When compared with Actim Partus, sensitivity (against the reference standard of preterm birth within7 days) was higher for fFN at 50 ng/ml in one study,42,43 lower for fFN at 50 ng/ml in two studies56,57 andthe same for both tests in three studies.49,51,54 Specificity (against the reference standard of preterm birthwithin 7 days) was lower for fFN than for Actim Partus in four of the six studies,42,43,51,54,56 and higher forthe other two studies.49,57 These data are presented in Table 63.
In the study that included both PartoSure and fFN at a threshold of 50 ng/ml,60,61 both sensitivity and specificity(against the reference standard of preterm birth within 7 days) were higher for PartoSure [sensitivity 80%(95% CI 63.1% to 91.6%) and specificity 94.6% (95% CI 90.1% to 97.5%)] than for fFN at 50 ng/ml[sensitivity 50.0% (95% CI 21.1% to 78.9%) and specificity 72.2% (95% CI 58.4% to 83.5%)].
As would be expected, in the two studies assessing qfFN at a variety of thresholds (APOSTEL-1 and Bruijn),as the threshold of fFN increased (< 10, < 50, < 200 or < 500 ng/ml) sensitivity decreased and thespecificity increased.42,43,62
DOI: 10.3310/hta23130 HEALTH TECHNOLOGY ASSESSMENT 2019 VOL. 23 NO. 13
© Queen’s Printer and Controller of HMSO 2019. This work was produced by Varley-Campbell et al. under the terms of a commissioning contract issued by the Secretary of Statefor Health and Social Care. This issue may be freely reproduced for the purposes of private research and study and extracts (or indeed, the full report) may be included inprofessional journals provided that suitable acknowledgement is made and the reproduction is not associated with any form of advertising. Applications for commercialreproduction should be addressed to: NIHR Journals Library, National Institute for Health Research, Evaluation, Trials and Studies Coordinating Centre, Alpha House, University ofSouthampton Science Park, Southampton SO16 7NS, UK.
219

Relevant systematic reviewsThe test accuracy data for fFN at 50 ng/ml presented above are based only on the studies included in thesystematic review of PartoSure, Actim Partus and qfFN (see Chapter 2, Results of the systematic review).Recent systematic reviews were sought in order to identify other available data on fFN at 50 ng/ml (eitherthe older qualitative test or the modern quantitative test) in the prediction of preterm birth.
Data from systematic reviews of fetal fibronectin at a threshold of 50 ng/mlOne notable systematic review by Sanchez-Ramos et al.128 (2009), included 32 studies that used either aqualitative fFN test or the quantitative test at a threshold of 50 ng/ml. In this review, pooled sensitivity (againsta reference standard of delivery within 7 days) was 76.1% (95% CI 69.1% to 81.9%) and pooled specificitywas 81.9% (95% CI 78.9% to 84.5%).128 More recently, Boots et al.129 (2014) published a systematic reviewthat included both studies assessing fFN at a threshold of 50 ng/ml and studies assessing cervical lengthmeasurement. For fFN at 50 ng/ml, sensitivity and specificity estimates from 38 studies (against a referencestandard of delivery within 7 days) were similar to those reported in the previous review by Sanchez-Ramoset al.;128 in the Boots et al.129 review, pooled sensitivity was 75% (95% CI 69% to 80%) and pooledspecificity was 79% (95% CI 76% to 83%). These values are also similar to those reported in recent NICEguidance,24 in which across 20 studies of ‘low’ to ‘very low’ quality, sensitivity (against a reference standard ofdelivery within 7 days) ranged from 56% (95% CI not reported) to 100% (95% CI not reported) andspecificity ranged from 61.9% (95% CI 59.6% to 62.5%) to 92% (95% CI not reported).
These systematic review data are also similar to the data for fFN at a threshold of 50 ng/ml from thecurrent overview (see Chapter 2, Heterogeneity between studies), which also ranged widely: sensitivity(against the 7-day reference standard) ranged from 23.8% (95% CI 17.3% to 31.4%) to 91.3% (95% CI82.0% to 96.7%) and specificity ranged from 62.2% (95% CI 57.3% to 66.9%) to 99.1% (95% CI97.3% to 99.8%).
Test accuracy data for transvaginal cervical length
Quantity and quality of the data available for cervical lengthAs can be seen in Table 62, nine of the 20 included studies42–44,47,50–52,59–62 report DTA data for cervicallength (in addition to data for at least one index test).
Of these nine studies, four42,43,51,59,62 used the cervical length threshold recommended in the current NICEguidance (< 15 mm).24 Three of these studies42,43,59,62 also reported test accuracy data at other thresholds(not presented in this report). One study50 reported test accuracy of cervical length using the threshold of< 20 mm. The remaining four studies44,47,52,60,61 all used a cervical length threshold of < 25 mm.
One study50 reports cervical length test accuracy data for two populations; all recruited women had theircervical length measured. For those women with a cervical length of > 30 mm, the Actim Partus test was notconducted (n = 42), and for those with a cervical length of < 30 mm, Actim Partus was conducted (n = 60).Cervical length test accuracy data were available both for the women with a cervical length of < 30 mm(n = 60) (i.e. for those women who also had an Actim Partus test) and for the whole sample (n = 102).
It should be noted here that cervical length measurement is a more subjective test (i.e. more open tohuman interpretation) than any of the other tests (PartoSure, Actim Partus, qfFN or qualitative fFN) and is,therefore, more dependent on clinicians’ experience/expertise and more open to potential (intentional orunintentional) bias. Typically, it was reported that cervical length was measured by a trained investigator,and that three measurements were taken and averaged. However, it is generally unclear whether or notthe clinicians measuring cervical length were blinded to the results of any biomedical test used. Indeed,with the exception of the study by Eroglu et al.,51 all studies that evaluated cervical length did not clearlydescribe whether or not clinicians were blinded to other test results.42–44,47,50,52,59–62 In Eroglu et al.,51 it wasexplicitly stated that the assessor was blinded to other test results.
APPENDIX 7
NIHR Journals Library www.journalslibrary.nihr.ac.uk
220
Test accuracy of transvaginal cervical length measurementTable 62 provides DTA data for the three studies42,43,59,62 assessing cervical length at a threshold of < 15 mm(against the 7-day delivery reference standard). At this threshold, sensitivity ranged widely, from 33.3%(95% CI 9.9% to 65.1%) in Bolotskikh et al.59 to 72.5% (95% CI 60.4% to 82.5%) in APOSTEL-1.42,43
Specificity was more similar across the four studies, ranging from 81.8% (95% CI 77.7% to 85.4%) inBruijn62 to 98.9% (95% CI 93.8% to 100.0%) in Bolotskikh et al.59
Against the 7-day delivery reference standard, sensitivity of cervical length at a threshold of < 20 mm was75.0% (95% CI 19.4% to 99.4%) in both of the Danti et al.50 samples (n = 60 and n = 102), whereasspecificity was 83.7% (95% CI 74.8% to 90.4%) for the sample of n = 102 and 71.4% (95% CI 57.8% to82.7%) in the sample of n = 60 (i.e. women with a cervical length of < 30 mm). Eroglu et al.51 also evaluatedcervical length at a threshold of < 20 mm against the 7-day delivery reference standard; sensitivity was lowerat 66.7% (95% CI 22.3% to 95.7%), but specificity was higher at 95.6% (95% CI 84.9% to 99.5%) thanDanti et al.50 Across the four studies providing data at a threshold of < 25 mm, and again against a 7-daydelivery reference standard, sensitivity ranged from 57.1% (95% CI 39.4% to 73.7%) in Nikolova et al.60,61
to 100.0% (95% CI 54.1% to 100.0%) in Hadzi-Lega et al.44 In these four studies, specificity ranged from31.6% (95% CI 12.6% to 56.6%) in Goyal et al.52 to 72.6% (95% CI 65.2% to 79.2%) in Nikolova et al.60,61
Again, it should be noted that these data do not cover all available evidence regarding test accuracy ofcervical length at thresholds of < 15, < 20 or < 25 mm and are based only on data reported by studiesincluded in our systematic review of Actim Partus, PartoSure and qfFN at thresholds other than 50 ng/ml.In addition, the large variation across these studies in sensitivity and specificity may be, at least in part,owing to the different clinical personnel conducting the cervical length measurements.
Comparison of cervical length and index testsSix studies42–44,47,50–52 assessed both cervical length measurement and Actim Partus in the same population.Three studies assessed both cervical length measurement and PartoSure44,59–61 and two42,43,62 assessed bothcervical length and qfFN. Note that the study by Hazdi-Lega et al.44 and the APOSTEL-1 study42,43 bothassess two index tests.
Against the 7-day reference standard, sensitivity was higher for cervical length measurement than ActimPartus in three studies (see Table 62).44,50,52 The cervical length threshold for a positive test result was< 25 mm in Hazdi-Lega et al.44 and Goyal et al.,52 and < 20 mm in Danti et al.50 In one study,47 sensitivity(against the 7-day reference standard) did not differ between Actim Partus and cervical length measurementwith a threshold of < 25 mm. In the remaining two studies,42,43,51 sensitivity was higher for Actim Partusthan for cervical length measurement with a threshold of < 15 mm. Specificity (against the 7-day referencestandard) was higher for Actim Partus than for cervical length in all studies except for Danti et al.50 andEroglu et al.,51 in which the specificity was higher for cervical length measurement (see Table 62).
When comparing the test accuracy of cervical length measurement with that of PartoSure (against the7-day reference standard), sensitivity was higher for PartoSure than for cervical length measurement at athreshold of < 15 mm in Bolotskikh et al.59 [100% (95% CI 73.5% to 100.0%) vs. 33.3% (95% CI 9.9% to65.1%)] and lower for PartoSure than for cervical length at a threshold of < 25 mm in Hadzi-Lega et al.44
[83.3% (95% CI 35.9% to 99.6%) vs. 100% (95% CI 54.1% to 100%)], although CIs overlap in Hadzi-Legaet al.44 Conversely, specificity was lower for PartoSure than for cervical length measurement at a threshold of< 15 mm in Bolotskikh et al.59 [95.4% (95% CI 88.6% to 98.7%) vs. 98.9% (95% CI 93.8% to 100.0%)]and higher for PartoSure than for cervical length measurement at a threshold of < 25 mm in Hadzi-Legaet al.44 [90.2% (95% CI 78.6% to 96.7%) vs. 70.6% (95% CI 56.2% to 82.5%)], albeit with overlappingCIs. In the third study,60,61 both sensitivity and specificity were higher for PartoSure than for cervical length ata threshold of < 25 mm [sensitivity 80.0% (95% CI 63.1% to 91.6%) vs. 57.1% (95% CI 39.4% to 73.7%)and specificity 94.6% (95% CI 90.1% to 97.5%) vs. 72.6% (95% CI 65.2% to 79.2%)], although, again,CIs (for sensitivity) overlap.
DOI: 10.3310/hta23130 HEALTH TECHNOLOGY ASSESSMENT 2019 VOL. 23 NO. 13
© Queen’s Printer and Controller of HMSO 2019. This work was produced by Varley-Campbell et al. under the terms of a commissioning contract issued by the Secretary of Statefor Health and Social Care. This issue may be freely reproduced for the purposes of private research and study and extracts (or indeed, the full report) may be included inprofessional journals provided that suitable acknowledgement is made and the reproduction is not associated with any form of advertising. Applications for commercialreproduction should be addressed to: NIHR Journals Library, National Institute for Health Research, Evaluation, Trials and Studies Coordinating Centre, Alpha House, University ofSouthampton Science Park, Southampton SO16 7NS, UK.
221
In comparison with qfFN, in APOSTEL-1,42,43 cervical length at a threshold of < 15 mm was most closelymatched to qfFN with the threshold of 200 ng/ml [sensitivity against the 7-day reference standard: 72.5%(95% CI 60.4% to 82.5%) vs. 71.0% (95% CI 58.8% to 81.3%) and specificity against the 7-day referencestandard: 83.3% (95% CI 78.4% to 87.4%) vs. 83.6% (95% CI 78.8% to 87.8%)]. However, in Bruijn,62
the sensitivity and specificity (against the 7-day reference standard) of cervical length measurement at athreshold of < 15 mm fell between sensitivities and specificities produced for qfFN at the 200-ng/ml and500-ng/ml thresholds (see Table 62). This was particularly because sensitivity of cervical length at a thresholdof < 15 mm was lower in Bruijn than in APOSTEL-1 [51.3% (95% CI 34.8% to 67.6%) vs. 72.5% (95% CI60.4% to 82.5%)], although the 95% CIs do overlap.42,43,62
Data from systematic reviews of cervical length measurementIn the Boots et al.129 review, cervical length measurement at a cut-off point of 15 mm was assessed in24 studies (against a reference standard of delivery within 7 days), with pooled sensitivity reported as 74%(95% CI 58% to 85%) and pooled specificity as 89% (95% CI 85% to 92%). Recent NICE guidance24
shows how the variability across studies is great: for cervical length measurement at a cut-off point of< 15 mm, across eight studies of ‘very low’ quality, sensitivity (against a reference standard of deliverywithin 7 days) ranged from 26.3% (95% CI 11.2% to 39.7%) to 97.7% (95% CI 86.9% to 99.9%) andspecificity from 83.0% (95% CI 70.0% to 93.0%) to 96.5% (95% CI 95.4% to 97.7%). These systematicreview data are similar to the data for cervical length measurement from the current overview (see Testaccuracy of transvaginal cervical length measurement and Table 62) in which, at a threshold of < 15 mm,sensitivity (against the 7-day reference standard) showed great variability across studies, ranging from33.3% (95% CI 9.9% to 65.1%) to 72.5% (95% CI 60.4% to 82.5%), and specificity was more similaracross studies, ranging from 81.8% (95% CI 77.7% to 85.4%) to 98.9% (95% CI 93.8% to 100.0%).
In the recent NICE guidance,24 at a cut-off point of < 25 mm (across five studies of ‘low’ and ‘very low’
quality), sensitivity (against a reference standard of delivery within 7 days) ranged from 60.0% (95% CI48.3% to 64.7%) to 83.3% (95% CI 43.7% to 97.0%) and specificity ranged from 71.7% (95% CI66.4% to 73.8%) to 96.9% (95% CI 91.6% to 99.5%). Again, these sensitivity data are similar to those inthe current overview in which, at a threshold of < 25 mm, sensitivity ranged from 57.1% (95% CI 39.4%to 73.7%) to 100.0% (95% CI 54.1% to 100.0%). However, at this threshold, a wider range of specificitywas found in the current overview [ranging from 31.6% (95% CI 12.6% to 56.6%) to 72.6% (95% CI65.2% to 79.2%)] than in the recent NICE guidance.24 The recent NICE guidance24 also included testaccuracy data for cervical length at a threshold of < 30 mm (across three studies of ‘very low’ quality), withsensitivity (against a reference standard of delivery within 7 days) ranging from 89.3% (95% CI 71.8% to97.2%) to 94.0% (95% CI 79.0% to 99.0%) and specificity from 42.0% (95% CI 37.0% to 47.0%) to55.6% (95% CI 53.0% to 56.8%). The current overview does not provide test accuracy data for cervicallength at the < 30-mm threshold.
SummaryOverall summary tables for the DTA review, including cervical length data, are presented in Tables 37and 38.
APPENDIX 7
NIHR Journals Library www.journalslibrary.nihr.ac.uk
222
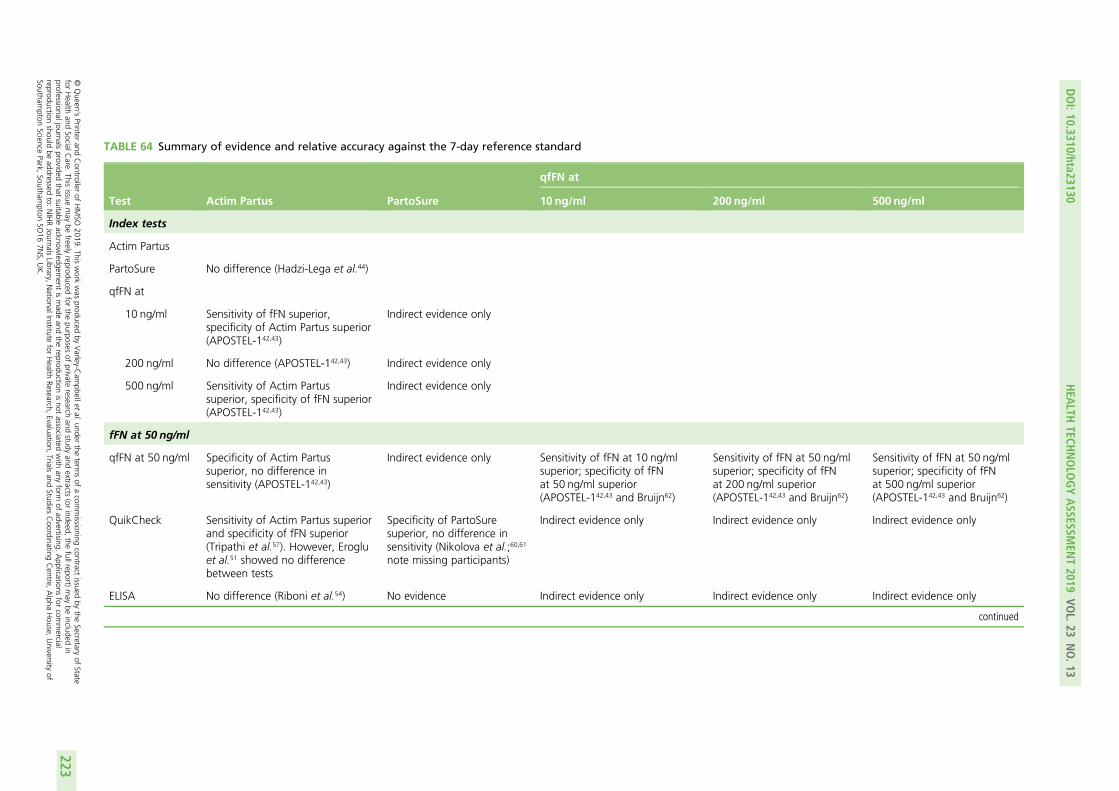
TABLE 64 Summary of evidence and relative accuracy against the 7-day reference standard
Test Actim Partus PartoSure
qfFN at
10 ng/ml 200 ng/ml 500 ng/ml
Index tests
Actim Partus
PartoSure No difference (Hadzi-Lega et al.44)
qfFN at
10 ng/ml Sensitivity of fFN superior,specificity of Actim Partus superior(APOSTEL-142,43)
Indirect evidence only
200 ng/ml No difference (APOSTEL-142,43) Indirect evidence only
500 ng/ml Sensitivity of Actim Partussuperior, specificity of fFN superior(APOSTEL-142,43)
Indirect evidence only
fFN at 50 ng/ml
qfFN at 50 ng/ml Specificity of Actim Partussuperior, no difference insensitivity (APOSTEL-142,43)
Indirect evidence only Sensitivity of fFN at 10 ng/mlsuperior; specificity of fFNat 50 ng/ml superior(APOSTEL-142,43 and Bruijn62)
Sensitivity of fFN at 50 ng/mlsuperior; specificity of fFNat 200 ng/ml superior(APOSTEL-142,43 and Bruijn62)
Sensitivity of fFN at 50 ng/mlsuperior; specificity of fFNat 500 ng/ml superior(APOSTEL-142,43 and Bruijn62)
QuikCheck Sensitivity of Actim Partus superiorand specificity of fFN superior(Tripathi et al.57). However, Erogluet al.51 showed no differencebetween tests
Specificity of PartoSuresuperior, no difference insensitivity (Nikolova et al.;60,61
note missing participants)
Indirect evidence only Indirect evidence only Indirect evidence only
ELISA No difference (Riboni et al.54) No evidence Indirect evidence only Indirect evidence only Indirect evidence only
continued
DOI:10.3310/hta23130
HEA
LTHTECH
NOLO
GYASSESSM
ENT2019
VOL.23
NO.13
©Queen
’sPrinter
andController
ofHMSO
2019.This
work
was
producedby
Varley-C
ampbellet
al.under
theterm
sof
acom
missioning
contractissued
bythe
Secretaryof
Statefor
Health
andSocialC
are.This
issuemay
befreely
reproducedfor
thepurposes
ofprivate
researchand
studyand
extracts(or
indeed,the
fullreport)may
beincluded
inprofessionaljournals
providedthat
suitableacknow
ledgement
ismade
andthe
reproductionisnot
associatedwith
anyform
ofadvertising.
Applications
forcom
mercial
reproductionshould
beaddressed
to:NIHRJournals
Library,NationalInstitute
forHealth
Research,Evaluation,
Trialsand
StudiesCoordinating
Centre,
Alpha
House,
University
ofSoutham
ptonScience
Park,Southam
ptonSO
167N
S,UK.
223
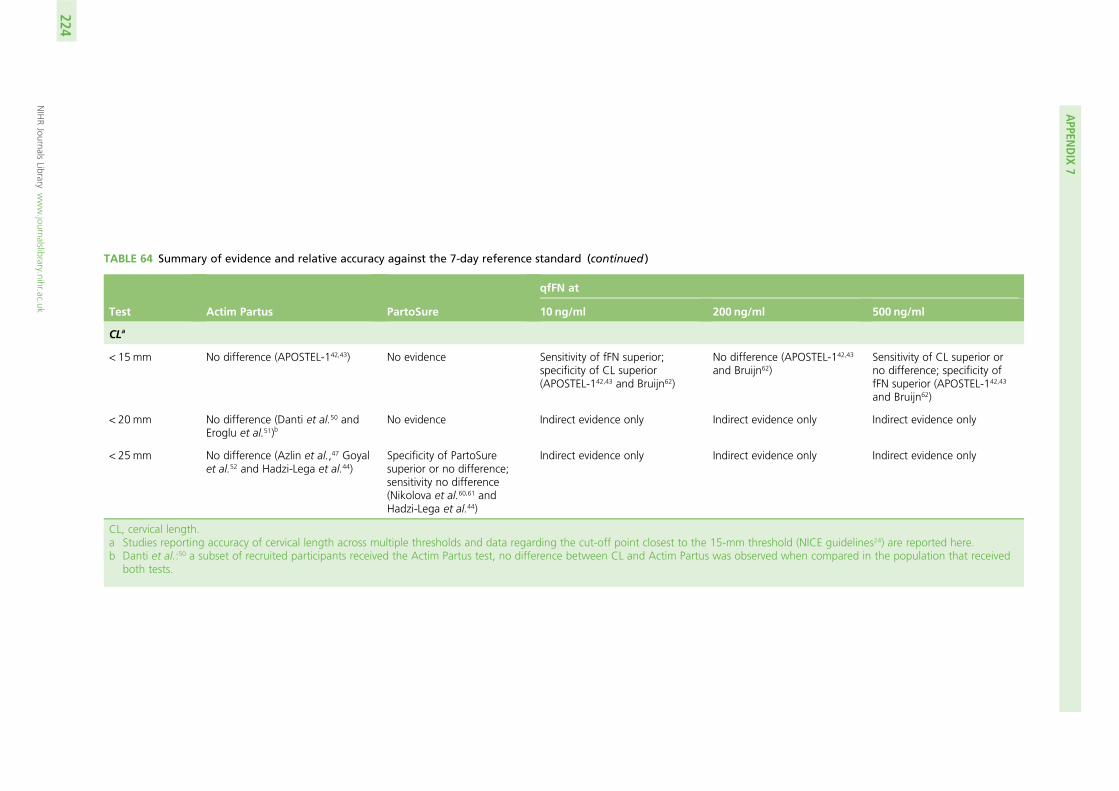
TABLE 64 Summary of evidence and relative accuracy against the 7-day reference standard (continued )
Test Actim Partus PartoSure
qfFN at
10 ng/ml 200 ng/ml 500 ng/ml
CLa
< 15mm No difference (APOSTEL-142,43) No evidence Sensitivity of fFN superior;specificity of CL superior(APOSTEL-142,43 and Bruijn62)
No difference (APOSTEL-142,43
and Bruijn62)Sensitivity of CL superior orno difference; specificity offFN superior (APOSTEL-142,43
and Bruijn62)
< 20 mm No difference (Danti et al.50 andEroglu et al.51)b
No evidence Indirect evidence only Indirect evidence only Indirect evidence only
< 25mm No difference (Azlin et al.,47 Goyalet al.52 and Hadzi-Lega et al.44)
Specificity of PartoSuresuperior or no difference;sensitivity no difference(Nikolova et al.60,61 andHadzi-Lega et al.44)
Indirect evidence only Indirect evidence only Indirect evidence only
CL, cervical length.a Studies reporting accuracy of cervical length across multiple thresholds and data regarding the cut-off point closest to the 15-mm threshold (NICE guidelines24) are reported here.b Danti et al.:50 a subset of recruited participants received the Actim Partus test, no difference between CL and Actim Partus was observed when compared in the population that received
both tests.
APPEN
DIX
7
NIHRJournals
Librarywww.journalslibrary.nihr.ac.uk
224
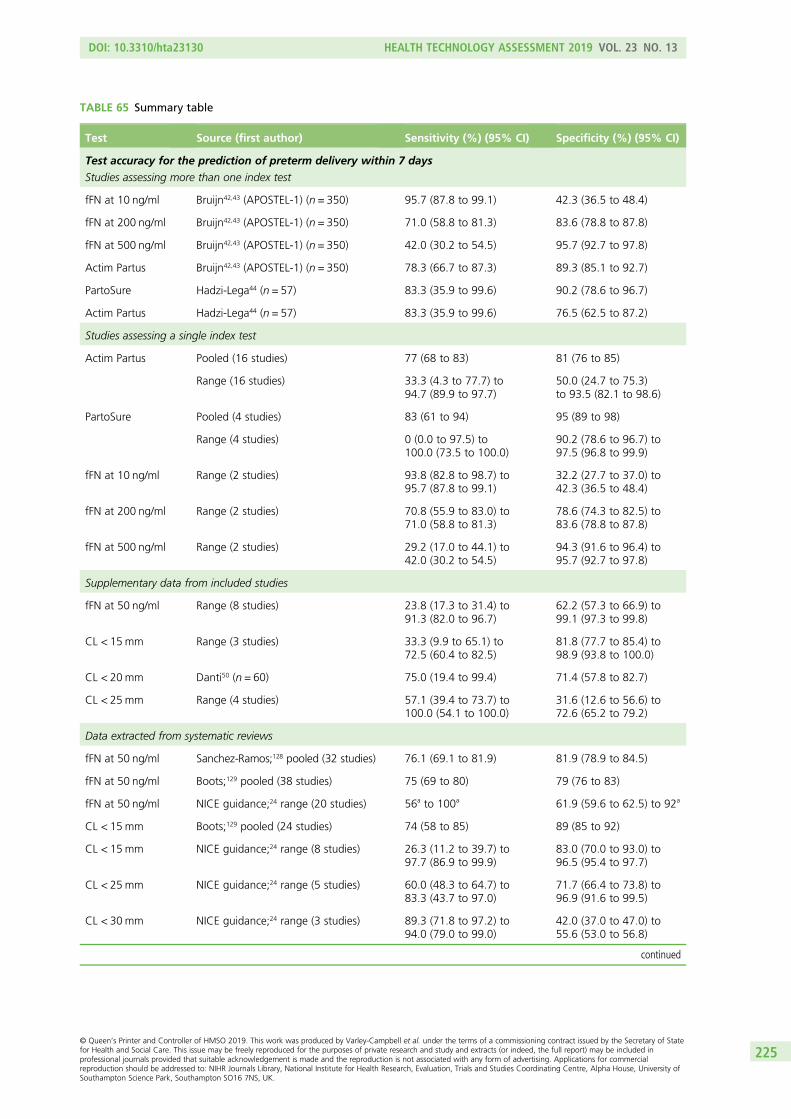
TABLE 65 Summary table
Test Source (first author) Sensitivity (%) (95% CI) Specificity (%) (95% CI)
Test accuracy for the prediction of preterm delivery within 7 days
Studies assessing more than one index test
fFN at 10 ng/ml Bruijn42,43 (APOSTEL-1) (n = 350) 95.7 (87.8 to 99.1) 42.3 (36.5 to 48.4)
fFN at 200 ng/ml Bruijn42,43 (APOSTEL-1) (n = 350) 71.0 (58.8 to 81.3) 83.6 (78.8 to 87.8)
fFN at 500 ng/ml Bruijn42,43 (APOSTEL-1) (n = 350) 42.0 (30.2 to 54.5) 95.7 (92.7 to 97.8)
Actim Partus Bruijn42,43 (APOSTEL-1) (n = 350) 78.3 (66.7 to 87.3) 89.3 (85.1 to 92.7)
PartoSure Hadzi-Lega44 (n = 57) 83.3 (35.9 to 99.6) 90.2 (78.6 to 96.7)
Actim Partus Hadzi-Lega44 (n = 57) 83.3 (35.9 to 99.6) 76.5 (62.5 to 87.2)
Studies assessing a single index test
Actim Partus Pooled (16 studies) 77 (68 to 83) 81 (76 to 85)
Range (16 studies) 33.3 (4.3 to 77.7) to94.7 (89.9 to 97.7)
50.0 (24.7 to 75.3)to 93.5 (82.1 to 98.6)
PartoSure Pooled (4 studies) 83 (61 to 94) 95 (89 to 98)
Range (4 studies) 0 (0.0 to 97.5) to100.0 (73.5 to 100.0)
90.2 (78.6 to 96.7) to97.5 (96.8 to 99.9)
fFN at 10 ng/ml Range (2 studies) 93.8 (82.8 to 98.7) to95.7 (87.8 to 99.1)
32.2 (27.7 to 37.0) to42.3 (36.5 to 48.4)
fFN at 200 ng/ml Range (2 studies) 70.8 (55.9 to 83.0) to71.0 (58.8 to 81.3)
78.6 (74.3 to 82.5) to83.6 (78.8 to 87.8)
fFN at 500 ng/ml Range (2 studies) 29.2 (17.0 to 44.1) to42.0 (30.2 to 54.5)
94.3 (91.6 to 96.4) to95.7 (92.7 to 97.8)
Supplementary data from included studies
fFN at 50 ng/ml Range (8 studies) 23.8 (17.3 to 31.4) to91.3 (82.0 to 96.7)
62.2 (57.3 to 66.9) to99.1 (97.3 to 99.8)
CL < 15mm Range (3 studies) 33.3 (9.9 to 65.1) to72.5 (60.4 to 82.5)
81.8 (77.7 to 85.4) to98.9 (93.8 to 100.0)
CL < 20mm Danti50 (n = 60) 75.0 (19.4 to 99.4) 71.4 (57.8 to 82.7)
CL < 25mm Range (4 studies) 57.1 (39.4 to 73.7) to100.0 (54.1 to 100.0)
31.6 (12.6 to 56.6) to72.6 (65.2 to 79.2)
Data extracted from systematic reviews
fFN at 50 ng/ml Sanchez-Ramos;128 pooled (32 studies) 76.1 (69.1 to 81.9) 81.9 (78.9 to 84.5)
fFN at 50 ng/ml Boots;129 pooled (38 studies) 75 (69 to 80) 79 (76 to 83)
fFN at 50 ng/ml NICE guidance;24 range (20 studies) 56a to 100a 61.9 (59.6 to 62.5) to 92a
CL < 15mm Boots;129 pooled (24 studies) 74 (58 to 85) 89 (85 to 92)
CL < 15mm NICE guidance;24 range (8 studies) 26.3 (11.2 to 39.7) to97.7 (86.9 to 99.9)
83.0 (70.0 to 93.0) to96.5 (95.4 to 97.7)
CL < 25mm NICE guidance;24 range (5 studies) 60.0 (48.3 to 64.7) to83.3 (43.7 to 97.0)
71.7 (66.4 to 73.8) to96.9 (91.6 to 99.5)
CL < 30mm NICE guidance;24 range (3 studies) 89.3 (71.8 to 97.2) to94.0 (79.0 to 99.0)
42.0 (37.0 to 47.0) to55.6 (53.0 to 56.8)
continued
DOI: 10.3310/hta23130 HEALTH TECHNOLOGY ASSESSMENT 2019 VOL. 23 NO. 13
© Queen’s Printer and Controller of HMSO 2019. This work was produced by Varley-Campbell et al. under the terms of a commissioning contract issued by the Secretary of Statefor Health and Social Care. This issue may be freely reproduced for the purposes of private research and study and extracts (or indeed, the full report) may be included inprofessional journals provided that suitable acknowledgement is made and the reproduction is not associated with any form of advertising. Applications for commercialreproduction should be addressed to: NIHR Journals Library, National Institute for Health Research, Evaluation, Trials and Studies Coordinating Centre, Alpha House, University ofSouthampton Science Park, Southampton SO16 7NS, UK.
225

TABLE 65 Summary table (continued )
Test Source (first author) Sensitivity (%) (95% CI) Specificity (%) (95% CI)
Test accuracy for the prediction of preterm delivery within 48 hours
Studies assessing a single index test
Actim Partus Pooled (6 studies) 87 (74 to 96) 73 (62 to 82)
Range (6 studies) 65.7 (47.8 to 80.9) to100 (47.8 to 100.0)
56.0 (34.9 to 75.6) to82.4 (56.6 to 96.2)
PartoSure Werlen41 (n = 41) 0.0 (0.0 to 97.5) 97.5 (86.8 to 99.9)
CL, cervical length.a 95% CI not reported.
APPENDIX 7
NIHR Journals Library www.journalslibrary.nihr.ac.uk
226


Part of the NIHR Journals Library www.journalslibrary.nihr.ac.uk
Published by the NIHR Journals Library
This report presents independent research funded by the National Institute for Health Research (NIHR). The views expressed are those of the author(s) and not necessarily those of the NHS, the NIHR or the Department of Health and Social Care
EMEHS&DRHTAPGfARPHR
Recommended


