
Using plant functional traits to understand thelandscape distribution of multiple ecosystem services
Sandra Lavorel1*, Karl Grigulis2, Penelope Lamarque1, Marie-Pascale Colace1,
Denys Garden3, Jacky Girel1, Gilles Pellet2 and Rolland Douzet2
1Laboratoire d’Ecologie Alpine, UMR 5553 CNRS Universite Joseph Fourier, BP 53, 38041 Grenoble Cedex 9,
France; 2Station Alpine Joseph Fourier, UMS 2925 CNRS Universite Joseph Fourier, BP 53, 38041 Grenoble Cedex
9, France; and 311 Allport St, Downer ACT 2602, Australia
Summary
1. Spatially explicit understanding of the delivery of multiple ecosystem services (ES) from globalto local scales is currently limited. New studies analysing the simultaneous provision of multiple
services at landscape scale should aid the understanding of multiple ES delivery and trade-offs tosupport policy, management and land planning.2. Here, we propose a new approach for the analysis, mapping and understanding of multiple ES
delivery in landscapes. Spatially explicit single ES models based on plant traits and abiotic charac-teristics are combined to identify ‘hot’ and ‘cold’ spots of multiple ES delivery, and the land use and
biotic determinants of such distributions. We demonstrate the value of this trait-based approach ascompared to a pure land-use approach for a pastoral landscape from the central French Alps, and
highlight how it improves understanding of ecological constraints to, and opportunities for, thedelivery ofmultiple services.
3. Vegetative height and leaf traits such as leaf dry matter content were response traits stronglyinfluenced by land use and abiotic environment, with follow-on effects on several ecosystem proper-ties, and could therefore be used as functional markers of ES.
4. Patterns of association among ES were related to the dominant traits underlying different eco-system properties. The functional decoupling between height and leaf traits provided alternative
pathways for high agronomic value, as well as determining hot and cold spots of ES. Traditionalland uses such as organic fertilization andmowing or altitude summer grazing were also linked with
ES hot spots, because functional characteristics supporting fodder production and quality are com-patible with species and functional diversity.
5. Synthesis. Analyses of ES using plant functional variation across landscapes are a powerfulapproach to understanding the fundamental ecological mechanisms underlying ES provision, and
trade-offs or synergies among services. Sustainable management of species and functionally diversegrassland could simultaneously aim at conserving biodiversity and locally important ES by takingadvantage of correlations and trade-offs among different plant functional traits.
Key-words: determinants of plant community diversity and structure, ecosystem services,
functional trade-offs, landscape modelling, mountain grassland management, plant functionaltraits
Introduction
Ecosystem services (ES) provide the link between ecosystems –
their biodiversity and their functioning – and human society
(Millennium Ecosystem Assessment 2005). Most ecosystems
provide a diversity of services, such as food and fodder provi-
sion, regulation of climate and water quality, pollination, and
aesthetic and recreational values (Millennium Ecosystem
Assessment 2005). Policy, management and land planning
urgently require spatial analyses of multiple ES at global (Nai-
doo et al. 2008), continental (Metzger et al. 2006; Kienast
et al. 2009) and regional (Chan et al. 2007; Egoh et al. 2009;
Eigenbrod et al. 2010) scales (Carpenter et al. 2009). There is
also a critical need for new studies mapping the simultaneous*Correspondence author. E-mail: [email protected]
! 2010 The Authors. Journal of Ecology ! 2010 British Ecological Society
Journal of Ecology 2011, 99, 135–147 doi: 10.1111/j.1365-2745.2010.01753.x

provision of multiple services at landscape scale (Naidoo &
Ricketts 2006; Gimona & van der Horst 2007) to advance
the understanding of ES trade-offs and synergies (Bennett,
Peterson & Gordon 2009). Such studies are also required to
support themodelling of land-use change (Verburg et al. 2009)
and the design of sustainable land architectures (de Groot
et al. 2009; Turner 2010).
Ecosystem service assessments often make the assumption
that ES can be mapped uniquely to land use or land cover
(LULC) (Naidoo & Ricketts 2006; Verburg et al. 2009;
Eigenbrod et al. 2010), especially at large scales where LULC
effects are at best corrected by a few simple modifiers, such as
coarse altitude or slope classes, or landscape heterogeneity for
which extensive information is available (Kienast et al. 2009;
Eigenbrod et al. 2010). Yet this approach can introduce
errors because it does not account for spatial variability in
biophysical variables (e.g. soils, topography) or processes
(Eigenbrod et al. 2010). For example Eigenbrod et al. (2010)
demonstrated that mapping ES over England using either
land cover or more refined proxies based on strong causal
drivers for specific services resulted in a poor fit to primary
data, as well as introducing errors in the identification of ES
hotspots. While of some use to depict broad-scale patterns of
ES delivery in the absence of better data, the use of LULC
proxies is also incompatible with the analysis of mechanisms
that drive ES delivery because ecosystem functioning often
varies across a LULC class due to biophysical heterogeneity
(e.g. topography, soil type) or management (e.g. grazing
intensity, logging practices) (Quetier et al. 2007; Gret-Rega-
mey et al. 2008; Bennett, Peterson & Gordon 2009; Reyers
et al. 2009; Willemen et al. 2010) and biotic responses to these
factors.
We propose to address this limitation by a refined analysis
at landscape scale of some of the ecological mechanisms that
drive ES delivery. Ecosystem service delivery has been related
to ecosystem biological characteristics (Kremen 2005), and
more specifically to functional traits (Kremen 2005; De Cha-
zal et al. 2008; De Bello et al. 2010). In particular, for plants
there is growing evidence for the effects of community-level
functional traits on ecosystem processes that underlie impor-
tant ES (Suding & Goldstein 2008). Following the biomass
ratio hypothesis (Grime 1998), community-weighted mean
traits, which represent the average trait value for a unit of bio-
mass within a community (Garnier et al. 2004; Violle et al.
2007), explain variation in net above-ground primary produc-
tivity (specific ANPP, Vile, Shipley & Garnier 2006; ANPP
Mokany, Ash & Roxburgh 2008), litter decomposition under
field (Garnier et al. 2004) and controlled (Cornelissen et al.
1999; Fortunel et al. 2009) conditions, digestibility (Pontes Da
Silva et al. 2007), or soil moisture (Mokany, Ash & Roxburgh
2008) and water uptake (Gross et al. 2008). Effects of func-
tional divergence, i.e. the expected variance in trait values
across two random units of biomass within a community
(Leps et al. 2006), have also been hypothesized to operate
through functional complementarity (Petchey & Gaston
2006). For example, within-community diversity in plant
heights is expected to enhance light capture (Vojtech et al.
2008), while diversity in leaf structural and chemical traits
would reflect diversity in nutrient acquisition and retention
strategies (Gross et al. 2007), and therefore affect primary
productivity (Schumacher & Roscher 2009) and decomposi-
tion (Scherer-Lorenzen 2008). However, their demonstration
has so far remained more elusive for such ecosystem processes
that appear to be dominated by biomass ratio effects (Diaz
et al. 2007; Mokany, Ash & Roxburgh 2008; but see Schum-
acher & Roscher 2009). Functional trait data is becoming
increasingly available thanks to standardized measurement
methods, which have promoted their wide use (Cornelissen
et al. 2003), and to large trait data bases (Kleyer et al. 2008;
Kattge et al. 2010). Quantitative models of ES built from
plant traits and environmental variables (Diaz et al. 2007)
have been used at the ecosystem level to quantify and project
ES for current management and future scenarios (Quetier
et al. 2007). However, such applications have projected ES
using unique values for trait means or divergence and of
abiotic factors within a given land use (Quetier et al. 2009),
ignoring the finer-scale biotic (e.g. plant species composition)
and abiotic (e.g. topography and soils) variation within each
land use that needs to be considered for a spatially explicit
landscape analysis.
Furthermore, existing trait-based analyses have considered
ES individually rather than bundles of ES with trade-offs and
synergies (Bennett, Peterson & Gordon 2009), as it is increas-
ingly done in spatial ES assessments (Naidoo & Ricketts
2006; Egoh et al. 2009; Eigenbrod et al. 2010; Willemen et al.
2010). Eigenbrod et al. (2010) highlighted the particularly
strong limitations of land use or proxy-based analyses when
addressing multiple ES. We believe that using the under-
standing of relationships between ES and traits should
strongly advance the understanding of ES synergies and
trade-offs. This would be achieved by using knowledge on
associations and trade-offs among traits as captured by plant
strategy schemes (Grime 1977; Westoby 1998) and trait spec-
tra analyses (Diaz et al. 2004; Wright et al. 2004; Chave et al.
2009).
In this study, we propose a new approach for the analysis of
multiple ES delivery in landscapes. We first develop spatially
explicit ES models based on plant traits and abiotic character-
istics, expanding the trait-based conceptual framework
(Fig. 1) (Diaz et al. 2007). This frameworkmakes it possible to
compare and combine land use, direct (abiotic) and indirect
(trait-mediated) effects on ecosystem properties by comparing
statistical models incorporating hierarchical combinations of
effects. Then ‘hot’ and ‘cold’ spots of ES delivery, representing
areas of high delivery for multiple vs. low delivery across ser-
vices, respectively, and their determinants in terms of land use
and plant traits are analysed combining multiple ecosystem
properties. Using interdisciplinary data for a grassland-domi-
nated landscape from the central French Alps, where animal
husbandry and tourism are themain activities, we demonstrate
how this trait-based approach improves on a pure land-use
approach, and how it advances understanding of ecological
constraints to, and opportunities for, the delivery of multiple
services.
136 S. Lavorel et al.
! 2010 The Authors. Journal of Ecology ! 2010 British Ecological Society, Journal of Ecology, 99, 135–147

Materials and methods
STUDY SITE AND FIELD MEASUREMENTS
The Lautaret study site (45"03¢ N, 6"24¢ E) is located in the Central
French Alps on the south-facing slopes of Villar d’Arene. The total
area is 13 km2 and the elevation ranges from 1552 to 2442 m a.s.l. A
detailed site description can be found in (Quetier, Thebault & Lavorel
2007). Land use legacies can play a key role in determining current
vegetation, soil properties and ecosystem functioning (Bruun et al.
2001; Fraterrigo, Turner & Pearson 2006), especially in mountain
grasslands (Maurer et al. 2006). Therefore we considered land use
trajectories, the combinations between past and present land use
mapped at site level using a combination of cadastral (1810 to pres-
ent) and aerial photographic data (since 1952) (Fig. 2) (Quetier,
Thebault & Lavorel 2007 – see Girel et al. 2010 for a detailed analysis
of land use history). We analysed eight trajectories, referred to as
‘land use’ henceforth, three on previously cultivated terraces [cur-
rently fertilized and mown (LU1), mown (LU2), or unmown and
grazed in spring and autumn (LU3)], three on never cultivated perma-
nent grasslands with a multi-century history of mowing [currently
mown (LU4), unmown and summer-grazed (LU5), and neither
mown nor grazed (LU6) ‘Festuca grasslands’ – dominated by the
large perennial grass Festuca paniculata], one on never mown summer
grasslands (>2000 m) (LU7) and one on steep (>30") grazed slopes
(LU8). Previous analyses have demonstrated significant differences in
soils, plant species and functional composition and ecosystem proper-
ties across these land use categories, reflecting both the effects of past
land use (presence or absence of cultivation) and current practices
(presence or absence of mowing and of fertilization) (Quetier, Theba-
ult & Lavorel 2007; Robson et al. 2007). All data were referenced in
a Geographic Information System including also a 10-m Digital
ElevationModel under ArcGiS 9.2, ESRI.
Vegetation, plant functional trait, ecosystem and environmental
data (Fig. 1) were collected for fifty-seven 30 · 30 m permanent plots
stratified by land use (eight categories), landscape sector (four sectors
defined based on local toponymy and representing homogenous
topography and distance to the village), and altitude within each of
these. Vegetation composition surveys used the BOTANAL method
to estimate species relative biomass (Lavorel et al. 2008). Plant vege-
tative traits [vegetative height (VH), leaf drymatter content (LDMC),
leaf nitrogen and phosphorus concentrations (LNC and LPC)]
assumed as relevant to ES provision (Quetier et al. 2007) were mea-
sured for all species making up 80% of cumulated biomass following
standard protocols (Garnier et al. 2007). For each trait we calculated
community-weighted mean (CWM; Garnier et al. 2004) and func-
tional divergence (FD, using the formulation by Mason et al. 2003)
using the F-Diversity package (Di Rienzo, Casanoves & Pla 2008).
Soil texture, soil total carbon and nitrogen, and nitrogen and
1900
1800
2000
2200
2300
1700
2100
1600
1800
0
Land use trajectories
Field plotsAltitude
Mown and fertilized terracesMown terracesUnmown terracesMown permanent grasslands
Unmown permanent grasslandsAbandonned permanent grasslandsAlpine grazed meadowsSteep grazed slopes
0 1 km0.5
Non grasslands
Fig. 2. Field site and land use types. Land use trajectories are the combinations between past and present land use, with three land uses on previ-ously cultivated terraces: fertilized and mown, mown, unmown and grazed in spring and autumn; three on permanent, never-cultivated perma-nent grasslands: mown, unmown and summer grazed, and neither mown nor grazed ‘Festuca grasslands’; never mown summer grasslands(>2000 m); steep (>30") grazed slopes. Sampled sites are markedwithwhite dots.
Topographyaltitude
Land useSoil properties
Water holding capacity (WHC)Fertility (NNI, PNI)
Community-level traits (CWM, FD)Vegetative height (VH)
Leaf dry matter content (LDMC)Leaf nitrogen concentration (LNC)
Leaf phosphorus concentration (LPC)Flowering onset (Flo)
Ecosystem propertiesGreen biomass production
Digestibility, crude prot.cont.Litter Mass
Soil carbon contentFlowering onset mean & div.
Plant species diversity
Ecosystem servicesAgronomic value
Cultural valuePollination valueSoil carbon stock
Direct effects
Trait effects = indirect effects
Trait responses
Fig. 1. Conceptual framework for the analysis of ecosystem proper-ties underlying ecosystem services. The analysis identifies successivelythe direct effects of land use on ecosystem properties (LU); the com-bined direct effects of land use and abiotic variables on ecosystemproperties (LU + abiotic); and the combination of abiotic effectswith indirect effects via plant functional diversity (trait community-weightedmean and functional divergence) (trait + abiotic).
Plant functional traits and provision of multiple ecosystem services 137
! 2010 The Authors. Journal of Ecology ! 2010 British Ecological Society, Journal of Ecology, 99, 135–147

phosphorus nutrition indices (NNI and PNI, respectively) were also
measured in each plot using standard protocols (Garnier et al. 2007).
Soil water holding capacity (WHC) was calculated using texture and
total carbon data (Osty 1971). Radiation was estimated within the
GIS using the site’s 10-m resolution Digital Elevation Model. Green
and litter biomass were estimated using calibrated visual estimates
(Lavorel et al. 2008) in 2007, 2008 and 2009, and analyses used a
smoothed mean over the three years with 2008 as a reference. Crude
protein content (CPC) of green biomass was estimated using near
infrared spectrometry (Pontes Da Silva et al. 2007) for a subset of 24
plots distributed across land uses and altitudes. Flowering phenology
(date of flowering onset and duration of flowering) was surveyed for
all species contributing to 80% cumulated biomass in 2007 and 2008
for a subset of 39 plots distributed across land uses. Date of flowering
onset was transformed to growing degree days adjusted to altitude
with a 0.6 "C 100 m)1 decrease validated with two weather stations
located at 1600 m and 2100 m. Functional divergence in flowering
dates (FD_Flo) was calculated using a dedicated Excel! Macro
(Leps et al. 2006).
STATIST ICAL ANALYSES
Variations across the landscape in CWM and FD for the four traits
of the vegetative phase were modelled with general linear models
(GLM) combining land use (one categorical variable) and abiotic
variables (four continuous variables: altitude, radiation, WHC, NNI,
PNI). Variation in biogeochemical ecosystem properties (EP) (green
biomass production, litter mass, fodder crude protein content, soil C)
was modelled using three alternative general linear models (Fig. 1):
(i) land use alone (LU; categorical variable with eight states), (ii) land
use and all abiotic variables (continuous variables) (LU + abiotic),
and (iii) traits CWM and FD and abiotic variables (continuous vari-
ables; trait + abiotic) following Diaz et al. (2007). The land-use-
alone model represents the ‘default’ model that would be used in the
absence of ecological or terrain data, as done in studies using land use
as a proxy for ES (Eigenbrod et al. 2010). The second model com-
bines land use and abiotic effects and provides a purely geographic
representation in the absence of ecological knowledge (e.g. Gret-
Regamey et al. 2008; Kienast et al. 2009). The comparison between
these first two models identifies effects of abiotic variables that may
need to be taken into account in broad-scale ES assessments. Finally,
the thirdmodel combines trait and abiotic effects as proposed byDiaz
et al. (2007). The comparison between this model and the land-use-
alone model identifies the need for site-based information beyond a
land use or land cover proxy, and the comparison with the land
use + abioticmodel assesses the value of additional ecological (trait)
information. Given the likely priority of abiotic effects over biotic
effects (Grime 1998 – seeDiaz et al. 2007) a trait-alonemodel was not
considered in the comparison. However, a trait-alone model was also
tested in preliminary analyses for those EP (green biomass produc-
tion and crude protein content) for which significant abiotic effects
were retained in the combined trait and abiotic model. It produced
very similar results in terms of fit and parsimony to the combined
model for green biomass production, whereas for crude protein con-
tent the trait-alone model performed considerably worse than the
combined model (44% vs. 62% variance explained). Therefore we
present only the trait + abiotic model, given that for litter and soil
carbon content this was actually a trait-alonemodel (see Table 3).
Simpson species diversity was modelled using the LU + abiotic
model given that functional diversity should be a consequence of spe-
cies diversity rather than the reverse (Leps et al. 2006). Phenological
ecosystem properties (CWM onset of flowering and FD_Flo, which
in fact are trait functional diversity measures) were modelled using
mixed models with land use and abiotic variables as fixed effects
(LU + abioticmodel) and year as a random effect. All analyses were
run using Genstat 11th Edition (VSN International, Hempstead,
UK) using all subsets regression (abiotic variables, traits, biogeo-
chemistry, species diversity) and residual estimation of maximum
likelihood (REML) (phenology) with quality of prediction (adjusted
R) and parsimony using the Akaike criterion as criteria for model
selection within eachmodel type (LU + abiotic or trait + abiotic).
MAPPING ECOSYSTEM PROPERTIES AND ECOSYSTEM
SERVICES
Abiotic variables (WHC, NNI, PNI), and CWM and FD for each
trait were modelled for each 20 · 20 m pixel using GLM estimated
effects for each land use category and estimated regression coeffi-
cients with abiotic variables (step 1). As a second step, ecosystem
properties for each pixel were calculated and mapped using model
estimates for effects of land use types (LU andLU + abioticmodels),
and for regression coefficients on abiotic variables and traits
(LU + abiotic and trait + abioticmodels). For each pixel these cal-
culations were applied to mapped estimates of abiotic variables and
trait CWM and FD provided by step 1. This second step is critically
novel as compared to a direct application of the model by Diaz et al.
(2007) in that we explicitly modelled the responses of trait commu-
nity-weightedmeans and functional divergences to environment prior
to evaluating their effects on ecosystem properties. Such an approach
is the key to the explicit representation of functional variation across
the landscape, as opposed to the use of unique trait values within each
land use (seeAlbert et al. 2010).
For each EP we thus produced one map based on pure land use
effects (LU) and one map based on the combination of abiotic and
traits effects (trait + abiotic). Given that the number of measured
plots was insufficient for splitting into calibration and validation sub-
sets, the two models were compared visually using mapped differ-
ences in estimates and comparisons across models of calculated total
EP values per land use type.
Ecosystem services were related to ecosystem properties according
to indicators identified by stakeholders (Quetier et al. 2007, 2010) or
experts (e.g. Martin et al. 2009) (Table 1). This approach based on
social evaluation of ES rather than on a top-down scientific expert
approach (e.g. Millennium Ecosystem Assessment 2005) makes it
possible to quantify service provision as perceived by stakeholders
(Bryan et al. 2010). Although necessarily site-specific (e.g. the nega-
tive perception of litter accumulation for cultural value – see Quetier
et al. 2010 for discussion), such an approach reveals how ecosystems
meet local stakeholders’ expectations for services. Based on percep-
tions by stakeholders from the agricultural sector and Martin et al.
(2009), grassland agronomic value was the sum of green biomass
(fodder quantity), fodder quality as indicated by crude protein con-
tent, and flowering phenology (mean community onset CWM_Flo
and diversity of flowering onset dates FD_Flo, each with a 0.5 weight
so as to give an even weight to phenology as compared to fodder
quantity and quality). The inclusion of phenology into agricultural
value is important because phenology drives management strategies
based on the sharp loss of fodder quality once flowering has begun,
especially in grasses (Ansquer et al. 2009). Based on perceived indica-
tors (Quetier et al. 2010) cultural value was the sum of positive effects
of species diversity and flowering diversity (FD_Flo) minus litter
mass. A single EP may simply be mapped onto a single ES as for soil
carbon content and climate regulation. Overall, following De Chazal
et al. (2008), we used simple rather than weighted sums of EP
138 S. Lavorel et al.
! 2010 The Authors. Journal of Ecology ! 2010 British Ecological Society, Journal of Ecology, 99, 135–147

to derive ES, because attribution of specific weights would require
in-depth analyses of perception and is highly sensitive to both stake-
holder sample and context (see also Quetier et al. 2009). Also, this
method implicitly assumes linear mapping of EP to ES and an explo-
ration of sensitivity of ES projections to their kinds of relationships to
EP (Koch et al. 2009) is beyond the scope of this study. Ecosystem
service maps produced in step 3 were simple sums of maps for rele-
vant EPproduced by step 2 (see Table 3) after scaling to a 0–100 base-
line and trimming outliers to the 5–95%quantiles (Venables &Ripley
2002). Given that the entire landscape is used for agriculture produc-
tion, we chose to keep continuous ES values rather than applying
threshold values to assign provision (or not) of an ES to a given pixel
(e.g. Chan et al. 2007).
ANALYSING MULTIPLE ECOSYSTEM SERVICES
The ability of different landscape locations to provide multiple ES
was assessed additively across ES. A givenEP could contribute to sev-
eral ES, e.g. diversity of flowering onset dates (FD_Flo) contributed
to agronomic, cultural and pollination services; therefore, to avoid
double counts, the multiple ES map was a sum of maps for uncorre-
latedEP using 0–100 scaled values. To understand trade-offs and syn-
ergies underlying the provision of multiple ES, a PCA on sampled
plots was used to characterize underlying patterns of correlation
among EP. Coordinates on the first two axes of PCAwere then calcu-
lated for each map pixel using the linear combinations of EP pro-
duced by the PCA, and the two corresponding maps represented
areas of trade-offs or synergies.
Results
LANDSCAPE VARIATIONS IN VEGETATION FUNCTIONAL
COMPOSIT ION
Community mean traits were strongly driven by land use but
also influenced by altitude (Table 2; see Appendix S1 and
Fig. S1 in Supporting Information). Land use determined
community mean vegetative traits directly (LDMC), indirectly
(LNC) or through mixed direct and indirect effects (VH and
LPC), with indirect effects resulting from fertility responses.
Altitude had additive direct negative effects for LNC and
LPC. Mean community onset of flowering responded to land
use, with additive delays due to decreased temperatures with
altitude. Functional divergence within communities was vari-
able but, with the exception of LPC and onset of flowering,
had little relationship to land use or topography (Table 2).
DIRECT AND INDIRECT EFFECTS OF LAND USE AND
ABIOTIC FACTORS ON ECOSYSTEM PROPERTIES
Models including abiotic factors or traits provided overall bet-
ter predictions of EP than land-use-alone models, with greater
nuances on the predicted effects of land use changes such as
cessation of fertilization or mowing (Table 3; Appendix S1;
Fig. S2). The trait + abiotic model was also the most parsi-
monious overall for green biomass and soil carbon, while both
the trait + abiotic and LU models had similar empirical sup-
port (i.e. differences in AIC < 2) for litter mass, and the LU
model was most parsimonious for crude protein content in
spite of a very large increase in prediction ability (adjusted-R
increasing from 43 to 62 from the LU to the trait + abiotic
model).
Green biomass production, predicted by mean community
traits VH and LNC and soil WHC, was highest in fertilized
and mown terraces and in unmown Festuca grasslands, and
least in unfertilized terraces and summer grasslands (Fig. 3a).
Production was reduced by cessation of fertilization or of
mowing in terraces that both promoted shorter and nitrogen-
poorer plants, but it increased with cessation of mowing in old
grasslands due to the dominance by the large grass Festuca
paniculata. Fodder quality, predicted by mean community
traits VH and LDMC andWHC, was significantly reduced by
cessation of mowing, which promoted plants with denser tis-
sues (higher LDMC), both in terraces and in Festuca grass-
lands, and improved by fertilization, which increased plant
stature and decreased leaf density (LDMC) in terraces
(Fig. 3b). Litter mass, predicted by VH, LPC (with CWM and
FD for both) and LDMC (CWMonly), was greatest following
cessation of mowing in both terraces and old grasslands
(Fig. 3c). For terraces especially, as well as for other grazed
grasslands, litter significantly decreasedwith altitude, reflecting
a decrease in CWM_LPC. Soil carbon stocks, predicted by
mean community traits LDMC and LPC, were greatest in
mown grasslands, especially in fertilized ones, and in summer
grasslands (Fig. 3g). They decreased with altitude following
Table 1. Mapping of ecosystem properties to ecosystem services based on stakeholder perception (agronomic value, cultural value; fromQuetier
et al. 2007, 2010) and expert opinion (agronomic value, pollination, soil carbon)
Ecosystemservice
Ecosystem properties
Greenbiomass
Littermass
Crude proteincontent
CWMflowering
FDflowering
Speciesdiversity
Soilcarbon
Agronomic 1 1 ! !Cultural )1 1 1Pollination 1 1Soil carbon 1
The table presents coefficients used for the summing of individual ecosystem properties to a given ecosystem service based on stakehold-ers’ perceptions, given positive (+1) or negative ()1) contributions. The overall positive contribution of phenology to agronomic valuewas divided into two variables, community mean and functional divergence of flowering dates, with a weight of ! each (see ‘Materialsand methods’ section).
Plant functional traits and provision of multiple ecosystem services 139
! 2010 The Authors. Journal of Ecology ! 2010 British Ecological Society, Journal of Ecology, 99, 135–147

CWM_LPC, especially in mown Festuca grasslands and sum-
mer grasslands, which were also those grasslands with lower
production. Plant species diversity increased with soil nitrogen
availability (NNI), which reflected mainly land use and a small
effect of altitude through effects of WHC on NNI (Fig. 3f,
Table 3).
LANDSCAPE PATTERNS IN ECOSYSTEM SERVICE
PROVIS ION
Ecosystem services patterns were comparable between the pure
land-use and the trait-based models, although as for EP, abso-
lute effects of land use changes were moderated by trait-based
models (Appendix S1). Agronomic value was highest for sum-
mer grasslands, which combined high fodder quality and
diverse flowering phenology, but had low production due to
short vegetation stature (Fig. 3i). Fertilized andmown terraces
also had high agronomic value by combining high fodder
quantity (green biomass) and quality resulting from tall stature
and high LNC, but less diverse flowering dates. Festuca grass-
lands, especially when unmown, had a lower value in spite of
their high stature and production, due to their poor fodder
quality resulting from low LNC. Unmown terraces and steep
slopes had the poorest value with low scores for all four EP.
Table 2. Summary of statistics fromGeneral LinearModels of abiotic variables and functional diversity components, trait community-weighted
mean (CWM) and functional divergence (FD)
Variable Model R AIC d.f. LUT Altitude Radiation WHC NNI PNI
Abiotic variablesWHC Single <0.001 0.009 0.024
Multiple 67.1 62.3 9 <0.001 0.031 –
NNI Single <0.001 0.035 0.015 <0.001Multiple 55.8 58.6 9 <0.001 – – 0.045
PNI Single <0.001 0.003 0.134 0.309Multiple 43.5 60.4 9 0.001 0.05 – –
Fertility index Single <0.001 0.712 0.506 0.06Multiple 59.5 56.6 8 <0.001 – – –
TraitsCWM_VH Single <0.001 0.035 0.024 0.031 <0.001 0.749
Multiple 79.0 67.8 9 <0.001 – – – 0.004 –
CWM_LDMC Single 0.01 0.044 0.261 0.488 0.205 0.011Multiple 22.4 55.6 8 0.01 – – – – –
CWM_LNC Single <0.001 <0.001 0.272 0.862 0.002 <0.001Multiple 58.5 62.9 3 – 0.008 – – – –
CWM_LPC Single <0.001 <0.001 0.084 0.332 0.177 <0.001Multiple 80.9 59.6 10 <0.001 0.044 – – 0.072 –
CWM-Flo Single 0.012 0.259 0.201 0.072 0.038 0.232Multiple 45.2 21.5 6 0.012 – – – – –
FD_VH Single 0.007 0.023 0.417 0.713 0.369 0.024Multiple 24.2 64.9 8 0.007 – – – – –
FD_LDMC Single 0.268 0.627 0.279 0.415 0.198 0.475Multiple NA NA NA NA NA NA NA NA NA
FD_LNC Single 0.072 0.465 0.2 0.64 0.021 0.233Multiple 12.7 65.8 8 0.072 – – – – –
FD_LPC Single <0.001 0.018 0.263 0.517 0.173 <0.001Multiple 49.9 59.9 10 <0.001 0.004 – 0.015 – –
FD_Flo Single 0.937 0.001 0.957 0.271 0.24 0.161Multiple 35.5 31.2 1 – 0.001 – – – –
For onset of flowering we used Residual Estimates Maximum-Likelihood models with year as a random effect. Single-term estimatesand combined model selection were obtained using ‘all subsets regression’ with adjusted-R and Akaike information criterion (AIC) asmodel ranking criteria. %var, percentage variance explained; d.f., number of degrees of freedom; LUT, land-use type; WHC, water hold-ing capacity; NNI, nitrogen nutrition index; PNI, phosphorus nutrition index; GFI, generalized fertility index; VH, vegetative height;LDCM, leaf dry matter content; MNC, leaf nitrogen concentration; LPC, leaf phosphorus concentration; Flo, date of onset of flowering;NA, model not available. Preliminary variable selection was used to choose the best descriptors of fertility for each response variable.Grey cells indicate variables that were not relevant for particular analyses. P-values are indicated for each response–explanatory variablecombination. – indicates variables that were not retained in best multiple regression models.
140 S. Lavorel et al.
! 2010 The Authors. Journal of Ecology ! 2010 British Ecological Society, Journal of Ecology, 99, 135–147
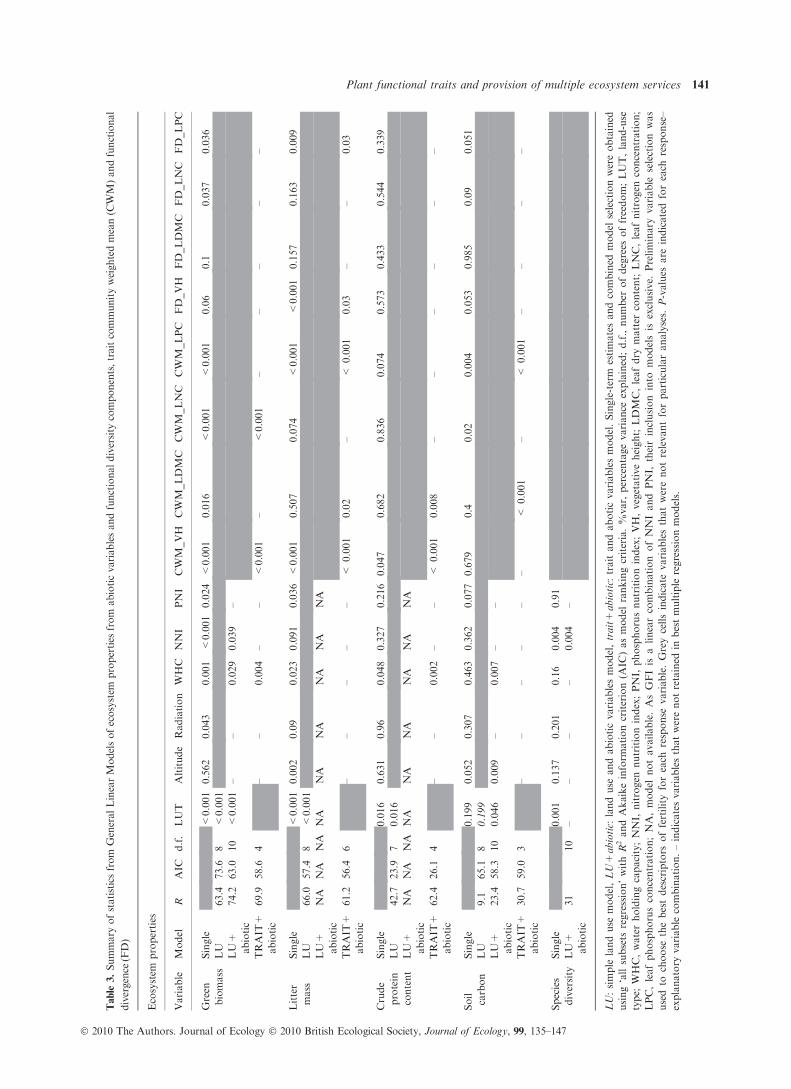
Table
3.Summaryofstatistics
from
General
LinearModelsofecosystem
properties
from
abioticvariab
lesan
dfunctional
diversity
components,traitcommunityweigh
tedmean(C
WM)an
dfunctional
divergence
(FD)
Ecosystem
properties
Variable
Model
RAIC
d.f.
LUT
Altitude
Rad
iation
WHC
NNI
PNI
CWM_V
HCWM_L
DMC
CWM_L
NC
CWM_L
PC
FD_V
HFD_L
DMC
FD_L
NC
FD_L
PC
Green
biomass
Single
<0.001
0.56
20.04
30.00
1<
0.001
0.02
4<
0.001
0.01
6<
0.001
<0.001
0.06
0.1
0.03
70.03
6LU
63.4
73.6
8<
0.001
LU+
abiotic
74.2
63.0
10<
0.001
––
0.02
90.03
9–
TRAIT
+ab
iotic
69.9
58.6
4–
–0.00
4–
–<
0.001
–<
0.001
––
––
–
Litter
mass
Single
<0.001
0.00
20.09
0.02
30.09
10.03
6<
0.001
0.50
70.07
4<
0.001
<0.001
0.15
70.16
30.00
9LU
66.0
57.4
8<
0.001
LU+
abiotic
NA
NA
NA
NA
NA
NA
NA
NA
NA
TRAIT
+ab
iotic
61.2
56.4
6–
––
––
<0.00
10.02
–<
0.00
10.03
––
0.03
Crude
protein
content
Single
0.01
60.63
10.96
0.04
80.32
70.21
60.04
70.68
20.83
60.07
40.57
30.43
30.54
40.33
9LU
42.7
23.9
70.01
6LU+
abiotic
NA
NA
NA
NA
NA
NA
NA
NA
NA
TRAIT
+ab
iotic
62.4
26.1
4–
–0.00
2–
–<
0.00
10.00
8–
––
––
–
Soil
carbon
Single
0.19
90.05
20.30
70.46
30.36
20.07
70.67
90.4
0.02
0.00
40.05
30.98
50.09
0.05
1LU
9.1
65.1
80.19
9LU+
abiotic
23.4
58.3
100.04
60.00
9–
0.00
7–
–
TRAIT
+ab
iotic
30.7
59.0
3–
––
––
–<
0.00
1–
<0.00
1–
––
–
Species
diversity
Single
0.00
10.13
70.20
10.16
0.00
40.91
LU+
abiotic
3110
––
––
0.00
4–
LU:simple
landuse
model,LU+
abiotic:
landuse
andab
ioticva
riab
lesmodel,trait+
abiotic:
traitan
dab
oticva
riab
lesmodel.Single-term
estimates
andcombined
model
selectionwereobtained
using‘allsubsets
regression’withR2an
dAkaikeinform
ationcriterion(A
IC)as
model
rankingcriteria.%
var,
percentage
varian
ceexplained;d.f.,number
ofdegrees
offreedom;LUT,land-use
type;
WHC,water
holdingcapacity;
NNI,
nitrogennutritionindex;PNI,
phosphorusnutritionindex;VH,vegetative
heigh
t;LDMC,leaf
dry
mattercontent;LNC,leaf
nitrogenconcentration;
LPC,leaf
phosphorusconcentration;NA,model
notav
ailable.AsGFIis
alinearcombination
ofNNIan
dPNI,
theirinclusion
into
modelsis
exclusive.Preliminaryvariab
leselection
was
usedto
choose
thebestdescriptors
offertilityforeach
response
variab
le.Greycellsindicateva
riab
lesthat
werenotreleva
ntforparticularan
alyses.P-values
areindicated
foreach
response–
explanatory
variab
lecombination.–indicates
variab
lesthat
werenotretained
inbestmultiple
regressionmodels.
Plant functional traits and provision of multiple ecosystem services 141
! 2010 The Authors. Journal of Ecology ! 2010 British Ecological Society, Journal of Ecology, 99, 135–147
Overall, agronomic value increased with altitude, which had
positive effects on all four EP, especially flowering mean date
and diversity. Cultural value was high for mown grasslands,
especially in fertilized, and mown terraces, and for summer
grasslands, which combined high species diversity, highly
diverse flowering phenology and low litter mass, it was lowest
for unmown grasslands, especially Festuca grasslands, with the
opposite attributes (Fig. 3j). This was a direct land use effect
for species diversity but a trait-based effect through litter accu-
mulation associated with high LDMC and tall vegetation in
unmown Festuca grasslands (Table 3). Climate regulation
through soil C sequestration was approximated by soil carbon
stocks (soil C) as described above. Pollination followed a pat-
tern close to that of cultural value, as species diversity and
diversity in flowering dates were common to these services,
while species diversity was strongly negatively correlated with
litter (R2 = 0.98,P < 0.001). Total regulation value, combin-
ing soil C stocks and pollination, was highest in mown (inter
alia) and summer grasslands, with maximum values for fertil-
ized terraces (due to high C stocks and species diversity) and
summer grasslands (with high values for all EP) (Fig. 3i). It
was lowest for unmown terraces, followed by unmown Festuca
grasslands, both having low pollination value resulting from
low species diversity and, for unmown terraces, particularly
lowC stocks due to lowLNC.
PROVIS ION OF MULTIPLE ECOSYSTEM SERVICES
Themodels summing EP showed that fertilized andmown ter-
races offered the greatest provision and synergy among ES
(Fig. 3k). Summer grasslands were also ES hot spots, despite
their low production, which decreased their agronomic value.
Mown but unfertilized terraces and mown permanent
grasslands showed similar patterns, but with lower provision
intensity for all services. In contrast, unmown Festuca grass-
lands were areas of trade-offs among services, with large
production potential but low cultural and soil C stocks value.
Steep slopes were also ES trade-off areas with lower agronomic
value and low C stocks, but higher cultural and pollination
values. Finally, unmown terraces delivered the least services,
with low provision of all ES. Overall, multi-service patterns
were strongly consistent between the pure land-use and the
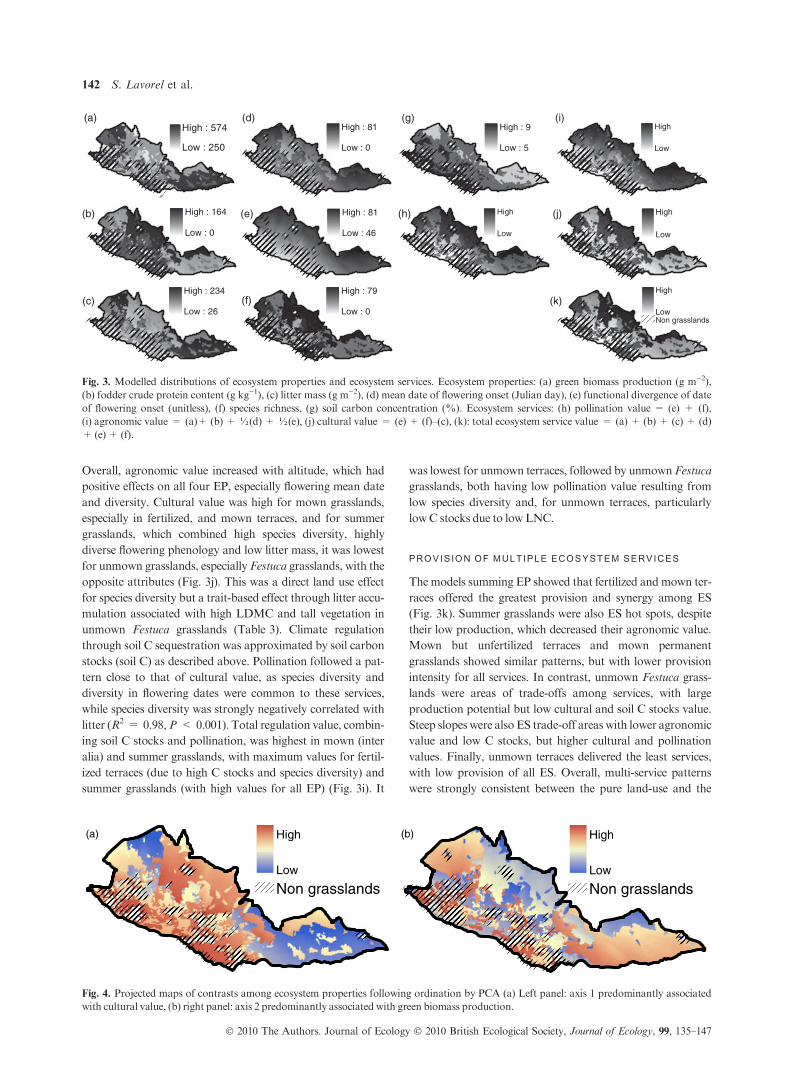
High : 574
Low : 250
High : 81
Low : 0
High : 9
Low : 5
High
Low
High : 164
Low : 0
High : 81
Low : 46
High
Low
High
Low
High : 234
Low : 26
High : 79
Low : 0
High
LowNon grasslands
(a)
(b) (e) (h) (j)
(k)(c)
(d) (g) (i)
(f)
Fig. 3. Modelled distributions of ecosystem properties and ecosystem services. Ecosystem properties: (a) green biomass production (g m)2),(b) fodder crude protein content (g kg)1), (c) litter mass (g m)2), (d) mean date of flowering onset (Julian day), (e) functional divergence of dateof flowering onset (unitless), (f) species richness, (g) soil carbon concentration (%). Ecosystem services: (h) pollination value = (e) + (f),(i) agronomic value = (a)+ (b) +!(d) +!(e), (j) cultural value = (e) + (f)–(c), (k): total ecosystem service value = (a) + (b) + (c) + (d)+ (e)+ (f).
High
Low
Non grasslands
High
Low
Non grasslands
(a) (b)
Fig. 4. Projected maps of contrasts among ecosystem properties following ordination by PCA (a) Left panel: axis 1 predominantly associatedwith cultural value, (b) right panel: axis 2 predominantly associated with green biomass production.
142 S. Lavorel et al.
! 2010 The Authors. Journal of Ecology ! 2010 British Ecological Society, Journal of Ecology, 99, 135–147

trait-based models (Appendix S1, Fig. 3g,h), although the
trait-basedmodel highlighted increased ESwith altitudewithin
land use types. The PCA of EPs elucidated these synergies and
trade-offs (Fig. 4, Fig. S4). The first axis was driven by con-
trasts between on the one hand high plant diversity, fodder
quality (CPC) and soil C in terraces and summer grasslands,
and on the other hand high litter accumulation and low diver-
sity of flowering phenology in unmown Festuca grasslands.
This axis therefore represented contrasts in cultural value, but
also potential conflicts among components of regulation ser-
vices soil C stocks and pollination. The second axis was mainly
driven by contrasts in green biomass production from fertilized
terraces (highest production) to summer grasslands (lowest
production). It also highlighted a trade-off among fodder
quantity and quality contrasting high production of poor qual-
ity in unmown Festuca grasslands with low production of bet-
ter quality in summer grasslands, although fertilized terraces
had high values for both, and thereby also high agronomic
value. Finally, orthogonality between cultural value (axis 1)
and production (axis 2) indicated the possibility of reconciling
both objectives.
Discussion
INDIRECT LAND USE EFFECTS ON ECOSYSTEM
SERVICES THROUGH PLANT FUNCTIONAL TRAITS
Land use or land cover is a practical but imperfect surrogate
for ES assessment (Eigenbrod et al. 2010). This is the first
study identifying direct and indirect effects of land use and
associated abiotic environmental variables on ES using alter-
native models for ecosystem properties at a landscape scale
(Fig. 1). All modelled EP showed a direct land use signal.
Adding abiotic variables describing topography (altitude)
and soil quality (fertility and water holding capacity, them-
selves related to land use) (LU + abiotic model), or repre-
senting indirect effects through plant functional traits
(trait + abiotic model) improved models by often similar lev-
els. With the exception of soil carbon, which was also poorly
modelled by land use alone (LU model), all EP were remark-
ably well explained by the statistical models, especially trait-
based (trait + abiotic) or full abiotic (LU + abiotic) models,
which afforded better prediction and, in all but the case of
litter, equal or better parsimony than the pure land use
model (LU). Overall, the best trait + abiotic models affor-
ded prediction of 60–70% of the variance in EP, with usually
two traits and often soil properties (WHC in most cases,
nitrogen fertility for the LU + abiotic model of green bio-
mass production) and altitude (in the LU + abiotic model).
Such a continuous quantification of land use effects within a
single land cover type (permanent grasslands) goes one step
further than categorical modifiers based on land condition
(Naidoo & Ricketts 2006; Reyers et al. 2009); but see (Gret-
Regamey et al. 2008; Willemen et al. 2010). Detailed models
including abiotic and ⁄or trait effects captured abiotic hetero-
geneity within land use types, e.g. a 25% variation in green
biomass production, litter accumulation or soil C. Green bio-
mass production measurements for an additional set of 34
independent points in 2010, covering a slightly greater altitudi-
nal range for summer grasslands (100 m higher), validated the
representativity of our core sample and predictions by the
trait + abioticmodel (significant regression between observed
and predicted green biomass, P = 0.005). Detailed models
also showed that simple land use models overestimated man-
agement change impacts by neglecting increases in predicted
EP with altitude within land use types, with marked effects
especially for summer grasslands and steep slopes. Altitude
effects were detected for all EP either directly in abiotic models
(LU + abiotic) or indirectly in trait-based models (trait +
abiotic) through the influence of altitude on community traits
(CWM) and field capacity (WHC), and were additive to land
use, which is also determined by topography at this site as
in other mountain systems (Mottet et al. 2006; Gellrich &
Zimmermann 2007). These results confirm that for ES assess-
ments in mountainous topography, and especially altitude and
its effects on bioclimate,must be taken into account in addition
to land cover (Gret-Regamey et al. 2008; Kienast et al. 2009).
Moreover, the prominent role of WHC in our models empha-
sizes important effects of current, and especially past, land use
on soils. These include fine soil loss and increased stoniness
resulting from past cropping on terraces (Bakker et al. 2008),
long-term effects of organic fertilization on terraces (Robson
et al. 2007), as well as continued export of organic matter
through mowing, which has over the course of history con-
cerned the entire landscape except summer grasslands and
steep slopes.
Trait-based models are data-intensive, especially when con-
sidering intraspecific trait variation in relation to land use
(Garnier et al. 2007), but data collection over entire landscapes
can be facilitated by standardized and rapid methods (Corne-
lissen et al. 2003; Lavorel et al. 2008). For applications such as
mapping of ecosystem properties and ES, trait measurements
for randomly sampled individuals (Gaucherand & Lavorel
2007; Baraloto et al. 2009) or for entire swards or canopies
(Stewart, Bourn & Thomas 2001) offer an interesting alterna-
tive to the tedious collection of species-level trait data. Land-
scape- and especially regional-scale applications can also now
strongly benefit from the availability of plant functional trait
data bases (Kleyer et al. 2008; Kattge et al. 2010), although
caution is warrantedwith respect to trait variability in response
to especially fertility (Lavorel et al. 2009). Such data bases will
make it possible to assess ES provision at regional scale by cou-
pling trait and vegetation data bases. Finally, remotely sensed
trait surrogates such as spectral signatures of leaf chemistry
(Ustin&Gamon 2010) also offer great promise for the applica-
tion of such trait-basedmodels over large scales.
ECOLOGICAL MECHANISMS UNDERLYING ECOSYSTEM
SERVICE RESPONSES TO LAND USE
Trait-based assessments of global change effects on ecosys-
tems and ES can reduce uncertainty in projections of land
futures (Diaz et al. 2007). Prediction of ES change through
traits hinges on overlaps of response and effect traits, where
Plant functional traits and provision of multiple ecosystem services 143
! 2010 The Authors. Journal of Ecology ! 2010 British Ecological Society, Journal of Ecology, 99, 135–147

traits that determine response to abiotic and land use changes
are equal or correlated to traits determining effects on ecosys-
tem functioning (Lavorel & Garnier 2002). Here all vegeta-
tive traits responded strongly to land use, except LNC, which
had an indirect response through fertility effects. These same
traits underpinned relevant EP, thereby providing a link from
land use to EP. There is increasing evidence for such overlaps
in response and effect traits (Suding & Goldstein 2008), of
which this is the first landscape-scale demonstration. In addi-
tion, we were able to integrate abiotic (topography and soils)
and land use effects with a parsimonious set of traits, namely
plant height and key leaf traits associated with plant resource
economy (Diaz et al. 2004). These traits have demonstrated
links to biomass production, litter decomposition, fodder
quality or soil water retention from species (Kazakou et al.
2006; Pontes Da Silva et al. 2007) to community level (Gar-
nier et al. 2004, 2007; Gross et al. 2008; Fortunel et al. 2009).
Vegetative height and LDMC were strong response traits
with effects on several EP, and could therefore be used as
functional markers of ES change (Garnier et al. 2004). Con-
sidering landscape distribution of EP in response to land use
and abiotic factors requires working at community level,
where trait responses and effects are indicated by commu-
nity-weighted means and functional diversity (Diaz et al.
2007; Garnier et al. 2007). Analyses of this landscape-wide
data set confirmed the greater relevance of CWM traits than
of functional divergence identified for a subset of 15 plots
with similar altitudes (Diaz et al. 2007). Only for litter accu-
mulation did the inclusion of FDs for vegetative height and
leaf phosphorus concentration markedly improve the predic-
tion from models using CWM traits (61% vs. 44% variance
explained). Negative effects of FD on litter accumulation sug-
gested improved decomposition of more diverse mixes of lit-
ter types (Gartner & Cardon 2004; Scherer-Lorenzen 2008).
ASSESSING MULTIPLE ECOSYSTEM SERVICES
Ecosystem services were even-weight sums of relevant EP, and
likewise for the assessment of multiple services (De Chazal
et al. 2008). Alternativemethodsmay use weights elicited from
stakeholders (Gimona & van der Horst 2007) (for example,
farmers at this site rank fodder quantity, phenology and qual-
ity differently depending on field functions in their farming sys-
tem) or different weights across stakeholder groups (see De
Chazal et al. 2008), or across alternative future scenarios (Que-
tier et al. 2009). The following discussion focuses on the bene-
fits of plant functional trait information to understand the
mechanisms underlying ES provision. Through its component
EP, agronomic value was influenced evenly by vegetative
height and leaf traits (LNC andLDMCbeing negatively corre-
lated), with soil WHC and altitude as modifiers. These traits,
as well as WHC, propagated a strong land use signal and a
fairly strong altitude signal (Table 3). The negative correlation
between green biomass production (fodder quantity) and
Crude Protein Content (fodder quality) (PCA axis 2) reflects
opposite effects of plant height on these two EP and captures
effects of Festuca paniculata and other tall grasses with poor
nutritive quality, especially after flowering, in contrast with
smaller species of high value such as legumes (e.g. Astragalus
danicus, Oxytropus campestris) and some dicots (e.g. Helian-
themumgrandiflorum,Potentilla aurea) found in summer grass-
lands. Having species with tall stature and ⁄or high LNC (e.g.
Dactylis glomerata, Heracleum sphondylum, Onobrychis
montana), fertilized terraces scored high for both quantity and
quality. Height and leaf traits such as LNC have indeed been
shown to be independent axes of functional variation over con-
tinents (Diaz et al. 2004) and for this site (Gross, Suding &
Lavorel 2007). Diversity of flowering dates (PCA axis 1) added
a dimension of variation in agronomic value by being indepen-
dent from these vegetative traits. Such a combination of inde-
pendent EP based on independent traits supported the overall
value of summer grasslands in spite of their low production, or
of fertilized terraces in spite of less diverse flowering dates. Cul-
tural and regulation values shared similar patterns through
common EP species diversity and flowering diversity, and the
negative correlation (R2 = 0.89, P < 0.001) between litter
(negative component of cultural value) and soil C (positive
component of regulation value). Cultural value was strongly
influenced by the well-known negative correlation between lit-
ter and species diversity (PCA axis 1; R2 = 0.97, P < 0.001),
with an additional positive altitude effect through flowering
diversity. High cultural value could be attained alternatively
with short height (summer grasslands) orwith high LPC (fertil-
ized terraces). The regulation value was influenced by two leaf
traits LDMC and LNC, with an additional positive altitude
effect through flowering diversity. The negative correlation
among these leaf traits afforded alternative pathways to
increased soil C in fertilized terraces (high LNC), in lower
unfertilized terraces and unmown Festuca grasslands (high
LDMC), and in the lower part of summer grasslands (higher
LDMC and LNC). Lower unfertilized and mown terraces and
unmown Festuca grasslands had higher regulation than
cultural value due to this higher soil C.
Consistent with other recent studies, there was a landscape-
scale diversity of associations among different types of ES
(Chan et al. 2007; Naidoo et al. 2008; Egoh et al. 2009).
Service hotspots, with synergy among nearly all services, were
fertilized terraces and summer grasslands, which currently
represent 5% and 23% of the landscape, respectively. Con-
versely, unmown Festuca grasslands, which represent 28% of
the landscape, appeared as areas of trade-offs among services.
Unmown terraces (11% of the total area) were services cold
spots with low provision for all services, yet our analysis did
not consider their agronomic function in terms of spatial com-
plementarity during the annual cycle (Andrieu, Josien &Duru
2007). Ecosystem services hot spots coincided with higher spe-
cies and functional diversity (Fig. 3, Fig. S1), while areas of ES
trade-offs and cold spots were least diverse, suggesting that,
unlike in other regions and especially with more intensive agri-
culture (Chan et al. 2007), sustainable management could
simultaneously conserve biodiversity and locally important
ES. The synergy among multiple ES was facilitated by both
the independence of components of agronomic (green biomass
production) vs. cultural and regulation services (litter and spe-
144 S. Lavorel et al.
! 2010 The Authors. Journal of Ecology ! 2010 British Ecological Society, Journal of Ecology, 99, 135–147

cies diversity) (orthogonal ordination in the PCA), and the
common and ⁄or positively correlated EP contributing to cul-
tural and regulation services (plant diversity, soil C), providing
themechanisms for how atmulti-functionality hot spots differ-
ent ES enhance one another (Bennett, Peterson & Gordon
2009;Willemen et al. 2010). These patterns of independence or
conversely correlation were in part related to dominant traits
underlying each service. Vegetative height, which determined
green biomass production and fodder quality, was a key driver
of agronomic value whereas leaf traits played a stronger role
for components of regulation and cultural values (soil C, litter).
The functional decoupling between these two sets of traits thus
contributes not only to agronomic value but also to highmulti-
ple ES delivery by fertilized andmown terraces–and conversely
to the low score for unmown terraces, with the other land use
types scoring high for one but not another service. Conse-
quently, production can be enhanced by moderate organic fer-
tilization without degrading other ES and the biodiversity that
underlies them, as long as appropriate leaf traits are promoted.
The future vulnerability of ES hotspots will also be directly
linked to land use and possible climate change effects on plant
traits (Quetier et al. 2007).
Conclusion
Models of ES using abiotic variables and plant traits rather
than land use alone afford refined representation of relevant
ecosystem properties. They also unravel mechanisms control-
ling ES delivery, and trade-offs or synergies in provision of
multiple ES. Trait-based approachesmay be generalized to ser-
vices provided by other organisms than plants (e.g. pollination,
pest control) (De Bello et al. 2010). Alternative methods to
simple statistical models include structural equation models
(Grace 2006) and process models (Nelson et al. 2009) and
more complex approaches could be considered for aggregation
of ecosystem properties and of ES to address multi-functional-
ity. In a subalpine grassland landscape traditional land uses
such as organic fertilization and mowing or altitude summer
grazing supported ES hot spots because functional characteris-
tics supporting production and fodder quality are compatible
with species and functional diversity. Conversely, key vulnera-
bilities are expected from land change that decreases biodiver-
sity and promotes plant types associated with ES cold spots
and ⁄or strong trade-offs among services. The relevance of this
model to broader and more diverse landscapes needs to be
tested to exploremore extreme scenarios including agricultural
abandonment andwoody encroachment.
Acknowledgements
We thank Audrey Orcel, Stephanie Periquet, Marion Salvi and
Francesco de Bello for data collection, the Ecrins National Park for
support, Villar d’Arene farmers for access to fields and interviews, the
Joseph Fourier Alpine Station for access to facilities, and Philippe
Choler, FabienQuetier andUlrikeTappeiner for insightful comments
on the manuscript. This research was conducted on the long-term
research site Zone Atelier Alpes, a member of the ILTER-Europe
network. ZAA publication n" 002, with funding from projects ACI-
ECCOECOGERDIVHERBE andANRBiodivERsAVITAL.
References
Albert, C.H., Thuiller, W., Yoccoz, N.G., Soudant, A., Boucher, F., Saccone,P. & Lavorel, S. (2010) Intraspecific functional variability: extent, structureand sources of variation within a French alpine catchment. Journal of Ecol-ogy, 98, 604–613.
Andrieu, N., Josien, E. & Duru, M. (2007) Relationships between diversity ofgrassland vegetation, field characteristics and land use managementpractices assessed at the farm level. Agriculture, Ecosystems and Environ-ment, 120, 359–369.
Ansquer, P., Duru, M., Theau, J.P. & Cruz, P. (2009) Functional traits as indi-cators of fodder provision over a short time scale in species-rich grasslands.Annals of Botany, 103, 117–126.
Bakker, M.M., Govers, G., Van Doorn, A., Quetier, F., Chouvardas, D. &Rounsevell,M.D.A. (2008) The response of soil erosion and sediment exportto land-use change in four areas of Europe: the importance of landscapepattern.Geomorphology, 98, 213–226.
Baraloto, C., Paine, C.E.T., Patino, S., Bonal, D., Herault, B. & Chave, J.(2009) Functional trait variation and sampling strategies in species-rich plantcommunities. Functional Ecology, 24, 208–216.
Bennett, E.M., Peterson, G.D. & Gordon, L.J. (2009) Understanding rela-tionships among multiple ecosystem services. Ecology Letters, 12, 1394–1404.
Bruun, H.H., Fritzboger, B., Rindel, P.O. & Lund Hanssen, U. (2001) Speciesrichness in grasslands: the relative importance of contemporary environmentand land-use history since the IronAge.Ecography, 24, 569–578.
Bryan, B.A., Raymond, C.M., Crossman, N.D. & Macdonald, D.H. (2010)Targeting the management of ecosystem services based on social values:where, what, and how?Landscape and Urban Planning, 97, 111–122.
Carpenter, S.R., Mooney, H.A., Agard, J., Capistrano, D., De Fries, R.S.,Diaz, S. et al. (2009) Science for managing ecosystem services: beyond theMillennium Ecosystem Assessment. Proceedings of the National Academy ofSciences, 106, 1305–1312.
Chan, K.M.A., Shaw, M.R., Cameron, D.R., Underwood, E.C. & Daily, G.C.(2007) Conservation planning for ecosystem services.PLoSBiology, 4, e379.
Chave, J., Coomes, D., Jansen, S., Lewis, S.L., Swenson, N.G. & Zanne, A.E.(2009) Towards a worldwide wood economics spectrum.Ecology Letters, 12,351–366.
Cornelissen, J.H.C., Perez-Harguindeguy, N., Dıaz, S., Grime, J.P., Marzano,B., Cabido, M., Vendramini, F. & Cerabolini, B. (1999) Leaf structure anddefence control litter decomposition rate across species and life forms inregional flora on two continents.New Phytologist, 143, 191–200.
Cornelissen, J.H.C., Lavorel, S., Garnier, E., Dıaz, S., Buchmann, N., Gurvich,D.E., Reich, P.B., ter Steege, H., Morgan, H.D., van der Heijden, M.G.A.,Pausas, J.G. & Poorter, H. (2003) Handbook of protocols for standardisedand easy measurement of plant functional traits worldwide. AustralianJournal of Botany, 51, 335–380.
De Bello, F., Lavorel, S., Dıaz, S., Harrington, R., Bardgett, R., Berg,M. et al.(2010) Functional traits underlie the delivery of ecosystem services acrossdifferent trophic levels.Biodiversity and Conservation, 143, 2873–2893.
De Chazal, J., Quetier, F., Lavorel, S., Van Doorn, A. & Castro, H. (2008)Including multiple differing stakeholder values into vulnerability assess-ments of socio-ecological systems. Global Environmental Change, 18,508–520.
Di Rienzo, J.A., Casanoves, F. & Pla, L. (2008) f-Diversity. Cordoba, Argen-tina.
Diaz, S., Hodgson, J.G., Thompson, K., Cabido, M., Cornelissen, J.H.C.,Jalili, A. et al. (2004) The plant traits that drive ecosystems: evidence fromthree continents. Journal of Vegetation Science, 15, 295–304.
Diaz, S., Lavorel, S., De Bello, F., Quetier, F., Grigulis, K. & Robson, T.M.(2007) Incorporating plant functional diversity effects in ecosystem serviceassessments. Proceedings of the National Academy of Sciences, 104, 20684–20689.
Egoh, B., Reyers, B., Rouget,M., Bode,M.&Richardson,D.M. (2009) Spatialcongruence between biodiversity and ecosystem services in South Africa.Biological Conservation, 142, 553–562.
Eigenbrod, F., Armsworth, P.R., Anderson, B.J., Heinemeyer, A., Gillings, S.,Roy, D.B., Thomas, C.D. &Gaston, K.J. (2010) The impact of proxy-basedmethods on mapping the distribution of ecosystem services. Journal ofApplied Ecology, 47, 377–385.
Plant functional traits and provision of multiple ecosystem services 145
! 2010 The Authors. Journal of Ecology ! 2010 British Ecological Society, Journal of Ecology, 99, 135–147

Fortunel, C., Garnier, E., Joffre, R., Kazakou, E., Quested, H., Grigulis, K.,Lavorel, S. & Consortium, V. (2009) Plant functional traits capture theeffects of land use change and climate on litter decomposability of herba-ceous communities in Europe and Israel.Ecology, 90, 598–611.
Fraterrigo, J.M., Turner, M.G. & Pearson, S.M. (2006) Interactions betweenpast land use, life-history traits and understory spatial heterogeneity. Land-scape Ecology, 21, 777–790.
Garnier, E., Cortez, J., Billes, G., Navas, M.-L., Roumet, C., Debussche, M.,Laurent, G., Blanchard, A., Aubry, D., Bellmann, A., Neill, C. & Toussaint,J.-P. (2004) Plant functional markers capture ecosystem properties duringsecondary succession.Ecology, 85, 2630–2637.
Garnier, E., Lavorel, S., Ansquer, P., Castro, H., Cruz, P., Dolezal, J. et al.(2007) A standardized methodology to assess the effects of land use changeon plant traits, communities and ecosystem functioning in grasslands.Annalsof Botany, 99, 967–985.
Gartner, T.B. & Cardon, Z.G. (2004) Decomposition dynamics in mixed-spe-cies leaf litter.Oikos, 104, 230–246.
Gaucherand, S. & Lavorel, S. (2007) A new protocol for a quick survey offunctional traits values in a plant community. Austral Ecology, 32, 927–936.
Gellrich, M. & Zimmermann, N.E. (2007) Investigating the regional-scalepattern of agricultural land abandonment in the Swiss mountains: a spatialstatistical modelling approach.Landscape and Urban Planning, 79, 65–76.
Gimona, A. & van der Horst, D. (2007) Mapping hotspots of multiplelandscape functions: a case study on farmland afforestation in Scotland.Landscape Ecology, 22, 1255–1264.
Girel, J., Quetier, F., Bignon, A. &Aubert, S. (2010)Histoire de l’Agriculture enOisans. StationAlpine Joseph Fourier, Grenoble, France.
Grace, J.B. (2006) Structural Equation Modeling and Natural Systems.CambridgeUniversity Press, Cambridge, UK.
Gret-Regamey, A., Bebi, P., Bishop, I.D. & Schmid,W.A. (2008) LinkingGIS-based models to value ecosystem services in an Alpine region. Journal ofEnvironmentalManagement, 89, 197–208.
Grime, J.P. (1977) Evidence for the existence of three primary strategies inplants and its relevance to ecological and evolutionary theory.The AmericanNaturalist, 111, 1169–1194.
Grime, J.P. (1998) Benefits of plant diversity to ecosystems: immediate, filterand founder effects. Journal of Ecology, 86, 902–906.
de Groot, R.S., Alkemade, R., Braat, L., Hein, L. & Willemen, L. (2009)Challenges in integrating the concept of ecosystem services and values inlandscape planning, management and decision making.Ecological Complex-ity, 7, 260–272.
Gross, N., Suding, K.N. & Lavorel, S. (2007) Leaf dry matter content andlateral spread predict response to land-use change factors for six dominantspecies in subalpine grasslands. Journal of Vegetation Science, 18, 289–300.
Gross, N., Suding, K.N., Roumet, C. & Lavorel, S. (2007) Complementarity asamechanism of coexistence among co-dominant functional groups of grami-noids. Journal of Ecology, 95, 1296–1305.
Gross, N., Robson, T.M., Lavorel, S., Albert, C., Le Bagousse-Pinguet, Y. &Guillemin, R. (2008) Plant response traits mediate the effects of subalpinegrasslands on soil moisture.New Phytologist, 180, 652–662.
Kattge, J., Ogle, K., Bonisch, G., Dıaz, S., Lavorel, S., Madin, J., Nadrowski,K., Noellert, S., Sartor, K. & Wirth, C. (2010) A generic structure for planttrait databases.Methods in Ecology and Evolution, doi: 10.1111/j.2041-210X.2010.00067.x.
Kazakou, E., Vile, D., Shipley, B., Gallet, C. & Garnier, E. (2006) Co-varia-tions in litter decomposition, leaf traits and plant growth in species from aMediterranean old-field succession. Functional Ecology, 20, 21–30.
Kienast, F., Bolliger, J., Potschin,M., Groot, R.S.D., Verburg, P.H., Heller, I.,Wascher, D. & Haines-Young, R. (2009) Assessing landscape functions withbroad-scale environmental data: insights gained from a prototype develop-ment for Europe.EnvironmentalManagement, 44, 1099–1120.
Kleyer, M., Bekker, R.M., Knevel, I.C., Bakker, J.P., Thompson, K., Son-nenschein, M. et al. (2008) The LEDA Traitbase: a database of life-historytraits of theNorthwest European flora. Journal of Ecology, 96, 1266–1274.
Koch, E.W., Barbier, E.B., Silliman, B.R., Reed, D.J., Perillo, G.M., Hacker,S.D. et al. (2009) Non-linearity in ecosystem services: temporal and spatialvariability in coastal protection. Frontiers in Ecology and the Environment, 7,29–37.
Kremen, C. (2005) Managing ecosystem services: what do we need to knowabout their ecology?Ecology Letters, 8, 468–479.
Lavorel, S. & Garnier, E. (2002) Predicting the effects of environmentalchanges on plant community composition and ecosystem functioning: revis-iting theHolyGrail. Functional Ecology, 16, 545–556.
Lavorel, S., Grigulis, K., McIntyre, S., Garden, D.,Williams, N., Dorrough, J.,Berman, S., Quetier, F., Thebault,A.&Bonis, A. (2008)Assessing functionaldiversity in thefield –methodologymatters!Functional Ecology, 22, 134–147.
Lavorel, S., Gachet, S., Sahl, A., Colace, M.-P., Gaucherand, S., Burylo, M. &Bonet, R. (2009) A plant functional traits data base for the Alps – under-standing functional effects of changed grassland management. Data Miningfor Global Trends in Mountain Biodiversity (eds. C. Korner & E. Spehn), pp.106–123. CRCPress ⁄Taylor and Francis, Boca Raton.
Leps, J., De Bello, F., Lavorel, S. & Berman, S. (2006) Quantifying and inter-preting functional diversity of natural communities: practical considerationsmatter.Preslia, 78, 481–501.
Martin, G., Hossard, L., Theau, J.P., Therond, O., Josien, E., Cruz, P., Rellier,J.P., Martin-Clouaire, R. & Duru, M. (2009) Characterizing potential flexi-bility in grassland use – an application to the French Aubrac region. Agron-omy for SustainableDevelopment, 29, 381–389.
Mason, N.W.H., MacGillivray, K., Steel, J.B. & Wilson, J.B. (2003) An indexof functional diversity. Journal of Vegetation Science, 14, 571–578.
Maurer, K., Weyand, A., Fischer, M. & Stocklin, J. (2006) Old cultural tradi-tions, in addition to land use and topography, are shaping plant diversity ofgrasslands in theAlps.Biological Conservation, 130, 438–446.
Metzger, M.J., Rounsevell, M.D.A., Acosta-Michlik, L., Leemans, R. &Schroter, D. (2006) The vulnerability of ecosystem services to land usechange.Agriculture, Ecosystems & Environment, 114, 69–85.
Millennium Ecosystem Assessment (2005) Ecosystems and Human Well-Being.Synthesis. A Report of the Millennium Ecosystem Assessment. Island Press,Washington.
Mokany, K., Ash, J. & Roxburgh, S. (2008) Functional identity is more impor-tant than diversity in influencing ecosystem processes in a temperate nativegrassland. Journal of Ecology, 96, 884–893.
Mottet, A., Ladet, S., Coque, N. & Gibon, A. (2006) Agricultural land-usechange and its drivers in mountain landscapes: a case study in the Pyrenees.Agriculture, Ecosystems & Environment, 114, 296–310.
Naidoo, R. & Ricketts, T.H. (2006) Mapping the economic costs and benefitsof conservation.PLoSBiology, 4, e360.
Naidoo, R., Balmford, A., Costanza, R., Fisher, B., Green, R.E., Lehner, B.,Malcolm, T.R. & Ricketts, T.H. (2008) Global mapping of ecosystem ser-vices and conservation priorities. Proceedings of the National Academy ofSciences, 105, 9495–9500.
Nelson, E., Mendoza, G., Regetz, J., Polasky, S., Tallis, H., Cameron, D. et al.(2009) Modeling multiple ecosystem services, biodiversity conservation,commodity production, and tradeoffs at landscape scales. Frontiers in Ecol-ogy and the Environment, 7, 4–11.
Osty, P. (1971) Influence of soil conditions on its moisture at pF 3.Annales Ag-ronomiques, 2, 451–476.
Petchey, O.L. & Gaston, K.J. (2006) Functional diversity: back to basics andlooking forward.Ecology Letters, 9, 741–748.
Pontes Da Silva, L., Soussana, J.F., Louault, F., Andueza, D. & Carrere, P.(2007) Leaf traits affect the above-ground productivity and quality ofgrasses. Functional Ecology, 21, 844–853.
Quetier, F., Thebault, A. & Lavorel, S. (2007) Linking vegetation and ecosys-tem response to complex past and present land use changes using plant traitsand amultiple stable state framework.EcologicalMonographs, 77, 33–52.
Quetier, F., Lavorel, S., Thuiller, W. & Davies, I.D. (2007) Plant trait-basedassessment of ecosystem service sensitivity to land-use change in mountaingrasslands.Ecological Applications, 17, 2377–2386.
Quetier, F., Lavorel, S., Daigney, S.&DeChazal, J. (2009)Assessing ecologicaland social uncertainty in the evaluation of land-use impacts on ecosystemservices. Journal of LandUse Science, 4, 173–199.
Quetier, F., Rivoal, F.,Marty, P., DeChazal, J. &Lavorel, S. (2010) Social rep-resentations of an alpine grassland landscape and socio-political discourseson rural development.Regional Environmental Change, 10, 119–130.
Reyers, B., O’Farrell, P.J., Cowling, R.M., Egoh, B.N.,Maitre, D.C.L. &Vlok,J.H.J. (2009) Ecosystem services, land-cover change, and stakeholders: find-ing a sustainable foothold for a semiarid biodiversity hotspot. Ecology andSociety, 14, 38 [http://www.ecologyandsociety.org/vol14/iss1/art38].
Robson, T.M., Lavorel, S., Clement, J.C. & Le Roux, X. (2007) Neglect ofmowing and manuring leads to slower nitrogen cycling in subalpine grass-lands. Soil Biology and Biogeochemistry, 39, 930–941.
Scherer-Lorenzen, M. (2008) Functional diversity affects decomposition pro-cesses in experimental grasslands. Functional Ecology, 22, 547–555.
Schumacher, J. & Roscher, C. (2009) Differential effects of functional traits onaboveground biomass in semi-natural grasslands.Oikos, 118, 1659–1668.
Stewart, K.E.J., Bourn, N.A.D. & Thomas, J.A. (2001) An evaluation of threequick methods commonly used to assess sward height in ecology. Journal ofApplied Ecology, 38, 1148–1154.
146 S. Lavorel et al.
! 2010 The Authors. Journal of Ecology ! 2010 British Ecological Society, Journal of Ecology, 99, 135–147
Suding, K.N.&Goldstein, L.J. (2008) Testing theHolyGrail framework: usingfunctional traits to predict ecosystem change. New Phytologist, 180, 559–562.
Turner, B.L. II (2010) Sustainability and forest transitions in the southernYucatan: the land architecture approach.LandUse Policy, 27, 170–179.
Ustin, S.L. & Gamon, J.A. (2010) Remote sensing of plant functional types.NewPhytologist, 186, 795–816.
Venables, W.N. & Ripley, B.D. (2002) Modern Applied Statistics with S.Springer-Verlag, NewYork.
Verburg, P.H., van der Steeg, J., Veldkamp, A. & Willemen, L. (2009) Fromland cover change to land function dynamics: A major challenge to improveland characterization. Journal of Environmental Management, 90, 1326–1335.
Vile, D., Shipley, B. &Garnier, E. (2006) Ecosystem productivity relates to spe-cies’ potential relative growth rate: a field test and a conceptual framework.Ecology Letters, 9, 1061–1067.
Violle, C., Navas, M.L., Vile, D., Kazakou, E., Fortunel, C., Hummel, I. &Garnier, E. (2007) Let the concept of trait be functional!. Oikos, 116, 882–892.
Vojtech, E., Loreau,M., Yachi, S., Spehn, E.M. &Hector, A. (2008) Light par-titioning in experimental grass communities.Oikos, 117, 1351–1361.
Westoby, M. (1998) A leaf-height-seed (LHS) plant ecology strategy scheme.Plant and Soil, 199, 213–227.
Willemen, L., Hein, L., van Mensvoort, M.E.F. & Verburg, P.H. (2010) Spacefor people, plants, and livestock? Quantifying interactions among multiplelandscape functions in aDutch rural region.Ecological Indicators, 10, 62–73.
Wright, I.J., Reich, P.B., Westoby, M., Ackerly, D.D., Baruch, Z., Bongers, F.et al. (2004) The worldwide leaf economics spectrum.Nature, 428, 821–827.
Received 26May 2010; accepted 18October 2010Handling Editor: LorenaGomez-Aparicio
Supporting Information
Figure S1. Modelled maps of abiotic environmental variables and
plant functional diversity.
Figure S2. Comparison of modelled ecosystem properties using a
land-use-only model (M1) vs. the full model including direct abiotic
effects and indirect effects through plant functional diversity (M3).
Figure S3. Modelled ecosystem services using a land-use-only model
vs. the full model including direct abiotic effects and indirect effects
through plant functional diversity.
Figure S4. Results from the Principal Components Analysis on Eco-
system Properties.
Appendix S1.Comparison ofmodels of ecosystem properties and eco-
system services.
As a service to our authors and readers, this journal provides support-
ing information supplied by the authors. Such materials may be
re-organized for online delivery, but are not copy-edited or typeset.
Technical support issues arising from supporting information (other
thanmissing files) should be addressed to the authors.
Plant functional traits and provision of multiple ecosystem services 147
! 2010 The Authors. Journal of Ecology ! 2010 British Ecological Society, Journal of Ecology, 99, 135–147
Recommended


