Embed Size (px)
Citation preview

Presentation to Rotary Club
of Western Johnson County
Brian D. NewbyElection CommissionerJohnson County, Kansaswww.ElectionDiary.comwww.jocoelection.orghttp://my.jocopolo.comMay 5, 2015
4
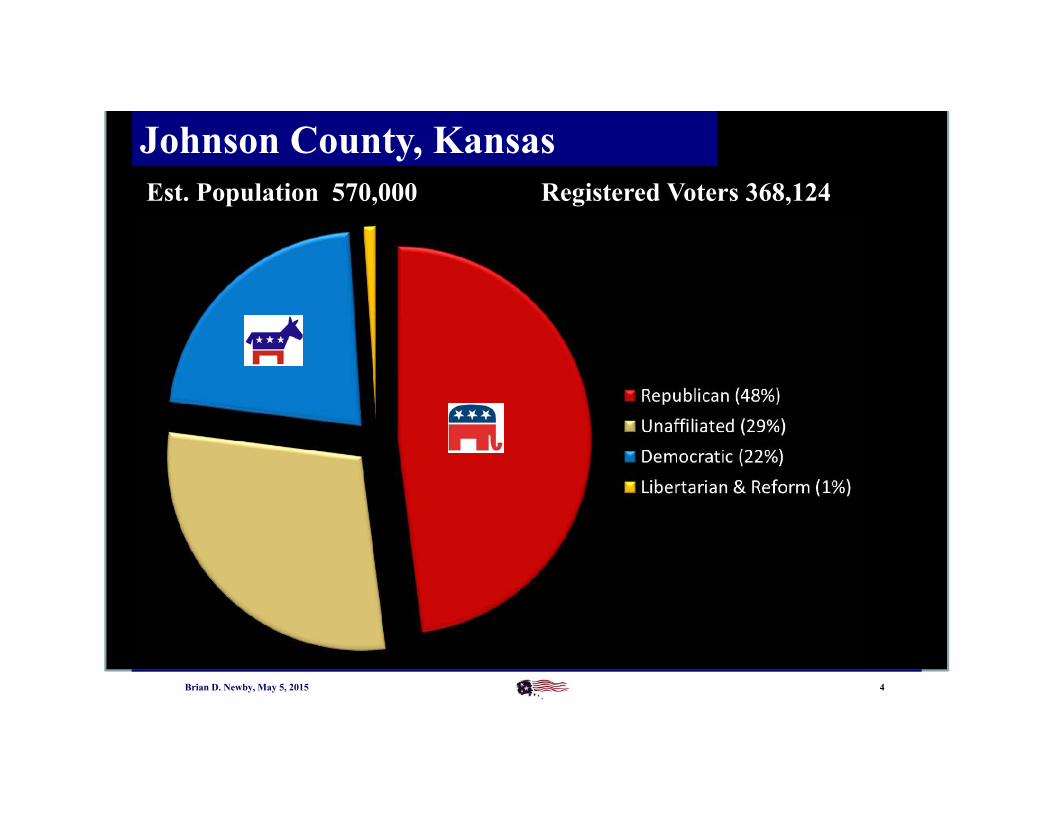
Johnson County, KansasEst. Population 570,000 Registered Voters 368,124
Registered Voters 350,000
Brian D. Newby, May 5, 2015

3
Johnson County Election Office By The Numbers
Brian D. Newby, May 5, 2015
Staff Members: 16 Full‐time Employees, up to 250 part‐time
Voters: Nearly 380,000 Registered voters
Precincts: 494Voting Locations: Up to 286; 182 for 2014Voting
Machines: 2,407
Unique Ballots:More than 1,500
Advance Voting Locations: 4

Johnson County StatisticsRegistered Voters Total Voted Turnout %
Year JoCoPop Growth% November Growth% November Growth% November Trend
1960 143,792 77,420 65,033 84%
1964 177,137 23% 84,059 9% 72,483 11% 86% 2%
1968 212,245 20% 100,610 20% 88,314 22% 88% 2%
1972 231,933 9% 120,407 20% 104,136 18% 86% -1%
1976 243,953 5% 140,956 17% 117,040 12% 83% -3%
1980 266,489 9% 155,769 11% 125,637 7% 81% -2%
1984 283,666 6% 169,773 9% 141,715 13% 83% 3%
1988 328,537 16% 185,727 9% 155,267 10% 84% 1%
1992 374,801 14% 222,815 20% 197,265 27% 89% 5%
1996 411,635 10% 246,497 11% 192,202 -3% 78.0% -11%
2000 451,086 10% 312,788 27% 218,486 14% 70% -8%
2004 496,691 10% 348,552 11% 259,599 19% 75% 5%
2008 532,215 7% 364,441 5% 285,001 10% 78.2% 3%
2012 551,529 4% 383,491 5% 275,674 -3% 72% -6%
5Brian D. Newby, May 5, 2015

Johnson County Residents Have High Expectations Related to ElectionsElections are among the more highly regarded services provided by the county.
Johnson County’s Growth Creates Scale Issues…This leads to many cost drivers related to elections. Bottom line, elections are expensive because they involve, in the case of Johnson County voters, more than 370,000 participants.
1
3
4
Each Election is UniqueAs we consider moving elections, it’s worth stressing that all elections come with their own nuances of candidates, candidate rotation, numbers of candidates constituting a primary, and the best way to conduct the election (mail or polls), just to name some of the unique items.
Brian D. Newby, May 5, 2015
Two Thirds of Johnson County’s Elections are Unscheduled
We’ve had 60 election in the last 10 years; 40 of them were special elections and spring primaries.
5
Elections Vary in ComplexityWith more than 1,500 types of ballots in an August election in Johnson County.
2
Election Business Drivers

Brian D. Newby, May 5, 2015
Turnout for Special Elections Is Greater Than Regular Spring ElectionsWe’ve seen this in Roeland Park special elections and in mail-ballot elections.
6
Election Business Drivers

Blue Valley USD #229 2/1/2005 43.80%Gardner-Edgerton USD #231 2/1/2005 51.50%Spring Hill USD #230 2/1/2005 55.80%City of Gardner 6/7/2005 51.30%Spring Hill USD #230 6/19/2007 42.55%De Soto USD #232 9/18/2007 45.58%Olathe USD #233 10/16/2007 29.96%City of Overland Park 1/29/2008 35.15%City of Lenexa 5/27/2008 31.86%City of Fairway 11/3/2009 41.41%City of Merriam 1/26/2010 36.14%City of De Soto 2/1/2011 39.43%Spring Hill USD #230 6/7/2011 46.93%City of Mission 12/6/2011 38.56%Blue Valley USD #229 1/31/2012 38.59%Gardner-Edgerton USD #231 1/31/2012 41.36%Olathe - USD #233 6/11/2013 31.32%City of Overland Park 10/8/2013 30.92%City of Olathe 11/12/2013 32.46%City of Roeland Park 12/10/2013 34.94%City of Fairway 5/13/2014 39.36%LOB USDs 229,231,232,233,512 1/27/2015 30.93%
Johnson County Question 9/27/2005 13.00%City of Roeland Park Special Election 6/23/2009 24.90%City of Roeland Park Special Election 2/14/2012 11.18%City of Roeland Park Special Election 5/13/2014 23.44%City of Roeland Park Special Election 12/9/2014 26.33%
City General Election 2011 4/5/2011 9.76%City General Election 2012 4/5/2012 11.02%City General Election 2013 4/2/2013 7.98%City General Election 2014 4/1/2014 9.61%City General Election 2015 4/7/2015 10.01%
Turnout for Mail Ballot Elections Turnout for Special Elections
Turnout for Spring General Elections
Brian D. Newby, May 5, 2015
Special Elections – Higher Turnout
The lowest turnout for a special election over the last 10 years is still greater than
the April turnout the last five years.
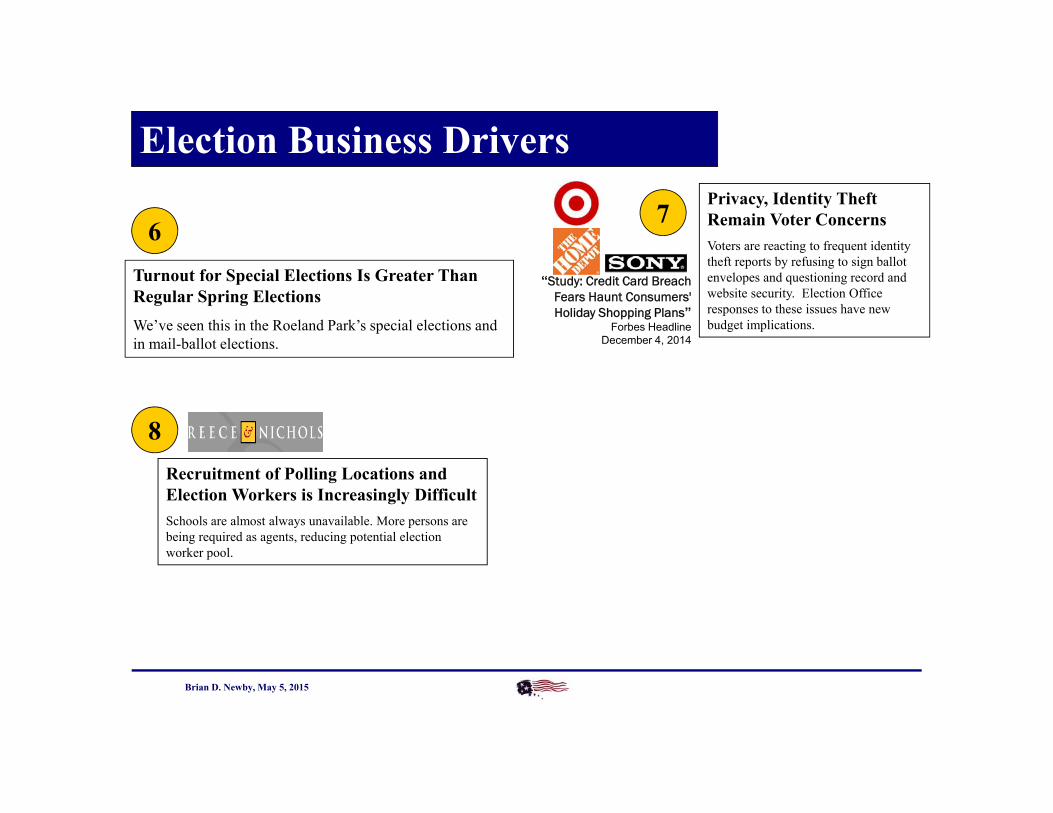
Privacy, Identity Theft Remain Voter ConcernsVoters are reacting to frequent identity theft reports by refusing to sign ballot envelopes and questioning record and website security. Election Office responses to these issues have new budget implications.
Recruitment of Polling Locations and Election Workers is Increasingly DifficultSchools are almost always unavailable. More persons are being required as agents, reducing potential election worker pool.
8
7
“Study: Credit Card Breach Fears Haunt Consumers' Holiday Shopping Plans”
Forbes HeadlineDecember 4, 2014
Brian D. Newby, May 5, 2015
Turnout for Special Elections Is Greater Than Regular Spring ElectionsWe’ve seen this in the Roeland Park’s special elections and in mail-ballot elections.
6
Election Business Drivers

Polling Places Are Less Available
Brian D. Newby, May 5, 2015
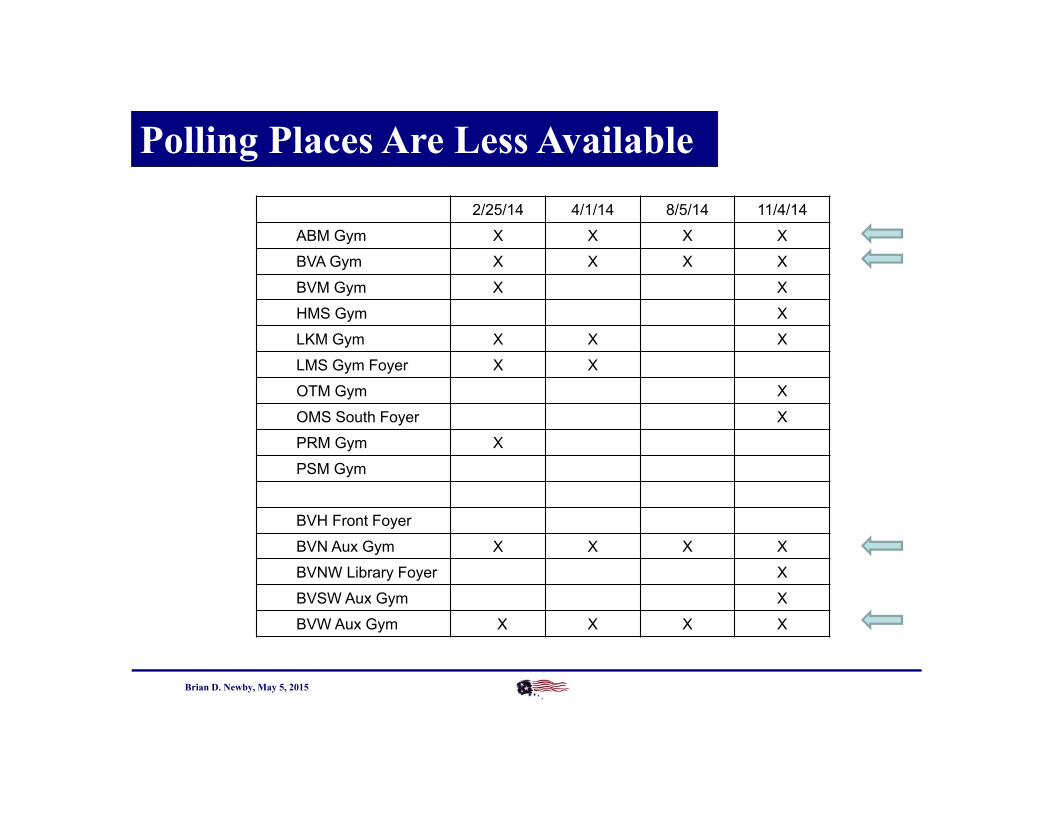
Polling Places Are Less Available2/25/14 4/1/14 8/5/14 11/4/14
ABM Gym X X X XBVA Gym X X X XBVM Gym X XHMS Gym XLKM Gym X X XLMS Gym Foyer X XOTM Gym XOMS South Foyer XPRM Gym XPSM Gym
BVH Front FoyerBVN Aux Gym X X X XBVNW Library Foyer XBVSW Aux Gym XBVW Aux Gym X X X X
Brian D. Newby, May 5, 2015

ADOPT-A-POLLING PLACE
Brian D. Newby, May 5, 2015
THE ADOPT-A-POLLING PLACE PROGRAM: • Provides community organizations and businesses the opportunity to be part of the elections process
• Raises funds for your worthy causes
• Each participating organization or business “adopts” a specific Polling Place or multiple Polling Places for each election cycle by providing the personnel to staff the polling place(s)
• The Election office will display a sign in your polling place with your organization or business’ name
• Your organization’s name will be added to our distinguished list of Community Partners, in our office, to highlight your contribution to this community
HOW MUCH CAN YOU EARN?
• In 2016, average fully staffed polling place earnings will be $1,265 per election
• In 2016 there will be four elections which means your organizations potential would be $5,060 fully staffing one polling place in every election

Privacy, Identity Theft Remain Voter ConcernsVoters are reacting to frequent identity theft reports by refusing to sign ballot envelopes and questioning record and website security. Election Office responses to these issues have new budget implications.
Recruitment of Polling Locations and Election Workers is Increasingly DifficultSchools are almost always unavailable. More persons are being required as agents, reducing potential election worker pool.
8 9
Advance Voting Brings Cost Efficiencies, Introduces Other Cost IssuesWith Ballot-on-Demand printing and maximum utilization of voting machines, advance voting maximizes the return on investment. Advance voting, though, is becoming more important because of limited polling place availability, and rent becomes a high and necessary expense.
7
“Study: Credit Card Breach Fears Haunt Consumers' Holiday Shopping Plans”
Forbes HeadlineDecember 4, 2014
Brian D. Newby, May 5, 2015
Turnout for Special Elections Is Greater Than Regular Spring ElectionsWe’ve seen this in the Roeland Park’s special elections and in mail-ballot elections.
6
November 2010 November 2012 November 2014
67,682 115,020 62,098
114,630 154,785 128,829
Advance In-Person
Election Business Drivers

13
Highest Participation, 2005-15
Brian D. Newby, May 5, 2015
Election Ballots Counted Voter Turnout1 2008 Fall General 285,001 78 %2 2012 Fall General 275,674 72 %3 2014 Fall General 194,052 51 %4 2006 Fall General 187,379 55 %5 2010 Fall General 184,834 51 %6 2005 Spring General 98,799 30 %7 2015 LOB Mail Ballot (In process) 62,581 31 %8 2005 Special Election 43,395 13 %9 2007 Spring General 40,853 12 %10 2008 City of Overland Park Special 38,569 35 %

14
2014 November Turnout Was Similar to 2010
Highest Participation, 2005-15
Brian D. Newby, May 5, 2015
Election Ballots Counted Voter Turnout1 2008 Fall General 285,001 78 %2 2012 Fall General 275,674 72 %
3 2014 Fall General 194,052 51 %4 2006 Fall General 187,379 55 %5 2010 Fall General 184,834 51 %
6 2005 Spring General 98,799 30 %7 2015 LOB Mail Ballot (In process) 62,581 30 %8 2005 Special Election 43,395 13 %9 2007 Spring General 40,853 12 %10 2008 City of Overland Park Special 38,569 35 %

Election Updates
www.ElectionDiary.com
Text “Follow ElectionDiary” to 40404