Embed Size (px)
Citation preview

SMART MOBILITY
APRIL 2015
By
Prof. Shivanand Swamy
Centre of Excellence in Urban Transport;
CEPT University, Ahmedabad
SMART CITY

INDIAN CITIES ARE GROWING
CITIES
THEY ARE DESIGNED FOR
COMMUNITY LIVING AND
COLLECTIVE MOBILITY

CITY COMPARIOSIONS
Aspect India Europe USA
Population Density 120 50 10-15
Percapita Motrised Trip Rates 0.75-1.1 2-3 2-3
Cars/1000 population 100 400 600-800'
Vehicles/1000 population 225 450 800-900'
Road length per capita (m) 0.75-1.25 2-3 5-7
Road length per ha (m) 100-120 115 90
% NMT Work Trips 20-25 15-20 5
NMT % of total passenger km 48 23 3
Car use-percapita(‘000km/yr) 1400 4500 12000
ICT Use Low High High
C

-Doubling of population in next 30-40
years
- Trip rates to double with increased
work participation (women coming into
workforce)
- Vehicle Ownership Rates Increasing
- How do we ensure mobility security?

- ALLOCATING ROAD SPACE FOR
COLLECTIVE MOBILITY IS THE WAY
FORWARD
- BRTS IS A KEY ELEMENT IN SMART
MOBILITY

0
25
50
75
100
125
150
175
0
5
10
15
20
25
1970 1975 1980 1985 1990 1995 2000 2005 2010
Cu
mu
lati
ve N
um
ber
of
Cit
ies
New
Cit
ies 2009: Ahmedabad
(Janmarg), India
2000: Bogotá
(TransMilenio),
Colombia
1974/1991*: Curitiba
1972/2010*: Lima
http://brtdata.org, October 2013
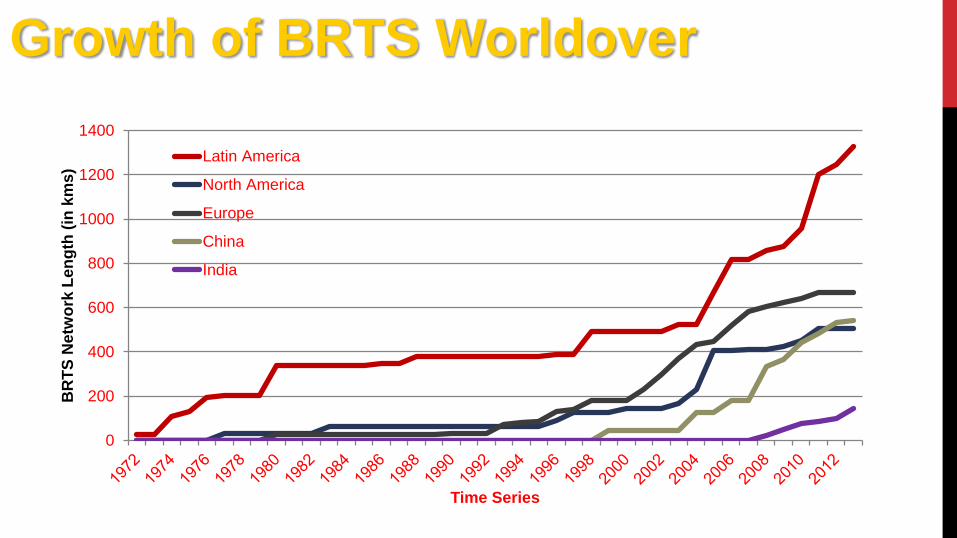
Growth of BRTS Worldover
0
200
400
600
800
1000
1200
1400
BR
TS
Netw
ork
Le
ng
th (
in k
ms
)
Time Series
Latin America
North America
Europe
China
India
Growth of BRTS Worldover

MYTHS ABOUT BRTS
BRTS
• Takes away road space!
• Roads will be congested!
• Very few buses given priority over large mixed traffic
vehicles!
• Movement will be inefficient!
• Too much Investment – Too little a benefit
Ahmedabad Municipal Corporation and Surat Municipal Corporation : Government of GujaratTechnical Assistance: Centre of Excellence in Urban Transport, CEPT University, Ahmedabad. (An initiative of the Ministry of Urban Development,
Government of India)

CURRENT SCENARIO

By:
Centre of Excellence in Urban Transport, CEPT University, Ahmedabad. In association with MoUD, Government of India & AMC
People moved : 150Area occupied – 84 sq. m
Queue length – 24 m.
Janmarg Mixed traffic
MORE BUSES MEAN LESS TRAFFICExisting Scenario (Ahmedabad) November 2012
Janmarg – Focus on Moving People..
People moved :77Area occupied – 486 sq. m.
Queue length - 54 m.
Phase Time – 40 Seconds
Cycle Length – 120 Seconds

By:
Centre of Excellence in Urban Transport, CEPT University, Ahmedabad. In association with MoUD, Government of India & AMC
People moved – 150Area occupied – 84 sq. m
Queue length – 24 m.
Janmarg Mixed traffic
MORE CARS – Constant queue Length- Reduction in people
moved
MORE CARS MEANS LESS PEOPLE
Janmarg – Focus on Moving People..
People moved -45(Reduction from 77)
Area occupied – 486 sq. m.
Queue length - 54 m.

By:
Centre of Excellence in Urban Transport, CEPT University, Ahmedabad. In association with MoUD, Government of India & AMC
People moved – 150
Area occupied – 84 sq. m
Queue length – 24 m.
People moved -77
Queue length - 183 m.(Increase from 54 meters)
Phase time – 70 Seconds
Cycle Length – 180
Seconds
Janmarg Mixed traffic
MORE CARS – Same No of people – Longer QueueMORE CARS MEANS LONGER QUES
Janmarg – Focus on Moving People..

Future Scenario: If the
Traffic is Doubled
Ahmedabad Municipal Corporation and Surat Municipal Corporation : Government of GujaratTechnical Assistance: Centre of Excellence in Urban Transport, CEPT University, Ahmedabad. (An initiative of the Ministry of Urban Development,
Government of India)

By:
Centre of Excellence in Urban Transport, CEPT University, Ahmedabad. In association with MoUD, Government of India & AMC
People moved – 280
Area occupied – 135 sq.
m
Queue length – 37 m.
People moved -155
Queue length – 210 m.Phase time – 70 Seconds
Cycle Length – 180
Seconds
Janmarg Mixed traffic
MORE CARS – Same No of people – Longer QueueMORE CARS MEANS LONGER QUES
Janmarg – Focus on Moving People..
18 M ARTICULATED BUS
CAPACITY- 140

IF BRTS DID
NOT EXIST

By:
Centre of Excellence in Urban Transport, CEPT University, Ahmedabad. In association with MoUD, Government of India & AMC
People moved -240
Queue length - 165 m.(Increase from 54 meters)
Phase time – 100 Seconds
Cycle Length > 180 Seconds (Not Desirable)
Mixed traffic
Present scenario- without BRTSMORE CARS MEANS LONGER QUES
Janmarg – Focus on Moving People..

By:
Centre of Excellence in Urban Transport, CEPT University, Ahmedabad. In association with MoUD, Government of India & AMC
People moved -240
Queue length - 463 m.(Increase from 210 meters)
Phase Time – 200 Seconds+ (Not possible to
operate with At-grade junction)
Mixed traffic
Future Scenario- (double traffic) without BRTSMORE CARS MEANS LONGER QUES
Janmarg – Focus on Moving People..

RESULTRESULT with NO BRTS
Ahmedabad Municipal Corporation and Surat Municipal Corporation : Government of GujaratTechnical Assistance: Centre of Excellence in Urban Transport, CEPT University, Ahmedabad. (An initiative of the Ministry of Urban Development,
Government of India)
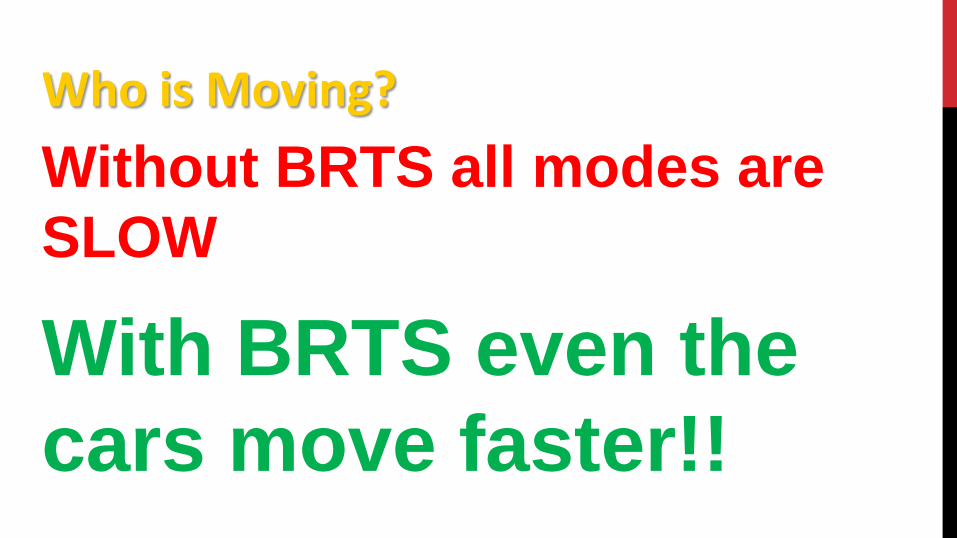
Without BRTS all modes are
SLOW
With BRTS even the
cars move faster!!
Who is Moving?

Origin - Destination Length
With BRT Without BRT Saving
Average Delay (s)Savings
(sec)
Average
Delay (sec)
Average Delays w/o
BRT over with BRT From To (Km) BRT Mix Traffic
Helmet Keshavbaug 2.1 104 339 235 395 3.8 times
Helmet Shivaranajani 2.6 138 368 230 431 3.1 times
SIMULATION RESULTS FROM VISSIM-- FROM HELMET TO SHIVARAJANI INTERSECTION
• The evaluation results indicate the average speed of 27.2 and 22-24 kmph for
BRT and mixed traffic respectively.
• The evaluation results indicate the average speed under mixed traffic situation
is 16-19 KMPHAhmedabad Municipal Corporation and Surat Municipal Corporation : Government of Gujarat
Technical Assistance: Centre of Excellence in Urban Transport, CEPT University, Ahmedabad. (An initiative of the Ministry of Urban Development,
Government of India)
SPEED DELAY ANALYSIS

BRTS – A SMART WAY TO MOBILITY
0
2000
4000
6000
8000
10000
12000
14000
16000
18000
20000
22000
24000
18
02
19
80
21
58
23
36
25
14
26
92
28
70
30
48
32
26
34
04
35
82
37
60
39
38
41
16
42
94
44
72
46
50
48
28
50
06
51
84
53
62
55
40
57
18
58
96
60
74
Dis
tan
ce
Tra
ve
lle
d
Distance Travelled
0
2000
4000
6000
8000
10000
12000
14000
16000
18000
20000
22000
24000
18
02
19
20
20
38
21
56
22
74
23
92
25
10
26
28
27
46
28
64
29
82
31
00
32
18
33
36
34
54
35
72
36
90
38
08
39
26
40
44
41
62
42
80
43
98
45
16
46
34
47
52
Distance Travelled
Sample size: 10 Buses
Bunching of buses in no
BRT scenario leads to
higher journey time.
Sample size: 12 Buses
Segregated bus lanes
reduce bunching by
increasing reliability
BRTS adds system reliability
No BRT Scenario BRT scenario
Average Journey Time: 38 mins & 31 minsAverage Journey Time: 60 mins

LESSON: BUILD BRTS
- Full BRTS
-Light BRTS
-Elevated BRTS
Ahmedabad Municipal Corporation and Surat Municipal Corporation : Government of GujaratTechnical Assistance: Centre of Excellence in Urban Transport, CEPT University, Ahmedabad. (An initiative of the Ministry of Urban Development,
Government of India)

Ahmedabad Municipal Corporation and Surat Municipal Corporation : Government of GujaratTechnical Assistance: Centre of Excellence in Urban Transport, CEPT University, Ahmedabad. (An initiative of the Ministry of Urban Development,
Government of India)
Bogota BRT System – FULL BRTS
Route Length operational 84km
BRTS Stations 114
Daily Ridership 1,650,000
Bus Capacity 140 /210
System Capacity 45,000 pphpd currently
System Speed (avg.) 28.0 kmph
Curitiba BRT System – FULL BRTS
Route Length operational 81 km
BRTS Stations 113
Daily Ridership 504,500
Bus Capacity 80/140/210
System Capacity 13,000 pphpd currently
System Speed (avg.) 19 kmph
Case Studies

Ahmedabad Municipal Corporation and Surat Municipal Corporation : Government of GujaratTechnical Assistance: Centre of Excellence in Urban Transport, CEPT University, Ahmedabad. (An initiative of the Ministry of Urban Development,
Government of India)
Xiamen BRTS – Elevated Corridor – FULL BRTS
Route Length operational 67.5km
BRTS Stations 47
Daily Ridership -
Bus Capacity 80
System Capacity 8,360 pphpd currently
System Speed (avg.) 27.0 kmph
Istanbul BRT System – FULL BRTS
Route Length operational 42km
BRTS Stations 33
Daily Ridership 600,000
Bus Capacity 170
System Capacity 30,000 pphpd currently
System Speed 42kmph (avg.)
Case Studies

ELEVATED BRTS
Centre of Excellence in Urban Transport, CEPT University, Amdavad
PRO(s):
• Can respond to RoW
constraints upto 24 m
• Minimize R&R
impacts
• Reduce delays
CON(s):
• Higher capital cost
• Longer construction
time
• Traffic management
during implementation

BRTS BHUBANESWAR
Junction Treatment for BRTS LITE
Segregation at BRTS LITE Station

Parking Mess
Eg from Ahmedabad
On-Street Parking reduces
Road Infrastructure Capacity
Traffic Speed
PARKING MANAGEMENT !!!
Planned On site situation
Element Width % covered Width % covered
Footpath 2.25m 15 % 2.25m 15 %
Carriageway 9.25m 50% 7m 22%
BRT lane 3.65m
25 %
3.65m
25 %BRT Stop 1.9m 1.9m
Parking 2.25 8 % 6m 36%

DO WE
HAVE AN
OPTION ?

BRTS SURAT
2006
NO
PUBLIC
TRANSPORT

BRTS SURAT
2009
SOME
PUBLIC
TRANSPORT

BRTS SURAT
2014
BRTS as
PUBLIC
TRANSPORT

INTEGRATED LAND USE WITH
MASS TRANSIT 2021

Centre of Excellence in Urban Transport, CEPT University, Ahmedabad
Focus on moving people

Centre of Excellence in Urban Transport, CEPT University, Ahmedabad
BRTS Breaks Social Barrier

THANK YOU