Embed Size (px)
Citation preview

Developing, Implementing, &
Sustaining Healthy Food
Incentive Programs at
Farmers’ Markets
Darcy Freedman, MPH, PhD
Associate Professor, Epidemiology,
Biostatistics, & Social Work
Associate Director, Prevention Research
Center for Healthy Neighborhoods
Case Western Reserve University
January 29, 2015

Disclosures
This research is a product of the University of South Carolina (USC)
Prevention Research Center, supported by Cooperative
Agreement Number 3U48DP001936 for the USC Cancer Prevention
and Control Research Network, and by the Prevention Research
Center for Healthy Neighborhoods at Case Western Reserve
University, supported by Cooperative Agreement Number
1U48DP005030, both awarded by CDC.
I do not have conflicts of interest, real or perceived, related to this
presentation. Results and information presented are the views of
the author and do not necessarily represent the official position of
the CDC.

Acknowledgements
Family Health Centers, Inc.
• Leon Brunson, Sr.
• Sandra Stephens, MD
• Edith Anadu, PhD
• Elvin Cobbs
Right Choice Fresh Start Farmers’ Market
• Paul Butler
• Sylvia Ellis
South Carolina Primary Health Care Association
• Vicki Young, PhD
University of South Carolina, Cancer Prevention and Control Research Network
• Daniela Friedman, PhD (PI)
• James Hebert, ScD (PI)
• Heather Brandt, PhD
• Kassy Alia, MS
• Amy Mattison-Faye, MPH
• Jason Greene, MPH
• Aaron Guest
• Kathryn Kranjc
• Thomas Hurley, MS
• Seul Ki Choi, MPH

Presenter’s Background
RiverWestProduce Stand
Nashville, TN
(2005-06)
Veggie ProjectNashville, TN
(2007-09)
Right Choice Fresh Start FMOrangeburg, SC (2009-14)
FreshLink
Cleveland, OH
(2014-present)
FM Tracks
Multi-state
(2014-present)

Presentation Objectives1. Identify the need for healthy food access interventions and the
benefit of making linkages between Extension, public health,
and community health center systems.
2. Describe a successful healthy food incentive program (Shop N
Save) piloted in rural South Carolina.
3. Identify methods for engaging key stakeholders (e.g., farmers,
community members, health care providers, elected officials,
researchers) to support and sustain healthy food incentive
programs at farmers’ markets through policy change.
4. Name at least three opportunities and challenges related to
wide-scale implementation of healthy food incentive programs
at farmers’ markets.

WHY ARE HEALTHY FOOD
INCENTIVE PROGRAMS NEEDED?

5 servings F/V per day
See Wang et al., 2014, BMJ
Eating at least 5 servings of fruits and vegetables
daily is associated with decreased risk
of all cause mortality.

Few Americans Consume Diet
Rich in Fruits and Vegetables
CDC, 2013
Median Daily Vegetable Intake among Adults in the U.S.

Percentage of U.S. Adults Consuming 5+
Fruits and Vegetables per Day
0
10
20
30
40
50
60
70
80
90
100
1996 1998 2000 2002 2003 2005 2007 2009
Pe
rce
nt
Source: CDC BRFSS

Date of download: 9/29/2014Copyright © 2014 American Medical
Association. All rights reserved.
From: Trends in Dietary Quality Among Adults in the United States, 1999 Through 2010
JAMA Intern Med. Published online September 01, 2014. doi:10.1001/jamainternmed.2014.3422
Alternate Healthy Eating Index 2010 Score Without the trans Fat Component According to Socioeconomic Status (SES) by National Health and Nutrition Examination Survey
CycleSymbols indicate covariate-adjusted means, and error bars, 95% confidence intervals. Participants with more than 12 completed years of education attainment and a
poverty income ratio of at least 3.5 were categorized as high SES; participants with less than 12 years educational attainment and a poverty income ratio of less than 1.30 were
categorized as low SES; and others were classified as medium SES. Values were estimated from multivariate linear regression analysis by adjusting for total energy intake
(continuous), sex (male, female), age group (20-39, 40-64, ≥65 y), race/ethnicity (non-Hispanic white, non-Hispanic black, Mexican American, other), and household size.
Figure Legend:
Gap between High SES
and Low SES was
3.9 in 1999 and 7.8 in 2010

1 in 3 National Health
Interview Survey
participants who
were chronically ill
reported they were
unable to afford
food, medications, or
both. (Berkowitz et al., 2014)
Hunger in America, 2014

Costs of Eating
Fruit & Vegetable Options
Snack Cost ($)
per Portion
Fruit or
Vegetable
Alternative
Cost ($) per
Portion
Difference in
Price ($) per
Portion
Cookie 0.16 Apple 0.36 +0.20
Graham
Cracker
0.14 Grapes 0.32 +0.18
Crackers 0.16 Carrots 0.19 +0.03
Pretzel 0.25 Red pepper 0.60 +0.35
Total Additional Costs 0.76
Family of 4 switches to fruit and veggie snacks:
$0.76/person/day x 7 days x 4 = $21.28/week
Additional Cost = $85.12/month
Source: USDA, Economic Research Service (11/28/2012)
http://www.ers.usda.gov/data-products/fruit-and-vegetable-prices.aspx#33646
The average SNAP benefit
per person is about $125
per month, which works out
to about $1.40 per person
per meal

WHO HAS EXPERTISE RELATED TO
HEALTHY FOOD INCENTIVE
PROGRAM IMPLEMENTATION?

See Freedman et al., (2014) Extending Cancer Prevention to Improve Fruit and Vegetable Prevention.
Journal of Cancer Education.
Cooperative Extension
Community Health
Centers
Public Health
Systems
The “Three Sisters”

RIGHT CHOICE FRESH START
FARMERS’ MARKET EXAMPLE

Forming the Right Choice Fresh Start Farmers’ Market
Federally Qualified Health
Center (FQHC) based farmers’ market
Formed at as community-university
partnership between University of
South Carolina (USC) and
Family Health Centers, Inc.
Supported through the USC
Cancer Prevention and Control
Research Network (CPCRN) funded
by CDC through the Prevention
Research Center Special Interest
Project (SIP) Program
FQHC Service Delivery Sites
• South Carolina: 156
• US: 7,621

Context of RCFS• Site selected (October 2010):
– Family Health Centers, Inc., Orangeburg, SC
• Orangeburg County ranked 45 out of 46 for county health
rankings**
South Carolina Orangeburg County
Population, 2011* 4,679,230 91,910
African American, 2011* 28.1% 62.3%
Median household income, 2006-10* $43,939 $32,849
Person below poverty level, 2006-10* 16.4% 25.8%
Persons/square mile, 2010* 153.9 83.6(micro-politan area)
Adult obesity** 31% 40%
Diabetes** 11% 15%
*US Census Bureau, **County Health Rankings

Community Readiness Assessment
Text, chart and/or photo here.
For more information see: Freedman et al. (2012). Journal of Community Health, 37, 80-88.

Engaging the Community
Memorandum of Agreement (10/2010, renewed annually)
Community Visioning Meeting (11/2010), N=50
Advisory Council (2/2011-ongoing); Establish Vendor Policies; Hire Farmers’ Market Manager
Farmers’ Market opened June 2011; 4th season opened June 6, 2014; Customer and Farmer Satisfaction Surveys (ongoing); Events at market
Seek additional funding: SC Cancer Alliance, CTG, Farm Bureau, USDA Community Food Project
2012 D. Freedman transitioned
out of active leadership
Freedman & Alia, 2013 “Building Farmacies” manual

1. Study population: Diabetic patients from the FQHC
2. Dose-response relationship between farmers’ market use and
improvement in fruit and vegetable consumption.
3. Patients who relied exclusively on incentives to purchase
produce at the RCFS farmers’ market experienced greater
improvements in fruit and vegetable consumption.
Key Findings from Initial RCFS Evaluations
For more information see: Freedman et al. (2013). Preventive Medicine, 56(5), 288-292.

Who?
Anyone shopping with federal food assistance at the RCFS
farmers’ market (SNAP, WIC, & Senior or WIC Farmers’ Market
Nutrition Program)
What?
Provide one $5 match for spending $5 or more with federal food
assistance at the RCFS
When?
Available throughout the season. One match per market day.
Shop N Save

Why?
Low use of RCFS by SNAP beneficiaries during first season
Concern among Advisory Council and Farmers
Findings from RCFS evaluations – incentives mattered to
improve diet
Reality of economic barriers to accessing healthy foods
Behavioral economics
Shop N Save

Strong demand for Shop N Save
336 enrollees in 2012 (first year)
617 in 2013 (second year)
Characteristics of Shop N Save (SNS) Participants in 2012
58% had NEVER been the RCFS before enrollment in SNS
91% women, 90% African American
54% patients at the FQHC
High rates of self-reported diet-related health impairments:
o High blood pressure (51%)
o Diabetes (30%)
o Arthritis (30%)
30% reported health status was “fair” or “poor”
Key Findings from Shop N Save EvaluationFor more information see: Freedman et al. (2014). Preventing Chronic Disease, 11(E87). http://dx.doi.org/10.5888/pcd11.130347

Types of Federal Food Assistance among SNS Participants
Key Findings from Shop N Save EvaluationFor more information see: Freedman et al. (2014). Preventing Chronic Disease, 11(E87). http://dx.doi.org/10.5888/pcd11.130347
0 20 40 60 80
SNAP
WIC
WIC FMNP
Senior FMNP
SNAP: Supplemental Nutrition Assistance Program, FMNP: Farmers’ Market Nutrition Program,
WIC: Supplemental Nutrition Assistance Program for Women, Infants, and Children

Food Assistance Revenue Before and After
Shop N SaveFor more information see: Freedman et al. (2014). Preventing Chronic Disease, 11(E87). http://dx.doi.org/10.5888/pcd11.130347
SNAP use ↑ 4-fold
Senior FMNP use ↑ nearly 4-fold
WIC use relatively unchanged

Food Assistance Revenue Before and After
Shop N SaveFor more information see: Freedman et al. (2014). Preventing Chronic Disease, 11(E87). http://dx.doi.org/10.5888/pcd11.130347
First and Last Week FMNP

Total Revenue at RCFS Farmers’ Market
Before and After Shop N SaveFor more information see: Freedman et al. (2014). Preventing Chronic Disease, 11(E87). http://dx.doi.org/10.5888/pcd11.130347
Significant increase in revenue from $14,285 to $15,720

http://epbiwww.case.edu/index.php/people/faculty/191-dfreedman
More Information on the Right Choice Fresh
Start Farmers’ Market

MOVING FROM PILOT PROJECT
TO POLICY CHANGE

Documentary film to disseminate the story of RCFS
o Community forums
o Film festivals
o “Planting Healthy Roots”
http://www.youtube.com/watch?v=viPtYFwzD6I
Papers, Reports, Newspaper Articles, Radio Shows, Presentations
http://epbiwww.case.edu/index.php/people/faculty/191-dfreedman
One-on-one conversations with catalysts for policy change
o Poverty-rights advocates
o Agriculture and public health sectors
o Social workers
Sharing Our Story to Promote Wide-Scale
Implementation of Shop N Save

South Carolina Budget Proviso
38.26. (DSS: SNAP Coupons) The Department of Social Services shall
establish a program to provide coupons that will allow Supplemental
Nutrition Assistance Program (SNAP) recipients to obtain additional
fresh fruits and vegetables when purchasing fresh produce at grocery
stores or farmers markets with SNAP benefits through their EBT
cards. Each coupon shall allow the beneficiary to double the amount of
produce purchased, up to five dollars. The agency shall utilize all funds
received in the prior and current fiscal years from the U.S. Department of
Agriculture as a bonus for reducing the error rate in processing SNAP
applications to fund the program.

To develop recommendations for an implementation plan
To advocate for recommendations to be implemented
To identify and help recruit sites
To help with outreach and publicizing of the program
Engaging Stakeholders

Challenge to engage 2 primary stakeholders from the
beginning: SNAP recipients and farmers’ markets
Used supporting survey data collected from SNAP recipients in
South Carolina to develop recommendations
Engaging Stakeholders
SNAP participants in SC want to purchase fresh healthy foods at farmers’ markets. The Midlands Family Study included 550 adults caring for children,
69% participating in SNAP. One in three of these participants shopped at
farmers’ markets, and 97% said they would use their SNAP benefits at a
farmers’ market if a participating one was close by to them. Shopping at
farmers’ markets may help alleviate child hunger, too, as families that
shopped at farmers markets reported being more food secure, including
being able to protect their children from hunger.¹Jones, S. et al (2013). [Midlands Family Study]. Unpublished raw data.
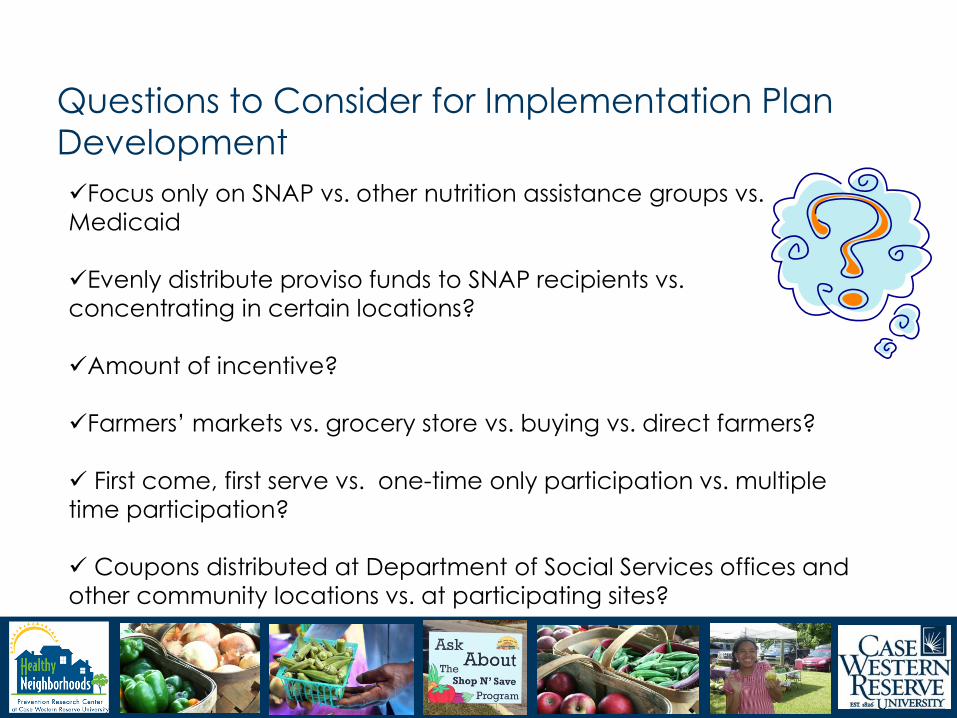
Focus only on SNAP vs. other nutrition assistance groups vs.
Medicaid
Evenly distribute proviso funds to SNAP recipients vs.
concentrating in certain locations?
Amount of incentive?
Farmers’ markets vs. grocery store vs. buying vs. direct farmers?
First come, first serve vs. one-time only participation vs. multiple
time participation?
Coupons distributed at Department of Social Services offices and
other community locations vs. at participating sites?
Questions to Consider for Implementation Plan
Development

Pilot year (2014) – will continue in 2015
6 farmers’ markets, 1 mobile market, 1 food distributor
SNAP recipients using $2.50 of their own SNAP money on
produce = $5 in “Healthy Bucks” for more produce purchases
Reimbursement form to be filled out by site to turn into DSS
(Name, EBT card number, signature, “healthy bucks” amount)
South Carolina Policy Implementation Plan
Some Implementation Plan Challenges
Difficult to find farmers’ markets with the capacity to or interest
in participating
Location of farmers’ markets
Need for clear communications especially with turnover in
staffing involved with Healthy Bucks

1. Partner early and often.
2. Location, location, location.
3. Imagine wide-scale implementation before developing policy.
4. Language matters.
5. Evaluate and Disseminate
Lessons Learned in South Carolina

FUTURE DIRECTIONS FOR HEALTHY
FOOD INCENTIVE INTERVENTIONS
AT FARMERS’ MARKETS

1. Food Insecurity Incentive Grant Program (USDA)
2. FreshLink Peer Health Advocate
3. FM Tracks App
Future Directions

References • Berkowitz, S. A., Seligman, H. K., & Choudhry, N. K. (2014). Treat or eat: food insecurity, cost-related
medication underuse, and unmet needs. American Journal of Medicine, 127(4), 303-310.e303. doi:
10.1016/j.amjmed.2014.01.002
• Freedman, D. A., & Alia, K. A. (2013). Building "farmacies": A guide for implementing a farmers' market at
a community health center. Columbia, SC: University of South Carolina.
• Freedman, D. A., Choi, S. K., Hurley, T., Anadu, E., & Hebert, J. R. (2013). A farmers' market at a federally
qualified health center improves fruit and vegetable intake among low-income diabetics. Preventive
Medicine, 56(5), 288-292. doi: doi.org/10.1016/j.ypmed.2013.01.018
• Freedman, D. A., Mattison Faye, A., Alia, K., Guest, M. A., & Hebert, J. R. (2014). Comparing farmers’
market revenue trends before and after the implementation of a food assistance monetary incentive
intervention. Preventing Chronic Disease.
• Freedman, D. A., Pena-Purcell, N., Friedman, D. B., Ory, M., Flocke, S., Barni, M. T., & Hebert, J. R. (2014).
Extending Cancer Prevention to Improve Fruit and Vegetable Consumption. Journal of Cancer
Education. doi: 10.1007/s13187-014-0656-4
• Freedman, D. A., Whiteside, Y. O., Brandt, H. M., Young, V., Friedman, D. B., & Hebert, J. R. (2012).
Assessing readiness for establishing a farmers' market at a community health center. Journal of
Community Health, 37(1), 80-88.
• Centers for Disease Control and Prevention. (2013). State indicator report on fruits and vegetables, 2013.
Atlanta, GA.
• Wang, D. D., Leung, C. W., Li, Y., Ding, E. L., Chiuve, S. E., Hu, F. B., & Willett, W. C. (2014). Trends in dietary
quality among adults in the United States, 1999 through 2010. JAMA Intern Med, 174(10), 1587-1595. doi:
10.1001/jamainternmed.2014.3422
• Wang, X., Ouyang, Y., Liu, J., Zhu, M., Zhao, G., Bao, W., & Hu, F. B. (2014). Fruit and vegetable
consumption and mortality from all causes, cardiovascular disease, and cancer: systematic review and
dose-response meta-analysis of prospective cohort studies. BMJ, 349. doi: 10.1136/bmj.g4490

Questions?