Embed Size (px)
Citation preview

Evidence-‐Based Monitoring of Local Government Performance: Indonesian
Experience
Agus Dwiyanto NaBonal InsBtute of Public AdministraBon
and Gadjah Mada University
Why Indonesia Needs to Promote Evidence Based-‐ Monitoring and EvaluaBon System?
• CiBzens and policy stakeholders are becoming more raBonal. They demand more evidences for policy outputs and outcomes
• Indonesia is moving into a more democraBc and open country. Policy reforms tend to be more transparent, inclusive, and raBonal. Evidence-‐based policy reforms is unavoidable.
• Indonesia ha conducted comprehensive decentralizaBon and governance reforms, quesBons about the effects of those reforms on service delivery and governance pracBces were on the arise.
What we do to promote evidence-‐based
monitoring of LG performance in Indonesia • CreaBng baseline data on decentralizaBon and
governance pracBces by conducBng rigorous surveys, such as Governance and DecentralizaBon Survey 2002 (GDS1), GDS1+ 2004, GDS2 2006, Governance Assessment Survey 2007
• The surveys were designed to measure comprehensively service delivery (health, educaBon, and infrastructure) and governance performance
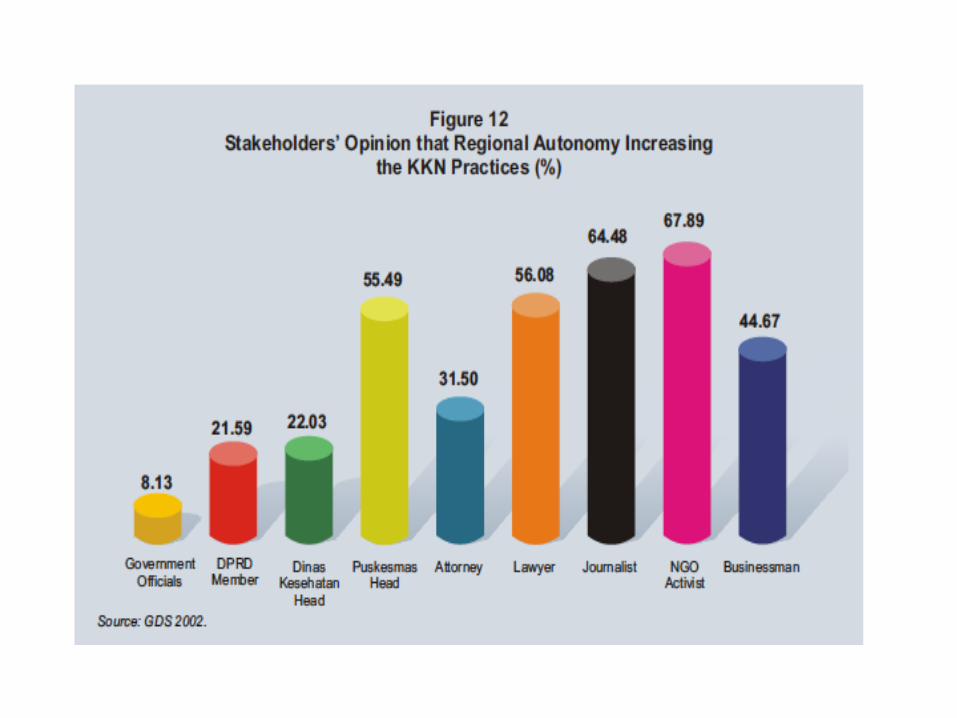
• Respondents of the survey were: government officials, service providers, households, and civil society groups such as NGO acBvist, journalist, and academician.

Surveys…
• Indonesian Family Life Survey (1997, 2001, and 2007): households social economic panel survey involving more than 40 thousand individuals of 137 districts.
• Survey on New Autonomous Regions (EDOHP 2010). The survey involved 205 newly-‐created regions in Indonesia. It was designed to measure the performance of the new regions.
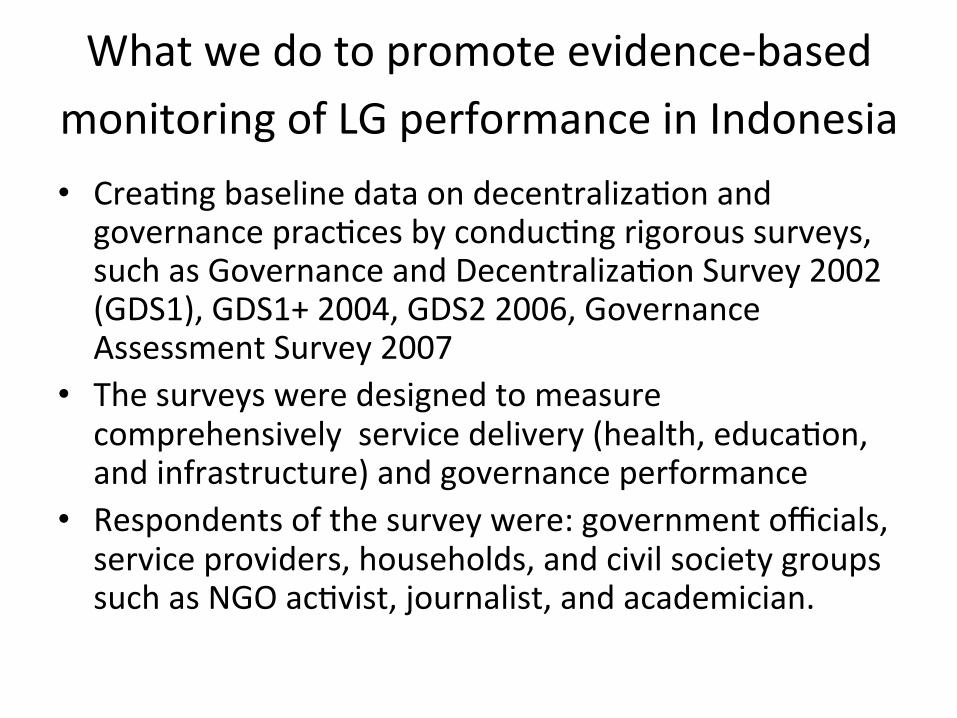
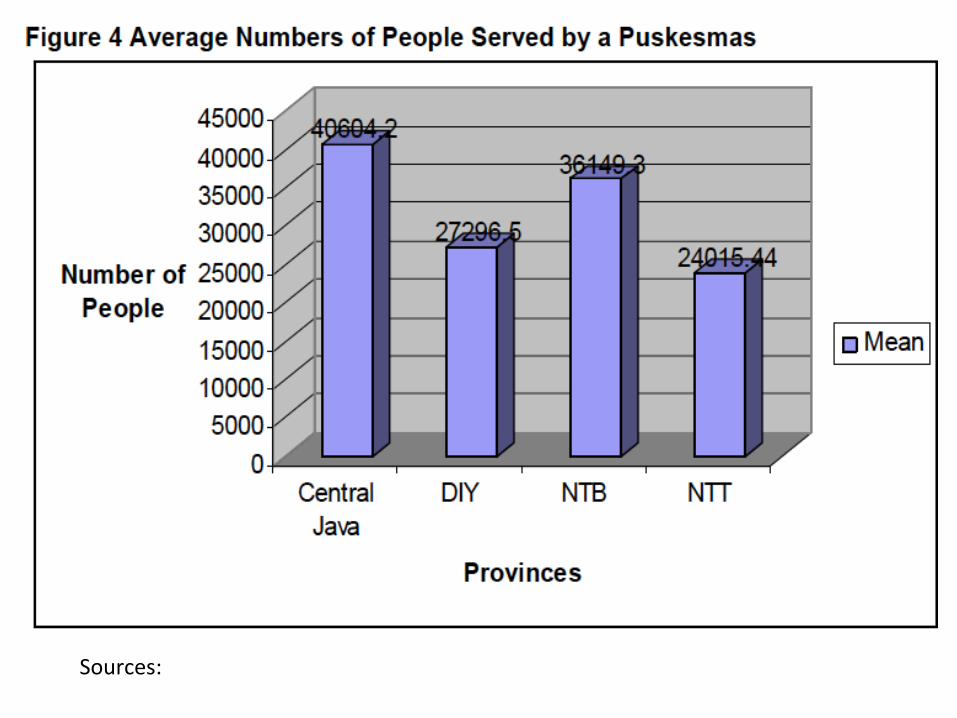
Example, Indicators of coverage and quality of health services, GDS
coverage • Number of people served
by a health clinic • Average Bme to reach the
nearest clinic and hospital • Mean to reach the nearest
clinic and hospital • Average area of coverage of
a clinic
quality • Number and quality of
medical staff • Available services • Standards of services (MSS) • ParBcipaBon in planning • FaciliBes available in clinic
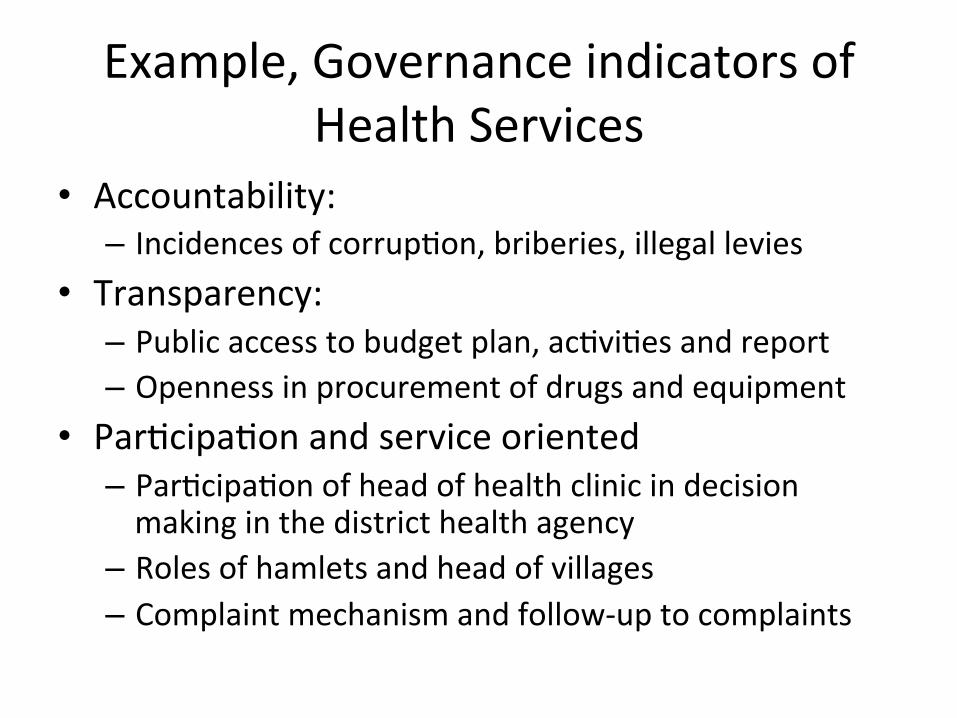
Example, Governance indicators of Health Services
• Accountability: – Incidences of corrupBon, briberies, illegal levies
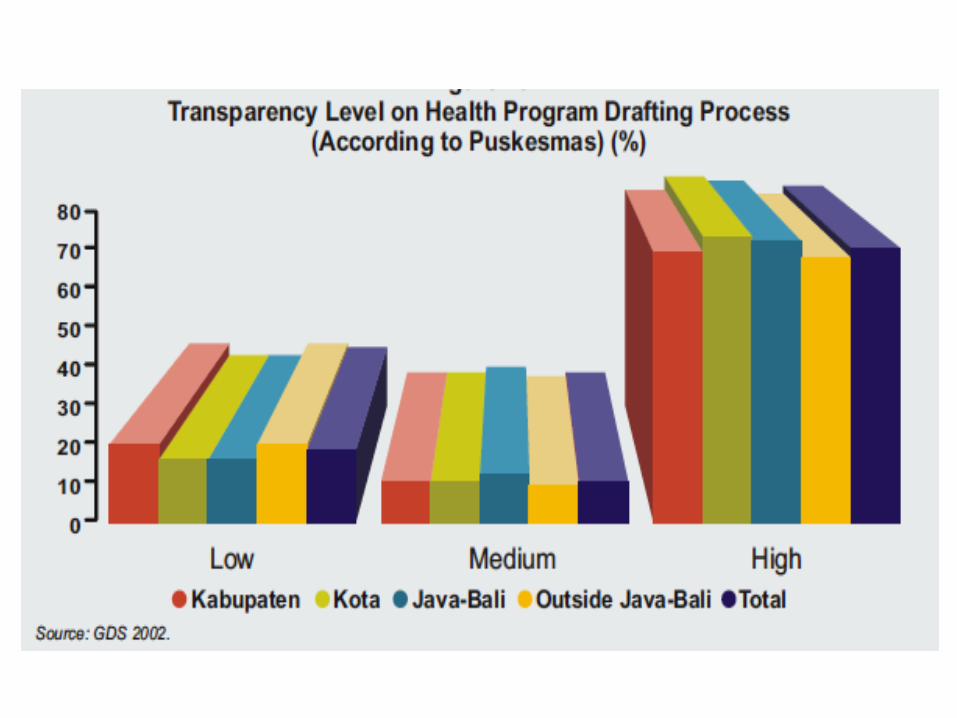
• Transparency: – Public access to budget plan, acBviBes and report – Openness in procurement of drugs and equipment
• ParBcipaBon and service oriented – ParBcipaBon of head of health clinic in decision making in the district health agency
– Roles of hamlets and head of villages – Complaint mechanism and follow-‐up to complaints
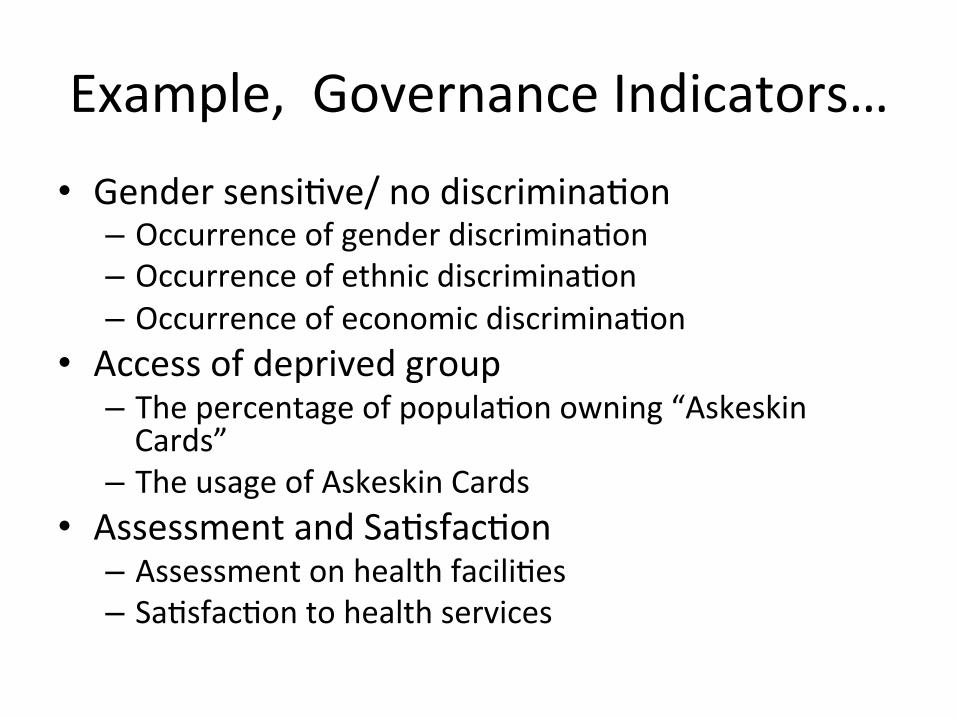
Example, Governance Indicators… • Gender sensiBve/ no discriminaBon
– Occurrence of gender discriminaBon – Occurrence of ethnic discriminaBon – Occurrence of economic discriminaBon
• Access of deprived group – The percentage of populaBon owning “Askeskin Cards”
– The usage of Askeskin Cards • Assessment and SaBsfacBon
– Assessment on health faciliBes – SaBsfacBon to health services
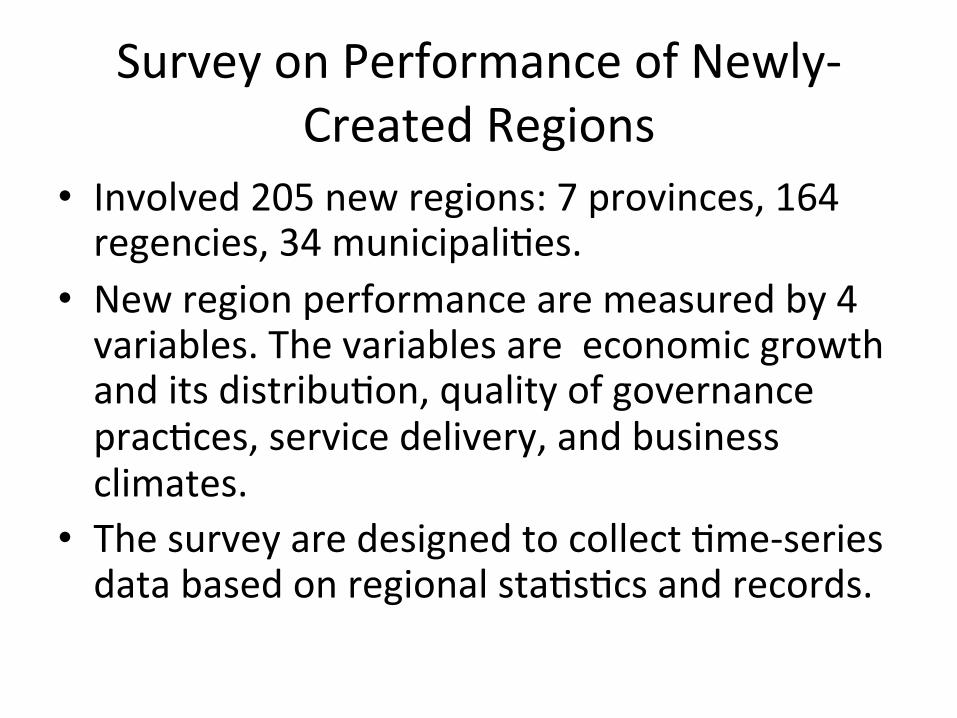
Survey on Performance of Newly-‐Created Regions
• Involved 205 new regions: 7 provinces, 164 regencies, 34 municipaliBes.
• New region performance are measured by 4 variables. The variables are economic growth and its distribuBon, quality of governance pracBces, service delivery, and business climates.
• The survey are designed to collect Bme-‐series data based on regional staBsBcs and records.
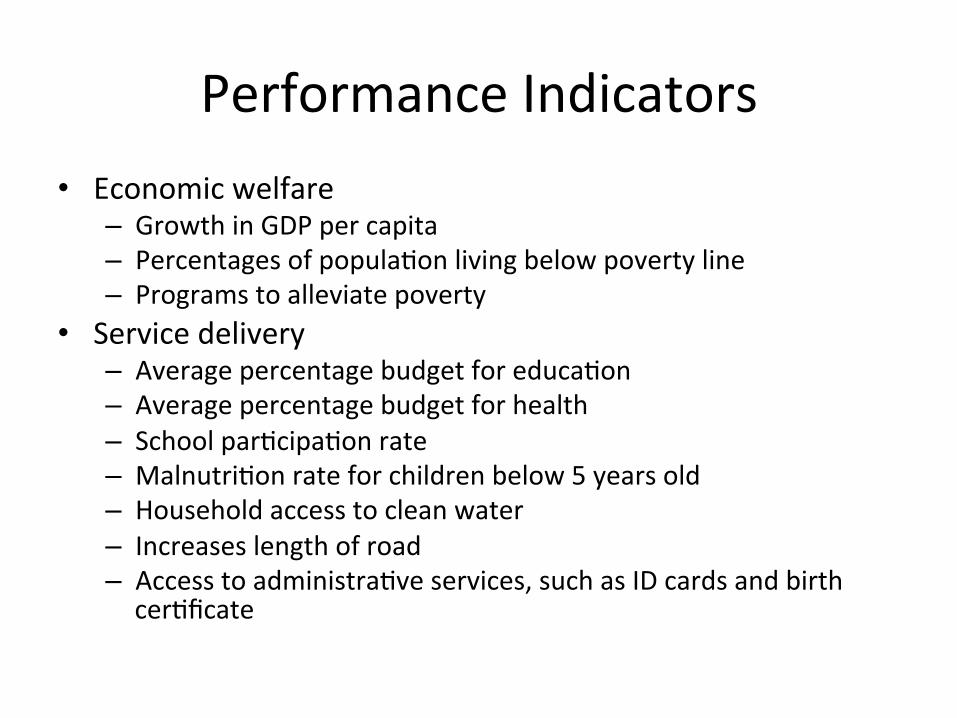
Performance Indicators • Economic welfare
– Growth in GDP per capita – Percentages of populaBon living below poverty line – Programs to alleviate poverty
• Service delivery – Average percentage budget for educaBon – Average percentage budget for health – School parBcipaBon rate – MalnutriBon rate for children below 5 years old – Household access to clean water – Increases length of road – Access to administraBve services, such as ID cards and birth cerBficate

Performance Indicators • Business climate
– Efficiency in issuing business permit – Growth rate of SMEs – Existence of head of regions and business community forum
• Quality of Governance – Local budget formulated on Bme – Budget disbursement capability – Transparency in budget spending and procurement – Public accountability reports – Elite capture (% budget for head of region and members of council) – Public consultaBon in regulatory processes, including budget planning
How those surveys were used to
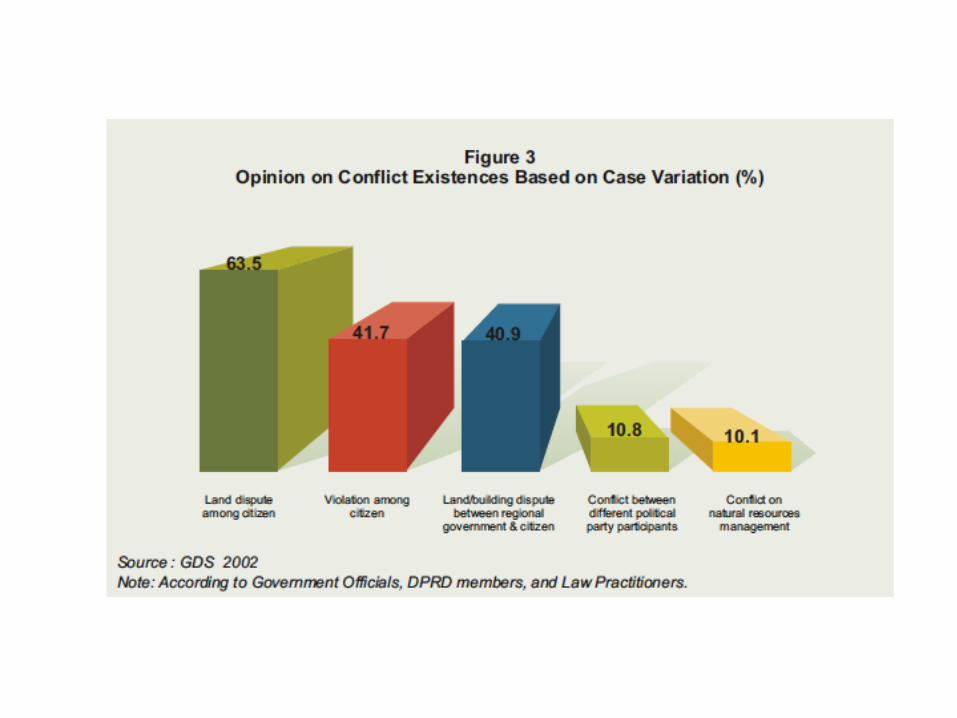
address policy quesBons? • Understanding the effects of “big bang
decentralizaBon policy” on service delivery, social conflicts, governance performance, business climate, (GDS)
• EvaluaBng governance performance across provinces and districts, e.g., governance indexes, index of percepBon on corrupBon, (GDS, GAS)
• Understanding the dynamics of poverty and its determinants (IFLS)
• Understanding the performance of newly-‐created regions and its determinants.
Benefits of employing evidence based monitoring and evaluaBon
• Enable monitoring and evaluaBon to provide “clear-‐cut” and convincing findings. – Strong and clear recommendaBon for policy reform, “what to do and how to do it”
• Make buy-‐ in strategy becomes more effecBve • Helps policy makers to focus on problem • Increase public awareness to the program

Constraints in employing evidence-‐based monev
• Limited staBsBcs available. Lack of tradiBon among government agencies to manage data base, collect program records, and to develop monitoring and evaluaBon system.
• Can be costly and Bme consuming • Wide gap between knowledge producing insBtuBon and policy making body
• Lack of incenBves to demonstrate performance

Source:
Sources:


Dynamics of poverty and pce
IFLS is panel survey so we can follow same households and individuals over Bme Is much movement into and out of poverty. 75% nonpoor in both 1997 and 2000 Over half of poor in 2000 were NOT poor in 1997, and visa versa
Correlates of Poverty and low pce
EducaBon of household head strong posiBve impact on lowering probabiliBes of poverty Also strong posiBve associaBon with being out of poverty in both 97 and 00 compared to being in poverty in both years

Gambar 3Transisi Kemiskinan Tahun 1997 and 2000
7,2 10,1 8,7
74,0
0
10
20
30
40
50
60
70
80
90
100
Miskin pada1997 & 2000
Miskin pada 1997, TdkMiskin pada 2000
Tidak Miskin pada 1997,Miskin pada 2000
Tidak Miskin pada 1997& 2000
Persen
Sumber: IFLS2 dan IFLS3

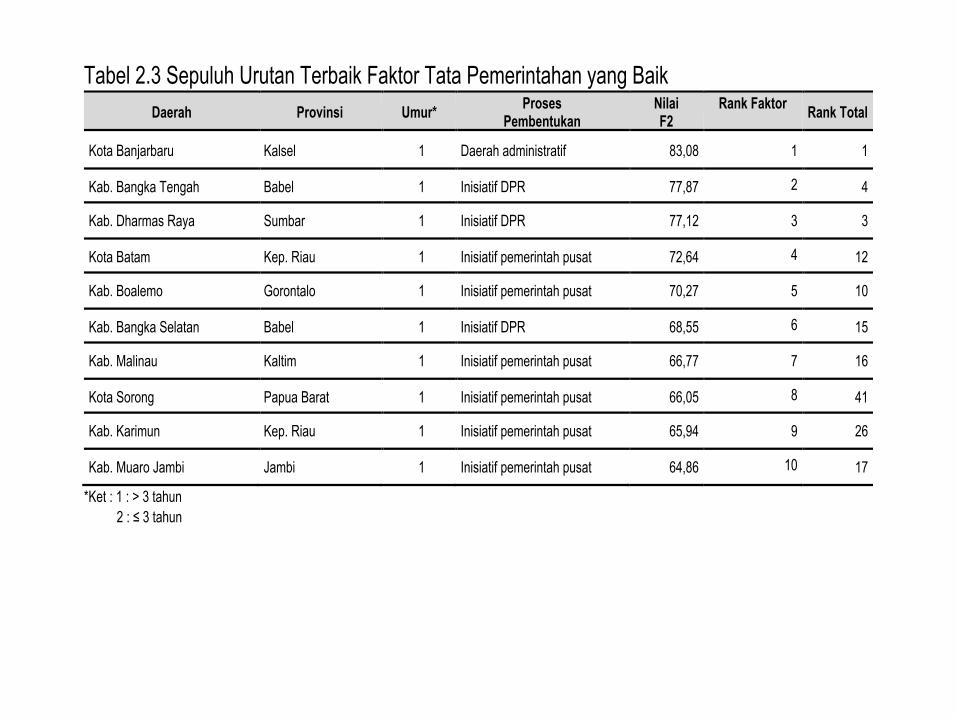
Tabel 2.3 Sepuluh Urutan Terbaik Faktor Tata Pemerintahan yang Baik Daerah Provinsi Umur* Proses
Pembentukan Nilai F2
Rank Faktor Rank Total
Kota Banjarbaru Kalsel 1 Daerah administratif 83,08 1 1
Kab. Bangka Tengah Babel 1 Inisiatif DPR 77,87 2 4
Kab. Dharmas Raya Sumbar 1 Inisiatif DPR 77,12 3 3
Kota Batam Kep. Riau 1 Inisiatif pemerintah pusat 72,64 4 12
Kab. Boalemo Gorontalo 1 Inisiatif pemerintah pusat 70,27 5 10
Kab. Bangka Selatan Babel 1 Inisiatif DPR 68,55 6 15
Kab. Malinau Kaltim 1 Inisiatif pemerintah pusat 66,77 7 16
Kota Sorong Papua Barat 1 Inisiatif pemerintah pusat 66,05 8 41
Kab. Karimun Kep. Riau 1 Inisiatif pemerintah pusat 65,94 9 26
Kab. Muaro Jambi Jambi 1 Inisiatif pemerintah pusat 64,86 10 17
*Ket : 1 : > 3 tahun 2 : ≤ 3 tahun

Tabel 2.4 Sepuluh Urutan Terburuk Faktor Tata Pemerintahan yang Baik Daerah Provinsi Umur* Proses
Pembentukan Nilai F2
Rank Faktor Rank Total
Kab. Kep. Meranti Riau 2 Inisiatif DPR 10 189 195
Kab. Nias Utara Sumut 2 Inisiatif DPR 10 190 191
Kab. Morotai Malut 2 Inisiatif DPR 10 191 194
Kab. Buru Selatan Maluku 2 Inisiatif DPR 10 192 193
Kab. Tambrauw Papua Barat 2 Inisiatif DPR 10 193 186
Kota Batu Jatim 1 Daerah administratif 10 194 187
Kab. Maybrat Papua Barat 2 Inisiatif DPR 6 195 196
Kab. Sigi Sulteng 2 Inisiatif DPR 0 196 198
Kab. Paniai Papua 1 Daerah administratif 0 197 197
Kab. Puncak Jaya Papua 1 Daerah administratif 0 198 192
*Ket : 1 : > 3 tahun 2 : ≤ 3 tahun
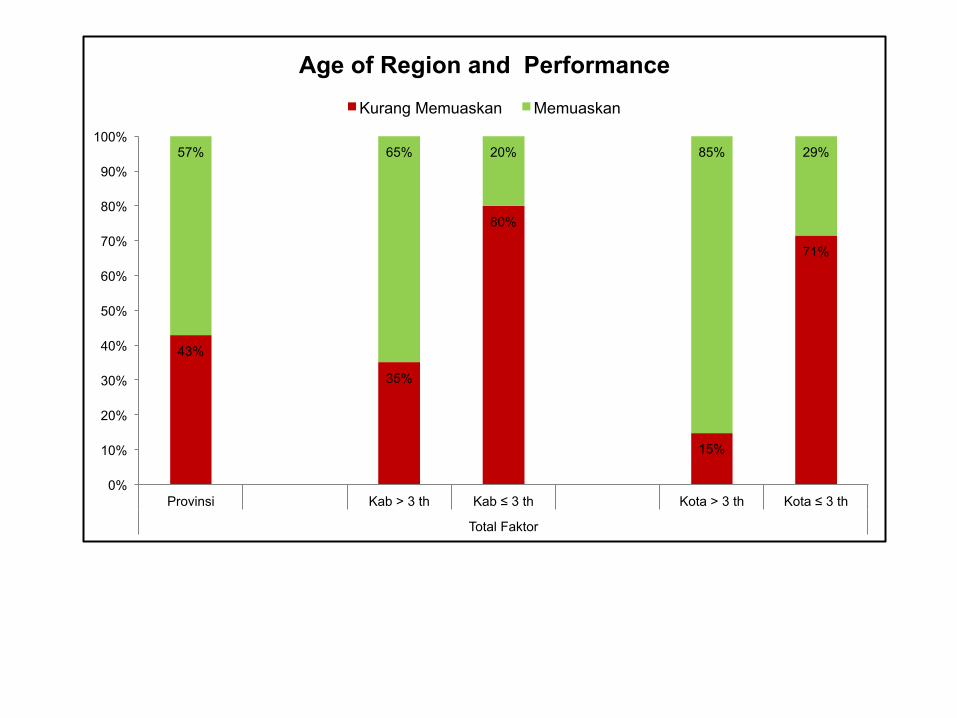
43%
35%
80%
15%
71%
57% 65% 20% 85% 29%
0%
10%
20%
30%
40%
50%
60%
70%
80%
90%
100%
Provinsi Kab > 3 th Kab ≤ 3 th Kota > 3 th Kota ≤ 3 th
Total Faktor
Age of Region and Performance Kurang Memuaskan Memuaskan
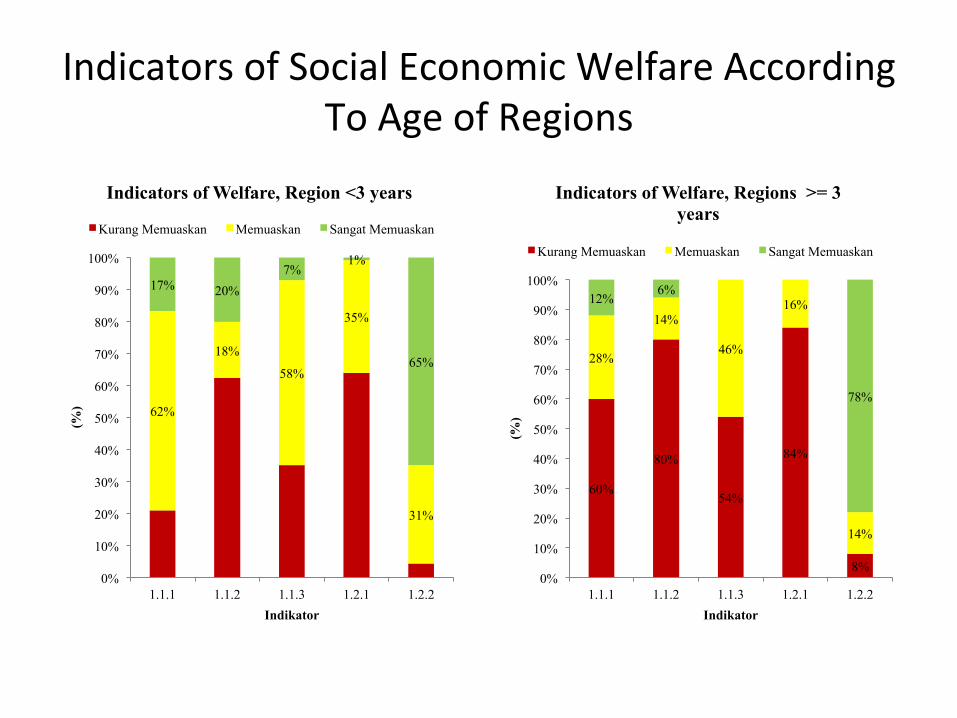
Indicators of Social Economic Welfare According To Age of Regions
62%
18%
58%
35%
31%
17% 20% 7%
1%
65%
0%
10%
20%
30%
40%
50%
60%
70%
80%
90%
100%
1.1.1 1.1.2 1.1.3 1.2.1 1.2.2
(%)
Indikator
Indicators of Welfare, Region <3 years
Kurang Memuaskan Memuaskan Sangat Memuaskan
60%
80%
54%
84%
8%
28%
14%
46%
16%
14%
12% 6%
78%
0%
10%
20%
30%
40%
50%
60%
70%
80%
90%
100%
1.1.1 1.1.2 1.1.3 1.2.1 1.2.2
(%)
Indikator
Indicators of Welfare, Regions >= 3 years
Kurang Memuaskan Memuaskan Sangat Memuaskan

71%
52% 59% 14%
16%
26%
14% 54% 47%
29% 15%
3%
29% 16%
56%
14% 5% 12%
0% 10% 20% 30% 40% 50% 60% 70% 80% 90%
100%
Prov. Kab. Kota Prov. Kab. Kota Prov. Kab. Kota
Pertumbuhan PDRB Per Kapita Pengurangan Angka Kemiskinan
Pemberdayaan Penduduk Miskin
Indicators of Socioeconomic Welfare, Province and Regions
Kurang Memuaskan Memuaskan Sangat Memuaskan