Embed Size (px)
Citation preview

1
Board Structure and Monitoring: New Evidence from CEO
Turnovers
Lixiong Guo and Ronald Masulis*
School of Banking and Finance
The University of New South Wales
January 6, 2015
Abstract
We use the 2003 NYSE and NASDAQ listing rules concerning board and committee
independence as a quasi-natural experiment to examine the causal relations between board structure
and CEO monitoring. Noncompliant firms forced to raise board independence or adopt a fully
independent nominating committee significantly increase their forced CEO turnover sensitivity to
performance relative to compliant firms. Nominating committee independence is important even for
firms with an independent board, and the effect is stronger when the CEO previously sat on the
committee. We conclude that more independent boards and fully independent nominating committees
lead to more effective CEO monitoring and discipline.
We would like to thank Renee Adams, Robert Daines, Mariassunta Giannetti, Udi Hoitash, Abhiroop Mukherjee, David
Parsley, Meijun Qian, Jesus Salas, Robert Tumarkin, Tina Yang, and seminar and conference participants at Vanderbilt
University, University of Colorado at Boulders, Nanyang Technological University, City University of Hong Kong,
University of Technology of Sydney, Victoria University of Wellington, the 2010 Australasian Banking and Finance
Conference (Sydney), the 2011 Midwest Finance Association Conference (Chicago), the 2011 Mid-Atlantic Research
Conference in Finance (Villanova University), the 2011 FMA Annual Meeting (Denver), the 2012 China International
Conference in Finance (Chongqing), the 2012 FMA Asian Conference (Phuket, Thailand), the 2012 ISB Summer Research
Conference in Finance (Hyderabad, India), the 2012 Conference on Empirical Legal Studies (Stanford Law School) and
2013 FIRS conference (Dubrovnik) for helpful comments and suggestions. Lixiong Guo would like to thank members of his
Ph.D. dissertation committee at Vanderbilt University for their advice. They are Ronald Masulis (Chair), Hans Stoll, Craig
Lewis, Bill Christie, Alexei Ovtchinnikov and Richard Willis. * The authors are both with the School of Banking and Finance, University of New South Wales (UNSW), Sydney, NSW
2052, Australia. Email addresses: [email protected] (Lixiong Guo), [email protected] (Ronald Masulis).

2
1. Introduction
Increasing the representation of independent directors on the board is often promoted by investors and
regulators as a way to strengthen board oversight. 1 By definition, independent directors are believed
to be more willing to challenge CEOs than gray or inside directors. In addition, they have incentives
to develop a reputation as skilled decision control experts in the corporate directorship market (Fama,
1980). Yet, independent directors often face severe limitations in accessing firm-specific information,
which can reduce their monitoring effectiveness (Jensen, 1993; Raheja, 2005; Adams and Ferriera,
2007; Harris and Raviv, 2008; Masulis and Mobbs, 2011). They usually hold small equity stakes in
the firms where they hold board seats, which limit their financial incentives to carefully monitor
(Perry, 1999). Also, a reputation of not challenging a CEO could improve an independent director’s
likelihood of being renominated at firms with a powerful CEO and being appointed to the boards of
other weakly governed firms (Hermalin and Weisbach (2003)). This incentive problem could offset
the reputation benefits of being a careful monitor described in Fama (1980). Adding more
independent directors to a board may also aggravate a free-rider problem among directors, which
could weaken board monitoring (Harris and Raviv (2008)). Hence, the net effect on CEO monitoring
of adding more independent directors is theoretically ambiguous and ultimately an empirical question.
Although a large empirical literature exists on the relation between board independence and
board actions and firm performance, many studies only document cross-sectional associations, not
causation.2 A key challenge in studies examining the relationship of board composition and board
decisions is whether particular board attributes lead to certain decisions or whether boards that make
certain decisions tend to have particular board attributes. Such endogeneity issues are a focus of a
recent survey by Adams, Hermalin and Weisbach (2010), who argues that although progress has been
made in devising ways to deal with endogeneity, it remains a pressing issue in corporate governance.
In studies of board structure and CEO turnover, unobservable factors present a serious
endogeneity concern since they can potentially contaminate the interpretation of the statistical
relationship between board composition and forced turnover to performance sensitivity. To illustrate
1 For example, an important requirement of the 2002 Sarbanes-Oxley Act is full independence of a board’s audit committee. 2 See surveys by Bhagat and Black (2002) and Hermalin and Weisbach (2003)

3
the importance of using “exogenous” shocks to assess the causal relation between board structure and
CEO turnover, we consider a board structure that is determined by a bargaining game between the
CEO and outside directors with regards to nominations of new directors in the spirit of Hermalin and
Weisbach (1998). CEOs want to nominate directors with whom they have close ties, while outside
directors seek the opposite. Boards learn about CEO ability from prior firm performance and a private
signal and a CEO’s bargaining power rises with her perceived ability. According to this model, more
talented CEOs are on average associated with less independent boards. Given that such a board has a
higher prior assessment of CEO ability, it takes a larger decline in performance for the board to
change its beliefs, lowering its assessment of a CEO below the firing threshold. As a result, the
empirically observed positive cross-sectional correlation of board independence and forced CEO
turnover sensitivity to performance can be driven by unobserved director beliefs about CEO ability.
As another illustration, if independent directors prefer to serve on corporate boards that conduct
more effective monitoring, say out of concern for their reputations in the labor market, then we can
expect to observe a stronger negative relation between prior performance and CEO turnover in firms
with more independent boards. However, this relation could be driven by omitted firm characteristics
that make these firms more attractive to independent directors. In particular, this correlation does not
imply that increasing board independence always leads to improved board monitoring. In reality, the
endogenous relations between board (committee) independence and the quality of board decisions can
be quite complicated. Since the omitted variables that drive these endogenous relations are usually
unobservable, using exogenous shocks that substantially alter board structure represents a more
effective way to overcome this endogeneity problem.
In this study, we exploit a natural experiment created by the introduction of new NYSE and
Nasdaq listing rule concerning board composition following the passage of Sarbanes-Oxley Act
(SOX) to provide evidence on a causal relation between the independence of the board and its major
committees and the quality of board monitoring. The main provisions of the new exchange listing
rules require the board of each publicly listed company to have (1) a majority of independent
directors, (2) fully independent nominating, compensation, and audit committees, defined as a

4
committee composed of only independent directors and hereafter labeled an independent committee.3
A major attraction of this natural experiment is that a large number of firms are in compliance prior
to the new exchange listing rules on board structure. 4 These firms can be used as potential control
firms in a difference-in-difference analysis to filter out temporal trends, such as the effect of SOX on
internal governance and increasing public scrutiny of governance in U.S. public firms over time.5
One other significant characteristic of our sample is that firms can be compliant with the board
independence rule, but non-compliant with one or more rules requiring full independence of major
board committees and vice versa. This offers us a rare opportunity to isolate the importance of board
independence from that of the independence of key board committees. For example, we find 95
percent of publicly listed U.S. firms that lacked a majority of independent directors on the board also
lacked a fully independent nominating committee prior to SOX. Such high correlations raise questions
about the interpretation of evidence reported in prior studies that only analyze board independence
and ignore the level of independence in the nominating committees. Thus, to better understand how
board structure affects board monitoring, we need to disentangle the effects of board independence
and key board committee independence.
We examine forced CEO turnover decisions to provide evidence on board monitoring because
hiring and firing the CEO is arguably the most important task of corproate boards. Hermalin and
3 These exchange listing rules also require non-management directors to hold regular meetings without the presence of
management. Nasdaq allows a majority of independent directors to nominate directors or set CEO compensation if a firm
lacks a nominating or compensation committee. “Controlled” firms where an individual, group or another firm holds a
majority of voting rights are exempt from the independent board, nominating and compensation committee requirements. 4 Chhaochharia and Grinstein (2009) exploit this same natural experiment to study the effect of board independence on CEO
compensation. Guthrie, Sokolowsky and Wan (2010) revisited these results and find that greater board independence has no
effect on CEO total pay, while firms forced to adopt an independent compensation committee raise CEO total pay. Although
higher CEO pay could indicate weaker monitoring, it could also reflect more intensive monitoring. For example, in Hermalin
(2005), an rise in board monitoring reduces CEO job stability, which requires higher pay to compensate for a rise in CEO
risk-bearing. Thus, it is unclear what conclusion one can draw about board monitoring from CEO compensation alone. In our
robustness analysis, we control for CEO pay for performance sensitivity and find that our major findings are robust. 5 The official name of Sarbanes-Oxley Act is the Public Company Accounting Reform and Investor Protection Act. The
official name highlights that its objective is to ensure the accuracy and credibility of corporate financial reports. SOX has
only one board structure requirement, i.e. all public firms need to have a fully independent audit committee (Section 301).
This is the only overlap between SOX and the new exchange listing rules we study. Except for Section 404, all the other
provisions of SOX affect almost all U.S. public firms and must be implemented by the end of 2003. This precedes the
compliance dates of the exchange listing requirements, which occur in 2004 and 2005. Section 404 (a) requires companies to
include in their annual reports an assessment of internal control for financial reporting (ICFR), and Section 404(b) requires
companies to provide an independent auditor’s attestation. For smaller public companies defined as those with a market
capitalization less than $75 million, the implementation of Section 404(a) was postponed until after December 15, 2007
while the implementation of Section 404(b) was initially postponed for these firms and later they became exempt under the
Dodd-Frank Act. We find that our noncompliant samples are not dominated by these smaller public companies. In fact, the
mean market capitalization of firms noncompliant in 2001 with any of the four rules is above $6 billion.

5
Weisbach (2003) argue that “one way to evaluate the board’s effectiveness is to look at the quality of
these (CEO turnover) decisions.” Hermalin (2005) motivates his focus on CEO turnover by saying
that “while the statutory authority of the board is relatively broad, the best empirical evidence
indicates that boards play a significant role in only a few corporate decisions. Among those in which
the board does play a significant role, the most common – and arguably among the most important –
are those decisions pertaining to the selection, monitoring, and retention (or dismissal) of the CEO.”
Similarly, Jenter and Kanaan (2014) begins their paper by saying that “Whether to retain or fire a
CEO after bad stock price or accounting performance is one of the most important decisions made by
corporate boards.”
We hypothesize that the mandatory adoption of a majority of independent directors on the board
should substantially improve board monitoring and lead to greater sensitivity of forced CEO turnover
to prior firm performance. This prediction follows from a large empirical literature on the boards of
directors which in general finds that firms with better governance are associated with greater CEO
turnover to performance sensitivity. 6
Hence, if the mandatory change in board structure improves
monitoring, we expect to see greater sensitivity of forced CEO turnover to firm performance in
affected firms. Hermalin and Weisbach (1998) develop a model where the percentage of independent
directors on the board is optimally determined by a negotiation between the CEO and the board of
directors. CEOs with higher estimated ability are able to negotiate for more insiders on the board.
They show that the prediction of higher turnover-performance sensitivity in firms with a more
independent board is an equilibrium outcome. This model provides a rigorous theoretical foundation
for our prediction.
In the Hermalin and Weisbach model, the board learns about the incumbent CEO’s ability based
on prior firm performance and the possible acquisition of a private signal at a later stage. The
probability of directors acquiring the private signal depends on the intensity of board monitoring. As
the right to fire the incumbent CEO creates a valuable option and there is more uncertainty about a
6 Weisbach (1988); Huson, Parrino and Starks (2001); Lel and Miller (2008); Jenter and Lewellen (2010); Kaplan and
Minton (2012); Mobbs (2013); Coles, Daniel and Naveen (2014).

6
new CEO than an old CEO, a new CEO is preferred to an old CEO. However, a new CEO requires
more monitoring by the board to realize the higher option value. Since independent directors are
assumed to be more willing to exert effort to monitor the CEO than non-independent directors, an
independent board is more willing to replace the old CEO by a new CEO than a non-independent
board given the same level of poor performance. This leads to an equilibrium in which an independent
board is less tolerant of poor firm performance (has a higher minimum CEO ability threshold for
retention) than a non-independent board and thus, is associated with a greater sensitivity of CEO
turnover to firm performance.7
An independent nominating committee excludes the CEO and her subordinates as well as gray
directors from the nominating process, which can crucially affect board monitoring for at least two
reasons. First, independent directors become more independent of the CEO if there is less concern that
CEO displeasure with their queries can reduce their likelihood of board re-nomination. Second,
requiring nominations to come from independent directors reduces the CEO’s opportunities to
influence the selection of nominees to individuals who meet the regulatory definition of
independence, but are connected to a CEO in other ways, e.g. through social connections (Hwang and
Kim (2009)). Hermalin and Weisbach (1998) point out that researchers should distinguish selections
that alter a board’s actual independence, i.e., the independence parameter in their model, from those
that only give the appearance of independence. The independent nominating committee requirement is
likely to strongly affect the bargaining process between a CEO and the board and accordingly raise
effective board independence. Thus, making the same argument used for board independence, we
hypthesize that a shift to an independent nominating committee raises forced CEO turnover sensitivity
to firm performance in the affected firms. Unlike the nominating committee, audit and compensation
committee duties suggest their independence does not directly affect board incentives to evaluate and
replace incumbent CEOs. So we expect audit and compensation committee independence to have
7 As noted by Hermalin and Weisbach (1998), the same prediction is generated by assuming independent directors attribute
less value to retaining the incumbent CEO than do non-independent directors because of their reputation concerns, better
alignment with shareholder interests, or lack of other ties to the CEO.

7
weaker, if any, effects on CEO turnover decisions compare to an independent board or an independent
nominating committee.
Our empirical analysis is based on a difference-in-difference (DiD) methodology where we
exploit the cross-sectional variations in a firm’s degree of compliance to these new listing rules prior
to their implementation. Treatment and control firms are defined for each new exchange listing rule.
To mitigate any bias introduced by firms self-selecting into compliant and noncompliant status with
respect to each specific new exchange listing rule, we match treatment and control firms based on
both industry and propensity scores prior to the rule change and then perform DiD analysis. Since
firms can be noncompliant with one or more of these new listing rules, we exploit various sample
variations to isolate the individual effects. Since our sample covers a long period of varying economic
conditions and given that CEO turnover policies may change with the macro economy, we allow our
baseline sensitivity of forced CEO turnover to firm performance to vary by year. We also include firm
fixed effects to control for any unobservable time-invariant differences across firms.
Our main findings are that after implementation of these new rules, firms previously not in
compliance with either the board or nominating committee independence requirements, exhibit
significantly greater gain in sensitivity of forced CEO turnover to firm performance following their
compliance with these requirements relative to previously compliant firms. In firms previously
compliant with the board independence requirement, but not with the independent nominating
committee requirement, the increase in nominating committee independence still leads to a significant
rise in CEO turnover sensitivity to firm performance. In contrast, board adjustments to comply with
the independent audit and compensation committee rules have no significant effect on CEO turnover
to performance sensitivity. These results hold whether we measure firm performance by market-
adjusted stock return or industry-adjusted change in EBIT. When p-values are calculated from
simulated distributions of test statistics of placebo board structure changes, statistical significance
remains unchanged or even increases.
We use a hypothetical fall in firm performance from the 75th percentile to the 25
th percentile of
the sample to assess the economic size of the two listing rule effects. Our estimated board

8
independence effect indicates a greater rise in the probability of forced CEO turnover of 2.4% (2%) in
the post-treatment period relative to the pre-treatment period for noncompliant firms relative to
compliant firms, when performance is measured by market-adjusted stock returns (industry-adjusted
changes in EBIT). Likewise, our estimated nominating committee independence effect indicates a
larger rise in the probability of forced CEO turnover of 2.4% (2%) in the post-treatment period
relative to pre-treatment period for noncompliant over compliant firms. To understand the economic
significance of these figures, we compare them to the average rise in the probability of forced CEO
turnover for the same drop in stock (operating) performance. This rise in the full sample is 2.2%
(1.3%). In the pre-treatment period, the rise is only 1.5% (0.4%) for firms noncompliant with board
independence and 1.7% (0.65%) for firms noncompliant with nominating committee independence.
This evidence supports the view that ceteris paribus, independent directors provide more intensive
internal monitoring than do inside or gray directors and that an independent nominating committee is
important to board monitoring, even in firms with a majority of independent directors.
In further support of our conclusion that independent directors are responsible for the rise in
monitoring intensity, we find that noncompliant firms further away from a majority independent
directors prior to the rule changes exhibit larger increases in sensitivity of forced CEO turnover to
firm performance. Consistent with CEO involvement in the director nomination process being an
important reason for ineffective monitoring, we find among firms that lack an independent
nominating committee prior to the regulatory change, those firms where the CEO was previously a
nominating committee member exhibit greater gains in sensitivity of forced CEO turnover to firm
performance than those where the CEO is not on the nominating committee. Consistent with
independent directors being more effective when information cost is low, we find that the rise in
forced CEO turnover sensitivity to performance is more significant in noncompliant firms with low
information costs. Consistent with independent directors being more important when other internal
monitoring mechanisms are not in place, we find the rise in forced CEO turnover sensitivity to
performance is more significant in noncompliant firms that lack an outside blockholder-director and

9
have low institutional ownership concentration prior to the rule change. Lastly, we find a non-linear
firm performance effect that is stronger in the weakest firm performance region.
We investigate an array of sensitivity tests to assess the robustness of our major findings. We
control for CEO pay-performance sensitivity and its interaction with firm performance. We explore
different specifications of the propensity score model, including a very simple model based on firm
size and industry. We exclude firms that could be misclassified as noncompliant due to the stricter
RiskMetrics definition of director independence. We exclude firms that fail to meet the board or
nominating committee independence requirements in 2005, the final year for compliance since they
are likely to be “controlled companies” exempt from board, nominating committee and compensation
committee independence requirements. Our central findings survive all these robustness tests.
This study makes three contributions to the corporate governance literature and to the policy
debates on the regulation of corporate boards. First, to our knowledge, we are the first study to
document a relation between an independent nominating committee and forced CEO turnover. We
find that even in firms with independent boards, the independence of the nominating committee
causes closer scrutiny of the CEO and a more expeditious board response to underperformance. Berle
and Means (1932) and more contemporary authors like Jensen (1993) have raised strong concerns
about management control over the board selection process and this control is an important reason for
the failure of internal governance systems.8 However, the existing corporate governance literature has
largely focused on how the outcome of this selection process – e.g. the observed insider-outsider ratio
– affects board oversight. With few exceptions, prior research pays little attention to the more
important question of who selects the board of directors and how this arrangement affects board
monitoring.9 Hence, our study fills an important gap in the literature. One policy implication of this
finding is that governance reforms aimed at increasing board monitoring can benefit from adding a
nominating committee independence requirement, in addition to overall board independence.
8 Berle and Means (1932 p.87): “… control will tend to be in the hands of those who select the proxy committee and by
whom, the election of directors for the ensuing period will be made. Since the proxy committee is appointed by existing
management, they can virtually dictate their own successors.” 9 Core, Holthausen and Larcker (1999) find that CEO compensation is higher when the CEO is involved in the nomination
of new directors. Grinstein and Hribar (2004) find that the merger bonus given to acquiring firm CEOs is higher when the
CEO is involved in the nomination of new directors. However, the causality is not clear in these studies.

10
Second, we provide the most credible statistical evidence to date on the causal relation between
overall board independence and CEO turnover. Weisbach (1988) is the first to report a significant
association between overall board independence and CEO turnover. He finds that CEO turnover is
more sensitive to performance in firms with an outsider-dominated board (more than 60% outside
directors) than in firms with an insider-dominated board (less than 40% outside directors), where an
outside director is defined as not working for or having extensive dealings with the company or its
senior management.
Dahya et al. (2002) examine changes in CEO turnover sensitivity to performance for U.K. firms
that adopt the Cadbury Commission recommendations. They find that adopting firms experience a
rise in CEO turnover sensitivity to performance. A key limitation of this experiment is that the
recommendation is not mandatory, so board changes are not purely exogenous.10
In contrast,
compliance with the new exchange listing rules we study is mandatory for exchange listed firms. We
also use more rigorous econometric techniques to identify the board independence effect than in this
earlier study.11
Taking a very different approach, Knyazeva, Knyazeva and Masulis (2013) exploit the
wide variation in local supplies of independent director candidates as an exogenous instrument to
examine how board independence affects board monitoring and firm performance. They find board
independence causes higher CEO turnover-performance sensitivity and better firm performance.
However, their study excludes large cap firms (top quartile) which are better able to recruit outside
directors from beyond the local labor market.
None of these earlier studies control for nominating committee independence. Given that we find
publicly listed U.S. firms that lack an independent board almost always lack an independent
nominating committee prior to SOX, it is unclear to what extent prior studies of board independence
are driven by nominating committee independence. To our knowledge, we are the first to take into
10 Dahya et al. (2002) note that compliance with the Cadbury Code is not totally voluntary because London Stock Exchange
requires listed companies to “comply or explain”. However, to the extent that some firms did choose not to adhere to the
Code, the interpretation of the results is still contaminated by endogeneity concerns. Furthermore, it is unclear whether their
evidence is applicable to firms in other countries that differ in terms of board powers and other governance mechanisms. 11
Rather than using a DiD method, Dahya et al. (2002) run separate regressions for compliant and noncompliant firms.
Thus, their methodology does not allow for a statistical test on deviation from the common time trend.

11
account the correlation of board and nominating committee independence and document clear causal
links between forced CEO turnover and either board or nominating committee independence.
Lastly, we document an important mechanism through which stock exchange listing rules can
significantly alter the level of board monitoring. While the intent of the new rules is clear, their
ultimate effects are much less so. Some commentators question whether board independence can be
truly increased by setting numerial targets for the percentage of independent directors on a board.
After all, CEOs and board members have great latitude in the selection process to offset the benefits
created by exogenously imposed ‘independence’ (Hermaline and Weisbach (1998); Romano (2005)),
thereby circumventing the rule’s regulatory intent. Our evidence suggests that the new exchange
listing rules have put enough constraints on the director selection process in affected firms to actually
increase the level of board independence. To the extent the passage of SOX placed added pressure on
stock exchanges to issue stricter corporate governance rules than otherwise, this is an indirect effect of
SOX. Our evidence complemets the findings in Duchin, Matsusaka and Ozbas (2010) and Bhagat and
Bolton (2013) who find regulation of board composition mandated by the 1999 exchange listing rule
change, the passage of SOX and the 2003 new listing rules signficantly improve firm performance.
Our evidence suggests a key mechanism through which the performance improvements documented
in these two studies can occur.
Our study is also related to Cornelli, Kominek and Ljungqvist (2012) who examine CEO
turnover decisions around major changes in statutary laws in Central and East European and Central
Asian countries. Their sample consists of more than 400 private equity-backed firms in 19 transition
economies. While we study a change in board composition rules that reduces the influence of
management over the board, they examine statutory changes that reduce shareholder influence over
the board, i.e. boards can fire CEOs without the need for shareholder approval. Both studies conclude
that changes in laws and regulations that reduce the influence of other parties on the board of directors
significantly changes the level of board monitoring of CEOs.

12
2. Empirical methodology
2.1. Difference-in-Difference specification
The 2003 new exchange listing rules are introduced at a time when the corporate governance of
U.S. public firms came under intense scrutiny and at the same time was undergoing substantial
changes. In July 2002 the U.S. Congress passed the Sarbanes-Oxley Act in response to corporate
accounting scandals involving such firms as Enron, Worldcom and Tyco International. It brought
sweeping reforms to financial reporting in publicly held firms and significantly raised the legal
accountability of CEOs and CFOs. To benchmark this temporal effect, we adopt a DiD approach that
uses firms previously in compliance with the new listing rules as control firms to estimate this
temporal change. The effect of changing board structure on CEO turnover is identified by a change in
forced CEO turnover to firm performance sensitivity that exceeds this common time trend.
To implement the DiD analysis, we estimate the following linear probability model (LPM) for
each treatment that we study:
𝑌𝑖,𝑡+1 = 𝛼 + 𝛽(𝑇𝑖𝑃𝑡) + 𝛾(𝑇𝑖𝑅𝑖𝑡) + 𝛿(𝑇𝑖𝑃𝑡𝑅𝑖𝑡) + 𝑅𝑖𝑡𝜋′𝜃 + 𝑋𝑖𝑡 ′𝜌 + 𝜆𝑖 + 𝜆𝑡 + 휀𝑖𝑡 (1)
where 𝑌𝑖,𝑡+1 equals 1 if a forced CEO turnover occurs in firm 𝑖 in year 𝑡 + 1 and equals 0 otherwise.
𝑇𝑖 is an indicator for a treatment. It equals 1 if firm 𝑖 is noncompliant with the new exchange listing
rule at year-end 2001 and 0 otherwise. 𝑃𝑡 is an indicator variable for the post-treatment period. It
equals to 1 for the years 2005 and beyond and is 0 otherwise. 𝑅𝑖𝑡 is firm 𝑖’s performance in year 𝑡,
measured by either market-adjusted stock return or industry-adjusted change in EBIT where industry
is defined by Fama and French 48 industries. Since our sample covers a long time period of varying
macroeconomic conditions, we allow the baseline sensitivity of forced CEO turnover to performance
to vary by years. This is accomplished by multiplying 𝑅𝑖𝑡 by a vector 𝜋 of year fixed effects. 𝑋𝑖𝑡 is
the vector of firm level controls and 𝜆𝑖 and 𝜆𝑡 are firm and year fixed effects, respectively.
The coefficient of interest is 𝛿. It measures the change in sensitivity of forced CEO turnover to
firm performance in treatment firms relative to control firms from before to after the treatment. Our
hypothesis predicts that 𝛿 < 0 for both the board and nominating committee independence rules. The
coefficient 𝛽 measures the change in the mean rate of forced CEO turnover in treatment firms relative

13
to control firms after the treatment. While an increase in CEO turnover-performance sensitivity
should in general lead to higher rate of CEO turnover, the average rate of CEO turnover can be
affected by many other factors beyond firm performance. For example, if CEOs work harder after
SOX, then even if the CEO turnover-performance sensitivity increases, the average rate of CEO
turnover may not increase. Hence, we do not test the hypothesis on 𝛽, even though a positive 𝛽 is
suggestive of more intensive monitoring.
Most prior CEO turnover studies estimate logit or probit models because they fit the data better
and produce predicted probabilities that are within the [0,1] interval. If we estimate a logit model
similar to equation (1), then our hypothesis predicts that the average marginal effect of firm
performance on probability of forced CEO turnover increases more in treatment firms relative to
control firms after the treatment. Unlike in a linear probability model, this cannot be tested based on
the sign and statistical significance of the coefficient 𝛿 in the logit specification. Rather, we need to
calculate the appropriate marginal effect and assess it statistical significance using the delta method.
We choose a linear probability model as our base model for two reasons. First, the difference
between linear and non-linear models in estimating the average marginal effect is usually small.
However, the linear model has the advantage that its coefficients can be directly interpreted as
marginal effects. This is important because our hypothesis is based on the coefficient of a triple
interaction term (i.e. 𝑇𝑖𝑃𝑡𝑅𝑖𝑡). In contrast, assessing the statistical significance of this marginal effect
in a non-linear model is more involved. Like us, Cornelli, Kominek and Ljungqvist (2012) rely on a
linear probability model to estimate their CEO turnover model with a triple interaction term. Second,
since we examine change over time, it is desirable to include firm fixed effects as controls for any
unobservable time-invariant attributes of these firms. The concern is that if these attributes are
correlated with any explanatory variables in our model specifications and firm fixed effects are not
controlled for, then the estimates can suffer from an omitted variable bias. Unfortunately, firm fixed
effects cannot be easily included in logit or probit models because standard conditional maximum
likelihood estimators are usually inconsistent with fixed effects due to an incidental parameter
problem. Our model choice is also consistent with the recommendation in Adams et al. (2010) who

14
observe that few existing CEO turnover studies control for firm-specific heterogeneity and such an
approach would provide a valuable contribution to our understanding of the CEO turnover process.
2.2. Propensity-Score Matching
The DiD approach we take allows for heterogeneity in treatment and control firms, which in our
case means that the treatment and control groups can have their own average rate of forced CEO
turnover and sensitivity of forced CEO turnover to firm performance, both before and after the
treatment. However, the DiD effect is identified by assuming a parallel temporal trend in the turnover-
performance relation in the period from before to after the treatment in both the treatment and control
groups in the absence of the treatment. To the extent that firm characteristics that determine the
endogenous choice of board structure before the treatment also affect the time trend, the DiD
estimates can be biased due to differences in the time trends of treatment and control groups.
To mitigate this potential bias, we first estimate a probit model to predict the likelihood that a
firm is noncompliant with a particular new exchange listing rule at year-end 2001 using data from
1996 to 2000. The predicted likelihood is called the propensity score. We then match each treatment
firm with one or more control firms drawn from the same Fama and French 48 industry and having
propensity scores within a predefined radius of the treatment firm in 2001. This method is known as
Radius Matching (Dehejia and Wahba (2002)). A benefit of radius matching is that it allows for the
use of additional control firms when the matches are good, which helps reduce the variance of the
estimates. The choice of radius is based on two considerations. On the one hand, a smaller radius
increases the quality of the matches. On the other hand, it also increases the probability that a match
cannot be found. Failure to find a match is a particular concern in CEO turnover studies since forced
CEO turnovers are infrequent and thus only a limited number of forced CEO turnovers are available
in our sample period. Based on this trade off, we choose a 0.15 radius for all our reported results. In
unreported results, we find that using a radius of 0.1 or 0.2 does not change our results significantly.
We rely on recent theories of corporate boards to guide our specification of the propensity score
models. Boone, Field, Karpoff, and Raheja (2007) summarize existing theories on corporate boards
into three non-mutually exclusive hypotheses. The scope and complexity hypothesis says that more

15
assets and greater complexity give rise to more serious agency problems requiring more independent
directors for monitoring. The monitoring hypothesis predicts that firms operating in noisy
environment are more costly for outsiders to monitor and thus are associated with a less independent
board. The bargaining hypothesis says that more influencial CEOs are able to bargain for more inside
and grey directors on the board.
In the propensity score model we use to predicts whether a firm was noncompliant with the
majority independent board rule in 2001, we include measures of each of the three hypotheses. We
use total assets to measure a firm’s scope and complexity, the entrenchment index (E-index) of
Bebchuk, Cohen, and Ferrell (2009) to measure the benefit of private control, market-to-book ratio
and monthly stock return variance to measure the cost of monitoring by outside directors, dual class
firm and CEO-Chairman indicators, CEO tenure, CEO age and voting power of non-independennt
directors to measure CEO influence and the presence of non-employee blockholder on the board to
measure constraints on CEO influence. A blockholder is defined as an investor holding more than 1%
of firm voting power.
To predict the likelihood a firm has an independent board committee, e.g. a nominating
committee, we add the fraction of independent directors on the board as another predictor. Our
reasoning is that, with more independent directors, the likelihood of independent board committees
rises since more independent directors are available to become committee members and the
independent directors have greater voting power to push for more independent board committees.
Coefficient estimates of the four propensity score models used to predict treatment group
membership under the four new listing rules are reported in Appendix 2. All models are estimated
using 1996-2000 data, the time period prior to when we classify firms into treatment and control
groups. The sign and statistical significance of the coefficients in Appendix 2 offer partial support
both at the board and board committee levels for the three hypotheses on determinants of board
independence studied in Boone et al. (2007) and are generally in line with prior board studies.
We recoganize that, although conducting a match between the treated and the control units
should in general mitigate the estimation bias in observational studies, we can only match firms on

16
observable attributes. As a result, matched firms may still be different on unobservable attributes. To
mitigate this concern, we control for any unobservable time-invariant differences across firms by
including firm fixed effects in all our DiD regressions.
3. Data and Sample
3.1. Data
We obtain data on boards of directors from the RiskMetrics database and data on CEO turnover
from the ExecuComp database. Our sample period is from 1996 to 2009. Year 1996 is the first year
that the boards of directors data are available from RiskMetrics, while year 2009 is the last year we
have information on CEO turnovers announced in the following year. Firm financial data are from
Compustat and stock return data from CRSP. Institutional holdings data are from Thomas Reuters.
To be included in our sample, firms must have (1) director independence data available in
RiskMetrics for fiscal year 2001 and (2) their common stock listed on the NYSE or Nasdaq from 2001
until at least 2004. The first requirement enables us to classify firms at year-end 2001 into those
compliant and non-compliant with each of the new exchange listing rules. The second requirement
insures our sample firms are subject to the regulatory shocks and that our results are not simply driven
by firms entering and exiting the sample before or after the introduction of the new exchange listing
rules. These criteria result in a sample of 1,231 firms in year 2001 and 17,080 firm-year observations
over the years 1996-2009. Panel A of Table 1 reports summary statistics for the full sample.
According to NYSE and Nasdaq, firms are required to comply with the new exchange rules
during their first annual meeting after January 15, 2004, but no later than October 31, 2004. For firms
with classified boards, the deadline for compliance is the second annual meeting after January 15,
2004, but no later than December 31, 2005. However, both anecdotal and time series evidence
suggests that firms began to make board structure changes as early as when the NYSE and Nasdaq
proposals first became public in August and October of 2002 respectively and many firms complied
with the new exchange listing rules by the end of 2003, well before the actual deadlines. Thus, board

17
data in fiscal year 2001 represent the last year board structure is not influenced by the new listing
rules since compliance can occur in fiscal year 2002 if the firm’s fiscal year-end is later than August.12
For each of the four new exchange listing rules on board structure, we classify sample firms into
either a treatment group or a control group based on whether their board structure in 2001 is in
compliance with the new exchange listing rule. Table 2 reports the distribution of our sample firms by
compliance status with the four new exchange listing rules at year-end 2001. The table shows that
most firms already had a majority of independent directors on the board at year-end 2001. Hence,
only 25% of sample firms are affected by the rule requiring an independent board. At the board
committee level, most firms also have independent audit (69%) and compensation (71%) committees
by year-end 2001. In contrast, 69% of sample firms lacked an independent nominating committee and
thus, are affected by the exchange rule on nominating committees. The table shows that overall board
independence is highly positively correlated with full independence of key board committees. One
particularly striking statistic is that 95% of firms without a majority of independent directors on the
board in 2001 also lacked an independent nominating committee.
Panels B and C of Table 1 compare major characteristics of treatment and control firms defined
by the four listing rules. Generally speaking, treatment and control firms differ systematically on
many characteristics with respect to all four listing rules. Noncompliant firms with respect to the
board independence rule or nominating committee independence rule are on average smaller and have
more growth opportunities and more volatile stock returns than compliant firms. Consistent with
internal and external governance mechanisms serving as substitutes, these noncompliant firms on
average have fewer antitakeover provisions as measured by the E-index than compliant firms (Guo,
Lach and Mobbs (2014)). By design, noncompliant firms have a significantly lower fraction of
independent directors on the board than complaint firms. However, the lack of board independence
seems to be somewhat offset by other governance mechanisms. For example, noncompliant firms are
less likely to have a dual CEO-Chairman, but more likely to have an outside blockholder on the board.
12 As a robustness check, we also repeat our analysis on sample that uses board structure on the last meeting date of fiscal
year 2002 to classify firms into treatment and control groups. The results are qualitatively unchanged.

18
With respect to CEO compensation, the pattern is less clear. For the board independence rule,
CEO total compensation is significantly lower on average in noncompliant firms than compliant
firms, but the pattern on CEO pay-performance sensitivity as measured by equity-to-nonequity pay
and the delta of the CEO’s equity portfolio is mixed (Core and Guay (2002); Coles, Daniel and
Naveen (2006)). For the nominating committee independence rule, CEO pay-performance sensitivity
is significantly higher for noncompliant firms than complaint firms, consistent with a substitution
between nominating committee independence and CEO equity incentives.
Overall, the systematic differences in treatment and control firms suggest that compliance in
2001 with subsequent exchange listing rule changes is not random; rather these two groups of firms
have systematically different characteristics. To control for these differences, we match treatment and
control firms by industry and propensity scores prior to performing our DiD analysis.
3.2. CEO turnover sample
CEO turnovers occur for many reasons. Besides forced departures for poor performance or
violation of laws or rules, CEOs often voluntarily leave offices due to retirements, major health
problems, deaths, or appointments to more attractive positions, etc. In this study, we are mainly
interested in CEO turnovers that are the result of board disciplinary actions for poor performance.
Consequently, we divide CEO turnovers into forced and voluntary following a classification method
developed by Parrino (1997) and now commonly used in CEO turnover studies (e.g., Huson,
Malatesta and Parrino (2004); Hazarika, Karpoff and Nahata (2009); Jenter and Kanaan (2014)). We
search the Factiva and Lexis-Nexis databases to find the earliest announcement dates for CEO
turnovers and other information needed to classify them.
A CEO turnover is classified as forced if (1) news articles mention that a CEO was fired, forced
out or left due to unspecified policy differences; (2) the CEO is under the age of 60 and the news did
not mention death, poor health, or the acceptance of another position (within the firm or elsewhere) as
the reason for the departure; (3) a CEO retirement is not announced at least six months in advance.
We further refine reason (3) by checking a wider range of news sources to make sure that no
indications of a voluntary resignation. If the incumbent CEO takes a comparable position elsewhere or

19
departs for reasons unrelated to the firm or are purely personal in nature, we reclassified the turnover
as voluntary. The remaining CEO turnovers not in categories (1) – (3) are classified as voluntary.
Of the 1,231 firms that meet our sample criteria in 2001, there are a total of 1,902 CEO turnovers
between 1996 and 2010, of which 442 are classified as forced and 1460 are classified as voluntary.
This translates into an 8.5% annual turnover rate for the full sample and a 2% rate for our forced
turnover sample. These values are close to those reported by Jenter and Kannan (2014) for all firms in
ExecuComp over the 1993-2001 period. In their sample, CEO turnovers occur in about 10 percent of
firms annually and forced CEO turnovers occur in about 2.3 percent of firms annually. The difference
between our sample and theirs is probably due to different sample criteria and sample periods.
One issue that requires special attention in this DiD approach is that some forced CEO turnovers
are not performance induced. A good example is the departure of Hewlett-Packard's CEO Mark Hurd
in August 2010 for violating company business standards. In this period, H-P stock greatly
outperformed the market, e.g. by 101% over his five-year tenure. Obviously, attempting to explain
such a forced CEO turnover by poor firm performance would be seriously misleading. This is a not
major concern in CEO turnover studies that do not use a DiD approach because the presence of non-
performance induced forced CEO turnovers only adds noise to the data, but does not affect the
coefficient estimate’s sign. But, in a DiD approach, a disproportional presence of non-performance
induced forced CEO turnovers in the treatment group relative to the control group could bias our
statistical inferences. This is a particular concern in our sample period as explained below.
In the years immediately after the passage of SOX, a number of high-profile investigations into
earnings manipulation, option backdating and other inappropriate business practices by public firms
occurred in U.S. Under SEC pressure, many firms conducted internal investigations into these
matters. The investigations resulted in the firings of a number of top executives including CEOs. We
identified CEO turnovers caused by statutory, regulatory and internal company codes of conduct
violations by reading new articles on CEO turnovers. Consistent with independent directors being
more effective monitors, we find a higher frequency of CEO turnovers post-SOX due to CEO legal or
quasi-legal violations (and unrelated to poor firm performance) in the board independence treatment

20
group relative to the control group. Thus, including these legal violations can bias any observed rise in
forced CEO turnover sensitivities to poor performance in treatment firms relative to control firms,
especially given the higher frequency of violation-related CEO turnovers in treatment firms. Thus, we
exclude forced turnovers due to legal and quasi-legal violations from our DiD analysis.
3.3. Change in board structure around the regulatory “shock”
The upper panel of Figure 1 reports changes in board structure for our sample firms over the
1998-2009 period. The plot begins in 1998 since board committee data in the RiskMetrics database is
very spotty before 1998. We observe that the fractions of firms with a majority independent board,
fully independent nominating, audit or compensation committees rise significantly between 2001 and
2005. The proportion of firms with a majority of independent directors on the board increased by 17
percent from 2001 to 2005, while the proportion of firms with independent nominating, audit and
compensation committees rose by 43 percent, 16 percent and 12 percent, respectively. In 2005, the
last year of mandatory compliance with all new exchange listing rules, firm compliance rates with the
board, nominating, audit and compensation committee independence rules are 92%, 74%, 85% and
83%, respectively. The lack of full compliance in year 2005 can be due to four reasons. First, this
figure uses fiscal years, rather than calendar years. Second, the RiskMetrics definition of independent
directors is more restrictive than the NYSE and Nasdaq definitions. For example, the NYSE and
Nasdaq define former employees as independent if they left the firm more than three years earlier,
while RiskMetrics considers all former employees non-independent. The NYSE and Nasdaq also
allow independent directors to have an “insignificant” business relation with the firm, while
RiskMetrics treats any director with a business relation as non-independent. Thus, some directors the
NYSE and Nasdaq consider independent, RiskMetrics classify as gray.13
Third, closely controlled
companies are exempt from NYSE and Nasdaq board, nominating and compensation committee
independence rules. Lastly, Nasdaq exempts firms from the independent nominating and
13
Although affected firms should be determined based on the exchange definitions, this is not practical since the size of
business relations between directors and firms are generally unobservable. We conduct a robustness check on this issue later
and find that our results are not affected by the misclassification of compliant and noncompliant firms.

21
compensation committee rules provided director nominations and executive compensation decisions
are determined by a majority of independent directors.14
The bottom panel of Figure 1 shows the mean percentage of independent directors on the board
over the 1996-2009 period with firms classified into those with and without a majority of independent
directors on the board in 2001. We observe that in treatment firms the proportion of independent
directors is relatively stable before 2001, but increases significantly after 2001. On the other hand, in
control firms, the proportion of independent directors increases only gradually over the entire sample
period. Thus, it is clear that the new exchange listing rules represent a significant shock to the board
structure of many publicly listed firms that we classify as treatment firms. 15
3.4. Firm performance and control variables
We measure firm performance by both market-adjusted stock returns and industry-adjusted
changes in EBIT. Market-adjusted stock return is defined as a firm’s monthly stock return minus the
CRSP value-weighted market return, compounded over the 12 months that ends 30 days before the
CEO turnover announcement. Industry-adjusted change in EBIT is defined as a firm’s annual change
in EBIT in the fiscal year scaled by beginning-of-year total assets minus the Fama-French 48 industry
median of this ratio. Both measures are used in Weisbach (1988) and other prior CEO turnover
studies. To reduce the influence of outliers, we winsorize the performance measures at both the 1st and
99th percentiles. We use market-adjusted stock returns, rather than industry-adjusted stock returns, as
recent CEO turnover studies find that boards filter out market benchmarks, not industry benchmarks,
when making CEO turnover decisions (Kaplan and Minton (2011) and Jenter and Kanaan (2014)).16
In our DiD analysis, we include an array of explanatory variables to control for the effects of any
remaining time-varying differences in firm and governance characteristics across treatment and
control firms. Most of these control variables are used in prior CEO turnover studies. These include
14 This noise in the classifications should in general bias against us finding a significant difference between treatment and
control groups. To the extent that we do find differences, they do not affect our conclusions. We explicitly check the
robustness of our results to these issues and find that our results are not affected by the misclassification of compliant and
noncompliant firms and the inclusion of controlled companies as shown in the Internet Appendix sections E and F. 15 For information on how our sample firms complied with the new rules, please refer to Internet Appendix section A. 16 We also decompose stock returns into an industry-induced component and an idiosyncratic component following Jenter &
Kanaan (2014) and measure a firm’s stock performance by the idiosyncratic component, while controlling for the industry-
induced component. In unreported restuls, we find our results are robust to this alternative measure of stock performance.

22
firm size measured by log of sales, firm risk measured by standard deviation of the prior 12 month
stock returns, a CEO-Chair indicator, an indicator for whether the CEO is a founder or heir, CEO
voting power measured by the percentage of votes under CEO control, the presence of a nonemployee
blockholder-director on the board, CEO age and a set of CEO tenure (in years) indicators. Founder
and heir information is hand-collected from an extensive search of CEO biographic information in
firm proxy statements, firm websites and other electronic news sources, such as Factiva, etc. A
nonemployee blockholder-director is defined as a nonemployee director who holds more than 1% of
the voting rights in the firm.
4. Empirical Results
4.1. Main results
In this section, we use equation (1) to test our main hypothesis that mandatory changes in board
and nominating committee independence lead to greater sensitivity of forced CEO turnover to firm
performance in previously noncompliant firms, while mandatory changes in audit and compensation
committee independence have less significant effects.
For each board structure change, we report two regressions, one measures firm performance by
market-adjusted stock return, the other by industry-adjusted change in EBIT. Although the two
performance measures are in general positively correlated, they contain different information. Stock
returns mainly reflect the effect of an incumbent CEO’s decisions on future cash flows, while
accounting earnings mainly reflect the effect of an incumbent CEO’s decisions on past operating
performance. The board is likely to use both sources of information when evaluating CEO
performance, although they may weight them unequally. Hence, a priori, an improvement in board
monitoring may not lead to the same rise in sensitivity of forced CEO turnover to both performance
measures. In other words, evidence of increased sensitivity of forced CEO turnover to one of these
measures would support our hypothesis provided that the sensitivity to the other measure is either
unchanged or also increases, although finding statistically significant increases in sensitivity to both
performance measures would provide even stronger support.

23
Table 3 reports DiD estimates on the effects of the four exogenous board structural changes on
the sensitivity of forced CEO turnover to firm performance. These individual effects are captured by
the coefficient of the triple interaction term of Post, Treat and Performance. Columns 1 and 2 of
Table 3 are estimated using the matched sample of treatment and control firms defined by the board
independence rule. Consistent with our hypothesis, the coefficient on the triple interaction term is
negative and statistically significant at 5% (10%) level in column 1 (column 2) in a two-sided test,
indicating that the rule requiring a majority of independent directors on the board results in an
increase in turnover-performance sensitivity in previously noncompliant firms.
Columns 3 and 4 of Table 3 are estimated using a matched sample of treatment and control firms
defined by the independent nominating committee rule. The analysis is similar to that in columns 1
and 2 except that Treat now indicates whether a firm is noncompliant with the nominating committee
independence rule in year 2001. Consistent with our hypothesis, the coefficient on the triple
interaction term is negative in both columns and statistically significant at the 1% level for market-
adjusted stock returns (column 3) and at the 5% level for industry-adjusted changes in EBIT (column
4), indicating the rule requiring a fully independent nominating committee also results in an increase
in turnover-performance sensitivity in previously noncompliant firms.
In columns 5 through 8, we examine the effects of the independent audit and compensation
committee rules. The functional responsibilities of these two board committees suggest that changes
in their independence are unlikely to have a significant effect on a board’s forced CEO turnover
decisions. Treat indicates noncompliance with the audit (compensation) committee independence rule
in columns 5 and 6 (columns 7 and 8). In contrast to the results in column 1 - 4, we find that the
coefficient of the triple interaction of Treat, Post and Performance is statistically insignificant in each
column at conventional levels, which confirms our prediction that these two board structure changes
are unlikely to have a significant effect on the sensitivity of forced CEO turnover to firm performance.
This finding is not surprising, but its importance can be easily underappreciated. These
insignificant results actually serve as an important check on the effectiveness of our identification
strategy and the validity of our interpretation of results in column 1 - 4. If our results in column 1 - 4

24
are driven by biases in our empirical methodology or by changes in some omitted factors associated
with the change in board and committee independence in general, then we would expect to find
similar significant effects in column 5 - 8 as in column 1 - 4. To the contrary, following the same
methodology, we find that only board structure changes that in theory should matter have significant
effects on forced CEO turnover, while board changes that in theory should not matter are
insignificant. One requires very complex assumptions on biases or omitted factors to generate such
contrasts. Therefore, these insignificant results not only confirm that independent audit and
compensation committees do not have significant causal effects on forced CEO turnover decisions,
but more importantly, they reinforce the validity of the significant causal effects of independent
boards and nominating committees on the sensitivity of forced CEO turnover to firm performance.
Beyond the triple interaction term, two double interaction terms are also worth noting. They are
the interaction of Post and Treat and the interaction of Treat and Performance. Both are positive for
the board and nominating committee independence rules. The first one indicates that the average rate
of forced CEO turnover increased in treatment firms relative to control firms after the treatment. The
second one indicates that the turnover-performance sensitivity is lower in treatment firms relative to
control firms in the pre-treatment period. These effects are statistically significant in some columns.
Moving to the control variables in Table 3, we find that their signs and statistical significance are
in general consistent with prior findings and are economically reasonable. The positive coefficient on
the natural log of sales suggests that CEOs in larger firms are more likely to be fired, which is
consistent with evidence in Huson, Parrino, and Starks (2001). The coefficient on stock volatility is
positive, suggesting that riskier firm CEOs are more likely to be fired. Consistent with more powerful
CEOs being less likely to be fired, we find that CEOs with more voting power or more board power
(CEO-Chairs) and CEOs who are founders or founding family members are less likely to be fired,
consistent with evidence in Denis, Denis and Sarin (1997) and Goyal and Park (2002), while the
presence of a nonemployee blockholder-director increases the likelihood of forced CEO turnover.
The effects of the board and nominating committee independence rules are not only statistically
significant, but also economically significant. To illustrate the economic significance, we posit a

25
hypothetical fall in firm performance from the 75th percentile (market-adjusted stock return = .23 or
industry-adjusted change in EBIT = .0231) to the 25th percentile (market-adjusted stock return = -.20
or industry-adjusted change in EBIT = -.0157) of the sample. For the board independence rule, the
coefficient estimate of -0.0556 (-0.525) in column 1 (column 2) indicates that the rise in probability of
a forced CEO turnover is 2.4% (2%) higher in the post-treatment period than in the pre-treatment
period for treatment firms after filtering out any time trend between the pre- to post-treatment periods.
Economically, this is quite significant since the average rise in the probability of a CEO being fired
for the same change in market-adjusted stock return (industry-adjusted change in EBIT) is 2.2%
(1.3%) in the overall sample,17
and it is only 1.5% (0.4%) in the treatment sample in the pre-treatment
period. For the nominating committee independence rule, the coefficient estimate of - 0.0496 (-0.557)
in column 3 (column 4) suggests that the rise in probability of forced CEO turnover is 2% (2.1%)
higher in the post-treatment period than in the pre-treatment period in treatment firms, after filtering
out time trends in the pre- and post-treatment periods. This compares with an average rise in the
probability of a CEO being fired for the same change in market-adjusted stock return (industry-
adjusted change in EBIT) of 2.2% (1.3%) in the overall sample and of 1.7% (0.65%) in treatment
firms in the pre-treatment period.
4.2. Isolating the board and nominating committee independence treatment effects
In table 3, we only include one treatment in each regression. However, according to Table 2,
board independence and nominating committee independence are highly positively correlated. For
example, in 2001 39% of firms with an independent board have an independent nominating
committee, while only 5% of firms without an independent board have an independent nominating
committee. Hence, for the board independence rule, 34% (calculated as 95% - 61%) more treatment
firms than control firms must increase nominating committee independence. As a result, the apparent
board independence effect could actually be due to the change in nominating committee
independence. On the other hand, 96% of firms with an independent nominating committee also have
an independent board, while only 66% of firms without an independent nominating committee have
17
We estimate equation (1) without the DiD terms to establish a baseline relation between forced CEO turnover and firm
performance in the full sample by varying performance, while setting all other variables at their respective sample means.

26
an independent board. Hence, 30% (calculated as 96% - 66%) more treatment firms than control firms
must raise their board independence level. Hence, the apparent nominating committee independence
effect in Table 3 could actually be a board independence effect.
Prior studies on board monitoring generally ignore the correlation between board and nominating
committee independence and attribute evidence of more effective board monitoring to board
independence. But, given the high correlation of the two variables and the findings in Table 3, it is
important to know if board independence and nominating committee independence both matter for
board monitoring or if only one matters. Furthermore, whether the independence of nominating
committee has a separate effect on board monitoring is an unanswered research question that has
important policy implications. In the following, we conduct a series of tests to answer these questions.
In our sample, there are 925 firms with a majority of independent directors on the board in 2001,
of which 61% lack an independent nominating committee. Since these firms are not affected by the
board independence rule, we can use this subsample to isolate the treatment effect of the nominating
committee independence rule.18
For this purpose, we first construct a matched sample of treatment
and control firms based on nominating committee independence in year 2001 from this subsample of
firms with independent boards. The propensity score model used here is identical to the one used to
construct the matched sample for testing the nominating committee independence rule in table 3,
except that the model is only estimated for firms that have an independent board in year 2001. We
next estimate equation (1) for this sample of firms and report the results in Table 4. TreatNom is an
indicator for noncompliance with the nominating committee independence rule in year 2001. The
coefficient on the triple interaction of Post, TreatNom and Performance is negative and statistically
significant at the 1% level in column 1 and at the 10% level in column 2 based on two-sided tests,
suggesting that after the treatment forced CEO turnovers become more sensitive to performance in
treatment firms relative to control firms. This evidence supports a separate nominating committee
independence effect on forced CEO turnover sensitivity to performance and indicates that an
independent nominating committee increases this sensitivity, even for firms with an independent
18 We do not consider the audit and compensation committee independence rules here because we already show in Table 3
that they do not affect CEO turnover decisions.

27
board. One important policy implication of this evidence is that governance reforms seeking to
improve board monitoring should consider giving independent directors sole control over director
nomination process. We also observe that the coefficient of the double interaction of TreatNom and
Performance is positive and statistically significant at the 1% level for market-adjusted stock returns
(column 1) and the 5% level for industry-adjusted changes in EBIT (column 2), indicating that, in the
pre-treatment period, forced CEO turnovers are less sensitive to performance in treatment firms than
in control firms.
Isolating the treatment effect of the board independence rule is more difficult than the
nominating committee independence rule since only 15 firms in our sample lack an independent
board, but have an independent nominating committee. Thus, clean subsample tests such as those in
Table 4 are not available. We thus adopt a less effective method of including both treatment effects in
the same regression to isolate the board independence treatment effect. Given the high positive
correlation between board independence and nominating committee independence in the data and the
common deadline for compliance with both rules, it is expected that such tests may lack statistical
power to cleanly separate the two treatment effects. Hence, any statistical significance would be a
strong indication that the board independence rule has a separate effect on board monitoring.
To accommodate two treatment effects, we modify equation (1) by including a full set of DiD
terms for both the board and nominating committee independence rules in the same regression. Since
our objective is to isolate the treatment effect of the board independence rule, treatment and control
firms are matched based on whether they have a majority of independent directors on the board in
2001 and we leave their compliance status with nominating committee independence to the data. This
is the same sample used in estimating columns 1 and 2 of Table 3.
We report results of these regressions in Table 5, where TreatBod and TreatNom are indicators
for treatment firms defined by the board and nominating committee independence rules respectively.
In columns 1 and 2, the post-treatment period begins again in 2005. Identification in these two
columns relies on cross-sectional variations in firm compliance with the two rules, (i.e. a large
number of firms have independent boards prior to SOX, but lack an independent nominating

28
committees. A small number of firms have an independent nominating committee, but lack an
independent board.). The coefficient on the triple interaction Post, TreatBod and Performance is
negative in both columns 1 and 2, although they are only statistically significant at the 10% level in
one-sided tests. While acknowledging the difficulty in isolating this treatment effect in our data, this
evidence does strongly suggests that the treatment effect documented in Table 3 for the board
independence rule is not caused by a simultaneous change in nominating committee independence for
a large majority of our sample firms.
In columns 3 and 4 of Table 5, we explore additional time-series variation in a firm’s actual
compliance year with each of the two rules (i.e. a firm can comply with the two rules in two different
years prior to 2005) to further separate out the board independence effect. In these regressions, we use
rule-specific post-treatment indicators. Specifically, we define a separate post-treatment period
indicator for each rule. In firms noncompliant with one or both rules, the post-treatment period starts
in the year the firm actually becomes compliant with that rule. In firms compliant with one or both
rules, the post-treatment period starts in 2004 for the rule(s) that they are compliant with. We choose
2004 since it is in the middle of the period between 2003, the year a large number of firms complied
with the new exchange listing rules, and 2005, the year all firms must be complaint. The coefficient of
the triple interaction of Post, TreatBod and Performance is negative and statistically significant at the
5% level for market-adjusted stock returns (column 3) and at the 10% level for industry-adjusted
changes in EBIT (column 4) under a two-sided test. These results offer some further evidence that the
board independence rule by itself has a significant treatment effect. However, given the actual
compliance date can be endogenous, one should be cautious not interpret these results independently
from those in columns 1 and 2.
In columns 5 and 6, we explore another way of detecting the treatment effect of the board
independence rule. That is to restrict our sample to noncompliant firms that implement large increases
in board independence. In these firms, the board independence effect is likely to be stronger relative
to the nominating committee independence effect, which should make detection easier. We define a
large rise in board independence as one that is above 11%, which is the 25th percentile of the gains

29
among firms noncompliant with the board independence rule. Consistent with a separate board
independence rule treatment effect, we observe that the coefficient of the triple interaction term is
negative and now statistically significant at the 10% level in two-sided tests in both columns.
4.3. CEOs on the nominating committee
CEO influence over director nominations is often cited as an important reason for weak board
monitoring. Although the nominating committee independence rule should improve board monitoring
in all firms that lacked a fully independent nominating committee, we expect it to have a larger impact
on firms when the CEO is directly involved in the director nominating process, indicated by the CEO
being a nominating committee member prior to the rule change. In our sample of firms that lack full
nominating committee independence, 68 percent have the CEO on the nominating committee, while
the remaining 32 percent of the sample have inside or grey directors as nominating committee
members. In this section, we test this hypothesis using only firms noncompliant with the nominating
committee independence rule in 2001.
We first match firms where the CEO is on the nominating committee, to firms where the
nominating committee excludes the CEO following a similar propensity score matching procedure as
before. We use the same set of predictors used in the independent nominating committee analysis to
predict when the CEO is on the nominating committee since the two cases only differ in the degree to
which the nominating committee lacks independence. This model is estimated for firms noncompliant
with the nominating committee independence rule in 2001.
Table 6 reports coefficient estimates from equation (1) estimated using the above matched
sample of firms. CEO on Nom is an indicator for whether the CEO is a nominating committee
member in 2001. Supporting our hypothesis, the coefficient of the triple interaction term of Post, CEO
on Nom, and Performance is negative for both stock and accounting performance and is statistically
significant at the 5% level for stock performance. In addition, the coefficient of the interaction of
CEO on Nom and Performance is positive and statistically significant at the 10% level for both stock
and accounting performance, indicating that during the pre-treatment period forced CEO turnover is
less sensitive to firm performance when the CEO sits on the nominating than when the CEO is not on

30
the nominating committee. Overall, table 6 provide new evidence that CEO involvement in the
director nominating process weakens board monitoring.
4.4. Distance from the board independence requirement
In this section, we explore cross-sectional variations in the degree of board change needed to
meet the independence requirement among noncompliant firms. Intuitively, we expect noncompliant
firms forced to implement greater board changes to exhibit larger gains in sensitivity of CEO forced
turnover to performance. To test this hypothesis, we divide our sample of noncompliant firms by
whether the proportion of independent directors on the board is below or above the sample median in
2001. In untabulated results, we find the sample median is 0.43.
Table 7 reports estimates of equation (1) in the two subsamples of noncompliant firms. Columns
1 and 2 show results for noncompliant firms having a fraction of independent directors under 0.43,
while in columns 3 and 4 show results for noncompliant firms having a fraction at or above 0.43. The
coefficient of the triple interaction term that captures the board independence treatment effect is
negative in all the columns, consistent with a rise in forced turnover sensitivity to performance.
However, the coefficient estimates are only statistically significant in the subsample of noncompliant
firms with a below median fraction of independent directors. Also, consistent with the prediction that
firms forced to make larger changes in board independence experience greater improvements in board
monitoring, the coefficient estimates in columns 1 and 2 are also larger than those in columns 3 and 4.
4.5. Nonlinear treatment effects
Equation (1) assumes the turnover-performance relation is the same for all firm performance
levels and as is the effect of board structure changes on turnover-performance sensitivity. Yet, there is
no compelling economic reason for such an effect to be the same across all firm performance levels.19
In this section, we examine over what firm performance region changes in board structure exhibit the
most significant effect.
19
Warner, Watts, & Wruck (1988) find regressing firm performance on CEO turnover in a logit model does not capture the
relation well, although it does better at extreme performance levels. Jenter and Lewellen (2010) note that economic theory
does not predict corporate governance has the same effect on turnover-performance sensitivity across all performance levels.
31
According to the Hermalin and Weisbach (1998) model, firms with an independent board use
higher minimum thresholds of estimated CEO ability for retention decisions than firm with a non-
independent board. One implication of the Hermalin and Weisbach model is that at very poor firm
performance levels where estimated CEO ability is even below the threshold used by firms with a
non-independent board, both types of boards would fire the CEO. Thus, a rise in board independence
should have no effect on CEO turnover over this range of performance. Similarly, at high firm
performance levels where a CEO’s estimated ability is above the threshold of firms with an
independent board, neither board type would fire the CEO. Again, a rise in board independence does
not matter. However, an intermediate region of firm performance exists such that ceteris paribus,
firms with an independent board would fire the CEO, but firms with a non-independent board would
not. It is over this region that an increase in board independence should strengthen the turnover-
performance relation. While our prior discussion is framed in terms of board independence, it also
applies to nominating committee independence.
Empirically it is unclear where to draw the boundary between extremely low and intermediate
levels of weak performance. We begin by using indicators of firm performance quintiles, where Q1
indicates the bottom quintile firm performance. The mean (median) market-adjusted stock return for
Q1 is -.45 (-.41) and Q2 is -.17 (-.16), and the mean (median) industry-adjusted changes in EBIT for
Q1 is -.062 (-.046) and Q2 is -.011 (-.010). We then modify equation (1) to allow both the turnover-
performance relation and the treatment effect to vary with performance quintiles. To save space, we
only report coefficients for the bottom two performance quintiles (columns 1 - 4) and their interaction
terms since the coefficients of the other quintiles and their interactions are statistically insignificant.
Using this new specification, we re-estimate the treatment effects in column 1 - 4 of Table 3 and
report them in Table 8. The triple interaction of Post, Treat and Q1 measures the increased likelihood
of forced CEO turnover following the treatment in treated firms relative to control firms for a firm
performance drop from the top to the bottom quintile. The positive coefficient estimate in column 1
(column 2) suggests that the adoption of the board independence rule leads to a rise in the likelihood
of forced CEO turnover of 10.4% (8.1%) in treatment firms relative to control firms when market-

32
adjusted stock return (industry-adjusted change in EBIT) drops from the top to the bottom quintile of
the sample. This coefficient is statistically significant at the 1% (5%) level in column 1 (column 2).
The coefficient of the triple interaction Post, Treat and Q2 is also positive though it is not significant.
In table 8 columns 3 and 4, we report results for the nominating committee independence rule.
The positive coefficient of the triple interaction of Post, Treat and Q1 suggests that the likelihood of
forced CEO turnover increases 8.2% (4.5%) in treatment firms relative to control firms for a drop in
market-adjusted stock return (industry-adjusted change in EBIT) from the top to the bottom quintile
of the sample. This coefficient is statistically significant at the 1% (10%) level in column 3 (column
4). The coefficient of the triple interaction term Post, Treat and Q2 is negative, but insignificant.
In columns 5 through 8, we repeat the above analysis using firm performance deciles, where Q1
represents the lowest firm performance decile. The mean (median) market-adjusted stock return for
Q1 is -.56 (-.54) and Q2 is -.34 (-.33), and the mean (median) industry-adjusted changes in EBIT for
Q1 is -.092 (-.077) and Q2 is .032 (-.031) respectively. Column 5 reports results for the board
independence rule where performance deciles are based on market-adjusted stock returns. The
estimates show that a rise in board independence leads to a rise in the likelihood of forced CEO
turnover in performance quintiles Q1 and Q2, and is statistically significant for Q2. In column 6,
performance deciles are based on industry-adjusted changes in EBIT. The estimates show that the
increase in likelihood of forced CEO turnover is marginally significant in both Q1 and Q2. However,
we do not find that the change in likelihood of forced CEO turnover is greater in Q2 than in Q1.
Columns 7 and 8 report similar evidence for nominating committee independence. These estimates
show that the change in likelihood of forced CEO turnover is statistically and economically most
significant in Q1. Thus, we continue to find that the treatment effect is concentrated in the poorest
performance region.
Overall, the evidence in Table 8 suggests that firms that are noncompliant with the board
independence or nominating committee independence rules are reluctant to replace the incumbent
CEO, even at very low firm performance levels prior to the introduction of the new exchange listing

33
rules. It is over this worst firm performance region (Q1 and sometimes Q2) that the new exchange
listing rules significantly improve board oversight.20
4.6. Independent director monitoring and information cost
It is well known that independent directors often face barriers in accessing firm-specific
information which can weaken their ability to effectively monitor a CEO. Recent theoretical and
empirical literature shows that independent director effectiveness in monitoring and advising depends
on the cost of becoming informed (Raheja (2005); Adams and Ferreira (2007); Harris and Raviv
(2008)). Supporting the view that independent directors are mainly effective in low information cost
firms, Duchin, Matsusaka and Ozbas (2010) show that adding independent directors improves
performance in low information cost firms, but hurts it in high information cost firms. Thus, the recent
literature suggests that independent boards (nominating committees) improve board monitoring
mainly in low information cost firms. We provide new empirical evidence on these predictions.
Following Duchin, Matsusaka and Ozbas (2010) and the empirical literature on determinants of
board structure,21
we measure firm information cost using two standard metrics: market-to-book ratio
and idiosyncratic stock return volatility. 22
Market-to-book ratio is defined as the ratio of book value
of debt plus market value of equity to book value of assets. It is a widely used measure of growth
opportunities. Jensen (1993) argues that it is more costly to monitor growth firms. In recent studies,
both Boone, Field, Karpoff, and Raheja (2007) and Duchin, Matsusaka, and Ozbas (2010) argue that
directors face higher information costs in firms with higher market-to-book ratios. Duchin et al.
(2010) find that the market-to-book ratio is a strong determinant of outside directors effectiveness.
Idiosyncratic volatility is measured by the standard deviation of a firm’s idiosyncratic monthly
stock returns in the fiscal year. Idiosyncratic return is calculated as the residual from regressing a
firm’s stock returns on the equally-weighted returns of all firms in the same Fama and French 48
industry, excluding the sample firm. Fama and Jensen (1993) argue that firms with high stock
20
This evidence is consistent with Jenter and Lewellen (2010) who find that difference in rate of CEO turnover between
firms with high and low board quality is most significant in the bottom quintile of firm performance. 21 See Boone, Field, Karpoff, & Raheja (2007), Coles, Daniel, & Naveen (2008) and Linck, Netter, & Yang (2008) 22 We do not use analyst-based measures as in Duchin et al. (2010) since too many firms in our matched samples lack analyst
forecast data in the I/B/E/S database, making meaningful statistical analysis difficult.

34
volatility are more likely to have firm-specific information that is unknown to independent directors.
Boone, Field, Karpoff, and Raheja (2007) argue that “the cost of monitoring managers is likely to
increase with the volatility of the firm’s stock price, because volatility reflects background uncertainty
about the firm’s prospect and performance and increases the difficulty of judging manager’s
performance.” In a similar vein, Duchin, Matsusaka, and Ozbas (2010) argue that “to the extent that a
firm’s performance is fundamentally uncertain, monitoring may be difficult and the effectiveness of
outside directos may be limited.”
We calculate the two information cost measures in 2001 for each firm in our sample. We divide
our sample firms into low and high information cost subsamples based on whether the firm is below
or above the median for each information cost measure. We use sample medians to minimize the
impact of sample size on any differences in statistical significance in the two subsamples. Each
noncompliant firm is matched with one or more compliant firms in 2001 using the same propensity
score matching method used earlier with the added requirement that firms are in the same information
cost category. To facilitate a comparison of statistical significance with our previous results, we
continue to use a matching radius of 0.15. For each exchange rule (board and nominating committee
independence) and each of the four information cost measures, we construct low and high information
cost subsamples and re-estimate the regression models in column 1 - 4 of Table 3 for these subsample
pairs. Within each subsample, we estimate two performance regressions, one for market-adjusted
stock returns and one for industry-adjusted changes in EBIT, which yield 16 estimated regressions.
In Table 9, we only report coefficient estimates and associated t-statistics of the triple interaction
term for the 16 DiD regressions to conserve space. First, we observe that all 16 coefficient estimates
are negative, consistent with a greater rise in turnover-performance sensitivity in both low and high
information cost firms. Second, negative coefficient estimates for high information cost firms are
statistically insignificant in all regressions, while for the low information cost firms they are
statistically significant in two-sided tests in 6 of 8 regressions. Further, the coefficient estimates are
larger in absolute value for the low information cost firms relative to the high information cost firms
in 6 of the 8 paired comparisons.

35
Our evidence suggests the effect of greater board or nominating committee independence on
turnover-performance sensitivity is stronger in noncompliant firms with low information cost than
with high cost. This finding adds support to the recent literature that shows independent directors are
more effective monitors when the cost of becoming informed is lower.
4.7. Independent director monitoring and other monitoring mechanisms
In addition to independent directors, large shareholders are often argued to have greater
incentives to collect information and monitor management (Shleifer and Vishny (1986)). Consistent
with this argument, Denis and Serrano (1996) show that, after unsuccessful takeover attempts,
management turnover is higher in poorly performing firms with a large outside blockholder. Bertrand
and Mullainathan (2001) find CEO pay for luck is significantly lower if there is a large shareholder.
Hartzell and Starks (2003) find concentrated institutional investor shareholdings are positively related
to excecutive pay-performance sensitivity and negatively related to compensation level. Since
monitoring by large shareholders is an alternative mechanism to strengthen the monitoring of CEOs,
we expect the new exchange listing rules to mainly affect firms that lacked boards with these strong
monitoring incentives prior to the rule change. In this section, we examine the impacts of two types of
large shareholder influences: outside blockholder-directors and concentrated institutional ownership.
An outside blockholder-director is defined as an outside director who holds over 1% of firm
voting power. We obtain data on outside blockholder-directors from the RiskMetrics database. Of our
sample firms, 31% have at least one outside blockholder-director in 2001. To measure monitoring
intensity by institutional investors, we follow Hartzell and Starks (2003) and use two institutional
ownership concentration measures. The primary measure is institutional ownership of the top five
institutional investors and the alternative measure is a Herfindalhl index of institutional ownership.
Institutional ownership data is from the Thomson Reuters Institutional (13f) Holdings database. The
mean (median) proportion of institutional holdings by the top five institutions is 41% (38%) and the
mean (median) institutional ownership Herfindalhl index is 0.082 (0.046) in our sample in year 2001.
We then divide our firms into subsamples for each of the three large shareholder measures. For
the blockholder measure, firms are classified in 2001 by whether an outside blockholder is on the

36
board. For both institutional investor concentration measures, we use sample medians to classify firms
into low and high concentration groups. We then match treatment and control firms in the same
blockholder or institutional ownership concentration category using the propensity score matching
method in Table 3 for both the board and nominating committee independence rules to obtain six
subsamples under each rule, for a total of 12 subsamples. Within each subample, we estimate equation
(1) for our two firm performance measures so that we ultimately estimate a total of 24 regressions.
Table 10 reports the results of controlling for large shareholder influence. To conserve space, we
only report coefficient estimates for the interaction of Treat and Performance and the triple
interaction of Treat, Post and Performance. A positive coefficient of the former indicates lower
sensitivity of forced CEO turnover in treatment firms than in control firms in the pre-treatment period.
A negative coefficient of the triple intereaction indicates that the treatment raises the sensitivity of
forced CEO turnover to firm performance in treatment firms in the post-treatment period.
Columns 1 and 2 of Table 10 compare firms with and without an outside blockholder-director.
Although the coefficient of the triple interaction term is negative in all the regressions except one, it is
only statistically significant for firms without an outside blockholder-director. 23
In addition, the
coefficient of the interaction of Treat and Performance is positive and statistically significant in firms
without an outside blockholder-director, but it has mixed signs and is statistically insignificant in
firms with an outside blockholder-director. This evidence indicates that in the pre-treatment period
firms without an outside blockholder-director have weaker monitoring than firms with one. Yet after
treatment, firms without a blockholder-director experience a significant rise in sensitivity of forced
CEO turnover to firm performance, while the other firms experience an insignificant rise.
Columns 3 and 4 compare treatment effects in firms with low and high institutional ownership
concentration under our primary institutional ownership concentration measure. The triple interaction
coefficient is negative for both pairs of regressions; however, it is only significant or marginally
significant for firms with low institutional ownership concentration. The sign and statistical
23 One caveat is the sample in column 2 is much smaller than column 1 since most firms lack an outside blockholder-
director. This is especially true in Panel B. Thus, the differences in statistical significance could be due to sample size. This
problem is not present in our second test using institutional holdings measures because we use sample medians to separate
firms into low and high institutional ownership concentration subsamples.

37
significance of the interaction of Treat and Performance is also consistent with weaker pre-treatment
period monitoring for firms with low institutional ownership concentration. The alternative measure
of institutional ownership concentration in columns 5 and 6 yields similar results to those in column 3
and 4. Thus, the evidence shows firms with low institutional ownership concentration seem to have
weaker monitoring than those with high institutional ownership concentration prior to treatment and
the new exchange listing rules mainly affect them. Overall, our evidence suggests independent
director monitoring is most important in firms that otherwise have weak monitoring.
5. Robustness Analysis
5.1. Statistical significance based on placebo tests
Bertrand, Duflo, and Mullainathan (2004) show that DiD regressions can over reject the null
hypothesis when long time series are used and observations within each unit are correlated over time.
Hence, we follow Bertrand et al. (2004) and estimate the distribution of the t-statistics of the triple
interaction of Post, Treat and Performance in columns 1 through 4 in Tabel 3 from 5,000 simulated
pseudo regulatory shocks to board and nominating committee independence. We then assess the
statistical significance of the original coefficient estimates by locating their t-statistics in the
distribution of the simualted t-statistics in Figure 2. We observe that due to mild asymmetry in the
distribution of the simulated t-statistics, the statistical significance of our coefficient estimates in
Table 3 for the board independence rule improve. The original t-statistic of the coefficient of the triple
interaction of Post, Treat and Performance in column 1 of Table 3 is located deep inside the left 2.5%
tail of the simulated distribution, while the orignal t-statistic of the same coefficient in column 2 of
Table 3 is now located almost on the border of the left 2.5% tail. For the nominating committee
independence rule, the original t-statistics are also deep in the left 2.5% tails, whether firm
performance is measured by market-adjusted stock return or industry-adjusted change in EBIT.
5.2. Further robustness
In Table 11 we report results for an array of sensitivity tests to assess the robustness of our major
findings. To conserve space, we only report selected coefficients. Panels A and B investigate whether

38
our main results for noncompliant firms are driven by turnover-performance sensitivity substituting
for pay-performance sensitivity as CEO incentive devices. For this analysis, we add the delta of a
CEO’s portfolio of firm equity and options holdings in columns 1 and 2 or the ratio of CEO equity to
nonequity-based pay in columns 3 and 4, plus their interactions with firm performance to equation (1).
In panels C and D, we investigate the robustness of our results to different specifications of the
propensity score model. In the first variation (columns 1 and 2), the propensity score model used to
predict firms noncompliant under the board independence rule is limited to the following explanatory
variables: firm size, market-to-book ratio, monthly stock return volatility, the entrenchment index (E-
index) and industry. In predicting firms noncompliant with the nominating committee independence
rule, we also add the fraction of independent directors. We exclude all governance variables except
for the E-index, which tends to be quite stable prior to SOX. In the second specification (columns 3
and 4), we only include firm size and industry to predict firms noncompliant with either rule.
In panel E, we investigate whether our results are driven by misclassification of some compliant
firms as noncompliant due to RiskMetrics’ stricter definition of independence. This should bias
against finding significant differences in treatment and control firms. But, if a significant number of
noncompliant firms are misclassified and our results are mainly driven by these misclassified firms,
then our conclusions could be false. To address this concern, we alternatively classify a firm as
noncompliant with the board (nominating committee) independence rule if the percentage of
independent directors on the board (nominating committee) in 2001 is below the sample median of
43% (66%) for noncompliant firms. We then re-estimate models 1 - 4 in Table 3 using this
noncompliant firm definition. Columns 1 and 2 report results for the board independence rule and
columns 3 and 4 for the nominating committee independence rule.
Panel F investigates whether inclusion of “controlled companies” affect our results since
exchange listing rules exempt controlled companies from board and nominating committee
independence requirements. A controlled company is defined as having an individual, a group or
another firm that hold over 50% of its voting rights. In panel F, we exclude firms in which the fraction
of independent directors on the board is at or below 50% or the nominating committee is not fully

39
independent in 2005, the year firms must meet the new exchange listing rules. Thus, a firm that does
not comply with the new listing rules, but remains listed is highly likely to be a “controlled company”
exempt from the requirements. We then estimate equation (1) using a matched sample of treatment
and control firms constructed from the remaining firms. Columns 1 and 2 present results for the board
independence rule, and columns 3 and 4 for the nominating committee independence rule.
As Table 11 shows, none of these sensitivity tests alters our major conclusions about how either
board or nominating committee independence affect CEO forced turnover sensitivity to performance.
More complete details of these tests are reported in the Internet Appendix sections B-E.
6. Conclusion
Although most regulators and investors believe that raising independent director representation
improves board oversight, the empirical evidence is mixed and inconclusive. Also, past studies of
corporate boards often neglect the level of nominating committee independence when studying the
effects of board independence. We find that firms with an insider-dominated board almost always lack
an independent nominating committee in our sample. Given the importance of CEO influence over the
board nominating process for attaining actual director independence and board incentives to monitor,
it is unclear to what extent the existing evidence on board independence is driven by the level of
nominating committee independence. We use changes in board composition required under NYSE
and Nasdaq listing rules in 2003 as a source of exogenous variation to address both these issues.
We document causal relations between board and nominating committee independence and the
intensity of board monitoring. Firms that move to an independent board or a fully independent
nominating committee following the new exchange listing rules experience greater sensitivity of
forced CEO turnover to performance. We show that board and nominating committee independence
rules have complementary, but separate effects on board monitoring. Specifically, firms moving to an
independent nominating committee have greater forced CEO turnover to firm performance sensitivity,
even when they already have an independent board. Also, moving to an independent board leads to
greater forced CEO turnover sensitivity to firm performance, even after controlling for the rise in

40
turnover sensitivity due to a change in nominating committee independence. Finally, in the cross-
section, we find changes in sensitivity of forced CEO turnover to firm performance are greater in
noncompliant firms that begin further away from the board independence requirement, have the CEO
sitting on the nominating committee, have no blockholder-directors and low concentration of
institutional ownership, and have low information cost.
To our knowledge, we are the first study to document a relation between a fully independent
nominating committee and forced CEO turnover. This evidence suggest that corporate governance
reforms can achieve greater improvement in board monitoring if they target both independence of the
overall board and full independence of the nominating committee.
Depending on what determines board structure prior to the issuance of the new exchange listing
requirements, the increased intensity of board monitoring we document in this study can have
different implications for shareholder wealth. From an agency viewpoint, the composition of
corporate boards is unduly influenced by the CEO and the main problem with corproate boards is that
they are an ineffective internal control mechanism (Jensen, 1993). Under this hypothesis, the
exognous shock we study should benefit shareholders. However, from an optimal contracting
viewpoint, the composition of corporate boards is optimally determined by a tradeoff between the
monitoring and advising needs of a firm. Under this hypothesis, although adding independent
directors to the board or nominating commitee increases the intensity of board monitoring,
nevertheless it can still move a board away from its optimal composition and, as a result, hurt
shareholder interests. The board of directors litearture has yet to reach an conclusion on what
characterizes the observed board structure prior to this mandatory change in board composition.
Furthermore it is likely that at times these forced changes in board composition can reduce firm value.
Thus, it will be important for future research to analzye when such regulatory shocks are detrimental
to shareholder interests.

41
References
Adams, R. B., & Ferreira, D. (2007). A theory of friendly board. Journal of Finance, 62(1), 217-250.
Adams, R., Hermalin, B., & Weisbach, M. (2010). The role of boards of directors in corporate
governance: a conceptual framework and survey. Journal of Economic Literature, 48(1), 58-
107.
Bebchuk, L., Cohen, A., & Ferrell, A. (2009). What matters in corproate governance? Review of
Financial Studies, 22, 783-827.
Berle, A. A., & Means, G. C. (1932). The modern corporattion and private property. New York:
MacMillan.
Bertrand, M., & Mullainathan, S. (2000). Agents with and without principals. American Economic
Review, XC, 203-208.
Bhagat, S., & Black, B. (1999). The uncertain relationship between board composition and firm
performance. The Business Lawyer, 54(3), 921-963.
Bhagat, S., & Bolton, B. (2013). Director ownership, governance and performance. Journal of
Financial and Quantitative Analysis, 48(1), 105-135.
Boone, A. L., Field, L. C., Karpoff, J. M., & Raheja, C. G. (2007). The determinants of corporate
board size and independence: an empirical analysis. Journal of Financial Economics, 85(1),
66-101.
Chhaochharia, V., & Grinstein, Y. (2009). CEO compensation and board structure. Journal of
Finance, 64(1), 231-261.
Coles, J. L., Daniel, N. D., & Naveen, L. (2006). Managerial incentives and risk-taking. Journal of
Financial Economics, 79, 431-468.
Coles, J. L., Daniel, N. D., & Naveen, L. (2008). Boards: Does one size fit all? Journal of Financial
Economics, 87, 329-356.
Coles, J. L., Daniel, N. D., & Naveen, L. (2013). Calculation of compensation incentives and firm-
related wealth using Execucomp: data, program and explanation . Working Paper.
Coles, J. L., Daniel, N. D., & Naveen, L. (2014). Co-opted boards. Review of Financial Studies,
Forthcoming.
Core, J. E., Holthausen, R. W., & Larcker, D. F. (1999). Corporate governance, CEO compensation,
and firm performance. Journal of Financial Economics, 51, 371-406.
Core, J., & Guay, W. (2002). Estimate the value of employee stock option portfolios and their
sensitivities to price and volatility. Journal of Accounting Research, 40, 613-630.
Cornelli, F., Kominek, Z., & Ljungqvist, A. (2012). Monitoring managers: does it matter? Journal of
Finance, 68(2), 431-481.

42
Dahya, J., McConnell, J. J., & Travlos, N. G. (2002). The Cadbury committee, corporate performance,
and top management turnover. Journal of Finance, 67, 461-483.
Dehejia, R. H., & Wahba, S. (2002). Propensity score matching methods for nonexperimental causal
studies. 84(1), 151-161.
Denis, D. J., & Denis, D. K. (1995). Performane changes following top management dismissals.
Journal of Finance, 50(4), 1029-1057.
Denis, D. J., & Serrano, J. M. (1996). Active investors and management turnover following
unsuccessful control contests. Journal of Financial Economics, 40, 239-266.
Denis, D. J., Denis, D. K., & Sarin, A. (1997). Ownership structure and top executive turnover.
Journal of Financial Economics, 45, 193-221.
Duchin, R., Matsusaka, J. G., & Ozbas, O. (2010). When are outside directors effective? Journal of
Financial Economics, 96, 195-214.
Fama, E. (1980). Agency problems and the theory of the firm. Journal of Political Economy, 88, 288-
307.
Fama, E. F., & Jensen, M. C. (1983). Separation of ownership and control. Journal of Law &
Economics, 26, 301-325.
Goyal, V. K., & Park, C. W. (2002). Board leadership structure and CEO turnvoer. Journal of
Corporate Finance, 8, 49-66.
Greene, W. (2010). Testing hypotheses about interaction terms in nonlinear models. Economic
Letters, 107, 291-296.
Grinstein, Y., & Hribar, P. (2004). CEO compensation and incentives: evidence from M&A bonuses.
Journal of Financial Economics, 73, 119-143.
Guo, L., Lach, P., & Mobbs, S. (2014). Tradeoffs between internal and external governance: evidence
from exogenous regulatory shocks. Financial Management, Forthcoming.
Guthrie, K., Sokolowsky, J., & Wan, K.-M. (2010). CEO Compensation and Board Structure
Revisited. Journal of Finance, 67(3), 1149-1168.
Harris, M., & Raviv, A. (2008). A Theory of Board Control and Size. Review of Financial Studies,
21(4), 1797-1832.
Hartzell, J. C., & Starks, L. T. (2003). Institutional Investors and Executive Compensation. Journal of
Finance, 58, 2351-2374.
Hazarika, S., Karpoff, J. M., & Nahata, R. (2009). Internal corporate governance, CEO turnover, and
earnings management. Journal of Financial Economics, Forthcoming.
Hermalin, B. E. (2005). Trends in Corporate Governance. Journal of Finance, 60(5), 2351-2384.
Hermalin, B. E., & Weisbach, M. S. (1998). Endogenously chosen boards of directors and their
monitoring of the CEO. American Economic Review, 88(1), 96-118.

43
Hermalin, B. E., & Weisbach, M. S. (2003). Boards of directors as an endogenously determined
institution: a survey of the economic literature. FRBNY Economic Policy Review, 7-26.
Hermalin, B. E., & Weisbach, M. S. (2014). Understanding corproate governance through learning
models of managerial competence. Working Paper.
Huson, M. R., Malatesta, P. H., & Parrino, R. (2004). Managerial succession and firm performance.
Journal of Financial Economics, 74, 237-275.
Huson, M. R., Parrino, R., & Starks, L. T. (2001). Internal monitoring mechanisms and CEO
turnover: a long-term perspective. Journal of Finance, 56(6), 2265-2297.
Hwang, B.-H., & Kim, S. (2009). It pays to have friends. Journal of Financial Economics, 93(1), 138-
158.
Jensen, M. C. (1993). The modern indsutrial revolution, exit, and the failure of internal control
systems. Journal of Finance, 48, 831-880.
Jenter, D., & Kanaan, F. (2014). CEO Turnover and Relative Performance Evaluation. Journal of
Finance, Forthcoming.
Jenter, D., & Lewellen, K. (2010). Performance-induced CEO Turnover. Stanford University Working
Paper.
Kaplan, S. N., & Minton, B. A. (2011). How has CEO turnover changed? International Review of
Finance, 12(1), 57-87.
Knyazeva, A., Knyazeva, D., & Masulis, R. W. (2012). The supply of corproate directors and board
independence. Review of Financial Studies, 26, 1561-1605.
Koh, P., & Reeb, D. (2014). R&D Disclosures. Working Paper.
Lel, U., & Miller, D. P. (2008). International cross-listing, firm performance and top management
turnover: a test of the bonding hypothesis. Journal of Finance, 63(4), 1897-1937.
Linck, J. S., Netter, J. M., & Yang, T. (2008). The determinants of board structure. Journal of
Financial Economics, 87(2), 308-328.
Masulis, R. W., & Mobbs, S. (2011). Are all inside directors the same? Do they entrench CEOs or
enhance board decision making? Journal of Finance, 66(3), 812-823.
Mobbs, S. (2013). CEOs underfire: the effects of competition from inside directors on forced CEO
turnover and CEO compensation. Journal of Fianncial and Quantitative Analysis, 48(3), 669-
698.
Parrino, R. (1997). CEO turnover and outside succession: A cross-sectional analysis. Journal of
Financial Economics, 46(2), 165-197.
Perry, T. (1999). Incentive compensation for outside directors and CEO turnover. Working Paper,
Arizona State University.

44
Raheja, C. (2005). Determinant of board size and composition: A theory of corporate boards. Journal
of Financial and Quantitative Analysis, 40(2), 283-206.
Romano, R. (2005). The Sarbanes-Oxley Act and the making of quack corporate governance. Yale
Law Review, 114, 1521-1611.
Schwartz-Ziv, M., & Weisbach, M. S. (2012). What do boards really do? Evidence from minutes of
board meetings. Journal of Financial Economics, 108(2), 349-366.
Shivdasani, A., & Yermack, D. (1999). CEO involvement in the selection of new board members: An
empirical analysis. Journal of Finance, 54, 1829-1853.
Shleifer, A., & Vishny, R. (1986). Large shareholders and corproate control. Journal of Political
Economy, 94(3), 461-88.
Warner, J., Watts, J., & Wruck, K. (1988). Stock prices and top management changes. Journal of
Financial Economics, 20, 431-460.
Weisbach, M. S. (1988). Outside directors and CEO turnover. Journal of Financial Economics, 20,
431-460.

45
Figure 1: Changes in board structure from 1996 to 2009 of sample firms
The sample consists of all firms on ExecuComp and RiskMetrics (formerly IRRC) that have board data for 2001
available on RiskMetrics and survived from 2001 until at least 2004. The data source is the RiskMetrics database.
The top panel shows the percentage of sample firms that have majority of independent directors on board, fully
independent nominating, audit and compensation committees respectively from 1998 to 2009. The bottom panel
shows the mean percentage of independent directors on the board from 1996 to 2009 for treatment firms and control
firms defined by whether the firm had a majority of independent directors on board in 2001.
0
0.1
0.2
0.3
0.4
0.5
0.6
0.7
0.8
0.9
1
1.1
1998 1999 2000 2001 2002 2003 2004 2005 2006 2007 2008 2009
Fraction of Firms In Compliance with the New
Exchange Listing Rules
ind_bod ind_nom ind_aud ind_com
0
0.1
0.2
0.3
0.4
0.5
0.6
0.7
0.8
0.9
1998 1999 2000 2001 2002 2003 2004 2005 2006 2007 2008 2009
Mean Fraction of Independent Directors on the Board
Treatment Control

46
Figure 2: Distribution of t-statistics from 5000 simulations of pseudo regulatory shocks.
This figure shows the histograms of the t-statistics of the coefficient of Post × Treat × Performance in Table 3
from 5000 simulations of pseudo regulatory shocks to board or nominating committee independence. The top
two graphs show the histograms for the board independence rule, while the bottom two graphs show the
histograms for the nominating committee independence rule. Kernel density estimates are imposed on top of the
histograms. The solid line marks the location of the original t-statistics in Table 3, while the two dashed lines
indicate the locations of the simulated critical t-statistics for 5% and 10% statistical significance in two-sided
tests respectively.
t=-2.14 10% 5%
0.1
.2.3
.4.5
De
nsity
-4 -2 0 2 4t
Board Independence - Stock return
Histogram of simulated t-statistics (N=5000)
t=-1.83 10% 5%
0.1
.2.3
.4
De
nsity
-4 -2 0 2 4t
Board Independence - Change in EBIT
Histogram of simulated t-statistics (N=5000)
t=-2.66 10% 5%
0.1
.2.3
.4
De
nsity
-4 -2 0 2 4t
Nominating Committee Independence - Stock return
Histogram of simulated t-statistics (N=5000)
t=-2.34 10% 5%
0.1
.2.3
.4
De
nsity
-4 -2 0 2 4t
Nominating Committee Independence - Change in EBIT
Histogram of simulated t-statistics (N=5000)

47
Table 1: Summary Statistics
Panel A reports summary statistics for the entire sample, which consists of all firm-year observations from 1996
to 2009 of the 1,231 firms that have board data available on RiskMetrics in 2001 and have survived from 2001 to
at least 2004 on the ExecuComp database. Total compensation is the CEO’s total compensation in the fiscal year
(TDC1 on the ExeuComp). Equity to nonequity pay and Delta are winsorized at 1% and 99%. Panel B compare
firms that are and are not in compliance with the new exchange listing rules that require listed firms to have a
majority of independent directors on the board and a fully independent nominating committee in year 2001,
respectively. Panel C compare firms that are and are not in compliance with the new exchange listing rules that
require listed firms to have a fully independent audit committee and compensation committee in 2001,
respectively. All variables are defined in Appendix 1. ***, **, * represent statistical significance at the 1%, 5%
and 10% levels for difference in means between the treatment and control firms.
Panel A: All firm-years (1996-2009)
Variables Obs Mean Median SD
Total assets ($ mil) 16092 17034.64 2054.77 87114.27
Sales ($ mil) 16086 6284.49 1597.98 17989.36
Market capitalization ($ mil) 15383 8439.53 1795.58 25176.89
Book leverage 16035 0.23 0.22 0.20
Market-to-book 15964 2.01 1.46 2.45
Stock return volatility 15908 0.117 0.098 0.079
Market-adjusted stock return 15924 0.0893 -0.0004 0.6719
Industry-adjusted change in EBIT 15836 0.0045 0.0010 0.2152
Fraction of Independent directors 13614 0.68 0.71 0.17
Board size 13614 9.8 9 2.8
Nonemployee blockholder 13614 0.25 0 0.44
CEO-Chairman 13287 0.66 1 0.47
E-index 13861 2.25 2 1.47
Percentage of CEO voting control (%) 11458 3.36 0 9.39
CEO tenure (year) 16116 5.2 5 3.6
CEO age 15838 55 56 7
Founder-Heir CEO 16116 0.078 0 0.269
Fraction of all CEO turnovers 16116 0.103 0 0.305
Fraction of forced CEO turnovers 16116 0.0252 0 0.157
Total compensation ($000s) 15386 5692.89 2972.24 12485.5
Equity to nonequity Pay 15344 1.70 0.84 2.84
Delta ($000s) 14316 881.56 259.04 1984.74

48
Table 1 Panel B: Comparison of treatment and control firms in 2001
Board Independence t-statistics Nominating Committee Independence t-statistics
Treatment Control (2)-(1) Treatment Control (4)-(3)
(1) (2) (3) (4)
Total assets ($ mil) 14146.40 14746.04 0.13 11696.22 21186.61 2.02
Sales ($ mil) 4589.72 6061.86 1.41 4404.61 8631.77 3.86
Market capitalization ($ mil) 7764.40 8338.93 0.27 6348.33 12505.84 3.07
Market-to-book 2.06 1.90 -1.79 2.02 1.77 -3.19
Stock return volatility 0.159 0.139 -3.42 0.152 0.127 -6.34
E-index 1.67 2.41 7.72 2.09 2.54 5.47
Independent directors 0.40 0.73 48.72 0.59 0.77 20.15
CEO-Chairman 0.61 0.72 3.30 0.66 0.77 3.90
Nonemployee blockholder 0.47 0.25 -6.77 0.37 0.17 -7.60
Total compensation ($000s) 5171.627 7077.778 2.15 6647.891 6537.621 -0.14
Equity-to-nonequity Pay 2.09 2.64 2.11 2.60 2.29 -1.42
Delta 1293.149 869.7862 -2.58 1061.685 772.8177 -2.27
Number of firms 306 925 855 376
Table 1 Panel C: Comparison of treatment and control firms in 2001
Audit Committee Independence t-statistics Compensation Committee Independence t-statistics
Treatment Control (2)-(1) Treatment Control (4)-(3)
(1) (2) (3) (4)
Total assets ($ mil) 20873.60 11770.07 -1.90 9692.45 16619.00 2.26
Sales ($ mil) 7207.99 5016.08 -2.08 4602.55 6147.84 1.75
Market capitalization ($ mil) 11904.30 6527.79 -2.58 6574.08 8849.38 1.33
Market-to-book 1.97 1.93 -0.51 1.96 1.93 -0.35
Stock return volatility 0.143 0.145 0.38 0.146 0.144 -0.42
E-index 2.10 2.30 2.34 1.95 2.35 4.48
Independent directors 0.53 0.70 15.72 0.51 0.70 18.08
CEO-Chairman 0.68 0.70 0.54 0.65 0.71 1.94
Nonemployee blockholder 0.40 0.26 -4.79 0.42 0.26 -5.30
Total compensation ($000s) 8988.388 5553.641 -2.49 6018.983 6853.453 0.91
Equity-to-nonequity Pay 2.70 2.42 -1.10 2.23 2.62 1.57
Delta 1396.340 779.913 -3.70 1130.052 909.087 -1.48
Number of firms 383 848 359 872

49
Table 2: Distribution of firms by compliance status with the new exchange listing rules in year 2001
This table reports the number (first row), row percentage (parenthesis) and column percentage (bracket) of sample firms by compliance status with the four new
exchange listing rules in year 2001. The sample consists of 1,231 firms that have board data available on RiskMetrics in 2001 and have survived from 2001
through 2004 on the ExecuComp database.
Independence of Nominating Committee Audit Committee Compensation Committee Total
Compliant? Yes No Yes No Yes No
Board Yes 361 564 723 202 754 171 925
(39%) (61%) (78%) (22%) (82%) (18%)
[96%] [66%] [85%] [53%] [86%] [48%] [75%]
No 15 291 125 181 118 188 306
(5%) (95%) (41%) (59%) (39%) (61%)
[4%] [34%] [15%] [47%] [14%] [52%] [25%]
Nominating Committee Yes … … 317 59 338 38 376
(84%) (16%) (90%) (10%)
[37%] [15%] [39%] [11%] [31%]
No … … 531 324 534 321 855
(62%) (38%) (62%) (38%)
[63%] [85%] [61%] [89%] [69%]
Audit Committee Yes … … … … 675 173 848
(80%) (20%)
[77%] [48%] [69%]
No … … … … 197 186 383
(51%) (49%)
[23%] [52%] [31%]
Total 376 855 848 383 872 359 1,231
(31%) (69%) (69%) (31%) (71%) (29%) 100%
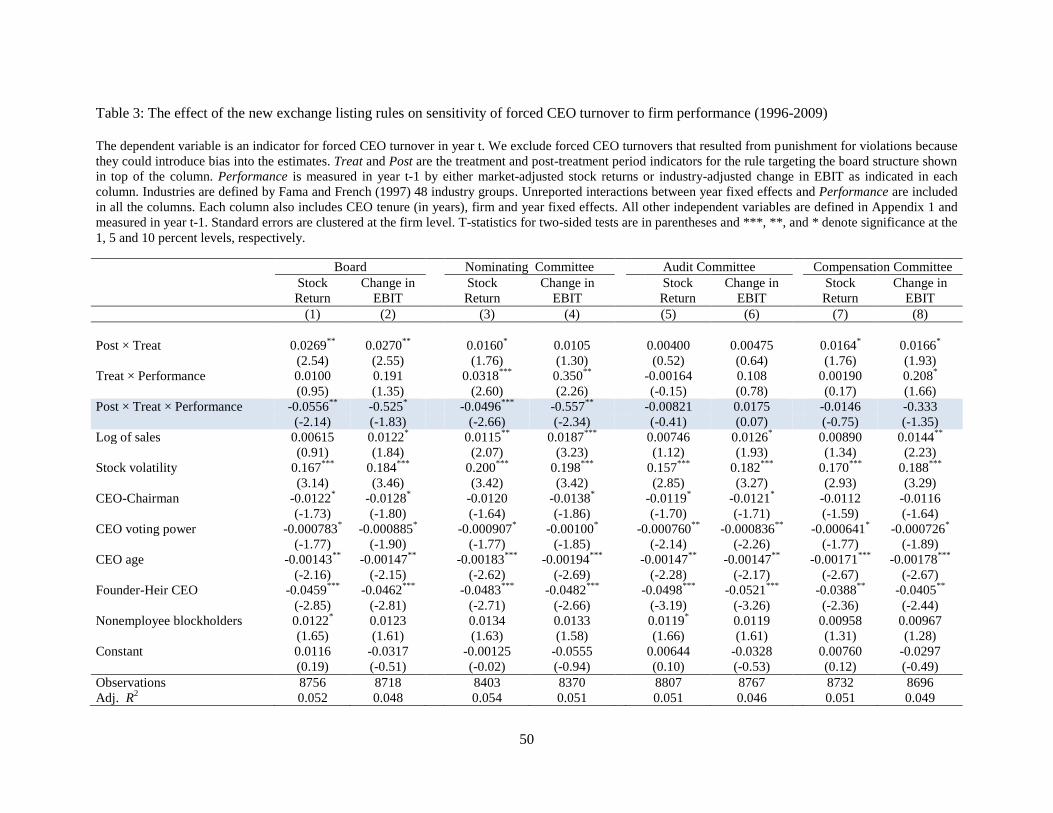
50
Table 3: The effect of the new exchange listing rules on sensitivity of forced CEO turnover to firm performance (1996-2009)
The dependent variable is an indicator for forced CEO turnover in year t. We exclude forced CEO turnovers that resulted from punishment for violations because
they could introduce bias into the estimates. Treat and Post are the treatment and post-treatment period indicators for the rule targeting the board structure shown
in top of the column. Performance is measured in year t-1 by either market-adjusted stock returns or industry-adjusted change in EBIT as indicated in each
column. Industries are defined by Fama and French (1997) 48 industry groups. Unreported interactions between year fixed effects and Performance are included
in all the columns. Each column also includes CEO tenure (in years), firm and year fixed effects. All other independent variables are defined in Appendix 1 and
measured in year t-1. Standard errors are clustered at the firm level. T-statistics for two-sided tests are in parentheses and ***, **, and * denote significance at the
1, 5 and 10 percent levels, respectively.
Board Nominating Committee Audit Committee Compensation Committee
Stock
Return
Change in
EBIT
Stock
Return
Change in
EBIT
Stock
Return
Change in
EBIT
Stock
Return
Change in
EBIT
(1) (2) (3) (4) (5) (6) (7) (8)
Post × Treat 0.0269**
0.0270**
0.0160* 0.0105 0.00400 0.00475 0.0164
* 0.0166
*
(2.54) (2.55) (1.76) (1.30) (0.52) (0.64) (1.76) (1.93)
Treat × Performance 0.0100 0.191 0.0318***
0.350**
-0.00164 0.108 0.00190 0.208*
(0.95) (1.35) (2.60) (2.26) (-0.15) (0.78) (0.17) (1.66)
Post × Treat × Performance -0.0556**
-0.525* -0.0496
*** -0.557
** -0.00821 0.0175 -0.0146 -0.333
(-2.14) (-1.83) (-2.66) (-2.34) (-0.41) (0.07) (-0.75) (-1.35)
Log of sales 0.00615 0.0122* 0.0115
** 0.0187
*** 0.00746 0.0126
* 0.00890 0.0144
**
(0.91) (1.84) (2.07) (3.23) (1.12) (1.93) (1.34) (2.23)
Stock volatility 0.167***
0.184***
0.200***
0.198***
0.157***
0.182***
0.170***
0.188***
(3.14) (3.46) (3.42) (3.42) (2.85) (3.27) (2.93) (3.29)
CEO-Chairman -0.0122* -0.0128
* -0.0120 -0.0138
* -0.0119
* -0.0121
* -0.0112 -0.0116
(-1.73) (-1.80) (-1.64) (-1.86) (-1.70) (-1.71) (-1.59) (-1.64)
CEO voting power -0.000783* -0.000885
* -0.000907
* -0.00100
* -0.000760
** -0.000836
** -0.000641
* -0.000726
*
(-1.77) (-1.90) (-1.77) (-1.85) (-2.14) (-2.26) (-1.77) (-1.89)
CEO age -0.00143**
-0.00147**
-0.00183***
-0.00194***
-0.00147**
-0.00147**
-0.00171***
-0.00178***
(-2.16) (-2.15) (-2.62) (-2.69) (-2.28) (-2.17) (-2.67) (-2.67)
Founder-Heir CEO -0.0459***
-0.0462***
-0.0483***
-0.0482***
-0.0498***
-0.0521***
-0.0388**
-0.0405**
(-2.85) (-2.81) (-2.71) (-2.66) (-3.19) (-3.26) (-2.36) (-2.44)
Nonemployee blockholders 0.0122* 0.0123 0.0134 0.0133 0.0119
* 0.0119 0.00958 0.00967
(1.65) (1.61) (1.63) (1.58) (1.66) (1.61) (1.31) (1.28)
Constant 0.0116 -0.0317 -0.00125 -0.0555 0.00644 -0.0328 0.00760 -0.0297
(0.19) (-0.51) (-0.02) (-0.94) (0.10) (-0.53) (0.12) (-0.49)
Observations 8756 8718 8403 8370 8807 8767 8732 8696
Adj. R2 0.052 0.048 0.054 0.051 0.051 0.046 0.051 0.049

51
Table 4: Identifying the treatment effect of nominating committee independence (1996-2009)
This table is estimated using firms that already have a majority of independent directors on the board in year
2001 and thus are not affected by the board independence rule. The dependent variable is an indicator for forced
CEO turnover in year t. We exclude forced CEO turnovers that resulted from punishment for violations because
poor firm performance is not the main reason for these turnovers. Treat and Post are the treatment and post-
treatment period indicators for the rule requiring a fully independent nominating committee. Performance is
measured in year t-1 by either market-adjusted stock returns or industry-adjusted change in EBIT as indicated in
each column. Industries are defined by Fama and French (1997) 48 industry groups. Unreported interactions
between year fixed effects and Performance are included in all columns. Each column also includes CEO tenure
(in years), firm and year fixed effects. All other independent variables are defined in Appendix 1 and measured
in year t-1. Standard errors are clustered at the firm level. T-statistics for two-sided tests are in parentheses and
***, **, and * denote significance at the 1, 5 and 10 percent levels, respectively.
Stock Return Change in EBIT
(1) (2)
Post × Treat 0.0106 0.00845
(1.23) (1.02)
Treat × Performance 0.0460***
0.369**
(3.60) (2.25)
Post × Treat × Performance -0.0598***
-0.442*
(-3.19) (-1.79)
Log of sales 0.00655 0.0118
(0.82) (1.50)
Stock volatility 0.176***
0.193***
(2.90) (3.16)
CEO-Chairman -0.0108 -0.0114
(-1.44) (-1.49)
CEO voting power -0.000972 -0.00109
(-1.57) (-1.62)
CEO age -0.00258***
-0.00269***
(-3.30) (-3.38)
Founder-Heir CEO -0.0497***
-0.0533***
(-2.79) (-2.89)
Nonemployee blockholders 0.0133 0.0129
(1.53) (1.43)
Constant 0.0696 0.0358
(0.92) (0.48)
Observations 7075 7039
Adj. R2 0.059 0.056

52
Table 5: Identifying the treatment effect of the board independence rule (1996-2009)
This table is estimated using the matched sample of treatment and control firms defined by the board independence rule. The dependent variable is an indicator
for forced CEO turnover in year t. We exclude forced CEO turnovers that resulted from punishment for violations because poor firm performance is not the main
reason for these turnovers. TreatBod and TreatNom are the treatment indicators for the rule requiring an independent board and a fully independent nominating
committee respectively. In columns 1 and 2, Post equals to one in year 2005 and onwards and zero otherwise. In columns 3 and 4, Post is defined for each rule
and it changes from zero to one in the actual year the firm become compliant with that rule. Performance is measured in year t-1 by either market-adjusted stock
returns or industry-adjusted change in EBIT as indicated in each column. Industries are defined by Fama and French (1997) 48 industry groups. Unreported
interactions between year fixed effects and Performance are included in all the columns. Each column also includes CEO tenure (in years), firm and year fixed
effects. All other independent variables are defined in Appendix 1 and measured in year t-1. Standard errors are clustered at the firm level. T-statistics for two-
sided tests are in parentheses and ***, **, and * denote significance at the 1, 5 and 10 percent levels, respectively.
2005 Cut-off Rule Specific Cut-off Large Increase in Indep
Stock Return Change in EBIT Stock Return Change in EBIT Stock Return Change in EBIT
(1) (2) (3) (4) (5) (6)
Post × TreatBod 0.0226**
0.0235**
0.0184* 0.0169
* 0.0304
** 0.0293
**
(2.02) (2.11) (1.76) (1.71) (2.31) (2.27)
TreatBod × Performance -0.00519 0.106 0.000740 0.143 0.00484 0.0781
(-0.48) (0.76) (0.07) (1.05) (0.43) (0.48)
Post × TreatBod × Performance -0.0380 -0.416 -0.0578**
-0.482* -0.0691
* -0.665
*
(-1.42) (-1.39) (-2.35) (-1.89) (-1.87) (-1.73)
Post × TreatNom 0.0126 0.0104 0.00714 0.00526 0.0117 0.00954
(1.48) (1.27) (0.95) (0.73) (1.33) (1.12)
TreatNom × Performance 0.0477***
0.288* 0.0459
*** 0.325
** 0.0520
*** 0.305
*
(3.87) (1.91) (3.80) (2.15) (4.05) (1.80)
Post × TreatNom × Performance -0.0553***
-0.360 -0.0366* -0.419
** -0.0635
*** -0.394
(-2.98) (-1.48) (-1.92) (-2.03) (-3.24) (-1.50)
Log of sales 0.00608 0.0125* 0.00617 0.0129
* 0.00490 0.0118
(0.92) (1.91) (0.93) (1.96) (0.67) (1.63)
Stock volatility 0.171***
0.186***
0.172***
0.186***
0.171***
0.186***
(3.22) (3.48) (3.23) (3.49) (3.04) (3.27)
CEO-Chairman -0.0122* -0.0131
* -0.0120
* -0.0131
* -0.0122
* -0.0133
*
(-1.73) (-1.84) (-1.70) (-1.85) (-1.67) (-1.80)
CEO voting power -0.000784* -0.000863
* -0.000800
* -0.000873
* -0.00110
* -0.00120
*
(-1.78) (-1.85) (-1.80) (-1.86) (-1.87) (-1.92)
CEO age -0.00139**
-0.00147**
-0.00141**
-0.00149**
-0.00135* -0.00136
*
(-2.10) (-2.17) (-2.13) (-2.20) (-1.91) (-1.86)
Founder-Heir CEO -0.0443***
-0.0456***
-0.0445***
-0.0468***
-0.0426**
-0.0438**

53
(-2.73) (-2.77) (-2.75) (-2.84) (-2.41) (-2.44)
Nonemployee blockholders 0.0122* 0.0122 0.0120 0.0121 0.0112 0.0111
(1.66) (1.60) (1.63) (1.60) (1.40) (1.35)
Constant 0.00900 -0.0352 0.00949 -0.0367 0.0171 -0.0343
(0.15) (-0.57) (0.16) (-0.59) (0.25) (-0.51)
Observations 8756 8718 8756 8718 7874 7836
Adj. R2 0.054 0.049 0.054 0.050 0.053 0.049

54
Table 6: Direct CEO influence over director nomination and the nominating committee independence
effect (1996-2009)
This table is estimated using firms that do not have a fully independent nominating committee in year 2001.
Firms in which the CEO is on the nominating committee in year 2001 is matched with those in which the CEO is
not on the nominating committee using a propensity score model similar to that for matching firms with and
without a fully independent nominating committee in year 2001. The dependent variable is an indicator for
forced CEO turnover in year t. We exclude forced CEO turnovers that resulted from punishment for violations
because poor firm performance is not the main reason for these turnovers. CEO on Nom equals to one if the CEO
is on the nominating committee in year 2001 and zero otherwise. Post is the post-treatment period indicators for
the rule requiring a fully independent nominating committee. Performance is measured in year t-1 by either
market-adjusted stock returns or industry-adjusted change in EBIT as indicated in each column. Industries are
defined by Fama and French (1997) 48 industry groups. Unreported interactions between year fixed effects and
Performance are included in both columns. Each column also includes CEO tenure (in years), firm and year
fixed effects. All other independent variables are defined in Appendix 1 and measured in year t-1. Standard
errors are clustered at the firm level. T-statistics for two-sided tests are in parentheses and ***, **, and * denote
significance at the 1, 5 and 10 percent levels, respectively.
Stock Return Change in EBIT
(1) (2)
Post × CEO on Nom 0.0122 0.0138
(1.10) (1.24)
CEO on Nom × Performance 0.0292* 0.272
(1.70) (1.20)
Post × CEO on Nom × Performance -0.0706**
-0.545
(-2.00) (-1.05)
Log of sales 0.0140 0.0190*
(1.52) (1.86)
Stock volatility 0.192**
0.243**
(2.06) (2.53)
CEO-Chairman -0.0214* -0.0217
**
(-1.96) (-1.97)
CEO voting power -0.00161**
-0.00181**
(-2.29) (-2.19)
CEO age -0.000951 -0.00105
(-1.03) (-1.07)
Founder-Heir CEO -0.0495 -0.0530
(-1.43) (-1.49)
Nonemployee blockholders 0.00936 0.0111
(0.82) (0.93)
Constant -0.0622 -0.101
(-0.70) (-1.08)
Observations 3179 3151
Adj. R2 0.082 0.074

55
Table 7: Distance from the majority independent requirement and the board independence effect
This table examines the treatment effect of the board independence rule in the subsamples of noncompliant firms
that had below (columns 1 and 2) and above (columns 3 and 4) the sample median percentage of independence
directors on the board in year 2001 separately. The dependent variable is an indicator for forced CEO turnover in
year t. We exclude forced CEO turnovers that resulted from punishment for violations because poor firm
performance is not the main reason for these turnovers. Treat and Post are the treatment and post-treatment
period indicators. Performance is measured in year t-1 by either market-adjusted stock returns or industry-
adjusted change in EBIT as indicated in the header of each column. Industries are defined by Fama and French
(1997) 48 industry groups. Unreported interactions between year fixed effects and Performance are included in
all four columns. Each column also includes CEO tenure (in years), firm and year fixed effects. All other
independent variables are defined in Appendix 1 and measured in year t-1. Standard errors are clustered at the
firm level. T-statistics for two-sided tests are in parentheses and ***, **, and * denote significance at the 1, 5
and 10 percent levels, respectively.
Independence<0.43 in 2001 Independence>=0.43 in 2001
Stock Return Change in EBIT Stock Return Change in EBIT
(1) (2) (3) (4)
Post × Treat 0.0260* 0.0290
* 0.0108 0.0107
(1.71) (1.85) (0.67) (0.69)
Treat × Performance 0.0143 0.259 0.0191 0.177
(0.96) (1.37) (1.22) (0.83)
Post × Treat × Performance -0.0806**
-0.785* -0.0272 -0.181
(-1.99) (-1.77) (-0.88) (-0.53)
Log of sales 0.00712 0.0142* 0.0179
*** 0.0218
***
(0.81) (1.71) (2.71) (3.22)
Stock volatility 0.149**
0.170**
0.173**
0.197***
(2.28) (2.54) (2.58) (2.97)
CEO-Chairman -0.0139 -0.0147 -0.0119 -0.0120
(-1.52) (-1.58) (-1.48) (-1.47)
CEO voting power -0.000872 -0.00102 -0.00146 -0.00163
(-1.38) (-1.52) (-1.56) (-1.58)
CEO age -0.000657 -0.000638 -0.00128* -0.00130
*
(-0.75) (-0.71) (-1.71) (-1.68)
Founder-Heir CEO -0.0503***
-0.0492**
-0.0569***
-0.0568***
(-2.60) (-2.50) (-2.90) (-2.81)
Nonemployee blockholders 0.0172* 0.0176
* 0.0114 0.0126
(1.73) (1.72) (1.24) (1.32)
Constant -0.0299 -0.0839 -0.0849 -0.114*
(-0.37) (-1.07) (-1.30) (-1.71)
Observations 5612 5577 5898 5863
Adj. R2 0.066 0.062 0.069 0.062

56
Table 8: Nonlinear treatment effects
This table is estimated using the same samples as columns 1 through 4 of Table 3. The dependent variable is an indicator for forced CEO turnover in year t. We
exclude forced CEO turnovers that resulted from punishment for violations because poor firm performance is not the main reason for these turnovers. Firm
performance is measured in year t-1 by either market-adjusted stock returns or industry-adjusted change in EBIT as indicated in each column. Industries are
defined by Fama and French (1997) 48 industry groups. Q1 and Q2 are indicators for the bottom two quintiles of firm performance in columns 1 through 4 and
bottom two deciles of firm performance in columns 5 through 8. To save space, we do not report terms beyond the bottom two quintiles or deciles of firm
performance. Post is the post-treatment period indicator. It equals to 1 after 2005 (inclusive) and 0 before 2005. Unreported interactions between year fixed
effects and firm performance quintiles or deciles are included in all the columns. Each column also includes CEO tenure (in years), firm and year fixed effects.
All other independent variables are defined in Appendix 1 and measured in year t-1. Standard errors are clustered at the firm level. T-statistics for two-sided tests
are in parentheses and ***, **, and * denote significance at the 1, 5 and 10 percent levels, respectively.
Board Nom Com Board Nom Com
Stock
Return
Change in
EBIT
Stock
Return
Change in
EBIT
Stock
Return
Change in
EBIT
Stock
Return
Change in
EBIT
(1) (2) (3) (4) (5) (6) (7) (8)
Treat × Q1 -0.0191 -0.0243 -0.0438**
-0.0193 0.00228 -0.00610 -0.0636**
-0.0592*
(-1.02) (-1.36) (-2.53) (-0.92) (0.08) (-0.18) (-2.41) (-1.67)
Treat × Q2 -0.000793 0.000238 0.0143 0.0246 -0.0217 -0.0138 -0.0333 0.00870
(-0.05) (0.02) (1.07) (1.48) (-0.84) (-0.68) (-1.51) (0.32)
- - - - - - - - -
Post × Treat × Q1 0.104***
0.0809**
0.0824***
0.0449* 0.105 0.0965 0.114
*** 0.0803
*
(2.80) (2.43) (3.39) (1.78) (1.39) (1.61) (2.76) (1.72)
Post × Treat × Q2 0.0103 0.0143 -0.00741 -0.00433 0.123***
0.0647 0.0625**
0.0179
(0.42) (0.67) (-0.43) (-0.28) (2.73) (1.57) (2.19) (0.60)
- - - - - - - - -
Log of sales 0.00661 0.0105 0.0131**
0.0171***
0.00673 0.0104 0.0134**
0.0175***
(0.97) (1.56) (2.38) (3.02) (0.99) (1.51) (2.44) (3.04)
Stock volatility 0.140**
0.158***
0.135**
0.164***
0.129**
0.154***
0.124**
0.154***
(2.53) (2.96) (2.23) (2.84) (2.32) (2.85) (2.02) (2.61)
CEO-Chairman -0.0129* -0.0119
* -0.0137
* -0.0125
* -0.0126
* -0.0118
* -0.0130
* -0.0125
*
(-1.85) (-1.68) (-1.88) (-1.68) (-1.80) (-1.67) (-1.80) (-1.68)
CEO voting power -0.000784* -0.000953
** -0.000867
* -0.00111
** -0.000644 -0.000970
** -0.000725 -0.00121
**
(-1.81) (-2.04) (-1.77) (-2.02) (-1.45) (-2.05) (-1.46) (-2.19)
CEO age -0.00149**
-0.00145**
-0.00187***
-0.00185**
-0.00157**
-0.00145**
-0.00193***
-0.00184**
(-2.22) (-2.11) (-2.64) (-2.54) (-2.34) (-2.09) (-2.76) (-2.50)

57
Founder-Heir CEO -0.0471***
-0.0482***
-0.0456**
-0.0498***
-0.0503***
-0.0475***
-0.0467***
-0.0477***
(-2.94) (-2.91) (-2.53) (-2.72) (-3.17) (-2.87) (-2.59) (-2.60)
Nonemployee blockholders 0.0100 0.0108 0.0119 0.0118 0.0105 0.0115 0.0125 0.0119
(1.36) (1.43) (1.47) (1.42) (1.43) (1.50) (1.53) (1.42)
Constant -0.00136 -0.0235 -0.0310 -0.0556 -0.0299 -0.0319 -0.0631 -0.0630
(-0.02) (-0.36) (-0.54) (-0.92) (-0.46) (-0.50) (-1.09) (-1.07)
Observations 8756 8718 8413 8370 8756 8718 8413 8370
Adj. R2 0.055 0.048 0.057 0.051 0.058 0.048 0.063 0.055

58
Table 9: Treatment effect and information costs
This table reports coefficient estimates of the triple interaction term in regressions similar to those in columns 1
through 4 of table 3 estimated using matched high and low information cost subsamples defined by each of the
following two information cost variables: market-to-book ratio and idiosyncratic stock return volatility. Within
each high and low subsample, we match treatment firms with control firms using the same propensity score
matching method as in table 3. Treat (TreatNom) equals to 1 if a firm is noncompliant with the board
independence rule (nominating committee independence rule) in 2001 and equals to 0 otherwise. Post is the
post-treatment period indicator. It equals to 1 after 2005 (inclusive) and 0 before 2005. Firm performance is
measured in year t-1 by either market-adjusted stock returns (Stock Return) or industry-adjusted change in EBIT
(∆EBIT). Industries are defined by Fama and French (1997) 48 industry groups. Unreported interactions between
year fixed effects and Stock Return or ∆EBIT are included in all four columns. Each column also includes CEO
tenure (in years), firm and year fixed effects. Standard errors are clustered at the firm level. T-statistics for two-
sided tests are in parentheses and ***, **, and * denote significance at the 1, 5 and 10 percent levels,
respectively.
Market-to-Book Idiosyncratic Volatility
Low High Low High
(1) (2) (3) (4)
Post × Treat × Stock Return -0.0811** -0.0231 -0.0663* -0.0452
(-1.99) (-0.53) (-1.80) (-1.06)
N 4040 3564 5262 2620
Adjusted R2
0.083 0.029 0.031 0.066
Post × Treat × ∆EBIT -0.464 -0.637 -0.833* -0.212
(-0.82) (-1.43) (-1.88) (-0.50)
N 4011 3562 5233 2619
Adjusted R2
0.075 0.037 0.030 0.064
Post × TreatNom × Stock Return -0.0768*** -0.00320 -0.0581**
-0.0501
(-2.89) (-0.10) (-2.54) (-1.34)
N 4034 3368 5120 2368
Adjusted R2
0.073 0.045 0.039 0.061
Post × TreatNom × ∆EBIT -0.269 -0.431 -0.754**
-0.367
(-0.70) (-1.26) (-2.47) (-0.73)
N 3399 2845 4981 2365
Adjusted R2
0.077 0.070 0.025 0.059

59
Table 10: Independent director monitoring and other monitoring mechanisms
We estimate CEO turnover regressions specified in equation (1) within subsamples of firms defined by whether a firm has at least one nonemployee blockholder
on the board in year 2001 and whether a firm has proportion of ownership by top five institutional investors or institutional ownership HHI below or above the
sample medians in year 2001. Treat (TreatNom) equals to 1 if a firm is noncompliant with the board independence rule (nominating committee independence
rule) in 2001 and equals to 0 otherwise. Post is the post-treatment period indicator. It equals to 1 after 2005 (inclusive) and 0 before 2005. Firm performance is
measured in year t-1 by either market-adjusted stock returns or industry-adjusted change in EBIT. Industries are defined by Fama and French (1997) 48 industry
groups. Unreported interactions between year fixed effects and Performance are included in all four columns. Each column also includes CEO tenure (in years),
firm and year fixed effects. Standard errors are clustered at the firm level. T-statistics for two-sided tests that the coefficient estimate equals zero are in
parentheses and ***, **, and * denote significance at the 1, 5 and 10 percent levels, respectively.
Nonemployee Blockholder Top 5 Institutional Ownership Institutional Ownership HHI
No Yes Low High Low High
(1) (2) (3) (4) (5) (6)
Panel A:
Treat × Stock Return 0.0223* -0.00972 0.0241** 0.00440 0.0175 0.00888
(1.67) (-0.48) (2.21) (0.22) (1.14) (0.54)
Post × Treat × Stock Return -0.0822** -0.0371 -0.0648* -0.0473 -0.0654 -0.0556
(-2.16) (-0.83) (-1.67) (-1.10) (-1.64) (-1.27)
Observations 5702 2186 4730 3046 4593 3150
Adj. R2 0.035 0.105 0.028 0.072 0.032 0.060
Treat × ∆EBIT 0.303* -0.00000 0.511** -0.0114 0.478*** 0.0113
(1.68) (-0.00) (2.54) (-0.05) (2.67) (0.05)
Post × Treat × ∆EBIT -0.908* -0.376 -0.729* -0.391 -0.651* -0.468
(-1.92) (-0.88) (-1.80) (-0.77) (-1.67) (-0.94)
Observations 5675 2175 4712 3026 4573 3132
Adj. R2 0.038 0.102 0.030 0.072 0.034 0.060
Panel B:
TreatNom × Stock Return 0.0342** 0.0343 0.0283* 0.0310 0.0215 0.0246
(2.35) (1.11) (1.88) (1.42) (1.43) (1.20)
Post × TreatNom × Stock Return -0.0553** -0.0615 -0.0737** -0.0304 -0.0631** -0.0222
(-2.47) (-1.42) (-2.29) (-0.92) (-2.19) (-0.64)
Observations 5735 1571 4216 2600 4357 2570
Adj. R2 0.038 0.060 0.028 0.054 0.031 0.051
TreatNom × ∆EBIT 0.454** -0.322 0.285 0.0869 0.328* -0.0128

60
(2.54) (-0.87) (1.50) (0.40) (1.84) (-0.06)
Post × TreatNom × ∆EBIT -0.661** 0.319 -0.599 -0.121 -0.552* 0.0529
(-2.20) (0.55) (-1.59) (-0.40) (-1.67) (0.18)
Observations 5723 1558 4205 2579 4344 2562
Adj. R2 0.041 0.058 0.031 0.056 0.034 0.052

61
Table 11: Robustness analysis
This table presents results from a series of robustness checks. Panel A and B present results from estimating
equation (1) after we add a measure of pay-performance sensitivity, PPS and its interaction with firm
performance to it. PPS is measured by the delta of the CEO’ portfolio of equity and options in the firm in
columns 1 and 2 and by the ratio of equity-based over nonequity-based pay in columns 3 and 4, all measured at
the end of the year prior to the CEO turnover. Panel C and D present results from estimating equation (1) using
samples that are constructed with two alternative specifications of the propensity score model. In columns 1 and
2, treatment and control firms are matched on firm size, market-to-book ratio, stock return volatility, E-index and
industry (in panel D when studying nominating committee independence, we also match on the fraction of
independent directors on the board), in columns 3 and 4, treatment and control firms are matched on firm size
and industry only. In panel E, we examine whether our main results are driven by the misclassification of some
compliant firms as noncompliant due to our use of the stricter RiskMetrics definition of independence. To do so,
we redefine treatment and control firms using stricter standards for noncompliance. Specifically, we only define
firms with less than the sample median percentage (43%) of independent directors on the board in 2001 as
noncompliant with the board independence rule. Similarly, we only define firms with less than the sample
median percentage (66%) of independent directors on the nominating committee in 2001 as noncompliant with
the full nominating committee independence rule. In panel F, we exclude all firms that are still noncompliant
with the board independence and nominating committee independence rules in year 2005. In panels E and F,
columns 1 and 2 report results for the board independence rule, while columns 3 and 4 report results for the
nominating committee independence rule. We exclude observations in the transition years of 2003 and 2004 to
reduce noise in the sample. In all panels, the dependent variable is an indicator for forced CEO turnover in year t.
We exclude forced CEO turnovers that resulted from punishment for violations because poor firm performance
is not the main reason for these turnovers. Treat and Post are the treatment and post-treatment period indicators
for the specific rule under study. Performance is measured in year t-1 by either market-adjusted stock returns or
industry-adjusted change in EBIT as indicated in each column. Industries are defined by Fama and French
(1997) 48 industry groups. Unreported interactions between year fixed effects and Performance are included in
all the columns. Each column also includes CEO tenure (in years), firm and year fixed effects. Standard errors
are clustered at the firm level. T-statistics for two-sided tests are in parentheses and ***, **, and * denote
significance at the 1, 5 and 10 percent levels, respectively.
Stock Return Change in EBIT Stock Return Change in EBIT
(1) (2) (3) (4)
Panel A: Board independence effect controlling for pay-performance sensitivity
Post × Treat 0.0329***
0.0316***
0.0259**
0.0263**
(2.94) (2.88) (2.40) (2.45)
Treat × Performance 0.00999 0.118 0.00868 0.187
(1.05) (0.86) (0.76) (1.32)
Post × Treat × Performance -0.0742***
-0.673**
-0.0562**
-0.519*
(-2.73) (-2.31) (-2.11) (-1.79)
PPS -0.0137***
-0.0172***
-0.0117**
-0.0122**
(-3.71) (-4.77) (-2.31) (-2.42)
PPS × Performance 0.00394 0.0603* -0.000809 0.0842
(1.48) (1.65) (-0.11) (1.34)
Panel B: Nominating committee independence effect controlling for pay-performance sensitivity
Post × Treat 0.0140 0.0100 0.0150 0.00942
(1.58) (1.26) (1.63) (1.15)
Treat × Performance 0.0198* 0.270
* 0.0297
** 0.309
**
(1.71) (1.80) (2.39) (1.99)
Post × Treat × Performance -0.0427**
-0.607***
-0.0482**
-0.527**
(-2.51) (-2.86) (-2.53) (-2.24)

62
PPS -0.0137***
-0.0169***
-0.0139**
-0.0138***
(-3.48) (-4.53) (-2.40) (-2.62)
PPS × Performance 0.00123 0.0306 0.00111 0.0862
(0.40) (0.85) (0.15) (1.32)
Panel C: Board independence effect using alternative propensity score models
Post × Treat 0.0145 0.0153 0.00688 0.00565
(1.26) (1.34) (0.64) (0.52)
Treat × Performance 0.00861 0.202 0.00408 0.0301
(0.74) (1.33) (0.38) (0.21)
Post × Treat × Performance -0.0456* -0.488
* -0.0381
* -0.355
(-1.83) (-1.78) (-1.83) (-1.54)
Panel D: Nominating committee independence effect using alternative propensity score models
Post × Treat 0.0191* 0.0136 0.0171
* 0.0116
(1.95) (1.57) (1.81) (1.40)
Treat × Performance 0.0327**
0.440***
0.0333***
0.394***
(2.47) (2.65) (2.78) (2.79)
Post × Treat × Performance -0.0523***
-0.585**
-0.0473***
-0.476**
(-2.93) (-2.49) (-2.76) (-2.39)
Panel E: Using stricter standards for noncompliance
Post × Treat 0.0256* 0.0276
* 0.0158 0.00867
(1.78) (1.87) (1.60) (0.99)
Treat × Performance 0.0128 0.203 0.0428***
0.488***
(0.93) (1.11) (3.53) (3.26)
Post × Treat × Performance -0.0794**
-0.791* -0.0684
*** -0.493
*
(-2.07) (-1.89) (-3.68) (-1.94)
Panel F: Excluding firms that are still noncompliant in year 2005
Post × Treat 0.0292**
0.0295**
0.0194* 0.0127
(2.54) (2.58) (1.72) (1.25)
Treat × Performance 0.00762 0.165 0.0372***
0.360**
(0.66) (1.12) (2.64) (1.99)
Post × Treat × Performance -0.0639**
-0.533* -0.0582
*** -0.617
**
(-2.14) (-1.77) (-2.62) (-2.20)
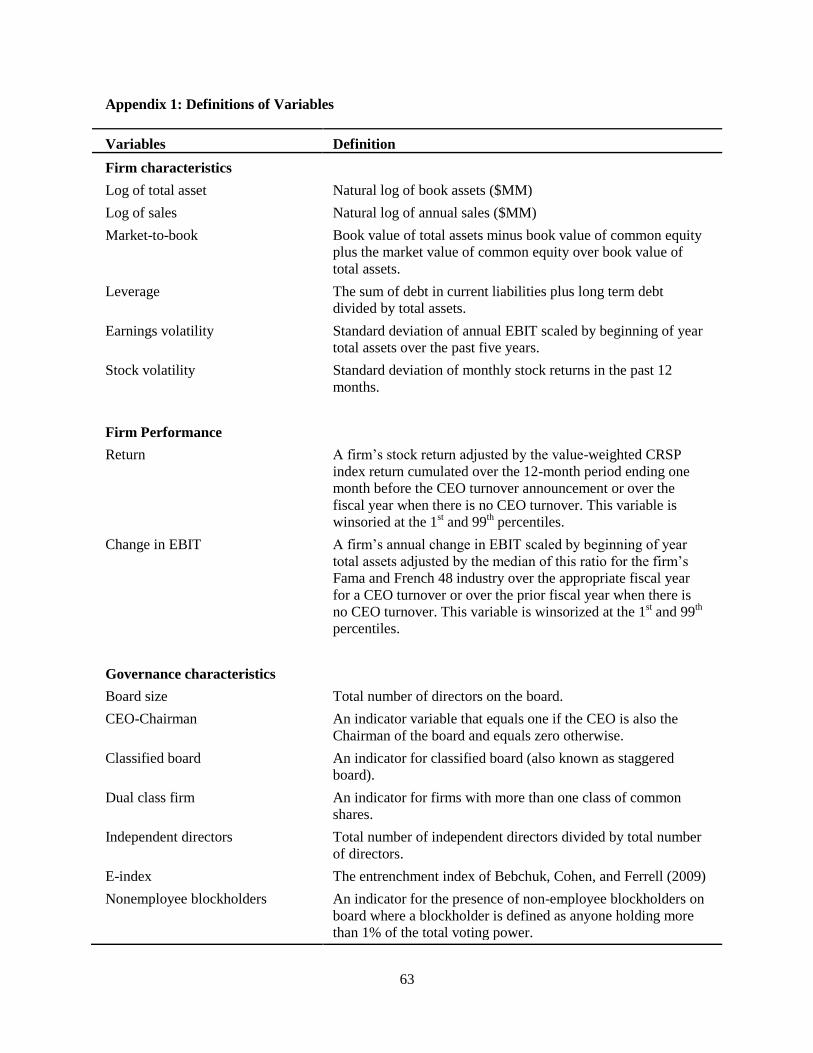
63
Appendix 1: Definitions of Variables
Variables Definition
Firm characteristics
Log of total asset Natural log of book assets ($MM)
Log of sales Natural log of annual sales ($MM)
Market-to-book Book value of total assets minus book value of common equity
plus the market value of common equity over book value of
total assets.
Leverage The sum of debt in current liabilities plus long term debt
divided by total assets.
Earnings volatility Standard deviation of annual EBIT scaled by beginning of year
total assets over the past five years.
Stock volatility Standard deviation of monthly stock returns in the past 12
months.
Firm Performance
Return A firm’s stock return adjusted by the value-weighted CRSP
index return cumulated over the 12-month period ending one
month before the CEO turnover announcement or over the
fiscal year when there is no CEO turnover. This variable is
winsoried at the 1st and 99
th percentiles.
Change in EBIT A firm’s annual change in EBIT scaled by beginning of year
total assets adjusted by the median of this ratio for the firm’s
Fama and French 48 industry over the appropriate fiscal year
for a CEO turnover or over the prior fiscal year when there is
no CEO turnover. This variable is winsorized at the 1st and 99
th
percentiles.
Governance characteristics
Board size Total number of directors on the board.
CEO-Chairman An indicator variable that equals one if the CEO is also the
Chairman of the board and equals zero otherwise.
Classified board An indicator for classified board (also known as staggered
board).
Dual class firm An indicator for firms with more than one class of common
shares.
Independent directors Total number of independent directors divided by total number
of directors.
E-index The entrenchment index of Bebchuk, Cohen, and Ferrell (2009)
Nonemployee blockholders An indicator for the presence of non-employee blockholders on
board where a blockholder is defined as anyone holding more
than 1% of the total voting power.

64
Variables Definition
Insider and linked vote Proportion of voting power held by inside and linked directors,
including the CEO.
CEO characteristics
CEO age CEO age at the time of the CEO turnover announcement.
CEO voting power The percentage of votes held by the CEO as defined by
RiskMetrics.
Founder-Heir CEO An indicator variable for whether the CEO is the founders or
heirs of founders of the firm.
Insider-linked voting The percentage of votes held by insider and linked (gray)
directors as defined by RiskMetrics.
Log CEO tenure Natural log of one plus CEO tenure in years.
CEO Compensation
Total Compensation Total compensation ($000s) (Execucomp variable tdc1)
Delta Dollar change in wealth associated with a 1% increase in the
firm’s stock price ($000s)
Equity-to-nonequity pay The sum of value of stock and option grants divided by total
compensation minus the sum of value of stock and option
grants.

65
Appendix 2: Coefficient estimates of the propensity score models
The table reports the coefficient estimates of the probit models used to predict membership in the treatment
group defined by the new listing rules on board independence (column 1), nominating committee independence
(column 2), audit committee independence (column 3) and compensation committee independence (column 4)
respectively. The dependence variables are Treat, Treat_Nom, Treat_Aud and Treat_Com. They indicate
membership in the treatment groups defined by the board independence, and full nominating committee, audit
committee and compensation committee independence rules in year 2001 respectively. All independent variables
are defined in Appendix 1. The sample consists of all firm years observations from 1996 to 2000 in our full
sample. The numbers in parentheses are t-statistics and ***, **, and * denote significance at the 1, 5 and 10
percent levels, respectively.
(1) (2) (3) (4)
Dependent Variable Treat Treat_Nom Treat_Aud Treat_Com
Log of total assets -0.118***
-0.0872***
0.0824***
-0.0549***
(-6.08) (-4.94) (4.73) (-3.07)
Market-to-book ratio -0.0264* 0.0110 0.0104 0.00661
(-1.92) (0.77) (0.85) (0.52)
Stock volatility 1.264**
3.141***
-1.369**
-0.454
(2.27) (4.74) (-2.52) (-0.93)
Independent directors (%) -3.012***
-2.556***
-2.727***
(-18.96) (-17.54) (-18.12)
E-index -0.160***
-0.0129 0.0190 -0.0526***
(-7.85) (-0.70) (1.05) (-2.77)
Dual class firms -0.0239 0.358***
-0.0904 -0.392***
(-0.26) (3.61) (-1.02) (-4.17)
CEO-Chairman -0.278***
-0.176***
-0.0612 -0.241***
(-4.72) (-3.15) (-1.14) (-4.37)
Insider and linked vote 0.0146***
0.00380 -0.00271* 0.000335
(9.03) (1.63) (-1.71) (0.19)
Nonemployee blockholder 0.0798 0.190***
0.311***
0.163***
(1.37) (3.24) (5.74) (2.92)
Log of CEO tenure 0.0933* 0.130
*** 0.110
** -0.00510
(1.69) (2.61) (2.22) (-0.10)
Founder-Heir CEO 0.351***
0.157**
-0.0789 -0.0547
(4.87) (1.96) (-1.07) (-0.73)
CEO age 0.0127***
-0.00484 -
0.00975***
0.00470
(3.53) (-1.34) (-2.90) (1.35)
Constant -4.212 6.820 -2.876 -2.551
(-0.05) (0.07) (-0.03) (-0.02)
N 4022 4029 4017 4006
pseudo R2 0.187 0.180 0.127 0.149

66
Internet Appendix
A. Compliance between 2001 and 2005
Our sample firms that are noncompliant with the board independence requirement in 2001
became compliant by 2005 in three ways: 92% of them complied by both adding new directors and
dropping existing directors, 5% complied by retaining all existing directors, but increasing the board’s
size to accommodate additional new independent directors and the remaining 3% complied simply by
dropping some existing non-independent directors. On average, these firms add 2.8 independent
directors, 1.2 linked directors and 1.1 employee directors, while they replaced 1.5 independent
directors, 1.7 linked directors and 1.9 employee directors. Mean numbers of retained independent,
linked and employee directors are 2.6, 2.2, and 2.2 respectively (see Table A-1). As we can see, the
mean number of new independent directors is similar to the mean number of continuing independent
directors and larger than the mean number of continuing linked or employee directors.
Sample firms not complying with the independent nominating committee rule in 2001 fall into
two categories: 46% have no nominating committee and the remaining 54% have a nominating
committee that is not fully independent. Firms in the first category complied by appointing
independent directors to a newly formed nominating committee. On average, 3.6 independent directors
subsequently join the nominating committee in these 312 firms. Firms in the second category
complied with the rule in one of two ways, namely through: (1) departures of existing committee
members (3% of all treatment firms) and (2) appointments of new committee members combined with
departures of existing committee members (51% of all treatment firms).24
The mean numbers of new
and continuing committee members are 2.4 and 1.9 respectively, while the mean numbers of departing
independent, linked and inside directors are 1.7, 1.2 and 1.2 respectively (see Table I-2).
B. Substitution of forced turnover-performance for pay-performance sensitivity
24 We use the term “new” here to refer to directors who are new to the nominating committee and the term “continuing” to
refer directors who continue to serve on the nominating committee from 2001 to 2005.

67
In the Hermalin and Weisbach (1998) model, the objective of board monitoring is discover the
true ability of the CEO and replace her when her perceived ability is lower than some threshold related
to the ability of the average replacement on the market. Here, CEO turnover is not an incentive device
and thus does not substitute for CEO compensation in providing incentives. However, in reality, the
threat of forced CEO turnover can potentially also serve to mitigate moral hazard problems, such as
shirking, in a somewhat similar way to equity-based compensation. From this perspective, the forced
CEO turnover to performance sensitivity can be a substitute for the pay-performance sensitivity in
providing incentives to the CEOs. If the increase in forced CEO turnover to performance sensitivity
we document is completely driven by a shift away from using pay-performance sensitivity to using
turnover-performance sensitivity in providing incentives to CEOs in non-compliant firms relative to
compliant firms, then it would be less clear whether we can interpret the evidence as reflecting an
improvement in board monitoring. In this section, we examine this concern by controlling for change
in pay-performance sensitivity in our main regressions in Table 3. Specifically, we add a measure of
pay-performance sensitivity and its interaction with firm performance to the regressions in columns 1
through 4 in Table 3 and re-estimate them. If our prior results are completely driven by a shift between
turnover-performance sensitivity and pay-performance sensitivity, then we expect the addition of these
two terms to take away most of the statistical significance of our DiD terms.
Our first measure of pay-performance sensitivity is the delta of a CEO’s equity portfolio at the
end of each fiscal year. It equals to the dollar change in CEO wealth associated with a 1% change in
the firms’ stock price (in $000s). This measure is calculated using ExecuComp data by adding the
delta of the portfolio of options and the delta of the portfolio of shares of the CEO. The delta of the
portfolio of options is estimated using the formulae and approximation method detailed in Core and
Guay (2002). The delta of the portfolio of shares is computed as the share owned by the CEO
excluding options (i.e. SHROWN_EXCL_OPTIONS in ExecuComp) times the stock price at the
fiscal year end (i.e. PRCCF in ExecuComp) times 0.01. Our second measure of pay-performance
sensitivity is the ratio of equity-based pay over nonequity-based pay. ExecuComp changed its data
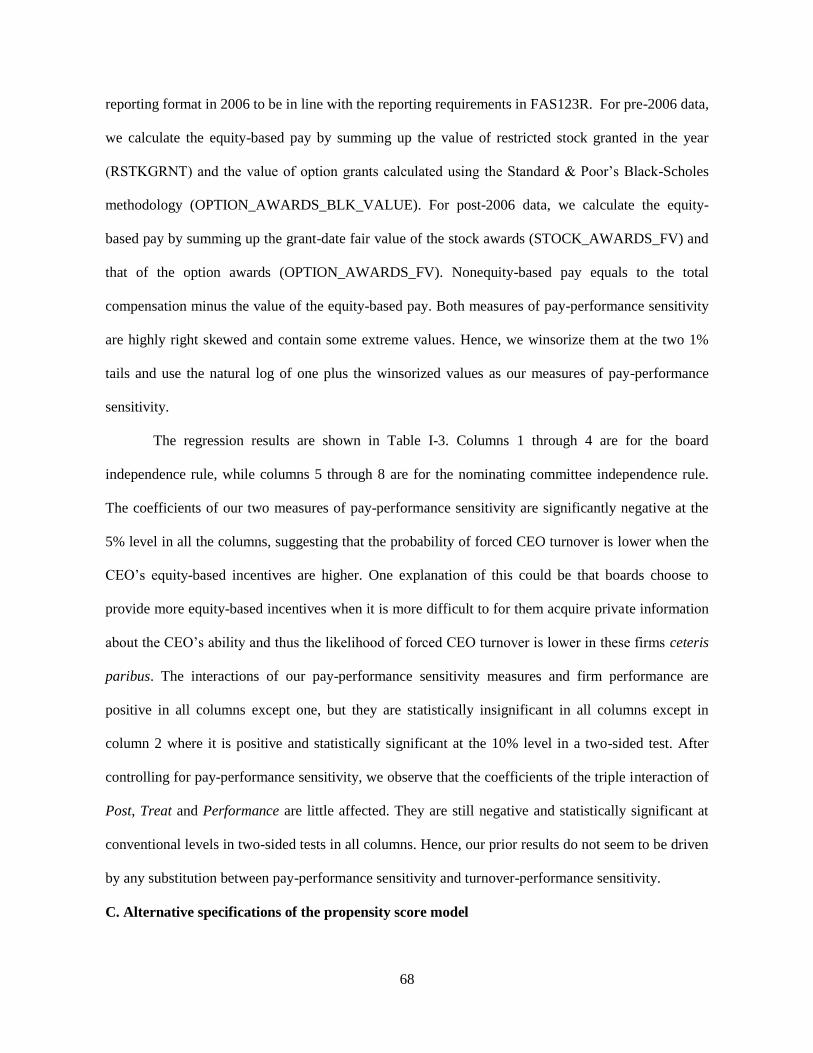
68
reporting format in 2006 to be in line with the reporting requirements in FAS123R. For pre-2006 data,
we calculate the equity-based pay by summing up the value of restricted stock granted in the year
(RSTKGRNT) and the value of option grants calculated using the Standard & Poor’s Black-Scholes
methodology (OPTION_AWARDS_BLK_VALUE). For post-2006 data, we calculate the equity-
based pay by summing up the grant-date fair value of the stock awards (STOCK_AWARDS_FV) and
that of the option awards (OPTION_AWARDS_FV). Nonequity-based pay equals to the total
compensation minus the value of the equity-based pay. Both measures of pay-performance sensitivity
are highly right skewed and contain some extreme values. Hence, we winsorize them at the two 1%
tails and use the natural log of one plus the winsorized values as our measures of pay-performance
sensitivity.
The regression results are shown in Table I-3. Columns 1 through 4 are for the board
independence rule, while columns 5 through 8 are for the nominating committee independence rule.
The coefficients of our two measures of pay-performance sensitivity are significantly negative at the
5% level in all the columns, suggesting that the probability of forced CEO turnover is lower when the
CEO’s equity-based incentives are higher. One explanation of this could be that boards choose to
provide more equity-based incentives when it is more difficult to for them acquire private information
about the CEO’s ability and thus the likelihood of forced CEO turnover is lower in these firms ceteris
paribus. The interactions of our pay-performance sensitivity measures and firm performance are
positive in all columns except one, but they are statistically insignificant in all columns except in
column 2 where it is positive and statistically significant at the 10% level in a two-sided test. After
controlling for pay-performance sensitivity, we observe that the coefficients of the triple interaction of
Post, Treat and Performance are little affected. They are still negative and statistically significant at
conventional levels in two-sided tests in all columns. Hence, our prior results do not seem to be driven
by any substitution between pay-performance sensitivity and turnover-performance sensitivity.
C. Alternative specifications of the propensity score model

69
Although our propensity score model is well motivated by existing theory and empirical evidence
on boards of directors, the exact choice of variables is not as clear cut. To verify that our results are
not driven by a particular specification, we evaluate the robustness of our main results to a number of
alternative model specifications and report two of them here. In the first variation, we restrict the
model used to predict firms noncompliant with the board independence rule to the following limited
set of explanatory variables: firm size, market-to-book ratio, monthly stock return volatility, the
entrenchment index (E-index) and industry. We add the fraction of independent directors on the board
to the model when predicting firms that are noncompliant with the nominating committee
independence rule. We exclude all governance variables except for the E-index, which tends to be
quite stable prior to SOX. In the second specification, we only include firm size and industry to predict
firms noncompliant with either rule. To facilitate a comparison with our main results, we continue to
use a 0.15 radius for propensity score matching. Table I-4 presents the results. Columns 1 through 4
are estimated using the first propensity score model specification. Examining the coefficient of the
triple interaction of Treat, Post and Performance, we find that it is negative and statistically significant
at 10% or better in all columns. Columns 5 through 8 are estimated using size and industry matching
only. The coefficient of the triple interaction is negative in all columns. It is statistically significant at
10% or better in two-sided tests in 3 out of the 4 columns. In the remaining column (column 6), it is
statistically significant at the 10% level in a one-sided test.
D. Misclassification of independent directors
In this section, we investigate whether our results are driven by the misclassification of some
noncompliant firms as compliant firms due to our use of the stricter RiskMetrics definition of
independence than the exchange definition. As we discussed before, RiskMetrics classifies all former
employees as non-independent while the exchanges consider a former employee independent if three
or more years have passed since the end of his employment. In addition, RiskMetrics consider any
business relation between a director and the firm compromises his independence while the exchanges
only do so for material business relations. Since there is no detailed data on business relations, we

70
cannot define independent directors using the exchange definition. To address this concern, we choose
to apply a stricter standard for noncompliance and re-classify our firms while using the RiskMetrics
definition of independence. Specifically, we classify a firm as noncompliant with the board
(nominating committee) independence rule only if the firm has less than the sample median percentage
of independent directors on the board (nominating committee) among noncompliant firms in year
2001. In un-tabulated results, we find the median percentage of independence directors on the board is
43% and that on the nominating committee is 66%. This should eliminate most, if not all, of the
misclassified compliant firms from our sample of noncompliant firms. We then follow the same
procedure to re-estimate models 1 - 4 in Table 3 and report the results in Table I-5. Columns 1 and 2
report results for the board independence rule, while columns 3 and 4 report results from the
nominating committee independence rule. We find the coefficient of the triple interaction of Post,
Treat and Performance is significant at 10% level or better in all the columns.
E. Controlled companies
The new exchange listing rules exempt “controlled companies” from the board and committee
independence requirements. A controlled company is defined as a firm in which an individual, a group
or another firm hold more than 50% of the total voting rights of the firm. However, since we do not
have detailed information on firm ownership to identify these controlled companies, they are not
excluded from our sample. This in general should only bias against us finding significant difference
between treatment and control firms. To make sure this is the case, in Table A6, we exclude firms in
which the percentage of independent directors on the board is below 50% and that on the nominating
committee is below 100% in 2005 from our sample. Year 2005 is the final year that all firms must
comply with the new exchange listing rules. Then, for the board independence rule and nominating
committee independence rule, we first construct a matched sample of treatment firms and control firms
from the remaining firms following the same propensity score matching procedure as before and then
re-estimate equation (1). As we can see in Table I-6, both treatment effects are still statistically
significant at conventional levels after we exclude potential controlled companies from the sample.

71
Table I-1: Board adjustments to meet the exchange listing rule requiring an independent board
between 2001 and 2005
The sample consists of 174 firms without a majority of independent directors on the board in 2001 and remains
listed to 2005. Panel A presents the percentage of firms in my sample that complied with the rule by adding,
dropping or replacing directors. Panel B presents the number, mean and median number of new arrivals,
continuing directors and departures between 2001 and 2005 per firm. The means and medians are calculated over
all firms with non-missing data in that category. “New” and “Continuing” are relative to the boards in 2001.
Panel A: Compliance by Arrivals and Departures
Only arrivals of new directors (%) 5%
Only departures of existing directors (%) 3%
Both arrivals of new directors and departures of existing directors (%) 92%
Panel B: Compliance by Director Types
Arrival Continuing Departure
Director type N Mean Median N Mean Median N Mean Median
Independent 163 2.8 3 167 2.6 3 112 1.5 1
Linked 30 1.2 1 138 2.2 2 106 1.7 1
Employee 54 1.1 1 168 2.2 2 97 1.9 1

72
Table I-2: Board adjustments to meet the exchange listing rule requiring a fully independent
nominating committee between 2001 and 2005
The sample consists of 693 firms without a nominating committee or without a fully independent one in 2001
and remains listed to 2005. Panel A presents the percentage of firms in this sample that complied by 2005 with
the fully independent nominating committee rule by adding, dropping or replacing directors. Panel B presents the
number, mean and median number of new arrivals, continuing directors and departures between 2001 and 2005
per firm. The means and medians are calculated over all firms with non-missing data in that category. “New”
“Continuing” and “Departures” are relative to the nominating committee composition in 2001.
Panel A: Compliance by Arrivals and Departures
New nominating committee (%) 46%
Only departures of existing nominating committee members (%) 3%
Both new arrivals and departures of existing nominating committee members (%) 51%
Panel B: Compliance by Director Type
N Mean Median
Firms without nominating committee in 2001
New independent directors 312 3.6 3
Firms with nominating committee in 2001
New independent directors 359 2.4 2
Continuing directors 319 1.9 2
Departures :
Independent 276 1.7 1
Linked 210 1.2 1
Employee 169 1.2 1

73
Table I-3: Controlling for substitution between pay-performance and turnover-performance sensitivity
The dependent variable is an indicator for forced CEO turnover in year t. We exclude forced CEO turnovers that resulted from punishment for violations because
they could introduce bias into the estimates. Treat and Post are the treatment and post-treatment period indicators for the rule targeting the board structure shown
in top of the column. Performance is measured in year t-1 by either market-adjusted stock returns or industry-adjusted change in EBIT as indicated in each
column. Industries are defined by Fama and French (1997) 48 industry groups. Unreported interactions between year fixed effects and Performance are included
in all the columns. PPS is measured by either the delta of the CEO’s portfolio of options and shares or the ratio of equity-based over nonequity-based pay in the
fiscal year. Each column also includes CEO tenure (in years), firm and year fixed effects. All other independent variables are defined in Appendix 1 and
measured in year t-1. Standard errors are clustered at the firm level. T-statistics for two-sided tests that the coefficient estimate equals zero are in parentheses and
***, **, and * denote significance at the 1, 5 and 10 percent levels, respectively.
Board (Delta) Board (Equity Ratio) Nom Com (Delta) Nom Com (Equity Ratio)
Stock
Return
Change in
EBIT
Stock
Return
Change in
EBIT
Stock
Return
Change in
EBIT
Stock
Return
Change in
EBIT
(1) (2) (3) (4) (5) (6) (7) (8)
Post × Treat 0.0329***
0.0316***
0.0259**
0.0263**
0.0140 0.0100 0.0150 0.00942
(2.94) (2.88) (2.40) (2.45) (1.58) (1.26) (1.63) (1.15)
Treat × Performance 0.00999 0.118 0.00868 0.187 0.0198* 0.270
* 0.0297
** 0.309
**
(1.05) (0.86) (0.76) (1.32) (1.71) (1.80) (2.39) (1.99)
Post × Treat × Performance -0.0742***
-0.673**
-0.0562**
-0.519* -0.0427
** -0.607
*** -0.0482
** -0.527
**
(-2.73) (-2.31) (-2.11) (-1.79) (-2.51) (-2.86) (-2.53) (-2.24)
PPS -0.0137***
-0.0172***
-0.0117**
-0.0122**
-0.0137***
-0.0169***
-0.0139**
-0.0138***
(-3.71) (-4.77) (-2.31) (-2.42) (-3.48) (-4.53) (-2.40) (-2.62)
PPS × Performance 0.00394 0.0603* -0.000809 0.0842 0.00123 0.0306 0.00111 0.0862
(1.48) (1.65) (-0.11) (1.34) (0.40) (0.85) (0.15) (1.32)
Log of sales 0.0145* 0.0203
*** 0.00813 0.0148
** 0.0214
*** 0.0285
*** 0.0136
** 0.0217
***
(1.92) (2.70) (1.17) (2.15) (3.68) (4.65) (2.46) (3.71)
Stock volatility 0.102**
0.112**
0.165***
0.183***
0.126**
0.122**
0.199***
0.198***
(1.98) (2.22) (3.15) (3.49) (2.21) (2.20) (3.46) (3.47)
CEO-Chairman -0.00562 -0.00540 -0.0118 -0.0125* -0.00605 -0.00661 -0.0117 -0.0134
*
(-0.83) (-0.79) (-1.64) (-1.72) (-0.87) (-0.94) (-1.58) (-1.78)
CEO voting power -0.000465 -0.000404 -0.000842* -0.000933
* -0.000544 -0.000509 -0.000949
* -0.00105
*
(-0.91) (-0.77) (-1.73) (-1.82) (-0.88) (-0.78) (-1.68) (-1.75)
CEO age -0.00103 -0.00105 -0.00155**
-0.00154**
-0.00119* -0.00128
* -0.00194
*** -0.00203
***
(-1.58) (-1.54) (-2.29) (-2.23) (-1.75) (-1.80) (-2.74) (-2.77)
Founder-Heir CEO -0.0288* -0.0277
* -0.0468
*** -0.0466
*** -0.0311
* -0.0293 -0.0492
*** -0.0485
***
(-1.74) (-1.69) (-2.87) (-2.81) (-1.71) (-1.61) (-2.72) (-2.65)
Nonemployee blockholders 0.0140* 0.0138
* 0.0125
* 0.0124 0.0168
** 0.0166
** 0.0139
* 0.0136

74
(1.93) (1.86) (1.67) (1.60) (2.10) (2.03) (1.67) (1.58)
Constant -0.0138 -0.0407 0.00973 -0.0396 -0.0537 -0.0913 -0.00416 -0.0645
(-0.22) (-0.63) (0.15) (-0.62) (-0.98) (-1.56) (-0.07) (-1.08)
Observations 8169 8136 8647 8610 7860 7831 8308 8276
Adj. R2 0.065 0.064 0.054 0.051 0.066 0.064 0.057 0.054

75
Table I-4: Robustness to the specification of the propensity score model
Treatment and control firms are matched on firm size, market-to-book ratio, stock return volatility, E-index and industry in columns 1 and 2. They are matched
on above dimensions plus the fraction of independent directors in columns 3 and 4. They are matched on firm size and industry only in columns 5 through 8. The
dependent variable is an indicator for forced CEO turnover in year t. We exclude forced CEO turnovers that resulted from punishment for violations because they
could introduce bias into the estimates. Treat and Post are the treatment and post-treatment period indicators for the rule targeting the board structure shown in
top of the column. Performance is measured in year t-1 by either market-adjusted stock returns or industry-adjusted change in EBIT as indicated in each column.
Industries are defined by Fama and French (1997) 48 industry groups. Unreported interactions between year fixed effects and Performance are included in all the
columns. Each column also includes CEO tenure (in years), firm and year fixed effects. All other independent variables are defined in Appendix 1 and measured
in year t-1. Standard errors are clustered at the firm level. T-statistics for two-sided tests are in parentheses and ***, **, and * denote significance at the 1, 5 and
10 percent levels, respectively.
Board Nom Com Board Nom Com
Stock
Return
Change in
EBIT
Stock
Return
Change in
EBIT
Stock
Return
Change in
EBIT
Stock
Return
Change in
EBIT
(1) (2) (3) (4) (5) (6) (7) (8)
Post × Treat 0.0145 0.0153 0.0191* 0.0136 0.00688 0.00565 0.0171
* 0.0116
(1.26) (1.34) (1.95) (1.57) (0.64) (0.52) (1.81) (1.40)
Treat × Performance 0.00861 0.202 0.0327**
0.440***
0.00408 0.0301 0.0333***
0.394***
(0.74) (1.33) (2.47) (2.65) (0.38) (0.21) (2.78) (2.79)
Post × Treat × Performance -0.0456* -0.488
* -0.0523
*** -0.585
** -0.0381
* -0.355 -0.0473
*** -0.476
**
(-1.83) (-1.78) (-2.93) (-2.49) (-1.83) (-1.54) (-2.76) (-2.39)
Log of sales 0.0108 0.0160**
0.00869 0.0153**
0.0135**
0.0194***
0.0124* 0.0192
***
(1.56) (2.35) (1.22) (2.22) (2.00) (2.89) (1.83) (2.89)
Stock volatility 0.148***
0.170***
0.163***
0.162***
0.147***
0.174***
0.163***
0.165***
(2.60) (2.98) (2.72) (2.73) (2.85) (3.35) (3.20) (3.25)
CEO-Chairman -0.0126* -0.0127
* -0.0122 -0.0133
* -0.0127
* -0.0127
* -0.0116 -0.0126
*
(-1.69) (-1.68) (-1.61) (-1.73) (-1.80) (-1.77) (-1.64) (-1.76)
CEO voting power -0.000642 -0.000729* -0.000639 -0.000750 -0.000590 -0.000663
* -0.000544 -0.000650
*
(-1.58) (-1.69) (-1.27) (-1.40) (-1.65) (-1.76) (-1.50) (-1.70)
CEO age -0.000773 -0.000807 -0.000723 -0.000808 -0.00102* -0.00107
* -0.00101
* -0.00108
*
(-1.18) (-1.19) (-1.11) (-1.20) (-1.68) (-1.70) (-1.67) (-1.73)
Founder-Heir CEO -0.0565***
-0.0559***
-0.0542***
-0.0531***
-0.0490***
-0.0482***
-0.0510***
-0.0493***
(-3.39) (-3.28) (-3.18) (-3.05) (-3.33) (-3.22) (-3.39) (-3.23)
Nonemployee blockholders 0.0135* 0.0138
* 0.0134 0.0141 0.0109 0.0112 0.0111 0.0111
(1.74) (1.74) (1.59) (1.63) (1.49) (1.49) (1.51) (1.48)
Constant -0.0516 -0.0901 -0.0302 -0.0817 -0.0567 -0.0983* -0.0449 -0.0966
*
(-0.83) (-1.45) (-0.47) (-1.30) (-0.96) (-1.66) (-0.76) (-1.65)
Observations 8006 7966 7436 7403 8882 8833 8853 8813
Adj. R2 0.065 0.059 0.065 0.060 0.066 0.061 0.067 0.063

76
Table I-5: Using stricter standards of noncompliance
We define firms with less than the sample median percentage (43%) of independent directors on the board in
2001 as noncompliant with the board independence rule. Similarly, we define firms with less than the sample
median percentage (66%) of independent directors on the nominating committee in 2001 as noncompliant with
the full nominating committee independence rule. We exclude observations in the transition years of 2003 and
2004 to reduce noise in the sample. The dependent variable is an indicator for forced CEO turnover in year t.
Treat and Post are the treatment and post-treatment period indicators for the rule targeting the board structure
shown in top of the column. Performance is measured in year t-1 by either market-adjusted stock returns or
industry-adjusted change in EBIT as indicated in each column. Industries are defined by Fama and French
(1997) 48 industry groups. Unreported interactions between year fixed effects and Performance are included in
all four columns. Each column also includes CEO tenure (in years), firm and year fixed effects. All other
independent variables are defined in Appendix 1 and measured in year t-1. Standard errors are clustered at the
firm level. T-statistics for two-sided tests that the coefficient estimate equals zero are in parentheses and ***, **,
and * denote significance at the 1, 5 and 10 percent levels, respectively.
Board (43% cut-off) Nom Com (66% cut-off)
Stock Return Change in EBIT Stock Return Change in EBIT
(1) (2) (3) (4)
Post × Treat 0.0256* 0.0276
* 0.0158 0.00867
(1.78) (1.87) (1.60) (0.99)
Treat × Performance 0.0128 0.203 0.0428***
0.488***
(0.93) (1.11) (3.53) (3.26)
Post × Treat × Performance -0.0794**
-0.791* -0.0684
*** -0.493
*
(-2.07) (-1.89) (-3.68) (-1.94)
Log of sales 0.00701 0.0139* 0.0143
** 0.0210
***
(0.95) (1.95) (2.38) (3.43)
Stock volatility 0.169***
0.190***
0.202***
0.195***
(2.85) (3.18) (3.20) (3.09)
CEO-Chairman -0.0119 -0.0120 -0.0118 -0.0128
(-1.49) (-1.49) (-1.45) (-1.54)
CEO voting power -0.000938 -0.00107 -0.000696 -0.000806
(-1.48) (-1.59) (-1.39) (-1.49)
CEO age -0.000630 -0.000676 -0.00114 -0.00124
(-0.88) (-0.92) (-1.50) (-1.58)
Founder-Heir CEO -0.0527***
-0.0517***
-0.0475***
-0.0453**
(-3.04) (-2.93) (-2.59) (-2.44)
Nonemployee blockholders 0.0171**
0.0175**
0.0170* 0.0172
*
(2.00) (1.99) (1.92) (1.91)
Constant -0.0342 -0.0841 -0.0605 -0.111*
(-0.50) (-1.25) (-1.02) (-1.85)
Observations 7038 7002 6587 6556
Adj. R2 0.063 0.058 0.070 0.064

77
Table I-6: Excluding controlled companies
This table presents the results estimated using only firms that complied with the exchange listing requirements
by 2005. Firms that were still noncompliant in 2005 are likely to be controlled companies so we exclude them
from the sample. Columns 1 and 2 are estimated for the board independence rule, while columns 3 and 4 are
estimated for the nominating committee independence rule. The dependent variable is an indicator for forced
CEO turnover in year t. Treat and Post are the treatment and post-treatment period indicators for the rule
targeting the board structure shown in top of the column. Performance is measured in year t-1 by either market-
adjusted stock returns or industry-adjusted change in EBIT as indicated in each column. Industries are defined by
Fama and French (1997) 48 industry groups. Unreported interactions between year fixed effects and
Performance are included in all four columns. Each column also includes CEO tenure (in years), firm and year
fixed effects. All other independent variables are defined in Appendix 1 and measured in year t-1. Standard
errors are clustered at the firm level. T-statistics for two-sided tests that the coefficient estimate equals zero are
in parentheses and ***, **, and * denote significance at the 1, 5 and 10 percent levels, respectively.
Exclude controlled companies Board Nominating Committee
Stock Return Change in EBIT Stock Return Change in EBIT
(1) (2) (3) (4)
Post × Treat 0.0292**
0.0295**
0.0194* 0.0127
(2.54) (2.58) (1.72) (1.25)
Treat × Performance 0.00762 0.165 0.0372***
0.360**
(0.66) (1.12) (2.64) (1.99)
Post × Treat × Performance -0.0639**
-0.533* -0.0582
*** -0.617
**
(-2.14) (-1.77) (-2.62) (-2.20)
Log of sales 0.00445 0.0106 0.0118* 0.0201
***
(0.63) (1.52) (1.74) (2.90)
Stock volatility 0.158***
0.177***
0.246***
0.243***
(2.85) (3.18) (3.57) (3.54)
CEO-Chairman -0.0127* -0.0134
* -0.0164
* -0.0192
**
(-1.72) (-1.79) (-1.82) (-2.10)
CEO voting power -0.00107* -0.00121
* -0.000372 -0.000379
(-1.80) (-1.93) (-0.49) (-0.45)
CEO age -0.00146**
-0.00145**
-0.00248***
-0.00271***
(-2.07) (-1.99) (-2.94) (-3.14)
Founder-Heir CEO -0.0463***
-0.0466***
-0.0411**
-0.0406**
(-2.66) (-2.63) (-2.15) (-2.05)
Nonemployee blockholders 0.0131* 0.0133 0.0147 0.0149
(1.65) (1.63) (1.46) (1.45)
Constant 0.0251 -0.0223 0.0263 -0.0294
(0.38) (-0.34) (0.36) (-0.40)
Observations 8136 8098 5976 5946
Adj. R2 0.053 0.048 0.053 0.054