Embed Size (px)
Citation preview

JRC-OECD-PLACARD-Workshop
26-28 October 2016, Paris, France
Comparison of different natural hazards and risks
in Germany
Annegret Thieken
University of Potsdam
Institute of Earth and Environmental Science
in cooperation with:
Comparison of risks – conditions and assumptions
Consistent comparison:
Comparable methods of risk analyses (e.g. upper bounds)
Same damage type (e.g. structural damage at residential buildings)
Common reference and aggregation levels (year, municipalities)
Risk metrics: FN curves, expected annual damage, 200-year damage
Absolute loss or loss per capita
No interaction between hazards Source: GRÜNTHAL, THIEKEN et al. (2006):
Comparative risk assessments for the city of
Cologne – storms, floods, earthquakes. –
Natural Hazards 38(1-2): 21-44.
Comparison of risks in the Freestate of Saxony
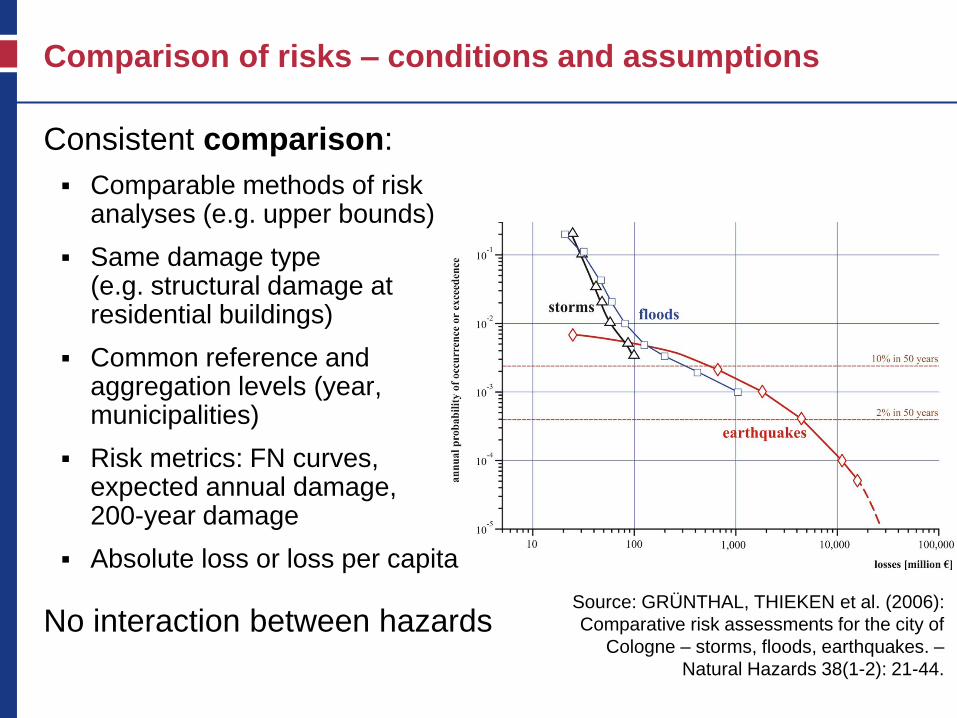
Aim
Performing a comparable risk analysis
for a bigger region (e.g. Saxony)

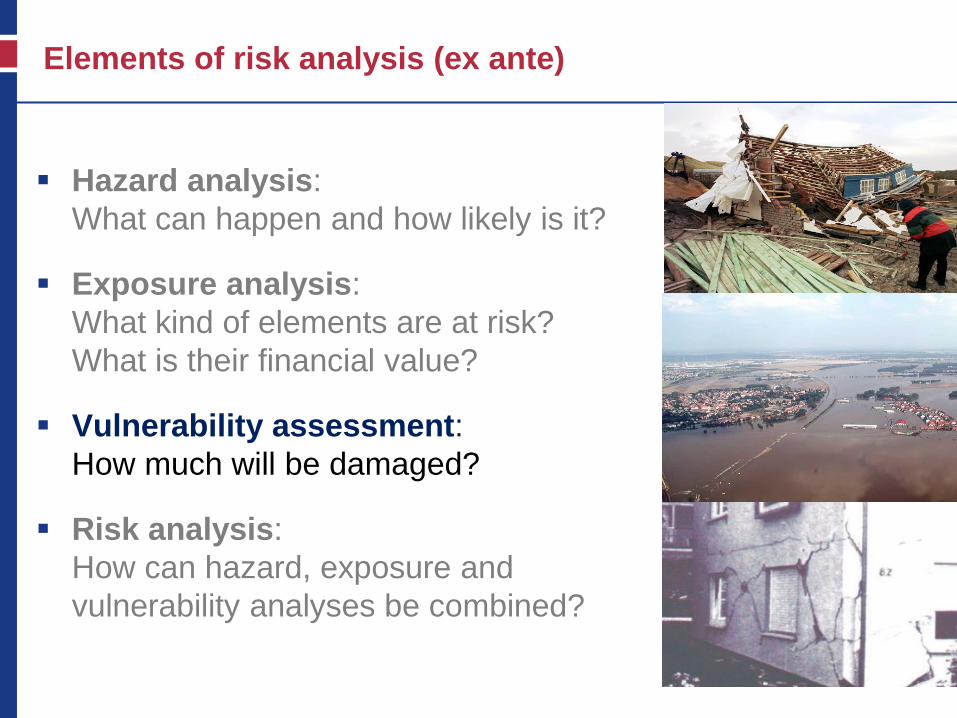
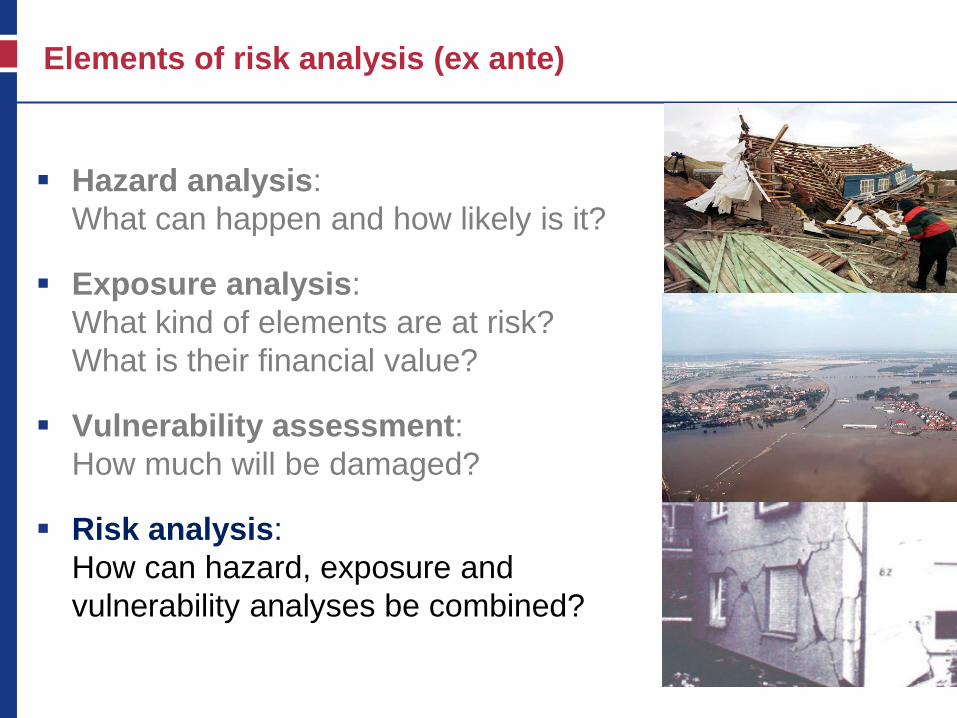
Elements of risk analysis (ex ante)
Hazard analysis:
What can happen and how likely is it?
Exposure analysis:
What kind of elements are at risk?
What is their financial value?
Vulnerability assessment:
How much will be damaged?
Risk analysis:
How can hazard, exposure and
vulnerability analyses be combined?
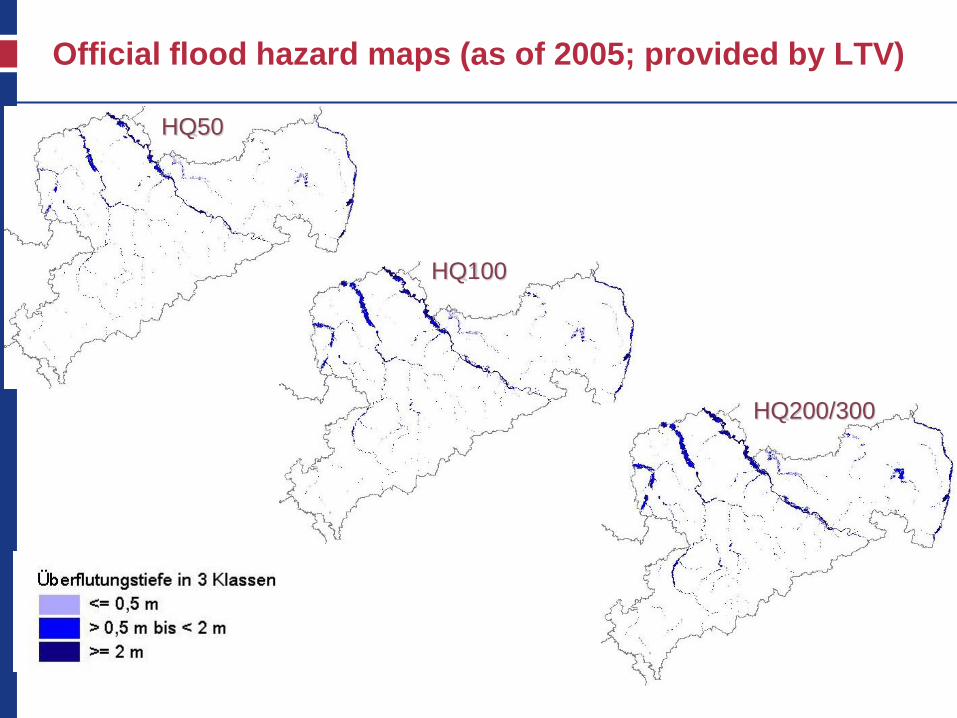
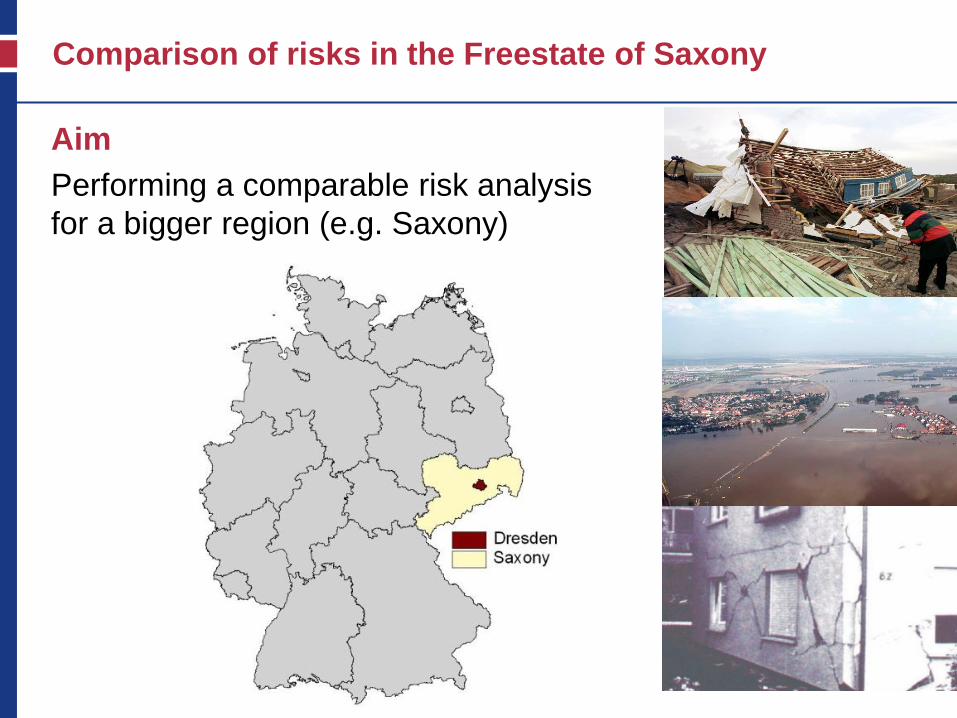
Official flood hazard maps (as of 2005; provided by LTV)
HQ50
HQ100
HQ200/300
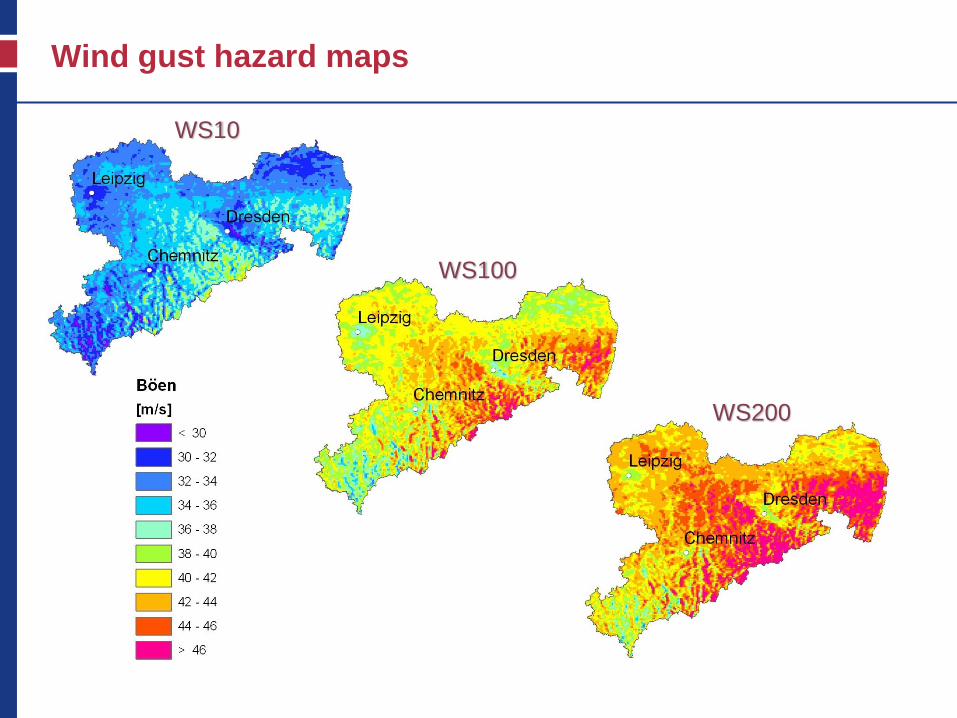
Wind gust hazard maps
WS10
WS100
WS200

Intensities
III IV V VIVII
VIII
EQ200
EQ500
EQ1000
Earthquake hazard maps

Elements of risk analysis (ex ante)
Hazard analysis:
What can happen and how likely is it?
Exposure analysis:
What kind of elements are at risk?
What is their financial value?
Vulnerability assessment:
How much will be damaged?
Risk analysis:
How can hazard, exposure and
vulnerability analyses be combined?
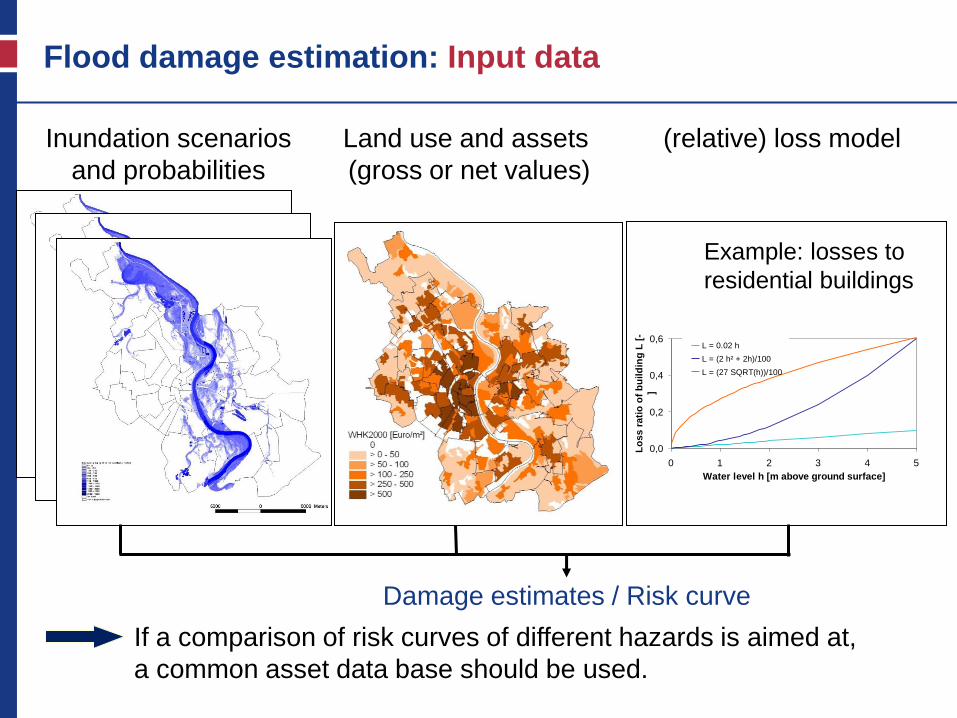
If a comparison of risk curves of different hazards is aimed at,
a common asset data base should be used.
Flood damage estimation: Input data
Damage estimates / Risk curve
Example: losses to
residential buildings
(relative) loss model Land use and assets
(gross or net values)
Inundation scenarios
and probabilities
0,0
0,2
0,4
0,6
0 1 2 3 4 5
Water level h [m above ground surface]
Lo
ss
ra
tio
of
bu
ild
ing
L [
-
]
L = 0.02 h
L = (2 h² + 2h)/100
L = (27 SQRT(h))/100
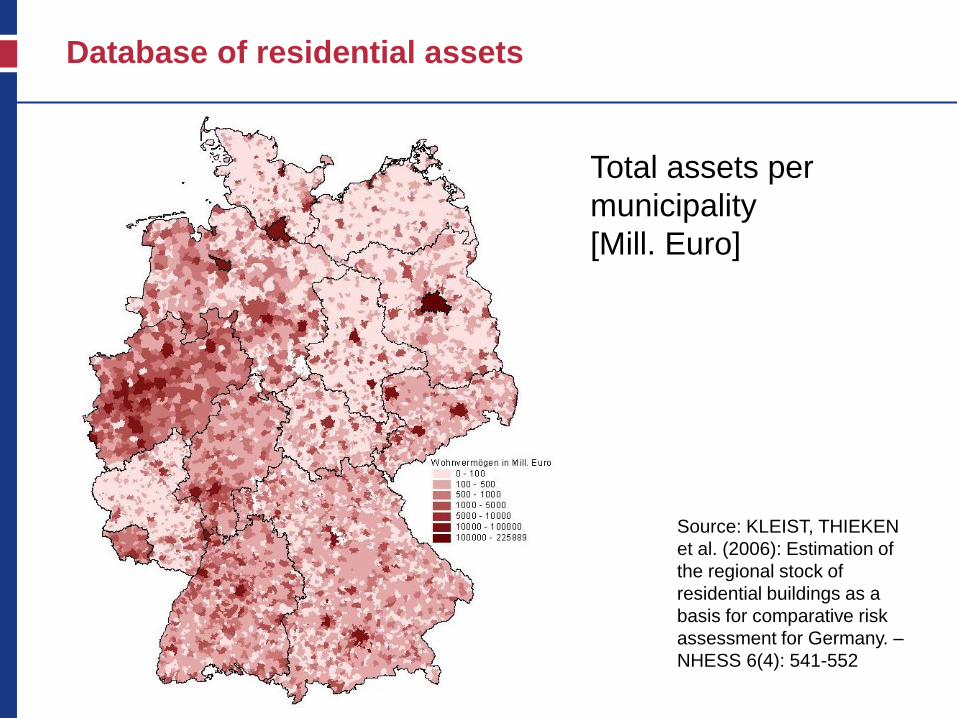
Database of residential assets
Source: KLEIST, THIEKEN
et al. (2006): Estimation of
the regional stock of
residential buildings as a
basis for comparative risk
assessment for Germany. –
NHESS 6(4): 541-552
Total assets per
municipality
[Mill. Euro]
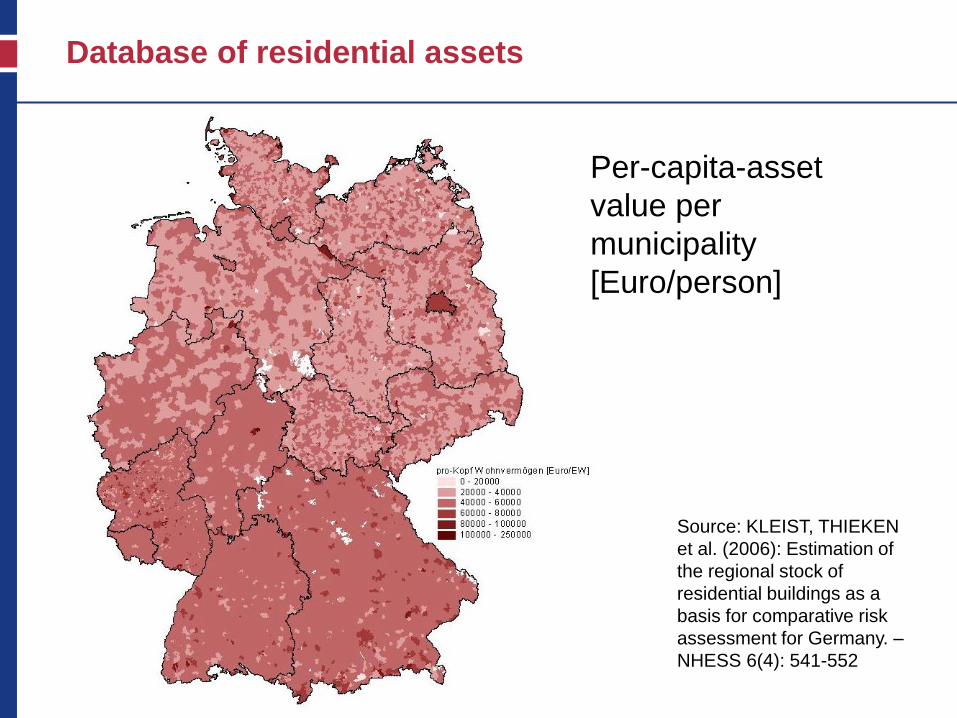
Source: KLEIST, THIEKEN
et al. (2006): Estimation of
the regional stock of
residential buildings as a
basis for comparative risk
assessment for Germany. –
NHESS 6(4): 541-552
Per-capita-asset
value per
municipality
[Euro/person]
Database of residential assets
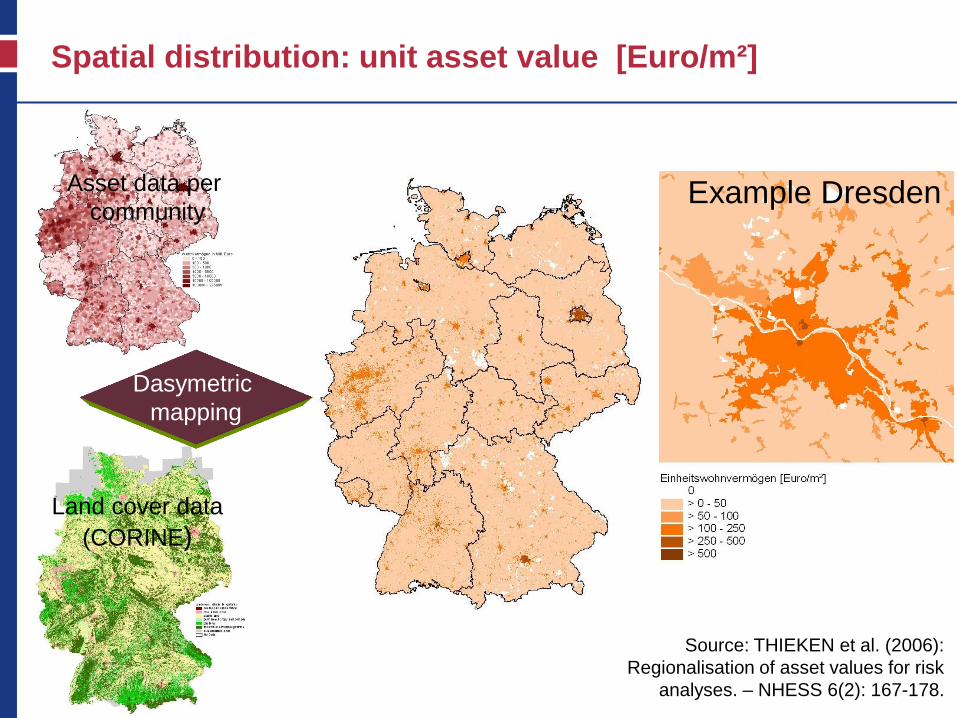
Spatial distribution: unit asset value [Euro/m²]
Source: THIEKEN et al. (2006):
Regionalisation of asset values for risk
analyses. – NHESS 6(2): 167-178.
Example Dresden Asset data per
community
Land cover data
(CORINE)
Dasymetric
mapping
Elements of risk analysis (ex ante)
Hazard analysis:
What can happen and how likely is it?
Exposure analysis:
What kind of elements are at risk?
What is their financial value?
Vulnerability assessment:
How much will be damaged?
Risk analysis:
How can hazard, exposure and
vulnerability analyses be combined?
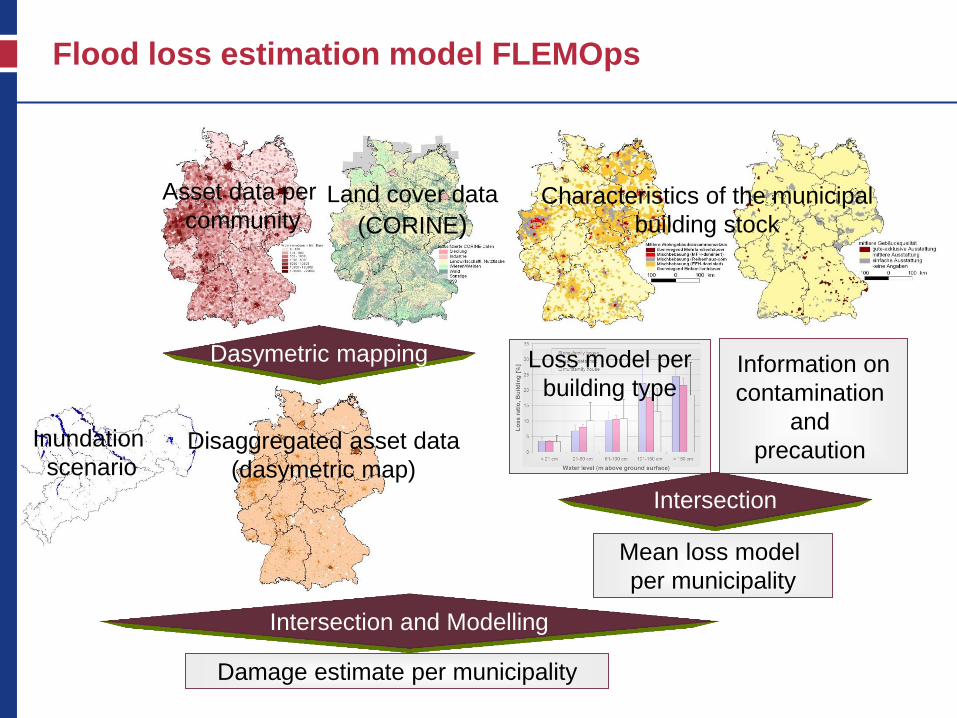
Flood loss estimation model FLEMOps
Mean loss model
per municipality
Characteristics of the municipal
building stock
Loss model per
building type
Information on
contamination
and
precaution
Intersection
Inundation
scenario
Asset data per
community Land cover data
(CORINE)
Dasymetric mapping
Disaggregated asset data
(dasymetric map)
Damage estimate per municipality
Intersection and Modelling
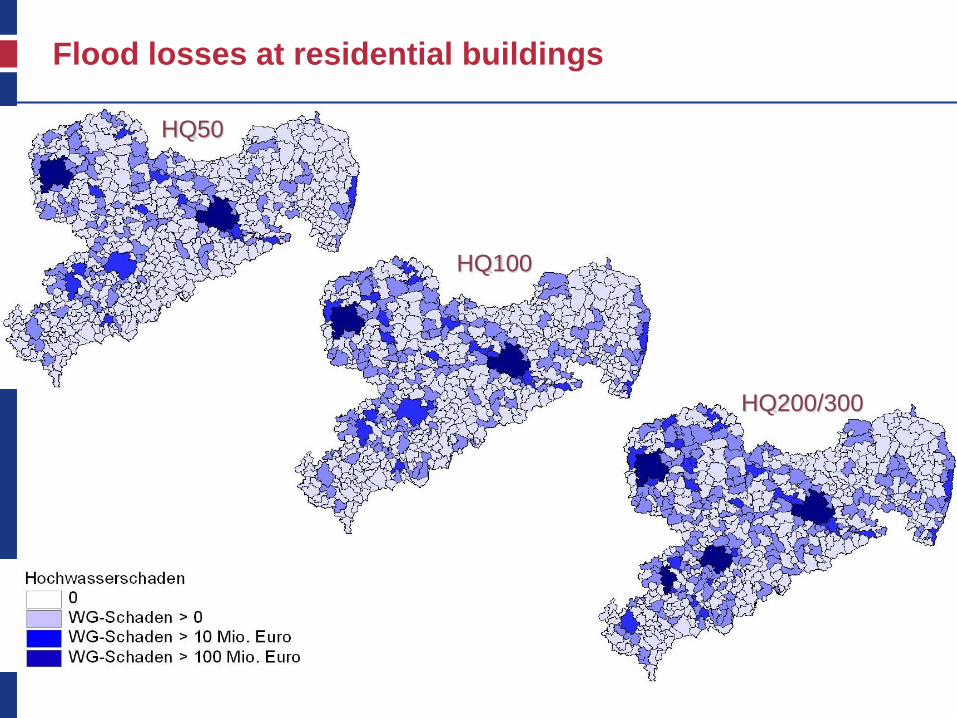
Flood losses at residential buildings
HQ50
HQ100
HQ200/300
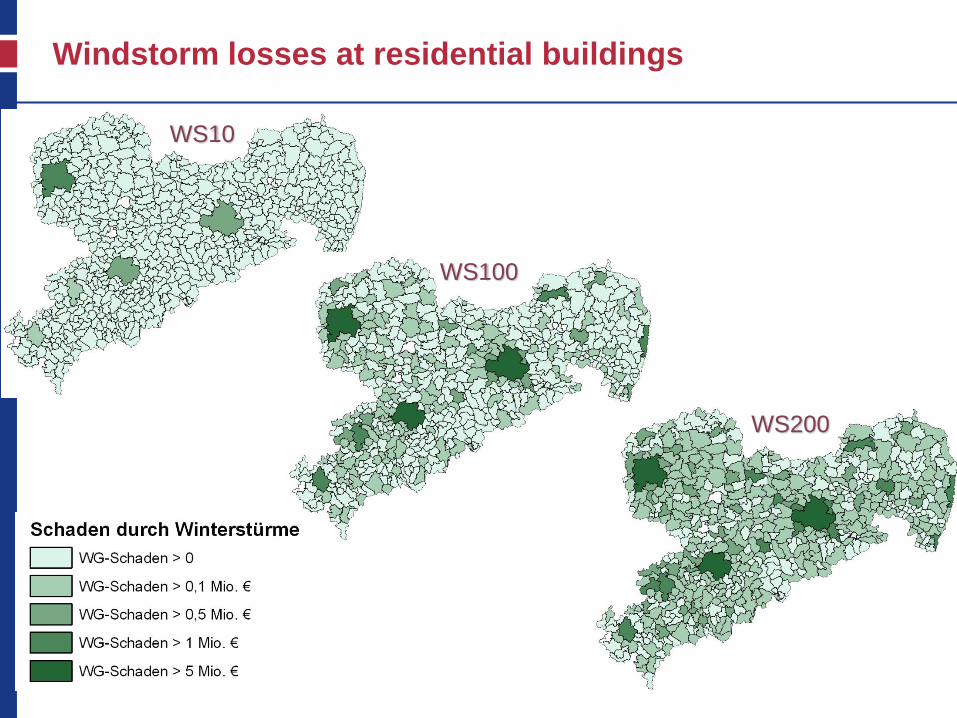
Windstorm losses at residential buildings
WS200
WS100
WS10
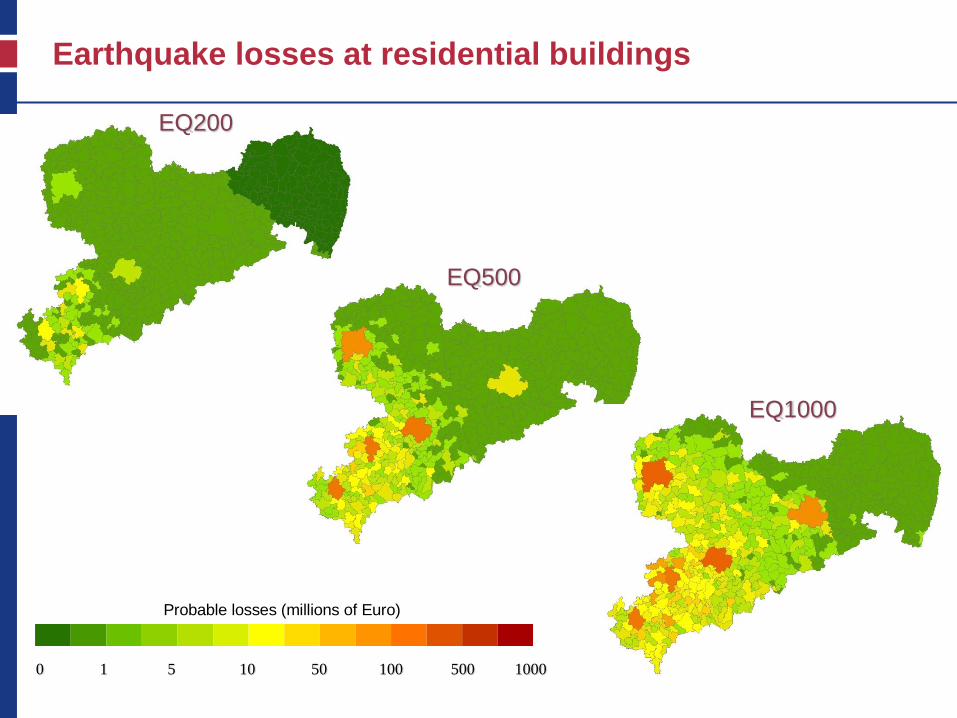
Earthquake losses at residential buildings
EQ200
EQ500
EQ1000
Probable losses (millions of Euro)
0 1 5 10 50 100 500 1000
Elements of risk analysis (ex ante)
Hazard analysis:
What can happen and how likely is it?
Exposure analysis:
What kind of elements are at risk?
What is their financial value?
Vulnerability assessment:
How much will be damaged?
Risk analysis:
How can hazard, exposure and
vulnerability analyses be combined?

Synthesis
Adapted from Heneka (2005)
Risk Vulnerability
Hazard
Median
Uncertainty
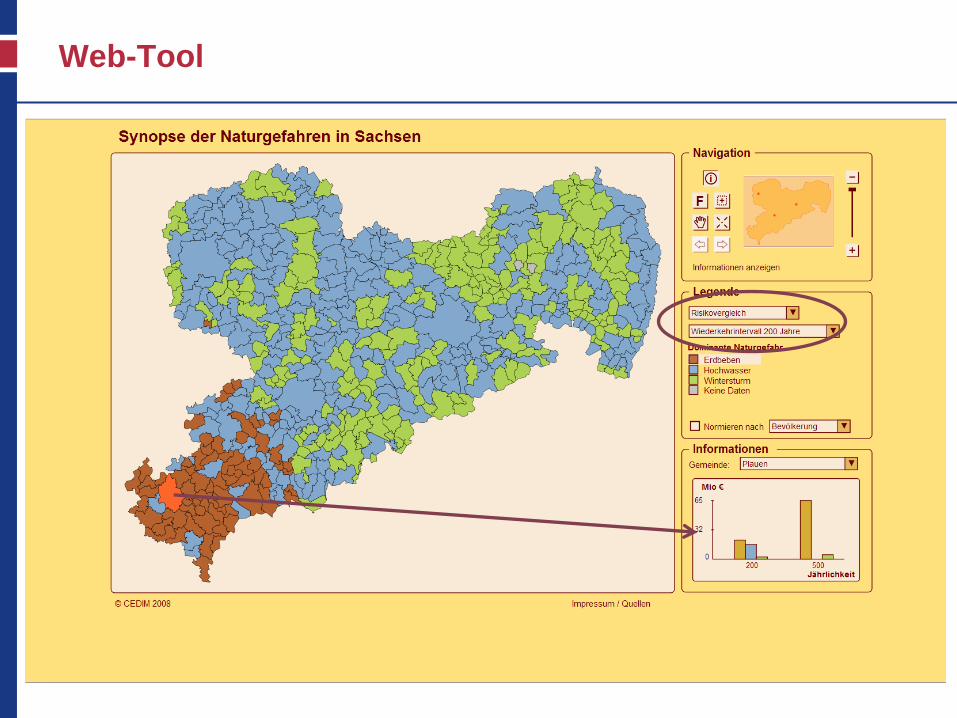
Web-Tool
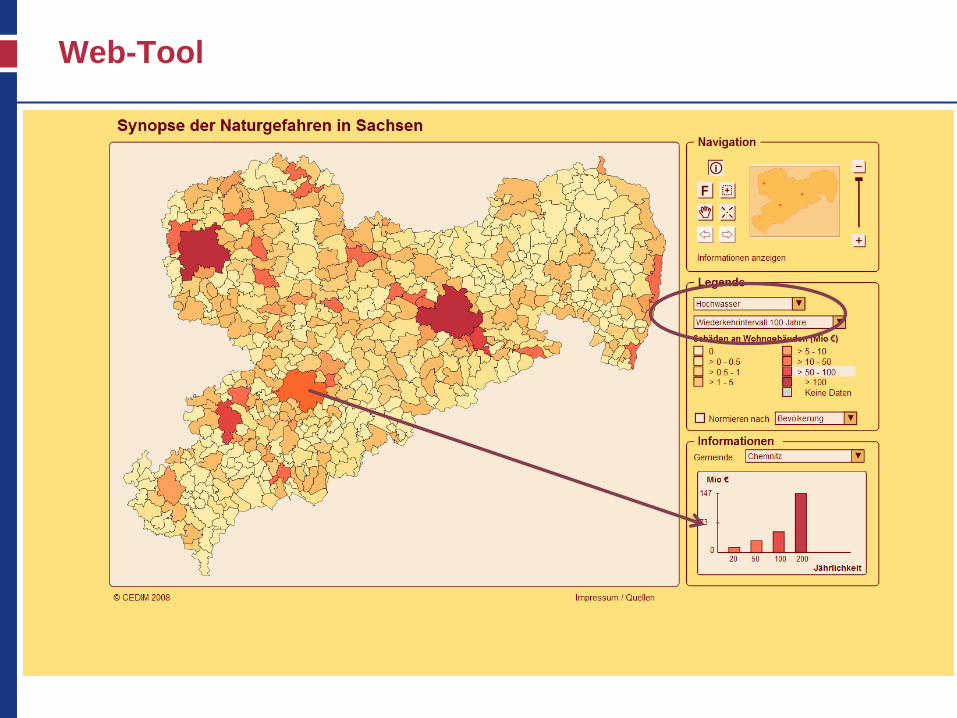
Web-Tool

Web-Tool

Summary
For the Freestate of Saxony, a first comparison of risks
from floods, storms and earthquakes was performed
(for a common return period of 200 years).
All results were visualised by a Web-Tool:
http://nadine-ws.gfz-
potsdam.de/risk_saxony/risk_saxony.html
The results allow to identify municipalities with high risks
and thus contribute to plan disaster risk reduction
strategies.