Embed Size (px)
Citation preview

Evaluation of Immediate Impacts of CPI Projects under EERP by AiD Pvt Ltd
Page 1 of 60
Evaluation of Immediate Impacts of Community Physical Infrastructure
(CPI) Projects under Expanded Early Recovery Project (EERP)
Associates in Development
(AiD) Pvt. Ltd, Pakistan.
June, 2013 Final Report

Evaluation of Immediate Impacts of CPI Projects under EERP by AiD Pvt Ltd
Page 2 of 60
Table of Contents Executive Summary ....................................................................................................................................... 7
Conclusions and Recommendations ....................................................................................................... 14
1. Background and Context: Malakand Division and the EERP .......................................................... 16
2. Objectives and Scope of Work ....................................................................................................... 17
3. Approach and Methodology .......................................................................................................... 18
3.1 Stage 1 - Inception ......................................................................................................................... 19
3.1.1 Work Plan ............................................................................................................................ 19
3.1.2 Tools .................................................................................................................................... 19
3.1.3 Staffing ................................................................................................................................ 19
3.1.4 QA Plan ................................................................................................................................ 20
3.1.5 Sampling .............................................................................................................................. 20
3.2 Stage 2 – Field Work ...................................................................................................................... 21
3.2.1 Pre-testing and Finalization of tools ................................................................................... 21
3.2.2 Field Activities ..................................................................................................................... 22
3.2.3 Challenges in the field ......................................................................................................... 22
3.3 Stage 3............................................................................................................................................ 23
3.3.1 Data Entry, Analysis and report writing .............................................................................. 23
4. Findings: ......................................................................................................................................... 24
4.1 CPI documentation: Availability and Adequacy ............................................................................. 26
4.1.1 Social Feasibility .................................................................................................................. 27
4.1.2 Environmental Screening .................................................................................................... 27
4.1.3 Technical Feasibility: ........................................................................................................... 28
4.1.4 Water Quality Test .............................................................................................................. 30
4.1.5 Project Proposal .................................................................................................................. 30
4.1.6 Project Approval.................................................................................................................. 30
4.1.7 PI register ............................................................................................................................ 30
4.1.8 Project completion report................................................................................................... 31
4.1.9 PI completion certificate ..................................................................................................... 31
4.1.10 Handing and taking over certificate: ................................................................................... 31
4.2 Design Validation ........................................................................................................................... 32
4.2.1 Scheme Layouts: ................................................................................................................. 32

Evaluation of Immediate Impacts of CPI Projects under EERP by AiD Pvt Ltd
Page 3 of 60
4.2.2 Design Validation: ............................................................................................................... 32
4.2.3 The following is a type wise breakdown of the CPIs: .......................................................... 33
4.3 Relevance ....................................................................................................................................... 34
4.3.1 Priority ................................................................................................................................. 34
4.3.2 Participation ........................................................................................................................ 34
4.3.3 Community Contribution .................................................................................................... 35
4.4 Effectiveness .................................................................................................................................. 37
4.4.1 Functionality: ...................................................................................................................... 37
4.4.2 Benefits ............................................................................................................................... 39
4.4.3 Problems ............................................................................................................................. 41
4.5 Efficiency: ....................................................................................................................................... 42
4.6 Sustainability .................................................................................................................................. 42
4.6.1 Design and layout. ............................................................................................................... 42
4.6.2 Quality ................................................................................................................................. 44
4.6.3 O&M systems ...................................................................................................................... 45
4.6.4 Institutional Maturity .......................................................................................................... 48
4.6.5 Meetings ............................................................................................................................. 48
4.6.6 Trainings .............................................................................................................................. 49
4.6.7 Self-initiated community projects ....................................................................................... 50
4.7 Impact ............................................................................................................................................ 52
4.7.1 Overall impact analysis ....................................................................................................... 52
4.7.2 Drinking Water Supply - CPI Scheme Impact ...................................................................... 53
4.7.3 Street pavements and drainage .......................................................................................... 55
4.7.4 Link roads and bridges ........................................................................................................ 56
4.7.5 Irrigation .............................................................................................................................. 57
4.8 Conclusions and Recommendations .............................................................................................. 58

Evaluation of Immediate Impacts of CPI Projects under EERP by AiD Pvt Ltd
Page 4 of 60
List of Abbreviations
AiD Associates in Development
AusAID the Australian Agency for International Development
CBR California Bearing Ratio Test
CO Community Organization
CPI
Community Physical Infrastructure
DWSS Drinking Water Supply Scheme
ERP
Early Recovery Programme
ER Environmental Review
EERP Expanded Early Recovery Programme
ES Environmental Screening
FGD Focus Group Discussion
GF Gravity Flow
GoKP
Government of Khyber Pakhtunkhwa
GPS
Global Positioning System
HH Household
HO Head Office
IRR
Irrigation
KII Key Informant interviews
KP
Khyber Pakhtunkhwa
MH/MHP/MHPP Micro Hydel / Micro Hydel Power / Micro Hydel Power Plant
MTDF Medium Term Development Framework
NGO
Non-Governmental Organization
O&M Operations & Maintenance
PCC
Plain Cement Concrete
PCNA
Post-Crisis Needs Assessment
PCR Project Completion Report
PI Physical Infrastructure
QA Quality Assurance

Evaluation of Immediate Impacts of CPI Projects under EERP by AiD Pvt Ltd
Page 5 of 60
RCC Reinforced Cement Concrete
SPD
Street Pavement and Drainage
SRSP
Sarhad Rural Support Programme
TOP
Terms of Partnership

Evaluation of Immediate Impacts of CPI Projects under EERP by AiD Pvt Ltd
Page 6 of 60
Location Map of the Expanded Early Recovery Project Area (Pl see annex 9 for details district wise maps)
Upper Dir
Chitral
Swat
Buner
Malakand
Shangla
Lower Dir

Evaluation of Immediate Impacts of CPI Projects under EERP by AiD Pvt Ltd
Page 7 of 60
Executive Summary
Background and Context
The 2010 floods affected large parts of Khyber Pakhtunkhwa. Nearly 1,500 people lost their lives and
37,000 homes were destroyed. Malakand Division was one of the worst affected areas. During this
period, AusAid funded Sarhad Rural Support program (SRSP) for ‘an initial Early Recovery Programme
designed to target the flood affected districts of Peshawar, Nowshera and Charsadda. However, based
on the PCNA1 findings and priorities identified for early recovery, SRSP submitted a revised proposal to
AusAid for an Expanded Early Recovery Programme (EERP) that would focus on reconstruction in the
entire Malakand Division.2
In 2011, AusAid earmarked AUS$ 3 million (PKR 255 million) for EERP that aimed to re-build
communities in areas hit by floods and insurgency in Malakand Division3. Focused on immediate
recovery and rehabilitation needs, the program called for completing all identified targets within a nine
month period.
The challenging environment in Malakand was not new to SRSP, which had been working in the project
area since 2001. As part of its development approach SRSP typically ensures a long term engagement
with the local communities and maintains a presence even after the project implementation comes to
an end. This has enabled the organization to continue supporting the capacity building and networking
needs of communities and also retain a knowledge base of the area and its people. With this structure in
place SRSP has the potential to ensure sustainability by leveraging additional resources for the
communities, as and when the opportunities arise.
The project area covered 191 villages (75 union councils) of 7 districts in the Malakand Division. The
targeted districts include, Chitral, Upper and Lower Dir, Swat, Buner, Malakand Agency and Shangla
The programme had 5 components including Community Institutions and Networking, Rebuilding
Community Physical Infrastructure Improved Livelihoods - through micro Enterprise, and through NRM-
based enterprises and Support to the local government. Under its component on community
institutions, the project organized nearly 400 local community-based organizations. The target group
included people hit by insurgency and floods, particularly the poor and marginalized, comprising nearly
74,000 households.
The Community Infrastructure was the most visible and the largest component of the project and
consumed 93% of the programme development budget. Specific interventions included the restoration
of community enabling infrastructure, predominantly in the drinking water sector but also link roads,
micro hydro electricity projects, protective works, bridges and sanitation projects. Approximately,
1 Post Conflict Needs Assessment: A multi-donor initiative.
2 Livelihood Strengthening Programme - Expanded Early Recovery Project in Border Areas of Khyber Pakhtunkhwa
(Malakand Division) – SRSP, April 2011 3Expanded Early Recovery Project (Livelihood Strengthening Programme) Project Completion Report - SRSP

Evaluation of Immediate Impacts of CPI Projects under EERP by AiD Pvt Ltd
Page 8 of 60
37,507 households gained access to clean drinking water and improved services through
rehabilitation/construction of community-based physical infrastructure schemes. The project also
included enterprise and vocational training for vulnerable groups particularly women. Over 700
households were also provided access to improved livelihood opportunities.
Scope of Work
The scope involved the assessment of 213 schemes implemented by SRSP across the entire Malakand
Division. The objective of the study was the verification and validation of the CPI schemes and an
assessment of the relevance, effectiveness, efficiency and immediate impact on the lives of the local
communities.
The geographic spread included all 7 districts of Malakand division including Buner, Chitral, Lower Dir,
Malakand, Shangla, Swat and Upper Dir.
Approach and Methodology
The primary focus of the study was two pronged; an engineering assessment and a structured
community survey. The engineering assessment focused on: i) an assessment of the availability and
adequacy of the various engineering documentation required for the implementation of the schemes;
and ii) a physical verification of the schemes’ existence and the state of their functionality. The
community survey included: iii) a Household interviews and Focus Group Discussions (FGDs) held with a
sample of the direct and indirect beneficiaries. . The survey, sample covered 60 schemes out of the total
of 213 that were randomly selected (proportional to the type and geographic spread of the schemes in
the districts covered). The sample size represents a confidence Level of 93 % with less than 10% margin
of error.
The study commenced in mid-February 2013 and was completed by mid June 2013.4 Led by a an
experienced team leader, multiple field teams assisted with the assessment to ensure timely completion
of the full scope spread over vast and a challenging terrain. Each team comprised a field supervisor and
two researchers. In addition, a short-term advisor, a senior engineer, and short-term inputs from a
Social Sector/Gender Specialist, and Data Analyst were tapped during implementation.
A variety of assessment tools helped generate the quantitative and qualitative analysis that provided the
basis for this report.
The following sections summarize the key findings:
Findings
1.1 Documentation: Availability and Adequacy:
Except for a small number of CPIs, documentation showing compliance with the SRSP processes such as
social feasibility, Terms of partnership (TOP), project completion reports (PCRs), certificate of
completion and handover documents to the community were available and found to be adequate.
4 See Annex 7

Evaluation of Immediate Impacts of CPI Projects under EERP by AiD Pvt Ltd
Page 9 of 60
However the engineering design basis and calculations were unavailable or inadequate for bulk of
sample CPIs, particularly for the road infrastructure CPIs.
1.2 Design validation:
All the 60 schemes were visited and checked for variations in relation to the original plans and designs.
The layout of 9 schemes had significant variations while the rest had minor or no variations. The
significant variations in layout were for DWSS. They either had to do with lengths of pipe network or the
variations in the location/number of storage or supply water tanks from what was originally planned.
Furthermore, the measurement of the structures showed major variations for 12 schemes, whereas 21
schemes had relatively minor variations.
Although a detailed investigation was not made on the rationale for the change, however, it was
reported that the change was necessitated by site conditions.
1.3 Relevance
Relevance refers to whether or not the selected schemes responded to the needs and priorities of the
target community. A number of indicators covered this important assessment parameter and aimed at
assessing the prioritization of the CPI schemes; participation in planning and implementation; and the
community contributions towards the schemes.
1.3.1 CPI Prioritization
An overwhelming majority, (98 percent of all male and females surveyed in all districts, except Lower
Dir, indicated that the schemes implemented under the EERP addressed the priority needs of the
communities.
1.3.2 Participation
The majority of respondents reported their own or the household’s participation in the planning and
implementation of the CPIs. The highest participation in planning and needs assessment of CPI schemes
was in the district of Chitral (100 %) and the least in Shangla where it was 67 %. Given the social norms
of the area it came as no surprise that participation of females was found to be low, however 32 %
females indicated that they or another female from their household did participate in the needs
assessment. Overall participation in the implementation was reported as 82 %. Again the highest level
of participation was reported from Chitral and the lowest in Shangla.
1.3.3 Community Contribution
Community contribution is an important indicator of ownership. Nearly 77 percent of the respondents
(75 percent females; and 79 percent males) claimed to have made contributions in cash and/or in kind
to the construction of CPI schemes, while the rest of the 23 percent did not contribute. Relatively higher
contributions were made in Chitral, Upper Dir and Buner (100, 92 and 83 percent, respectively).
Interestingly, 77 percent of respondents which were non CO members also contributed towards
construction. Of the total households that contributed, 17 percent contributed in cash. The highest

Evaluation of Immediate Impacts of CPI Projects under EERP by AiD Pvt Ltd
Page 10 of 60
frequency of cash contributions (30 percent) was witnessed in Shangla. 70 percent of the contributions
were in the form of labor whereas 20 percent contributed additional items in kind.
1.4 Effectiveness
Effectiveness refers to whether the CPI schemes are practically meeting the need for which they were
designed and built. Accordingly the indicators against which effectiveness has been gauged are
functionality and recurring benefits of the CPI schemes. Except for an odd few cases, all the schemes
were found to be functioning well and providing the anticipated benefit to their respective
communities.
1.4.1 Functionality
From the community perspective, approximately 91 percent of the respondents across the 7 districts
acknowledged that the CPI schemes were working and functional. Across the respondents, 86 % of the
female respondents believed that the schemes were 100 percent functional, as compared to the more
cautious replies of male respondents, 61 % of whom felt that the schemes were 100 % effectively
working. FGD analysis supported the overall satisfactory responses from majority of the male and
female participants.
Functionality on the ground was also verified by the field engineers. Out of the total sample of 60 schemes, the field engineers were able to inspect and verify that 52 schemes were fully functional. Of the remaining 8 CPIs, 4 schemes were not operational at the time of the visit. These schemes included the MHPP scheme in Shao Kalam, district Swat, and Khanabad, district Upper Dir; both of them had technical breakdown and were in the process of being repaired by the communities. Whereas, the Irrigation Channel in Meragai Swat was not operational, since it was not an irrigation season, whereas in the case of DWSS Dardyal, Kabal Swat, the intake structure had been damaged due to a snow slide and the communities were waiting for the snow to melt before attempting any repairs. The remaining 3 schemes namely Drainage CPI, Bazkhel, DWSS Sher Khan, and Link Road Gujjer Tangi, were partially functional. A major reason for this seemed to be lack of an effective O&M system for these CPIs.
1.4.2 Scheme Benefits
Overall 90 percent of respondents claimed to be directly benefitting from the CPI schemes. A relatively
higher percentage of people (100, 97 and 80 percent) were found to be benefiting from the CPI schemes
in Shangla, Lower Dir and Chitral, reinforcing the communities’ high levels of participation in planning,
implementation and cash contribution in these 3 particular districts. Furthermore, the schemes were
benefiting members and nonmembers alike as nearly 88 % of the non-members interviewed also
confirmed that they were directly benefitting.
1.5 Efficiency:
Bulks of the CPIs were implemented within the planned budgets and time of completion. The review
shows that 95% of the schemes were completed within the planned timeframe while 87 % of the sample
schemes were completed within the estimated budgets. A relatively modest 7% of the schemes

Evaluation of Immediate Impacts of CPI Projects under EERP by AiD Pvt Ltd
Page 11 of 60
exceeded the approved budget by 10% while 6% of the scheme sample was completed under the
estimated budgets. It is noteworthy that in the case of budget overrun it was the community which
invariably contributed to meet the shortfall.
Although hard comparative data is not available for similar sized schemes which the GoKP or other
organizations have implemented, there is anecdotal evidence that cost per beneficiary in the case of
SRSP CPIs is relatively low. One reason is community contributions which on average is at least 20 % of
the total cost of schemes
1.6 Sustainability
Sustainability of the schemes refers to whether i) the schemes will fulfill its design life and ii) whether or
not communities will continue to maintain the systems independent of any support from SRSP. The
indicators for this assessment parameter included quality of the CPI schemes; and the Operations &
Management (O&M) systems put in place (including transparency), and the overall institutional maturity
of the community organization.
1.6.1 Quality
Despite the rough and remote mountain terrain, the quality of schemes of the majority of schemes was
found to be good. Community perception in this regard corroborated the engineering team’s findings.
The focus group discussions indicated that more than 91 percent of the respondents were satisfied with
the current condition of the CPI schemes, out of these 87 % were non members. In Buner, Chitral and
Malakand Agency, nearly 100 % of the male respondents showed satisfaction; while 86 to 97 % of the
females indicated satisfaction with the quality of work. Out of the 9 schemes which had quality issues,
most indicated quality of concrete in the PCC link roads as an issue.
1.6.2 O&M systems
Knowledge of any O&M system was generally low. Almost 48 % of the respondents were not aware of
any O&M system. Of these 24 % were male and 79 % were female respondents. Approximately 39
percent of respondents claimed to have made contributions to O&M. The largest contribution was in
irrigation schemes (55 percent); and ‘others’ (77 percent). Of the contributors, 52 percent were CO
members, and 49 percent non-CO members. Respondents acknowledged awareness that most of the
maintenance funds were being run through SRSP and then CO bank accounts. The FGD analysis reflects
that about half the male respondents claimed to be satisfied with the O&M system, however less than a
quarter of the females showed satisfaction with O&M.. Majority of female respondents were unaware
of any O&M system.
For the engineering team, verification of O&M involved observation of how well the CPIs were being
maintained and discussed the functioning of the O&M committees. It was reported that O&M
committees for half the CPI schemes were found fully functional; whereas it was observed that O&M
existed and functioned partially at 27 percent of the sites; while 24 percent cases there was no
functional system for O&M. From the engineering view point a total of 14 schemes were not well
maintained.

Evaluation of Immediate Impacts of CPI Projects under EERP by AiD Pvt Ltd
Page 12 of 60
1.6.3 Institutional Maturity
Another indicator of ‘Sustainability’ is Institutional Maturity, which assesses the capacity of the
communities to independently run the CPI schemes in the longer-run. Indicators for this assessment are
complex and tricky. However some of these were captured during the field survey. Among these
include; Community meetings during- and post-implementation of CPI schemes; trainings of community
of members; and community’s local initiative.
1.6.3.1 Meetings
While 70 % of the respondents said that they met either fortnightly or monthly before CPI completion,
only 12 % meet on a regular basis once the CPI was completed. Most of the respondents however said
that they continue to meet on need basis.
1.6.3.2 Trainings
Nearly half the respondents, 46 % said that someone from the community has been given trainings with
the lowest proportion in Dir and highest being reported from Malakand. Most of these trainings were in
leadership and financial management, but 14% were on O&M, related which were all given to the males
of the community.
1.6.3.3 Self-initiated community projects
17 % of respondents indicated that they had imitated other projects besides the CPI which was assisted
by SRSP. Of these, 67 % respondents were CO members whereas, 33 were non-CO members.
Furthermore, the new indicatives by CO members were predominantly donor assisted as compared to
the once implemented by the non CO members, showing a greater capacity to network and leverage
external funds for local development.
Linking the above analysis to the subject of community’s ability to self initiate projects and/or run
existing schemes independently, majority of the FGD responses endorsed the confidence of the male
and female participants claiming that the CPI schemes could very well continue to run in the absence of
support from SRSP. However, scheme-wise response from FGD participants believed that irrigation and
drinking water supply schemes respectively could not run solely by the communities.
1.7 Immediate Impact
Overall the community felt a significant positive impact of the schemes.
For the irrigation schemes include enhanced yields, crop production and increase in overall farm
incomes. Construction of street pavements and drainage, and implementation of improved drinking
water supplies led to a decrease in foul smells and a perception of decreased waterborne diseases.
With the construction of link roads and bridges, approximately 68 percent of respondents across all 7
districts acknowledged a positive impact on women’s free time, enabling them to manage their daily
activities more efficiently and productively. Some indirect benefits include a significant positive impact
on girls' and boys' education reported by all respondents across all 7 districts, post implementation of
the various CPI schemes. More specifically, this was in terms of greater access/lesser distances due to
Evaluation of Immediate Impacts of CPI Projects under EERP by AiD Pvt Ltd
Page 13 of 60
the construction of link roads and bridges, etc. However, the main immediate outcomes, as a direct
result of the CPI schemes are as follows:
1.7.1 Drinking Water Supply - CPI Scheme Impact
Post implementation, the average time taken to reach the water source decreased drastically, allowing
community members, particularly females, to allocate their time more efficiently to other important
daily tasks. The result findings indicate that the responsibility of collecting water is now being shared
most often by the daughters (21 percent), allowing the mothers to utilize their time more efficiently.
Satisfaction levels with the new DWS CPI schemes were 100 percent for males and 97 percent for
females, implying lower risks of waterborne diseases.
1.7.2 Street pavements and drainage
Majority of the respondents (92 percent) in the 3 districts where the scheme was implemented,
Malakand Agency, Shangla and Swat agreed that post implementation of the CPI; the issue of stagnant
water in the streets had either been completely or partially eliminated. Additionally, post-SPD CPI, in
Shangla and Swat, 75 and 93 percent respondents, respectively claimed high incidences of reduction in
foul smell, while only 50 percent respondents reported the same in Malakand Agency. However,
majority of the respondents from Shangla (approximately 62 percent) are still claiming that waste water
is not disposed properly even after implementation of the scheme. Post implementation of the CPI
scheme, nearly 50 percent of the respondents in both Malakand Agency and Shangla perceived an
improvement and positive effect on the health of the children as a result.
1.7.3 Link roads and bridges
The new link roads and bridges/communication infrastructure has remarkably decreased the average
time taken for community residents to avail essential daily requirements including distances to the
nearest drinking water supply; grocery stores; girls’ and boys’ schools; hospital; and the nearest local
Tehsil administration. In Malakand Agency, 3 percent respondents claimed to not use it all. Of these 3
percent respondents, 33 percent stated the reason that the new infrastructure was of no use to them.
The 8 percent respondents in Swat, who claimed the same, all reported ‘poor quality’ as the reason. In
terms of overall traveling cost, it decreased by 25 percent for all respondents in Lower Dir and between
25 to 75 percent across all districts at varying levels. There was an overall 75 percent decrease in the
cost of freight transport across all districts except Buner, where no change was reported.
1.7.4 Irrigation
The household surveys show that there was a remarkable increase in crop production. While 100
percent respondents reported a 50 percent increase in wheat production; between 50 to 80 percent
reported a 100 percent increase in rice and grain production. Production of maize also increased
considerably. In vegetables, 100 percent increase in production of onions, tomatoes, okra and garlic
was also reported by all respondents. With regards to the overall impact on farm income, 100 percent
respondents reported a minimum of 50 percent increase.

Evaluation of Immediate Impacts of CPI Projects under EERP by AiD Pvt Ltd
Page 14 of 60
Conclusions and Recommendations
In view of the early recovery context and the difficult terrain, SRSP’s outreach and successful conclusion
of this challenging project is commendable. The schemes have been implemented in areas where the
government had limited outreach and other non-governmental players had no presence. Working in the
target areas meant many hours of driving and trekking through often rugged and mountainous terrain.
Despite these difficulties, the overall quality of work is of good standards. All project outputs were also
achieved within the agreed timelines. Thanks to a motivated team, nearly 400 community organizations
were formed, local priorities identified and over 200 CPIs implemented within a short span of 9 months.
Overall the communities have reported a very positive impact of the CPI program.
o Post implementation of the DWSS, the average time taken to reach the water source
decreased significantly, allowing community members, particularly females, to allocate
their time more efficiently to other important daily tasks. Satisfaction levels with the
new DWS CPI schemes were 100 percent for males and 97 percent for females, also,
implying lower risks of waterborne diseases.
o In case of Sanitation and drainage CPIs, the majority of the respondents (92 percent) in
the 3 districts where the scheme was implemented noted that the issue of stagnant
water in the streets had either been completely or partially eliminated. Additionally, 75
and 93 percent respondents in Shangla and Swat, respectively claimed reduction in foul
smell, while 50 percent respondents reported the same in Malakand Agency.
o The new link roads and bridges has remarkably decreased the average time taken for
community residents to avail essential daily requirements; travel to the nearest drinking
water supply schemes; grocery stores; girls’ and boys’ schools; hospital; and the nearest
local Tehsil administration. The respondents reported an overall 75 percent decrease in
the cost of freight transport across all districts except Buner, where no change was
reported.
o The survey also shows considerable increase in crop production due to the
implementation of irrigation schemes. Nearly all respondents reported a 50 percent
increase in wheat production; while between 50 to 80 percent reported a 100 percent
increase in rice and grain production. With regards to the overall impact on farm
income, 100 percent respondents reported a minimum of 50 percent increase.
o Combined capacity of the 3 MHPs in Chitral, Swat and Upper Dir has the designed
capacity of 225 KW, which will benefit approximately 600 HH. The MHP in Chitral has
been functioning at full capacity and is not only supplying electricity to the communal
HH’s, but also to a local hotel, Bashalini(Menstruation/Maternity Home),Jasthakhan
(Funeral Dance Hall) , a school and also mosque.
Evaluation of Immediate Impacts of CPI Projects under EERP by AiD Pvt Ltd
Page 15 of 60
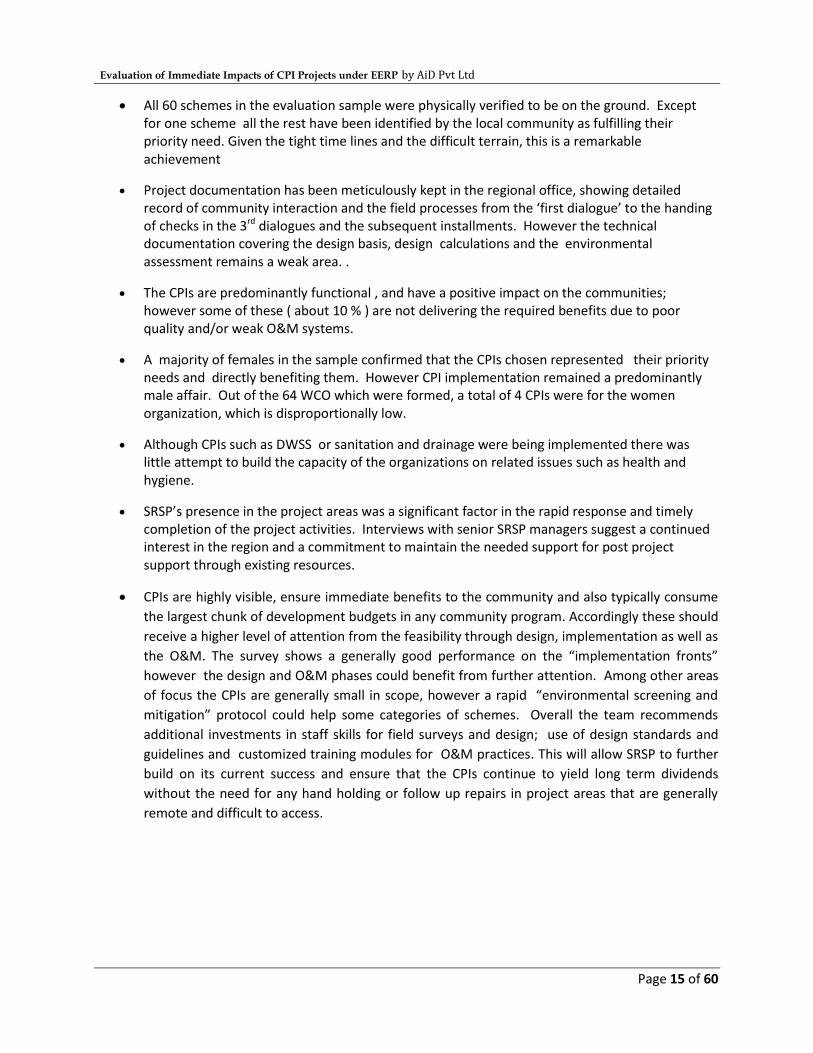
All 60 schemes in the evaluation sample were physically verified to be on the ground. Except for one scheme all the rest have been identified by the local community as fulfilling their priority need. Given the tight time lines and the difficult terrain, this is a remarkable achievement
Project documentation has been meticulously kept in the regional office, showing detailed record of community interaction and the field processes from the ‘first dialogue’ to the handing of checks in the 3rd dialogues and the subsequent installments. However the technical documentation covering the design basis, design calculations and the environmental assessment remains a weak area. .
The CPIs are predominantly functional , and have a positive impact on the communities; however some of these ( about 10 % ) are not delivering the required benefits due to poor quality and/or weak O&M systems.
A majority of females in the sample confirmed that the CPIs chosen represented their priority needs and directly benefiting them. However CPI implementation remained a predominantly male affair. Out of the 64 WCO which were formed, a total of 4 CPIs were for the women organization, which is disproportionally low.
Although CPIs such as DWSS or sanitation and drainage were being implemented there was little attempt to build the capacity of the organizations on related issues such as health and hygiene.
SRSP’s presence in the project areas was a significant factor in the rapid response and timely completion of the project activities. Interviews with senior SRSP managers suggest a continued interest in the region and a commitment to maintain the needed support for post project support through existing resources.
CPIs are highly visible, ensure immediate benefits to the community and also typically consume
the largest chunk of development budgets in any community program. Accordingly these should
receive a higher level of attention from the feasibility through design, implementation as well as
the O&M. The survey shows a generally good performance on the “implementation fronts”
however the design and O&M phases could benefit from further attention. Among other areas
of focus the CPIs are generally small in scope, however a rapid “environmental screening and
mitigation” protocol could help some categories of schemes. Overall the team recommends
additional investments in staff skills for field surveys and design; use of design standards and
guidelines and customized training modules for O&M practices. This will allow SRSP to further
build on its current success and ensure that the CPIs continue to yield long term dividends
without the need for any hand holding or follow up repairs in project areas that are generally
remote and difficult to access.

Evaluation of Immediate Impacts of CPI Projects under EERP by AiD Pvt Ltd
Page 16 of 60
1. Background and Context: Malakand Division and the EERP
The floods that affected large parts of Khyber Pakhtunkhwa in 2010 only compounded the issues being
faced by the population; almost 1,500 people lost their lives and 37,000 homes were destroyed.
Malakand Division was one of the worst affected areas; the region had not yet recovered from
fundamentalist insurgency and the subsequent military intervention that took place in 2009 and
displaced over 2 million people5.
AusAid development aid to Pakistan has burgeoned over the last four to five years. In 2001-2002, AusAid
donated an estimated $4.5 million to Pakistan with the focus on increased access to basic education for
girls and better management of the environment6. In contrast, in 2010-11, assistance to Pakistan soared
to $67.5million, with a major chunk of the budget being directed towards humanitarian assistance and
reconstruction.7An initial Early Recovery Programme was designed to target the flood affected districts
of Peshawar, Nowshera and Charsadda. Once the activities and interventions for the three districts had
been implemented, SRSP, keeping in view the Pakistan governments plans for the province, out lined in
the PCNA, MTDF and Early Recovery Priorities in KP, submitted a proposal to AusAid for the Expanded
Early Recovery Programme (EERP) which would focus on reconstruction in Malakand Division.8
In 2011, AusAid, as part of its mandate for reconstruction of the Malakand region, earmarked AUS$ 3
million (PKR 255 million) for the Expanded Early Recovery Programme (EERP). EERP is a nine month long
initiative by Aus-AiD, in collaboration with SRSP, whose overall objective is to “build resilient
communities in areas hit by floods and insurgency in Malakand Division”9. This objective was to be
achieved using a multi- pronged approach with the restoration of Community Physical Infrastructure
being a central focus of the project, accounting for 93% of the financial outlay.
The challenging environment suited SRSP, which had been working in the project area since 2001, with a
long term community based approach. Typically for SRSP, a basic skeleton structure of the organization
remains in the area to interact with communities even after the project it implements comes to an end.
This Core enables SRSP to continue to support the capacity building and networking of communities and
also retain a knowledge base of the area and its people; with this structure in place SRSP leverages
additional resources for the communities when opportunities arise. This is particularly important from
sustainability point of view, comparing it to other imitative which have a short terms ‘project specific’
approach.
5Malakand Comprehensive Stabilization and Socio-Economic Development Strategy – GoNWFP, 2009
6 Aid budget summary 2001-02http://www.ausaid.gov.au/Budgets/Pages/default.aspx
7 Australia’s International Development Assistance Budget, 2010
8 Livelihood Strengthening Programme - Expanded Early Recovery Project in Border Areas of Khyber Pakhtunkhwa
(Malakand Division) – SRSP, April 2011 9Expanded Early Recovery Project (Livelihood Strengthening Programme) Project Completion Report - SRSP

Evaluation of Immediate Impacts of CPI Projects under EERP by AiD Pvt Ltd
Page 17 of 60
The overall impact of initiatives carried out under EERP is significant; 74,385 men and women,
representing individuals from the 191 poorest and most vulnerable districts of Malakand Division10 have
benefitted from the programme.
The selection of schemes was to be carried out using the platform of 395 community based
organizations or COs. The CO platform was chosen in order to make the process a participatory and
transparent one. The CO members were to be trained and their capacities built in a bid to enable them
to organize themselves, voice their concerns and needs collectively, and most importantly take
collective ownership of their schemes to achieve long term sustainability. The 395 CO’s formed for this
purpose worked towards reconstructing/rehabilitating 213 CPI schemes which were to benefit a
targeted 37,000 households.
The entire process, from the formation of the COs, to selection of schemes, through to the
implementation and eventual handover of the schemes to communities was to be carried out within the
mandated timeframe of nine months, from May 2011 to January 2012.
2. Objectives and Scope of Work
Associates in Development Pvt. Ltd. was contracted to carry out an evaluation of the Community
Physical Infrastructure (CPI) Projects in order to establish the immediate impacts of the schemes and
validation of design and planned outcomes. The scope of work is the evaluation of the 213 Community
Physical Infrastructure (CPI) projects implemented by communities with SRSPs assistance under the
EERP. The majority of them, 40 % were built in Swat, followed by Shangla, Lower dir and Malakand
which had 12 %, and lastly, Buner, Upper Dir and Chitral which had 5 % of the total11.
Most of these schemes were to assist communities in the provision of DWSS, followed by Road
Infrastructure, Sanitation, Bridges, Irrigation Schemes, and Micro Hydel. There is an odd one CPI of a
rehabilitation of a sports facility as well.
Schemes range in costs from Rs 110,000 for a Hand pump in Buner to Rs 8, 600,000, average cost of the
different type of schemes range from Rs 5.8 million for Bridges, to Rs 0.7 million for DWSS.12 Cost per
beneficiary is most favorable in the case of irrigation CPIs. At Rs 1977 per HH benefited, where 4
irrigation related schemes are benefiting 463 beneficiaries as compared to soil conservation works
where 2 schemes costing more that Rs 7 mill with an average cost of Rs 23,675 per beneficiary13
At the individual scheme level, the aim was to assess; i) the Relevance of the CPI to the intended
beneficiaries’ needs; ii) the Efficiency with which the schemes were implemented, in terms of costs and
time; iii) assessment of the scheme Effectiveness; iv) the direct and indirect Impacts of the scheme and’
10
ibid 11
See Annex 2 CPI Distributions 12
See Annex 2 CPI Distributions 13
See Annex 2 CPI Distributions

Evaluation of Immediate Impacts of CPI Projects under EERP by AiD Pvt Ltd
Page 18 of 60
v) the Sustainability of the scheme14. These criterions were used to judge whether or not the expected
outcomes envisaged in the projects proposal/financing agreement are being realized by the community
built and maintained infrastructure schemes.
3. Approach and Methodology
The approach and methodology of the study revolved around the physical verification of the technical
information and obtaining a firsthand account of how the beneficiaries viewed this initiative.
The activities were divided into a three staged approach outlined below:
Stage 1 was the inception phase which lasted from the 8th April to 17th April 2013. This time was used to
develop an understanding of the programme, review all relevant documentation and secondary data
and to finalize the tools used in the field and the teams’ work plan. This stage culminated with the
submission of the Inception.
Stage 2 was the Field research phase during which the teams were mobilized and they completed data
collection in the targeted villages. Key Informant interviews with Project staff, community members and
other stakeholders, the household survey, engineering field reports and FGDs were all conducted during
this phase.
The final stage of the process, Stage 3, involved the entry and analysis of all the data collected and the
preparation of the Final Report. A draft of the Final Report is to be shared with SRSP, and the comments
14
See Appendix 4 - Evaluation Matrix
Inception/Desk review
•- Understand stated and unstated expectations of SRSP
•- Review relevant project documents and reports
•- Design checklists, templates ,finalize data gathering instruments and detailed work plan
•- Submission of inception report
Field work
•- Data collection from target UCs
•- Meetings with and relevant stakeholders and review of records of facilities
•- IDIs & Focus Group Discussions with with Project staff, community members and other stakeholders
•- Record Field Observations
Data analysis and report writing
•- Data entry and analysis
•- Presentation to the client on key findings
•- Prepare Draft report for sharing with the client
•- Incorporate Feedback and submit Final report

Evaluation of Immediate Impacts of CPI Projects under EERP by AiD Pvt Ltd
Page 19 of 60
made by the client, if any, are to be incorporated before the Report is handed over and the findings are
presented.
3.1 Stage 1 - Inception
3.1.1 Work Plan
The field work was spread over 7 districts where drive time over rugged mountain roads could take over
5 hours. The entire evaluation was to be completed within a tight deadline and the work plans for the
teams were designed accordingly. Initial work plans were submitted to SRSP along with the original
Technical Proposal and Inception report. These plans had to be modified due to a number of factors,
most crucially due to the difficulty in finding female researchers willing and able to work in the project
areas. A final version of the work plan was drafted near the close of the inception phase15.
3.1.2 Tools
At this stage it was decided that the engineering focus would be on i) a preliminary desk review which
studies the availability and adequacy of the documentation on design estimation and the
documentation on approvals of the completion process. The data from the desk review has been
reported in the form of the “Desk Review Report”. ii) The engineering team was to carry out extensive
site visits during which they would physically validate the design and outcomes of the individual CPI
schemes. Additionally, they would verify the O&M systems and their effectiveness.
In addition, the tools for the social sector assessment were drafted at this stage. An extensive review of
material available on CPI schemes and on other similar assessments in the target districts, inputs from
social sector specialists and Aid’s extensive prior experience with similar assignments were all drawn on
to draft the initial tools which consisted of a i) detailed household questionnaire and ii) a form for Focus
Group Discussions (FGDs).
3.1.3 Staffing
In order to carry out the work in the least amount of time and maximize the use of available resources, it
was decided that two field teams would carry out operations simultaneously in two clusters. Each field
team comprised of a Field Supervisor and two Researchers. The Researchers were responsible for
gathering qualitative and quantitative information from the project sites using the purpose designed
data gathering forms. The team also included a short-term Advisor, a full time Team Leader, a senior
Engineer, and short terms inputs from a Social Sector Specialist, Gender Specialist, and Data Analyst.
The Field supervisors, Team Leader and other sector specialists not only supervised these activities but
also participated actively in the data collection. The Field Supervisors were the first level Quality
Assurance; at the second tier, a Quality Assurance Manager rechecked and validated the quality of the
data collected in the field.
The proposed Team Leader retained overall control of the research operations and maintained close
liaison with the designated representatives of SRSP. The team was mobilized immediately after the
15
See Annex 7 – Work Plan

Evaluation of Immediate Impacts of CPI Projects under EERP by AiD Pvt Ltd
Page 20 of 60
43%
7%11%
12%
12%
10%5%
40%
10%12%
12%
12%
9%
5%
Fig 1.1 CPIs by DistrictSwat
Buner
Malakand
Shangla
Lower Dir
Upper Dir
Chitral
Note:
Outside Ring: = Total EERP CPI sInside Ring: = Evaluation Sample
contract was signed. Team coordination was ensured through constant communication and contact
(including frequent meetings) between all team members; head office staff and the field teams.
The team was fully mindful of the cultural sensitivities and local norms which had to be adhered to when
working in the target areas. The team received the full support from SRSP staff in terms of logistical
arrangements, facilitation of meetings and coordination at the field level.
3.1.4 QA Plan
In order to ensure that all tasks are completed with the high standards quality that clients have come to
expect. All field work, data collection, results and reports were passed through Aid’s comprehensive yet
dynamic Quality Assurance (QA) system.
At the inception stage, the top management at AiD, along with the project Team Leader and senior
Sector Specialists designed QA policies which consist of specific Key Performance Indicators (KPIs) used
to gauge the level of performance and resultantly, the quality and timeliness of project delivery.
For the Evaluation of Immediate Impacts of CPIs under EERP, a 4 tier QA approach was chosen which
functioned in parallel to Aid’s standard QA measures.16
The first level of QA was the Field Supervisors who were required to scrutinize all the primary data
collected on a daily basis. This was important for identifying, and subsequently ratifying, any gaps or
omissions in the questionnaire whilst still in the field. Next, staff at Aid’s head office in Islamabad
reviewed the questionnaires sent in by the Field Supervisors on a weekly basis. A third level of QA took
place once the data has been entered cleaned and analyzed. The sector specialists then prepared a Final
Report QA’d by the Project Advisor.
3.1.5 Sampling
In order to ensure that a
representative sample was
selected for the study, a multi
stage sampling method was
used. In the first stage the
seven districts were divided
into two clusters namely
Cluster A and Cluster B.
Cluster A consists of Swat,
Shangla, Buner and Malakand
while Cluster B consists of
Lower Dir, Upper Dir and
Chitral. The sample was
designed with a view to
16
See Annex 5 – QA Diagram

Evaluation of Immediate Impacts of CPI Projects under EERP by AiD Pvt Ltd
Page 21 of 60
36%
32%
12%
8%
7%5%0%
40%
30%
11%
8%
6%4%1%
Fig 1.2 CPIs by TypeDWSS
Road InfrstructureSanitation
Bridges
Irrigation
MHPNote:
Outside Ring: = Total EERP CPI sInside Ring: = Evaluation Sample
capturing the diversity of the entire Project area and the types of schemes.
A total sample of 60 schemes out of the total of 213 was randomly selected; this represents a
Confidence Level of 93% with less than 10% margin of error.
The total sample was first
distributed in terms of the
proportion of schemes in
each district and then further
divided according to the
number of each sub-type of
scheme, i.e. irrigation,
drinking water supply, roads
and drainage in each region.
The second list for ‘types of
schemes’ in each region was
first ranked in descending
order of number of
beneficiaries of the scheme, then the nth scheme of each subtype was selected based on an
approximation of the sample/the population17. See fig 1.1 and 1.2
The field teams managed to look at 26 schemes in district Swat, 7 each in district Shangla and Lower Dir,
and Malakand, 6 in district Upper Dir, 4 in Buner and 3 in District Chitral. Out of these 60 Schemes, 22
schemes were DWSS, 19 road infrastructure, 7 Sanitation, 5 Bridges, 4 irrigation and 3 were micro
Hydel18.
Ten additional schemes were chosen to replace any scheme from the initial selection that could not be
visited due to unforeseen circumstances, such as security concerns, inaccessibility etc. Eventually, four
schemes were selected from the list of ten to replace schemes that could not be visited.19
3.2 Stage 2 – Field Work
3.2.1 Pre-testing and Finalization of tools
After all formats, sampling and work planning was finalized the two teams were mobilized in the field.
Initially, they were accompanied by the Team Leader and sector specialists who supervised activities at
this stage. The data collection tools were initially pre-tested at two schemes in Swat. The team leader
led the pre testing exercise and both teams accompanied him for the exercise. After the pre-test, the
team held a session during which the forms were re-checked for any inconsistencies, gaps or
17
See fig 1.1 and 1.2 18
See Annex 3 Sampled 60 CPIs 19
This is further detailed in Stage 3: Challenges in the Field

Evaluation of Immediate Impacts of CPI Projects under EERP by AiD Pvt Ltd
Page 22 of 60
redundancies. The necessary changes were made to the data collection tools and the finalized forms
were used for all subsequent data collection.
3.2.2 Field Activities
The field teams adhered strictly to a predefined protocol for conducting visits to the CPI sites. Before
each visit, the engineers reviewed all available documentation for the scheme to be assessed on that
day. They extracted all necessary information before the social and engineering teams were taken
together to the site by the local SRSP representatives who were facilitating the visits.
Once the teams arrived at the village, the engineering and social teams split up; the engineers went to
the CPI to make physical verifications and fill out the corresponding forms. In the meanwhile, the social
sector team dispersed in the village; the females would fill questionnaires going from door to door,
whilst the men went to the hujra to meet with the males. The females would continue on to conduct
FGDs with those women who had not been included in the HH survey.
Once the engineers had completed the physical inspection of the schemes, the male researchers and the
engineers would gather the members and management of the all-male COs. Together, they would go
over all of the COs documentation and interview the management to assess the adequacy, or lack
thereof, of the O&M system in place for the scheme. Afterwards, the engineers and social researchers
would together to conduct an FGD with male members of the community; ensuring both members and
non-members participated.
3.2.3 Challenges in the field
The field teams faced a number of challenges working in some very volatile areas. The sample schemes
were spread out over a sizeable area and many were located in remote areas. SRSP’s outreach to these
areas is commendable; the schemes had been implemented in areas where no other government or
non-government entities had any presence. This meant many hours of driving and trekking through
often rugged and mountainous terrain for the field teams.
Some of the schemes could not be visited. For instance, two schemes from Swat; Chinawatt and Foladai
were replaced, as was one scheme in Buner. Chinawatt was replaced due to the fact that it could only be
reached after a three and a half hour walk through treacherous, snow covered mountain paths; a trip
that locals said was only advisable for locals familiar with the village. It was replaced with a scheme
implemented in Saidu Sharif. Foladai was replaced with a scheme in Deolai because Foladai was
rendered inaccessible due to torrential rains. Similarly, Malikpur, a village in Buner could not be visited
because there were on-going military operations in the area.
Evaluation of Immediate Impacts of CPI Projects under EERP by AiD Pvt Ltd
Page 23 of 60
3.3 Stage 3
3.3.1 Data Entry, Analysis and report writing
Data from the field was periodically sent to the AiD Head Office by the field teams for parallel data
entry. The final set of data from the field was received on 12th April when the entire team held a
collective work shop to discuss their experiences, recommendations and the lessons learnt.
The forms had all been coded for ease of management and to minimize the potential for errors.
Nonetheless, as per QA protocols, the forms received from the field were checked for any major
inconsistencies, missing information or collection errors. These forms were then passed on to data entry
operators who used Microsoft Excel™ spreadsheets to record the data.
The Excel™ spreadsheets were exported to Stata™ software which was used to analyze the varied forms.
After data cleaning, the Data Analyst prepared an extensive list of tables which were used to develop
the results and findings for the Final Report.
The final report is organized around the five Evaluation Parameters initially decided upon. Each
parameter has been given a separate section and the CPI’s have been analyzed in terms of each one in
great detail.
Evaluation of Immediate Impacts of CPI Projects under EERP by AiD Pvt Ltd
Page 24 of 60
4. Findings:
CPI Description:
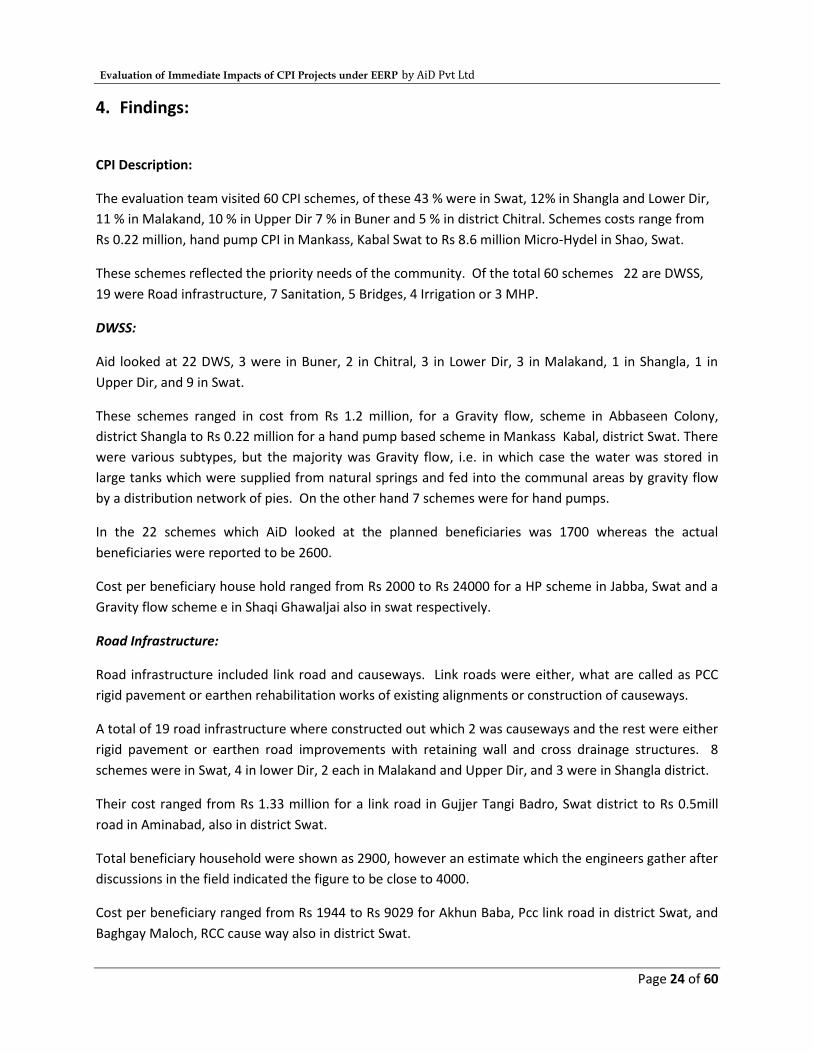
The evaluation team visited 60 CPI schemes, of these 43 % were in Swat, 12% in Shangla and Lower Dir,
11 % in Malakand, 10 % in Upper Dir 7 % in Buner and 5 % in district Chitral. Schemes costs range from
Rs 0.22 million, hand pump CPI in Mankass, Kabal Swat to Rs 8.6 million Micro-Hydel in Shao, Swat.
These schemes reflected the priority needs of the community. Of the total 60 schemes 22 are DWSS,
19 were Road infrastructure, 7 Sanitation, 5 Bridges, 4 Irrigation or 3 MHP.
DWSS:
Aid looked at 22 DWS, 3 were in Buner, 2 in Chitral, 3 in Lower Dir, 3 in Malakand, 1 in Shangla, 1 in
Upper Dir, and 9 in Swat.
These schemes ranged in cost from Rs 1.2 million, for a Gravity flow, scheme in Abbaseen Colony,
district Shangla to Rs 0.22 million for a hand pump based scheme in Mankass Kabal, district Swat. There
were various subtypes, but the majority was Gravity flow, i.e. in which case the water was stored in
large tanks which were supplied from natural springs and fed into the communal areas by gravity flow
by a distribution network of pies. On the other hand 7 schemes were for hand pumps.
In the 22 schemes which AiD looked at the planned beneficiaries was 1700 whereas the actual
beneficiaries were reported to be 2600.
Cost per beneficiary house hold ranged from Rs 2000 to Rs 24000 for a HP scheme in Jabba, Swat and a
Gravity flow scheme e in Shaqi Ghawaljai also in swat respectively.
Road Infrastructure:
Road infrastructure included link road and causeways. Link roads were either, what are called as PCC
rigid pavement or earthen rehabilitation works of existing alignments or construction of causeways.
A total of 19 road infrastructure where constructed out which 2 was causeways and the rest were either
rigid pavement or earthen road improvements with retaining wall and cross drainage structures. 8
schemes were in Swat, 4 in lower Dir, 2 each in Malakand and Upper Dir, and 3 were in Shangla district.
Their cost ranged from Rs 1.33 million for a link road in Gujjer Tangi Badro, Swat district to Rs 0.5mill
road in Aminabad, also in district Swat.
Total beneficiary household were shown as 2900, however an estimate which the engineers gather after
discussions in the field indicated the figure to be close to 4000.
Cost per beneficiary ranged from Rs 1944 to Rs 9029 for Akhun Baba, Pcc link road in district Swat, and
Baghgay Maloch, RCC cause way also in district Swat.

Evaluation of Immediate Impacts of CPI Projects under EERP by AiD Pvt Ltd
Page 25 of 60
Bridges:
Out of the 18 bridges which SRSP assisted with under the EERP project the team was able to see 5
bridges, 4 of which were pedestrian suspension bridges whereas 1 was a RCC bridge for regular traffic.
One of the suspension foot bridge were located in Buner, 2 were located in upper dir whereas 1 was in
Shangla. The RCC Bridge in Kamay, Swat.,
The bridge CPIs cost from Rs 0.92 million for the suspension bridge constructed in Bazarkot, district
Buner to Rs 2.5 million for the RCC bridge, constructed in Kamay Swat.
Bridges like roads benefit not just the immediate community which has been involved in the
construction of the scheme but any adjacent village or hamlet which is using it. In one case however the
team found that the HH reported were less than what were planned.
Cost per beneficiary varied from Rs 4585 for the Pedestrian suspension bridge in Swat to Rs 10123 for
Malow, in Upper dir.
Sanitation
7 schemes which addressed the sanitation and drainage of the communities were built. 5 of these are in
district Swat, whereas 2 are in Shangla. These schemes are mainly construction of drains and rigid
pavement
The total cost of each sanitation related scheme ranged from Rs 0.3 million for a drainage scheme in
Bazkhelin district Shangla , to Rs 1.2 million for the Street pavement and drainage in Shagai, district
Swat.
The total beneficiaries of the road infrastructure were reported to be 1430 instead of the originally
planned 1030. The cost per beneficiary ranged from Rs 1717 in village Faqira; district Swat, to Rs 11780
for Bazkhel, Drainage scheme where the number of beneficiaries was very low.
Irrigation:
Out of the total of 12 irrigation schemes which were done under EERP, the evaluation team looked at 4.
Most of them were in Swat district, and one in Malakand. The schemes range from installation of a
pump, to a construction of irrigation channel to channel lining and in one case construction of a
retaining wall.
The cost of the schemes range from Rs 0.55 million for the ram pump in Babu Maira in Swat to Rs 1.1
million for the irrigation channel lining and construction of retaining wall, in Meragai, Swat.
The total beneficiaries for the 4 schemes are around 800 HH.
MHP
The team visited 3 out of the 8 MHP done under EERP. One of these was in Swat; the other two in
Upper Dir and Chitral respectively.MHP are technically complex and relatively costly. The schemes cost

Evaluation of Immediate Impacts of CPI Projects under EERP by AiD Pvt Ltd
Page 26 of 60
ranged from Rs 2.7 million for the 50 Kw MHP in Khanabad, Upper Dir, to Rs 8.6 million for the 100 Kw
MHP in Bhamborate, Chitral.
Two of the schemes i.e. the one in Shao, Swat and Bhamborate, Chitral are being implemented using an
innovative approach of what is called a social enterprise in which both SRSP and the community are co-
managing the scheme.
The number of beneficiaries is around 900 and the cost ranges from Rs 12176 per beneficiary to Rs
31300 per beneficiary.
4.1 CPI documentation: Availability and Adequacy
The Engineer’s Desk Review constituted the first level of verification of the 60 CPI schemes mentioned
above. Before the schemes themselves were visited the engineering team assessed the availability and
adequacy of the CPIs’ documentation annexure 620, shows a simplified diagram of the PI process, and
the various documentation required.
The process of implementation of any CPI is triggered by a resolution from the Community Organization.
This resolution indicates that the community is interested in a development partnership have reached a
consensus on a priority problem which they would like to address in the shape of a possible CPI. This is
also, what can be termed as the culmination of a series of meetings called 1st dialogues.
Once a resolution is passed by the community, it is received by the local social organizer(s) who prepare
a Social Feasibility for the scheme. Engineers, meanwhile, prepare the required technical reports such
as Design and Estimates and carry out an Environmental Screening to ensure that there are no major
environmentally detrimental effects of the scheme.
If the results of the social and engineering reports and the environmental screening are found to be
positive and they fall within the criterion set by EERP, the scheme is given a formal approval for
implementation by the SRSP Head Office.
Afterwards, SRSP representatives engage the community in a ‘3rd dialogue’ during which a Terms of
Partnership (TOP) document is signed by the community. The TOP is included in the final Project
Proposal.
For record keeping, all copies of receipts, expenditures as well as any and all other documentation
pertaining to the construction of the schemes are to be maintained in a Physical Infrastructure (PI)
Register by the CO’s secretary.
Once the scheme is completed a Project Completion Report (PCR) showing the actual cost and date of
completion is prepared; the PCR also becomes part of the CO’s and SRSP’s records. If the schemes is
successful and is handed over to the community, and a Project Completion Certificate is issued.
20
Annex 6
Evaluation of Immediate Impacts of CPI Projects under EERP by AiD Pvt Ltd
Page 27 of 60
The evaluation team assessed the availability and adequacy of this essential documentation for each of
the sampled schemes and has come up with the following result. The detailed scheme wise summary is
available in a tabular form in the annexure. 21
4.1.1 Social Feasibility
A social feasibility report serves several functions; it shows that the Community Organization exists on
the ground, it has an open bank account, and that there was no conflict amongst the CO’s members in
general or around the priority ranking of the CPI itself.
All the 60 schemes sampled had the required Social Feasibility documentation and it was found to be
adequate.
4.1.2 Environmental Screening
Environmental Screenings were carried out using a simple template developed by SRSP for its field staff.
The screenings were used indicate whether or not the proposed project is safe for the environment and
weather a detailed environment assessment is to be made or not.
The Environmental Screening consists of a three stage process. At the first level, an environmental
sensitivity assessment is carried out. Environmental sensitivity is taken in terms of the proximity of the
proposed scheme to natural habitats/vegetation, slopes, populated areas, various kinds of wetlands,
historical and cultural sites, etc.
In the second stage, the level of environmental screening required for the scheme is determined based
on the results of the environmental sensitivity assessment. An Environmental Review (ER) is the basic
minimum level of screening required for all schemes, regardless of their ranking/categories from the
sensitivity assessments. Higher levels of screening; those which are more detailed and are to be
performed by professional environmentalists are required for schemes which rank poorly in the
environmental sensitivity assessment.
The Environmental Review is the third and final section of the environmental screening. The ER is used
to determine the potential negative impacts of the scheme on the environment and details the
measures that must be taken to mitigate those negative impacts. These mitigation measures must be
included in the schemes’ proposals.
Environmental Screening documentation was available for the first two stages, albeit partially in some
cases for 49 of the 60 schemes. The ES documentation for the remaining 11 schemes was either not
available or had not been filled in. Furthermore, the team was unable to see any Environmental
Review reports.
21
See Annex 1A

Evaluation of Immediate Impacts of CPI Projects under EERP by AiD Pvt Ltd
Page 28 of 60
4.1.3 Technical Feasibility:
4.1.3.1 Design Basis
The most crucial aspect of any technical feasibility is the design basis and assumptions on which the
schemes has actually been designed and estimated.
The table below shows some examples of the required design basis which would necessary for a correct
design.
S. No
Type of Scheme Required Design basis
1 Road/Bridge CBR or bearing capacity, Axle load, Details of construction joints
2 Drinking Water Supply Capacity, HH requirements
3 Drainage Rainfall Intensity, Catchment area
4 Irrigation Crop water requirements/Soil type
The design basis for 27 of CPI’s was not available or inadequate. Most of these were link road or
street pavements. Key information such as bearing capacities of soil and the Axle loads were
missing.22
4.1.3.2 Design Calculation
Once we have the design basis of any engineering structure or its component the next step is to
calculate the design parameters. Depending on weather a design is for a street pavements, roads or
drinking water supply storage tanks, for the engineer the design of the thickness, compaction of roads,
tank wall thickness, concrete slab thickness or reinforcement design, all need to be calculated. These
calculations are made to ensure the integrity and efficiency of the structure and to ensure that there is a
backup in case of any liability
For the schemes implemented by SRSP, it was found that the design calculations for 32 schemes were
not available. Of the remaining 28 schemes the Calculations for 10 seemed inadequate. For instance,
in the case of storage reservoirs, the calculations for the determining the dimensions of water tanks
were missing.23
4.1.3.3 Construction Drawings:
Construction drawings are needed to ensure that the community and labor working on the ground are
able to construct the schemes in accordance to the designs envisioned.
Accept for one scheme namely Jabba in district Swat, all the CPI proposals reviewed had at least the
basic schematic construction drawings attached as part of the project proposals. See table 1.4 24
22
See Annex 1 A Table 1.2 23
See Annex 1 A Table 1.3 24
See Annex 1 A Table 1.4

Evaluation of Immediate Impacts of CPI Projects under EERP by AiD Pvt Ltd
Page 29 of 60
4.1.3.4 Material and works specifications
Material and works specifications must be detailed because they are essential for ensuring the quality of
the construction is up to the standard anticipated by the project proposal. The site engineer and the
community must be very clear on what is to be used for the construction of the schemes and how it is to
be used.
All the CPIs mentioned what materials were required, such as bricks, sand and steel. However, it was
observed that invariably, there was no mention of the detailed specifications for these materials such as
the standard quality of the bricks, the type of sand or strength of the steel.
Detailed Material Specifications Should be:
Cement Grey Portland Cement shall be normal setting cement of make and source as approved by the Engineer. Cement shall conform to the requirements of ASTM C 150 unless otherwise acceptable to the Engineer.
Fine Aggregates
Fine Aggregate shall be clean River sand from an approved source of supply and of uniform quality having fineness modules between 2.3 and 3.10.Fine aggregates shall comply with the requirements of the relevant ASTM C-33 Specifications, and shall be graded as follows: Sieve Number/Size %age (by weight) passing 9.50 mm 3/8" 100 4.75 mm (No.4) 3/16" 95-100 2.36 mm (No.8) 3/32" 80-100 1.18 mm (No.16) 3/64" 50-85 0.6 mm (No.30) 25-60 0.3 mm (No.50) 10-30 0.15 mm (No.100) 2-10 Limits for deleterious substances of total sample shall be: Clay lumps and friable particles Maximum 3% by weight Material passing No.200 sieve Maximum 3% by weight Coal and lignite Maximum 0.5% by weight Weight loss of sand subjected to 5 cycles of soundness test when sodium sulphate is used shall not be greater than 10%.
Coarse Aggregates
Coarse aggregate shall be 3/4" down, hard crushed stone from a source approved by the Engineer. For members up to 3" thickness, 1/2" down crushed stone shall be used. Coarse aggregate shall comply with the graduation requirements of ASTM C-33 and shall be graded as follows:
Nominal Size of Graded Aggregates shall be 19 mm (3/4") down Sieve Number/Size %age (by weight) passing
19.00 mm (3/4") 90-100 12.50 mm (1/2") - 09.50 mm (3/8") 20-55

Evaluation of Immediate Impacts of CPI Projects under EERP by AiD Pvt Ltd
Page 30 of 60
04.75 mm (3/16") 0-10 02.36 mm (3/32") 0-5 Weight loss of coarse aggregate when subjected to 5 cycles of soundness test using sodium sulphate shall not exceed 12% and %age loss for Los Angles Abrasion (500 revolutions) not be greater than 50. Aggregates shall be screened and washed if required to the satisfaction of the Engineer
Water Water to be used in the work shall be clean water or approved by the Engineer. The community shall supply sufficient water for all purposes including mixing the concrete, curing, and cleaning plant and tools. It should be clean and free from injurious amounts of oils, acids, alkalis, salts, organic materials or other substances that may be deleterious to concrete or reinforcement. Where doubt exists as to the suitability of water, it should be tested in accordance with BS 3148.
Steel Unless otherwise specified, all deformed reinforcing bars shall comply with the requirements of ASTM 615 for deformed cold worked new stock billet steel bars and shall have a minimum characteristic strength of 40,000 lb. per square inch.
4.1.3.5 Costing/Estimates
The costing and estimates for all 60 schemes were checked and found to be correct.
4.1.4 Water Quality Test
Water Quality tests had to be carried out for DWS schemes to ensure that the water from these
schemes was potable.
Out of the 22 DWSS schemes Water Quality tests reports were available for all the schemes.
4.1.5 Project Proposal
The project proposals are detailed documents that cover the technical (engineering), social, procedural
and management aspects of the schemes. The engineering documentation listed in the previous
sections such as environmental assessment reports and design and cost estimates are part of this
proposal. Similarly, the objectives of the project, the roles of the key stakeholders and the protocols for
management of the project are all outlined in the proposal.
Project proposals for all 60 schemes were available, in the regional offices albeit some were
incomplete as mentioned elsewhere in this section.
4.1.6 Project Approval
All the schemes had received formal approval by the competent forum.
Project approval documentation was available for all schemes.
4.1.7 PI register
A PI register is to be maintained by the CO, typically by the CO’s secretary. The PI register contains all
documentation related to the implementation phase of the scheme, most commonly the receipts for
outlays during the construction phase, or for O&M.

Evaluation of Immediate Impacts of CPI Projects under EERP by AiD Pvt Ltd
Page 31 of 60
PI registers were available for 54 of the 60 schemes and most were diligently maintained, however,
the team was not able to see the PI registers for 6 schemes.25
4.1.8 Project completion report
The project completion report details the initially estimated quantities of various materials and labor
required for implementation of the CPI and the actual quantities used as well as the variation between
the estimate and actual outlays.
The project completion reports were missing at 4 of the schemes visited. Of the remaining 56,
completion reports for 5 were deemed to be inadequate because they did not have signatures of the
community members.26
4.1.9 PI completion certificate
A PI completion certificate is prepared by engineers once the scheme is ready for hand over to the
community. It lists the contributions made by the stakeholders and the dates of completion.
All of the CPI’s had completion certificates except Shao, MHP in Swat, and Bazarkot and Riaz Ambela
in district Buner.27
4.1.10 Handing and taking over certificate:
The Handing and Taking over Certificate is signed by the community members once the scheme has
been completed and is officially being handed over to them by SRSP. The certificate is a crucial for
ensuring the sustainability of the scheme since it makes official the community’s ownership of the
scheme and lists the members of the O&M committee. It also certifies that O&M systems have been put
in place, such as the opening of a bank account specifically to hold an O&M fund.
The Handing and Taking Over certificates were available for 55 schemes. Out of the remaining 1 had
failed, 2 schemes had not yet been handed over and 2 schemes did not have a certificate on file. 28
25
See Annex 1 A Table 1.5 26
See Annex 1 A Table 1.6 27
See Annex 1 A Table 1.7 28
See Annex 1 A Table 1.8

Evaluation of Immediate Impacts of CPI Projects under EERP by AiD Pvt Ltd
Page 32 of 60
4.2 Design Validation
This section outlines the Engineering Team’s findings of the physical validation of the various design
parameters of the CPI’s. The design parameters verified include scheme layouts, design measurement,
material specifications as well as the workmanship, the scheme outcomes, environmental screening,
operation & maintenance, and finally the schemes functionality, efficiency and effectiveness.
This section in particular covers the findings from the layout and design, environmental screening, and
material validation, the rest of the findings from the engineers visit to the site are in their relevant
sections which follow.
4.2.1 Scheme Layouts:
The scheme layout was verified on how the various CPI components are laid physically on the ground.
For example the alignment of the road, or the location of the various structures mentioned in the
design.
The engineering team conducted site visits to all sample schemes to validate the physical layout and
schemes layout. It was observed that except for 9 CPI29 all the rest were implemented according to the
planned layout.
The major problems either related to a difference of what was observed in the pipe network, such as
missing pipes or tanks observed at Yakh Tangay village in Swat, Banjo Tangay in Buner, Abbaseen village
in Shangla and missing elements, such as RCC culverts in village Gujjer Tangi Swat30.
Five schemes were found to have minor problems. For example the design of the Gravity Flow DWSS
(GF) in Sory Kad village, Swat, showed two supply lines were showing in a schematic layout but it was
observed that instead of two lines, four lines were originating from the tank. However, despite the
deviation from the scheme layout, the desired design discharge was acquired satisfactorily. In Asilo
village, Lower Dir, the designed/proposed layout of distribution lines of the DWSS had not been adhered
to on site. Similarly the drawings of the Gravity Flow scheme in Ambela village, Buner, indicated that 4
supply lines were originating from the storage tank. However, it was observed that 05 distribution lines
were in connection with the storage tank.
4.2.2 Design Validation:
All the 60 schemes were checked to validate the design in terms of the measurement of the structure,
the material used and its workmanship.
It was reported that 48 % of the schemes were found to be exactly as per design, 34% had minor
variations and were marked as satisfactory. However, 18 % had major variations, from what was
originally planned.
29
See Annex 1 B 30
See Annex 1 B

Evaluation of Immediate Impacts of CPI Projects under EERP by AiD Pvt Ltd
Page 33 of 60
The schemes with variations either had missing structures, such as those at Sanam village in Shangla,
Gujjer Tangi & Mankass Kabal in Swat and Faqira, in Swat, or the measurement of structures did not
match as was the case in, Banjo Tangy DWWS , district Buner, Abbaseen Colony, DWSS in district
Shangla, amongst other.31
4.2.3 The following is a type wise breakdown of the CPIs:
4.2.3.1.1 Drinking Water supply Schemes
Out of the 22 schemes the design and layout of 4 schemes could not be validated on site. For e.g. In
DWSS Yakh Tangay, district Swat, Banjo Tangay, district Buner, Abbaseen Colony in District Shangla, and
Danwa, Lower Dir, the original design has a different configuration than what is on site. In Kuru Bala,
Chitral, the community has not built the Dug well where originally laid out by SRSP, and as a result the
scheme has failed.
4.2.3.1.2 Road Infrastructure:
Out of the 19 road infrastructures which were visited, there was one scheme for which a layout could
not be seen. Only 2 were found to be out of sync with the original layout. Gujjer Tangi, Islampur in
district Swat, did not have 7 culverts originally designed, similarly in Baghgay Maloch, also in district
Swat, the layout of the culverts is different from what was shown in the project proposals. See table for
detail
Furthermore, the measurements of the structures in road infrastructure CPI in village Samteer and
Aminabad, district Swat and village Sanam, district Shangla did not match with was planned. See Table
for details.
4.2.3.1.3 Bridges
All the bridges were on the spot which they were planned for; however the design basis or calculation
were missing. Only in the case of Tangir we have some design however the calculations were not
adequate.
4.2.3.1.4 Sanitation:
The layouts of all the schemes were found to be as planned. However the design for drains and
pavement did not have a technical basis or any reference.
4.2.3.1.5 Irrigation
The layout of the schemes are fine, however there are discrepancies in measurement of the structures
in the case of Meragai and Babu Maira scheme. In the case of Babu Maria a tank has been constructed
which is not part of the original design and is not mentioned in the documentation, where as in the case
of Meragai, the retaining wall is shorter and also lower than what was proposed.
4.2.3.1.6 Micro Hydel Project
All the schemes have been constructed as per documented layout and design
31
See Annex 1 B

Evaluation of Immediate Impacts of CPI Projects under EERP by AiD Pvt Ltd
Page 34 of 60
4.3 Relevance
From the GoKP’s viewpoint one key document which indicates the priority areas of investment of the
GOKP for Malakand Division is the Malakand Strategy prepared in 200932. It is noteworthy that one of
the means to achieve its objectives, the strategy envisions the rehabilitation or building of road and
bridges, water and sanitation, irrigation, and power Infrastructure. The CPIs done under EERP closely
match the priority of the GoKP as it has set down in its strategy document.
AusAid is concerned EERP comes under its objectives # 3 for Pakistan as it is explained in the Pakistan Annual Program Performance Report 2011 33, this is;
Sustainable economic development—through increasing agricultural productivity and improving rural livelihoods.
All the CPIs contribute towards improving rural livelihoods; on the other hand sustainable development requires sustainable institutions which at the local level would require a longer period of engagement with the communities than the timeline available under the EERP. Perhaps SRSP would needs to creatively develop a ‘sustainability’ pool towards which any client contributes when engraining SRSP. To directly gauge the perceptions of the local communities both a HH survey and Group discussions with
local communities in all the 60 villages where the CPIs were implemented.
To assess relevance, the HH survey grouped related questions under 3 indicators one asked them
directly about whether the scheme was a priority for the whole community. The second related to their
participation in the implementation process and third was about their contribution in cash or kind.
4.3.1 Priority
An overwhelming majority, 98 percent of all people surveyed in 6 districts said that they considered the
CPIs which were implemented by SRSP a priority. This response is more or less the same across all the
districts, and gender. What is significant is that the response for non members is also very similar and
97.3 % also said that the scheme was a priority need of the community.
4.3.2 Participation
The highest participation was in districts Chitral (100 percent), where the community members felt they
had participated thought the implementation of the schemes. Whereas he lowest level of participation
about 60 % was reported from Shangla.
32 Government of Pakistan’s Comprehensive Stabilization and Socio-Economic Development
Strategy for Malakand Division. 2009 33
http://www.ausaid.gov.au/Publications/Documents/pakistan-appr-2011.pdf

Evaluation of Immediate Impacts of CPI Projects under EERP by AiD Pvt Ltd
Page 35 of 60
Given the socio cultural
norm of the area it was not
surprising that participation
of females was low.
Participation in
identification and planning
/implementation ranged
from a very low of 6% for
both Upper and Lower
where around 11 % of the
respondents were
members, to 67 % for
Chitral where membership
for WO was 100 %.
Irrespective of that 96 % of
the female respondents felt
that the CPI was a priority
need.
The FGD analysis supports
the findings of participation
of females, with males more
involved. Approximately 17
percent female participants
claimed that 'no one' was
involved and/or interested
in the project-related
activities, as compared to 3
percent males who
reported the same. Another
23 percent females were unaware/unable to comment on the query. While 63 percent male FGD
participants claimed that most and/or all members fully involved, only two-third of the females (43
percent) thought the same. The highest rate of responses regarding non-interest were from Swat (23
percent), while FGD participants claimed high levels of full involvement in Buner, Malakand Agency and
Shangla. Scheme-wise, the FGD participants claimed to be most involved in irrigation (71 percent).
4.3.3 Community Contribution
One indicator on how relevant the community considers initiation and implementation of any project
can be determined by how much they are willing to contribute towards it – in terms of cash and/or in
kind (labor, etc). This is also an important indicator to ensure high (or low) levels of ownership of the
project, so that chances of its sustainability are higher. In terms of community-based contribution to the
construction (cash and/or in kind), 77 percent of the respondents claimed to have made contributions
(75 percent females; and 79 percent males). The highest amounts of contributions were made in Chitral,

Evaluation of Immediate Impacts of CPI Projects under EERP by AiD Pvt Ltd
Page 36 of 60
Graph 3.2: Community contribution in CPI construction
Graphs 3.3 & 3.4: Mean cash distributed by location and type of CPI scheme (PKR):
Upper Dir and Buner (100, 92 and 83 percent, respectively). Pl see the graph below for contribution
towards different
CPI schemes.
Interestingly, an
equal amount of
non-CO members
(approximately 77
percent) as
compared to their
counterpart
members
contributed
towards the
construction of CPI schemes.
Of the households that contributed positively, 17 percent of them contributed cash. An average of PKR
5800 was contributed these respondents, where the male average was PKR 8000 and the female
average was approximately PKR 4500. The highest frequency of cash contributions (30 percent) was
witnessed in Shangla; the highest amount in Chitral (PKR 60000); and the CPI scheme contributed most
towards was street pavements and drainage (20 percent).
Around 70 percent of the respondents (25 percent; CO members and 15 percent; non-CO members) also
contributed in kind offering themselves for labor, mostly in Buner and Malakand Agency (90 and 81
percent, respectively). The average number of labor days contributed by both males and females was
31, which was spent evenly on each CPI scheme.
Further, 20 percent of respondents contributed additional items in kind, almost evenly (20 percent)
across districts, with the exception of Chitral (40 percent) and Malakand Agency (no additional
contribution). These included the following, district- and CPI scheme-wise:

Evaluation of Immediate Impacts of CPI Projects under EERP by AiD Pvt Ltd
Page 37 of 60
4.4 Effectiveness
The second evaluation parameter, effectiveness, was evaluated in terms of weather it is fulfilling the
needs it was designed to meet, is it operational.
Accordingly, the indicators identified for Effectiveness were: Functionality of the CPI schemes; benefits
for community members; and problems encountered with the schemes.
4.4.1 Functionality:
As part of the approach, functionality of the scheme was also checked on site by the field engineers. In
this regard they were able to check 55 CPIs out of the total sample of 60 and found that 95 % of the CPIs
were functioning well whereas 5% or 3 schemes had some problems.34
Out of the remaining 5 CPIs which could not be checked, 4 were not operational at the time of the visit
and 1 dug well DWSS, had been declared a failure due to unavailability of groundwater.
The 4 schemes were not operational at the time of the visit included the MHP scheme in Shao Kalam,
district Swat and Khanabad, district Upper Dir, Irrigation CPI in Meragai Swat and DWSS Dardyal, district
Swat. The two MHP had technical breakdown and were in the process of being repaired by the
communities, whereas, the Irrigation Channel in Meragai Swat was not operational, since it was not an
irrigation season, whereas in the case of DWSS Dardyal, Kabal Swat, the intake structure had been
damaged due to a snow slide and the communities were waiting for the snow to melt before attempting
any repairs. schemes which were non operational included the MHPP scheme in Shao Kalam and
Khanabad, in Upper Dir, both of them had technical breakdown and were in the process of being
repaired.
4.4.1.1 Functionality: DWSS
All the schemes were fully functional accept for 2. One of them was a gravity flow scheme Dardyal, in
Kabal, Swat and the other was a hand pump scheme in Sher khan, Swat, where out of 5 hand pumps of
to 3 were working.
In the case of Kura Bala, the community decided to relocate the originally location for the CPI to one
which was closer to them, however despite digging to a depth of 90’ the well remains dry and has been
officially declared as a failure
4.4.1.2 Functionality Road Infrastructure
Despite the problems mentioned, all the schemes were functional albeit, in some cases partially as was
the case of Link Road in Gujjer Tangi, district Swat, Feza, and Sur Kamar in District Shangla, where either
the cross drainage work were not functional or some portions of the road had been severely eroded.
All bridges were found to be functional and effective.
From the HH survey, approximately 91 percent of the respondents acknowledged that the CPI schemes
were functional across the 7 districts. When asked how effectively the CPI schemes were delivering, the
34
See Annex 1B Table 2.6

Evaluation of Immediate Impacts of CPI Projects under EERP by AiD Pvt Ltd
Page 38 of 60
female respondents gave more optimistic assessments stating that 86 percent of the schemes were 100
percent functional, as compared to the more cautious replies of male respondents, claiming 61 percent
of the schemes to be fully functional. Another 3 and 26 percent females and males, respectively stated
that the schemes were functioning above 75 percent, making the overall gender-wise level of
satisfaction equal. Scheme-wise, on average, 72 percent of the schemes were termed fully (100 percent
delivery). Scheme-wise, on average, 72 percent of the schemes were fully (100 percent delivery) and 15
percent partially functional (delivery above 75 percent) across the 7 districts (see Graph 3.6 below).
Graph 3.5: Functionality of CPI scheme – by district
A minor percentage (3 percent) of respondents claimed that the non-operational CPI schemes were only
so for less than three months.
Graph 3.6: Level of functionality of CPI schemes
FGD analysis supported the overall satisfactory responses from majority of the male and female
participants. In some cases, respondents gave mixed reviews, such as in Chitral, where 33 percent
reported that certain schemes were currently not working, and 67 percent stated that the schemes over
there are working and they had no further complaints. CPI scheme-wise, the data is reflected in Table
3.1 (Annex: 1-C).
86
14
69
31
100
0
100
0
96
4
91
9
82
18
% %
Yes No
Is the CPI functional at present?
District Buner
District Chitral
District Lower Dir
District Malakand Agency
District Shangla
District Swat
District Upper Dir
71
18
1 2 7
80
3 0 6 11
75
18
2 5 0
75
145 6
0
50
0
17
0
33
% % % % %
Delivering 100%
Delivering 75% Delivering 50% Delivering 25% Delivering 0%
Total Drinking water supply
Total Irrigation
Total Link road/Bridges
Total Street pavement and drainage
Total Other

Evaluation of Immediate Impacts of CPI Projects under EERP by AiD Pvt Ltd
Page 39 of 60
There appeared to be no bias in positive responses of CO members who fully ‘owned’ the process, as
opposed to the opinions of non-CO members, where 89 and 87 percent of both types of respondents,
respectively acknowledged that the CPI schemes were between 75 to 100 percent functional.
4.4.2 Benefits
Community response was close to what the engineers found on the ground. The result of the HH survey
Overall 90 percent of respondents claimed to be directly benefitting from the CPI schemes; including 67
percent of CO members and 58 percent of the non-CO members surveyed. Further, responses reflected
that 80 percent of the surveyed people were benefiting from the CPI schemes in Chitral, reinforcing this
district’s high rates of proactively in planning, implementation and cash contribution.
A gender-wise break down reflects 67 percent satisfied male respondents and 100 percent females
claiming to be directly benefitting from the CPI schemes there. Approximately 87 percent of the females
reported to be directly benefitting from the CPI schemes, with 100 appreciations in Chitral, Shangla and
Upper Dir. All CPI schemes were allocated above 86 percent priority by females, with irrigation reported
to be 100 percent important for them. Female priority, based on CPI schemes is as follows:
Graph 3.7: Female perception of direct benefits from CPI schemes
Respondents in Shangla and Lower Dir claimed to be the most satisfied direct beneficiaries (100 and 97
percent, respectively), consistent for both males and females. Of the female respondents, 86 percent
claimed to be direct beneficiaries, as compared to 93 percent of males.
73.150
100 97.1 100
26.950
2.9
Drinking water supply
Irrigation Link road/Bridges
Street pavement
and drainage
Other
Type of CPI
Are you directly benefiting from the CPI? No %
Are you directly benefiting from the CPI? Yes %
YES: Directly
benefitting
NO: Not directly
benefitting

Evaluation of Immediate Impacts of CPI Projects under EERP by AiD Pvt Ltd
Page 40 of 60
Graph 3.8: Overall perception of direct benefits from CPI schemes
Graph 3.9: Direct beneficiaries of CPI schemes – CO members and non-members
An enlightening aspect is that even a high number of non-CO members (88 percent) were gaining
positive externalities from the implementation of the CPI schemes. Reasons for respondents not
79
21
88
12
100
0
93
8
83
17
% %
Yes No
Are you directly benefiting from the CPI?
Type of CPI Drinking water supply
Type of CPI Irrigation
Type of CPI Link road/Bridges
Type of CPI Street pavement and drainage
91
9
88
12
% %
Yes No
Are you directly benefiting from the CPI?
CO/VO Membership Yes
CO/VO Membership No
YES NO

Evaluation of Immediate Impacts of CPI Projects under EERP by AiD Pvt Ltd
Page 41 of 60
In terms of related responses of satisfaction levels through the FGD analysis, 80 and 76 percent male
and female respondents, respectively claimed to be aware of and receiving most and/or all the intended
benefits of the CPI schemes. Highest claims (above 80 percent responses) were received in Lower Dir,
Malakand Agency and Shangla; and CPI scheme-wise for link roads and bridges; and street pavements
and drainage.
4.4.3 Problems
The highest complaints of problems were reported in Upper Dir, followed by Shangla (19 and 11
percent, respectively). Overall, 10 percent respondents identified the problems in street pavements and
drainage, and 7 percent in link roads and bridges (and 55 percent in ‘other’ schemes). A list of problems
is given in Table 3.4 (see Annex 1-B). The following graph shows the gender-wise break down of
respondents’ reporting problems, if any, with the CPI schemes – less than 10 percent reported any
complaints:
Graph 3.11: Gender-wise break down of respondents’ reports of problems with CPI schemes
In terms of whether or not the respondents perceived the projects as being cost effective, results from
the FGDs reflect a high level of unawareness of females as opposed to almost all males 98 percent
sharing their viewpoints, with male perceptions spread out across the options. One female stated during
5
1
11
6
2Have access to another source
The household is from another caste/tribe/social class
Low quality of output from the CPI
High cost/user fee of the CPI
The House is far away from the CPI location
Other
9
91
07
7517
% % %
Yes No Don’t know
Are there any problems/issues with the scheme at the time of interview?
Sex Male
Sex Female
All Females
1 Female; 1 Male
Female
Female
Male
4 Males; 2 Females
Evaluation of Immediate Impacts of CPI Projects under EERP by AiD Pvt Ltd
Page 42 of 60
an FGD that ‘this topic was male domain’. The projects in Chitral were proclaimed most cost effective by
67 percent respondents during the FGDs. Details are given in Table: 3.5 (see Annex 1-B).
4.5 Efficiency:
The efficiency of CPI construction has been evaluated with regard to the completion of the CPIs within
the specified time and costs.
In terms of time taken for completion, it was found that 95% of the schemes were completed within the
planned timeframe. In terms costs, 87 % of the sample schemes were completed within the estimated
budgets. . A relatively modest 7% of the schemes were completed at over 10% of the estimated cost
while 6% were completed under the estimated budgets. What is significant to note is that in case of cost
overrun, local communities contributed to cover the balance.
Assessment of the comparative beneficiary costs from earlier studies show that SRSP investments are
generally cost effective.
As a comparison, one study done in Nov 2002, “Cost and Impact Analysis of Water Supply and
Environmental Sanitation in Pakistan” by Pakistan Institute of Development Economics Nov 2002, shows
a figure of Rs 14228/HH for Government of KP and Rs 5521/ HH for NGOs for Water supply and
Sanitation schemes. Adjusted for inflation this would be close to Rs 13000 per HH today.
On the other hand, based on the data of the sample schemes the average cost of the EERP Sanitation
CPIs this comes to Rs 3430/ HH about 3-4 times less in terms of cost per beneficiary.
Although hard comparative data is not available for similar sized schemes which the GoKP or other
organizations have implemented, there is anecdotal evidence that cost per beneficiary in the case of
SRSP CPIs is relatively low. One reason is community contributions which on average is at least 20 % of
the total cost of schemes
4.6 Sustainability
The sustainability of EERP CPI and for that matter any infrastructure relate to its technical design, quality
of construction and system of O&M. In case the scheme has been poorly designed or constructed, even
a good O&M system will struggle to keep it going. On the other hand even if the structure has been
designed and built to the best of standards, it will deteriorate over time if not maintained properly.
4.6.1 Design and layout.
The CPI scheme designs invariably are based on the traditional technologies and designs being used in
the area. Scheme design were available for more than half the schemes however as mentioned earlier
that there was no design basis for 27 CPIs was either not available or inadequate and similarly design
calculations were missing from 32 schemes. All the construction drawing were very basic and left the
details to the discretion of the technician on the ground.

Evaluation of Immediate Impacts of CPI Projects under EERP by AiD Pvt Ltd
Page 43 of 60
About 15 percent of the schemes had changed the layout significantly from what had been planned.
Although this is not a bad thing in itself, since for a community based project needs to have an inbuilt
flexibility to match the conditions in the field. On the other hand this also reflects on the weak
feasibility and lack of time given to technical planning and thinking.
Workmanship in a large number of schemes was found to be excellent. This was despite the difficulty in
carriage of material and water for curing. One example is the RCC Bridge in Kamay, in Swat district.
The quality of workmanship at the sites was also observed in the field. It was found that, at 44% of the
schemes workmanship were ranked good and at 38% it was found to be satisfactory. However, 18% of
the schemes were ranked as being poor quality work.
Road alignments, wear and tear, poor surface finishes and honey combing in concrete structures
resulting from poor quality of workmanship was observed in villages Feza, Sanam & Sur Kamar in
Shangla. In Gujjer Tangi, Swat road cutting was carried out without proper slope35.
To further get some depth in understanding the key indicators i.e. quality of the CPI schemes; and the
Operations & Management (O&M) systems put in place (including transparency) were also explored in
the HH survey and the FGD.
35
See Annex 1-B Table 2.5

Evaluation of Immediate Impacts of CPI Projects under EERP by AiD Pvt Ltd
Page 44 of 60
Graph 3.12: Percentage of respondents who considered good quality of CPI schemes
4.6.2 Quality
When inquired, 91 percent of
the respondents (92 and 89
percent, respectively) were
satisfied with the current
condition of the CPI schemes.
Other than only 84 percent
satisfaction in Swat (86 and
82 percent for males and
females, respectively), all
respondents elsewhere
claimed above 88 percent
satisfaction, with 100 percent
in Lower Dir. In the districts of
Buner, Chitral and Malakand
Agency, while male
respondents were 100
percent satisfied, female rate
of satisfaction ranged
between 86 to 97 percent. Approximately 9 and 14 percent of females were dissatisfied with drinking
water supply; and link roads and bridges, respectively and above 93 percent satisfaction levels for the
rest of the CPI schemes. As for males, only 75 percent were satisfied with the irrigation scheme; 92
percent with link roads and bridges, and above 93 percent with the rest of the CPI schemes.
Interestingly, 87 percent of non-CO members showed satisfaction with the CPI schemes, as opposed to
94 percent of CO members.
In the household survey, fewer females (68 percent) rated the material used in the CPI schemes as
‘good’, as opposed to males (89 percent). Additionally, 20 percent of females also claimed to be
unaware/unable to respond/make a judgment. In Upper Dir, only 55 percent of the respondents
perceived the material used to be as ‘good’ and 70 and 74 percent in Lower Dir and Shangla,
respectively, while the rest of the districts received responses between 82 and 96 percent. Interestingly,
a considerable percentage (82) in Swat perceived the material used as ‘good’, despite overall
satisfaction levels stated as low. Overall 79 percent of the respondents termed the material as ‘good’. In
the case of link roads and bridges, 77 percent of the respondents perceived the material used as ‘good’;
and 13 percent labeled it as ‘average’ or ‘poor’; while 11 percent said they ‘didn’t know’. A detailed CPI
scheme-wise breakdown is given in Annex: 1-C in Table 3.3, whereas the percentage of respondents
who considered the quality good is presented in Graph 3.12.
Once again, 79 percent of the non-CO members cautiously rated the material used in CPI schemes as
‘good’, as opposed to 86 percent of the CO members with the same rating.
Similarly, workmanship of the construction was rated as ‘good’ by 73 percent of the respondents; 59
percent by females and 85 percent by males. Only 36 percent of the respondents in Upper Dir labeled

Evaluation of Immediate Impacts of CPI Projects under EERP by AiD Pvt Ltd
Page 45 of 60
the workmanship as ‘good’; and overall 68
percent respondents’ perceiving the
workmanship of link roads and bridges as
‘good’; thus, both reflecting consistent results as
above.
Pre-testing of the scheme before hand over to
the community is another important aspect to
ensure the quality of the scheme. Overall 68
percent of the respondents (73 percent males;
and 58 percent females) claimed that the CPI
schemes were tested before being handed over
according to their communities. Complete pre-
testing was undertaken in Buner.
4.6.3 O&M systems
The engineering reports suggest that for the schemes which were functional, O&M existed and
functioned only partially at 22% of the sites, while at 30% there was no functional system for O&M36.
The 15 schemes which were not performing O&M works were lacking in this regard because:
No O&M committee existed in PI register Meragai, Gujjer Tangi Badro & Khan Palao in Swat and
Khan Abad in Upper Dir.
No O&M systems or protocols were available for the implementation of maintenance works at a
majority of the schemes.
In some villages, O&M committees existed but were not performing their roles & responsibilities
in this regard. Bazkhel Sanam & Sur Kamar in Shangla are examples of this case.
O & M problems were observed in Sher Khan Bazdara, Malakand, Mankass, Kabal, and Swat. In all these
schemes there ‘seems’ to be no system to resolve the problems because of which the scheme is non
functional. As a result, the whole community is suffering.
In the case of Bazkhel, district Shangla, the scheme is pretty much non functional, since the drains a
clogged and there does not seem to be any organized effort towards making it functional again.
Existence and functionality of O&M systems are indicators that can determine community levels of
ownership and acceptability of the surrounding CPI schemes. Knowledge of any O&M system was
generally low with 76 percent males; and only 20 percent females acknowledging them, with the least
amount of awareness in Lower and Upper Dir (overall 40 and 42 percent, respectively).
36
See Annex 1 Table 2.4
29
100
38
8
23
0
Awareness of any O&M Committee Males'Yes'
Buner
Chitral
Lower Dir
Malakand AgencyShangla
Swat
Upper Dir

Evaluation of Immediate Impacts of CPI Projects under EERP by AiD Pvt Ltd
Page 46 of 60
Approximately 39 percent of respondents claimed to have made contributions to O&M; 32 percent
males and 50 percent females; mostly in Chitral (overall 91 percent contributions) and less than 45
percent elsewhere. The largest contribution was in irrigation schemes (55 percent); and ‘others’ (77
percent). While 52 percent of CO members interviewed claimed to have contributed to the O&M of the
CPI schemes, even 49 percent of the non-CO members that were surveyed claimed to have done so as
well. Majority of the respondents (overall 28 percent) claimed to pay for as and when required. The high
spirit of community members to contribute and even take charge of maintenance was quite apparent
during the FGD sessions. The breakdown of CPI scheme-wise contributions is as follows:
Table 3.7: How do you pay money for maintenance?
Monthly Annually When Needed
Never Don’t know
% % % % %
Type of CPI
Drinking water supply 6.4 2.9 26.9 24.0 39.8
Irrigation 44.4 14.8 40.7
Link road/Bridges 30.3 46.1 23.6
Street pavement and drainage
9.0 38.8 52.2
Other 39.3 42.9 14.3 3.6
Additionally, overall 23 percent, but interestingly 29 percent females and only 18 males claimed
knowledge of the existence of an O&M committee. There were very stark contrasts in female and male
respondents in Malakand Agency and Shangla, where awareness levels of female respondents appeared
to be comparatively very high.

Evaluation of Immediate Impacts of CPI Projects under EERP by AiD Pvt Ltd
Page 47 of 60
Graphs 3.13 & 3.14: Awareness of O&M Committees – by gender
Existence of maintenance funds were acknowledged for drinking water and supply (33 percent); and link
roads and bridges (32 percent); and the rest for ‘others’ (90 percent). Respondents stated they were
aware that most of the maintenance funds were being run through SRSP and then CO bank accounts
(Table: 3.8). Overall, 8 percent of respondents believed that the O&M fund covers its own maintenance
costs, 44 percent believed that it covered none. Approximately 39 percent of the respondents reported
any knowledge of an O&M Committee; 30 percent denied it; and 32 percent reported no knowledge
whatsoever – 66 percent females did not know, as compared to 12 percent male respondents.
Table 3.8: How are the funds being maintained?
CO bank Account
With Project
Committee
With the CO
Manager
With the SRSP
Don’t Know
Own help
% % % % % %
District Buner 33.3 44.4 22.2
Chitral 68.8 6.3 18.8 6.3
Lower Dir 100.0
Malakand Agency 16.7 41.7 41.7
Shangla 27.3 18.2 36.4 9.1 9.1
Swat 6.5 15.2 39.1 17.4 21.7
Upper Dir 100.0
A gender-wise analysis of how decisions are made for the fund shows that a very small percentage of
females agreed that they – the beneficiaries and/or the CO members - had any say (5 percent); whereas
SRSP and others were the main decision-makers (see Table 3.9 in Annex 1-B for more details).
Approximately, 12 percent females and 25 percent males claimed to be members of the O&M
Committee. Overall highest membership was in Shangla (41 percent). Overall satisfaction with the
Project Committee is provided in Tables 3.10 and 3.11 in Annex 1-B, both district- and CPI scheme-wise,
with Chitral once again topping the list with 100 percent satisfaction (rated between ‘OK’ and ‘good’).
The highest level of satisfaction with the Project Committees was reported in Street pavement and

Evaluation of Immediate Impacts of CPI Projects under EERP by AiD Pvt Ltd
Page 48 of 60
drainage, where 56 percent rated it as ‘good’, and 44 percent selected, ‘OK’, ‘poor’, and/or ‘don’t
know’.
With regards to their views on transparency in the planning, development and O&M of the CPI schemes,
the FGD analysis reflects that 53 percent male respondents claimed to be satisfied. Only 24 percent
female respondents claimed the same, but an additional 65 percent of them also stated that they were
unaware. Highest levels of efficiency with regards to perception of transparency were found in Chitral
(83 percent); and Buner (50 percent). The FGD respondents were most satisfied with transparency and
availability of records in the CPI schemes of street pavement and drainage (64 percent). A detailed table
(3.12) can be found in Annex 1-C.
4.6.4 Institutional Maturity
A follow-up to ‘Sustainability’ this is the evaluation parameter addressed in this sub-section: Institutional
Maturity of the CO, which assesses the capacity building of the communities to enable permanent
running of the CPI schemes by themselves in the long-run. Such an assessment can be determined with
the help of the following indicators: Community meetings during- and post-implementation of CPI
schemes; trainings of community of members; and community’s ability to self-initiate additional
schemes.
4.6.5 Meetings
While 23 to 40 percent of all respondents claimed to have met for planning and construction discussions
on need-basis for each CPI scheme; 67 percent of respondents claimed to meet fortnightly on irrigation
schemes, followed by 44 and 41 percent on street pavements and drainage; and drinking water supply,
respectively. Even non-CO members claimed to participate in such discussions, mostly fortnightly (38
percent); and on need-basis (49 percent).
District-wise, respondents appeared the most active in Malakand Agency, where 69 percent claimed to
meet on a fortnightly basis. In Swat and Lower Dir, the frequency was more monthly and/or on need-
basis:
24.6
20
22.1
56.1
Graph 3.15: Performance rating of Project Committees (Good %)
Drinking water supply
Irrigation
Link road/Bridges
Street pavement and drainage

Evaluation of Immediate Impacts of CPI Projects under EERP by AiD Pvt Ltd
Page 49 of 60
Table 3.13: How often did you meet during the CPI planning & construction stages?
Total
Fortnightly Monthly On need basis
Never %
% % % %
District Buner 42.3 11.5 38.5 7.7 100.0
Chitral 61.9 38.1 100.0
Lower Dir 9.1 33.3 42.4 15.2 100.0
Malakand Agency 69.4 13.9 16.7 100.0
Shangla 54.5 27.3 18.2 100.0
Swat 47.5 18.8 33.7 100.0
Upper Dir 13.3 36.7 33.3 16.7 100.0
In terms of frequency of meetings during the planning and construction phases of CPI schemes, the
gender breakdown is as follows, with 47 percent males (females; 20 percent) reporting to have gathered
on a fortnightly basis, while 40 percent females (males; 20 percent) claimed to meet only on needs-
basis. Approximately 34 percent females claimed to have ‘never’ participated. Understandably, given
the cultural constraints, once again, males appeared to be more active and females perhaps being
unaware or unable to participate that constructively.
With regards to frequency of meetings after the completion of the CPI schemes, the highest number of
responses, scheme-, gender- and district-wise were unanimously reported as on ‘need-basis’.
4.6.6 Trainings
In addition to membership, training can be another key indicator of how active a CO is and the level of
awareness of its members. 46 percent of the respondents/members claimed to have received any
training in the Committee. Interestingly, even non-CO members37 claimed to have received training. The
nature of training received, both gender- and CPI scheme-wise is illustrated below. Females received the
highest amount of training in financial management, and males in leadership. However no respondent
or any female member was given any O&M training as compared to male 15 % for male. Similarly, CPI
scheme-wise, the greatest amount of training was received for leadership and financial management,
according to 47 and 21 percent respondents, respectively, with consistent male and female breakdown
below (and a CPI scheme-wise breakdown in Table 3.9: Annex 1-C):
37
Approximately 25 percent of non-CO members interviewed; possibly trainings under some other organizations.
Table 3.14: Nature of Trainings
Gender breakdown
Total
Disaster Preparedness
Financial management Leadership O & M Any other
%
% % % % %
Sex Male 3.5 15.8 50.9 13.2 16.7 100.0
Female 56.3 18.8 25.0 100.0

Evaluation of Immediate Impacts of CPI Projects under EERP by AiD Pvt Ltd
Page 50 of 60
4.6.7 Self-initiated community projects
Assuming that the training and high participation of CO members led to their improved skills and
institutional maturity, a greater percentage of them (27) were involved in self initiated additional
projects, as opposed to 14 percent of non CO members involved in self help assignments and 86 percent
in donor initiated projects.
On inquiry, 9 percent females and 19 percent males reported that their communities had initiated other
projects as well. Approximately 19 percent CO members claimed to have done so, as well as 10 percent
non-CO members. The highest response was found in Malakand Agency (43 percent), followed by Buner
and Swat (22 and 21 percent, respectively). Scheme-wise, street pavements and drainage was reported
as the most popular (34 percent) additional project to have been initiated. Of these additional projects,
28 percent males proclaimed them as ‘self-help’, while 72 percent of the projects were labeled as ‘donor
initiated’. Of these projects were in irrigation (100 percent); and street pavement and drainage (92
percent). Chitral and Malakand Agency witnessed 100 percent donor initiated additional projects, and
Buner reportedly had the highest rate (83 percent) of self initiated projects undertaken.
Support from SRSP
With regards to support from SRSP on the functioning of CPI schemes, 88 percent respondents were
satisfied (50 percent ‘good’ and 38 percent ‘Satisfactory’); 1 percent were dissatisfied; and 11 percent
claimed to be unaware (largely female respondents).
Of the female respondents, 58 percent were aware of SRSP and its work in their communities.
Chitral witnessed 100 percent awareness; followed 82 percent of female respondents claiming
to be aware in Buner; and awareness levels between 46 to 68 percent in the rest of the districts.
Level of awareness of female non-CO members was also considerably high at 57 percent of the non-
members surveyed.
A highly significant finding was that 64 percent of the females who were CO members were also a part
of another organization, whereas the rate of participation of non-CO member females was 10 percent.
This could positively indicate an increase in female mobilization in local communities due to their
involvement in the SRSP-AusAid CPI schemes.
Whether or not the female respondents had been actively involved as members, and/or in the planning
and construction phases, almost all of them (97 percent) were fully aware of the existence of the CPI
schemes in their communities.
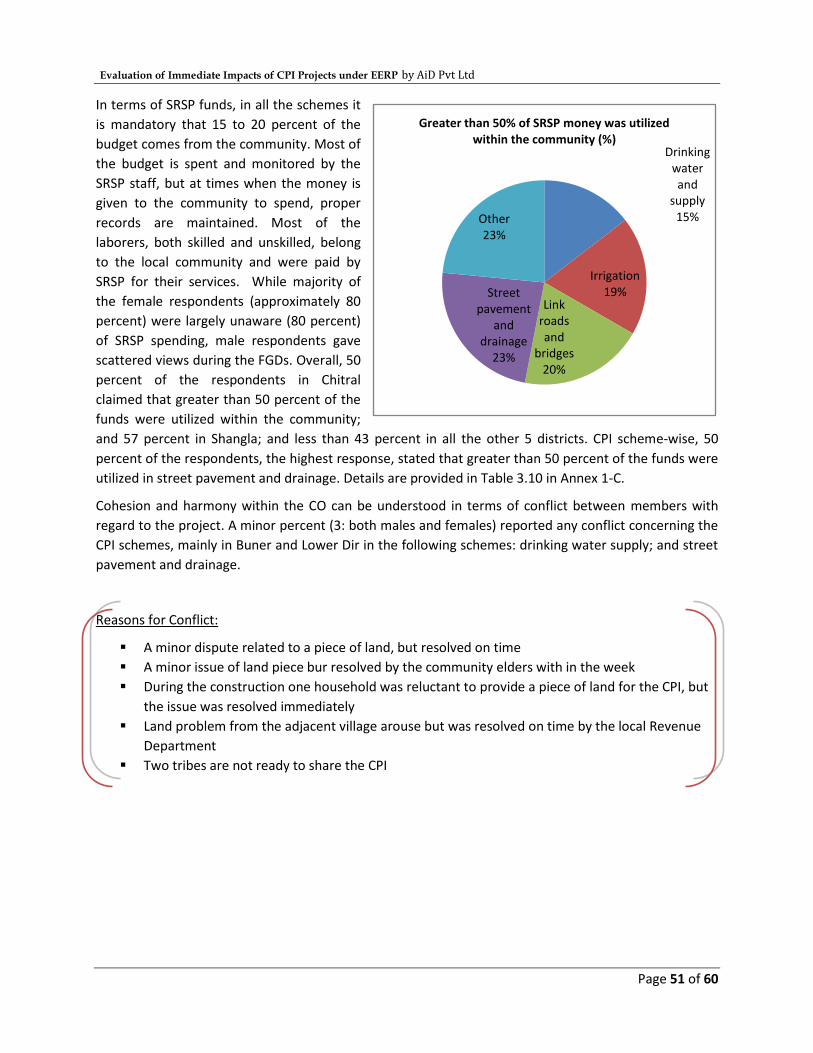
Evaluation of Immediate Impacts of CPI Projects under EERP by AiD Pvt Ltd
Page 51 of 60
Drinking water and
supply15%
Irrigation19%
Link roads and
bridges20%
Street pavement
and drainage
23%
Other23%
Greater than 50% of SRSP money was utilized within the community (%)
In terms of SRSP funds, in all the schemes it
is mandatory that 15 to 20 percent of the
budget comes from the community. Most of
the budget is spent and monitored by the
SRSP staff, but at times when the money is
given to the community to spend, proper
records are maintained. Most of the
laborers, both skilled and unskilled, belong
to the local community and were paid by
SRSP for their services. While majority of
the female respondents (approximately 80
percent) were largely unaware (80 percent)
of SRSP spending, male respondents gave
scattered views during the FGDs. Overall, 50
percent of the respondents in Chitral
claimed that greater than 50 percent of the
funds were utilized within the community;
and 57 percent in Shangla; and less than 43 percent in all the other 5 districts. CPI scheme-wise, 50
percent of the respondents, the highest response, stated that greater than 50 percent of the funds were
utilized in street pavement and drainage. Details are provided in Table 3.10 in Annex 1-C.
Cohesion and harmony within the CO can be understood in terms of conflict between members with
regard to the project. A minor percent (3: both males and females) reported any conflict concerning the
CPI schemes, mainly in Buner and Lower Dir in the following schemes: drinking water supply; and street
pavement and drainage.
Reasons for Conflict:
A minor dispute related to a piece of land, but resolved on time
A minor issue of land piece bur resolved by the community elders with in the week
During the construction one household was reluctant to provide a piece of land for the CPI, but
the issue was resolved immediately
Land problem from the adjacent village arouse but was resolved on time by the local Revenue
Department
Two tribes are not ready to share the CPI

Evaluation of Immediate Impacts of CPI Projects under EERP by AiD Pvt Ltd
Page 52 of 60
Majority of the FGD responses endorsed the confidence of the male and female participants claiming
that the CPI schemes could very well continue to run in the absence of support from SRSP. However,
scheme-wise response reflected another story, where 43 and 27 percent FGD participants believed that
irrigation and drinking water supply schemes could not run solely by the communities.
Table 3.17: Do you think that the project can continue in the absence of SRSP?
There is no O&M system
and the community does not have any capacity
There is no O&M system
but the community does have
some capacity
There is no O&M system
but the community has been trained to implement
There is an O&M system
and the community has been trained to implement
There is no O&M
system and the
community is actively
contributing
Don’t know
% % % % % %
Scheme type
Drinking water supply
28.6 4.8 4.8 33.3 7.1 21.4
Irrigation 42.9 14.3 28.6 14.3
Link road/Bridges
20.9 18.6 16.3 23.3 4.7 16.3
Street pavement and drainage
7.7 -
15.4 30.8 23.1 23.1
Other 33.3 16.7 16.7 33.3
4.7 Impact
4.7.1 Overall impact analysis
All respondents across all 7 districts reported a significant positive impact of the CPIs implemented
under EERP by SRSP. In the case of villages where a Link Road or a Bridge had been constructed,
respondents in Buner and Malakand Agency reported a positive change in both cases, as high as, 80 and
77 percent, respectively. Even in a district as conservative as Shangla respondents claimed that the
impact led to between 13 to 16 percent positive changes in education for both girls' and boys'
Similarly time to fetch water has been reduced by nearly 12 times due to the drinking water supply
schemes and whereas earlier only 34 % had access to drinking water 24 hr, now nearly 93 % do.
While the survey results reflect that 97 percent respondents acknowledged a stark positive change in
female mobility, as a result of the CPI schemes; however, findings across the indicators reflect extreme
lack of awareness and participation on the part of women. They need to be mobilized and encouraged
to take greater initiative and be more involved in the process for a greater sense of ownership of the
schemes, as well as, higher self-esteem and general knowledge. This is their key to greater
empowerment. Approximately 68 percent of respondents across all 7 districts acknowledged a positive
impact on women’s free time, enabling them to manage their daily activities more efficiently and
productively. Some, however, did state that no change was witnessed in this regard:
Table 3.18: Is there any change in women’s free time

Evaluation of Immediate Impacts of CPI Projects under EERP by AiD Pvt Ltd
Page 53 of 60
Large benefits Some benefits No benefit Don’t Know
District Buner 40.0% 10.0% 50.0%
Lower Dir 22.5% 32.5% 45.0%
Malakand Agency
50.0% 29.2% 20.8%
Shangla 14.3% 40.0% 42.9% 2.9%
Swat 32.4% 35.1% 5.4% 27.0%
Upper Dir 30.0% 66.7% 3.3%
With the exception of 23 and 7 percent respondents, respectively in Lower and Upper Dir, who reported
no benefit/change in marketing of agricultural surplus, 67 percent respondents across all 7 districts
reported a positive impact in this regard as well. Same is the case with impact on cost of farm input (and
access to business opportunities): with the exception of 50 (50), 23 (25) and 3 (6) percent respondents,
respectively in Buner, Lower and Upper Dir, who reported no benefit/change, approximately 68 (89)
percent respondents across all districts reported a positive impact, respectively.
4.7.2 Drinking Water Supply - CPI Scheme Impact
This segment analyzes the immediate impact of the Drinking Water Supply CPI on reducing the time and
effort taken to get to the water source. Overall, before DWSS CPI implementation, the average time
taken to reach the water source and come back was 24 minutes for males, which, after the
implementation of the schemes, was cut down to a fifth; to around 6 minutes. For females, an initial
average time of 47 minutes, was cut drastically to a twelfth of the original amount of time taken; down
to 4 minutes. Overall, it now takes an average of 5 minutes to get to and from the water source than the
pre-CPI implementation estimate of 35 minutes, reflecting a major reduction in time, allowing
community members to allocate their time more efficiently on other important daily tasks. The
numbers now indicate that this responsibility is now being shared amongst the rest of the household
members, most often the female child (21 percent), thus giving females higher opportunities utilize their
time efficiently since the CPI scheme implementation has increased ease of accessibility.
Percentage distribution of tasks undertaken by community members in a typical day shows that females
now spend approximately 90 percent of their time on other household chores:
District-wise, drastic savings in time allocation have been realized by beneficiaries due to DWS CPI. In
Chitral and Upper Dir, it now takes almost no time to reach the most utilized water source. The time
saved in Lower Dir, Swat and Shangla is almost 12 times as little. However, it takes the beneficiaries in
Malakand longer to reach the DWS CPI source now than it did before installation.
Table 3.19: Average time taken to reach water source and return (in minutes), before and after the
implementation of DWS CPI schemes; by gender
Average minutes after CPI by gender Average minutes before CPI by gender Mean Minutes Mean Minutes
Male 6 Male 24
Female 4 Female 47

Evaluation of Immediate Impacts of CPI Projects under EERP by AiD Pvt Ltd
Page 54 of 60
Table 3.21: The frequency of water available to HH before implementation of the DWS CPI scheme; by Gender
Before CPI? Male Female Total
Full time/24 hours 37.6 34.4 36.1
Daily intermittently 53.2 61.5 57.1
Alternate days 0.0 2.1 1.0
Twice a week 9.2 1.0 5.4
Others 0.0 1.0 0.5
Total 100.0 100.0 100.0
Table 3.22: The frequency of water available to HH after implementation of the DWS CPI scheme; by Gender
After CPI? Male Female Total
Full time/24 hours 97.1 90.1 93.9
Daily intermittently 2.9 7.7 5.1
Alternate days 0.0 1.1 0.5
Twice a week - - 0
Others 0.0 1.1 0.5
Total 100.0 100.0 100.0
Table 3.20: Average time taken to go to water source and come back (in minutes), before and after the
implementation of DWS CPI schemes; by District
Average minutes by location
District Mean Minutes District Mean Minutes
Buner 9.1 Buner 32.3
Chitral N/A Chitral 10.0
Lower Dir 4.2 Lower Dir 48.7
Malakand 11.4 Malakand 2.7
Shangla 2.1 Shangla 35.1
Swat 3.8 Swat 40.5
Upper Dir N/A Upper Dir 69.0
Total 4.8 Total 34.9
Before the implementation of DWS CPI schemes, 60 percent of respondents from 6 out of the 7 districts
reported that mainly adult women would fetch water for the HH’s use. The only exception was
Malakand Agency, where water is most often
fetched by a female child (over 60 percent cases).
After the implementation of DWS CPI, the highest
percentage is still of adult women who fetch
water, but this has almost halved to
approximately 34 percent; with the exception of
Chitral and Malakand Agency.
Satisfaction levels with the new DWS CPI schemes
were 100 percent for males and 97 percent for
females. In addition to coverage of lesser
distances now, another reason for high
satisfaction was that the frequency of water
availability was also raised by almost 100 percent
after the implementation of the DWS CPI
schemes. The tables 3.21 and 3.33 reflect the
stark positive differences:
With regards to households using any additional
water treatment method for drinking water after
the implementation of DWS CPI scheme; a 100
percent claim of no water treatment was
reported. Though, Malakand and Swat still seemed to have its doubts about the purity of water
provided and thus continued to use some form of water purification methodology. Once again,
strengthening the claim that whereas, other districts were saving time and manual input, Malakand
Agency was still struggling with the concept. This highlights the need for further training and follow-up
with Cos in Malakand Agency. Similarly, while almost 100 percent respondents from Malakand Agency
and Swat reported that the water from the CPI schemes had a clear appearance, sweet taste and was

Evaluation of Immediate Impacts of CPI Projects under EERP by AiD Pvt Ltd
Page 55 of 60
odorless; they reported cases of disease due to these water schemes (see Table 3.11 in Annex 1-C). This
rendition of doubt (still using some form of water treatment) by Malakand and Swat would be better
explained if the quality of water provided by CPI was unsatisfactory, but ironically both districts claim
almost zero percent dissatisfaction. There is however, one point that may support their claim, that being
the information that Malakand and Swat both have reported a higher percentage of diseases contracted
through water (even after CPI) as compared to other districts. This might be cause for worry, hence,
needs to be investigated.
4.7.3 Street pavements and drainage
Analyzing the immediate impact of the Street Pavement and Drainage CPI scheme, in terms of water
disposal and improvement in the local environment, will eventually help to evaluate the current health
scenario of the beneficiaries. Majority of the respondents (96 percent) in the 3 districts: Malakand
Agency, Shangla and Swat agreed that their streets had stagnant water with no effective way of its
disposal. Post SPD CPI, the situation positively reversed with approximately 92 percent of the
respondents indicating that the issue of stagnant water in the streets had either been completely or
partially eliminated, with majority leaning towards complete elimination. Hence, the SPD CPI scheme
has been a source of great convenience for the beneficiaries. It not only saves them transport time, but
may also result in better health as the diseases contracted from stagnant water might be greatly
reduced.
Table 3.24: Respondents claims of cases of elimination stagnant water after
CPI?
Yes No To some extent
% % %
District Malakand 100.0 0 0
Shangla 50.0 25.0 25.0
Swat 97.7 2.3 0
Approximately 96 percent of the respondents from the 3 districts reported a rampant foul smell due to
improper drainage systems. Post-SPD CPI, whereas in Shangla and Swat the situation was quite
favorable towards the SPD CPI, with 75 and 93 percent respondents from both districts, respectively
claiming a reduction in foul smell, there was a 50/50 split in Malakand Agency. This calls for revisiting
the CPI scheme impact in Malakand.
In regards to domestic waste water’s appropriate disposal, the responses generated have made for an
interesting analysis. Pre-SPD CPI, the distinction by sample district claims that whereas in Shangla 100%
of the respondents claimed that the waste water was not being disposed properly; the situation was
relatively better in Swat with only half the respondents claiming that it was not. Post-SPD CPI, the
scheme has performed well enough almost half the male respondents to agree that domestic waste
water is now being disposed properly in contrast to 93 percent stating the contrary before the
implementation of the scheme. In the same way, the percentage of female respondents increased from
67 to approx 89 percent. In Swat, now up to 75 percent respondents are satisfied with the output of the
scheme, whereas majority of the respondents from Shangla (approximately 62 percent) are still claiming
that waste water is not disposed properly.

Evaluation of Immediate Impacts of CPI Projects under EERP by AiD Pvt Ltd
Page 56 of 60
Furthermore, the resulting answer to the question whether there has been any significant decrease in
Mosquitoes or flies the answer was no from 100 % of the female beneficiaries, whereas 7.5 % male said
that it did. The answer to the query of improved children health before the CPI scheme of street
pavement and drainage was a resounding 100 percent ‘No’ on all accounts. Similarly, to the Post
implementation of the CPI scheme, above 50 percent of the respondents in both Malakand Agency and
Shangla perceived an improvement and positive effect on the health of the children as a result. If this
can assessed based on actual figures, this would reflect the impact the CPI schemes have had on
increased life expectancy and economizing family budgets to save the amount of money spent on health
treatment.
4.7.4 Link roads and bridges
The impact of implementation of CPI schemes of link roads and bridges, in other words, communication
infrastructure has remarkably decreased the average time taken for community residents to avail
essential daily requirements including access to the nearest drinking water supply; distance to grocery
shopping; distance to girls’ and boys’ schools; access to hospital; and distance to the nearest local Tehsil
administration:
Table 3.25: Before CPI Schemes in Communication Infrastructure – Average (mean) time taken to acquire the following facilities (minutes):
District
Drinking water supply
Grocery shopping / General store
Boys’ school
Girls’ school
Hospital Local Tehsil administration
Buner 46.5 1 36.6 38.1 9.8 1
Lower Dir 17.8 33.4 13.2 16.3 13 1
Malakand 4.2 37.9 29.7 30.1 39.3 51.6
Shangla 15.6 145.4 115.3 123.9 197.4 133.3
Swat 110.6 151.6 126.3 121.6 162.8 54
Upper Dir 17 35.4 42.4 23.9 71.6 9.3
Total 39.7 84.1 67.2 61 97.3 49.2
Table 3.26: After CPI Schemes in Communication Infrastructure – Average (mean) time taken to acquire the following facilities (minutes):
District
Drinking water supply
Grocery shopping / General store
Boys’ school
Girls’ school Hospital Local Tehsil administration
Buner 17.5 1 15.4 17.1 5.3 1
Lower Dir 9.3 17.4 6.7 8.6 6.1 1
Malakand 1.6 12.1 14.1 14.8 24 28.8
Shangla 9.6 36.9 12.6 14.8 43.9 19.1
Swat 28.9 41.7 27.6 24.8 52.7 46.2
Upper Dir 5.4 14 17.8 11.8 32.7 5.4
Total 12.9 25.1 15.6 14.3 30.3 16.4
Among the above listed facilities, a rather unique shift was witnessed in the mode of transport used to
gain access the nearest general/grocery store. Comparing before- and after- CPI construction cases, the

Evaluation of Immediate Impacts of CPI Projects under EERP by AiD Pvt Ltd
Page 57 of 60
mode of transport ‘on foot’ surprisingly decreased (except in Buner); the usage of motorbikes and four
wheel engine vehicles increased (other than in Lower Dir); and also witnessed was an increase in usage
of public transport across all districts. This is quite alarming since the first assumption that can be made
is that the distance due to the link roads has in fact, expanded rather than the reverse, which would
placed the community members at a greater convenience.
The usage and hence, relevance of the link roads and bridges constructed under the CPI schemes is
detailed in Table 3.12 in Annex 1-C. Of the 3 percent respondents in Malakand Agency who claimed to
not use it all, 33 percent of them stated that the new infrastructure was of no use to them. The 8
percent (approximately) respondents in Swat who claimed the same all reported ‘poor quality’ as the
reason. The rest of the higher majority of respondents, however, in both districts, and elsewhere were
highly satisfied with the quality of the new communication infrastructure.
In terms of overall traveling cost, it decreased by 25 percent for all respondents in Lower Dir and
between 25 to 50 percent for respondents in Upper Dir. As for the 5 districts, travel cost decreased
between 25 to 75 percent at varying levels. Additionally, there was an overall 75 percent decrease in the
cost of freight transport due to the new CPI communication infrastructure across all districts except
Buner, where no change was witnessed at all. The detailed breakdown of the impact is illustrated in
Table 3.12 in Annex 1-C.
4.7.5 Irrigation
The household survey results reflect that there was a remarkable increase in crop production of
community members surveyed owing to the implementation of CPI irrigation schemes. While 100
percent respondents reported a 50 percent increase in wheat production; between 50 to 80 percent
reported a 100 percent increase in rice and grain production. Production of maize also increased
considerably. In vegetables, 100 percent increase in production of onions; tomatoes; lady fingers; and
garlic was also reported by all respondents. Fruits such as apples; plums; and apricots comparatively did
not witness such levels of increase in production. Production increments ranged between 50 to 70
percent. A 63 percent increase in rearing was also reported by respondents; with 10 out of 16
respondents surveyed claiming an increase, and 6 reporting no change.
With regards to the overall impact on farm revenue, as indicated in the table below, 100 percent
respondents reported minimum 50 percent increase. This is a substantial outcome of the irrigation CPI
scheme, raising the economic empowerment of beneficiaries working on agricultural land.
Table 3.29: Overall Farm Revenue
Farm revenue 50% 70% 80% Total
Overall Farm revenue 28.6 42.9 28.6 100

Evaluation of Immediate Impacts of CPI Projects under EERP by AiD Pvt Ltd
Page 58 of 60
4.8 Conclusions and Recommendations
In view of the early recovery context and the difficult terrain, SRSP’s outreach and successful conclusion
of this challenging project is commendable. The schemes have been implemented in areas where the
government had limited outreach and other non-governmental players had no presence. . Working in
the target areas meant many hours of driving and trekking through often rugged and mountainous
terrain. Despite these difficulties, the overall quality of work is of good standards. All project outputs
were also achieved within the agreed timelines. Thanks to a motivated team, nearly 400 community
organizations were formed, local priorities identified and over 200 CPIs implemented within a short span
of 9 months.
Overall the communities have reported a very positive impact of the CPI program.
o Post implementation of the DWSS, the average time taken to reach the water source
decreased significantly, allowing community members, particularly females, to allocate
their time more efficiently to other important daily tasks. Satisfaction levels with the
new DWS CPI schemes were 100 percent for males and 97 percent for females, also,
implying lower risks of waterborne diseases.
o In case of Sanitation and drainage CPIs, the majority of the respondents (92 percent) in
the 3 districts where the scheme was implemented noted that the issue of stagnant
water in the streets had either been completely or partially eliminated. Additionally, 75
and 93 percent respondents in Shangla and Swat, respectively claimed reduction in foul
smell, while 50 percent respondents reported the same in Malakand Agency.
o The new link roads and bridges has remarkably decreased the average time taken for
community residents to avail essential daily requirements; travel to the nearest drinking
water supply schemes; grocery stores; girls’ and boys’ schools; hospital; and the nearest
local Tehsil administration. The respondents reported an overall 75 percent decrease in
the cost of freight transport across all districts except Buner, where no change was
reported.
o The survey also shows considerable increase in crop production due to the
implementation of irrigation schemes. Nearly all respondents reported a 50 percent
increase in wheat production; while between 50 to 80 percent reported a 100 percent
increase in rice and grain production. With regards to the overall impact on farm
income, 100 percent respondents reported a minimum of 50 percent increase.
o Combined capacity of the 3 MHPs in Chitral, Swat and Upper Dir has the designed
capacity of 225 KW, which will benefit approximately 600 HH. It was reported that the
MHP in Bhamborate, Chitral has been functioning at full capacity and is not only
supplying electricity to the communal HH’s, but also to a local hotel, Maternity Home,
Funeral Hall, a school and also mosque.

Evaluation of Immediate Impacts of CPI Projects under EERP by AiD Pvt Ltd
Page 59 of 60
All 60 schemes in the evaluation sample were physically verified to be on the ground. Except for one scheme all the rest have been identified by the local community as fulfilling their priority need. Given the tight time lines and the difficult terrain, this is a remarkable achievement
Project documentation has been meticulously kept in the regional office, showing detailed record of community interaction and the field processes from the ‘first dialogue’ to the handing of checks in the 3rd dialogues and the subsequent installments. However the technical documentation covering the design basis, design calculations and the environmental assessment remains a weak area. .
The CPIs are predominantly functional, and have a positive impact on the communities; however some of these (about 10 %) are not delivering the required benefits due to poor quality and/or weak O&M systems.
A majority of females in the sample confirmed that the CPIs chosen represented their priority needs and directly benefiting them. However CPI implementation remained a predominantly male affair. Out of the 64 WCO which were formed, a total of 4 CPIs were for the women organization, which is disproportionally low.
Although CPIs such as DWSS or sanitation and drainage were being implemented there was little attempt to build the capacity of the organizations on related issues such as health and hygiene.
SRSP’s presence in the project areas was a significant factor in the rapid response and timely completion of the project activities. Interviews with senior SRSP managers suggest a continued interest in the region and a commitment to maintain the needed support for post project support through existing resources.
CPIs are highly visible, ensure immediate benefits to the community and also typically consume
the largest chunk of development budgets in any community program. Accordingly these should
receive a higher level of attention from the feasibility through design, implementation as well as
the O&M. The survey shows a generally good performance on the “implementation fronts”
however the design and O&M phases could benefit from further attention. Among other areas
of focus the CPIs are generally small in scope, however a rapid “environmental screening and
mitigation” protocol could help some categories of schemes. Overall the team recommends
additional investments in staff skills for field surveys and design; use of design standards and
guidelines and customized training modules for O&M practices. This will allow SRSP to further
build on its current success and ensure that the CPIs continue to yield long term dividends
without the need for any hand holding or follow up repairs in project areas that are generally
remote and difficult to access.
Specific recommendations:
1. Improve Engineering technical feasibility:
1.1. Establish policy to adhere to basic technical engineering standards.
1.2. Outsource technical assistance on engineering complex structures
1.3. Outsource essential engineering tests.
1.4. Acquire modern survey and test equipment
1.4.1. Total Station

Evaluation of Immediate Impacts of CPI Projects under EERP by AiD Pvt Ltd
Page 60 of 60
1.4.2. GPS enabled cameras
1.4.3. Use Google earth where possible, else develop proper base map layout to ensure proper
planning.
1.5. Establish Mobile lab for remote locations to ensure that the necessary tests such as soil
analysis, CBR are carried out when necessary.
1.6. Staff training
2. Improve Environmental Feasibility
2.1. Revisit the Environmental review process
2.2. Hire an environmental engineer.
2.3. Staff training
3. Improve Quality of Scheme Construction
3.1. Establish quality standards
3.2. Training of project committee
3.3. Ensure a effective ratio of field engineers to scheme ratio for effective field supervisor
3.4. Training of ‘skilled’ and unskilled local labor.
4. Improve O & M system
4.1. Develop scheme specific O&M schedules
4.2. Develop basic troubleshooting guidelines defining what to do and when with clearly defined
roles and responsibilities.
4.3. Establish intensive training of O&M committee and members and ensure refreshers.
4.4. Encourage an O&M fund and before hand-over of the scheme.
4.5. Monitor outcomes instead of outputs.
4.6. Use of cell phone technology to monitor O&M
5. Focus on Female organization or investments:
5.1. Establish link between investment in CPI and female activities.
5.1.1. Implement CPI’s only where WCO are formed or at least where female SOs is given access.
6. Plan for CPI investments holistically.
6.1. This is especially important in the case of DWSS and Sanitation CPIs where basic health and
hygiene should be seen as a overarching framework
6.2. Irrigation related schemes should be followed up with water conservation and erosion control
trainings.


![Complete Picture eERP eBuz [Compatibility Mode]](https://img.pdfslide.net/doc/110x75/577d27601a28ab4e1ea3c381/complete-picture-eerp-ebuz-compatibility-mode.jpg)