Embed Size (px)
Citation preview

3/18/2016
Franklin Public Schools
FY2017
Budget Hearing
Dr. Maureen Sabolinski, Superintendent of Schools
Miriam Goodman, School Business Administrator
3/18/2016
Agenda
Revenue
Budgeted Expenses
Budget Drivers
Unmet Needs
Statewide Picture
Final Takeaways
3/18/2016
State Revenue
Foundation budget
The spending target imposed by the Education Reform Act of 1993 for each school district as the minimum level necessary to provide an adequate
education for all students
$9,513

3/18/2016
State Revenue
Free and reduced price lunch data is no longer available for all districts
as a result of districts’ participation in the USDA’s Community Eligibility
Program. As a result, the foundation budget will now be calculated
using economically disadvantaged enrollment in place of formerly
available low income enrollment. The rate has changed to reflect the
new metric.

3/18/2016
State Revenue
Community EligiblityProvision
Economically Disadvantaged
$3,815 per pupil
Additional Resource: Redefining Low Income - A New
Metric for K-12 Education Data

3/18/2016
State Revenue
Required Municipal ContributionLocal effort from property wealth
Local effort from income
Municipal revenue growth factor
Municipal contribution is calculated then
apportioned based on foundation enrollment to
FPS and regional school districts which we
belong (Tri County and Norfolk County).

3/18/2016
Required Net School Spending
Local Contribution
+
Chapter 70 Aid
Required NSS => Foundation Budget
3/18/2016
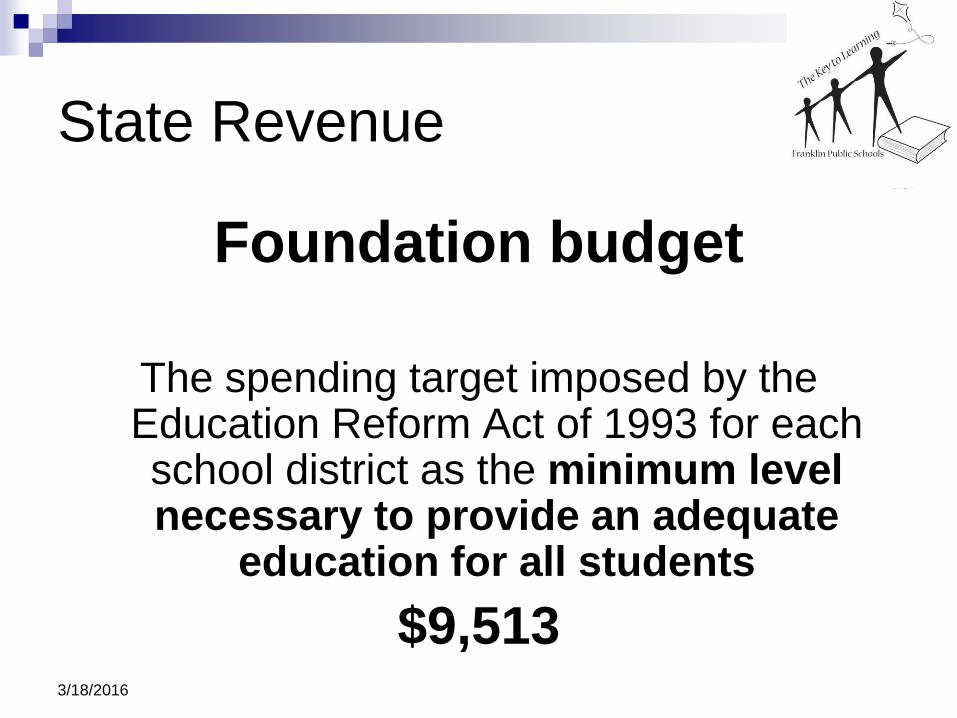
CHAPTER 70 FUNDING
47.5% of FY17 budget
*FY17 Preliminary Amount
$0
$5
$10
$15
$20
$25
$30
Millions

3/18/2016
State Revenue
Chapter 70
FY17 PRELIMINARY ALLOCATION
$27,545,516
FY14 House 1 Budget Allocation

Chapter 70 Trends, FY93 to FY16
3/18/2016Source: DESE
$0
$10,000,000
$20,000,000
$30,000,000
$40,000,000
$50,000,000
$60,000,000
$70,000,000
$80,000,000
93 94 95 96 97 98 99 00 01 02 03 04 05 06 07 08 09 10 11 12 13 14 15 16
Fiscal Year
Chapter 70 Aid
Foundation Budget
Required Net School Spending
Actual Net School Spending
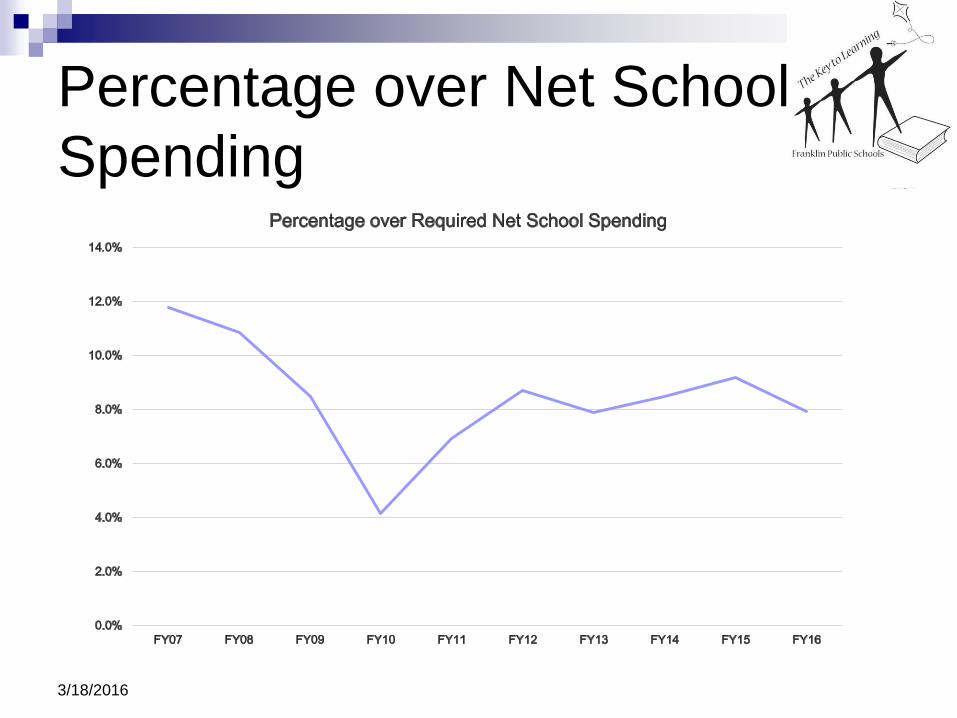
Percentage over Net School
Spending
3/18/2016

3/18/2016
Grant Revenue FY16
Federal Entitlement Grants
Title I, Title II, IDEA, IDEA Preschool, SPED
Program Improvement
$1,447,017
State Grants
Full Day Kindergarten, Academic Support,
School Safety Zone Improvement
$228,950

3/18/2016
Other Sources of Revenue
Revolving Accounts
Circuit Breaker
Lifelong Learning
Food Service
Transportation
Athletics
Extracurricular
School Choice

3/18/2016
One-Time Funds Budgeted
Funding Source FY16 FY17 Difference
Lifelong Learning 50,000 80,000 30,000
School Choice 600,000 1,000,000 400,000
Pre K Revolving 271,345 694,445 423,100
Pay to Ride 600,000 1,000,000 400,000
Athletics 323,000 323,000 0
Extracurricular Participation 35,500 51,860 16,360
LLL/Café/Grants 300,000 300,000 0
Circuit Breaker 2,000,000 2,930,485 930,485
Totals 4,179,845 6,379,790 2,199,945

3/18/2016
FY17 Proposed Budget
Salaries 76%
Health & Medicare Costs
9%
Out-of-District Tuition 7%
Other Expenses5%
Transportation3%
$58,250,000
3/18/2016
FY17 Proposed Budget
Represents an increase over FY16 of
$1,300,000
2.28%
3/18/2016
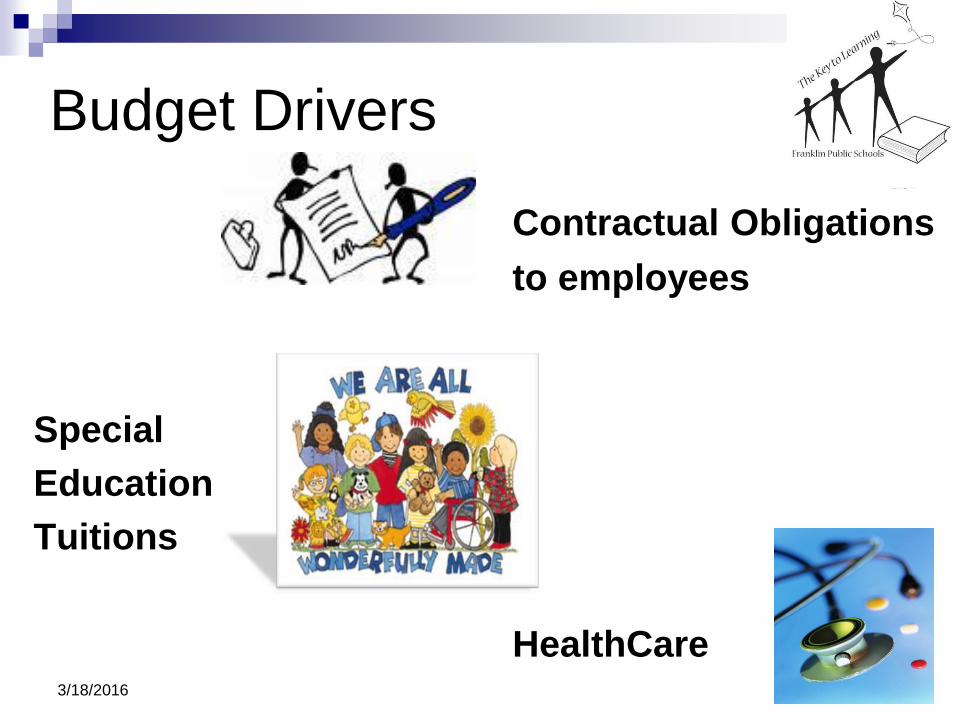
Budget Drivers
Contractual Obligations
to employees
Special
Education
Tuitions
HealthCare

Special Education Challenges
79 students access the curriculum in a
placement outside of the district because their
needs exceed the capacity to educate them in
district schools
8 students moved into Franklin in the 2015-2016
school year requiring a placement outside of the
district
10 additional students required an out-of-district
placement over the course of the school year
FY17 projected cost for these 18 students
exceeds $1M 3/18/2016
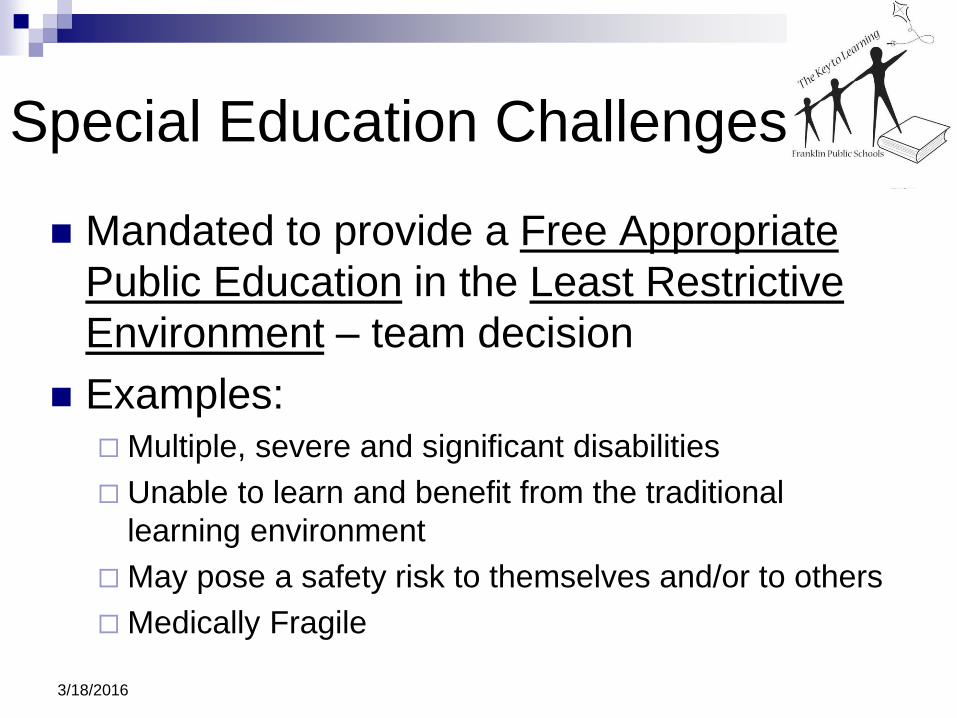
Special Education Challenges
Mandated to provide a Free Appropriate
Public Education in the Least Restrictive
Environment – team decision
Examples: Multiple, severe and significant disabilities
Unable to learn and benefit from the traditional
learning environment
May pose a safety risk to themselves and/or to others
Medically Fragile
3/18/2016

Decrease of 7.0 FTE Teaching Positions
Decrease of 3.0 FTE Educational
Assistants
Reductions will be addressed through
retirements and attrition
3/18/2016
OVERALL Personnel
Change

Unmet Needs
Expanding counseling services to be more
proactive
Providing students with skills to be more
resilient
Expanding STEM programming
Technology Support to be more proactive
New Innovations across the curriculum to
stay current
Media specialists3/18/2016

3/18/2016
HOW DO WE
COMPARE?
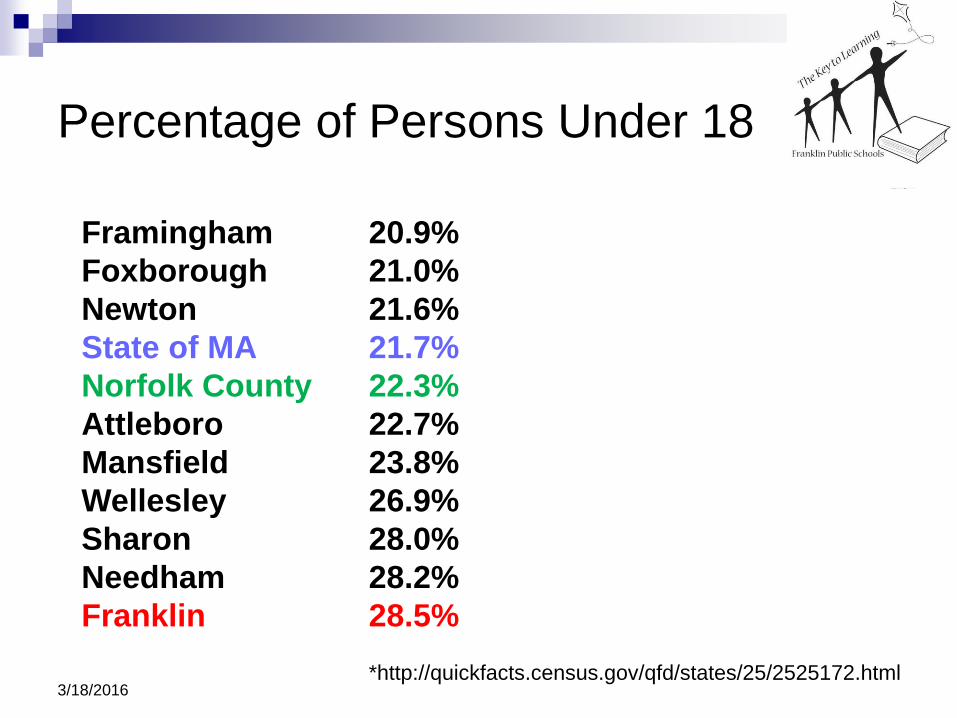
Percentage of Persons Under 18
3/18/2016*http://quickfacts.census.gov/qfd/states/25/2525172.html
Framingham 20.9%
Foxborough 21.0%
Newton 21.6%
State of MA 21.7%
Norfolk County 22.3%
Attleboro 22.7%
Mansfield 23.8%
Wellesley 26.9%
Sharon 28.0%
Needham 28.2%
Franklin 28.5%

3/18/2016
PER PUPIL EXPENDITURES*
Franklin
$12,435
State Average
$14,920
•FY15 detail data can be found at http://finance1.doe.mass.edu/statistics/
20% below

3/18/2016
PER PUPIL EXPENDITURES
8,000
9,000
10,000
11,000
12,000
13,000
14,000
15,000
FY06 FY07 FY08 FY09 FY10 FY11 FY12 FY13 FY14 FY15
Franklin
State Average

3/18/2016
FY15 Town of
Franklin
State
Average
Excess
(Deficit)Percentage
Administration 328.96 530.11 (201.15) -61%
Instructional Leadership 684.99 971.81 (286.82) -42%
Classroom and Specialist Teachers 5,259.43 5,607.52 (348.09) -7%
Other Teaching Services 840.68 1,168.44 (327.76) -39%
Professional Development 218.09 198.11 19.98 9%
Instructional Materials, Equipment and Technology 377.30 430.36 (53.06) -14%
Guidance, Counseling and Testing 345.59 438.96 (93.37) -27%
Pupil Services 1,031.35 1,435.42 (404.07) -39%
Operations and Maintenance 1,061.54 1,144.31 (82.77) -8%
Insurance, Retirement Programs and Other 1,535.37 2,490.06 (954.68) -62%
Total Expenditures per Pupil * 12,435 14,920 (2,485) -20%
*Columns do not sum to the total due to spending categories not reported by DOE (approx. 5% of total)
DESE Categories of ExpensesSource: Massachusetts Department of Education

3/18/2016
DESE Categories of ExpensesSource: Massachusetts Department of Education

Final Takeaway
Fiscally conservative in using revolving
funds in prior years
Significant increase in the use of one-time
funds to offset this FY17 budget
Balanced FY17 budget, but this trend of
using of one time revolving funds cannot
continue in future years based on Town
Administrator’s 5-year forecast
3/18/2016

Final Takeaway
Spending down reserves at a rate that is
unsustainable
Not filling vacancies left by retirements at
elementary level
Approved housing (600+ units in Franklin
puts added pressures on the school
population (must assess the impact)
2018 will be a challenge
3/18/2016

3/18/2016
Thank You