Embed Size (px)
DESCRIPTION
The GDNet Baseline and M&E Framework Report establishes GDNet’s baseline and details the approach GDNet will follow in order to meet its monitoring and evaluation (M&E) requirements as set out in the GDNet logframe 2010-2014. The document is structured according to the GDNet logframe, it looks into the Baseline summary, M&E tools and methods designed to generate the data for each baseline figure, Data management plan the ownership, frequency, and source of on-going M&E activities with GDNet.and specific, Tools and Templates to generate and/or store GDNet’s baselines and on-going M&E data. Data collection activities which generated significant volumes of data.
Citation preview
1
GDNet Baseline and M&E Framework
Final Report
Robbie Gregorowski June 2011
2
Contents Introduction ................................................................................................................................ 3 GDNet Baseline Summary .......................................................................................................... 4 Purpose Level ‐ Diverse research and policy audiences make better use of development research from the global south .................................................................................................. 7 Output 1 ‐ Southern research better informed by current ideas and knowledge................... 14 Output 2 ‐ Researchers better able to communicate their research to policy ........................ 18 Output 3 ‐ Knowledge networking between researchers and with policy actors increased ... 21 Output 4 ‐ Research better communicated to different, identified audiences ....................... 23 Output 5 ‐ Lessons about knowledge brokering best practice in the global south learnt and communicated.......................................................................................................................... 24
3
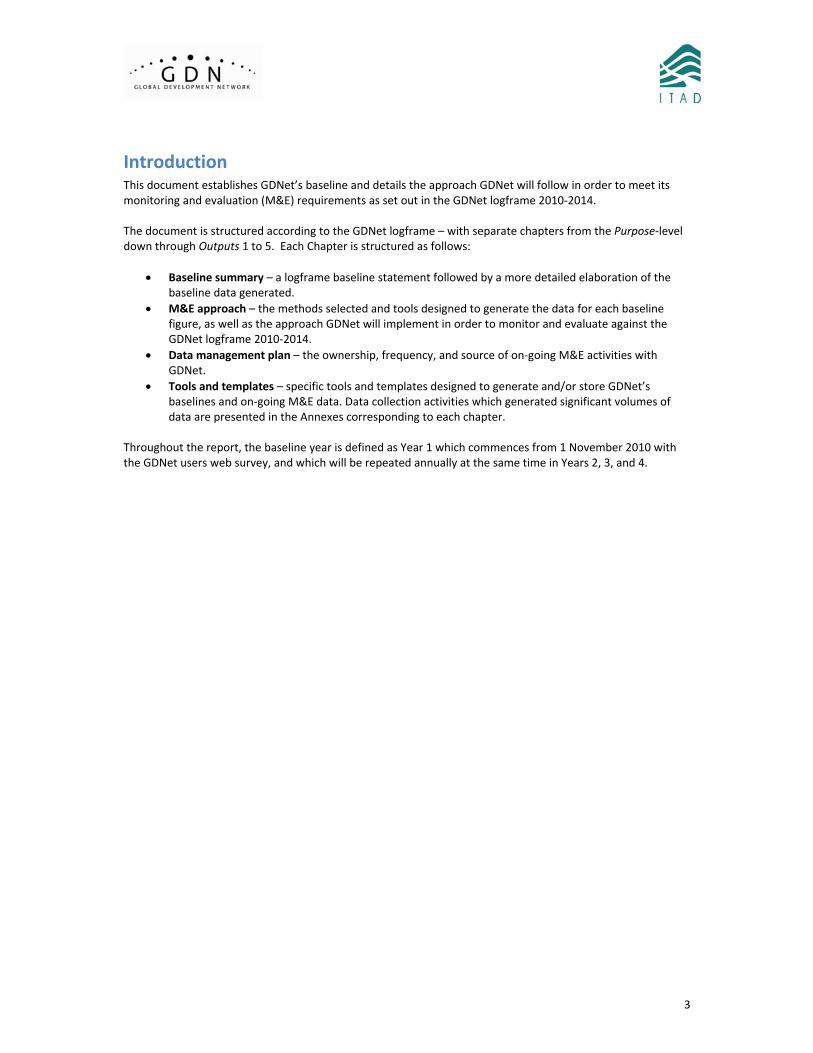
Introduction This document establishes GDNet’s baseline and details the approach GDNet will follow in order to meet its monitoring and evaluation (M&E) requirements as set out in the GDNet logframe 2010‐2014. The document is structured according to the GDNet logframe – with separate chapters from the Purpose‐level down through Outputs 1 to 5. Each Chapter is structured as follows:
• Baseline summary – a logframe baseline statement followed by a more detailed elaboration of the baseline data generated.
• M&E approach – the methods selected and tools designed to generate the data for each baseline figure, as well as the approach GDNet will implement in order to monitor and evaluate against the GDNet logframe 2010‐2014.
• Data management plan – the ownership, frequency, and source of on‐going M&E activities with GDNet.
• Tools and templates – specific tools and templates designed to generate and/or store GDNet’s baselines and on‐going M&E data. Data collection activities which generated significant volumes of data are presented in the Annexes corresponding to each chapter.
Throughout the report, the baseline year is defined as Year 1 which commences from 1 November 2010 with the GDNet users web survey, and which will be repeated annually at the same time in Years 2, 3, and 4.
4
GDNet Baseline Summary
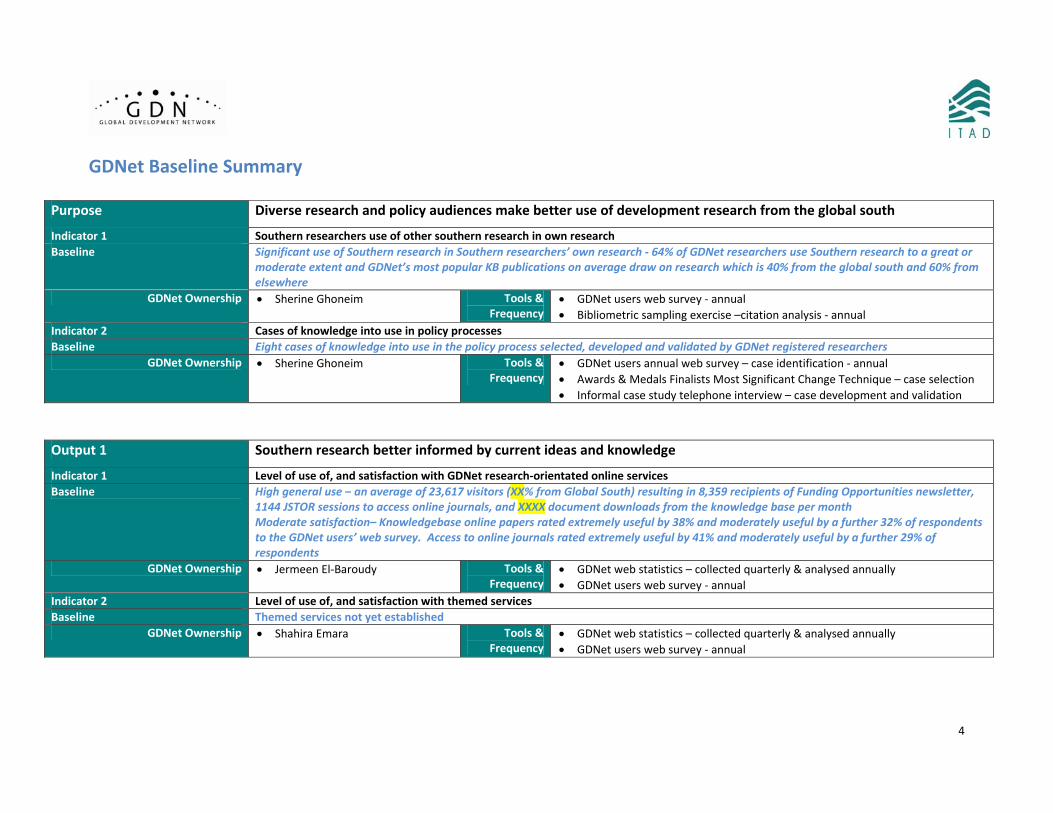
Purpose Diverse research and policy audiences make better use of development research from the global south
Indicator 1 Southern researchers use of other southern research in own research Baseline Significant use of Southern research in Southern researchers’ own research ‐ 64% of GDNet researchers use Southern research to a great or
moderate extent and GDNet’s most popular KB publications on average draw on research which is 40% from the global south and 60% from elsewhere
GDNet Ownership • Sherine Ghoneim Tools & Frequency
• GDNet users web survey ‐ annual • Bibliometric sampling exercise –citation analysis ‐ annual
Indicator 2 Cases of knowledge into use in policy processesBaseline Eight cases of knowledge into use in the policy process selected, developed and validated by GDNet registered researchers
GDNet Ownership • Sherine Ghoneim Tools & Frequency
• GDNet users annual web survey – case identification ‐ annual • Awards & Medals Finalists Most Significant Change Technique – case selection • Informal case study telephone interview – case development and validation
Output 1 Southern research better informed by current ideas and knowledge
Indicator 1 Level of use of, and satisfaction with GDNet research‐orientated online servicesBaseline High general use – an average of 23,617 visitors (XX% from Global South) resulting in 8,359 recipients of Funding Opportunities newsletter,
1144 JSTOR sessions to access online journals, and XXXX document downloads from the knowledge base per month Moderate satisfaction– Knowledgebase online papers rated extremely useful by 38% and moderately useful by a further 32% of respondents to the GDNet users’ web survey. Access to online journals rated extremely useful by 41% and moderately useful by a further 29% of respondents
GDNet Ownership • Jermeen El‐Baroudy Tools & Frequency
• GDNet web statistics – collected quarterly & analysed annually • GDNet users web survey ‐ annual
Indicator 2 Level of use of, and satisfaction with themed servicesBaseline Themed services not yet established
GDNet Ownership • Shahira Emara Tools & Frequency
• GDNet web statistics – collected quarterly & analysed annually • GDNet users web survey ‐ annual
5
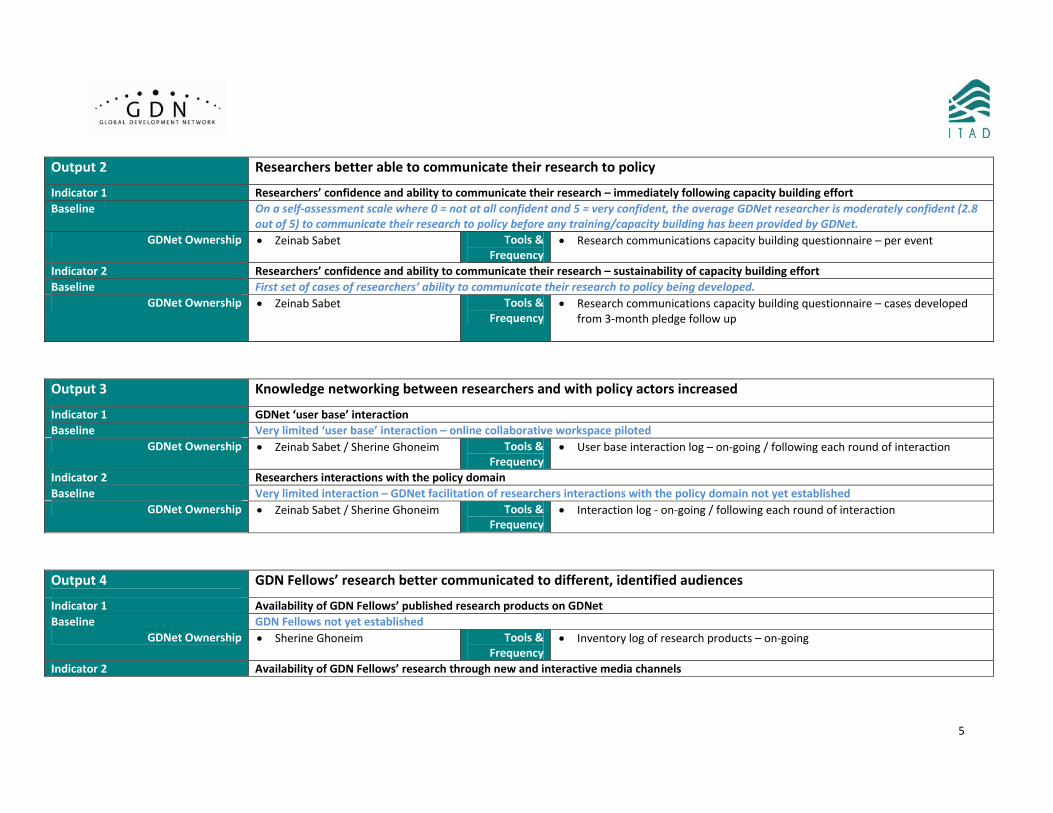
Output 2 Researchers better able to communicate their research to policy
Indicator 1 Researchers’ confidence and ability to communicate their research – immediately following capacity building effortBaseline On a self‐assessment scale where 0 = not at all confident and 5 = very confident, the average GDNet researcher is moderately confident (2.8
out of 5) to communicate their research to policy before any training/capacity building has been provided by GDNet. GDNet Ownership • Zeinab Sabet Tools &
Frequency • Research communications capacity building questionnaire – per event
Indicator 2 Researchers’ confidence and ability to communicate their research – sustainability of capacity building effortBaseline First set of cases of researchers’ ability to communicate their research to policy being developed.
GDNet Ownership • Zeinab Sabet Tools & Frequency
• Research communications capacity building questionnaire – cases developed from 3‐month pledge follow up
Output 3 Knowledge networking between researchers and with policy actors increased
Indicator 1 GDNet ‘user base’ interactionBaseline Very limited ‘user base’ interaction – online collaborative workspace piloted
GDNet Ownership • Zeinab Sabet / Sherine Ghoneim Tools & Frequency
• User base interaction log – on‐going / following each round of interaction
Indicator 2 Researchers interactions with the policy domainBaseline Very limited interaction – GDNet facilitation of researchers interactions with the policy domain not yet established
GDNet Ownership • Zeinab Sabet / Sherine Ghoneim Tools & Frequency
• Interaction log ‐ on‐going / following each round of interaction
Output 4 GDN Fellows’ research better communicated to different, identified audiences
Indicator 1 Availability of GDN Fellows’ published research products on GDNetBaseline GDN Fellows not yet established
GDNet Ownership • Sherine Ghoneim Tools & Frequency
• Inventory log of research products – on‐going
Indicator 2 Availability of GDN Fellows’ research through new and interactive media channels
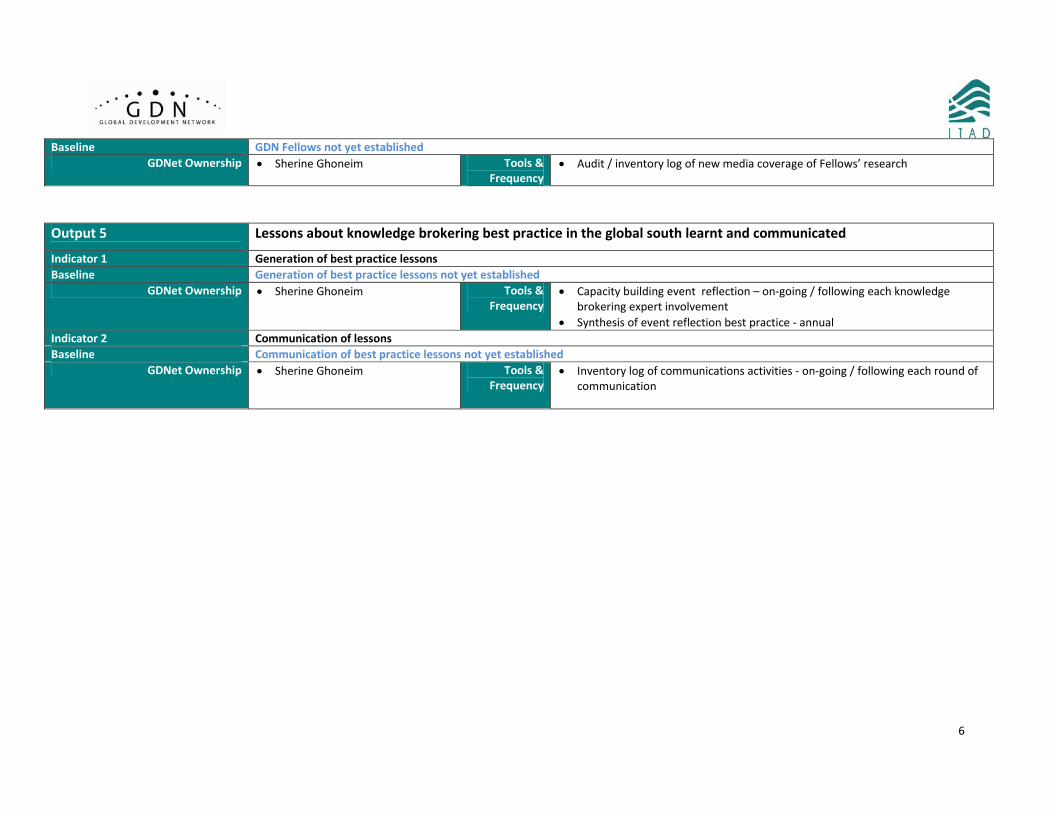
6
Baseline GDN Fellows not yet establishedGDNet Ownership • Sherine Ghoneim Tools &
Frequency • Audit / inventory log of new media coverage of Fellows’ research
Output 5 Lessons about knowledge brokering best practice in the global south learnt and communicated
Indicator 1 Generation of best practice lessonsBaseline Generation of best practice lessons not yet established
GDNet Ownership • Sherine Ghoneim Tools & Frequency
• Capacity building event reflection – on‐going / following each knowledge brokering expert involvement
• Synthesis of event reflection best practice ‐ annual Indicator 2 Communication of lessonsBaseline Communication of best practice lessons not yet established
GDNet Ownership • Sherine Ghoneim Tools & Frequency
• Inventory log of communications activities ‐ on‐going / following each round of communication
7
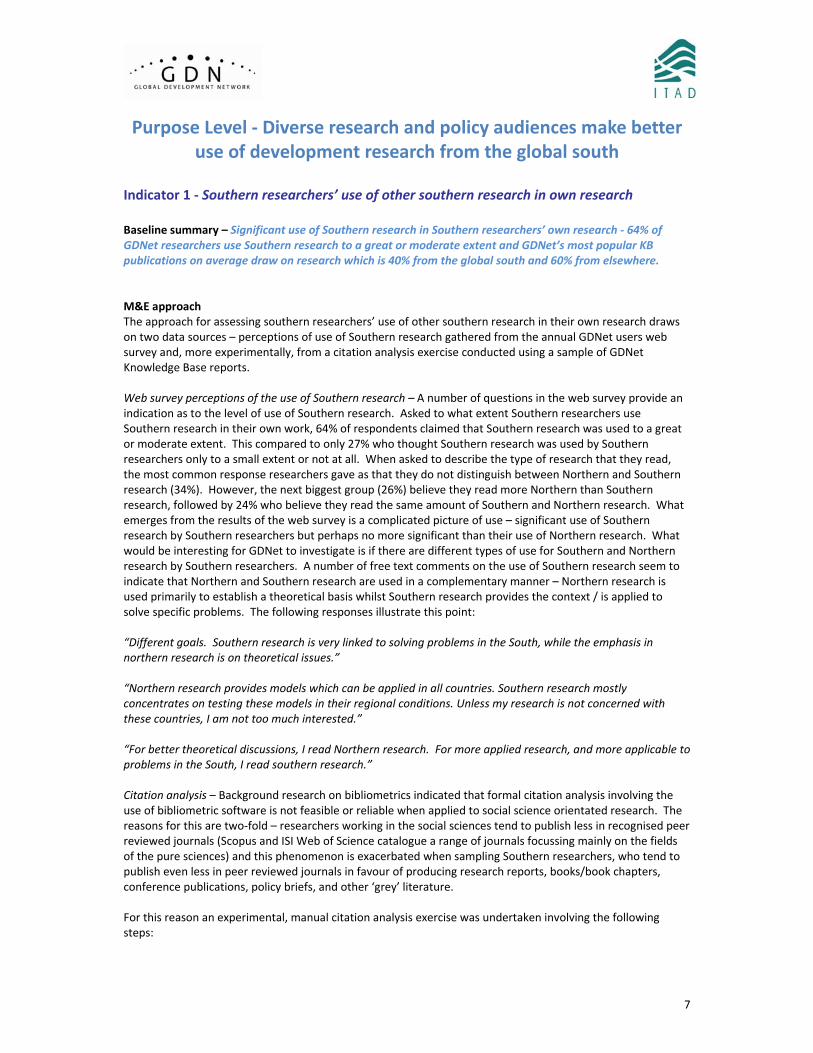
Purpose Level ‐ Diverse research and policy audiences make better use of development research from the global south
Indicator 1 ‐ Southern researchers’ use of other southern research in own research Baseline summary – Significant use of Southern research in Southern researchers’ own research ‐ 64% of GDNet researchers use Southern research to a great or moderate extent and GDNet’s most popular KB publications on average draw on research which is 40% from the global south and 60% from elsewhere. M&E approach The approach for assessing southern researchers’ use of other southern research in their own research draws on two data sources – perceptions of use of Southern research gathered from the annual GDNet users web survey and, more experimentally, from a citation analysis exercise conducted using a sample of GDNet Knowledge Base reports. Web survey perceptions of the use of Southern research – A number of questions in the web survey provide an indication as to the level of use of Southern research. Asked to what extent Southern researchers use Southern research in their own work, 64% of respondents claimed that Southern research was used to a great or moderate extent. This compared to only 27% who thought Southern research was used by Southern researchers only to a small extent or not at all. When asked to describe the type of research that they read, the most common response researchers gave as that they do not distinguish between Northern and Southern research (34%). However, the next biggest group (26%) believe they read more Northern than Southern research, followed by 24% who believe they read the same amount of Southern and Northern research. What emerges from the results of the web survey is a complicated picture of use – significant use of Southern research by Southern researchers but perhaps no more significant than their use of Northern research. What would be interesting for GDNet to investigate is if there are different types of use for Southern and Northern research by Southern researchers. A number of free text comments on the use of Southern research seem to indicate that Northern and Southern research are used in a complementary manner – Northern research is used primarily to establish a theoretical basis whilst Southern research provides the context / is applied to solve specific problems. The following responses illustrate this point: “Different goals. Southern research is very linked to solving problems in the South, while the emphasis in northern research is on theoretical issues.” “Northern research provides models which can be applied in all countries. Southern research mostly concentrates on testing these models in their regional conditions. Unless my research is not concerned with these countries, I am not too much interested.” “For better theoretical discussions, I read Northern research. For more applied research, and more applicable to problems in the South, I read southern research.” Citation analysis – Background research on bibliometrics indicated that formal citation analysis involving the use of bibliometric software is not feasible or reliable when applied to social science orientated research. The reasons for this are two‐fold – researchers working in the social sciences tend to publish less in recognised peer reviewed journals (Scopus and ISI Web of Science catalogue a range of journals focussing mainly on the fields of the pure sciences) and this phenomenon is exacerbated when sampling Southern researchers, who tend to publish even less in peer reviewed journals in favour of producing research reports, books/book chapters, conference publications, policy briefs, and other ‘grey’ literature. For this reason an experimental, manual citation analysis exercise was undertaken involving the following steps:
8
• A sample of the ‘top 20’ most downloaded publications from the GDNet Knowledge Base (KB) was taken ‐ 10 publications from January 2011 and 10 publications from February 2011.
• A random sample of another 20 publications was taken from the GDNet KB. This random sample was ‘pair matched’ according to the ‘publication type’ of the ‘top 20’ – research report, journal article, policy brief, book/book chapter, conference publication, and other ‘grey’ literature.
• As well as the citation analysis, each publication was analysed against specific criteria ‐ Total downloads, Publication type, External funding agency, Country of origin/publisher, Country/ies of author's/authors' institutional affiliation, Country/ies of author/authors, Collaboration (based on countries of authors' institutional affiliation)
• The citation analysis was conducted by extracting the reference section from each publication and analysing each reference according to the country location of the publishing organisation cited. This produced a set of results which could be broken down into the total number of references from Northern institutions, the total number of references from Southern institutions, and hence the extent to which each publication used/relied upon Southern research in its creation.
• Note: During the scoping of the citation analysis exercise it was anticipated that the analysis would ‘drill down’ to identify and record the specific nationality of each referenced researcher. This proved to be both impractically resource intensive and feasibly impossible as it is not possible to identify the nationality of each researcher based simply on their surname and initial provided by a reference. As this is a common constraint in citation analysis, focusing on the country location of the publishing institution is considered standard practice. In this respect the analysis conforms with the norm.
The detailed results of the citation analysis exercise are set out in Annex 1. The headline conclusions to emerge from the exercise are as follows:
• The citations from the ‘top 20’ most downloaded publications are based on research which is approximately 60% from the North and 40% from the Global South. This finding broadly supports the results from the web survey that show that GDNet researchers combine the use both Northern and Southern research in their own research but perhaps rely slightly more on Northern rather than Southern research.
• However any conclusion from such a small sample needs to be treated with caution. The results show that there is considerable variation within the sample of ‘top 20’ publications – with several publications exclusively using either Northern or Southern research.
• Unsurprisingly, and reflecting international trends in research production, the USA and the UK dominate as the country locations for citations from the North whilst India dominates as the country location producing research from the Global South.
• Interesting the random ‘pair matched’ sample of publications is based on research which is 80% from the North and only 20% from the Global South. That the ‘top 20’ most downloaded publications from the knowldgebase tend to draw more on Southern research than the random pair matched sample may suggest that GDNet users are actively using GDNet as a source of Southern research. However, it is difficult to confirm this with any degree of confidence given the small sample size and inaccurate nature of assessing research origin by location of publishing institution.
Some broader conclusions to emerge from the citation analysis exercise relating to the nature of the research featured on GDNet include:
• The most downloaded publications from the GDNet KB seem not to be peer reviewed journal articles but more general research reports. There are two implications of this finding. Firstly, this confirms the received wisdom that formal citation analysis using bibliometric software would be an inappropriate method for analysing social‐science‐based southern research. Second, Southern researchers seem to use GDNet not to access peer reviewed journal articles, which perhaps are perceived as ‘northern’ in orientation, in favour of accessing a broader range of research outputs produced for a southern audience by southern researchers. It would be interesting for GDNet to further investigate this hypothesis – that GDNet is playing an important role opening up access to a broader range of views – ‘the diversity of southern research’.
• Other broad conclusions from the analysis are: o That the most popular publications tend to be Indian published by Indian authors. Six of the
top 20 publication (including the top three) come from Indian institutions and Indian researchers. Conversely only three of the top 20 publications originate from African
9
institutions and African researchers. On one hand this reflects poorly on the diversity of GDNet’s research audience. But on the other hand it reflects the size of the Indian population and the strength of their research institutions.
o There seems to be little institutional collaboration on the sample of Southern research used. The vast majority of the sampled publications are produced by a single institution and only one involved a North‐South collaboration and only two involved a South‐South collaboration. The finding is supported by wider research on research collaboration produced by the Royal Society which finds that South‐South collaboration is tiny in comparison to North‐North research collaboration but is increasing from a very low base ‐ http://royalsociety.org/policy/reports/knowledge‐networks‐nations/ Supporting further South‐South collaboration, particularly in Africa, is something that GDNet may consider supporting in the future.
Overall, whilst the manual citation analysis exercise was experimental in its nature it has proved to be a valid and interesting learning exercise. It adds to the very limited pool of existing knowledge on the use of southern research by southern researchers and seems to lend support to GDNet’s theory of change on the value of supporting research published in the Global South and how this is different in nature and use to research produced by researchers in more developed countries. It is hoped that the citation analysis exercise may be further refined in subsequent GDNet M&E activities. Data management plan Robbie Gregorowski / ITAD
• On an annual basis – Further refine citation analysis exercise on an annual basis. Sherine Ghoneim / GDNet
• On‐going – Interpretation of the findings of the citation analysis and application to better understand and improve the services GDNet offers
Tools and templates See Annex 1 for citation analysis results template.
10
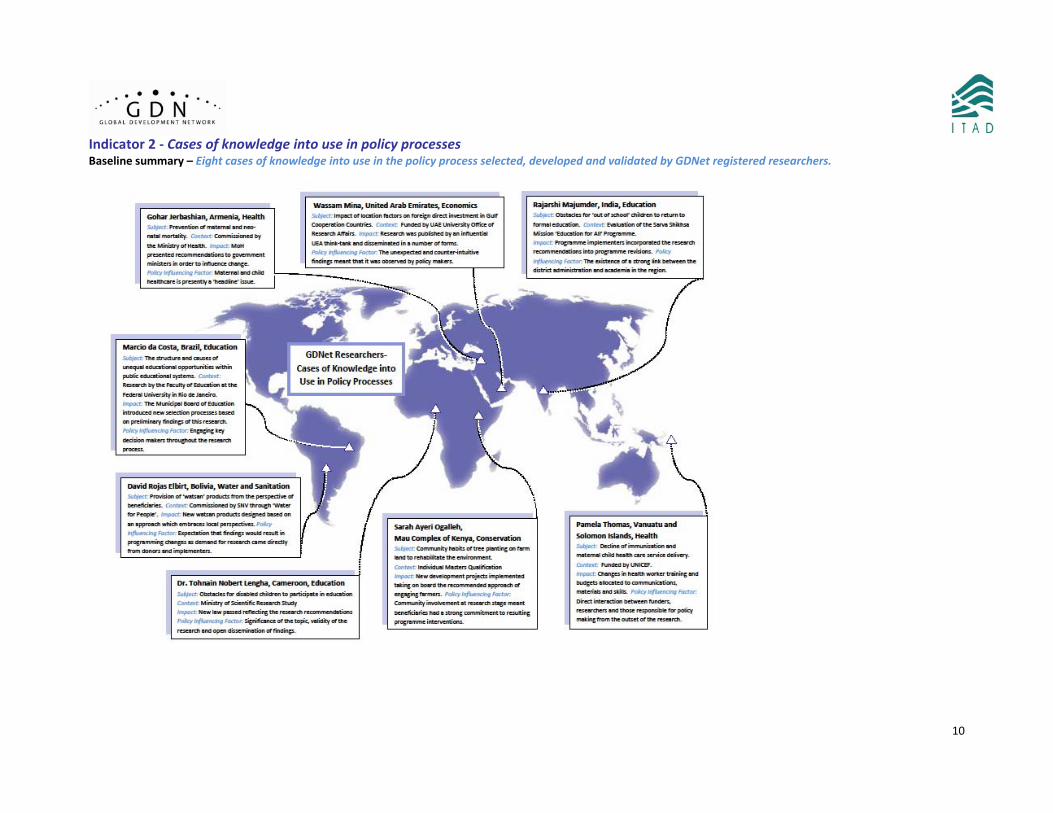
Indicator 2 ‐ Cases of knowledge into use in policy processes Baseline summary – Eight cases of knowledge into use in the policy process selected, developed and validated by GDNet registered researchers.
11
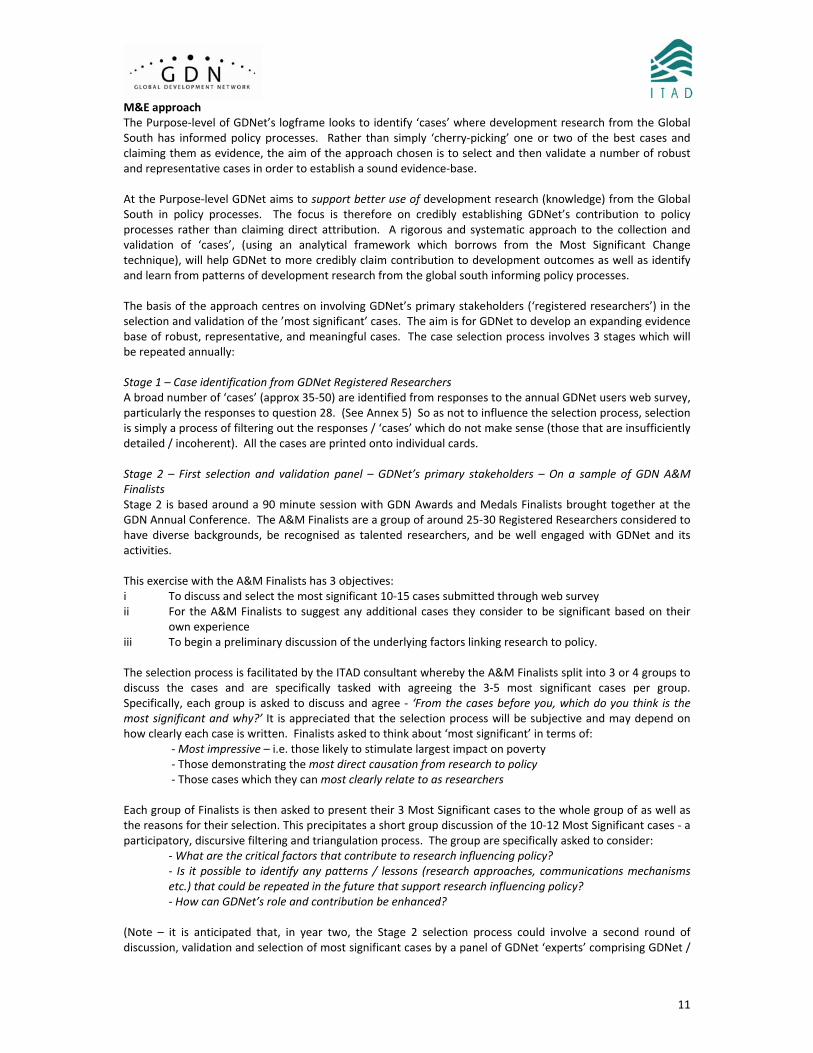
M&E approach The Purpose‐level of GDNet’s logframe looks to identify ‘cases’ where development research from the Global South has informed policy processes. Rather than simply ‘cherry‐picking’ one or two of the best cases and claiming them as evidence, the aim of the approach chosen is to select and then validate a number of robust and representative cases in order to establish a sound evidence‐base. At the Purpose‐level GDNet aims to support better use of development research (knowledge) from the Global South in policy processes. The focus is therefore on credibly establishing GDNet’s contribution to policy processes rather than claiming direct attribution. A rigorous and systematic approach to the collection and validation of ‘cases’, (using an analytical framework which borrows from the Most Significant Change technique), will help GDNet to more credibly claim contribution to development outcomes as well as identify and learn from patterns of development research from the global south informing policy processes. The basis of the approach centres on involving GDNet’s primary stakeholders (‘registered researchers’) in the selection and validation of the ’most significant’ cases. The aim is for GDNet to develop an expanding evidence base of robust, representative, and meaningful cases. The case selection process involves 3 stages which will be repeated annually: Stage 1 – Case identification from GDNet Registered Researchers A broad number of ‘cases’ (approx 35‐50) are identified from responses to the annual GDNet users web survey, particularly the responses to question 28. (See Annex 5) So as not to influence the selection process, selection is simply a process of filtering out the responses / ‘cases’ which do not make sense (those that are insufficiently detailed / incoherent). All the cases are printed onto individual cards. Stage 2 – First selection and validation panel – GDNet’s primary stakeholders – On a sample of GDN A&M Finalists Stage 2 is based around a 90 minute session with GDN Awards and Medals Finalists brought together at the GDN Annual Conference. The A&M Finalists are a group of around 25‐30 Registered Researchers considered to have diverse backgrounds, be recognised as talented researchers, and be well engaged with GDNet and its activities. This exercise with the A&M Finalists has 3 objectives: i To discuss and select the most significant 10‐15 cases submitted through web survey ii For the A&M Finalists to suggest any additional cases they consider to be significant based on their
own experience iii To begin a preliminary discussion of the underlying factors linking research to policy. The selection process is facilitated by the ITAD consultant whereby the A&M Finalists split into 3 or 4 groups to discuss the cases and are specifically tasked with agreeing the 3‐5 most significant cases per group. Specifically, each group is asked to discuss and agree ‐ ‘From the cases before you, which do you think is the most significant and why?’ It is appreciated that the selection process will be subjective and may depend on how clearly each case is written. Finalists asked to think about ‘most significant’ in terms of:
‐ Most impressive – i.e. those likely to stimulate largest impact on poverty ‐ Those demonstrating the most direct causation from research to policy ‐ Those cases which they can most clearly relate to as researchers
Each group of Finalists is then asked to present their 3 Most Significant cases to the whole group of as well as the reasons for their selection. This precipitates a short group discussion of the 10‐12 Most Significant cases ‐ a participatory, discursive filtering and triangulation process. The group are specifically asked to consider:
‐ What are the critical factors that contribute to research influencing policy? ‐ Is it possible to identify any patterns / lessons (research approaches, communications mechanisms etc.) that could be repeated in the future that support research influencing policy? ‐ How can GDNet’s role and contribution be enhanced?
(Note – it is anticipated that, in year two, the Stage 2 selection process could involve a second round of discussion, validation and selection of most significant cases by a panel of GDNet ‘experts’ comprising GDNet /
12
GDN core management staff, independent exerts specialising in policy influence, DFID RUT counterparts, and Regional Network Partner staff. This additional selection panel and group discussion did not prove feasible and was not deemed necessary for establishing the baseline cases in year one.) Stage 3 – Development and Validation of Most Significant Cases The authors of the 10‐12 selected cases are contacted by the ITAD consultant and each invited to an informal telephone interview to discuss and develop their case in more detail. The follow‐up interview process has two objectives: ‐ To clarify case objectives, methodology, findings, and impact ‐ what questions? ‐ To explore the determinants of success and the implications for GDNet ‐ how and why questions? The outcome of the process is 8‐10 rigorous, robust and representative cases of knowledge into use in policy processes. Each case is briefly written up (See Annex 3) and summarised in the map above. Based on a rapid synthesis of the eight cases selected and developed in year one, it is possible to extract a number of common policy influencing factors as well as a number of suggestions as to how GDNet’s role and contribution could be enhanced: Policy Influencing Factors
• Research is likely to have a great influence on policy if connections and clear lines of communication are established between all key stakeholder groups during the design of the research process, especially between the funding organisation, the research team, decision‐makers, and the primary beneficiaries.
• Critical that researchers identify questions (set research objectives) for which there is demand for answers from decision‐makers.
• A communications plan is an essential component of any successful research to policy process. • Policy‐makers are often ‘searching’ for robust and reliable research to provide the ‘evidence‐base’ to
support their decisions. GDN and GDNet’s Role and Contribution
• Most of the researchers interviewed had long histories of involvement with GDN/GDNet, most starting when they were more junior researchers. They credit training and the recognition they received through the GDN A&M process with inspiring and motivating them as capable researchers. In this way, GDN and GDNet has influenced the careers of a number of now influential, senior researchers working across the Global South.
• Nearly all researchers interviewed felt that they are lacking the relevant skills and capacity in research communications and policy influence and further training from GDNet would be beneficial. A number suggested a training of trainers (ToT) for research communications ‘champions’ appointed within each research institution.
• There appears to be considerable demand to join and support ‘thematic micro‐sites’ if these were to be developed and facilitated by GDNet. The two thematic areas that emerged (perhaps by chance) through the case selection process relate to maternal and child healthcare, and primary and secondary education provision.
It is anticipated that GDNet staff will further develop and investigate the cases identified in year one as an on‐going lesson‐learning process. In year two, a new set of most significant cases will be developed so that GDNet is continually building a robust and reliable evidence‐base of cases of knowledge into use in the policy process. Data management plan Robbie Gregorowski / ITAD
• On an annual basis – Facilitation of the case selection process and development of new cases. Zeinab Sabet / GDNet
• On‐going – more detailed case follow‐up and lesson learning Sherine Ghoneim / GDNet
• On‐going – Extraction and synthesis of lessons to enhance GDNet’s role and contribution. Tools and templates

13
The tools and templates required to establish the cases are located in the annexes as follows: • Annexes 5 and 6 detail the results of the Web Survey from which the cases were identified under
stage 1. • Annex 2 provides the instructions used for the stage 2 A&M Finalists most significant case selection
process. • Annex 3 provides the full write‐ups of all 8 of the cases developed for the baseline under stage 3.
14
Output 1 ‐ Southern research better informed by current ideas and knowledge
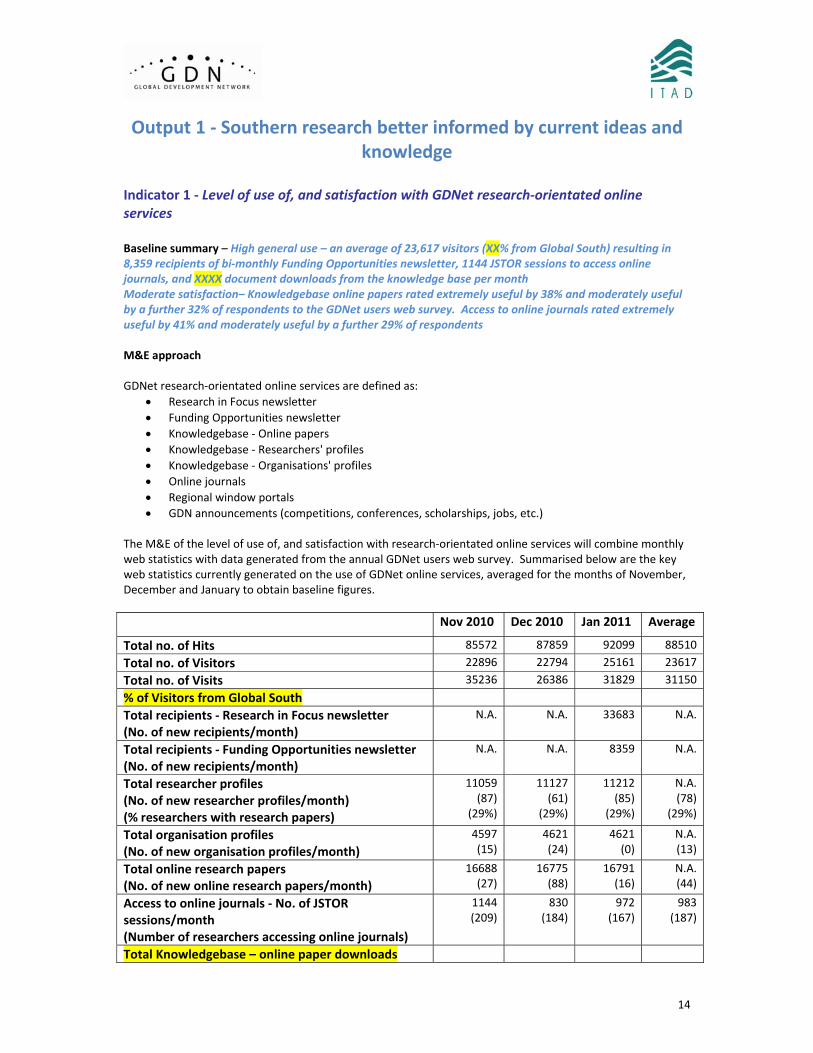
Indicator 1 ‐ Level of use of, and satisfaction with GDNet research‐orientated online services Baseline summary – High general use – an average of 23,617 visitors (XX% from Global South) resulting in 8,359 recipients of bi‐monthly Funding Opportunities newsletter, 1144 JSTOR sessions to access online journals, and XXXX document downloads from the knowledge base per month Moderate satisfaction– Knowledgebase online papers rated extremely useful by 38% and moderately useful by a further 32% of respondents to the GDNet users web survey. Access to online journals rated extremely useful by 41% and moderately useful by a further 29% of respondents M&E approach GDNet research‐orientated online services are defined as:
• Research in Focus newsletter • Funding Opportunities newsletter • Knowledgebase ‐ Online papers • Knowledgebase ‐ Researchers' profiles • Knowledgebase ‐ Organisations' profiles • Online journals • Regional window portals • GDN announcements (competitions, conferences, scholarships, jobs, etc.)
The M&E of the level of use of, and satisfaction with research‐orientated online services will combine monthly web statistics with data generated from the annual GDNet users web survey. Summarised below are the key web statistics currently generated on the use of GDNet online services, averaged for the months of November, December and January to obtain baseline figures. Nov 2010 Dec 2010 Jan 2011 Average
Total no. of Hits 85572 87859 92099 88510
Total no. of Visitors 22896 22794 25161 23617
Total no. of Visits 35236 26386 31829 31150
% of Visitors from Global South
Total recipients ‐ Research in Focus newsletter (No. of new recipients/month)
N.A. N.A. 33683 N.A.
Total recipients ‐ Funding Opportunities newsletter (No. of new recipients/month)
N.A. N.A. 8359 N.A.
Total researcher profiles (No. of new researcher profiles/month) (% researchers with research papers)
11059(87)
(29%)
11127(61)
(29%)
11212 (85)
(29%)
N.A.(78)
(29%)
Total organisation profiles (No. of new organisation profiles/month)
4597 (15)
4621(24)
4621 (0)
N.A.(13)
Total online research papers (No. of new online research papers/month)
16688(27)
16775(88)
16791 (16)
N.A.(44)
Access to online journals ‐ No. of JSTOR sessions/month (Number of researchers accessing online journals)
1144(209)
830(184)
972 (167)
983(187)
Total Knowledgebase – online paper downloads
15
Level of use ‐ GDNet’s online services receive on average 88,510 hits per month from an average 23,617 visitors. XX% of these visitors originate from the Global South. The GDNet Newsletters reach large numbers of users (33,683 ‐ Research in Focus, 8359 ‐ Funding Opportunities newsletter), and GDNet registered researchers benefit from free access to online journals through an average 983 JSTOR sessions per month. An average of XXX papers/reports are downloaded from the knowledgebase per month. The relatively high and frequent level of use across a range of services indicated by the web statistics is confirmed by the findings from the first annual GDNet users web survey. Over a quarter of respondents (26.9%) stated that they access GDNet on average once a week and a further 44.0% indicated that they access the GDNet services about once a month. There does not seem to be one single stand‐out use of GDNet’s online services. Rather the survey respondents seem to be relatively evenly split between the Knowledge Base online papers (29.0%), Access to online journals (28.6%), and the GDN newsletters (26.9%). A much smaller proportion of respondents have update their profile in the last 12 months – 36.7% stated they have never updated their profiles. A similarly small proportion (29%) have their research papers featured on GDNet. In terms of the gender disaggregation of GDNet users, respondents to an optional question in the annual GDNet users web survey were almost 75% male (73.6% male and 26.4% female), perhaps reflecting the nature of the research community as a profession, particularly in the Global South. GDNet will continue to collect data on the gender of its users through the web survey as part of its approach and planning to improve gender mainstreaming across GDNet and within the Global South. Under its current strategy and workplan, GDNet will increasingly be looking to balance the quantity of use (total number of users) with quality of use, developing a number of ‘involved’ users, and increasing the proportion of users who attain key usage goals. These goals may include:
• % of users who: o View a profile (researcher or organization) o Click on ‘featured’ content o Download a document o Conduct a search on the site
• Reducing the bounce rate from key landing pages • % of users who make repeat contributions to site content
To ensure that GDNet adequately captures quality as well as quantity of use, a revised set of web statistics will be defined. The revised web statistics plan was defined with support from the GDNet User Engagement Strategy Consultant, Cheryl Brown, in order to monitor and evaluate the impact of the various marketing campaigns GDNet is undertaking. Further ‘quality of use’ statistics will be defined and introduced by Cheryl Brown as GDNet marketing activities develop. Level of Satisfaction ‐ Satisfaction with research orientated online services is based on responses to the GDNet users web survey. Overall, GDNet users engaged through the web survey seem satisfied with GDNet services. When asked how they rate the usefulness of the services listed above every service (other than the Regional Window Portals) is rated as either extremely or moderately useful by at least 50% of respondents. Services rated particularly useful are: Access to online journals (41% of respondents rated them extremely useful and a further 29% rated them moderately useful); Funding opportunities newsletter (38% extremely useful and 29% moderately useful); and, Knowledgebase online papers (38% extremely useful and 32% moderately useful). Despite the encouraging baseline results on satisfaction with GDNet services, there is an opportunity for GDNet to raise satisfaction levels by improving its online services. For example, only 18% of respondents rated the Knowledgebase organisations’ profiles as extremely useful and only 21% rated the Research into Focus newsletter and Knowledgebase researchers’ profiles as extremely useful. Data management plan Cheryl Brown
• Definition of ‘quality of use’ web stats Karim Sohr
• Design and testing of revised set of web statistics Jermeen El‐Baroudy

16
• Day‐to‐day management, collection, and reporting of web statistics (reporting monthly but analysed and provided to DFID quarterly)
Robbie Gregorowski • On an annual basis – assess level of use of research‐orientated online services over previous 12
months through analysis of web statistics and through the annual GDNet users web survey, and report on findings against baseline and lesson learnt to GDNet.
Tools and templates See Annex 7 for revised web statistics plan.
17
Indicator 2 ‐ Level of use of, and satisfaction with themed services Baseline summary – Themed services not yet established The subject areas for themed services have not yet been defined by GDN. However, GDNet has planned to align the thematic content along researchers’ interests as registered on the GDNet KB and is preparing to pilot a range of thematic services through a number of Thematic Micro‐sites. Under each Thematic Micro‐site, it is planned that GDNet will coordinate and facilitate Online Community Groups who have signed up to specific themes. Assuming sign‐up / registration is a requirement, GDNet will collect gender disaggregated statistics on the Online Community Group members. M&E approach Level of use themed services will be monitored using web usage statistics. Web statistics are likely to include: ‐ Number of sign‐ups to each thematic micro‐site ‐ Frequency of micro‐site usage ‐ Quality of micro‐site usage – log‐ins, entering into online discussion, submitting content to micro‐site Satisfaction with themed services will be assessed through the annual GDNet users web survey. This will assess overall satisfaction with themed services from the general population of GDNet users. In addition, and depending on the design and conditions of the Thematic Knowledge Base, a separate web survey may be targeted at thematic micro‐site users. Data management plan Shahira Emara
• Day‐to‐day – management and facilitation of themed services including generating web statistics on the level of use (reporting monthly but analysed quarterly).
Robbie Gregorowski • On an annual basis ‐ assess thematic service satisfaction through the annual GDNet users web survey
as well as designing short web survey targeted at thematic micro‐site users Tools and templates To be defined in the year 2 round of M&E activities.
18
Output 2 ‐ Researchers better able to communicate their research to policy
Indicator 1 – Researchers’ confidence and ability to communicate their research – immediately following capacity building effort Baseline summary – Confidence ‐ On a self‐assessment scale where 0 = not at all confident and 5 = very confident, the average GDNet researcher is moderately confident (3.1 out of 5) to communicate their research to policy before any training/capacity building has been provided by GDNet. This average confidence figure rises to 4.3 immediately following a training / capacity building event. Ability ‐ On a self‐assessment scale where 0 = not at all able and 5 = very able, the average GDNet researcher is moderately able (2.9 out of 5) to communicate their research to policy before any training/capacity building has been provided by GDNet. This average ability figure rises to 4.0 immediately following a training / capacity building event. Indicator 2 – Researchers’ confidence and ability to communicate their research – sustainability of capacity building effort Baseline summary – First set of cases of researchers’ confidence and ability to communicate their research being developed M&E approach for Indicator 1 and Indicator 2 GDNet activities under output 2 revolve around a series of region‐specific and thematic mentoring, capacity building and training workshops for a range of researchers / GDNet stakeholders on research communications and writing for policy relevance. A number of these workshops have already taken place – in Mombasa in November 2010 and in Bogota before the GDN Annual Conference with the A&M Finalists in January 2011. The approach to monitoring and evaluating researchers’ confidence and ability to communicate their research draws heavily on Kirkpatrick’s training evaluation model and employs a tailored questionnaire to assess confidence and ability before and after training. The four levels of Kirkpatrick's training evaluation model essentially measure: 1 ‐ Reaction ‐ is how the participants felt about the training or learning experience. 2 ‐ Learning ‐ is the measurement of the increase in knowledge ‐ before and after. 3 ‐ Behaviour ‐ is the extent of applied learning back on the job ‐ implementation. 4 ‐ Results ‐ is the effect on the business or environment by the participant. A questionnaire template (Annex 8) to evaluate GDNet’s output 2 capacity building activities was designed and piloted at the GDNet training events in Mombasa and Bogota. Based on participant feedback, the template was revised in order to be simpler to administer and complete. Completing Parts 1 and 2 of the questionnaire involves responding to a set of confidence and ability self‐assessment statements which have been tailored to the specific objectives of each training session / workshop. Tailoring these statements is the responsibility of the GDNet staff member facilitating the workshop, working with the external consultant contracted to provide the training (if there is one). At the beginning of a training event, an explanation of the assessment process is given to the participants, who are then asked to rate their confidence and ability against the set of statements according to a six‐point scale (0 = not at all confident/able and 5 = very confident/very able). Participant confidence and ability is assessed at the beginning and end of the training event in order to gather before and after confidence and ability ratings. These ratings primarily relate to level 1 (reaction) and level 2 (immediate learning) in Kirkpatrick’s model. Part 3 of the questionnaire asks the participants some more open‐ended questions on the likely outcomes from the training – how they plan to apply the learning they have gained, what results it might deliver, and some wider outcomes to come from the training in terms of networking with other experts in the same field.
19
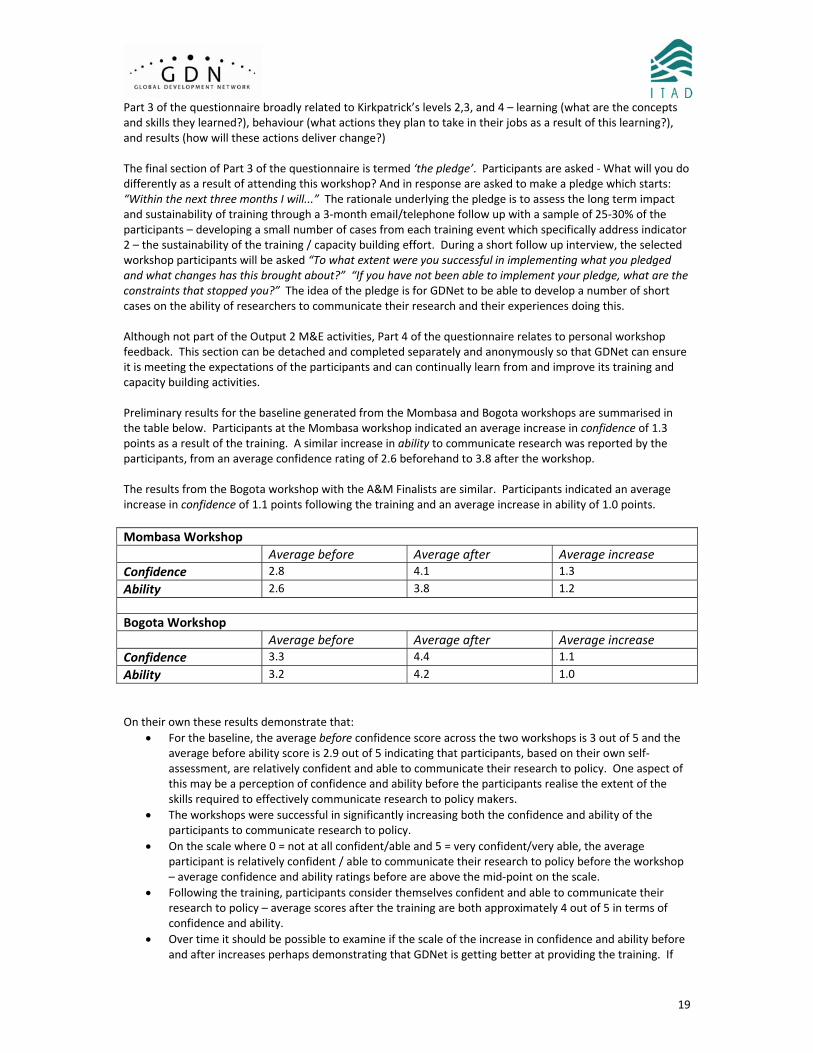
Part 3 of the questionnaire broadly related to Kirkpatrick’s levels 2,3, and 4 – learning (what are the concepts and skills they learned?), behaviour (what actions they plan to take in their jobs as a result of this learning?), and results (how will these actions deliver change?) The final section of Part 3 of the questionnaire is termed ‘the pledge’. Participants are asked ‐ What will you do differently as a result of attending this workshop? And in response are asked to make a pledge which starts: “Within the next three months I will...” The rationale underlying the pledge is to assess the long term impact and sustainability of training through a 3‐month email/telephone follow up with a sample of 25‐30% of the participants – developing a small number of cases from each training event which specifically address indicator 2 – the sustainability of the training / capacity building effort. During a short follow up interview, the selected workshop participants will be asked “To what extent were you successful in implementing what you pledged and what changes has this brought about?” “If you have not been able to implement your pledge, what are the constraints that stopped you?” The idea of the pledge is for GDNet to be able to develop a number of short cases on the ability of researchers to communicate their research and their experiences doing this. Although not part of the Output 2 M&E activities, Part 4 of the questionnaire relates to personal workshop feedback. This section can be detached and completed separately and anonymously so that GDNet can ensure it is meeting the expectations of the participants and can continually learn from and improve its training and capacity building activities. Preliminary results for the baseline generated from the Mombasa and Bogota workshops are summarised in the table below. Participants at the Mombasa workshop indicated an average increase in confidence of 1.3 points as a result of the training. A similar increase in ability to communicate research was reported by the participants, from an average confidence rating of 2.6 beforehand to 3.8 after the workshop. The results from the Bogota workshop with the A&M Finalists are similar. Participants indicated an average increase in confidence of 1.1 points following the training and an average increase in ability of 1.0 points.
On their own these results demonstrate that:
• For the baseline, the average before confidence score across the two workshops is 3 out of 5 and the average before ability score is 2.9 out of 5 indicating that participants, based on their own self‐assessment, are relatively confident and able to communicate their research to policy. One aspect of this may be a perception of confidence and ability before the participants realise the extent of the skills required to effectively communicate research to policy makers.
• The workshops were successful in significantly increasing both the confidence and ability of the participants to communicate research to policy.
• On the scale where 0 = not at all confident/able and 5 = very confident/very able, the average participant is relatively confident / able to communicate their research to policy before the workshop – average confidence and ability ratings before are above the mid‐point on the scale.
• Following the training, participants consider themselves confident and able to communicate their research to policy – average scores after the training are both approximately 4 out of 5 in terms of confidence and ability.
• Over time it should be possible to examine if the scale of the increase in confidence and ability before and after increases perhaps demonstrating that GDNet is getting better at providing the training. If
Mombasa Workshop Average before Average after Average increase Confidence 2.8 4.1 1.3
Ability 2.6 3.8 1.2 Bogota Workshop Average before Average after Average increase Confidence 3.3 4.4 1.1
Ability 3.2 4.2 1.0
20
this were to be the case the scale of the increase before and after over time is likely to be at best very small.
• Finally, it may also be possible to draw inferences on the differences in confidence and ability between groups perhaps according to geographical location, researcher experience etc.
The 3‐month follow‐up component of the questionnaire through the ‘pledge’ aims to examine the longer‐term outcomes of the training in terms of the participants’ ability to communicate their research to policy. A sample of workshop participants with interesting or promising pledges are selected and invited to take part in a short telephone interview. The results of the first set of pledge interviews from the Mombasa workshop are pending. Data management plan Robbie Gregorowski / ITAD
• Design and testing of workshop questionnaire template and results Zeinab Sabet / GDNet
• On‐going – defining confidence and ability statements in advance of each workshop, • Facilitating questionnaire completion by participants at each workshop, • Recording results following each workshop in the results template, • Facilitating the 3‐month ‘pledge’ email and telephone follow‐up with a sample of participants (approx.
25%) following each workshop and completing the pledge follow‐up template, • Synthesis of pledge results into a small number of cases on an annual basis, • Follow‐up on training event feedback to extract learning for GDNet and feed this back into improved
training and capacity building provision. Tools and templates A number of templates have been designed to support the M&E of Output 2:
• RCCB Training Questionnaire template – Parts 1‐4 to be completed by participants(Annex 8) • RCCB Training Results database – To store the data generated from the questionnaires from each
event as well as a set of guidelines on how to enter the data. The data generated from the Mombasa and Bogota training events is already held in the template (Annex 9)
21
Output 3 ‐ Knowledge networking between researchers and with policy actors increased
Indicator 1 – GDNet ‘user base’ interaction Baseline summary – Very limited ‘user base’ interaction – online collaborative workspace piloted M&E approach GDNet ‘user base’ interaction involves Southern researchers with whom GDNet has engaged – through attendance at training event, conference, membership of a community group ‐ interacting with other Southern researchers. As GDNet’s user base is a relatively new concept which emerged from the still to be defined GDNet user base concept it has not yet been possible for GDNet to undertake activities to support user base interaction. GDNet has undertaken a small number of activities which support Southern researcher interaction, defined as the user base. These include piloting an online collaborative workspace accessible through the GDNet website and accessible to researchers who have attended a GDNet training and capacity building workshop – see output 2 RCCB events held in Mombasa and Bogota. Similarly GDNet has managed a number of activities around GDNet and GDN events such as the GDN Conference in January 2011 which have facilitated GDNet user base interaction. Once the ‘user base’ definition has been formalised and the activities to support user base interaction have been agreed (likely to be event‐driven), monitoring the frequency and nature of this interaction will be achieved through a simple event / activity log. Additionally it may prove possible to design and conduct a short user base electronic survey through an online collaborative workspace (if take up is sufficiently high) to assess the nature of user base interaction, the results this interaction has brought about, and how GDNet’s role facilitating user base networks can be enhanced. The M&E Consultant will further develop this approach in Year 2 once GDNet user base interaction activities are well defined and established. Data management plan Robbie Gregorowski / ITAD
• Annually from year 2 ‐ designing and conducting GDNet user base focus group / web survey Zeinab Sabet / GDNet
• On‐going – logging GDNet user base interaction according to log template and extracting lessons for GDNet
Tools and templates A template to record user base interaction log is provided in Annex 10. Indicator 2 ‐ Researchers interactions with the policy domain Baseline summary – Limited interaction – GDNet facilitation of researchers’ interactions with the policy domain not yet established M&E approach GDNet will facilitate interaction between researchers and the policy domain through a number of activities and events, which kicked‐off in January 2011 with a workshop discussion session at the GDN Conference in Columbia entitled ‘Research Shaping Policy – Latin America’s Experiences.’ The session brought together the Executive Directors of five Latin American think tanks, from Colombia, Argentina, Equator, Brazil and Chile to draw similarities and contrasts from their different approaches to influencing policy. Other activities that GDNet has planned under this output include: coordinating occasional series of regional policy dialogues with Regional Network Partners (RNPs); running policy‐relevant physical networking sessions at RNPs’ Regional
22
Conferences; running ad hoc high‐level policy – expert dialogues with national partners in Cairo; and, a series of researcher to researcher and research to policy activities at the GDN Annual Conference. The approach to monitoring these activities and evaluating the researcher – policy domain interaction is much the same as indictor 1 – GDNet user base interaction. Monitoring researcher – policy domain interaction will involve logging the nature and frequency of the activities that GDNet facilitates. On an annual basis GDNet will use the logs to extract and synthesise the results and lessons that have emerged from the researcher – policy domain interaction. Data management plan Zeinab Sabet / GDNet
• On‐going – logging researcher – policy domain interaction according to log template and extracting lessons for GDNet
Tools and templates A template to record research – policy domain interaction log is provided in Annex 11.
23
Output 4 – GDN Fellows’ research better communicated to different, identified audiences
Indicator 1 – Availability of GDN Fellows’ published research products on GDNet Baseline summary – GDN Fellows’ not yet established M&E approach GDN Fellows have not yet been established by GDN. The M&E approach for this indicator is anticipated to be developed towards the end of 2011 when further details of the GDN Fellows are available. The approach is likely to involve ‘tagging’ the various research products produced by GDN Fellows by name and product on the GDNet KB. Data management plan Sherine Ghoneim
• On‐going – interaction with GDN on the definition, establishment, and appointment of GDN Fellows. Jermeen El‐Baroudy
• On‐going – collection, tagging, and web statistics reporting on research products published by GDN Fellows on the knowledge base.
Tools and templates None required. Indicator 2 – Availability of GDN Fellows’ research through new and interactive media channels Baseline summary – GDN Fellows not yet established M&E approach As with indicator 1 above, the development of new and interactive media channels to manage and disseminate GDN Fellows’ research is on hold pending the establishment of the Fellows’ by GDN and is anticipated to be developed towards the end of 2011 when further details of the GDN Fellows are available. Data management plan Jermeen El‐Baroudy
• On‐going – period dissemination of GDN Fellows’ research according to media channels developed. Tools and templates None required.
24
Output 5 ‐ Lessons about knowledge brokering best practice in the global south learnt and communicated
Indicator 1 ‐ Generation of best practice lessons Baseline summary ‐ Generation of best practice lessons not yet established M&E approach Knowledge brokers such as GDNet generate, interpret, organise and communicate research‐based information from diverse perspectives. They also foster links, interaction, understanding and collaboration between researchers and decision makers. GDNet and its partners have significant experience and expertise in this role. Output 5 focuses on the expertise and experience generated by the GDNet team as experts in facilitating, convening and, knowledge brokering in the global south. GDNet activities under Output 5 involves a range of reflective, lesson‐learning activities in order to extract, triangulate, and synthesise the knowledge brokering best practice generated by GDNet. In order to capture the new knowledge generated across GDNet’s portfolio of activities, GDNet staff will need to ensure those people engaged to support and facilitate these activities (including external experts) are required to produce a short reflection on their input. GDNet will organise periodic (perhaps bi‐annual) reflective events, such as team retreats, in order to extract and synthesise this knowledge and produce best practice lessons. Reflective events will be complemented by occasional distinct learning products. Monitoring Output 5 indicator 1 activities will involve a log of reflective activities. Data management plan Range of GDNet staff and service providers
• Completion of reflective summary following each input, activity or event. Zeinab Sabet / GDNet
• On‐going completion of log of reflective activities • Bi‐annually – organisation of reflective events and products in order to produce best practice lessons
Tools and templates A template for logging the reflective events and products is provided in Annex 12. Indicator 2 ‐ Communication of lessons Baseline summary – Communication of best practice lessons not yet established M&E approach GDNet is responsible for communicating the best practice lessons generated through the reflective activities detailed above. Audiences are likely to include other knowledge brokers such as DFID Research Uptake Team and the IDS Impact and Learning Team. Communications channels may include emailing the best practice note to relevant stakeholder groups such as the Knowledge Brokers Forum or presenting the findings at relevant seminars and conferences such as the GDN Annual Conference. GDNet is also expected to highlight the best practice lessons through its website. Monitoring GDNet’s communications of the lessons will be conducted through a simple log. Data management plan Zeinab Sabet / GDNet
• On‐going completion of communications of best practice lessons log Tools and templates A log template for the communication of best practice lessons is provided in Annex 13.