Embed Size (px)
Citation preview

Congressional Budget Office
Overview of the Federal Budget
Presentation to the Maryland Association of CPAs, Inc.
April 17, 2015
Barry Blom Principal Budget Analyst, Projections Unit
This presentation provides 10-year budget projections published in Updated Budget Projections: 2015 to 2025 (March 2015), www.cbo.gov/publication/49973, economic forecasts from The Budget and Economic Outlook: 2015 to 2025 (January 2015), www.cbo.gov/publication/49892, and longer-term budget projections from Budgetary and Economic Outcomes Under Paths for Federal Revenues and Noninterest Spending Specified by Chairman Price, March 2015 (March 2015), www.cbo.gov/publication/49977.

1 C O N G R E S S I O N A L B U D G E T O F F I C E
CBO’s History and Mission
■ Created by the Congressional Budget and Impoundment Control Act of 1974
■ Provides objective, timely, and nonpartisan analysis for budget and economic decisions
■ Most work supports the activities of committees rather than individual Members of Congress
2 C O N G R E S S I O N A L B U D G E T O F F I C E
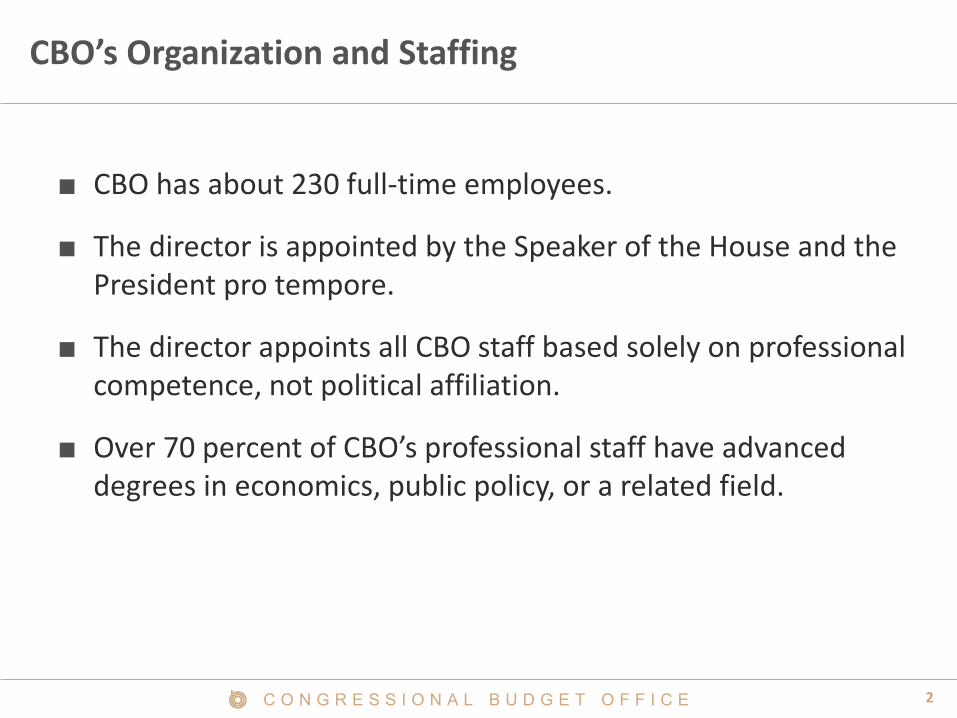
CBO’s Organization and Staffing
■ CBO has about 230 full-time employees.
■ The director is appointed by the Speaker of the House and the President pro tempore.
■ The director appoints all CBO staff based solely on professional competence, not political affiliation.
■ Over 70 percent of CBO’s professional staff have advanced degrees in economics, public policy, or a related field.
3 C O N G R E S S I O N A L B U D G E T O F F I C E
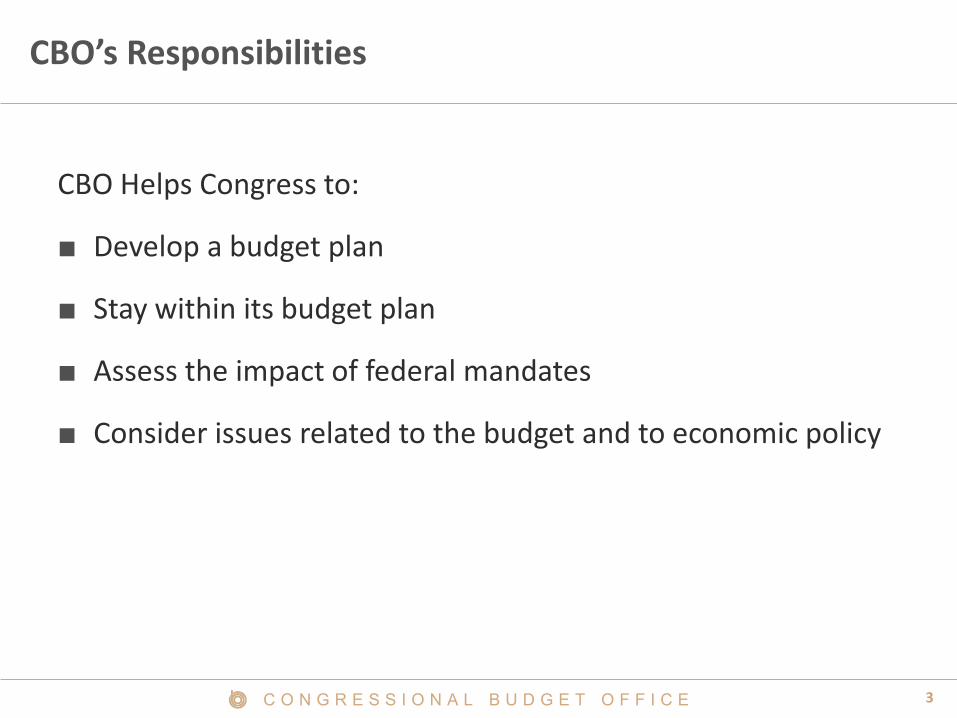
CBO’s Responsibilities
CBO Helps Congress to:
■ Develop a budget plan
■ Stay within its budget plan
■ Assess the impact of federal mandates
■ Consider issues related to the budget and to economic policy
4 C O N G R E S S I O N A L B U D G E T O F F I C E
CBO’s Products
■ Annual baseline
■ Analysis of the President’s budget
■ Cost estimates
■ Scorekeeping tabulations
■ Long-term budget outlook
■ Budget options
■ Reports and testimony on budget and economic issues

5 C O N G R E S S I O N A L B U D G E T O F F I C E
What CBO Does Not Do
■ Make policy recommendations – Strictly nonpartisan; no judgments about a legislative proposal’s merits
■ Write legislation – Instead evaluates different proposals and options
■ Implement programs and regulations and enforce budget rules – The executive branch does that
■ Audit spending or receipts – GAO does that

6 C O N G R E S S I O N A L B U D G E T O F F I C E
Total Deficits or Surpluses
(Percentage of gross domestic product)
Deficits
Surpluses
Actual Projected
1965 1970 1975 1980 1985 1990 1995 2000 2005 2010 2015 2020 2025 -10
-8
-6
-4
-2
0
2
4
Average Deficit, 1965 to 2014
(2.7%)

7 C O N G R E S S I O N A L B U D G E T O F F I C E
Budget Totals, 2009, 2013, 2015-2016
Billions of Dollars Percentage of GDP Actual Baseline Actual Baseline
2009 2013 2015 2016 2009 2013 2015 2016
Total Revenues 2,105 2,775 3,191 3,470 14.6 16.7 17.7 18.4
Total Outlays 3,518 3,455 3,677 3,925 24.4 20.8 20.4 20.8 ______________________________________ ____________________________________ __________________________________ _______________________________________ _______________________________________ _______________________________________ _______________________________________ _______________________________________
Total Deficit -1,413 -680 -486 -455 -9.8 -4.1 -2.7 -2.4

8 C O N G R E S S I O N A L B U D G E T O F F I C E
Total Revenues and Outlays
(Percentage of gross domestic product)
Outlays
Revenues
1965 1970 1975 1980 1985 1990 1995 2000 2005 2010 2015 2020 2025 0
4
8
12
16
20
24
28 Actual Projected
Average Revenues, 1965 to 2014
(17.4%)
Average Outlays, 1965 to 2014
(20.1%)

9 C O N G R E S S I O N A L B U D G E T O F F I C E
GDP and Potential GDP
(Trillions of 2009 dollars)

10 C O N G R E S S I O N A L B U D G E T O F F I C E
Actual Values and CBO’s Projections of Key Economic Indicators

11 C O N G R E S S I O N A L B U D G E T O F F I C E
Revenues, by Major Source
(Percentage of gross domestic product)
1965 1970 1975 1980 1985 1990 1995 2000 2005 2010 2015 2020 20250
1
2
3
4
5
6
7
8
9
109.5
IndividualIncome Taxes
Actual Projected
5.7
1.8
1.2
Payroll Taxes
CorporateIncome Taxes
Other RevenueSources
12 C O N G R E S S I O N A L B U D G E T O F F I C E
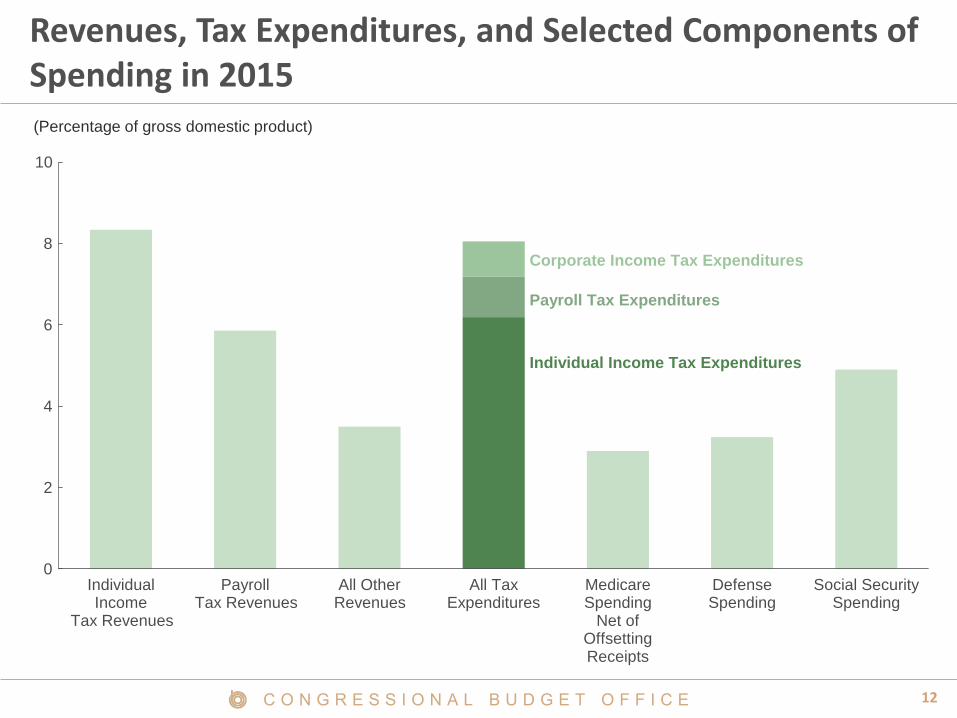
Revenues, Tax Expenditures, and Selected Components of Spending in 2015 (Percentage of gross domestic product)
IndividualIncome
Tax Revenues
PayrollTax Revenues
All OtherRevenues
All TaxExpenditures
MedicareSpending
Net ofOffsettingReceipts
DefenseSpending
Social SecuritySpending
0
2
4
6
8
10
Corporate Income Tax Expenditures
Payroll Tax Expenditures
Individual Income Tax Expenditures
13 C O N G R E S S I O N A L B U D G E T O F F I C E
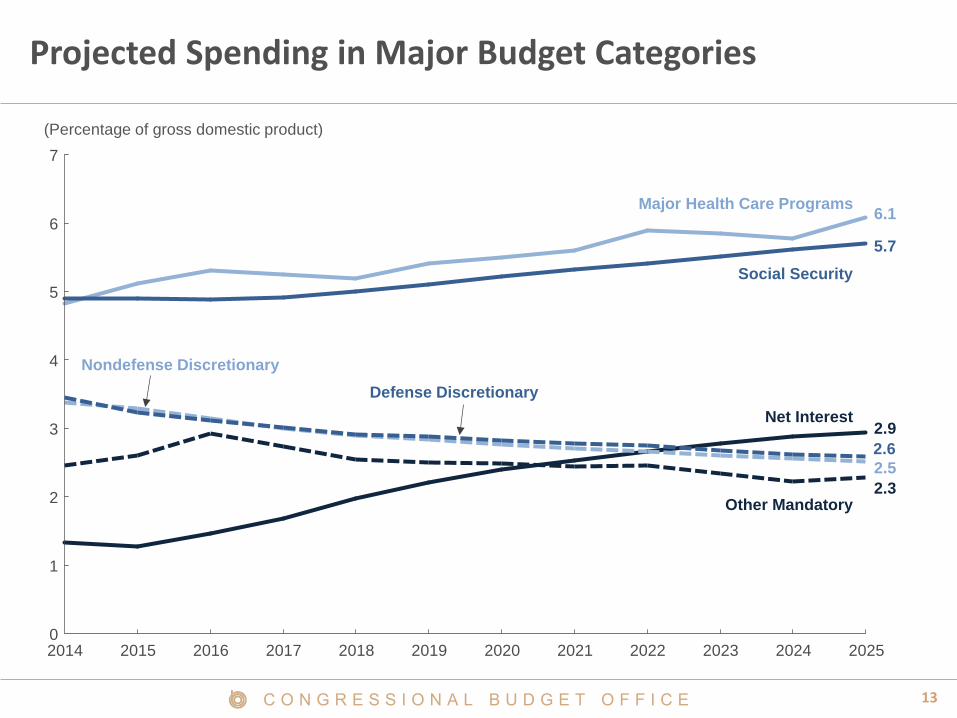
Projected Spending in Major Budget Categories
(Percentage of gross domestic product)
Major Health Care Programs 6.1
Social Security
5.7
Net Interest 2.9
Nondefense Discretionary
2.5
Other Mandatory 2.3
2014 2015 2016 2017 2018 2019 2020 2021 2022 2023 2024 2025 0
1
2
3
4
5
6
7
Defense Discretionary
2.6

14 C O N G R E S S I O N A L B U D G E T O F F I C E
Components of the Total Increase in Outlays in CBO’s Baseline Between 2015 and 2025
Total Increase in Outlays:$2.4 Trillion
All Other Programs(16%)
Net Interest(24%)
Social Security(29%)
Major Health Care Programs(31%)

15 C O N G R E S S I O N A L B U D G E T O F F I C E
Projected Debt Held by the Public and Net Interest
(Billions of dollars)
2014 2015 2016 2017 2018 2019 2020 2021 2022 2023 2024 20250
100
200
300
400
500
600
700
800
900
0
5,000
10,000
15,000
20,000
25,000Net Interest (Left axis)
Debt Held by the Public (Right axis)
16 C O N G R E S S I O N A L B U D G E T O F F I C E
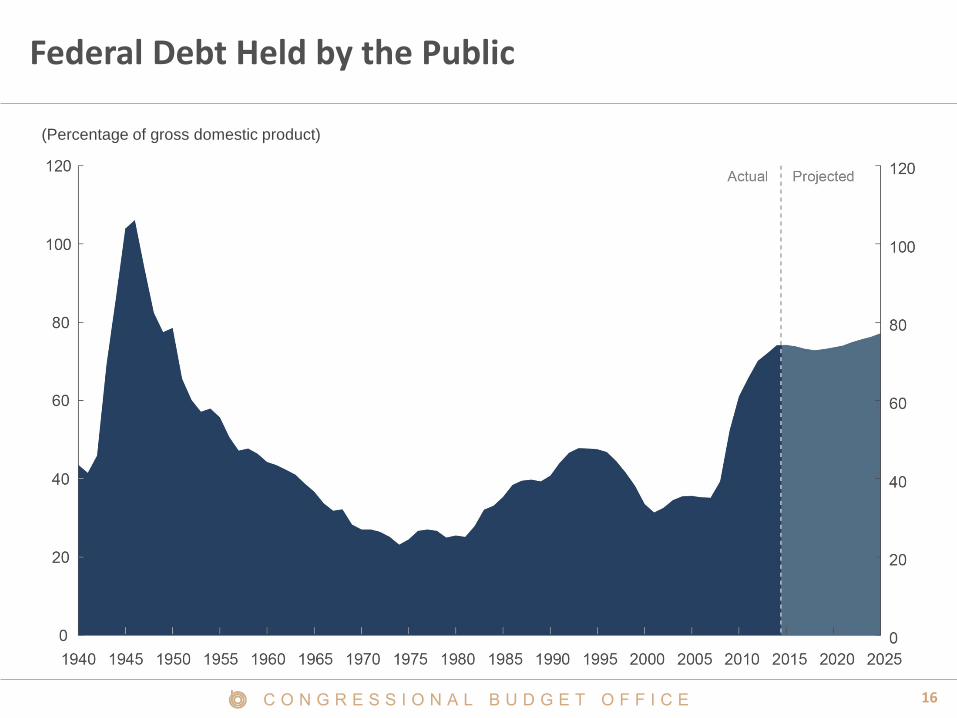
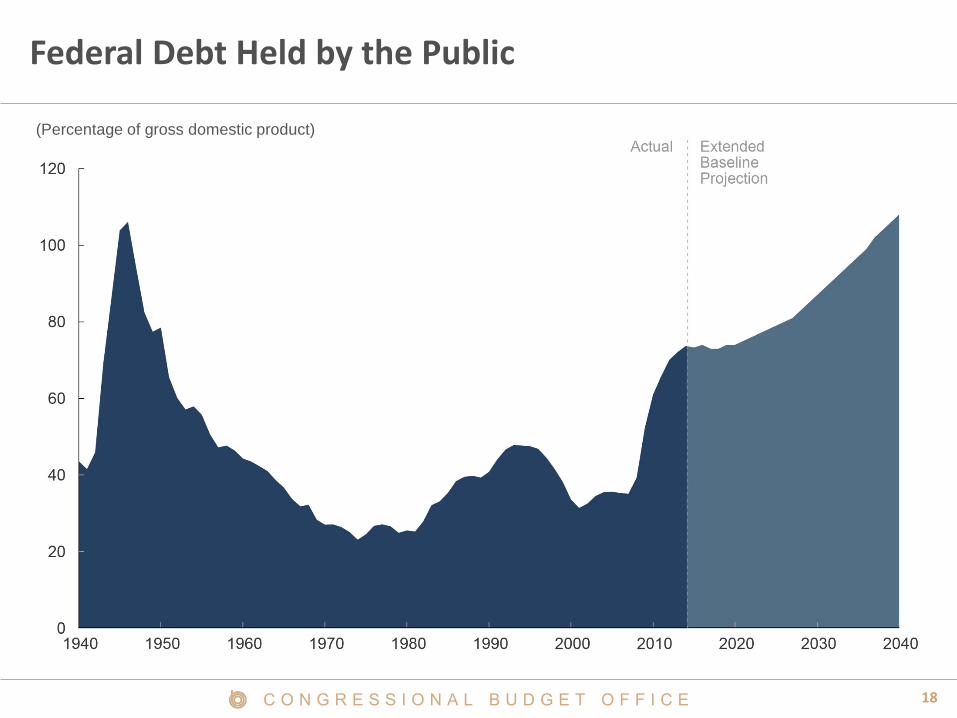
Federal Debt Held by the Public
(Percentage of gross domestic product)

17 C O N G R E S S I O N A L B U D G E T O F F I C E
Why Does Rising Federal Debt Matter?
■ Boosts interest costs, putting more pressure on the rest of the budget and making it more difficult to constrain future deficits
■ Restrains economic growth and people’s income in the long term
■ Limits the ability of the government to respond to future challenges
■ Increases the risk of a fiscal crisis
18 C O N G R E S S I O N A L B U D G E T O F F I C E
Federal Debt Held by the Public
(Percentage of gross domestic product)
19 C O N G R E S S I O N A L B U D G E T O F F I C E
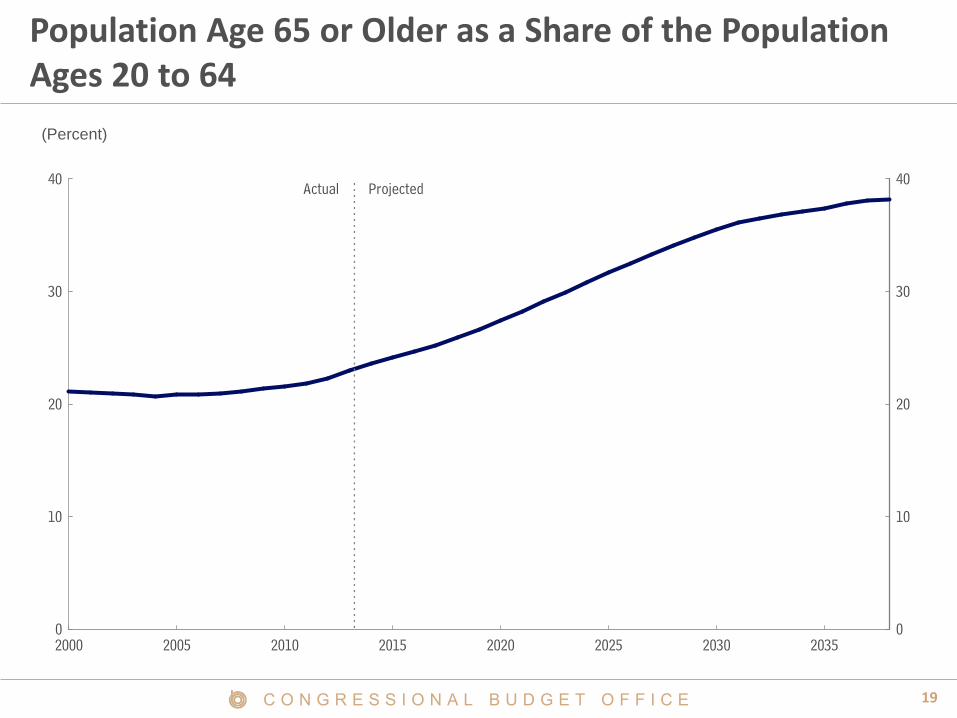
Population Age 65 or Older as a Share of the Population Ages 20 to 64
(Percent)
2000 2005 2010 2015 2020 2025 2030 20350
10
20
30
40
0
10
20
30
40Actual Projected

20 C O N G R E S S I O N A L B U D G E T O F F I C E
Spending for Social Security Under CBO’s Extended Baseline (Percentage of gross domestic product)
1999 2004 2009 2014 2019 2024 2029 2034 20390
2
4
6
8Actual
2024
2040
6.2
4.9
Extended Baseline Projection
5.62014
21 C O N G R E S S I O N A L B U D G E T O F F I C E
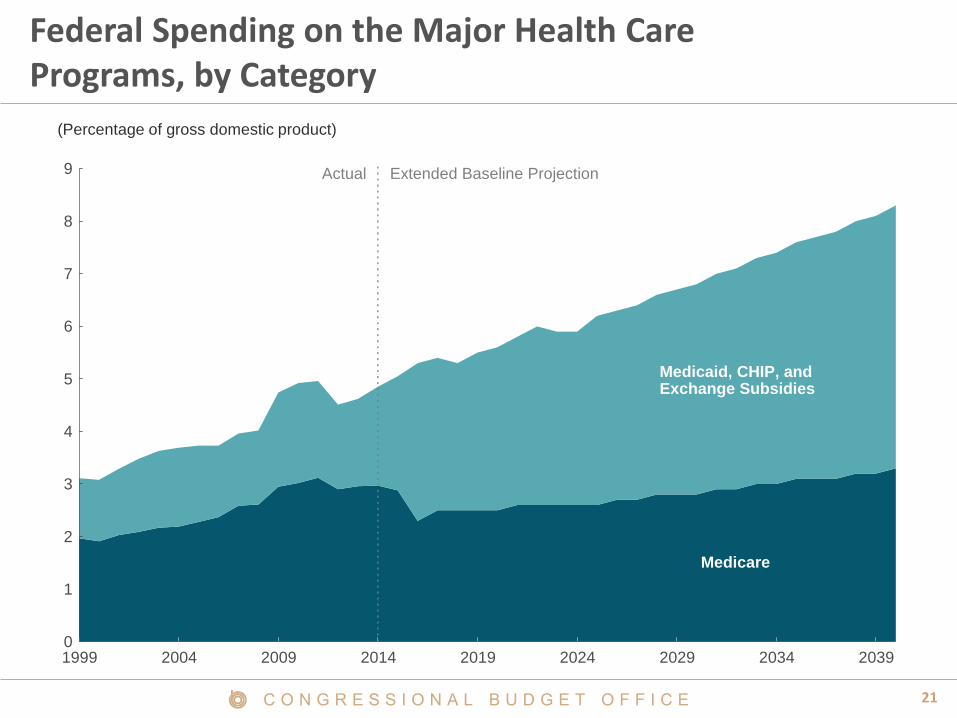
Federal Spending on the Major Health Care Programs, by Category
(Percentage of gross domestic product)
1999 2004 2009 2014 2019 2024 2029 2034 20390
1
2
3
4
5
6
7
8
9
Medicare
Medicaid, CHIP, and Exchange Subsidies
Actual Extended Baseline Projection

22 C O N G R E S S I O N A L B U D G E T O F F I C E
Conclusion
Given the aging of the population and rising costs for health care, attaining a sustainable federal budget will require the United States to deviate from the policies of the past 50 years in at least one of the following ways:
■ Letting revenues rise more than they would under current law
■ Reducing spending for large benefit programs to below the projected amounts
Changes in spending for other federal activities could affect the magnitude of the changes needed in taxes or large benefit programs but would not eliminate the need to make such changes.