Embed Size (px)
Citation preview

For Peer Review
Proposed Performance Management System Framework By
Using IPMS Method at Indonesian Government Research Institution Under Ministry Administration
Journal: International Journal of Productivity and Performance Management
Manuscript ID: Draft
Manuscript Type: Standard Paper
Keywords: Performance management systems, Government agencies, IPMS Method, TOWS matrix
International Journal of Productivity and Performance Management

For Peer Review
PROPOSED PERFORMANCE MANAGEMENT SYSTEM FRAMEWORK BY USING
IPMS METHOD AT INDONESIAN GOVERNMENT RESEARCH INSTITUTION
UNDER MINISTRY ADMINISTRATION
Mahammad Khadafi and Dermawan Wibisono
School of Business and Management
Bandung Institute of Technology, Indonesia
[email protected]; [email protected]
Abstract Purpose – It proposes performance management system framework by using Integrated
Performance Management System (IPMS) method at Indonesia government research institution. The
problem such as lack of innovation, a few number of scientific publication and limited of budget
allocation makes Center for Pulp and Paper as one of the government research institution in
Indonesia is poor at R&D performance. R&D activity is only focused on achieving the target of annual
state budget allocation. So that, output from R&D activity such as number of technology and patent
that produced are very a few in numbers. Consequently, the institution needs a suitable corporate
performance management system that can be monitored R&D output activity of Center for Pulp and
Paper.
Design/Methodology/Approach – The analysis begin with formulate corporate performance
management framework based on IPMS method to proposed a new strategic plan, The new strategy
formulation is obtained from SWOT analysis, Internal – External Factor Strategy analysis for
positioning the company at directional strategy matrix and TOWS matrix analysis. New strategic
objectives from strategy formulation are used as a reference to determine performance variables
and Key Performance Indicators (KPI) of company based on IPMS variable framework. Weight factors
of performance measurement indicator are calculated by using Analytical Hierarchy Process (AHP).
The result is obtained in form of performance variable weight that can be used to measure
government research institution performance.
Finding – Found that there is problem with current performance management that had been
implemented. The monitoring and evaluation is based on financial variable. This paper also provides
some strategies how to improve government research institution performance through
implementation of Integrated Performance Management System.
Research Limitation – This research is limited to design performance management system topic in
Center for Pulp and Paper as government research institute under Ministry of Industry Republic of
Indonesia Administration.
Originality/Value - This paper fulfills with supported and improvement framework based on IPMS
method how to boost Center for Pulp and Paper performance in research and development
institution.
Pratical Implication - The paper includes implications for an performance improvement in
government research institution especially Center for Pulp and Paper Indonesia.
Keywords : Performance Management System, Government Research Institution, TOWS Matrix,
IPMS Method.
Page 1 of 18 International Journal of Productivity and Performance Management
123456789101112131415161718192021222324252627282930313233343536373839404142434445464748495051525354555657585960
For Peer Review
1. Introduction
Ministry of Industry is a government institution which the main duty is making the public policy or
regulation for industrial community. Ministry of industry has duty to drive Indonesia economic
growth through real sector by improving the value added of natural resources through industrial
activity. Center for Pulp and Paper (CPP) is one of the eleven government research and development
(R&D) institution under the Ministry of Industry administration with its vision is becoming an
innovative and professional research and development (R&D) institution and center for technical
services in the field of pulp and paper commodity. The institution was established on November 14th
,
1968 and since then CPP has a lot of operational experiences in providing research and development
activity, formulation of Indonesia National Standards (SNI), consultancy, training, testing, certification
and calibration services (bbpk.go.id, 2013).
The used of R&D result in industrial sector depend on the quality of R&D result that applied at R&D
institution. Therefore, R&D activity is encouraged to more applied from the laboratory scale to up
scale industrial approach in order to applied with business or industrial needs. This is important to
attract the industry or business in using the research and development result at R&D institution and
properly used in the industry through technoeconomy or feasibility study analysis. In the internal
business process of Ministry of Industry, service activities that related with R&D are facilitating the
used of Intellectual Property Right (IPR), implementation of standarization and industrial promotion
through dissemination of R&D publication (kemenperin accountability report, 2013).
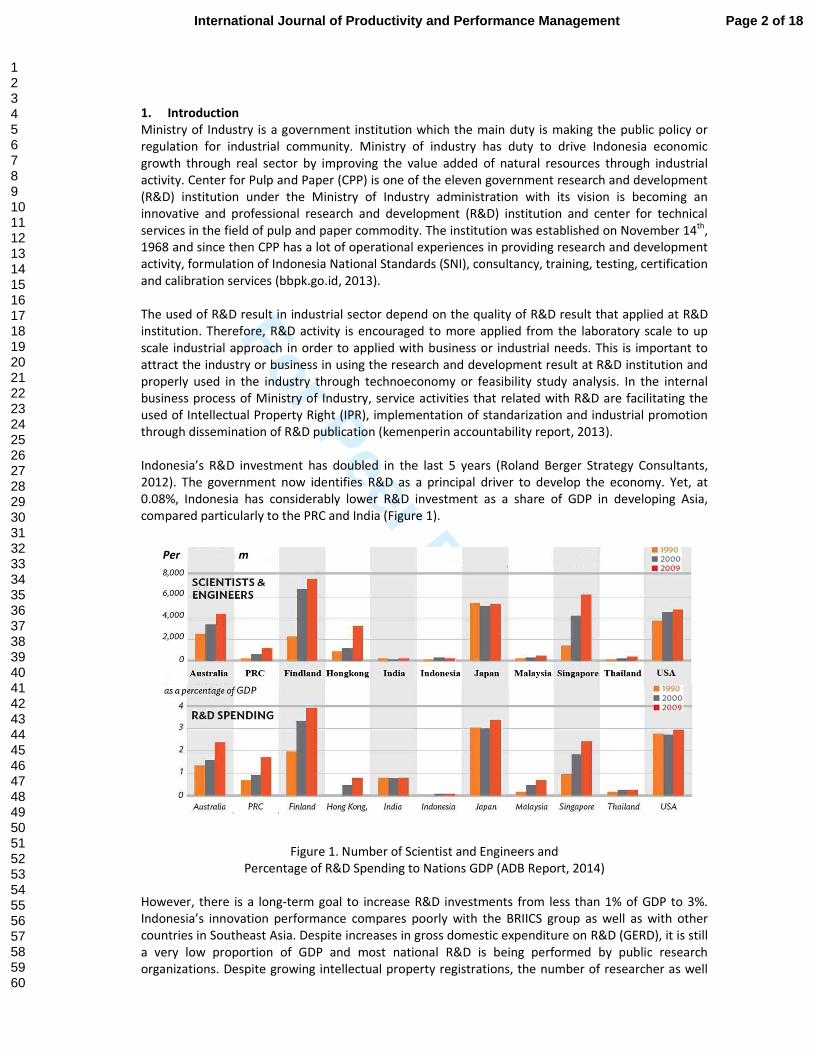
Indonesia’s R&D investment has doubled in the last 5 years (Roland Berger Strategy Consultants,
2012). The government now identifies R&D as a principal driver to develop the economy. Yet, at
0.08%, Indonesia has considerably lower R&D investment as a share of GDP in developing Asia,
compared particularly to the PRC and India (Figure 1).
Figure 1. Number of Scientist and Engineers and
Percentage of R&D Spending to Nations GDP (ADB Report, 2014)
However, there is a long-term goal to increase R&D investments from less than 1% of GDP to 3%.
Indonesia’s innovation performance compares poorly with the BRIICS group as well as with other
countries in Southeast Asia. Despite increases in gross domestic expenditure on R&D (GERD), it is still
a very low proportion of GDP and most national R&D is being performed by public research
organizations. Despite growing intellectual property registrations, the number of researcher as well
Per m
Page 2 of 18International Journal of Productivity and Performance Management
123456789101112131415161718192021222324252627282930313233343536373839404142434445464748495051525354555657585960

For Peer Review
as of scientist and engineers have also been relatively small between others country that become
members of OECD (OECD, 2010). Increase research and development expenditure to at least 1.5% as
a percentage of gross domestic product. Other than the People’s Republic of China (PRC), none of the
emerging economies have an R&D investment of 1.5% of GDP that countries such as the Republic of
Korea, Japan, and Singapore undertook at middle-income levels. The study suggests that an
allocation of at least 1.5% of GDP to R&D is required to undertake innovations that will help to
advance beyond middle-income levels (ADB report, 2014).
The implementation of reform of bureaucracy in cental or district government institution must be
guided by the grand design that written on presidential decree No. 81, 2010 and also road map for
reform that written on Ministrial of Reformation of Bureaucracy decree No. 20, 2010. The purpose of
national bureaucracy reform is to create good corporate government (GCG) with high integrity and
productive civil servant and also excellence service in order to improve public trust (Presidential
Decree No 81/2010). Reform of bureaucracy has significant impact to the employee, both civil
servant who comply the standard competence and performance and also who doesn’t have it.
Therefore, the institution must take a right steps for increasing the capacity and competence of
employee, in order to enhance the performance that in accordance with the aim of reform of
bureaucracy program.
From the explaination above, problem that identified is mainly because lack of innovation in
Indonesia R&D public institution. Based on study from World Intellectual Property Organization
(WIPO), the number of Intellectual Property Right of Indonesia that applied in industry is increasing
from 284 patent in 2007 to 601 patent in 2013, but the patent produced comes from R&D activity in
Indonesia is very few compare to Singapore (1.081 patent in 2013), China (535.312 patent) and India
(9.553 patent) (WIPO, 2013). According to Asian Develpment Bank (ADB) study, number of human
resources in R&D activity around 200 researcher per million population and Indonesia has lower R&D
investment at 0,08% Gross Dometic Expenditure on R&D (ADB, 2014). The other issues are based on
internal organization performance such as 8 main area of reform of bureaucracy issues in Indonesia.
This study focuses on designing performance management system by using IPMS method at Center
for Pulp and Paper. The step for design performance management framework begin with stage 0 for
foundation step, stage 1 for basic information step, stage 2 for designing framework step and stage 3
for implementation plan of IPMS framework. This final project is limited to design performance
management system framework at Center for Pulp and Paper as government research institution
below Ministry of Industry Republic of Indonesia administration.
This paper begins with a brief literature review of IPMS method explaination followed by an
explanation of the theoretical framework employed. In theoritical perspectives, Author also explain
about Analytical Hierarchy Process (AHP) method that used to measure the weight of designing the
Key Performance Indicators (KPI). Section 3 discusses the research method used, and the section 4
discuss about designing the performance management system framework by using IPMS method at
Center for Pulp and Paper. A conclusion and suggestions for future research ends this paper.
2. Theoritical Perspectives
2.1 Integrated Performance Management System (IPMS)
A good performance management system should have a close connection with accountability, in
which contained performance indicator as a target and measurement reference. The good
performance measurement system should outline seven cirteria (Wibisono, 2013) such as :
1. Directly related to coporate strategy
2. Variables should be measured by non – financial measurement
3. Flexible and varies depending on the location of company
4. Dynamic, constantly updated in line with changing times
5. Simple as possible and easy to operate
6. Quick feedback for the operator and manager in charge
Page 3 of 18 International Journal of Productivity and Performance Management
123456789101112131415161718192021222324252627282930313233343536373839404142434445464748495051525354555657585960

For Peer Review
7. Directed to the improvement not only monitoring
Government institution can improve their performance over time not by simple trial and error, but
by systematically analyzing what works and what doesn’t and translating the information into
decision about where to put their resources, how to manage, and how to improve program design
(Redburn et al, 2008). This statement is similar with the function of performance management as an
improvement process (directly to improvement) as mention in the one of seven criteria of good
performance management system above.
Performance management is all about execution by the translation of plans into results. The
improvement of performance management is also synchronizing to create value for and from
customers with the result of economic value creation to stockholders and owners (Cokins, 2009).
Beside the plan, company also must execute the plan into the action plan. This action plan can be
divided into activities that related to company core business. As the performance management is a
set of system, the system is evaluated and monitored to make continous improvement in the system.
Figure 2 Design framework of Performance Management System (Wibisono, 2006)
The first step of any performance measurement system improvement lies in its framework. The
framework is a reliable translation of the vision, mission and strategy statement of organization. This
framework will be included in the performance indicators that will be a benchmark in the
achievement of business objectives and vision of the organization, as well as the improvement of
organization. According to Wibisono, there are four basic steps in designing performance
management systems (Wibisono, 2006) :
1) 0 Stage : Foundation
2) 1st Stage : Basic Information
3) 2nd Stage : Design
Page 4 of 18International Journal of Productivity and Performance Management
123456789101112131415161718192021222324252627282930313233343536373839404142434445464748495051525354555657585960

For Peer Review
4) 3rd Stage : Practice
5) 4th Stage : Refresher
In the 1st phase, examining the information surrounding organization by using business
environmental analysis framework such as internal and external condition analysis of company. In
the 2nd phase, examining the analysis of current company vision and mission, and also formulation
the company startegy. Thus, the 1st phase and 2nd phase have a central role in design performance
management system. Therefore the framework that will be used in performance management
system evaluation at Center for Pulp and Paper Ministry of Industry.
2.2 The Role of Indonesia Goverment Research Institution
The number of government research institution in Indonesia is a lot of in numbers and the role of
each institution have similarity in their main duty and function. This issues have been major problem
in Indonesia. Because of overlapping in the function and main duty, there is also problem with
coordination between each government research institution. Based on research from Mulyanto in
2014, he categorized the Indonesian research and development institution into 4 different
institutions and build the linear model of innovation between those research and development
institutions. This linear model can be seen on Figure 3.
University
Government
Research
Institution
(non ministry)
Ministry
research and
development
institutuion
Industry
Basic researchApplied
research
Technology
development
LIPI BPPT
CPP MoI
Figure 3 The linear model of innovation, role of each R&D institution (Mulyanto, 2014)
The process of transfer, exploitation and commercialization of public research result are critical areas
of science, technology and innovation policy. The linear model of innovation explain about the role of
each Indonesia R&D institution from university that have role in doing basic research to industry as
the used of technology development (Mulyanto, 2014). Center for Pulp and Paper as ministry R&D
institution that below ministry of industry administration has role to develop technology or transfer
technology to industry as the final used of R&D result. In fact, the weak performance issues has
arisen in ministry R&D institution due to a weak linkage between R&D institutions on the supply side
with industries on the demand side occurs. The operational system for public research institutions
does not provide much opportunity to build linkages with the private sectors. This weak linkages
between public research institute and private company (industry) is because of incentives system
that supports these linkages is weak and also there aren’t national industrial policies related to
government procurement that supports domestic industry.
Figure 4 Core of innovation system (Lakitan, 2013)
Page 5 of 18 International Journal of Productivity and Performance Management
123456789101112131415161718192021222324252627282930313233343536373839404142434445464748495051525354555657585960

For Peer Review
Based on the study from Lakitan, the role of government in core of innovation system (Figure 4) is as
a regulator. The main duty of regulator is proactively facilitate communication and interaction
between technology developers and users. Technology developers included university, public R&D
institution and any other institution or individuals that develop technology. In addition, technology
users include industry (producing goods or services), government (especially for providing better
public services, also for national security and defense), and any other institutions or individuals who
require technology for executing or improving quality and/or efficiency of their activities (Lakitan,
2013). Regulation should be formulated with main aim to establish favorable ecosystem for
innovation system to blossom. Tax incentives are common tool used by many governments for
directing prioritized technologies to be developed, improving absorptive capacity of the users, and
facilitating interaction between developers and users.
2.3 Analytical Hierarchy Process
Process AHP was first introduced by Thomas L. Saaty in 1970 and Niemira in 2006. AHP was
designed to rationally perception toward a problem through a procedure which designed to gather
prefential scales of several alternaltives. This model of AHP is used to determined the priorities. AHP
principal is to give score for each factor, variable, and indicator by using comparison of factors,
variables and indicators one to another. Generally, the application of AHP model is executed in two
step. They are hierarchy arrangement and hierarchy evaluation (Saaty et al, 2006). In this final
project, Expert Choice version 11.5 is used to determine the weight factor of performance of Center
for Pulp and Paper as the main objectives. And then, the hierarchy of variable that affected the
performance of CPP was made. Those hierarchy are consist of perspectives, strategic objectives and
strategic measurement. The priority of each variable in first, second and third hierarchy are
determined by making a pairwise comparison. To fill in the pairwise comparison, it uses numbers
that are considered to be relatively more important than the other elements. The scale is illustrated
in scale one to nine to determine the hierarchy one to another. Studies prove that scale at level 9 is
considered to be accepted and it indicates the level which can differentiate the intensity of relations
among the elements. A pairwise comparasion scale which is used in AHP to detemined the
alternative priority to achieve the goal as illustrated in Table 1.
Table 1. Numerical value of weighting scale for AHP method (Saaty, 1987)
Numerical
value
Importance
relativity
Definition
1 Equal Both factors are important
3 Moderate One factor is quite more important than others
5 Strong One factor is essential or more important than others
7 Very strong One factor is clearly more important than others
9 Extreme One factor is definitely more important than the others
2,4,6,8 Median value The value to compare among these numbers
While all considerations are expressed in number, its validity is evaluated with one correlation
assessment. In decision making process, there is a need a consistency to prioritiza related elements
or activities by using certain criteria. This executed for the sake of valid result in empirical
description. AHP measures the whole consistency from various considerations through consistency
ratio. The value of consistency ratio must be 10 percent or less (CR < 0.1). If it is more than 10
percent, the consideration could be done randomly and is required to fix (Sucihatiningsih, 2014).
Hierarchy model of AHP calculation are divided into 3 different perspectives, 11 strategy objectives
and 24 of strategic measurement.. Then, the weight factor for each perspectives, strategic
objectives and variable mesurement can be obtained through AHP calculation.
3. Research Methodology
The research methodology for final project is about designing performance management system at
Center for Pulp and Paper, Ministry of Industry. After exploring business issues based on the
Page 6 of 18International Journal of Productivity and Performance Management
123456789101112131415161718192021222324252627282930313233343536373839404142434445464748495051525354555657585960

For Peer Review
exploration framework from all the history data result and strategic analysis in the internal
organization. The root problem faced by Center for Pulp and Paper can be concluded mainly because
the lack of appropriate performance management system. The used of Balanced Scorecard as
company performance management system is not suitable with the competitive advantage of CPP as
government research institution.
The methodology used in conducting this research is using stage 0 (Foundation) until stage 3
(Implementation) of IPMS framework. After identified the problem of institution, the research
continue with designing the performance management system framework by using IPMS method.
First, the method of this research is identified the external and internal of company based on
business environmental analysis framework (Wheelen and Hunger, 2010). This analysis consist of
internal (Strength – Weakness) analysis and external (Opportunity – Threat) analysis. This analysis is
conducted to formulate the new strategy formulation of Center for Pulp and Paper. The tools that
used in this analysis are begin with SWOT analysis, positioned the company at Directional Matrix
Strategy and Internal – External strategy matrix (defined company strategy in the future) by using the
scoring result comes from EFAS and IFAS analysis. And then, by using TOWS matrix analysis, new
startegy formulation of CPP can be obtained. From this analysis, author can formulate the new
eleven startegic objectives for designing the framework formulation of IPMS method.
The choice of IPMS as performance measurement system is because of this framework can monitor
and evaluate government research institution not only based on financial measurement, but also non
– financial measurement. Stage 0 (Foundation) is the gap analysis of performance measurement
system between current PMS of institution and new PMS that needs based on 4 principles and 5
rules of IPMS framework. Stage 1 (Basic informaltion) is company external and internal analysis. This
stage has already done from the identification of new strategy formulation of company based on
business environmental analysis framework. After that, designing the PMS framework (Stage 2) is
done through company vision analysis, mission analysis (and also proposed the new vision and
mission), building the company performance variables based on IPMS framework perspectives,
calculated the weight scoring of performance indicators that designed by using AHP method, link
those performace variable into design variable linkages and bechmark the performance variables to
other goverment research institution, in this case Forest Research Institute Malaysia (FRIM) from
Malaysia. The next step is Stage 3 which is implementation plan of this research project at institution.
This stage explained through draw the schedule of project timeline and resource allocation that
needs in this project.
The process of data collection is done through Forum Group Discussion (FGD) with management
team and staff at company as primary data. Another resource is taken from questionnaire that sent
out to employee of CPP. The process of weight factor for performance indicators is calculated by
using Analytical Hierarchy Process (AHP) method. This method is carried out from Expert Choice
V.11.5 software as tool for calculation the weight factor of performance indicators. Author devided
the layer of calculation into 3 different layer that influenced the performance of CPP. Those layer are
perspectives, strategic objectives and performance indicators. Then, those performance indicators
are calculated by using the questionnaire as the source of primary data for weight calculation. The
process of data collecting is using 25 sample of person to answer the pairwise question of each
hierarchy on the questionnaire.
4. Result and Discussion
Following the IPMS framework that descibed in Figure 2, the IPMS method begin with stage 0 until 4
(in this paper only until stage 3). The explaination of analysis are described as follow :
a) Stages 0 : Foundation
The basic stage of designing a performance management system is the foundation. In building the
foundation, IPMS refer to the four basic principle and the five rules, as explained in the framework of
exploration in figure 2, problem analysis from previous exploration will be conducted with further
Page 7 of 18 International Journal of Productivity and Performance Management
123456789101112131415161718192021222324252627282930313233343536373839404142434445464748495051525354555657585960
For Peer Review
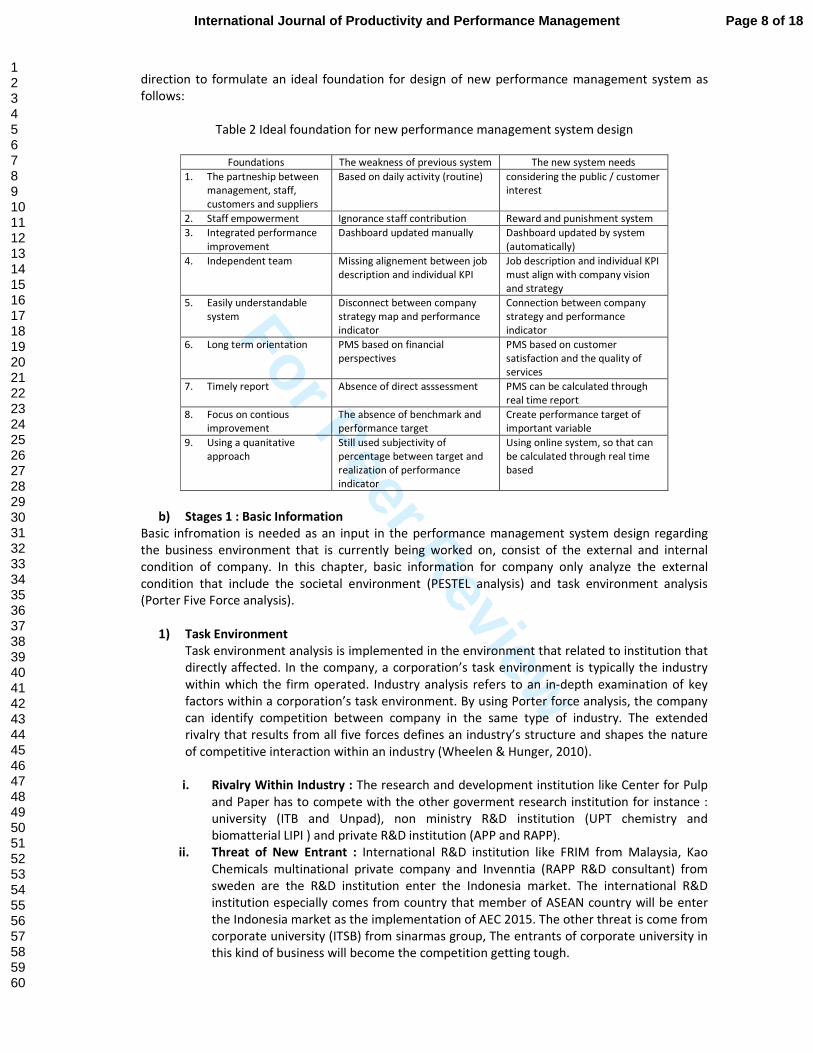
direction to formulate an ideal foundation for design of new performance management system as
follows:
Table 2 Ideal foundation for new performance management system design
Foundations The weakness of previous system The new system needs
1. The partneship between
management, staff,
customers and suppliers
Based on daily activity (routine) considering the public / customer
interest
2. Staff empowerment Ignorance staff contribution Reward and punishment system
3. Integrated performance
improvement
Dashboard updated manually Dashboard updated by system
(automatically)
4. Independent team Missing alignement between job
description and individual KPI
Job description and individual KPI
must align with company vision
and strategy
5. Easily understandable
system
Disconnect between company
strategy map and performance
indicator
Connection between company
strategy and performance
indicator
6. Long term orientation PMS based on financial
perspectives
PMS based on customer
satisfaction and the quality of
services
7. Timely report Absence of direct asssessment PMS can be calculated through
real time report
8. Focus on contious
improvement
The absence of benchmark and
performance target
Create performance target of
important variable
9. Using a quanitative
approach
Still used subjectivity of
percentage between target and
realization of performance
indicator
Using online system, so that can
be calculated through real time
based
b) Stages 1 : Basic Information
Basic infromation is needed as an input in the performance management system design regarding
the business environment that is currently being worked on, consist of the external and internal
condition of company. In this chapter, basic information for company only analyze the external
condition that include the societal environment (PESTEL analysis) and task environment analysis
(Porter Five Force analysis).
1) Task Environment
Task environment analysis is implemented in the environment that related to institution that
directly affected. In the company, a corporation’s task environment is typically the industry
within which the firm operated. Industry analysis refers to an in-depth examination of key
factors within a corporation’s task environment. By using Porter force analysis, the company
can identify competition between company in the same type of industry. The extended
rivalry that results from all five forces defines an industry’s structure and shapes the nature
of competitive interaction within an industry (Wheelen & Hunger, 2010).
i. Rivalry Within Industry : The research and development institution like Center for Pulp
and Paper has to compete with the other goverment research institution for instance :
university (ITB and Unpad), non ministry R&D institution (UPT chemistry and
biomatterial LIPI ) and private R&D institution (APP and RAPP).
ii. Threat of New Entrant : International R&D institution like FRIM from Malaysia, Kao
Chemicals multinational private company and Invenntia (RAPP R&D consultant) from
sweden are the R&D institution enter the Indonesia market. The international R&D
institution especially comes from country that member of ASEAN country will be enter
the Indonesia market as the implementation of AEC 2015. The other threat is come from
corporate university (ITSB) from sinarmas group, The entrants of corporate university in
this kind of business will become the competition getting tough.
Page 8 of 18International Journal of Productivity and Performance Management
123456789101112131415161718192021222324252627282930313233343536373839404142434445464748495051525354555657585960

For Peer Review
iii. Threat of Substitute : Research and development institution like CPP doesn’t have the
substitute of product or services. Because the role and function of CPP is only provided
services that related to pulp and paper industry as customer.
iv. Bargaining Power of Buyer : CPP is much more concern in paper market. Paper industry
has many number of company in Indonesia especally from medium to large industry
scale. The issues of environmental friendly technology and higher cost of energy in
Indonesia become the main issues of industry especially pulp and paper industry.
v. Bargaining Power of Supplier and Other Stakeholder : The supplier for this industry is
pulp and paper laboratory equipment, laboratory glassware, chemical substance and ISO
laboratory standard supplier. The power of supplier is relatively low, because those kind
of product is very familiar in the market and there is a lot of varian product that sold.
2) Societal Environment
The purpose of societal environment analysis is to identify the opportunity and threat of the
company that has impact to the customer value that produced. Factors that are scanning in
this analysis such :
1. Political – legal force that allocate power and provide constraining and protecting laws
and regulation
2. Economic force that regulate the exchange of materials, money, energy and information
3. Technological force that generate problem – solving inventions
4. Sociocultural force that regulate the values, mores and customs of society (Wheelen and
Hunger, 2012)
Table 3 External environmental variables analysis
External Environment Opportunities Threats
1) Politics
• The new regulation from
new president / ministry
that has been elected
2) Economy
• Contribution of pulp and
paper comodity to
Indonesia GDP
• Implementation of ASEAN
economic community 2015
• Cashless society
3) Technology
• Energy saving and green
technology
• The implementation of e-
document
4) Social
• Environmental issues
� Organization and public
services as the main area of
changes for reform of
bureaucracy program.
� Indonesia rank is the 9th largest
of pulp production & 6th of
paper production in the world.
� The support from government
to develop nanotechnology and
biotechnology in pulp and
paper industry.
� Government regulation
regarding the greenhouse
effect and energy saving in
industry
� The bottlenecking in the
implementation of
regulation, because of
different polical party
interest in parliament.
� Indonesia isn’t ready for the
implemetation of AEC 2015,
due to low scientific
productivity.
� The used of electronic
documentation is higher
due to easiness and
flexibility.
� The hazardous material
waste from pulp and paper
industry can cause the
harmful to community
c) Stages 2 : Design
i. Vision Analysis
From the company profile of Center for Pulp and Paper, the company formulated a vision as
follow :
“Becoming an innovative and professional research and development institution and center
for technical services in the field of pulp, paper, cellulose derivate and environmental study.”
Page 9 of 18 International Journal of Productivity and Performance Management
123456789101112131415161718192021222324252627282930313233343536373839404142434445464748495051525354555657585960

For Peer Review
Table 4 Vision statement in details
Keyword Interpretation Implication
“Becoming an innovative and
professional R&D institution”
To create the culture of
company and employee
become more innovative and
professional as the main
principle of working activity
especially that related with
R&D activity.
� Defined the company
competitive advantages in
R&D activity.
� Encourage the employee
to be professional in their
position and make the new
idea of innovation
“center for technical services
in the field of pulp, paper,
cellulose derivatives and
environmental study”
To be appreciated by the
customer that the main
services provided by company
are very spesific and also to
become the center of those
kind of services compared to
another institution
� Defined the company
services that provided to
customer and make
differentiation with other
company
� Maintain a good
relationship with the
customer.
� Defined the company goals
and target
ii. Mission Analysis
Based on the CPP company profile, the mission of company are as follow :
1. To conduct an innovative research and development in the field of pulp, paper, cellulose
derivatives and environmental study
2. To provide technical services in the field of pulp and paper industry, cellulose derivatives
product and environmental study
Table 5 Mission statement in details
Keyword Interpretation Implication
1. To conduct an
innovative research and
development in the field
of pulp, paper, cellulose
derivatives and
environmental study
Creating innovations to increase
the customer confidence and
the existance of government
institution in industry especially
pulp and paper industry
� Doing the research project
activity based on the
customer problem
(industry needs)
� Establishing employee
training program to
become more creative and
innovative through new
ideas
2. To provide technical
services in the field of
pulp and paper industry,
cellulose derivatives
product and
environmental study
Giving the best quality of
services to customer based on
technical services that the
company has
� Make clear explanation
about the company
services that provided to
customer.
� Improve the employee
knowledege and company
facilities in those area of
company services provided
to customer
iii. Strategy Formulation
a. EFAS and IFAS Analysis
IFAS and EFAS analysis which based on internal and external factor in previous SWOT
analysis will be rated to get significant factor for strategy formulation. The table of IFAS
and EFAS analysis are shown below on Table 6 and Table 7. The calculation for weight
score is using Analytical Hierarchy Process (AHP) method.
Page 10 of 18International Journal of Productivity and Performance Management
123456789101112131415161718192021222324252627282930313233343536373839404142434445464748495051525354555657585960

For Peer Review
Table 6 IFAS Analysis of Center for Pulp and Paper
NO Internal Factor Weight Rating
(1 – 5)
Weighted
Score
Strength (S)
S1 The only one pulp and paper R&D government institution 0,10 4 0,40
S2 The company has integrated two quality management system
that based on ISO 17025 for good laboratory practice and ISO
9001 to ensure the quality management system since 2009.
0,02 3 0,06
S3 The funding source for doing R&D activity 80% comes from
government state budget (APBN).
0,01 3 0,03
S4 Strong relationship with pulp and paper industry with become
the member of Indonesia pulp and paper association (APKI) and
International pulp and paper association (TAPPI) since 2006
0,02 2 0,04
S5 53% of employee has graduated from university and 23% of them
have position become researcher and engineers.
0,05 3 0,15
Weakness (W)
W1 The promotion of company services isn’t effective 0,17 3 0,51
W2 The gap generation of employee due to vacuum of recruitment
process from 1986 – 2004
0,03 2 0,06
W3 There is only a few of R&D activity with average ratio 12 : 1 yearly
that can be implemented in the industry as the main customer
0,29 4 1,16
W4 70% of laboratory equipment especially in pulp and paper study
are still using the old technology
0,23 4 0,92
W5 The used of government state budget as the main funding source
of institution isn’t utilized optimally
0,08 3 0,24
TOTAL 1 3,57
Table 7 EFAS Analysis of Center for Pulp and Paper
NO External Factor Weight Rating
(1 – 5)
Weighted
Score
Opportunity (O)
O1 There is an insentive from government for R&D institution that
implemented KNAPPP standard such as scholarship, SINas
insentive and business incubator insentive
0,12 3 0,36
O2 The reform of bureaucracy program for 8 main area of change in
government institution based on ministry of reformation of
bureaucracy regulation no.20 year 2010
0,11 4 0,44
O3 Pulp and paper industry as the main priority for national industry
program based on law no.3 year 2014 ministry of industry
regulation
0,05 2 0,10
O4 Based on the new article no.100 year 2012, there is a clear carrer
path and compensation program for employee who hold position
as researcher and engineering
0,17 4 0,68
O5 Indonesia rank as no.9 for pulp production and no.6 for paper
production in the wordwide that made pulp and paper as th the
main commodity product for Indonesia
0,03 2 0,06
Threat (T)
T1 Based on study from mckinsey the growth of using the electronic
payment system (e-payment) is 57% in asia pasific region as well
as the electronic documentation system (e-document) is getting
higher
0,17 4 0,68
T2 The recruitment system isn’t based on the needs of company
qualification
0,03 1 0,03
T3 Different technology between industry and government
institution in case of processing technology
0,11 4 0,44
T4 The implementation of ASEAN Economic Community 2015 0,17 3 0,51
Page 11 of 18 International Journal of Productivity and Performance Management
123456789101112131415161718192021222324252627282930313233343536373839404142434445464748495051525354555657585960
For Peer Review
T5 The financial regulation no.190 year 2012 about the used of
government state budget that limited the movement of CPP to
expand the company activity
0,04 3 0,12
TOTAL 1 3,42
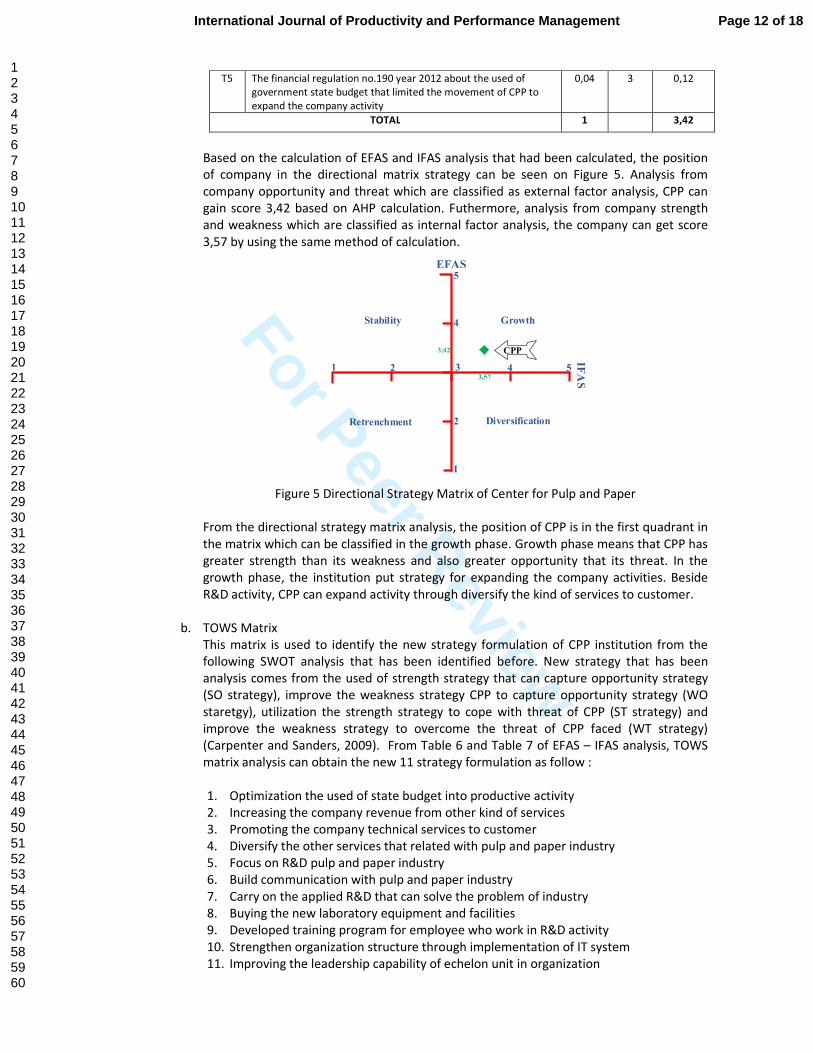
Based on the calculation of EFAS and IFAS analysis that had been calculated, the position
of company in the directional matrix strategy can be seen on Figure 5. Analysis from
company opportunity and threat which are classified as external factor analysis, CPP can
gain score 3,42 based on AHP calculation. Futhermore, analysis from company strength
and weakness which are classified as internal factor analysis, the company can get score
3,57 by using the same method of calculation.
Figure 5 Directional Strategy Matrix of Center for Pulp and Paper
From the directional strategy matrix analysis, the position of CPP is in the first quadrant in
the matrix which can be classified in the growth phase. Growth phase means that CPP has
greater strength than its weakness and also greater opportunity that its threat. In the
growth phase, the institution put strategy for expanding the company activities. Beside
R&D activity, CPP can expand activity through diversify the kind of services to customer.
b. TOWS Matrix
This matrix is used to identify the new strategy formulation of CPP institution from the
following SWOT analysis that has been identified before. New strategy that has been
analysis comes from the used of strength strategy that can capture opportunity strategy
(SO strategy), improve the weakness strategy CPP to capture opportunity strategy (WO
staretgy), utilization the strength strategy to cope with threat of CPP (ST strategy) and
improve the weakness strategy to overcome the threat of CPP faced (WT strategy)
(Carpenter and Sanders, 2009). From Table 6 and Table 7 of EFAS – IFAS analysis, TOWS
matrix analysis can obtain the new 11 strategy formulation as follow :
1. Optimization the used of state budget into productive activity
2. Increasing the company revenue from other kind of services
3. Promoting the company technical services to customer
4. Diversify the other services that related with pulp and paper industry
5. Focus on R&D pulp and paper industry
6. Build communication with pulp and paper industry
7. Carry on the applied R&D that can solve the problem of industry
8. Buying the new laboratory equipment and facilities
9. Developed training program for employee who work in R&D activity
10. Strengthen organization structure through implementation of IT system
11. Improving the leadership capability of echelon unit in organization
1
2
3
4
5
1 2 4 5
EFAS
IFAS
GrowthStability
Retrenchment Diversification
CPP
3,57
3,42
Page 12 of 18International Journal of Productivity and Performance Management
123456789101112131415161718192021222324252627282930313233343536373839404142434445464748495051525354555657585960

For Peer Review
d) Stages 2 :Framework Formulation
Determining the appropriate performance variable to be used, there are three perspectives
which used to be variables basis such as resources capability, internal process and
organization output. The third perspectives are also consist of several aspect that can be
divided into 9 aspects of measurement. Each aspect describes the parameter of variable
measurement in the internal organization. Resource capability is divided into three different
aspect such as human, technology and organization. Internal process of organization explain
about the process of innovation, operation, marketing and after sales service. In addition,
business output is measuring the parameter of financial and non financial aspect (Wibisono,
2013). The exploration framework perspectives can be seen on Table 8 below.
Table 8 Exploration Framework Perspectives
Perspectives Aspects
Business output Financial
Non financial
Internal process Innovation
Operation Process
Marketing
After Sales Services
Resources capability Human
Technology
Organization
i. Resource Capability
To make different value and sustainability resources capability of institution, CPP must
develop three kinds of intangible assets as its resources capability such as :
a. Human Resources
Strategic objective for this aspect is developing training program for employees of
organization. Competence of employee as the performance variable to be measured,
the institution used performance indicators for this aspect such as : the amount of
training certificate, percentage of employee skills, percentage of new R&D personel and
the productivity of researcher.
b. Technology Resources
The strategic objective such as buying the new laboratory equipment and facilities can
replace the old technology of CPP technology resources. The variable performance for
technology resources aspect is technology availability of company. To measure the
availability of technology can be done through performance indicators such as number
of new equipment purchased and percentage utilization of laboratory equipment.
c. Organization Resources
As the company strategic objectives are Strengthing the organization structure through
implementation of IT system and improving the leadership capability of echelon unit in
organization. This can be translated into organization readiness and leadership capability
performance variables. Organization readiness can be measured through improving the
quality of company services and percentage of employee attendance after using IT
implementation as absency method. Furthermore, the leadership capability can be
measured through percentage of employee who participated in leadership program as
variables measurement.
ii. Internal Process
From the previous analysis, it can be concluded that the main business process which affects
the performance of CPP is innovation, operation process and marketing.
Page 13 of 18 International Journal of Productivity and Performance Management
123456789101112131415161718192021222324252627282930313233343536373839404142434445464748495051525354555657585960

For Peer Review
a. Marketing
From the strategic objectives of CPP, marketing process is selected as variable
performance for marketing aspect. Eventhough the main service of institution is R&D
services, the others technical services that have contribution to the company revenue
such as training, material testing, consultancy, calibration, standardization and
certification must be promoted to customer, in order to boost the company revenue.
The performance indicator for this aspect can be monitored through the number of
industry as customers served and customer satisfaction index.
b. Operation Process
CPP must diversify the other kind of services that provide to the main customer for
sustaining its business in pulp and paper industry. By achieveing the service
effectiveness, the performance indicator for this variable are measuring the percentage
of revenue that comes from training service, number of ceritification product, number
of testing sample and number of calibration equipment. CPP also must keep focus on
the pulp and paper industry for R&D services. The measurement of this performance
variable such as number of scientific research published and number of Indonesian
national standard (SNI) produced. Other variable that related with operation process
aspect is relationship with industry. The performance indicator for industry relationship
can be measured through percentage of industry participation in company activity.
c. Innovation
The sucess of innovation can be measured through how many R&D activity can become
industrial patent and prototype of industry. This is very important to bring the solution
of technology to industry as technology users. The performance indicator for innovation
aspect are number of joint research with industry and percentage the quality of
research.
iii. Business Output
From the previous analysis, it can be concluded that the main business process which affects
the performance of CPP is innovation, operation process and marketing.
a. Financial
Financial aspect for government institution mainly related with the company income or
usually called non – taxes national income (PNBP). Other performance indicator that
related with finacial aspect is percentage the realization of government state budget.
This measurement comes from how much the percentage of money from government
can be spent into productive activity that can be delivered to customers, in this case
pulp and paper industry.
b. Non - Financial
As the company competitive advantage is R&D services, the measurement of output
that comes from R&D aactivity can be classified as productive activity such as number of
patent and number of technology produced. This measurement also support the
company strategic objectives which is to optimize the used of government state budget
into productive activity.
From the exploration of framework perspectives, performance indicators that have been determined
can be translated into company strategic map. Strategy map provide such a tool that give employee a
clear line of sight into how their jobs are linked to the overall objectives of organization. The strategy
map describes the process for transforming intangible assets into tangible customer and financial
outcomes. It provides executives with a framework for describing and managing strategy in a
knowledge economy (Kaplan and Norton, 2001). IPMS framework perspectives can be translated into
company strategy map. Mapping of Center for Pulp and Paper strategy is depicted on Figure 6. With
become innovative and professional R&D institution as company strategic vision, twenty-four of Key
Performance Indicator (KPI) that have been decribed on each perspectives are mapped into strategy
map of company. This strategy map is very useful to show the cause and effect links by which specific
improvements create desired outcomes.
Page 14 of 18International Journal of Productivity and Performance Management
123456789101112131415161718192021222324252627282930313233343536373839404142434445464748495051525354555657585960

For Peer Review
Figure 6. Company strategic map based in IPMS framework perspectives
The determination weight of variable mesurement is calculated by using AHP (Analytical Hierarchy
Process) method. . Hierarchy model for AHP calculation is divided into 3 different perspectives, 11
strategy objectives and 24 of Key Performance Indicators. Then, those variable is calculated by using
the questionnaire as the source of primary data for weight calculation. The ranking of weight factor
priority is shown from the value of weight factor as seen on Table 9.
Table 9 Ranking of weight factor priority from AHP calculation
No Key Performance Indicators Weight factor
1 Percentage utilization of laboratory equipment 0,181
2 Percentage of employee skill 0,171
3 Researcher productivity 0.152
4 Number of new laboratory equipment 0,060
5 Percentage the realization of state budget (APBN) 0.049
6 Number of technology (RBPI) 0.049
7 Total amount of company revenue (PNBP) 0.049
8 Percentage of industry participation in company activity 0,047
9 Percentage of new researcher 0,039
10 Percentage of employee participation in leadership program 0,037
11 Number of joint research with industry 0,030
12 Improving the quality of service 0,022
13 Number of patent 0,016
14 Customer satisfaction index 0,015
15 Number of testing sample 0,015
16 Number of training certificate 0,014
17 Number of certification product 0,010
18 Percentage the quality of research 0,010
19 Number of calibration equipment 0,008
20 Number of scientific research (journal) 0,008
21 Number of Indonesia national standard (SNI) 0,008
22 Total company as customer 0,005
23 Percentage of employee attendance 0,003
24 Percentage revenue from training service 0,003
Page 15 of 18 International Journal of Productivity and Performance Management
123456789101112131415161718192021222324252627282930313233343536373839404142434445464748495051525354555657585960

For Peer Review
Mapping those performance indicators into 11 performance variable according to framework
perspectives and then linkage the correlation or relationship between performance variable by
linking each performance variable that has correlation or relationship. The design of linkage
performance variable for Center for Pulp and Paper can be seen on Figure 7.
Figure 7 Design variables linkages
The type of benchmarking for Center for Pulp and Paper are done by using performance
benchmark. This type of benchmarking step to compare the performance of institution to others
government institution with the same type of business. Government institution from Malaysia
that called FRIM (Forestry Research Institute of Malaysia) is selected as the institution for
benchmarking of CPP. FRIM is a government research institution under Ministry of Natural
Resources and Environment. Data of performance variable benchmark for R&D profile between
CPP and FRIM can be seen on Table 10 (FRIM Annual Report, 2013).
Table 10 Table of bechmarking for R&D profile between CPP and FRIM in 2013
Perfromance variable
(yearly)
Center for pulp and
paper Indonesia (CPP)
Forestry research
institute Malaysia
(FRIM)
Research fund (Rp) Rp. 730 million Rp. 100,8 billion
Ratio number of researcher / total employee 1 : 4 3 : 10
Number of research project (project) 11 189
R&D dissemination through exibition (Event) 8 28
Number of scientific journal (Journal) 20 159
• International publisher 10 47
• Local publisher 10 112
Number of joint research with industry
(company)
17 71
Number of patent (patent) 1 6
Number of technology produced (techology) 1 3
Number of invention disclosure (invention) N/A 15
e) Stages 3 : Implementation Plan
Strategic management is an integrated process of continous improvement, strategy
formulation, strategic plan, harmonizing the organization, strategic reformulation. As goverment
institution, CPP must reformulation its strategy in the period of 5 years basis. Display for this
final project is the schedule of implementation plan for new performance management system.
CPP should redefine its position and formulated new strategy formulation for implementation of
new performance management system. The willingness of top management in this cased head
of center as the manager of institution is very important and depend on its policy on the
Page 16 of 18International Journal of Productivity and Performance Management
123456789101112131415161718192021222324252627282930313233343536373839404142434445464748495051525354555657585960

For Peer Review
organization. The schedule and timeline for implementation plan of this project can be seen on
figure 8.
Figure 8 Timeline for implementation plan schedule
5. Conlusions & Recommendation
By designing the new performance management system framework based on IPMS method is very
useful for government research institution especially Center for Pulp and Paper to monitor and
evaluate the performance of institution. Conclusion of this final project is designing the performance
management system based on IPMS method can be done through reformulation the strategic
objectives of institution by using tools such as SWOT analysis, EFAS – IFAS analysis, TOWS matrix and
company position on directional strategy matrix. From three perspectives of IPMS performance
framework, the design of performance framework continue with deriving those three perspectives
into eleven new strategic objectives. After that, list the twenty four of Key Performance Indicator
(KPI) from eleven strategic objectives that effected the performance of Center for Pulp and Paper.
Recommendation for this final project is the performance management framework based on IPMS
method should be implemented at Center for Pulp and Paper. The design framework should be
tested in the real implementation. In addition, if this design framework is implemented at CPP, there
would be benefit and weakness of this system. Then, the process of continous improvement should
be done for completing the design performance management framework into the next step.
Reference
Anonymous. (2013), “Forestry Research Institution Malaysia (FRIM) Annual Report”, Ministry of
Natural Resources and Environment, Malaysia.
Anonymous. (2013), “Ministry of Industry Accountability Report 2013”, Ministry of Industry, Republic
of Indonesia.
Asian Development Bank. (2014), “Innovative Asia : Advancing The Knowledge – Based Economy”.
ADB : Philippines.
Carpenter, A. Mason and W. Gerard Sanders. (2009), “Strategic management : Concept a dynamic
perspective”. Second Edition. Pearson Publisher : America.
Page 17 of 18 International Journal of Productivity and Performance Management
123456789101112131415161718192021222324252627282930313233343536373839404142434445464748495051525354555657585960
For Peer Review
Center for Pulp and Paper Website. (2013), “Center for Pulp and Paper Company Profile”. Quoted on
8th October 2014 from http://www.bbpk.go.id/profile.
Cokins, G. (2009), “Performance Management : Integrating Strategy Execution, Methodologies, Risk
and Analytics”. John Willey and Sons : New Jersey, Canada.
Indonesian Government. (2010), “Grand Design Reformasi Birokrasi Indonesia 2010 - 2025 –
Presidential Instruction Inpres No. 81/2010”, Indonesian Government, Jakarta, Indonesia.
Kaplan, S. Robert and Norton, P. David. (2001), “The strategy focused organization : How balanced
scorecard companies thrieve in the new business environment”. Harvard Business School Press :
Boston, Massachusetts USA.
Lakitan, B. (2013), “Connecting all the dots : Identifying the ‘actor level’ Challenges in establishing
effective innovation system in Indonesia”. Journal of Technology in Society, 35, pp 41 – 54.
Mulyanto. (2014), “Performance of Indonesian R&D Institutions : Influence of type of Institutions and
their funding source on R&D Productivity”. Journal of Technolohy in Society, 36, pp 148 – 160.
Organisation for Economic Co-operation and Development. (2010), “The Emerging Middle Class in
Developing Countries”. Working Paper No. 285. Paris : France.
Redburn, F. Stevens., Robert J. Shea., and Terry F. Buss. (2008), “Performance Management and
Budgeting : How Governments Can Learn From Experience”. Nation Academy of Public
Administration. M. E. Sharpe : New York.
Roland Berger Strategy Consultants. (2012), “Innovation – How the Emerging Markets Are Driving the
Global Innovation Agenda”, Munich : Germany.
Saaty, T.L. (1987), “The Analytic Hierarchy Process – What it is and How it is Used”, Math Modelling,
Pergamon Journals Ltd, Oxford.
Saaty, T.L. and Niemira, M.P. (2006), “A framework for making a better decision how to make more
effective site selection, store closing and other real estate decisions”, Research Review, Vol. 13
No. 1, p. 5.
Sucihatiningsih, D.W.P. (2014), “Strategy for controlling agricultural land conversion of paddy by
using Analytical Hierarchy Process in Central Java”, Management of Environmental Quality : An
International Journal, Vol. 25 Iss. 5, pp. 631 – 647.
Wheelen, Thomas L and J. David Hunger. (2010), “Strategic Management and Business Policy”.
Twelfth Edition. Pearson Education : America.
Wheelen, Thomas L., and Hunger J. D., (2012), Strategic Management and Business Policy : Toward
Global Sustainability, Thirteenth Edition, Pearson Education : America.
Wibisono, D. (2006), “Manajemen Kinerja : Konsep, Desain dan Teknik Meningkatkan Daya Saing
Perusahaan”, Penerbit Erlangga : Jakarta, Indonesia.
Wibisono, D. (2012), “How to Create a World Class Company : Panduan Bagi Manajer dan Direktur”,
Gramedia Pustaka Utama : Jakarta, Indonesia.
World Intellectual Property Organization. (2013), “WIPO IP Facts and Figures : Economic and Statistic
Series”. WIPO Publication No. 943E/13 : Geneva, Switzerland.
Page 18 of 18International Journal of Productivity and Performance Management
123456789101112131415161718192021222324252627282930313233343536373839404142434445464748495051525354555657585960