Embed Size (px)
Citation preview

State-inducement Versus Self-initiation: A Comparative Study of Micro and Small
Enterprises in Ethiopia
Girum AbebeEDRI

Outline of the presentation
• Introduction
• Related literature
• Overview of the MSE development program and
testable hypotheses
• Data and Methodology
• Result discussion
• Summary of Results
• Suggestions for further research
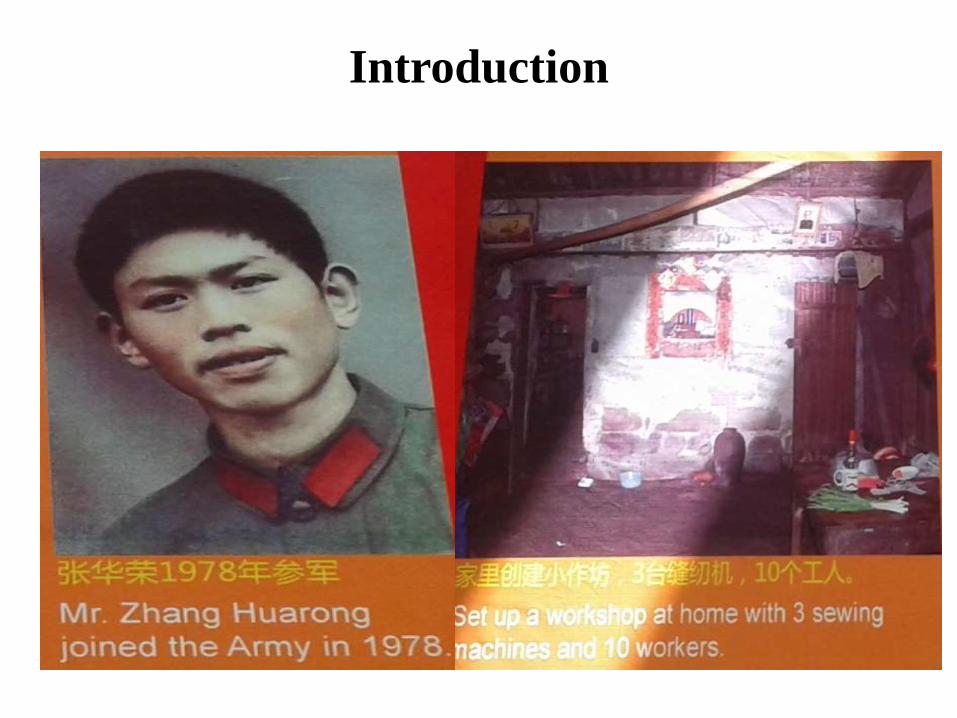
Introduction
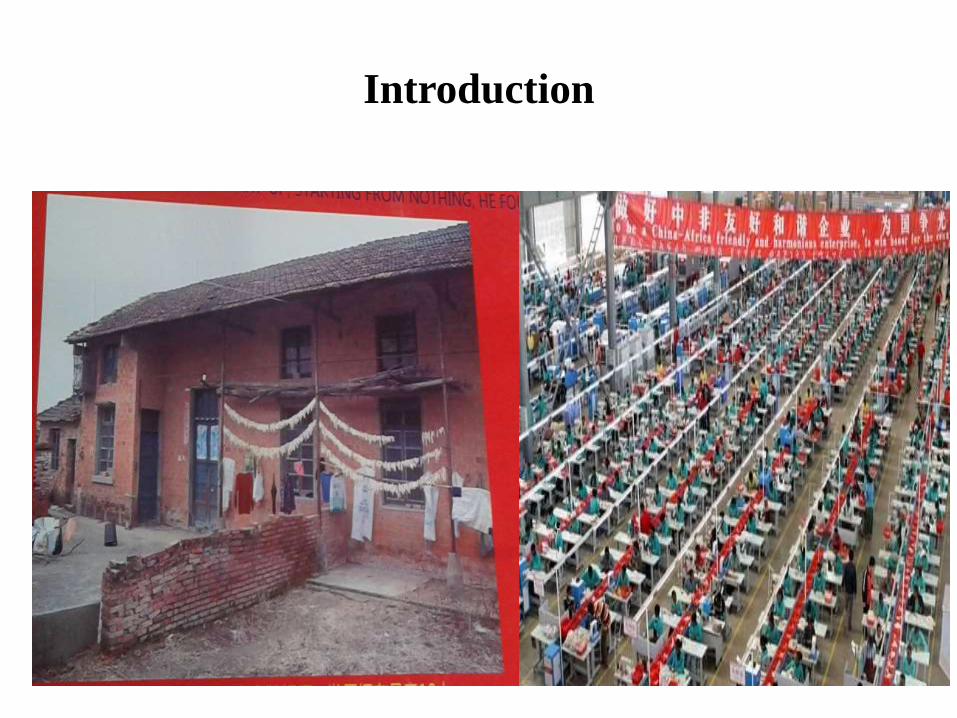
Introduction
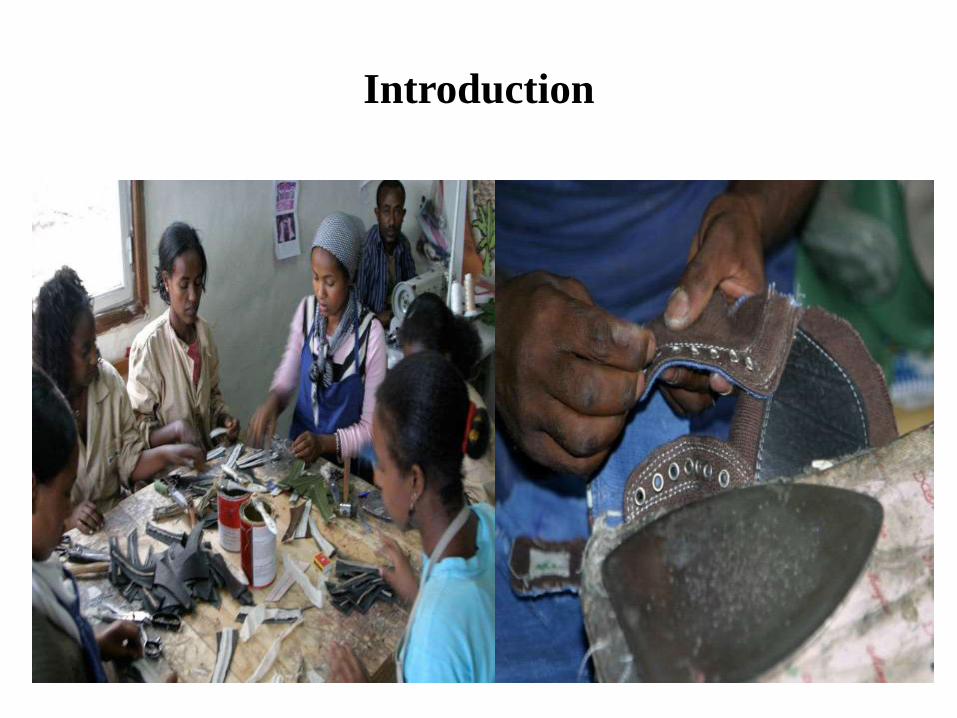
Introduction
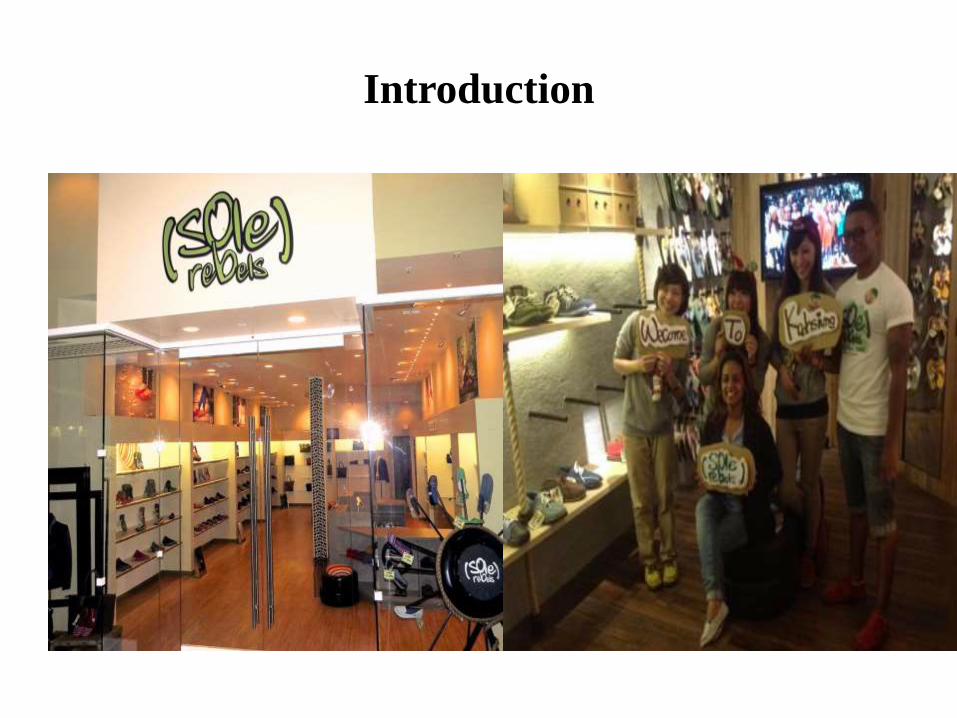
Introduction
Introduction
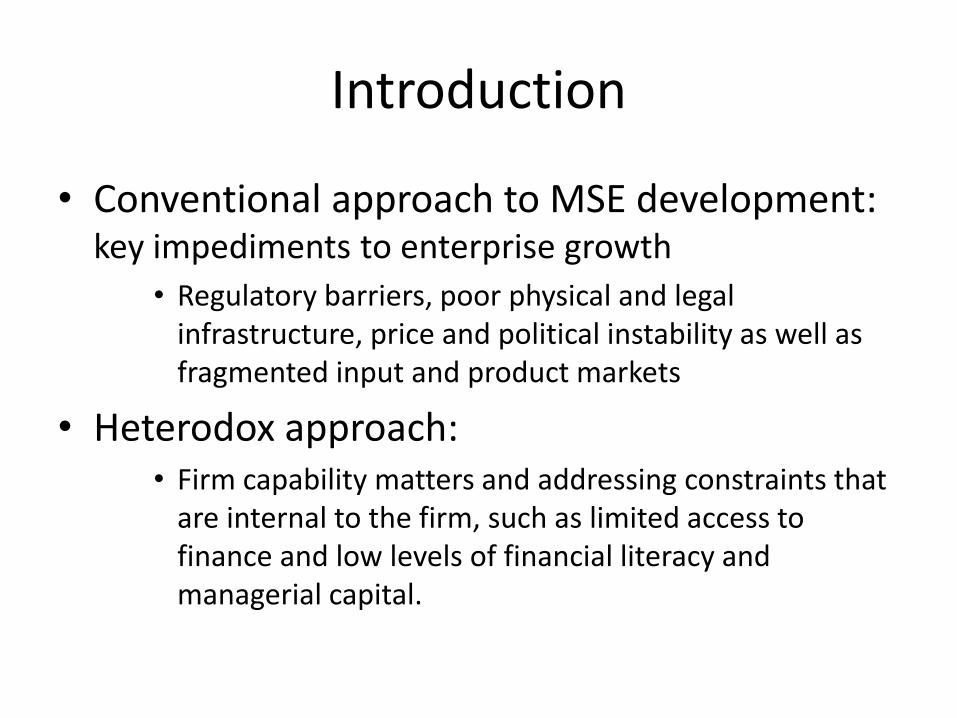
• Conventional approach to MSE development: key impediments to enterprise growth
• Regulatory barriers, poor physical and legal infrastructure, price and political instability as well as fragmented input and product markets
• Heterodox approach: • Firm capability matters and addressing constraints that
are internal to the firm, such as limited access to finance and low levels of financial literacy and managerial capital.
Introduction
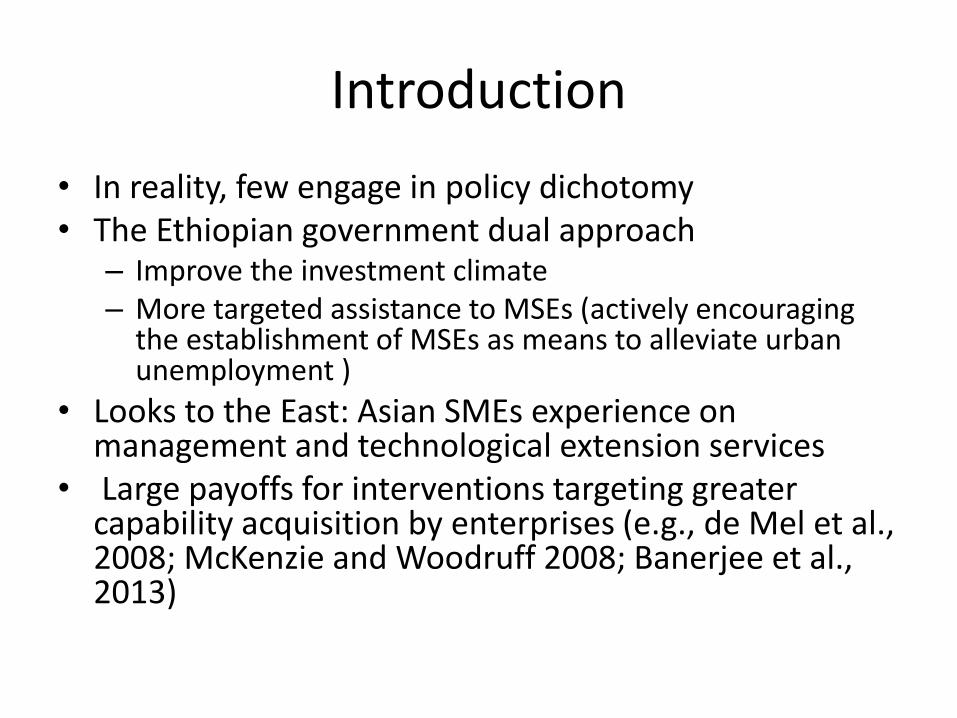
• In reality, few engage in policy dichotomy • The Ethiopian government dual approach
– Improve the investment climate– More targeted assistance to MSEs (actively encouraging
the establishment of MSEs as means to alleviate urban unemployment )
• Looks to the East: Asian SMEs experience on management and technological extension services
• Large payoffs for interventions targeting greater capability acquisition by enterprises (e.g., de Mel et al., 2008; McKenzie and Woodruff 2008; Banerjee et al., 2013)
Introduction
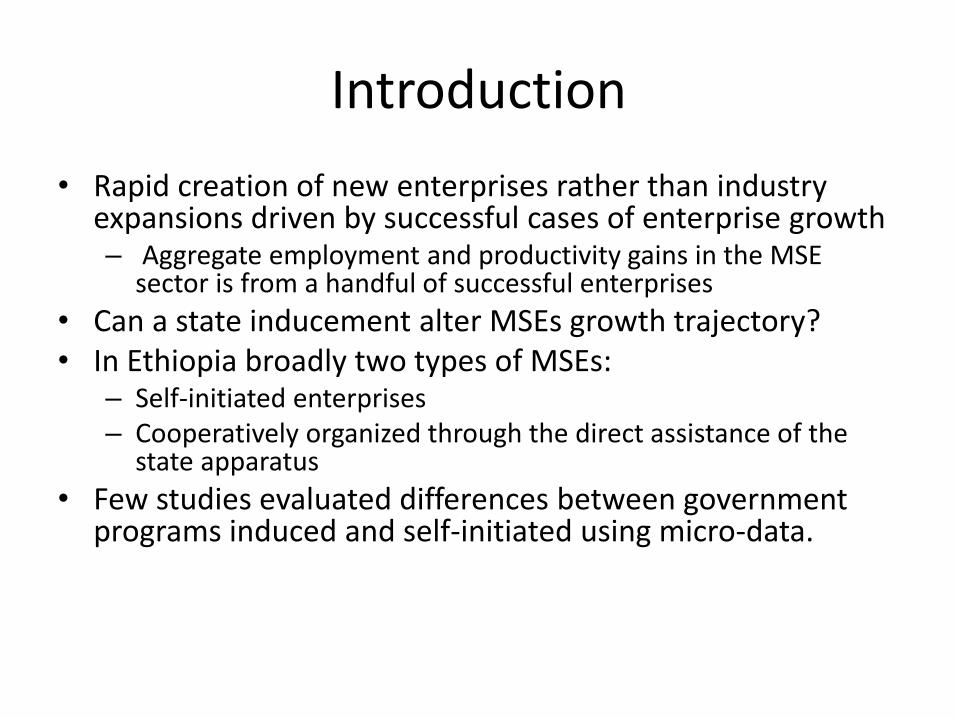
• Rapid creation of new enterprises rather than industry expansions driven by successful cases of enterprise growth– Aggregate employment and productivity gains in the MSE
sector is from a handful of successful enterprises
• Can a state inducement alter MSEs growth trajectory? • In Ethiopia broadly two types of MSEs:
– Self-initiated enterprises – Cooperatively organized through the direct assistance of the
state apparatus
• Few studies evaluated differences between government programs induced and self-initiated using micro-data.

Introduction
• We undertake a study that would explore whether government-induced enterprises:
(a) do in fact have greater access to state support,
(b) adopt different technologies and business practices,
(c) enjoy higher productivity and growth, and
(d) are different in other important attributes that drive wedge in performance with self-initiated enterprises.
Related literature
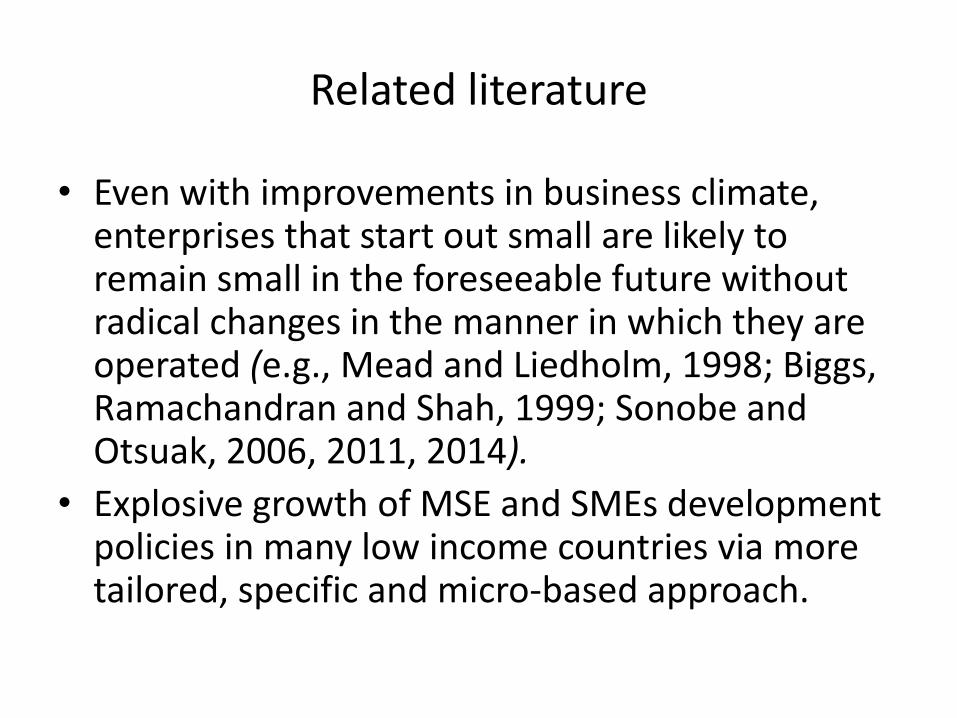
• Even with improvements in business climate, enterprises that start out small are likely to remain small in the foreseeable future without radical changes in the manner in which they are operated (e.g., Mead and Liedholm, 1998; Biggs, Ramachandran and Shah, 1999; Sonobe and Otsuak, 2006, 2011, 2014).
• Explosive growth of MSE and SMEs development policies in many low income countries via more tailored, specific and micro-based approach.
Related literature
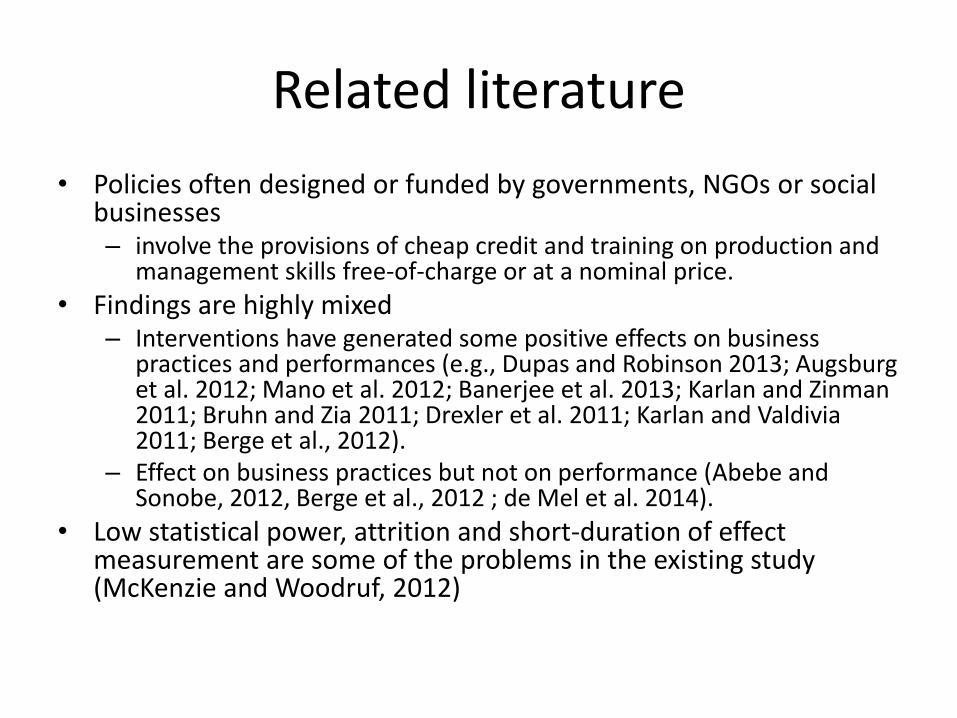
• Policies often designed or funded by governments, NGOs or social businesses – involve the provisions of cheap credit and training on production and
management skills free-of-charge or at a nominal price.
• Findings are highly mixed – Interventions have generated some positive effects on business
practices and performances (e.g., Dupas and Robinson 2013; Augsburg et al. 2012; Mano et al. 2012; Banerjee et al. 2013; Karlan and Zinman2011; Bruhn and Zia 2011; Drexler et al. 2011; Karlan and Valdivia 2011; Berge et al., 2012).
– Effect on business practices but not on performance (Abebe and Sonobe, 2012, Berge et al., 2012 ; de Mel et al. 2014).
• Low statistical power, attrition and short-duration of effect measurement are some of the problems in the existing study (McKenzie and Woodruf, 2012)

Related literature
• Rijkers, Laderchi and Teal (2008) employ the Addis Ababa Construction Enterprise Survey to explore the effect of the AAIHDP (housing program) on firm technology choice and workers’ welfare.
• Main findings are – Labor intensity and technology do not differ between
enterprises that are in the housing program and those that are not
– Workers in the program are more educated and enjoy greater earning premium
– Earning premium is highly heterogeneous and is the largest for those at the bottom of the earning distribution.
Overview of the MSE development program and
testable hypotheses
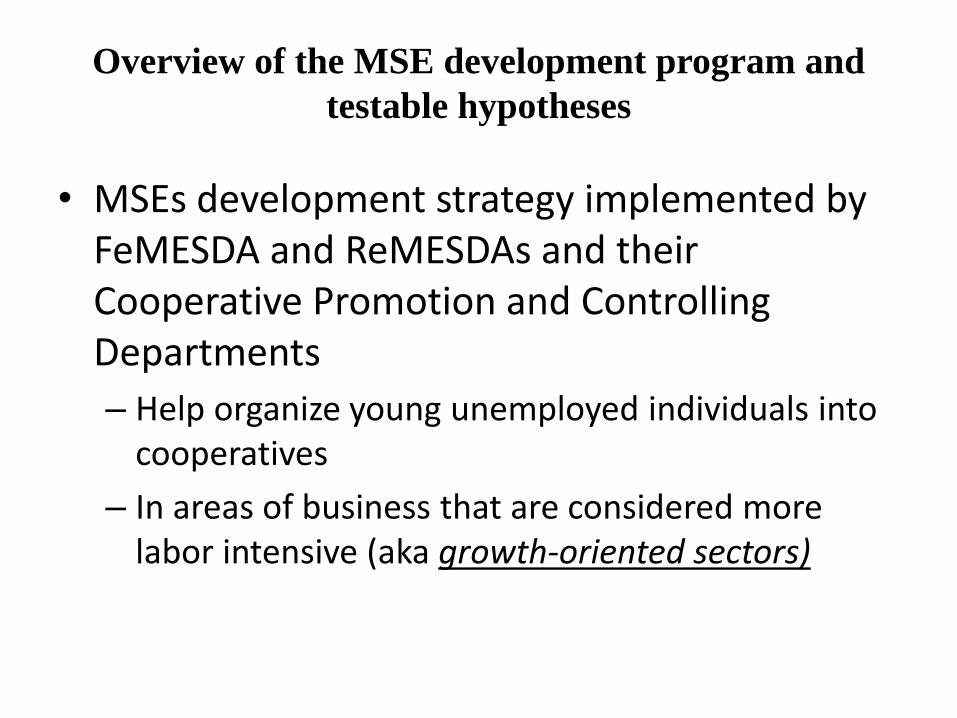
• MSEs development strategy implemented by FeMESDA and ReMESDAs and their Cooperative Promotion and Controlling Departments
– Help organize young unemployed individuals into cooperatives
– In areas of business that are considered more labor intensive (aka growth-oriented sectors)
Overview of the MSE development program and
testable hypotheses
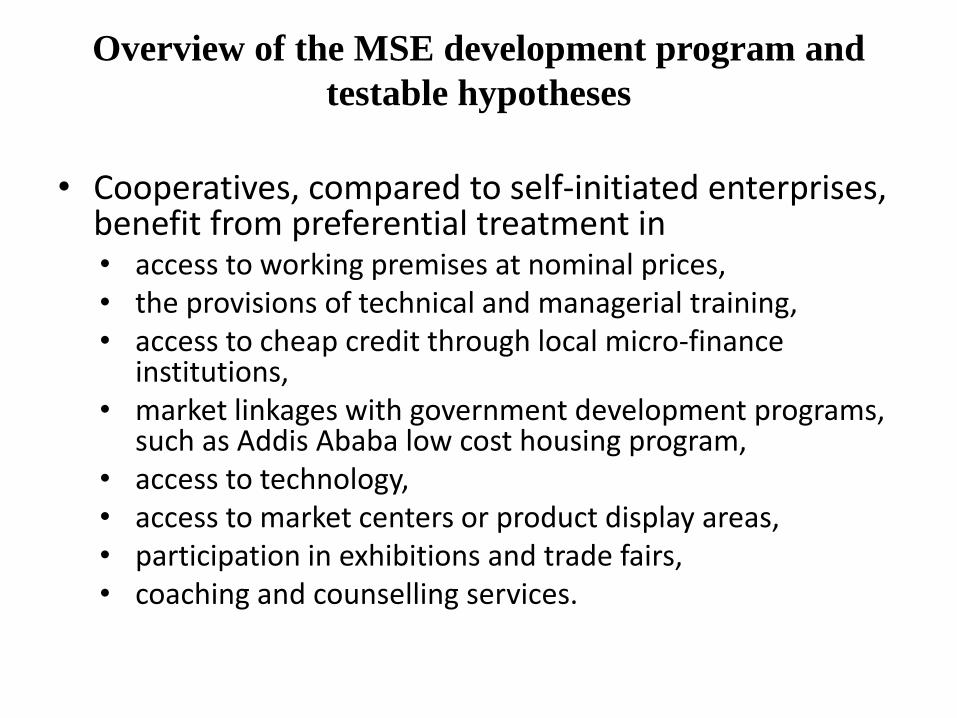
• Cooperatives, compared to self-initiated enterprises, benefit from preferential treatment in • access to working premises at nominal prices,• the provisions of technical and managerial training,• access to cheap credit through local micro-finance
institutions, • market linkages with government development programs,
such as Addis Ababa low cost housing program, • access to technology, • access to market centers or product display areas, • participation in exhibitions and trade fairs, • coaching and counselling services.
Overview of the MSE development program
and testable hypotheses
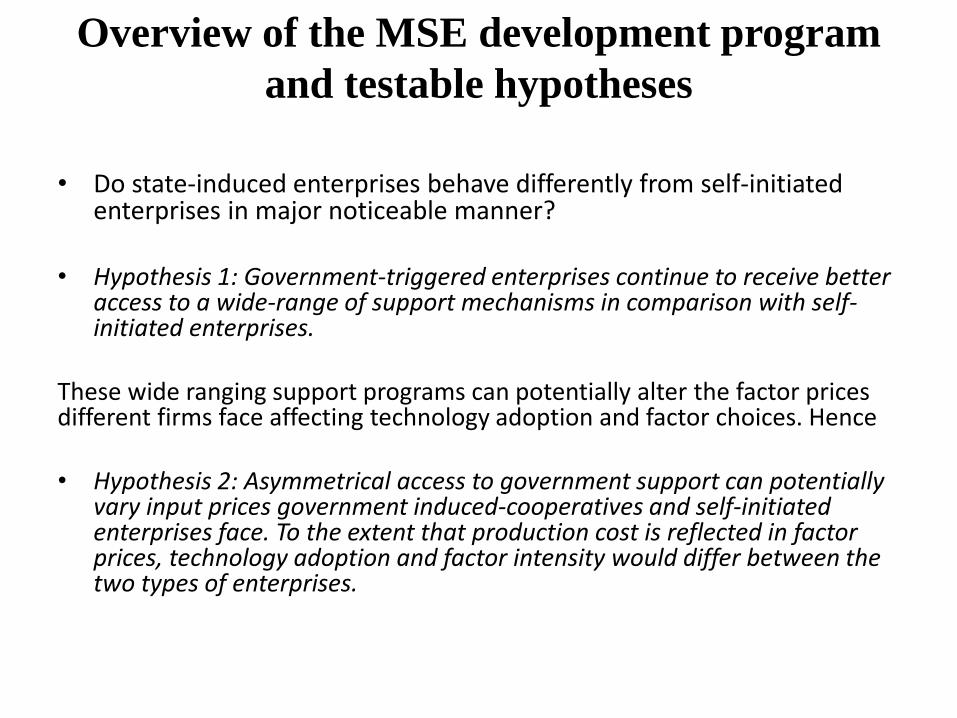
• Do state-induced enterprises behave differently from self-initiated enterprises in major noticeable manner?
• Hypothesis 1: Government-triggered enterprises continue to receive better access to a wide-range of support mechanisms in comparison with self-initiated enterprises.
These wide ranging support programs can potentially alter the factor prices different firms face affecting technology adoption and factor choices. Hence
• Hypothesis 2: Asymmetrical access to government support can potentially vary input prices government induced-cooperatives and self-initiated enterprises face. To the extent that production cost is reflected in factor prices, technology adoption and factor intensity would differ between the two types of enterprises.
Overview of the MSE development program
and testable hypotheses
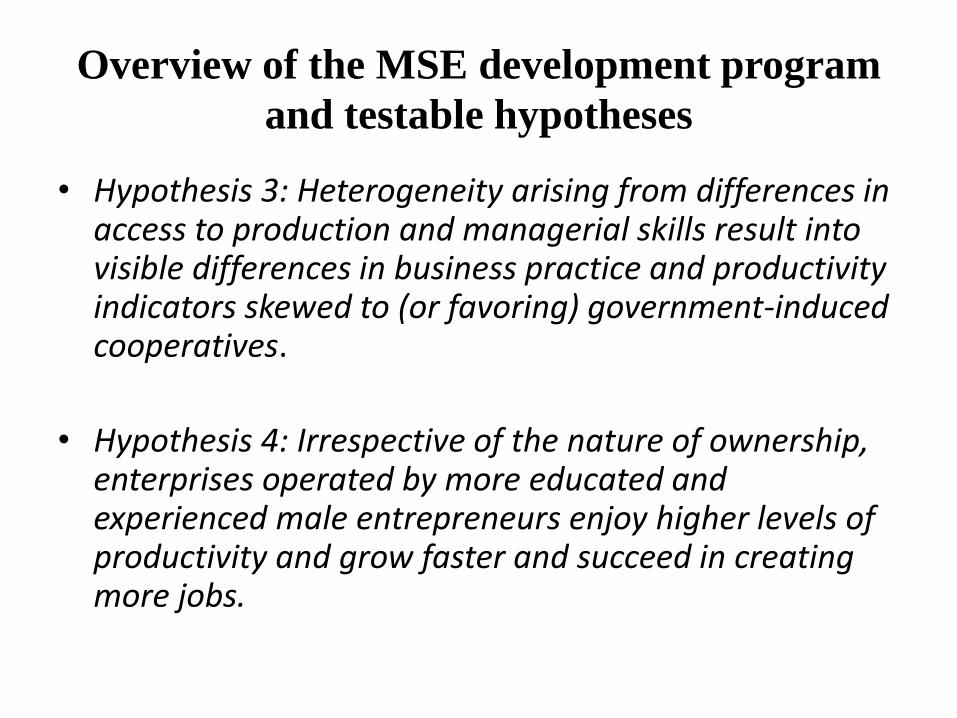
• Hypothesis 3: Heterogeneity arising from differences in access to production and managerial skills result into visible differences in business practice and productivity indicators skewed to (or favoring) government-induced cooperatives.
• Hypothesis 4: Irrespective of the nature of ownership, enterprises operated by more educated and experienced male entrepreneurs enjoy higher levels of productivity and grow faster and succeed in creating more jobs.
Data and methodology
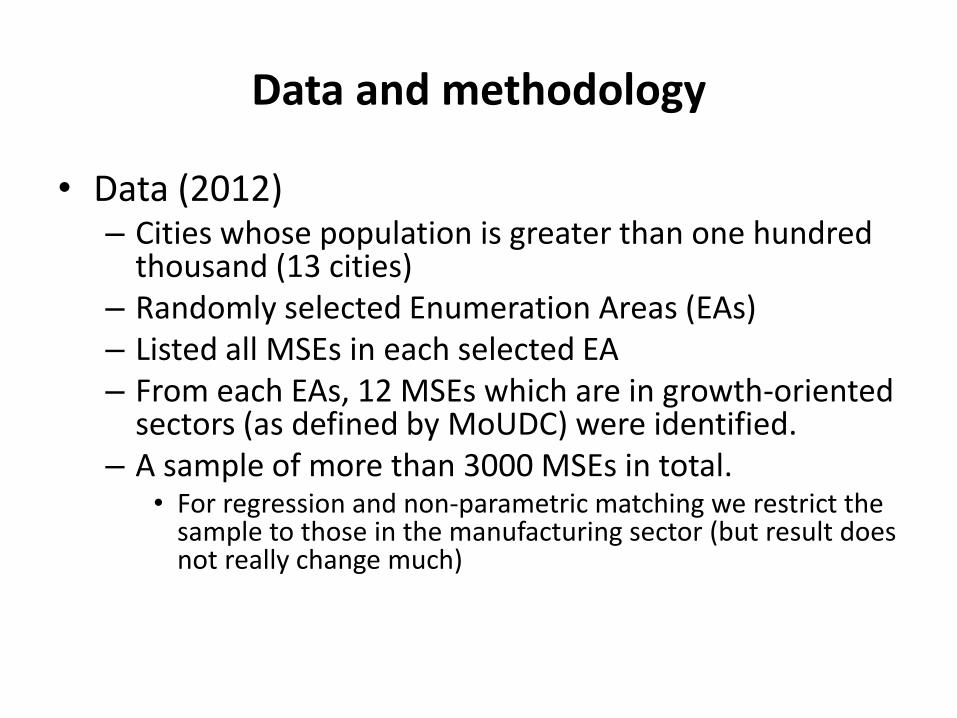
• Data (2012)– Cities whose population is greater than one hundred
thousand (13 cities)– Randomly selected Enumeration Areas (EAs) – Listed all MSEs in each selected EA– From each EAs, 12 MSEs which are in growth-oriented
sectors (as defined by MoUDC) were identified. – A sample of more than 3000 MSEs in total.
• For regression and non-parametric matching we restrict the sample to those in the manufacturing sector (but result does not really change much)
Data and methodology
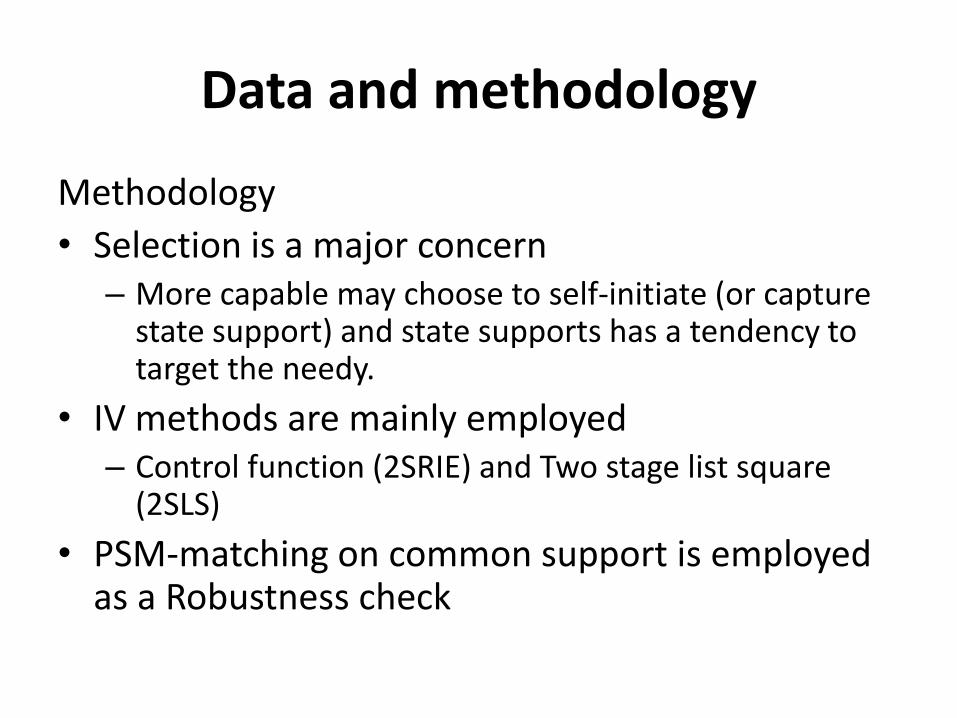
Methodology
• Selection is a major concern – More capable may choose to self-initiate (or capture
state support) and state supports has a tendency to target the needy.
• IV methods are mainly employed – Control function (2SRIE) and Two stage list square
(2SLS)
• PSM-matching on common support is employed as a Robustness check
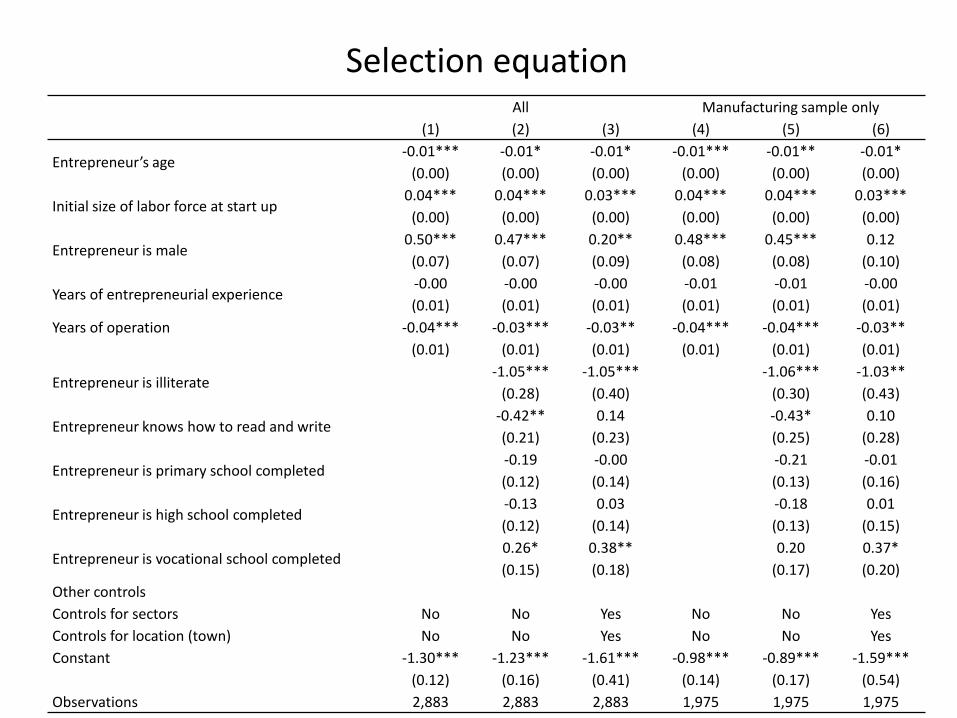
Selection equationAll Manufacturing sample only
(1) (2) (3) (4) (5) (6)
Entrepreneur’s age-0.01*** -0.01* -0.01* -0.01*** -0.01** -0.01*
(0.00) (0.00) (0.00) (0.00) (0.00) (0.00)
Initial size of labor force at start up0.04*** 0.04*** 0.03*** 0.04*** 0.04*** 0.03***
(0.00) (0.00) (0.00) (0.00) (0.00) (0.00)
Entrepreneur is male0.50*** 0.47*** 0.20** 0.48*** 0.45*** 0.12
(0.07) (0.07) (0.09) (0.08) (0.08) (0.10)
Years of entrepreneurial experience-0.00 -0.00 -0.00 -0.01 -0.01 -0.00
(0.01) (0.01) (0.01) (0.01) (0.01) (0.01)
Years of operation -0.04*** -0.03*** -0.03** -0.04*** -0.04*** -0.03**
(0.01) (0.01) (0.01) (0.01) (0.01) (0.01)
Entrepreneur is illiterate -1.05*** -1.05*** -1.06*** -1.03**
(0.28) (0.40) (0.30) (0.43)
Entrepreneur knows how to read and write-0.42** 0.14 -0.43* 0.10
(0.21) (0.23) (0.25) (0.28)
Entrepreneur is primary school completed-0.19 -0.00 -0.21 -0.01
(0.12) (0.14) (0.13) (0.16)
Entrepreneur is high school completed -0.13 0.03 -0.18 0.01
(0.12) (0.14) (0.13) (0.15)
Entrepreneur is vocational school completed 0.26* 0.38** 0.20 0.37*
(0.15) (0.18) (0.17) (0.20)
Other controls
Controls for sectors No No Yes No No Yes
Controls for location (town) No No Yes No No Yes
Constant -1.30*** -1.23*** -1.61*** -0.98*** -0.89*** -1.59***
(0.12) (0.16) (0.41) (0.14) (0.17) (0.54)
Observations 2,883 2,883 2,883 1,975 1,975 1,975

Data and methodology
• Main instrument is age and number of persons (employment) at start up– MSE support scheme primarily aims at tackling urban youth unemployment
with group formation requirements– Age and making groups of 5 to 10 have been an important implicit criteria
adopted to organize young unemployed individuals into cooperatives.– Controls for previous and current labor market experience are included to
remove lingering relationships between age and measures of enterprise outcome.
– Controls for current employment size is employed to remove remaining selection arising from initial size. Size at start-up is fairly orthogonal to productivity once we control for current size.
– Test the validity of the instrument using over-identification restrictions and Durbin-Wu-Hausman test.
• The control function approach (2SRIE) while relies on the same kinds of identification conditions as 2SLS, unlike 2SLS, it employs fitted values of residuals as instruments rather than estimated values derived from the first stage regression

Data and methodology
• Test whether technology differ. First select the production function form. Translog vs cobb-douglas restriction.
Translog representation
General
𝑙𝑛𝑌 = 𝑙𝑛𝐴𝛼𝑖,𝛽𝑖 + 𝑖=1𝑛 𝛼𝑖 ln 𝑋𝑖 + 𝑖=1
𝑛 𝑗=1𝑛 𝛽𝑖𝑗 ln 𝑋𝑖 ln 𝑋𝑗 + 𝜑 (1)
Cobb-Douglas restriction
𝛽𝑘𝑘 = 𝛽𝑘𝑙 = 𝛽𝑘𝑚 = 𝛽𝑙𝑙 = 𝛽𝑙𝑚 = 𝛽𝑚𝑚 = 0
Data and methodology
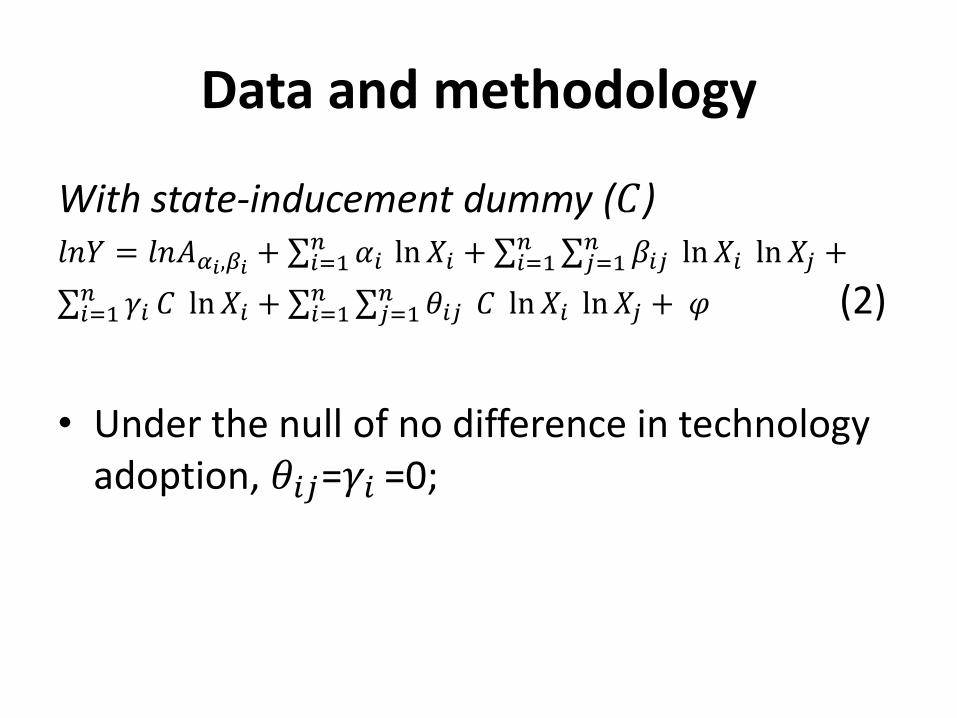
With state-inducement dummy (𝐶)𝑙𝑛𝑌 = 𝑙𝑛𝐴𝛼𝑖,𝛽𝑖 + 𝑖=1
𝑛 𝛼𝑖 ln 𝑋𝑖 + 𝑖=1𝑛 𝑗=1
𝑛 𝛽𝑖𝑗 ln 𝑋𝑖 ln 𝑋𝑗 +
𝑖=1𝑛 𝛾𝑖 𝐶 ln𝑋𝑖 + 𝑖=1
𝑛 𝑗=1𝑛 𝜃𝑖𝑗 𝐶 ln𝑋𝑖 ln 𝑋𝑗 + 𝜑 (2)
• Under the null of no difference in technology adoption, 𝜃𝑖𝑗=𝛾𝑖 =0;

Data and methodology
• Productivity measures : select measures that leave the underlying technology unspecified and allows for heterogeneity, without functional form or behavioral assumptions.
– TFP
– DEA-efficiency scores
– Labor productivity
(3))ln)(ln(2
1)ln(lnln ,,, jjijtji
j
ii XXYYTFP
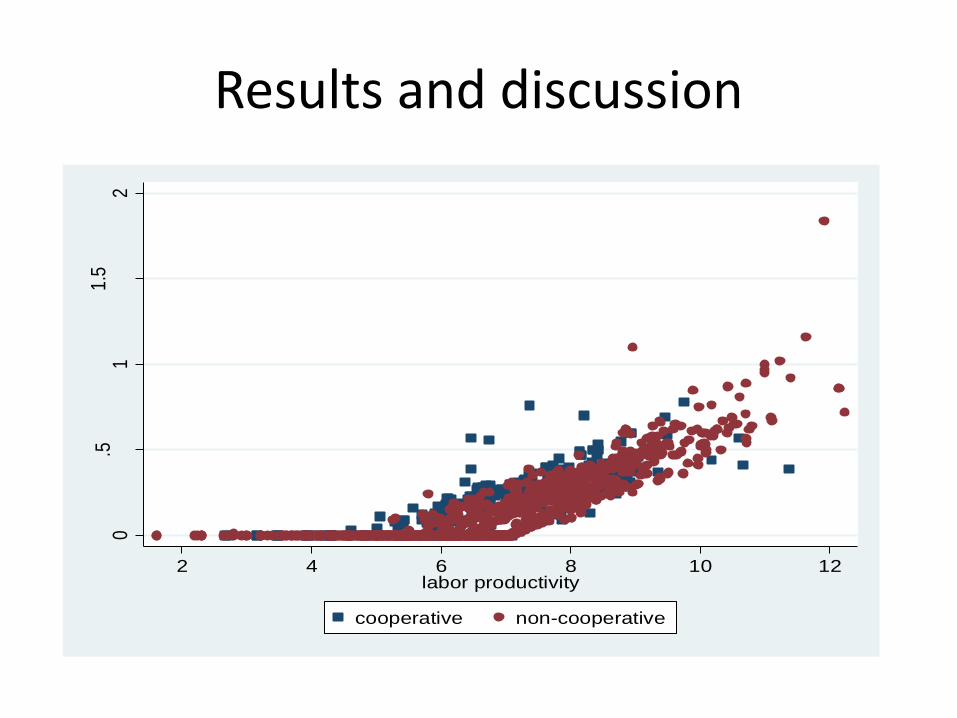
Results and discussion0
.51
1.5
2
Dea
effi
cenc
y sc
ore
2 4 6 8 10 12labor productivity
cooperative non-cooperative
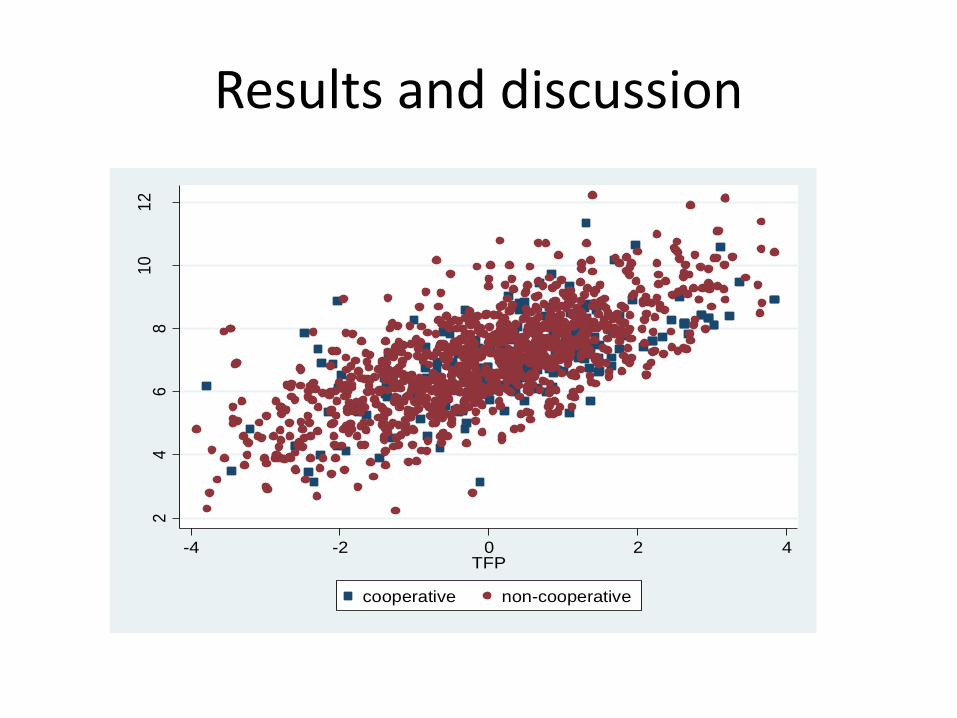
Results and discussion2
46
81
01
2
lab
or
pro
du
ctiv
ity
-4 -2 0 2 4TFP
cooperative non-cooperative
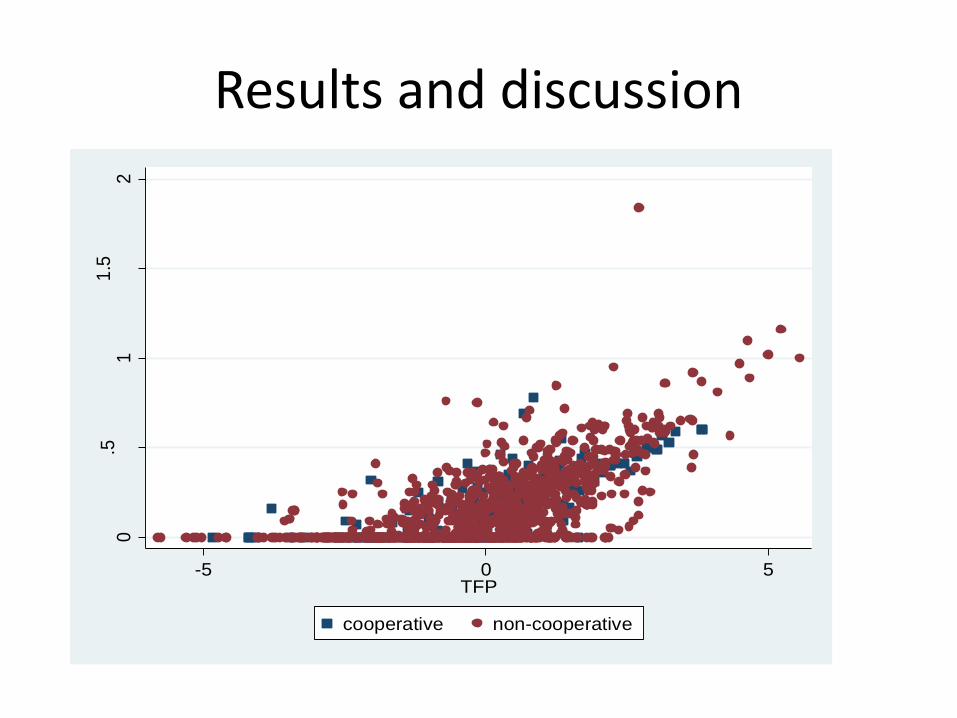
Results and discussion0
.51
1.5
2
dea
effic
ency
sco
re
-5 0 5TFP
cooperative non-cooperative
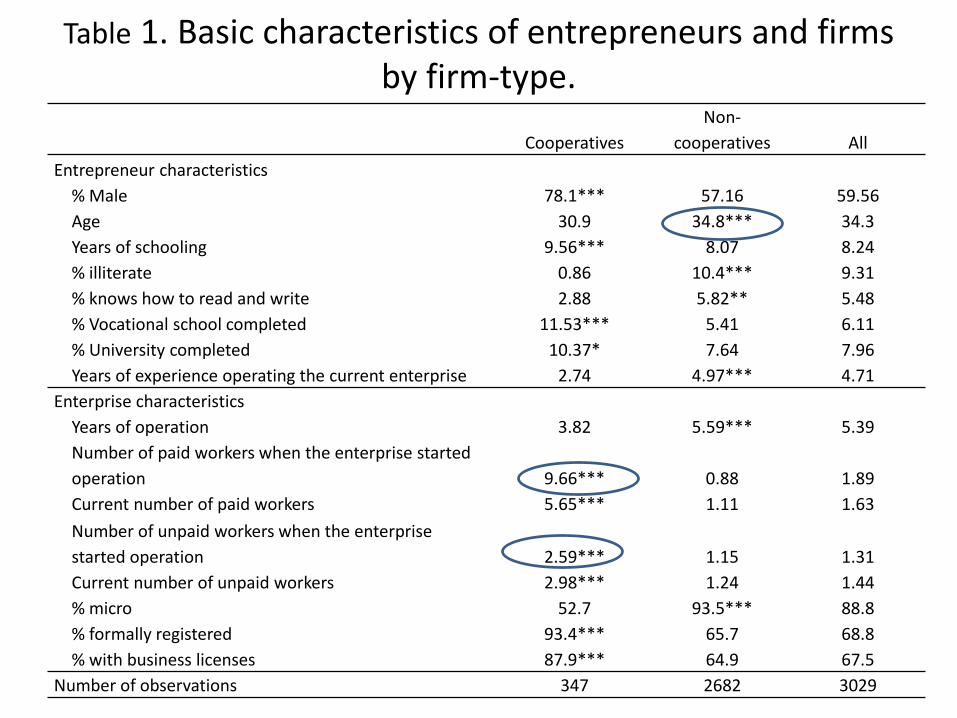
Table 1. Basic characteristics of entrepreneurs and firms by firm-type.
Cooperatives
Non-
cooperatives All
Entrepreneur characteristics
% Male 78.1*** 57.16 59.56
Age 30.9 34.8*** 34.3
Years of schooling 9.56*** 8.07 8.24
% illiterate 0.86 10.4*** 9.31
% knows how to read and write 2.88 5.82** 5.48
% Vocational school completed 11.53*** 5.41 6.11
% University completed 10.37* 7.64 7.96
Years of experience operating the current enterprise 2.74 4.97*** 4.71
Enterprise characteristics
Years of operation 3.82 5.59*** 5.39
Number of paid workers when the enterprise started
operation 9.66*** 0.88 1.89
Current number of paid workers 5.65*** 1.11 1.63
Number of unpaid workers when the enterprise
started operation 2.59*** 1.15 1.31
Current number of unpaid workers 2.98*** 1.24 1.44
% micro 52.7 93.5*** 88.8
% formally registered 93.4*** 65.7 68.8
% with business licenses 87.9*** 64.9 67.5
Number of observations 347 2682 3029
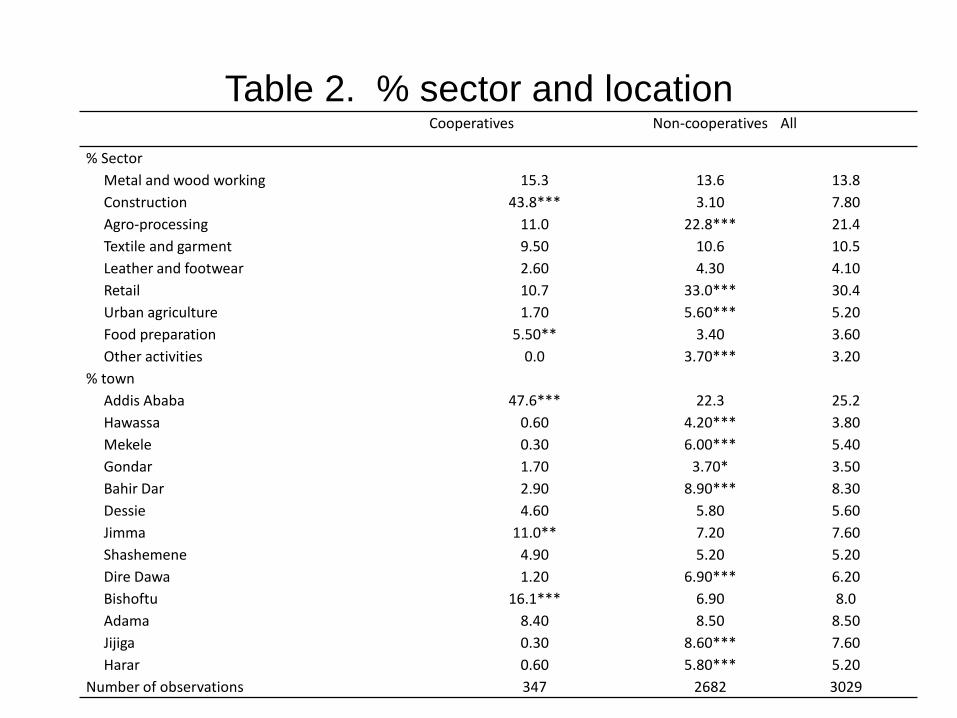
Table 2. % sector and locationCooperatives Non-cooperatives All
% Sector
Metal and wood working 15.3 13.6 13.8
Construction 43.8*** 3.10 7.80
Agro-processing 11.0 22.8*** 21.4
Textile and garment 9.50 10.6 10.5
Leather and footwear 2.60 4.30 4.10
Retail 10.7 33.0*** 30.4
Urban agriculture 1.70 5.60*** 5.20
Food preparation 5.50** 3.40 3.60
Other activities 0.0 3.70*** 3.20
% town
Addis Ababa 47.6*** 22.3 25.2
Hawassa 0.60 4.20*** 3.80
Mekele 0.30 6.00*** 5.40
Gondar 1.70 3.70* 3.50
Bahir Dar 2.90 8.90*** 8.30
Dessie 4.60 5.80 5.60
Jimma 11.0** 7.20 7.60
Shashemene 4.90 5.20 5.20
Dire Dawa 1.20 6.90*** 6.20
Bishoftu 16.1*** 6.90 8.0
Adama 8.40 8.50 8.50
Jijiga 0.30 8.60*** 7.60
Harar 0.60 5.80*** 5.20
Number of observations 347 2682 3029
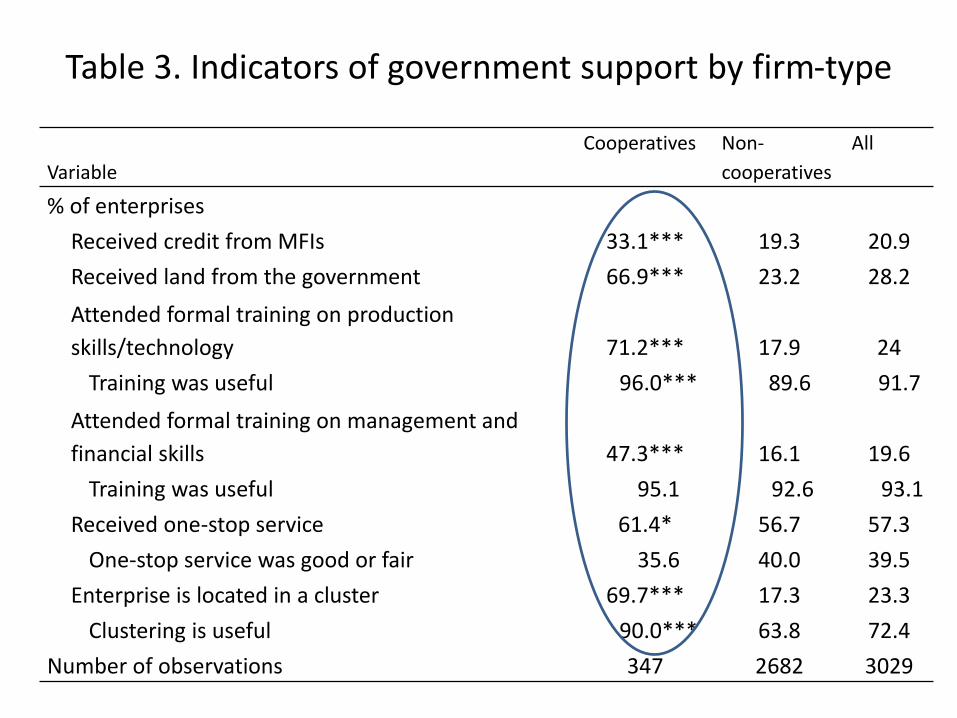
Table 3. Indicators of government support by firm-type
Variable
Cooperatives Non-
cooperatives
All
% of enterprises
Received credit from MFIs 33.1*** 19.3 20.9
Received land from the government 66.9*** 23.2 28.2
Attended formal training on production
skills/technology 71.2*** 17.9 24
Training was useful 96.0*** 89.6 91.7
Attended formal training on management and
financial skills 47.3*** 16.1 19.6
Training was useful 95.1 92.6 93.1
Received one-stop service 61.4* 56.7 57.3
One-stop service was good or fair 35.6 40.0 39.5
Enterprise is located in a cluster 69.7*** 17.3 23.3
Clustering is useful 90.0*** 63.8 72.4
Number of observations 347 2682 3029
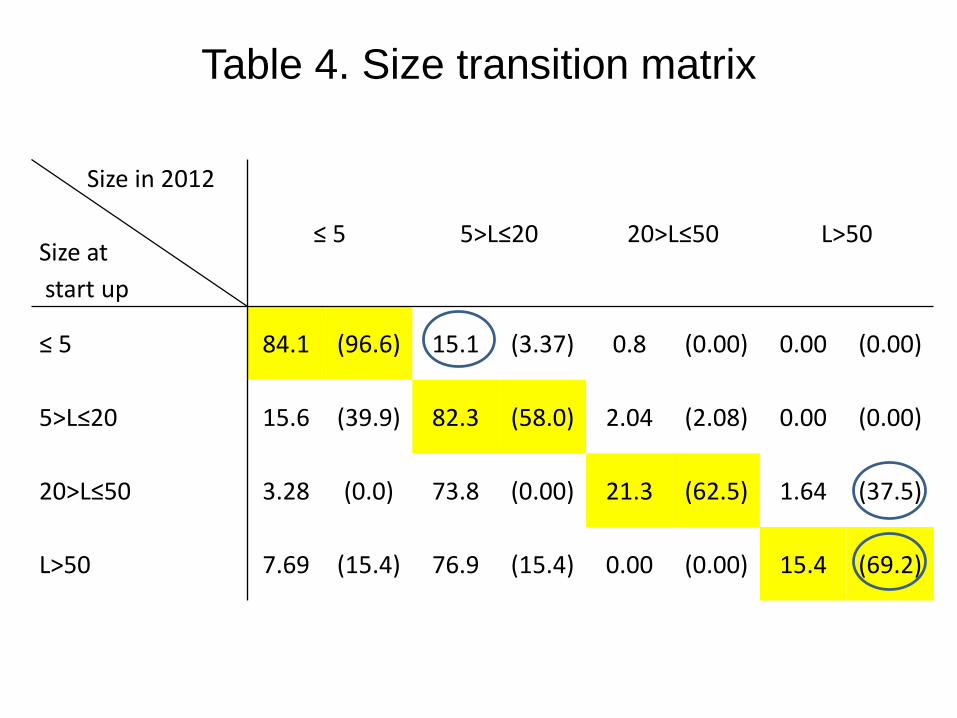
Table 4. Size transition matrix
Size in 2012
Size at
start up
≤ 5 5>L≤20 20>L≤50 L>50
≤ 5 84.1 (96.6) 15.1 (3.37) 0.8 (0.00) 0.00 (0.00)
5>L≤20 15.6 (39.9) 82.3 (58.0) 2.04 (2.08) 0.00 (0.00)
20>L≤50 3.28 (0.0) 73.8 (0.00) 21.3 (62.5) 1.64 (37.5)
L>50 7.69 (15.4) 76.9 (15.4) 0.00 (0.00) 15.4 (69.2)
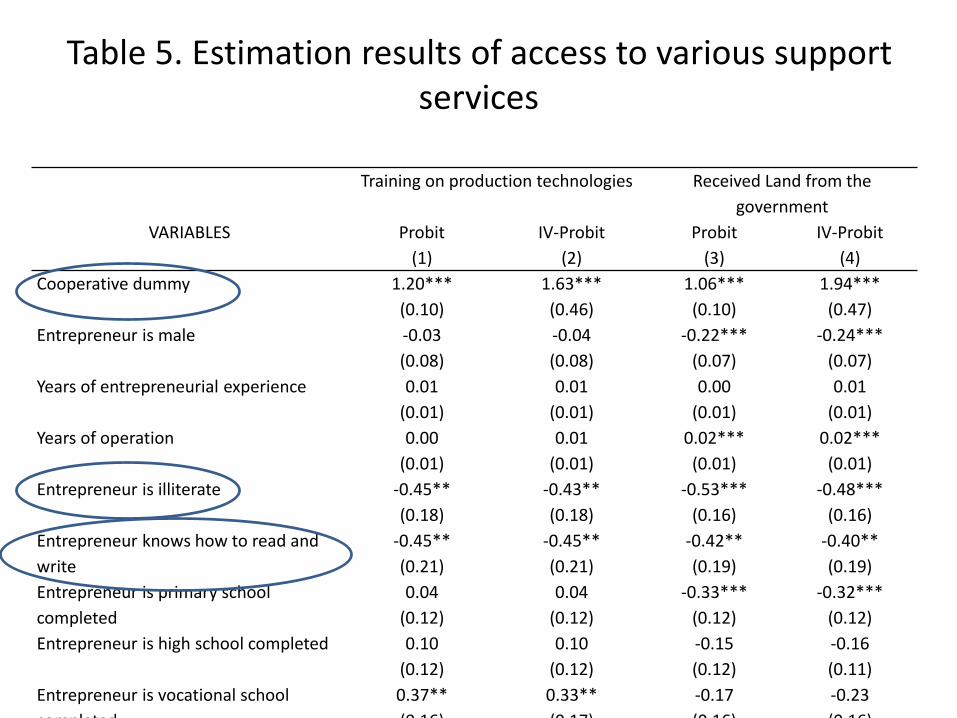
Table 5. Estimation results of access to various support services
Training on production technologies Received Land from the
government
VARIABLES Probit IV-Probit Probit IV-Probit
(1) (2) (3) (4)
Cooperative dummy 1.20*** 1.63*** 1.06*** 1.94***
(0.10) (0.46) (0.10) (0.47)
Entrepreneur is male -0.03 -0.04 -0.22*** -0.24***
(0.08) (0.08) (0.07) (0.07)
Years of entrepreneurial experience 0.01 0.01 0.00 0.01
(0.01) (0.01) (0.01) (0.01)
Years of operation 0.00 0.01 0.02*** 0.02***
(0.01) (0.01) (0.01) (0.01)
Entrepreneur is illiterate -0.45** -0.43** -0.53*** -0.48***
(0.18) (0.18) (0.16) (0.16)
Entrepreneur knows how to read and
write
-0.45** -0.45** -0.42** -0.40**
(0.21) (0.21) (0.19) (0.19)
Entrepreneur is primary school
completed
0.04 0.04 -0.33*** -0.32***
(0.12) (0.12) (0.12) (0.12)
Entrepreneur is high school completed 0.10 0.10 -0.15 -0.16
(0.12) (0.12) (0.12) (0.11)
Entrepreneur is vocational school
completed
0.37** 0.33** -0.17 -0.23
(0.16) (0.17) (0.16) (0.16)
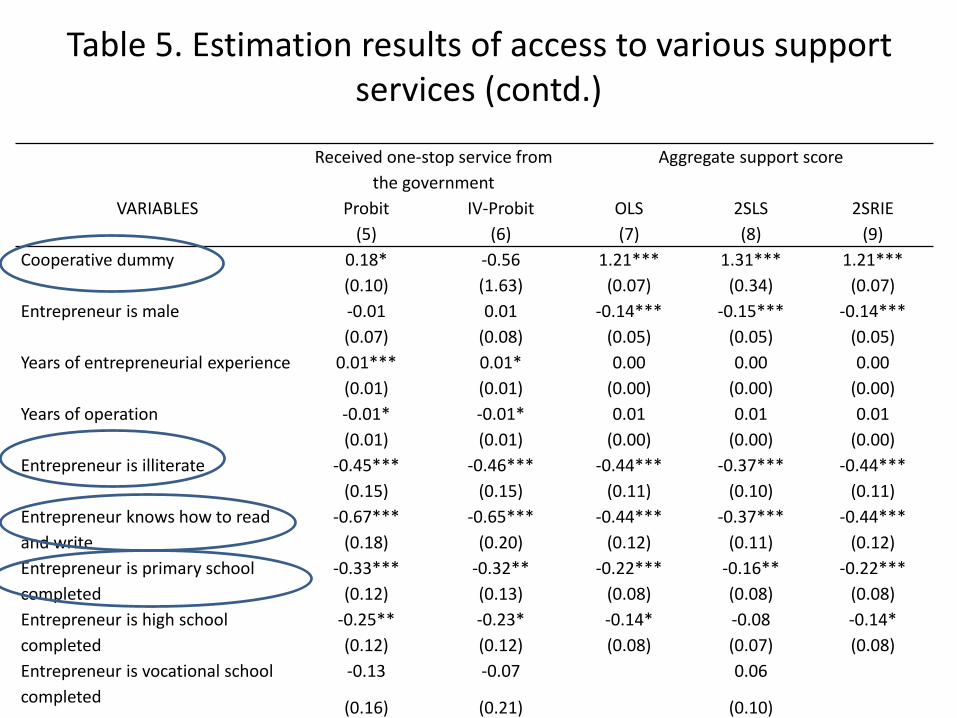
Table 5. Estimation results of access to various support services (contd.)
Received one-stop service from
the government
Aggregate support score
VARIABLES Probit IV-Probit OLS 2SLS 2SRIE
(5) (6) (7) (8) (9)
Cooperative dummy 0.18* -0.56 1.21*** 1.31*** 1.21***
(0.10) (1.63) (0.07) (0.34) (0.07)
Entrepreneur is male -0.01 0.01 -0.14*** -0.15*** -0.14***
(0.07) (0.08) (0.05) (0.05) (0.05)
Years of entrepreneurial experience 0.01*** 0.01* 0.00 0.00 0.00
(0.01) (0.01) (0.00) (0.00) (0.00)
Years of operation -0.01* -0.01* 0.01 0.01 0.01
(0.01) (0.01) (0.00) (0.00) (0.00)
Entrepreneur is illiterate -0.45*** -0.46*** -0.44*** -0.37*** -0.44***
(0.15) (0.15) (0.11) (0.10) (0.11)
Entrepreneur knows how to read
and write
-0.67*** -0.65*** -0.44*** -0.37*** -0.44***
(0.18) (0.20) (0.12) (0.11) (0.12)
Entrepreneur is primary school
completed
-0.33*** -0.32** -0.22*** -0.16** -0.22***
(0.12) (0.13) (0.08) (0.08) (0.08)
Entrepreneur is high school
completed
-0.25** -0.23* -0.14* -0.08 -0.14*
(0.12) (0.12) (0.08) (0.07) (0.08)
Entrepreneur is vocational school
completed
-0.13 -0.07 0.06
(0.16) (0.21) (0.10)
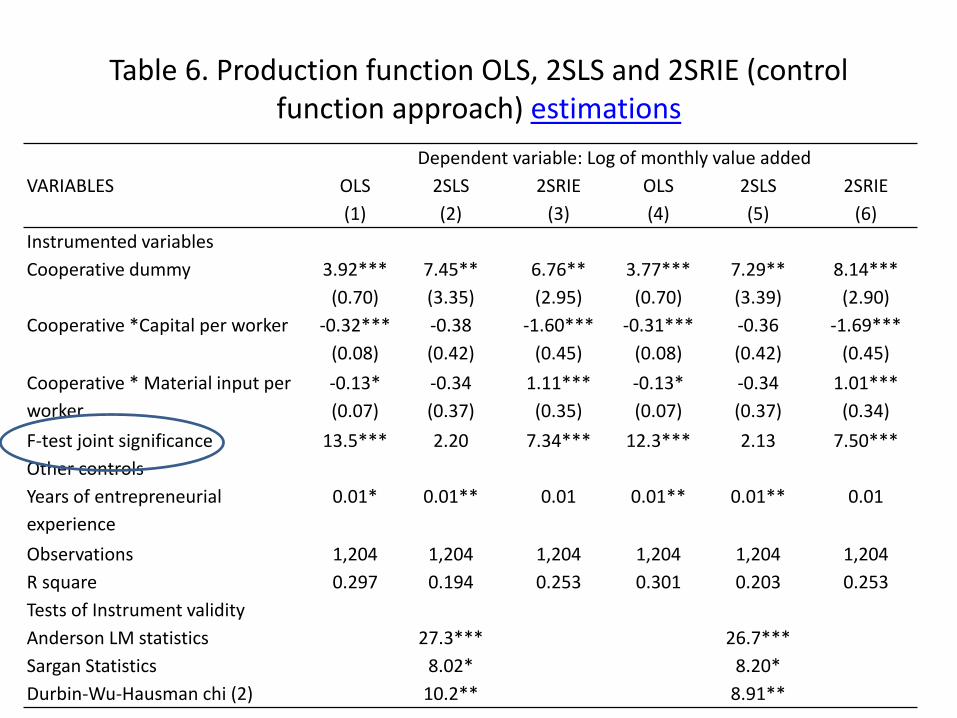
Table 6. Production function OLS, 2SLS and 2SRIE (control function approach) estimations
Dependent variable: Log of monthly value added
VARIABLES OLS 2SLS 2SRIE OLS 2SLS 2SRIE
(1) (2) (3) (4) (5) (6)
Instrumented variables
Cooperative dummy 3.92*** 7.45** 6.76** 3.77*** 7.29** 8.14***
(0.70) (3.35) (2.95) (0.70) (3.39) (2.90)
Cooperative *Capital per worker -0.32*** -0.38 -1.60*** -0.31*** -0.36 -1.69***
(0.08) (0.42) (0.45) (0.08) (0.42) (0.45)
Cooperative * Material input per
worker
-0.13* -0.34 1.11*** -0.13* -0.34 1.01***
(0.07) (0.37) (0.35) (0.07) (0.37) (0.34)
F-test joint significance 13.5*** 2.20 7.34*** 12.3*** 2.13 7.50***
Other controls
Years of entrepreneurial
experience
0.01* 0.01** 0.01 0.01** 0.01** 0.01
Observations 1,204 1,204 1,204 1,204 1,204 1,204
R square 0.297 0.194 0.253 0.301 0.203 0.253
Tests of Instrument validity
Anderson LM statistics 27.3*** 26.7***
Sargan Statistics 8.02* 8.20*
Durbin-Wu-Hausman chi (2) 10.2** 8.91**
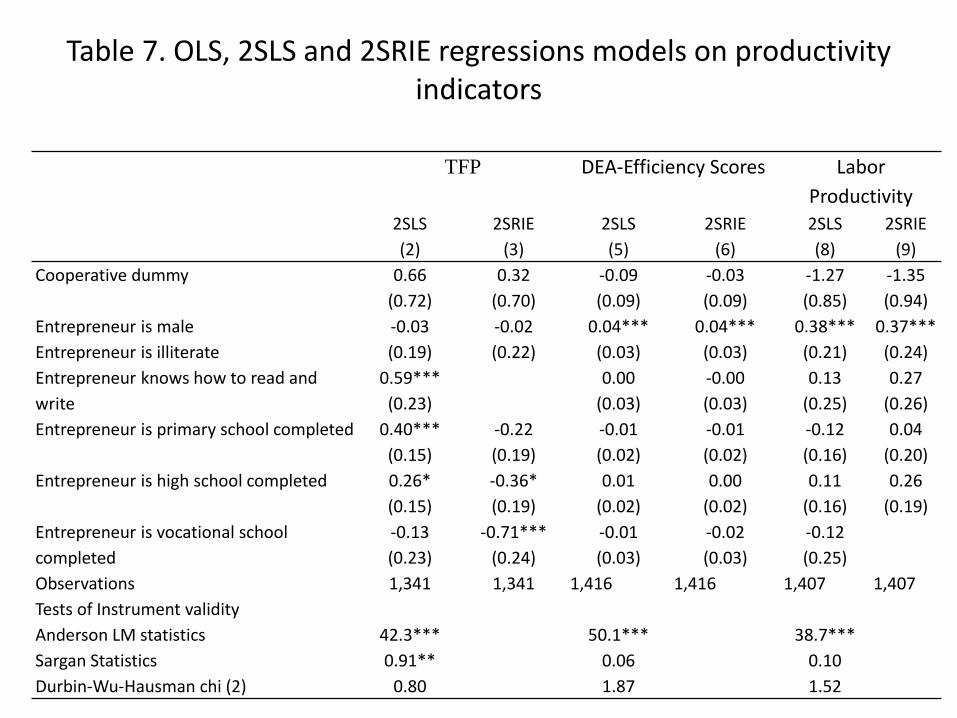
Table 7. OLS, 2SLS and 2SRIE regressions models on productivity indicators
TFP DEA-Efficiency Scores Labor
Productivity
2SLS 2SRIE 2SLS 2SRIE 2SLS 2SRIE
(2) (3) (5) (6) (8) (9)
Cooperative dummy 0.66 0.32 -0.09 -0.03 -1.27 -1.35
(0.72) (0.70) (0.09) (0.09) (0.85) (0.94)
Entrepreneur is male -0.03 -0.02 0.04*** 0.04*** 0.38*** 0.37***
Entrepreneur is illiterate (0.19) (0.22) (0.03) (0.03) (0.21) (0.24)
Entrepreneur knows how to read and
write
0.59*** 0.00 -0.00 0.13 0.27
(0.23) (0.03) (0.03) (0.25) (0.26)
Entrepreneur is primary school completed 0.40*** -0.22 -0.01 -0.01 -0.12 0.04
(0.15) (0.19) (0.02) (0.02) (0.16) (0.20)
Entrepreneur is high school completed 0.26* -0.36* 0.01 0.00 0.11 0.26
(0.15) (0.19) (0.02) (0.02) (0.16) (0.19)
Entrepreneur is vocational school
completed
-0.13 -0.71*** -0.01 -0.02 -0.12
(0.23) (0.24) (0.03) (0.03) (0.25)
Observations 1,341 1,341 1,416 1,416 1,407 1,407
Tests of Instrument validity
Anderson LM statistics 42.3*** 50.1*** 38.7***
Sargan Statistics 0.91** 0.06 0.10
Durbin-Wu-Hausman chi (2) 0.80 1.87 1.52
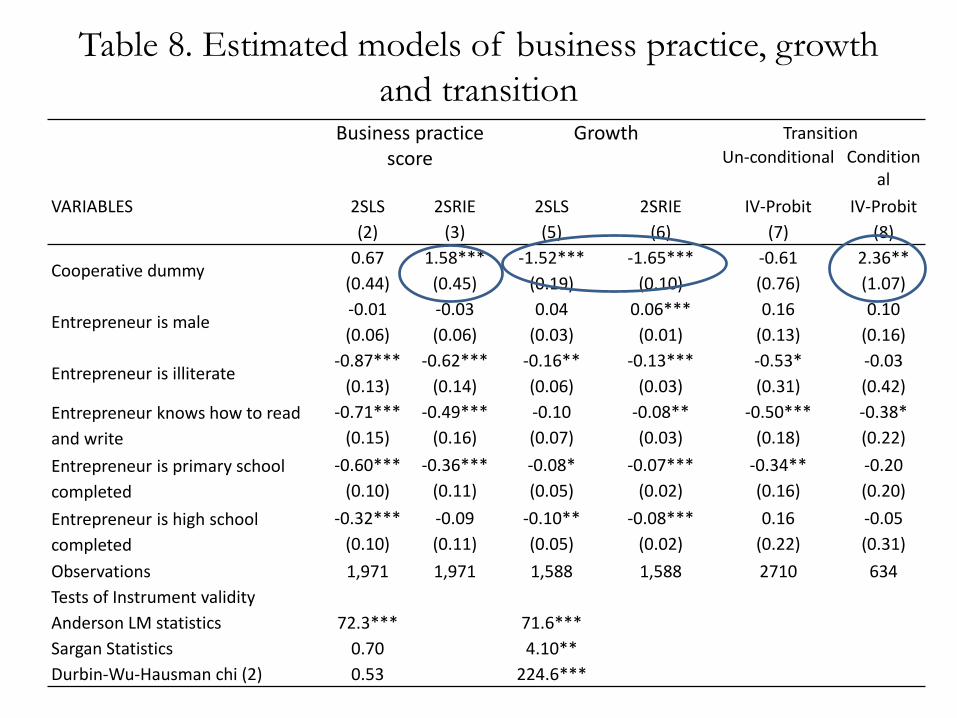
Table 8. Estimated models of business practice, growth
and transition Business practice
scoreGrowth Transition
Un-conditional Conditional
VARIABLES 2SLS 2SRIE 2SLS 2SRIE IV-Probit IV-Probit
(2) (3) (5) (6) (7) (8)
Cooperative dummy0.67 1.58*** -1.52*** -1.65*** -0.61 2.36**
(0.44) (0.45) (0.19) (0.10) (0.76) (1.07)
Entrepreneur is male-0.01 -0.03 0.04 0.06*** 0.16 0.10
(0.06) (0.06) (0.03) (0.01) (0.13) (0.16)
Entrepreneur is illiterate -0.87*** -0.62*** -0.16** -0.13*** -0.53* -0.03
(0.13) (0.14) (0.06) (0.03) (0.31) (0.42)
Entrepreneur knows how to read
and write
-0.71*** -0.49*** -0.10 -0.08** -0.50*** -0.38*
(0.15) (0.16) (0.07) (0.03) (0.18) (0.22)
Entrepreneur is primary school
completed
-0.60*** -0.36*** -0.08* -0.07*** -0.34** -0.20
(0.10) (0.11) (0.05) (0.02) (0.16) (0.20)
Entrepreneur is high school
completed
-0.32*** -0.09 -0.10** -0.08*** 0.16 -0.05
(0.10) (0.11) (0.05) (0.02) (0.22) (0.31)
Observations 1,971 1,971 1,588 1,588 2710 634
Tests of Instrument validity
Anderson LM statistics 72.3*** 71.6***
Sargan Statistics 0.70 4.10**
Durbin-Wu-Hausman chi (2) 0.53 224.6***
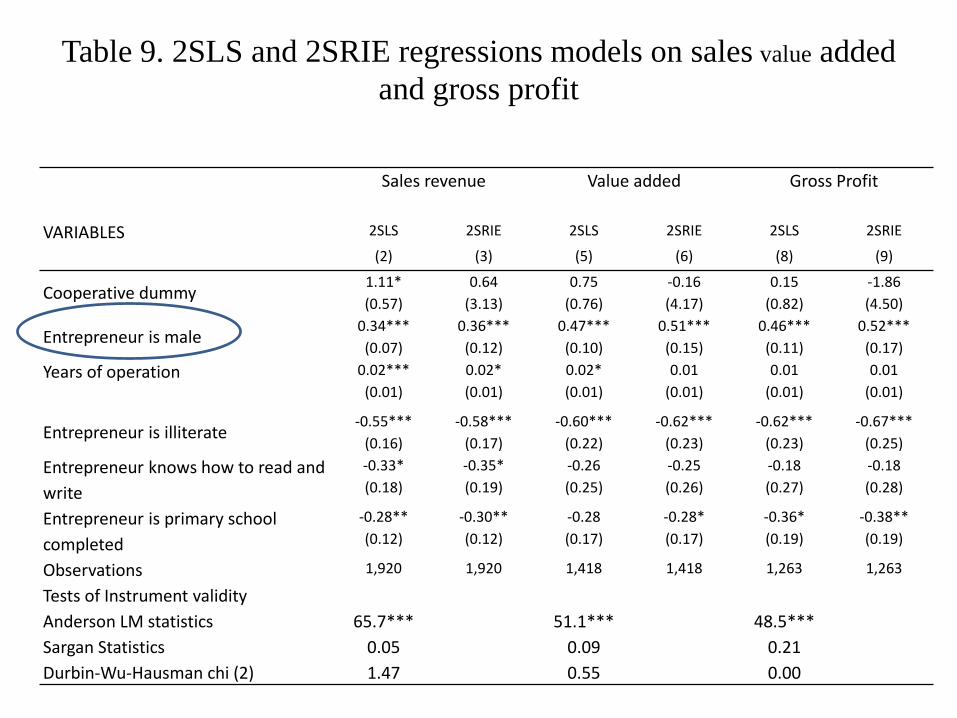
Table 9. 2SLS and 2SRIE regressions models on sales value added
and gross profit
Sales revenue Value added Gross Profit
VARIABLES 2SLS 2SRIE 2SLS 2SRIE 2SLS 2SRIE
(2) (3) (5) (6) (8) (9)
Cooperative dummy1.11* 0.64 0.75 -0.16 0.15 -1.86
(0.57) (3.13) (0.76) (4.17) (0.82) (4.50)
Entrepreneur is male0.34*** 0.36*** 0.47*** 0.51*** 0.46*** 0.52***
(0.07) (0.12) (0.10) (0.15) (0.11) (0.17)
Years of operation 0.02*** 0.02* 0.02* 0.01 0.01 0.01
(0.01) (0.01) (0.01) (0.01) (0.01) (0.01)
Entrepreneur is illiterate -0.55*** -0.58*** -0.60*** -0.62*** -0.62*** -0.67***
(0.16) (0.17) (0.22) (0.23) (0.23) (0.25)
Entrepreneur knows how to read and
write
-0.33* -0.35* -0.26 -0.25 -0.18 -0.18
(0.18) (0.19) (0.25) (0.26) (0.27) (0.28)
Entrepreneur is primary school
completed
-0.28** -0.30** -0.28 -0.28* -0.36* -0.38**
(0.12) (0.12) (0.17) (0.17) (0.19) (0.19)
Observations 1,920 1,920 1,418 1,418 1,263 1,263
Tests of Instrument validity
Anderson LM statistics 65.7*** 51.1*** 48.5***
Sargan Statistics 0.05 0.09 0.21
Durbin-Wu-Hausman chi (2) 1.47 0.55 0.00
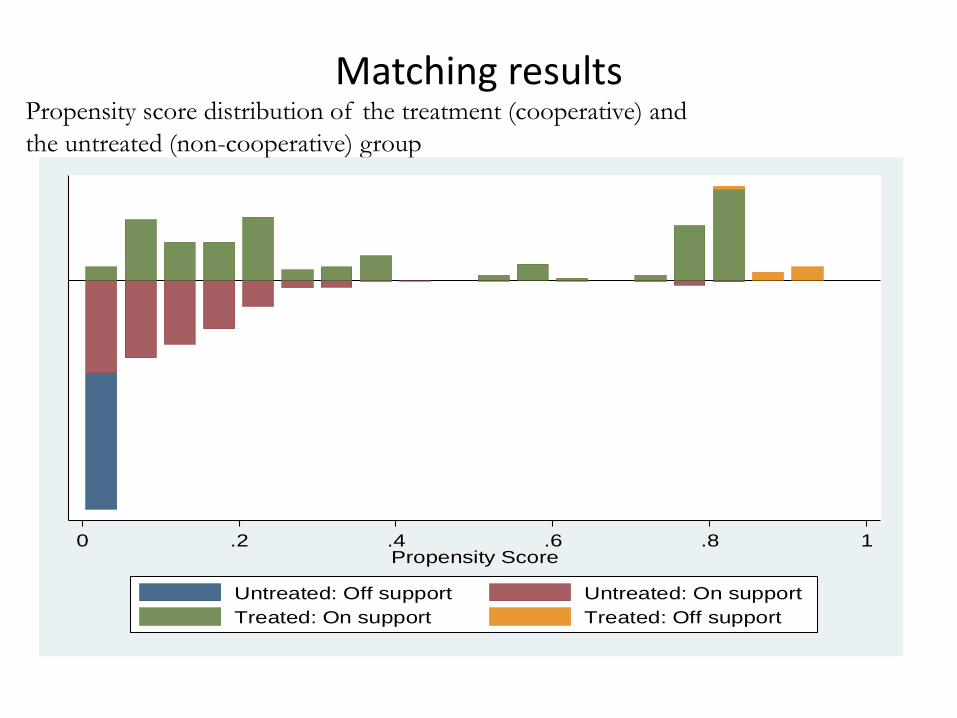
Matching results Propensity score distribution of the treatment (cooperative) and
the untreated (non-cooperative) group
0 .2 .4 .6 .8 1Propensity Score
Untreated: Off support Untreated: On support
Treated: On support Treated: Off support

Matching results
02
46
Den
sity
0 .2 .4 .6 .8 1Propensity score
kdensity propensity score cooperatives kdensity propensity score noncooperatives
02
46
Den
sity
0 .2 .4 .6 .8 1Propensity score
kdensity propensity score cooperatives kdensity propensity score noncooperatives
Unmatched sample Matched sample

Matching results
Training on production
technologies
Received land from the
government
Received one-stop service
from the government
Aggregate support score
(1) (2) (3) (4)
PSM 0.42*** 0.40*** 0.20*** 1.33***
Boot-strapped standard errors (0.07) (0.06) (0.07) (0.14)
Number of Observations 1975 1975 1975 1972
Panel 1. Estimation results on access to various support services
TFP DEA-Efficiency Scores
Labor Productivity
(1) (2) (3)PSM 0.27 -0.06 -0.02Boot-strapped standard errors (0.26) (0.33) (0.22)Number of Observations 1431 1407 1873
Panel 2. Estimation results on productivity indicators
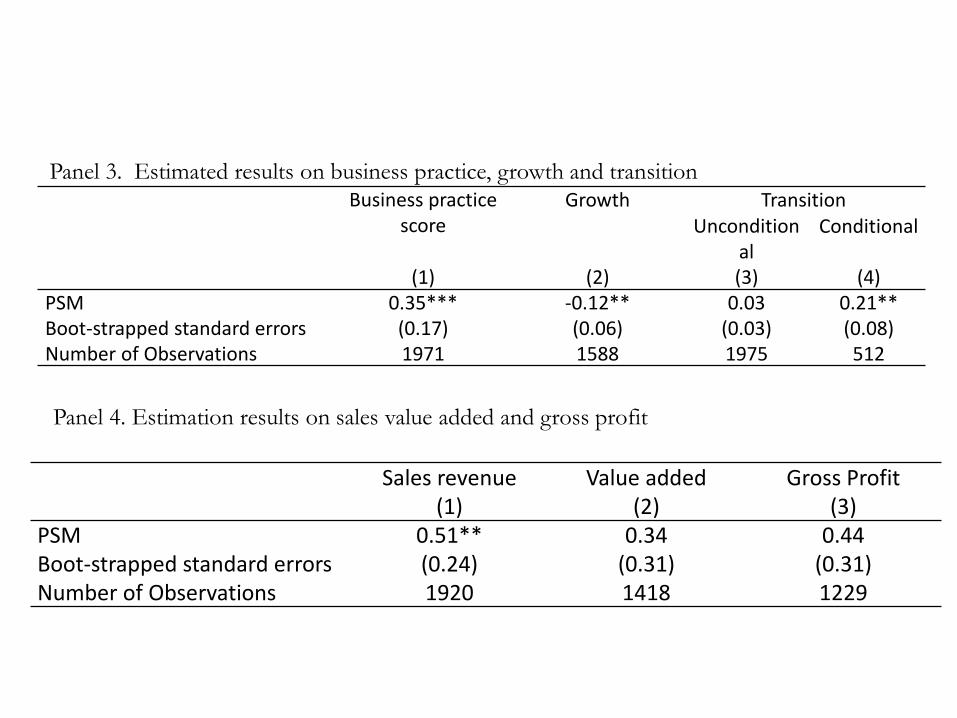
Business practice score
Growth TransitionUncondition
al Conditional
(1) (2) (3) (4)PSM 0.35*** -0.12** 0.03 0.21**Boot-strapped standard errors (0.17) (0.06) (0.03) (0.08)Number of Observations 1971 1588 1975 512
Sales revenue Value added Gross Profit(1) (2) (3)
PSM 0.51** 0.34 0.44Boot-strapped standard errors (0.24) (0.31) (0.31)Number of Observations 1920 1418 1229
Panel 4. Estimation results on sales value added and gross profit
Panel 3. Estimated results on business practice, growth and transition
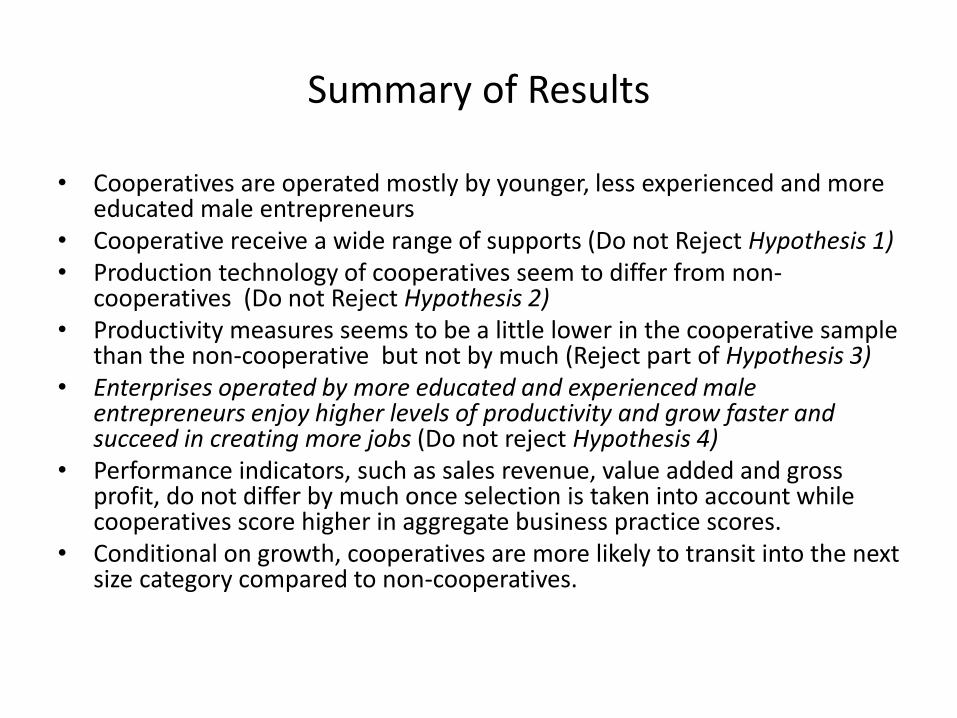
Summary of Results
• Cooperatives are operated mostly by younger, less experienced and more educated male entrepreneurs
• Cooperative receive a wide range of supports (Do not Reject Hypothesis 1)• Production technology of cooperatives seem to differ from non-
cooperatives (Do not Reject Hypothesis 2)• Productivity measures seems to be a little lower in the cooperative sample
than the non-cooperative but not by much (Reject part of Hypothesis 3)• Enterprises operated by more educated and experienced male
entrepreneurs enjoy higher levels of productivity and grow faster and succeed in creating more jobs (Do not reject Hypothesis 4)
• Performance indicators, such as sales revenue, value added and gross profit, do not differ by much once selection is taken into account while cooperatives score higher in aggregate business practice scores.
• Conditional on growth, cooperatives are more likely to transit into the next size category compared to non-cooperatives.

Summary of Results
Why is the link between state support and productivity gains weak?
• Less capable and less promising enterprises (promotes survival without meaningful productivity improvement)
• Support system may not be sufficient in depth and content
• Constraints on accessing inputs and markets attenuates the likely effect of state support
• Knowledge trickle down from lead person to other members
• Decision model based on equal voting rights may not necessarily be in sync with efficiency enhancing management system.
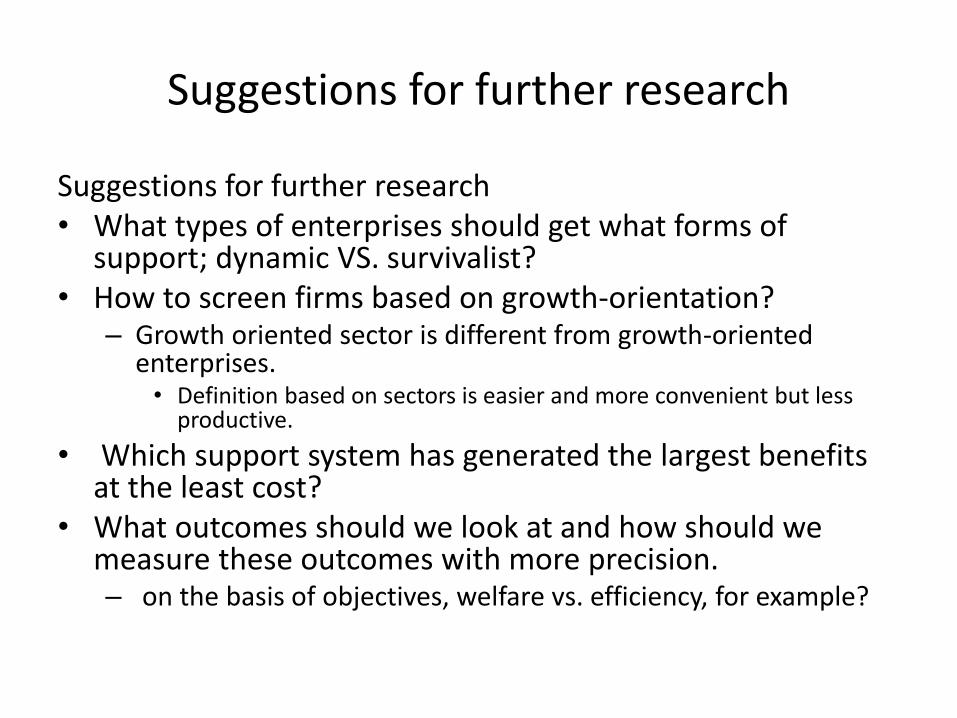
Suggestions for further research
Suggestions for further research• What types of enterprises should get what forms of
support; dynamic VS. survivalist?• How to screen firms based on growth-orientation?
– Growth oriented sector is different from growth-oriented enterprises. • Definition based on sectors is easier and more convenient but less
productive.
• Which support system has generated the largest benefits at the least cost?
• What outcomes should we look at and how should we measure these outcomes with more precision.– on the basis of objectives, welfare vs. efficiency, for example?

Thank you for your attention!


![11B 14B (k) vs vs vs vs vs vs vs vs vs vs vs vs vs vs vs ...sanspo-dbls-golf.com/pdf/2017/20171114c.pdf · 11B 14B (k) vs vs vs vs vs vs vs vs vs vs vs vs vs vs vs *7+1 Y—F2 Ll.]](https://img.pdfslide.net/doc/110x75/5bf8a68d09d3f294138c8536/11b-14b-k-vs-vs-vs-vs-vs-vs-vs-vs-vs-vs-vs-vs-vs-vs-vs-sanspo-dbls-golfcompdf2017.jpg)