Embed Size (px)
Citation preview

Targeting of aid in rural Ethiopia: Any improvementwith recent changes?
Elsa Valli
CSAE Conference 2017University of Sussex & UNICEF Office of Research
March 20, 2017
Elsa Valli (University of Sussex) Targeting of aid in rural Ethiopia March 20, 2017 1 / 22

Outline
1 Motivation and literature review
2 Aid in Ethiopia: Food Aid and PSNP
3 Data and Descriptive statistics
4 Empirical strategy
5 Results
6 Conclusions
Elsa Valli (University of Sussex) Targeting of aid in rural Ethiopia March 20, 2017 2 / 22

Motivation and literature review
Motivation
Ethiopia: drought-prone country and long history of aid,emergency-based
Aid in 2 forms: Public Works and Food AidIn 2005 major reforms on aidTargeting in Ethiopia: Community-Based Targeting (CBT)
Studies on targeting of past aid: biases in selection of beneficiaries(gender and political connections) and targeting errors (geography andassets/welfare)Growing attention to targeting in Sub-Saharan Africa
Question: Has there been any improvement in targeting after the majorchanges in aid programmes in Ethiopia compared to the past?
Is now aid reaching the poorest and the most vulnerable?Do political connections still play an important role in aid allocation?
Elsa Valli (University of Sussex) Targeting of aid in rural Ethiopia March 20, 2017 3 / 22

Motivation and literature review
Literature Review
Targeting of anti-poverty programmes
Community-Based Targeting (CBT): mixed evidence. More transparent,better information, higher perceived fairness. BUT risks of elite capture andrent seeking behaviours (Bardhan et al., 2000; Conning et al., 2002; Alataset al., 2012)
Evidence in Africa: comparison different methods (Handa et al., 2012;Sabates-Wheeler et al., 2015) and challenging PMT (Brown et al., 2016;Kidd et al., 2017)
Targeting in Ethiopia
PW: mostly determined on labour supply characteristics; FA: some evidenceof targeting based on demographics and economic need (Jayne et al., 2002,JDE)
Political connections important role (Caeyers & Dercon, 2012; Broussard etal., 2014)
Elsa Valli (University of Sussex) Targeting of aid in rural Ethiopia March 20, 2017 4 / 22

Aid in Ethiopia: Food Aid and PSNP
Aid in Ethiopia: Food Aid and PSNP
Previous aid programmes similar characteristics BUT emergency-based,discontinuous, unpredictable
Productive Safety Net Programme (PSNP)Started in 2005, still ongoingCoverage: 7.5 mln people (10% of population)Budget: $360m (1.2% of GDP). Annual avg transfers per hh: $137 (14% ofGDP pc)Components: Public Works (PW): used to build community infrastructureduring non-farming activities; Direct Support (labour-constrainedhouseholds)Objective: "to assure food consumption and prevent asset depletion for foodinsecure households in chronically food insecure Woredas, while stimulatingmarkets, improving services and natural resources, and rehabilitating andenhancing the natural environment"
Emergency Food Aid still massive ($509m per year 2002-2012).Humanitarian Response Fund (2006)
Elsa Valli (University of Sussex) Targeting of aid in rural Ethiopia March 20, 2017 5 / 22
Aid in Ethiopia: Food Aid and PSNP
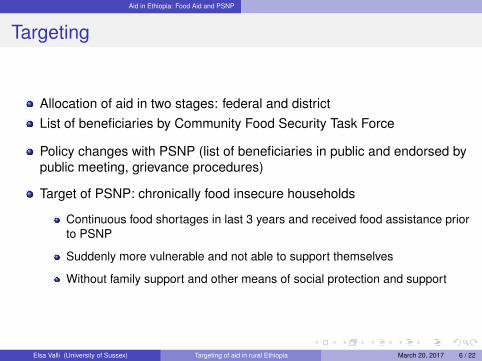
Targeting
Allocation of aid in two stages: federal and districtList of beneficiaries by Community Food Security Task Force
Policy changes with PSNP (list of beneficiaries in public and endorsed bypublic meeting, grievance procedures)
Target of PSNP: chronically food insecure households
Continuous food shortages in last 3 years and received food assistance priorto PSNP
Suddenly more vulnerable and not able to support themselves
Without family support and other means of social protection and support
Elsa Valli (University of Sussex) Targeting of aid in rural Ethiopia March 20, 2017 6 / 22
Data and Descriptive statistics
Data
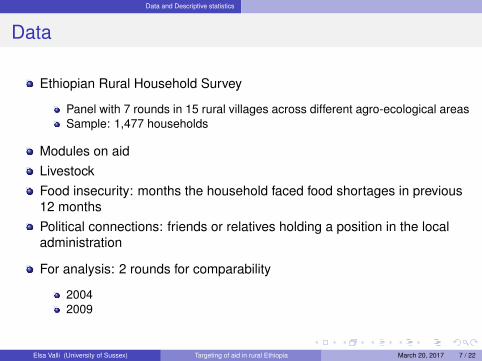
Ethiopian Rural Household Survey
Panel with 7 rounds in 15 rural villages across different agro-ecological areasSample: 1,477 households
Modules on aidLivestockFood insecurity: months the household faced food shortages in previous12 monthsPolitical connections: friends or relatives holding a position in the localadministration
For analysis: 2 rounds for comparability
20042009
Elsa Valli (University of Sussex) Targeting of aid in rural Ethiopia March 20, 2017 7 / 22

Data and Descriptive statistics
Summary statistics
Table 1: Characteristics of households by beneficiary status and round: Public Works
2004 2009Non-benef Benef Diff. Non-benef Benef Diff.
Head primary education 0.14 0.14 -0.00 0.16 0.13 -0.03Female head 0.36 0.28 -0.08** 0.37 0.46 0.09**Age head 51.30 48.01 -3.29*** 54.29 50.23 -4.06***Ability score 1.46 1.24 -0.22*** 1.62 1.38 -0.24***Household size 5.41 5.94 0.53** 5.50 5.75 0.25Share of elders 0.10 0.04 -0.06*** 0.12 0.05 -0.08***Livestock pc 307.25 362.27 55.03* 350.67 217.47 -133.20***Food insecurity 2.89 3.60 0.72*** 3.45 4.58 1.13***Political connections 0.32 0.46 0.13*** 0.32 0.33 0.01
Elsa Valli (University of Sussex) Targeting of aid in rural Ethiopia March 20, 2017 8 / 22
Data and Descriptive statistics
Summary statistics
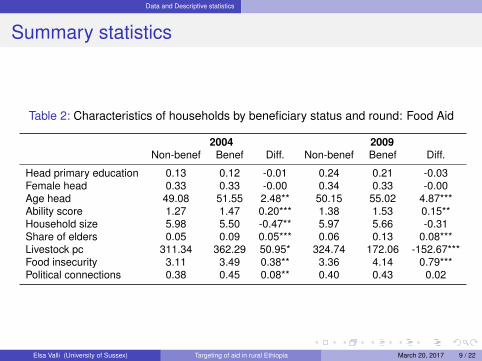
Table 2: Characteristics of households by beneficiary status and round: Food Aid
2004 2009Non-benef Benef Diff. Non-benef Benef Diff.
Head primary education 0.13 0.12 -0.01 0.24 0.21 -0.03Female head 0.33 0.33 -0.00 0.34 0.33 -0.00Age head 49.08 51.55 2.48** 50.15 55.02 4.87***Ability score 1.27 1.47 0.20*** 1.38 1.53 0.15**Household size 5.98 5.50 -0.47** 5.97 5.66 -0.31Share of elders 0.05 0.09 0.05*** 0.06 0.13 0.08***Livestock pc 311.34 362.29 50.95* 324.74 172.06 -152.67***Food insecurity 3.11 3.49 0.38** 3.36 4.14 0.79***Political connections 0.38 0.45 0.08** 0.40 0.43 0.02
Elsa Valli (University of Sussex) Targeting of aid in rural Ethiopia March 20, 2017 9 / 22
Empirical strategy
Empirical strategy
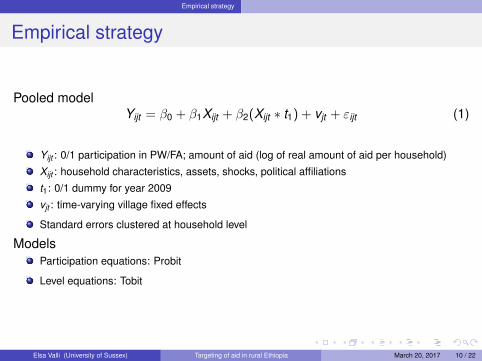
Pooled modelYijt = β0 + β1Xijt + β2(Xijt ∗ t1) + vjt + εijt (1)
Yijt : 0/1 participation in PW/FA; amount of aid (log of real amount of aid per household)
Xijt : household characteristics, assets, shocks, political affiliations
t1: 0/1 dummy for year 2009
vjt : time-varying village fixed effects
Standard errors clustered at household level
ModelsParticipation equations: Probit
Level equations: Tobit
Elsa Valli (University of Sussex) Targeting of aid in rural Ethiopia March 20, 2017 10 / 22

Results
Public Works
Participation (Probit ME) Amount (Tobit ME)(Pooled) (Full int) (Net) (Pooled) (Full int) (Net)
Log pc livestock -0.022** -0.004 -0.060** -0.004(0.009) (0.009) (0.027) (0.024)
Food insecurity 0.021*** 0.030*** 0.061*** 0.078***(0.007) (0.009) (0.023) (0.024)
Political connections (d) 0.069* 0.083** 0.191* 0.205*(0.037) (0.037) (0.112) (0.106)
2009 * Log pc livestock -0.033** -0.037** -0.212*** -0.216***(0.015) (0.017) (0.074) (0.078)
2009 * Food insecurity -0.024** 0.006 -0.082 -0.004(0.012) (0.015) (0.057) (0.062)
2009 * Political connections (d) -0.069 0.014 -0.178 0.027(0.055) (0.066) (0.280) (0.299)
Controls Yes Yes Yes YesTime-varying village fe Yes Yes Yes YesObservations 1110 1110 1110 1110LL -626.071 -616.275 -1665.855 -1652.691Significance levels * 10% ** 5% *** 1%. Standard errors are clustered at the household level.
Elsa Valli (University of Sussex) Targeting of aid in rural Ethiopia March 20, 2017 11 / 22

Results
Food Aid
Participation (Probit ME) Amount (Tobit ME)(Pooled) (Full int) (Net) (Pooled) (Full int) (Net)
Log pc livestock -0.015* -0.012 -0.035** -0.023(0.008) (0.010) (0.018) (0.022)
Food insecurity 0.003 0.005 0.005 0.012(0.007) (0.010) (0.016) (0.022)
Political connections (d) 0.079** 0.073* 0.134* 0.156(0.031) (0.041) (0.074) (0.098)
2009 * Log pc livestock -0.003 -0.015 0.005 -0.018(0.011) (0.015) (0.015) (0.027)
2009 * Food insecurity -0.002 0.003 0.005 0.018(0.010) (0.014) (0.014) (0.027)
2009 * Political connections (d) 0.001 0.073 -0.030 0.126(0.046) (0.062) (0.069) (0.119)
Time-varying village fe Yes Yes Yes YesObservations 1352 1352 1352 1352LL -774.581 -773.444 -1773.841 -1253.877Significance levels * 10% ** 5% *** 1%. Standard errors are clustered at the household level.
Elsa Valli (University of Sussex) Targeting of aid in rural Ethiopia March 20, 2017 12 / 22

Results
Robustness checks
Past aid and political connections
Different models (SUR models)
Analysis done also restricting only to villages that received both FA andPW
Quantile regressions on amount of aid received
Elsa Valli (University of Sussex) Targeting of aid in rural Ethiopia March 20, 2017 13 / 22
Conclusions
Conclusions
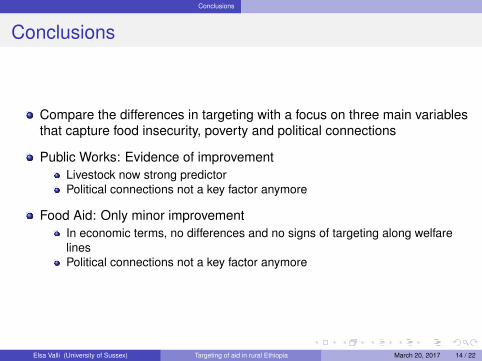
Compare the differences in targeting with a focus on three main variablesthat capture food insecurity, poverty and political connections
Public Works: Evidence of improvementLivestock now strong predictorPolitical connections not a key factor anymore
Food Aid: Only minor improvementIn economic terms, no differences and no signs of targeting along welfarelinesPolitical connections not a key factor anymore
Elsa Valli (University of Sussex) Targeting of aid in rural Ethiopia March 20, 2017 14 / 22

Conclusions
Thank you!
Elsa Valli (University of Sussex) Targeting of aid in rural Ethiopia March 20, 2017 15 / 22
Conclusions
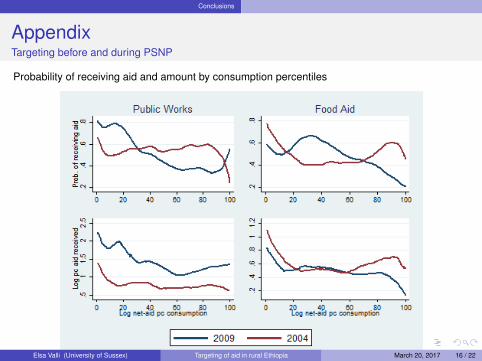
AppendixTargeting before and during PSNP
Probability of receiving aid and amount by consumption percentiles
Elsa Valli (University of Sussex) Targeting of aid in rural Ethiopia March 20, 2017 16 / 22

Conclusions
pw: Summary statistics
Table 3: Characteristics of PW beneficiary/non-beneficiary households before/duringPSNP
Pre-PSNP PSNPNo FA FA Diff. p-value No FA FA Diff. p-value
Real consumption pc 82.94 77.61 -5.32 0.32 55.51 49.66 -5.84 0.13Head primary education 0.14 0.14 -0.00 0.88 0.16 0.13 -0.03 0.43Female head 0.36 0.28 -0.08 0.03 0.37 0.46 0.09 0.05Age head 51.30 48.01 -3.29 0.00 54.29 50.23 -4.06 0.00Ability score 1.46 1.24 -0.22 0.00 1.62 1.38 -0.24 0.00Household size 5.41 5.94 0.53 0.01 5.50 5.75 0.25 0.29Share of elders 0.10 0.04 -0.06 0.00 0.12 0.05 -0.08 0.00Livestock pc 307.25 362.27 55.03 0.06 350.67 217.47 -133.20 0.00Food insecurity 2.89 3.60 0.72 0.00 3.45 4.58 1.13 0.00Office 0.32 0.46 0.13 0.00 0.32 0.33 0.01 0.81
Elsa Valli (University of Sussex) Targeting of aid in rural Ethiopia March 20, 2017 17 / 22
Conclusions
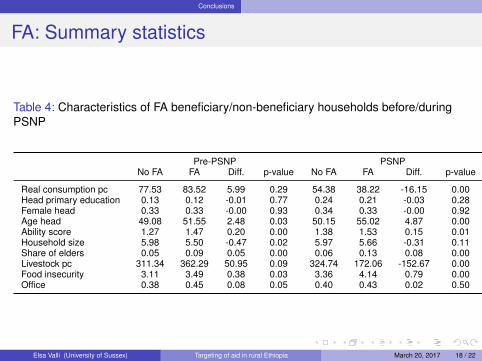
FA: Summary statistics
Table 4: Characteristics of FA beneficiary/non-beneficiary households before/duringPSNP
Pre-PSNP PSNPNo FA FA Diff. p-value No FA FA Diff. p-value
Real consumption pc 77.53 83.52 5.99 0.29 54.38 38.22 -16.15 0.00Head primary education 0.13 0.12 -0.01 0.77 0.24 0.21 -0.03 0.28Female head 0.33 0.33 -0.00 0.93 0.34 0.33 -0.00 0.92Age head 49.08 51.55 2.48 0.03 50.15 55.02 4.87 0.00Ability score 1.27 1.47 0.20 0.00 1.38 1.53 0.15 0.01Household size 5.98 5.50 -0.47 0.02 5.97 5.66 -0.31 0.11Share of elders 0.05 0.09 0.05 0.00 0.06 0.13 0.08 0.00Livestock pc 311.34 362.29 50.95 0.09 324.74 172.06 -152.67 0.00Food insecurity 3.11 3.49 0.38 0.03 3.36 4.14 0.79 0.00Office 0.38 0.45 0.08 0.05 0.40 0.43 0.02 0.50
Elsa Valli (University of Sussex) Targeting of aid in rural Ethiopia March 20, 2017 18 / 22
Conclusions
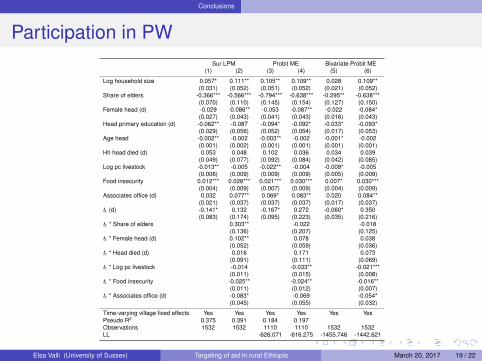
Participation in PWSur LPM Probit ME Bivariate Probit ME
(1) (2) (3) (4) (5) (6)
Log household size 0.057* 0.111** 0.105** 0.109** 0.028 0.109**(0.031) (0.052) (0.051) (0.052) (0.021) (0.052)
Share of elders -0.366*** -0.566*** -0.794*** -0.638*** -0.295** -0.638***(0.070) (0.110) (0.145) (0.154) (0.127) (0.150)
Female head (d) -0.029 -0.086** -0.053 -0.087** -0.022 -0.084*(0.027) (0.043) (0.041) (0.043) (0.016) (0.043)
Head primary education (d) -0.062** -0.087 -0.094* -0.092* -0.033* -0.093*(0.029) (0.056) (0.052) (0.054) (0.017) (0.053)
Age head -0.002** -0.002 -0.003** -0.002 -0.001* -0.002(0.001) (0.002) (0.001) (0.001) (0.001) (0.001)
Hh head died (d) 0.053 0.048 0.102 0.036 0.034 0.039(0.049) (0.077) (0.092) (0.084) (0.042) (0.085)
Log pc livestock -0.013** -0.005 -0.022** -0.004 -0.009* -0.005(0.006) (0.009) (0.009) (0.009) (0.005) (0.009)
Food insecurity 0.012*** 0.028*** 0.021*** 0.030*** 0.007* 0.030***(0.004) (0.009) (0.007) (0.009) (0.004) (0.009)
Associates office (d) 0.032 0.077** 0.069* 0.083** 0.020 0.084**(0.021) (0.037) (0.037) (0.037) (0.017) (0.037)
t1 (d) -0.141* 0.132 -0.167* 0.272 -0.060* 0.350(0.083) (0.174) (0.095) (0.223) (0.035) (0.216)
t1 * Share of elders 0.303** -0.022 -0.018(0.136) (0.207) (0.125)
t1 * Female head (d) 0.102** 0.078 0.038(0.052) (0.059) (0.036)
t1 * Head died (d) 0.016 0.171 0.073(0.091) (0.111) (0.069)
t1 * Log pc livestock -0.014 -0.033** -0.021***(0.011) (0.015) (0.008)
t1 * Food insecurity -0.025** -0.024** -0.016**(0.011) (0.012) (0.007)
t1 * Associates office (d) -0.083* -0.069 -0.054*(0.045) (0.055) (0.032)
Time-varying village fixed effects Yes Yes Yes Yes Yes YesPseudo R2 0.375 0.391 0.184 0.197Observations 1532 1532 1110 1110 1532 1532LL -626.071 -616.275 -1455.746 -1442.621
Elsa Valli (University of Sussex) Targeting of aid in rural Ethiopia March 20, 2017 19 / 22

Conclusions
Amount of PWTwo-Part OLS SUR Two-Part OLS Tobit(1) (2) (3) (4) (5) (6)
Log household size 0.538*** 0.255** 0.603*** 0.536*** 0.439*** 0.349**(0.080) (0.107) (0.114) (0.154) (0.162) (0.152)
Share of elders -0.263 -0.350 -1.371*** -1.562*** -2.770*** -2.326***(0.342) (0.461) (0.306) (0.362) (0.626) (0.569)
Female head (d) -0.026 -0.040 -0.146 -0.247** -0.156 -0.282**(0.063) (0.085) (0.094) (0.120) (0.117) (0.121)
Head primary education (d) 0.138 0.177 -0.019 0.118 -0.184 -0.168(0.088) (0.126) (0.100) (0.155) (0.141) (0.131)
Age head -0.003 0.003 -0.007* -0.002 -0.007* -0.001(0.002) (0.003) (0.004) (0.004) (0.004) (0.004)
Hh head died (d) 0.096 0.024 0.206 0.102 0.316 0.123(0.085) (0.105) (0.165) (0.215) (0.250) (0.211)
Log pc livestock 0.008 0.004 -0.018 0.003 -0.060** -0.004(0.018) (0.022) (0.019) (0.027) (0.027) (0.024)
Food insecurity 0.016 0.013 0.027 0.065** 0.061*** 0.078***(0.013) (0.018) (0.018) (0.027) (0.023) (0.024)
Associates office (d) 0.120* 0.104 0.111 0.181 0.191* 0.205*(0.062) (0.077) (0.087) (0.111) (0.112) (0.106)
t1 (d) 1.153*** 0.434 0.443 0.987 -0.289 0.905(0.271) (0.493) (0.419) (0.716) (0.342) (0.756)
t1 * Share of elders -0.120 0.339 -0.174(0.628) (0.564) (1.202)
t1 * Female head (d) 0.015 0.187 0.447(0.122) (0.186) (0.325)
t1 * Head died (d) 0.324 0.286 0.992(0.208) (0.321) (0.637)
t1 * Log pc livestock 0.007 -0.033 -0.212***(0.030) (0.038) (0.074)
t1 * Food insecurity 0.009 -0.062* -0.082(0.024) (0.037) (0.057)
t1 * Associates office (d) 0.056 -0.152 -0.178(0.124) (0.162) (0.280)
Constant 1.223*** 1.519*** 1.352*** 1.058**(0.330) (0.379) (0.376) (0.464)
Time-varying village fixed effects Yes Yes Yes Yes Yes YesPseudo/Adj R2 0.751 0.760 0.576 0.580 0.112 0.119Observations 587 587 1045 1045 1110 1110
Elsa Valli (University of Sussex) Targeting of aid in rural Ethiopia March 20, 2017 20 / 22
Conclusions
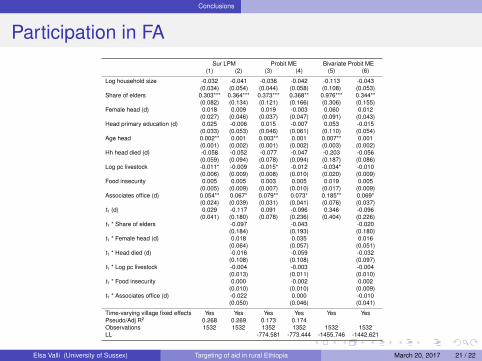
Participation in FASur LPM Probit ME Bivariate Probit ME
(1) (2) (3) (4) (5) (6)
Log household size -0.032 -0.041 -0.036 -0.042 -0.113 -0.043(0.034) (0.054) (0.044) (0.058) (0.108) (0.053)
Share of elders 0.303*** 0.364*** 0.373*** 0.368** 0.976*** 0.344**(0.082) (0.134) (0.121) (0.166) (0.306) (0.155)
Female head (d) 0.018 0.009 0.019 -0.003 0.060 0.012(0.027) (0.046) (0.037) (0.047) (0.091) (0.043)
Head primary education (d) 0.025 -0.006 0.015 -0.007 0.053 -0.015(0.033) (0.053) (0.046) (0.061) (0.110) (0.054)
Age head 0.002** 0.001 0.003** 0.001 0.007** 0.001(0.001) (0.002) (0.001) (0.002) (0.003) (0.002)
Hh head died (d) -0.058 -0.052 -0.077 -0.047 -0.203 -0.056(0.059) (0.094) (0.078) (0.094) (0.187) (0.086)
Log pc livestock -0.011* -0.009 -0.015* -0.012 -0.034* -0.010(0.006) (0.009) (0.008) (0.010) (0.020) (0.009)
Food insecurity 0.005 0.005 0.003 0.005 0.019 0.005(0.005) (0.009) (0.007) (0.010) (0.017) (0.009)
Associates office (d) 0.054** 0.067* 0.079** 0.073* 0.185** 0.069*(0.024) (0.039) (0.031) (0.041) (0.076) (0.037)
t1 (d) 0.029 -0.117 0.091 -0.096 0.346 -0.096(0.041) (0.180) (0.078) (0.236) (0.404) (0.226)
t1 * Share of elders -0.097 -0.043 -0.020(0.184) (0.193) (0.180)
t1 * Female head (d) 0.018 0.035 0.016(0.064) (0.057) (0.051)
t1 * Head died (d) -0.016 -0.059 -0.032(0.108) (0.108) (0.097)
t1 * Log pc livestock -0.004 -0.003 -0.004(0.013) (0.011) (0.010)
t1 * Food insecurity 0.000 -0.002 0.002(0.010) (0.010) (0.009)
t1 * Associates office (d) -0.022 0.000 -0.010(0.050) (0.046) (0.041)
Time-varying village fixed effects Yes Yes Yes Yes Yes YesPseudo/Adj R2 0.268 0.269 0.173 0.174Observations 1532 1532 1352 1352 1532 1532LL -774.581 -773.444 -1455.746 -1442.621
Elsa Valli (University of Sussex) Targeting of aid in rural Ethiopia March 20, 2017 21 / 22

Conclusions
Amount of FATwo-Part OLS SUR Two-Part OLS Tobit(1) (2) (3) (4) (5) (6)
Log household size 0.207*** 0.364*** 0.023 0.129 -0.013 -0.024(0.080) (0.107) (0.091) (0.143) (0.099) (0.128)
Share of elders 0.020 -0.287 0.887*** 1.062*** 0.630*** 0.581*(0.152) (0.231) (0.213) (0.348) (0.218) (0.296)
Female head (d) 0.020 0.029 0.093 0.110 0.056 0.029(0.063) (0.082) (0.079) (0.127) (0.085) (0.107)
Head primary education (d) -0.057 -0.090 0.121 0.151 0.019 -0.052(0.084) (0.122) (0.087) (0.169) (0.100) (0.133)
Age head -0.000 0.002 0.008*** 0.006 0.007** 0.004(0.002) (0.003) (0.003) (0.004) (0.003) (0.004)
Hh head died (d) -0.046 -0.155 -0.219 -0.263 -0.181 -0.130(0.128) (0.181) (0.157) (0.247) (0.159) (0.197)
Log lagged pc livestock value 0.001 0.002 -0.012 -0.016 -0.035** -0.023(0.012) (0.014) (0.016) (0.024) (0.018) (0.022)
Food insecurity 0.004 0.006 -0.003 -0.008 0.005 0.012(0.012) (0.020) (0.016) (0.028) (0.016) (0.022)
Associates office (d) -0.061 -0.020 0.064 0.114 0.134* 0.156(0.054) (0.077) (0.073) (0.107) (0.074) (0.098)
t1 (d) 0.452*** 1.222*** 0.313* 0.682 0.362* -0.103(0.156) (0.421) (0.178) (0.519) (0.210) (0.744)
t1 * Share of elders 0.520 -0.317 0.194(0.318) (0.462) (0.208)
t1 * Female head (d) -0.012 -0.037 0.091(0.127) (0.174) (0.093)
t1 * Head died (d) 0.278 0.132 -0.231*(0.258) (0.314) (0.130)
t1 * Log pc livestock -0.004 0.011 0.005(0.023) (0.031) (0.015)
t1 * Food insecurity -0.003 0.006 0.005(0.024) (0.033) (0.014)
t1 * Associates office (d) -0.082 -0.115 -0.030(0.108) (0.133) (0.069)
Constant 1.085*** 0.658** 1.352*** 1.058**(0.217) (0.277) (0.376) (0.464)
Time-varying village fixed effects Yes Yes Yes Yes Yes YesPseudo/Adj R2 0.416 0.420 0.259 0.263 0.085 0.129Observations 660 660 1045 1045 1352 1352
Elsa Valli (University of Sussex) Targeting of aid in rural Ethiopia March 20, 2017 22 / 22