Embed Size (px)
Citation preview

Dominique P. Bureau
Workshop on Alternative Feed Protein Sources
Assessment of the Nutritive Value
of Processed Animal Proteins for Fish

Processed animal protein ingredients, such as blood meal, feather meal, meat and
bone meal, and poultry by-products meal, compare favorably cost-wise with many
other types of protein sources commonly used in fish feeds. Useful sources of
nutrients, such as essential amino acids, phosphorus, and various minor nutrients
(micro-minerals, phospholipids, cholesterol, etc.)
Accurately characterization of the nutritive value of the different types of
processed animal proteins available on the market is essential to optimize their use
in feeds.
Introduction
Feedstuffs Crude Protein
%
Price$/tonne
Price$/tonne
Crude Protein
Price $/tonne
Digestible protein
Fish Meal 60 900 1500 1667
Rapeseed (Canola) Meal 38 289 761 963
Corn Gluten Meal 60 500 833 868
Soybean Meal 48 369 761 802
Meat and Bone Meal 50 310 609 775
Feather Meal 83 355 426 570

Apparent Digestibility of Feather Meals
Guelph System
ADC
Protein Energy
82-84% N/ASugiura et al. (1998)
58% 70%Cho et al. (1982)
Stripping
81-87% 76-80%Bureau (1999)
83% 81%Pfeffer et al. (1995)
HCl hydrolyzed feather meal
Data obtained using the same facilities and methodology. There is value in using standard methodological approaches consistently over many years.

Processed animal proteins are produced using different mix of raw materials and
processing equipment and conditions. This may result in inherent differences in the
chemical composition and nutritive value for different “batches” of the “same”
ingredient.
Assessment of nutritional value of processed animal proteins has focused on
apparent digestibility of proximate components (dry matter, crude protein, gross
energy) and very seldom on that of specific nutrients (e.g. as essential amino acids).
Lots of research. However, in most feeding trials, the control diet is formulated
with high fish meal levels (> 30% ) and all essential nutrients are supplied greatly
in excess of requirements. The test ingredient is included at graded levels and effect
on growth performance is monitored. The “absence of effect” of the test ingredient
is the “standard”. Yet, the “absence of effect” is highly dependent on the
composition of the diet used.
Need to refine methodological approaches to focus on meaningfully assessing the
available nutrients composition of ingredients.
State-of-The-Art and Limitations

Wang et al. (2010)
Effect of replacement of a fish meal by a mixture of processed animal proteins in feeds
formulated to two different protein levels
At higher protein levels, essential amino acids (EAA) deficiencies occur at lower fish meal (higher alternative ingredient) levels. It is the EAA intakes that matter, not the “fish meal level” or “relative level” of essential amino acids of the diet (as % protein).
“Fish Meal Replacement” is Something Highly Relative

Adequately Characterizing the Chemical Composition and Nutritive Value of Ingredients

Cheng and Hardy (2002)
Nutrient Composition of Different Fish Meals and Poultry by-Products Meals
Fish meal Poultry by-Products Meal
Composition Herring Menhaden Feed-grade Prime Refined
Dry matter, % 93 91 97 96 97
Crude Protein, % 71 61 62 66 70
Crude fat, % 9 9 11 8 10
Ash, % 12 22 15 15 11
Phosphorus, % 2.4 3.1 2.6 2.8 2.0
Lysine, % 5.4 4.2 3.7 3.7 4.6
Methionine, % 1.8 1.5 1.2 1.3 1.5
Histidine, % 2.2 1.2 1.4 1.2 1.5
Threonine, % 3.1 2.4 2.5 2.4 3.0
Fish meal is not fish meal and poultry by-products meal is not poultry by-products meal.These are generic names that regroup ingredients that can be widely different.

Fish meal Poultry by-Products Meal
Component Herring Menhaden Feed-grade Prime Refined
%
Dry matter 81 71 71 72 75
Crude Protein 90 86 83 85 87
Crude fat 92 91 80 83 80
Phosphorus 58 47 49 46 56
Lysine 95 95 89 92 93
Methionine 95 95 92 95 94
Histidine 92 93 85 89 89
Threonine 90 92 82 85 85
Apparent Digestibility of Nutrients of Different Fish Meals and Poultry By-Products Meals
Cheng and Hardy (2002)
Information on EAA content and digestibility is extremely meaningful for the formulation of cost-effective feeds

Processing Conditions Affects the Nutritive Value ofProcessed Animal Proteins

Blood Meal
Guelph System
ADC
Protein Energy
96-99% 92-99%Spray-dried blood meal
85-88% 86-88%Ring-dried blood meal
84% 79%Steam-tube dried blood meal
Bureau et al. (1999)
82% 82%Rotoplate dried blood meal
Different drying equipments can greatly affect apparent digestibility

Limitations of Apparent Digestibility as a Measure of Nutritive Value
Apparent digestibility is a measure of “disappearance” of nutrients but not a direct measure of the amount of nutrient available
Heat damaged amino acids may be digestible but not available
Should validate estimate of digestibility with more direct assessment of the bioavailability of nutrients in feed ingredients
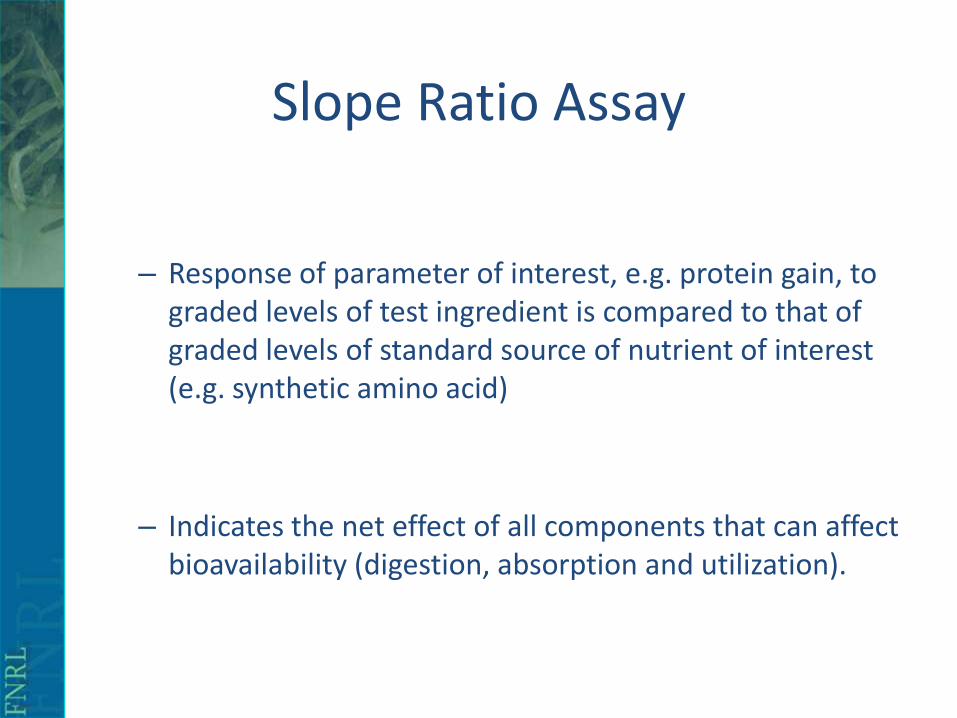
Slope Ratio Assay
– Response of parameter of interest, e.g. protein gain, to graded levels of test ingredient is compared to that of graded levels of standard source of nutrient of interest (e.g. synthetic amino acid)
– Indicates the net effect of all components that can affect bioavailability (digestion, absorption and utilization).

1.0
1.5
2.0
90.0
100.0
110.0
120.0
130.0
140.0
0.5 1.0 1.5 2.0 2.5
Lysine intake (g/fish)
FB
W(g
ifis
h)
Spray
Flash
Disk
Lys+DiCal
Final Body Weight - Lysine Bio-Availability Trial
Shows that differences exist in the bioavailability of lysine in blood meals produced with different drying equipment
El Haroun and Bureau (2006)

Bureau et al. (1999)
Processing Conditions ADC
(provided by manufacturers) DM CP GE
%
1 Steam hydrolysis, 30 min at 276 kPa, disc dryer 82 81 80
2 Steam hydrolysis, 5 min at 448 kPa, disk dryer 80 81 78
3 Steam hydrolysis, 40 min at 276 kPa, ring dryer 79 81 76
4 Steam hydrolysis, 40 min at 276 kPa, steam-tube dryer 84 87 80
Apparent Digestibility of Feather Meals from Various Origins to Rainbow Trout

Formulation of Experimental Diets Used in Feather Meal Trial
Ingredients Diet1 2 3 4 5 6 7 8
Herring meal 50 35 35 35 50 40 30 20
Blood meal, tube-dried 10 10 10 10 6 9 12 15
Feather meal 1 15
Feather meal 2 15
Feather meal 4 15 8 12 16 20
Corn gluten meal 10 10 10 10 6 9 12 15
Whey 12 12 12 12 12 12 12 12
Vitamins + minerals 3 3 3 3 3 3 3 3
Fish oil 15 15 15 15 15 15 15 15

Performance of rainbow trout fed diets with different feather meals
Diet Gain Feed FE RN RE
g/fish g/fish g/fish kJ/fish
1- Control 73.5 ab 51.6 1.42 ab 1.9 a 587 a
2- 15% FEM 1 74.3 ab 51.4 1.44 a 1.9 a 553 a
3- 15% FEM 2 71.1 bc 52.0 1.37 bc 1.8 a 561 a
4- 15% FEM 4 73.0 abc 52.3 1.40 abc 1.9 a 547 a
5- 20% FEM-CGM-BM 74.5 a 51.8 1.44 a 1.9 a 574 a
73.2 abc 51.7 1.42 abc 1.9 a 554 a
73.3 abc 52.2 1.41 abc 1.9 a 579a
70.1 c 51.8 1.35 c 1.8 a 537a
G:F
6- 30% FEM-CGM-BM
8- 50% FEM-CGM-BM
7- 40% FEM-CGM-BM
Could not highlight differences in the nutritive value of feather meals with different digestible protein levels. Diets 2-4 contained at least 35% fish meal.

Trial #1 – Bioavailability of Arginine in Feather Meal using a Slope-Ratio Assay - Formulation of the Experimental Diets
Ingredient Diet 1 Diet 2 Diet 3 Diet 4 Diet 5 Diet 6 Diet 7 Diet 8 Diet 9
Skim milk powder 20 20 20 20 20 18 16 14 12
Corn gluten meal 32 32 32 32 32 28 24 20 16
L-arginine 0.1 0.2 0.3 0.4
Feather meal 6 12 18 24
Calculated Composition (% DM)
CP 40.3 40.4 40.5 40.6 40.7 40.6 40.8 41.0 41.2
Lipid 21.0 21.0 21.0 21.0 21.0 21.0 21.0 21.0 21.1
Arg (digestible) 1.19 1.30 1.40 1.51 1.61 1.31 1.42 1.53 1.64
Diet Arg Lys Met+ Cys
ThrPhe+Tyr
His Val Leu Ile
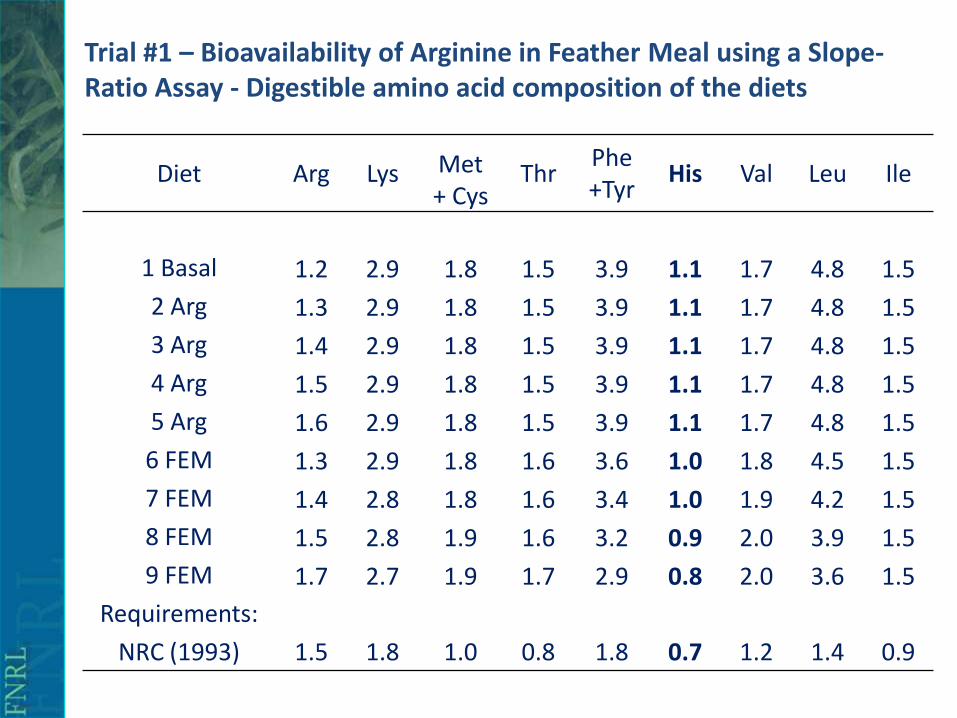
1 Basal 1.2 2.9 1.8 1.5 3.9 1.1 1.7 4.8 1.5
2 Arg 1.3 2.9 1.8 1.5 3.9 1.1 1.7 4.8 1.5
3 Arg 1.4 2.9 1.8 1.5 3.9 1.1 1.7 4.8 1.5
4 Arg 1.5 2.9 1.8 1.5 3.9 1.1 1.7 4.8 1.5
5 Arg 1.6 2.9 1.8 1.5 3.9 1.1 1.7 4.8 1.5
6 FEM 1.3 2.9 1.8 1.6 3.6 1.0 1.8 4.5 1.5
7 FEM 1.4 2.8 1.8 1.6 3.4 1.0 1.9 4.2 1.5
8 FEM 1.5 2.8 1.9 1.6 3.2 0.9 2.0 3.9 1.5
9 FEM 1.7 2.7 1.9 1.7 2.9 0.8 2.0 3.6 1.5
Requirements:
NRC (1993) 1.5 1.8 1.0 0.8 1.8 0.7 1.2 1.4 0.9
Trial #1 – Bioavailability of Arginine in Feather Meal using a Slope-Ratio Assay - Digestible amino acid composition of the diets

y = -53.494x2 + 178.76x - 97.086R² = 0.8378
y = -93.263x2 + 257.86x - 135.92R² = 0.7732
30
35
40
45
50
55
1.1 1.2 1.3 1.4 1.5 1.6 1.7
Weig
ht
Gain
(g
/fis
h)
Arginine (% DM)
Synthetic Arg
Feather Meal
Trial #1 - Weight gain of rainbow trout in response to
increase dietary arginine supplied as L-arginine or feather
meal
Poppi (2010)

y = -0.03x2 + 0.32x + 0.67
R2 = 0.80
y = -1.42x2 + 4.40x - 2.23
R2 = 0.94
1.000
1.050
1.100
1.150
1.200
1.250
1.1 1.2 1.3 1.4 1.5 1.6 1.7Arginine (%DM)
Feed
Eff
icie
ncy R
ati
o
Synthetic Arg
Feather Meal
Trial #1 - Feed efficiency (gain:feed) in response to increase dietary
arginine supplied as L-arginine or feather meal
Poppi (2010)

Trial #1 - Conclusions
Fish responded well to basal diet supplementation with L-arginine
Weight gain of fish did not respond to increasing arginine supplied by feather
meal
Interestingly, feed efficiency improved very significantly with increasing
levels of feather meal. This means that overall, the “nutrients” (energy) in
feather meal were well utilized
Experimental diets formulated to meet all EAA requirements according to
NRC (1993) levels with large safety margin for all essential amino acids (e.g.
all diets apparently 15-30% above histidine requirement according to NRC
(1993))
Obviously overlooked something. May be one or two essential amino acids are
deficient. Supplementation feather meal diets with various essential EAA to
find out which one likely missing.

Diet Original Diet – Trial #1 SupplementWeight gain
g/fish
1 Diet 1 – 1.3% Arginine None 64.1
2 Diet 4 -1.6% Arg, (L-Arg) None 75.5
3 “ + 0.5% DL Methionine 68.0
4 “ + 4% EAA mix (no Met, no Arg) 73.1
5 “ + 4% EAA + 0.5% DL Met 65.1
6 Diet 8 – 2.1% Arg (FEM) None 72.3
7 “ + 0.5% DL Methionine 68.2
8 “ + 4% EAA mix (no Met, no Arg) 81.2*
9 “ + 4% EAA + 0.5% DL Met 74.5
* Significant different from Diet 6
Trial #2 – Supplementation of Trial #1 Diets with various EAA supplements

Traditional (simplistic) experimental design have suggested that feather meal is an ingredient with “poor” or “variable” quality.
A slightly more elaborate methodological approaches suggest that issue may simply be low available levels of specific EAA in feather meal and poor characterization of EAA requirements of fish
This is easily addressed through feed formulation (use of synthetic amino acids, use of complementary protein sources).
Take Home Message:
Researchers: Meaningfully characterize the available nutrient contents of different processed animal proteins
Feed formulators: Formulate (least-cost) feed on a digestible or available nutrient compositions. Beware of reference (table) values.
Conclusion

Acknowledgements
- Dr. Li Peng, National Renderers Association – HK Office
- Fats and Proteins Research Foundation
- Ontario Ministry of Agriculture, Food and Rural Affairs
- Ontario Ministry of Natural Resources
- NSERC
- EVONIK Degussa
- Martin Mills
-- Canadian Rendering Industry

Extra Slides

Feather Meal

Disulfide Bonds
Certain natural proteins, such as keratins, contain many disulfide bonds. These bonds are very stable. Moist heat + pressure can break disulfide bonds
Raw feather and hair (>90% keratins) Apparent digestibility coefficient of CP= 0%
Feather, steam hydrolyzed (steam + pressure) Apparent digestibility coefficient of CP > 70%
Different processing conditions can affect digestibility:
-Variations in ADC of crude protein of up to 15% between feather meal processed using different conditions in poultry (Latshaw et al., 1994; Moritz and Latshaw, 2001)
-Fine balance between sufficient hydrolysis and over-processing

Bureau et al. (1999)
Processing Conditions ADC
(provided by manufacturers) DM CP GE
%
1 Steam hydrolysis, 30 min at 276 kPa, disc dryer 82 81 80
2 Steam hydrolysis, 5 min at 448 kPa, disk dryer 80 81 78
3 Steam hydrolysis, 40 min at 276 kPa, ring dryer 79 81 76
4 Steam hydrolysis, 40 min at 276 kPa, steam-tube dryer 84 87 80
Apparent Digestibility of Feather Meals from Various Origins to Rainbow Trout