Embed Size (px)
Citation preview

Investigation of Sensory Gating Processes in First-Episode Schizophrenia Patients and Their Healthy Siblings with Event-Related Potentials (ERPs)
ERDIL ARSOY
ADVISOR: PROF. MUGE DEVRIM UCOK
Master Thesis in Neuroscience
Istanbul University, Institute for Experimental and Medical Research - 2017

Index
1. Objective
2. General Information
3. Method
4. Results
5. Discussion & Conclusion
6. References

Objective
Attain significances in sensory gating processes among first-episode
schizophrenia patient, sibling and control groups
Evaluation of P50, N100 and P200 potentials via different methods
Enhance the number of healthy sibling and control groups in previous
TUBITAK Project (Devrim-Ucok et al 2008)

Symptoms are mostly manifest themselves as:
o hallucinations, delusions, disorganized speech and decreases in DLAs
o insidious beginning
o slow and gradually increasing symptoms
Life-time prevalence % 0.3 – 0.7
Possibly start at late-adolescence in men and adulthood in women (APA 2013)
General InformationSchizophrenia

Keshavan & Schooler (1992) stated five clinical features for FES:
i. Decrease in social skills
ii. Onset of behavioral symptoms
iii. Onset of positive and negative symptoms
iv. First treatment
v. First hospitalization
General InformationFirst-Episode Schizophrenia

CNS’s ability of inhibit incoming irrevelant stimuli
and facilitate important ones
Standart measure of sensory gating is P50
P50 sensory gating is evaluated via paired-click
paradigm (PCP)
o S1 conditioning stimulus; S2 test stimulus
o S2/S1 ratio/S1-S2 difference
o Decreased ratio/high difference = successful gating
(Turetsky et al 2008)
Paired-Click Paradigm
General InformationSensory Gating

Abnormal P50 gating with PCP in schizophrenia is:
Potential endophenotype
«Fixed trait» associated with genetic features
Hereditable
Predispositional on unaffected siblings
General InformationP50 Gating Paradigm
(Lijffijt et al 2009)

Gating ratio and difference may measure brain stem, hippocampus and cerebral cx gating
S1 stimulus may be a neural response of synaptic activation of auditory cortex
interneural GABA oscillation
inhibition of S2 stimulus response
General InformationP50 Gating Paradigm

Some of medication studies state that:
• Patients with typical antipsychotic and non-medicated patients shows similar gating processes
(Boutros et al 2004)
• However, patients who were treated with atypical antipsychotics show improvement in gating
processes (Nagamoto et al 1999)
Therefore recent studies:
• Designed with early phase of illness as FES and prodromal
• Thus long-term impairments caused by cronicity can be eliminated (Devrim-Ucok et al 2008).
General InformationP50 Gating Paradigm

ERP indentified between 70-110 ms
Band-pass filter of 10-55 Hz
Patterson et al (2009) found:
• S1 and S2 peaks are similar in bipolar I disorder
patients but not in schizophrenia spectrum
disorder patients
• Therefore, P85 may not be an endophenotype for
schizophrenia but for bipolar I disorder
(Patterson et al 2009)
General InformationP85 Gating Paradigm

Represent higher cognitive functions and
further levels of information processes
Recent studies found that:
o Ultra-high risk patients show unsufficient gating
by comparison with healthy controls (Brockhaus-
Dumke et al 2008)
o More reliable than P50 (Rentzsch et al 2008)
o Hereditable (Anokhin et al 2006)(Lijffijt et al 2009)
General InformationN100/P200 Gating Paradigm

1. Latency
o 40-80 ms (Boutros et al 2004); 25-75 ms; 40-75
ms (Patterson et al 2008); 40-90 ms (Nagamoto
et al 1999); 40-85 ms (Clementz & Blumenfeld
2001)
2. P30/N40
o P30 15-40 ms, Pa, possible artifact (?)
(Nagamoto et al 1999)
o N40 25-60 ms, Nb (van Tricht et al 2012)(Rentzsch et al 2008)
General InformationMethodological Differences
Several methods are used in attempt to measure sensory gating:

3. Average
o S2/S1 ratio & S1-S2 difference
o Difference may be more reliable (Smith et al 1994)
o Difference and ratio might be interrelated (Peters et al 2014)
4. Amplitude
o Peak to peak (PP) standart measure of P50 and P85
o Baseline to peak (BP) standart measure of N100 and P200
o BP might be more reliable than PP with S2/S1 ratio measure (Rentzsch et al 2008)
General InformationMethodological Differences

Within the scope of previous TUBITAK project:
o 32 healthy controls (HC), 20 FES patients and
20 healthy siblings (HS)
For master thesis:
o 9 healthy controls, 2 FES patients and
1 healthy siblings were included
HC (n=41) HS (n=27) FES (n=45)
Age (average±s.d) 21.2±5.4 22.4±5.9 22.7±5.4
Gender (F/M) 15/26 18/9 16/29
Education (average±s.d) 11.2±3.0 10.2±2.6 10.1±3.3
Hand Dominance (L/R) 37/4 22/5 42/3
MethodParticipants

FES patients
o Evaluated with SCID-I (First et al 1997)
o No psychotic episodes and admission to clinic
o Medication < 15 days
HS & HC
o SCID-I non-patient version
o For HS; no medical history of psychiatric ilness and drug use
o For HC; no medical history of psychiatric illness among first-degree relatives
MethodParticipants

Duration of clicks 4 ms
500 ms interval between S1 & S2
Average interval between click pairs 10 sec (8-12)
Click density 80 dB with headphones
30 of click pairs on each block
Ends with 85 of artifact-free recording
MethodSensory Gating Paradigm

Ag–AgCl electrodes placed at Cz & Fz according to 10–
20 system: Oz, O1, O2, Pz, P3, P4, Cz, C3, C4, T7, T8,
Fz, F3, F4
2 EOG electrodes placed below infraorbital ridge &
above eyebrow of the right eye
Impedance < 10 kΩ
Band-pass filter of 0.1 - 70 Hz
Digitilised at 256 Hz (Devrim-Ucok et al 2008)
http://www.bem.fi/book/13/13.htm
MethodERP Recording

EEG/EOG voltages exceeded ± 90 μV were rejected automatically
Muscle/eye and alpha/theta activites were eliminated visually
250 ms before S1 and 1000 ms after S2 were epoched and averaged
Averaged P50 and P85 data were filtered with a band-pass filter of 10-49 Hz (Croft et al 2004)
Averaged N100 and P200 data were filtered with a band-pass filter of 0.5-20 Hz (Boutros et al 2008)
MethodData Analysis

For peak to peak (PP) P50 measures 3 different parameters utilized:
o Largest positive deflection between: 40-80 ms (Boutros et al 2004), 40-85 ms (Clementz and
Blumenfeld 2001) and 40-90 ms (Nagamoto et al 1999)
For baseline to peak (BP) P50 measure:
o Only 40-90 ms latency utilized
o A 50 ms pre-stimulus baseline was referenced for both S1 & S2 (Peters et al 2014)
S2 P50 response:
o For S2 the most positive deflection within ±15 ms latency corresponding to S1
o If S2 response could not be found within ±15 ms assumed to be completely atteunated and a 0.01 mV
amplitude utilized (Boutros et al 2004)
MethodData Analysis – P50

MethodData Analysis – P85
For peak to peak (PP) P85 measure:
o Most positive deflection within 70-110 ms
o Negative peak following 40-80 ms P50 as the trough for P85
o A band-pass filter of 10-48 Hz (Patterson et al 2009)
S2 P50 response:
o For S2 the most positive deflection within ±15 ms latency corresponding to S1
o If S2 response could not be found within ±15 ms assumed to be completely atteunated and
a 0.01 mV amplitude utilized (Boutros et al 2004)

MethodData Analysis – N100 & P200
For PP and BP N100 measures:
o Largest negative deflection between 60-170 ms
For PP and BP P200 measures:
o Largest positive deflection between 100-260 ms
o Both N100 & P200 peaks had to be visually distinguishable from baseline (Rentzsch et al 2008)
S2 response:
o For N100 S2 response the most negative deflection within ±40 ms latency corresponding to S1
o For P200 S2 response the most positive deflection within ±40 ms latency corresponding to S1
o If S2 response could not be found within ±40 ms assumed to be completely atteunated and a 0.01 mV
amplitude utilized (Boutros et al 2004)

Sensory gatings were obtained via Cz & Fz channels:
o Evaluated both with S2/S1 ratio and S1-S2 difference
o Gating ratios above 2 (100% facilitation) was converted to 2 to prevent outliers from disproportionate affect
on group meaning (Nagamoto et al 1991)
To determine normally distributed values Kolmogorov-Smirnov/Shapiro-Wilk tests was used
Parameters were assessed with repeated measures ANOVA (Devrim-Üçok et al 2008):
o Post hoc repeated measure t -tests were applied to assess differences within groups
o An overall %5 value was used to deduce for statistical significance (Hayran 2011), p values relatively high
from 0,05 was included to analysis (statistical trend)
MethodStatistical Analysis

Group differences observed in S1 P50 amplitudes [group:
F(2.85)=3.569, p=0.032]. Post-hoc tests revealed that P50
amplitudes significantly reduced in FES patients
compared to HS (p=0.049) and HC (p=0.028)
ResultsP50 (40-85 ms)
Healthy Controls(n=36)
Healthy Siblings(n=20)
FES Patients(n=33)
Cz Fz Cz Fz Cz Fz
S1 amplitude(μV)
5.7 ± 2.3 4.8 ± 1.9 7.0 ± 3.4 5.2 ± 2.8 4.6 ± 2.2 3.8 ± 1.9

Group differences observed in PP N100 S1-S2 difference [group:
F(2.101)=3.059, p=0.051] (statistical trend). Post hoc tests revealed
that PP N100 differences reduced in FES patients compared to HC
(p=0.074) (statistical trend). However, this reduction was significant
in FES patients and HS (p=0.025)
ResultsPeak to Peak N100
Healthy Controls(n=41)
Healthy Siblings(n=25)
FES Patients(n=39)
Cz Fz Cz Fz Cz Fz
N100 Differences
13.5±9.1 9.7±7.0 14.7±9.1 11.0±6.3 10.0±6.8 7.6±4.9
ResultsPeak to Peak N100
Healthy Controls(n=41)
Healthy Siblings(n=25)
FES Patients(n=39)
Cz Fz Cz Fz Cz Fz
N100 S1 amplitude (μV)
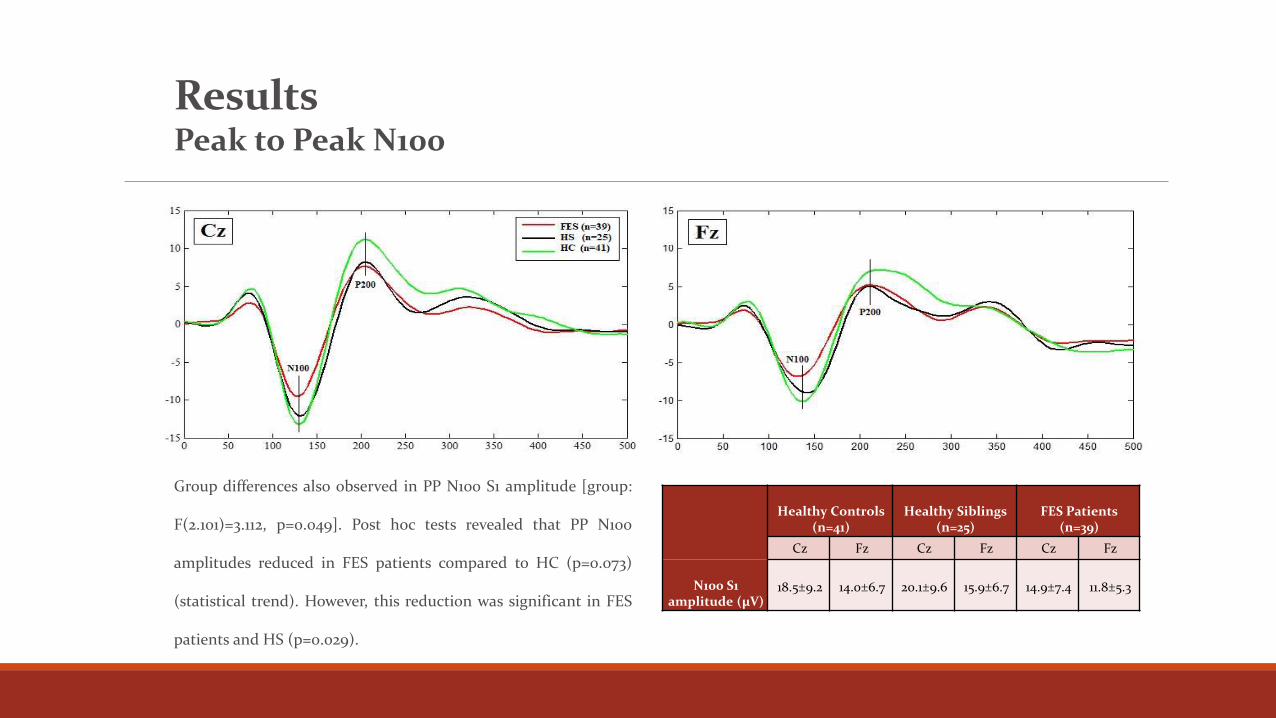
18.5±9.2 14.0±6.7 20.1±9.6 15.9±6.7 14.9±7.4 11.8±5.3
Group differences also observed in PP N100 S1 amplitude [group:
F(2.101)=3.112, p=0.049]. Post hoc tests revealed that PP N100
amplitudes reduced in FES patients compared to HC (p=0.073)
(statistical trend). However, this reduction was significant in FES
patients and HS (p=0.029).

ResultsPeak to Peak P200
Healthy Controls(n=41)
Healthy Siblings(n=25)
FES Patients(n=39)
Cz Fz Cz Fz Cz Fz
P200Differences
19.0±10.0 13.3±8.5 21.2±11.1 15.5±8.1 14.6±8.4 9.9±5.9
Group differences observed in PP P200 S1-S2 difference [group:
F(2.101)=4.604, p=0.012]. Post hoc tests revealed that PP P200
differences reduced in FES patients compared to HC (p=0.005) and
HS (p=0.036).

ResultsPeak to Peak P200
Healthy Controls(n=41)
Healthy Siblings(n=25)
FES Patients(n=39)
Cz Fz Cz Fz Cz Fz
P200 S1 amplitude (μV)
24.6±11.2 18.1±9.2 28.0±13.2 21.7±8.5 20.4±10.2 15.2±7.3
Group differences observed in PP P200 S1 amplitude [group:
F(2.101)=4.024, p=0.021]. Post hoc tests revealed that PP P200
amplitudes reduced in FES patients compared to HC (p=0.088)
(statistical trend). However, this reduction was significant in FES
patients and HS (p=0.011).

ResultsBaseline to Peak N100
Healthy Controls(n=40)
Healthy Siblings(n=25)
FES Patients(n=39)
Cz Fz Cz Fz Cz Fz
N100Differences
-9.9±7.7 -7.0±6.1 -10.9±7.1 -8.9±5.3 -7.2±4.9 -5.3±3.6
Group differences observed in BP N100 S1-S2 difference [group:
F(2.100)=3.165, p=0.046]. Post hoc tests revealed that BP N100
differences reduced in FES patients compared to HC (p=0.085) in
statistical trend and significantly in HS (p=0.020).
ResultsBaseline to Peak N100
Healthy Controls(n=40)
Healthy Siblings(n=25)
FES Patients(n=39)
Cz Fz Cz Fz Cz Fz
N100 S1 Amplitude (μV)
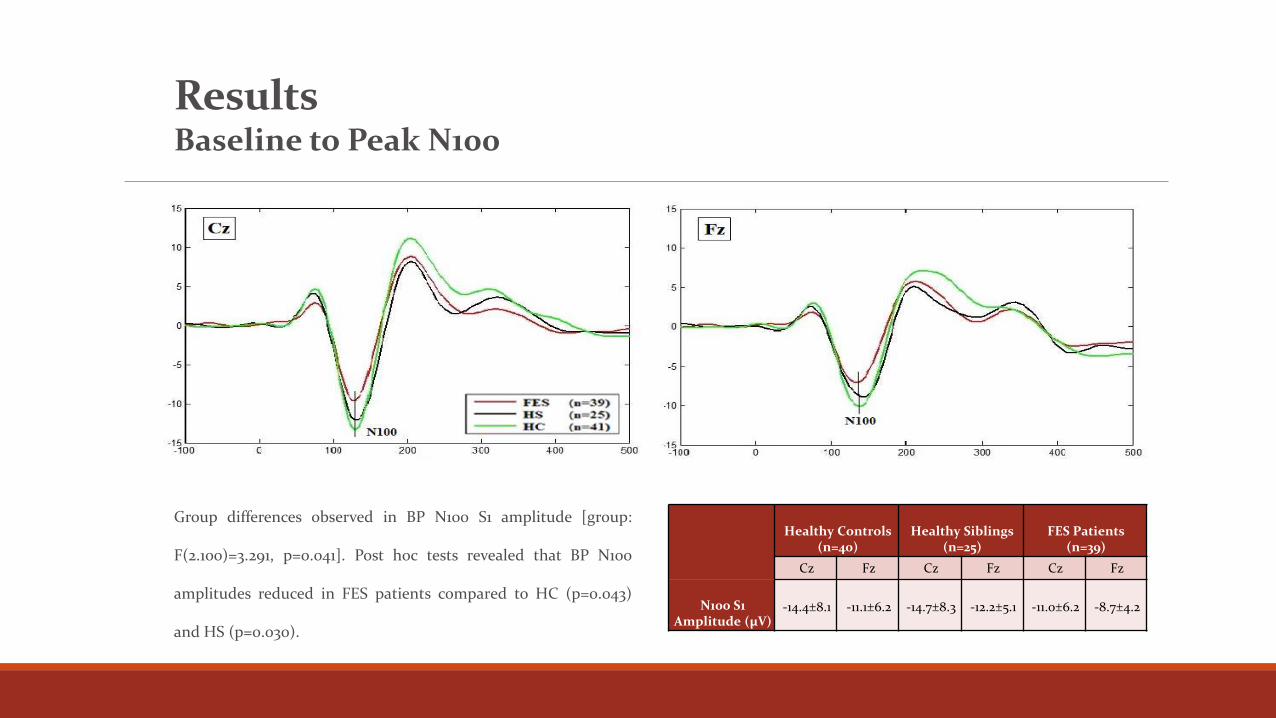
-14.4±8.1 -11.1±6.2 -14.7±8.3 -12.2±5.1 -11.0±6.2 -8.7±4.2
Group differences observed in BP N100 S1 amplitude [group:
F(2.100)=3.291, p=0.041]. Post hoc tests revealed that BP N100
amplitudes reduced in FES patients compared to HC (p=0.043)
and HS (p=0.030).

1. Peak to peak N100 ve P200 S1-S2 differences reduced in FES patients compared to healthy siblings and controls. It
would seem that PP N100 and P200 S1-S2 difference demonstrated better gating processes among patient and
healthy groups than S2/S1 ratio.
2. Correlatively baseline to peak N100 difference reduced in FES patients compared to healthy groups.
3. S1 N100 and P200 amplitudes found reduced in FES patients compared to healthy subjects both in PP and BP
measure parameters.
4. 40-80 ms, 40-85 ms and 40-90 ms P50 ratios and differences showed no significant difference among groups. Only
S1 40-85 ms P50 amplitudes reduced in FES patients compared to healthy subjects.
5. In P50 sensory gating evaluation three different latencies were utilized:
• 76 participants 40-80 ms P50 potentials coincide with 35 participants’ 40-85 ms and 34 participants’ 40-90 ms P50 potentials
• Likewise 92 participants’ 40-85 ms P50 potentials coincide with 74 participants’ 40-90 ms P50 potentials
• Hence in sensory gating studies one might measure different potentials with different latencies
Discussion & Conclusion
American Psychiatric Association (2013). Diagnostic and statistical manual of mental disorders (5th ed.). Washington, DC.
Anokhin, A. P., Vedeniapin, A. B., Heath, A. C., Korzyukov, O. & Boutros, N. N. (2007). Genetic and environmental influences on
sensory gating of mid-latency auditory evoked responses: a twin study. Schizophrenia research, 89(1), 312-319.
Boutros, N. N., Korzyukov, O., Jansen, B., Feingold, A. & Bell, M. (2004). Sensory gating deficits during the mid-latency phase of
information processing in medicated schizophrenia patients. Psychiatry Research, 126(3), 203-215.
Brockhaus-Dumke, A., Schultze-Lutter, F., Mueller, R., Tendolkar, I., Bechdolf, A., Pukrop, R., Klosterkoetter, J. & Ruhrmann, S. (2008).
Sensory Gating in Schizophrenia: P50 and N100 Gating in Antipsychotic-Free Subjects at Risk, First-Episode, and Chronic Patients.
Biological Psychiatry, 64(5), 376-384.
Clementz, B. A. & Blumenfeld, L. D. (2001). Multichannel electroencephalographic assessment of auditory evoked response suppression
in schizophrenia. Experimental Brain Research, 139(4), 377-390.
Croft, R. J., Dimoska, A., Gonsalvez, C. J. & Clarke, A. R. (2004). Suppression of P50 evoked potential component, schizotypal beliefs
and smoking. Psychiatry Research, 128(1), 53-62.
Devrim-Üçok, M., Keskin-Ergen, H. Y., & Üçok, A. (2008). P50 gating at acute and post-acute phases of first-episode schizophrenia.
Progress in Neuro-Psychopharmacology and Biological Psychiatry, 32(8), 1952-1956.
First, M. B., Spitzer, R. L., Gibbon, M. & Williams, J. B. W. (1997). Structured clinical interview for DSM-IV Axis I disorders (SCID-I),
Clinical Version. Washington, DC: American Psychiatric Press.
References

Hayran, M. (2011). Sağlık araştırmaları için temel istatistik. Omega Araştırma.
Keshavan, M. S., & Schooler, N. R. (1992). First-episode studies in schizophrenia: criteria and characterization. Schizophrenia Bulletin,
18(3), 491-513.
Lijffijt, M., Lane, S. D., Meier, S. L., Boutros, N. N., Burroughs, S., Steinberg, J. L., Moeller, F. G. & Swann, A. C. (2009). P50, N100, and
P200 sensory gating: Relationships with behavioral inhibition, attention, and working memory. Psychophysiology, 46(5), 1059-1068.
Nagamoto, H. T., Adler, L. E., Waldo, M. C., Griffith, J., & Freedman, R. (1991). Gating of auditory response in schizophrenics and
normal controls: effects of recording site and stimulation interval on the P50 wave. Schizophrenia research, 4(1), 31-40.
Nagamoto, H. T., Adler, L. E., McRae, K. A., Huettl, P., Cawthra, E., Gerhardt, G. & Griffith, J. (1999). Auditory P50 in schizophrenics on
clozapine: improved gating parallels clinical improvement and changes in plasma 3-methoxy-4-hydroxyphenylglycol.
Neuropsychobiology, 39(1), 10-17.
Patterson, J. V., Sandman, C. A., Ring, A., Jin, Y. & Jr., W. E. (2009). An initial report of a new biological marker for bipolar disorder: P85
evoked brain potential. Bipolar Disorders, 11(6), 596-609.
Peters, R. M., Gjini, K., Templin, T. N. & Boutros, N. N. (2014). A statistical methodology to improve accuracy in differentiating
schizophrenia patients from healthy controls. Psychiatry research, 216(3), 333-339.
Rentzsch, J., Jockers-Scherübl, M. C., Boutros, N. N. & Gallinat, J. (2008). Test–retest reliability of P50, N100 and P200 auditory sensory
gating in healthy subjects. International Journal of Psychophysiology. 67, 81–90.
References

Smith, D. A., Boutros, N. N. & Schwarzopf, S. B. (1994). Reliability of P50 auditory event‐related potential indices of sensory gating.
Psychophysiology, 31(5), 495-502.
Turetsky, B. I., Greenwood, T. A., Olincy, A., Radant, A. D., Braff, D. L., Cadenhead, K. S. & Gur, R. C. (2008). Abnormal auditory N100
amplitude: a heritable endophenotype in first-degree relatives of schizophrenia probands. Biological psychiatry, 64(12), 1051-1059.
van Tricht, M. J., Nieman, D. H., Koelman, J. H., Bour, L. J., van der Meer, J. N., van Amelsvoort, T. A. & de Haan, L. (2011). Auditory ERP
components before and after transition to a first psychotic episode. Biological psychology, 87(3), 350-357.
References