Embed Size (px)
Citation preview
Neuromonitoring in anesthesia
Classification of monitoring techniques:
The brain can be monitored in terms of:
Function
Cerebral blood flow (CBF) & intracranial pressure (ICP)
Brain oxygenation and metabolism
Monitoring of FUNCTION:
Electroencephalograms (EEG) Raw EEG
Computerized Processed EEG: Compressed spectral array, Density spectral array, Aperiodic analysis, Bispectral analysis (BIS)
Evoked Potential Sensory EP:
Somatosensory EP
Visual EP
Brain stem auditory EP
Motor EP:
- Transcranial magnetic MEP
- Transcranial electric MEP
- Direct spinal cord stimulation
EMG
- Cranial nerve function (V, VII, IX, X, XI, XII)

EEG
EEG
Electroencephalogram – surface recordings of the summation of excitatory and inhibitory postsynaptic potentials generated by pyramidal cells in cerebral cortex
EEG:
Measures electrical function of brain
Indirectly measures blood flow
Measures anesthetic effects
EEG
Three uses perioperatively:
Identify inadequate blood flow to cerebral cortex caused by surgical/anesthetic-induced reduction in flow
Guide reduction of cerebral metabolism prior to induced reduction of blood flow
Predict neurologic outcome after brain insult
Other uses: identify consciousness, unconsciousness, seizure activity, stages of sleep, coma
EEG
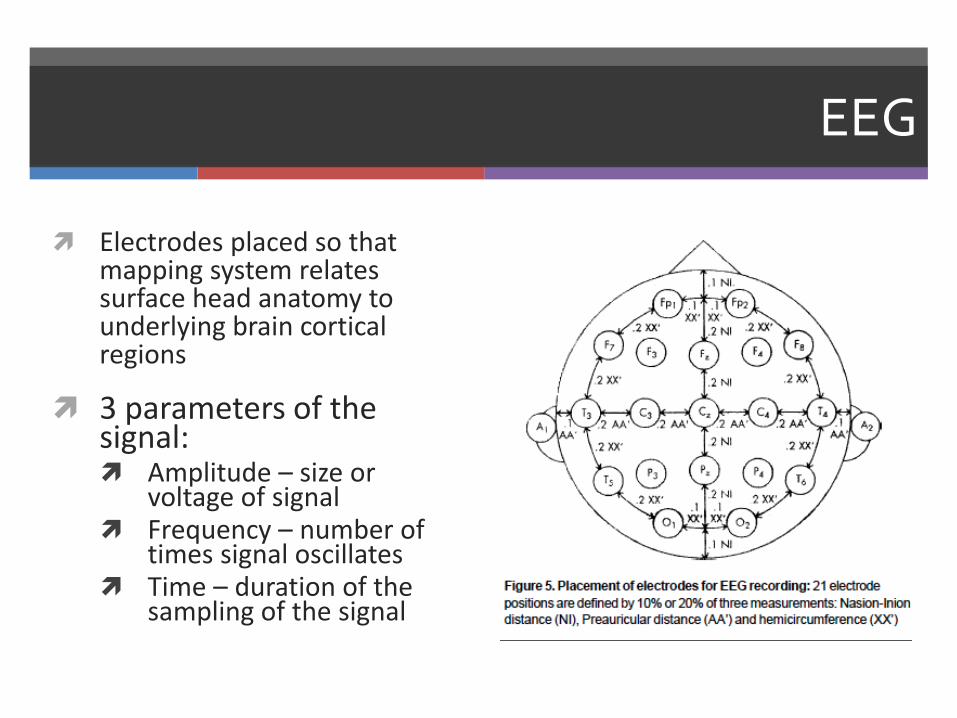
Electrodes placed so that mapping system relates surface head anatomy to underlying brain cortical regions
3 parameters of the signal: Amplitude – size or
voltage of signal Frequency – number of
times signal oscillates Time – duration of the
sampling of the signal

EEG
EEG Waves :
Beta: high freq, low amp (awake state)
Alpha: med freq, high amp (eyes closed while awake)
Theta: Low freq (not predominant)
Delta: very low freq high amp (depressed functions/deep coma
Abnormal EEG
Regional problems - asymmetry in frequency, amplitude or unpredicted patterns of such Epilepsy – high voltage spike with slow waves
Ischemia – slowing frequency with preservation of amplitude or loss of amplitude (severe)
Global problems – affects entire brain, symmetric abnormalities Anesthetic agents induce global changes similar to global
ischemia or hypoxemia (control of anesthetic technique is important
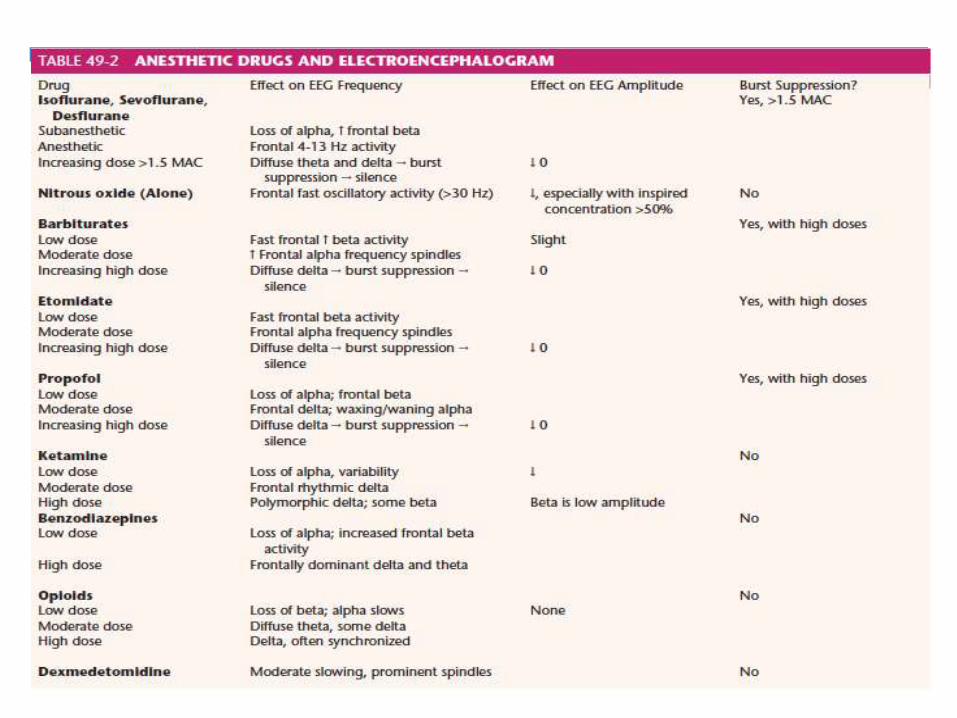
Anesthetic agents and EEG
Subanesthetic doses of inhaled anesthetics (0.3 MAC): Increases frontal beta activity (low voltage, high frequency)
Light anesthesia (0.5 MAC): Larger voltage, slower frequency
General anesthesia (1 MAC): Irregular slow activity
Deeper anesthesia (1.25 MAC): Alternating activity
Very deep anesthesia (1.6 MAC): Burst suppression eventually isoelectric
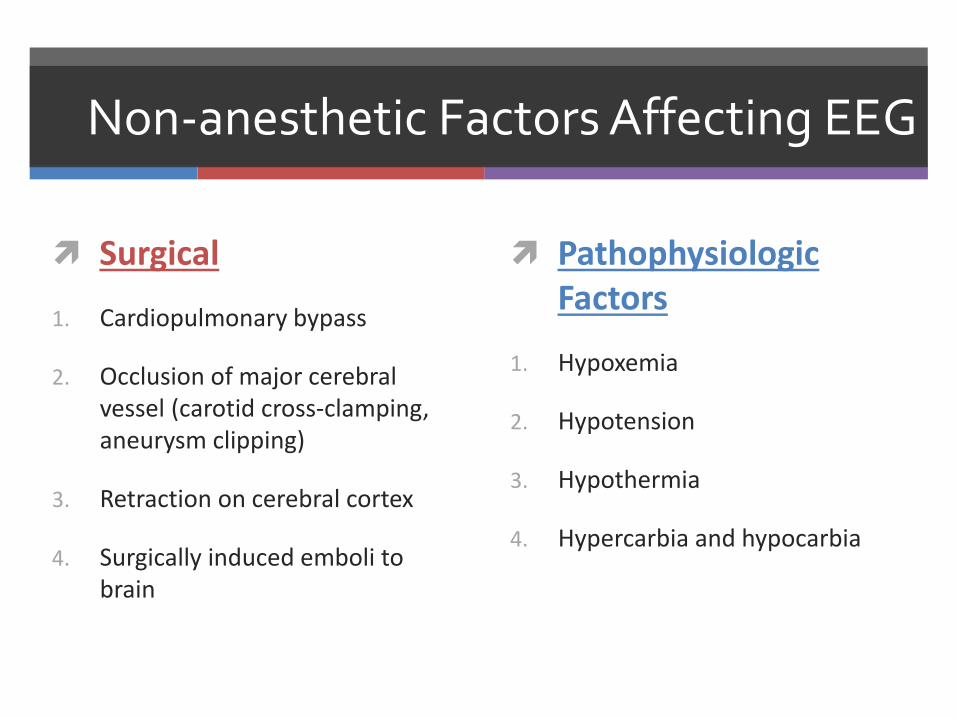
Non-anesthetic Factors Affecting EEG
Surgical
1. Cardiopulmonary bypass
2. Occlusion of major cerebral vessel (carotid cross-clamping, aneurysm clipping)
3. Retraction on cerebral cortex
4. Surgically induced emboli to brain
Pathophysiologic Factors
1. Hypoxemia
2. Hypotension
3. Hypothermia
4. Hypercarbia and hypocarbia
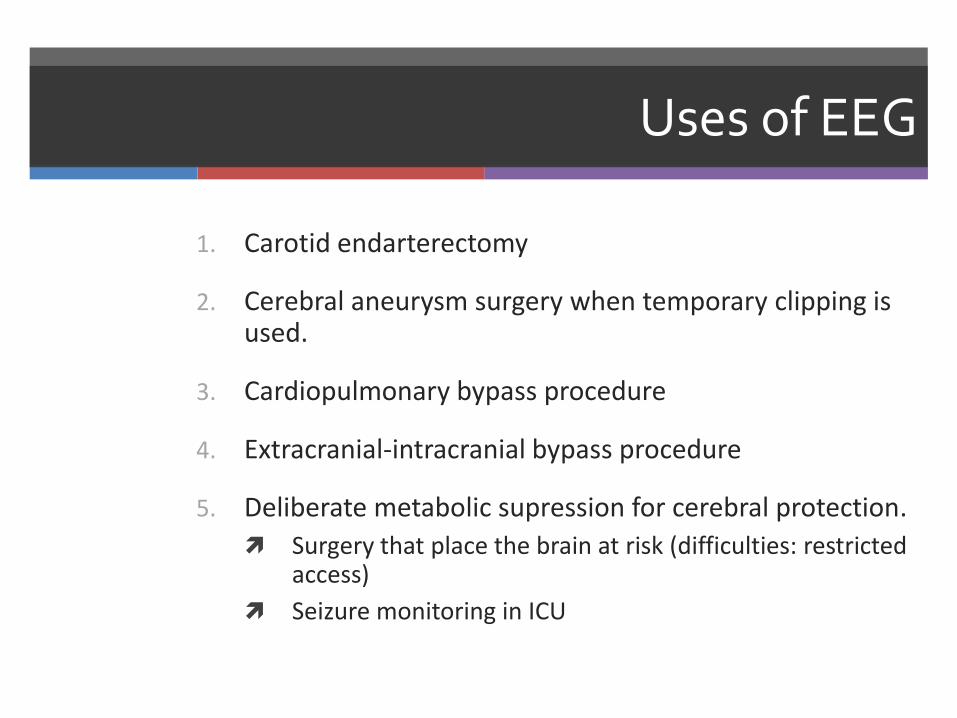
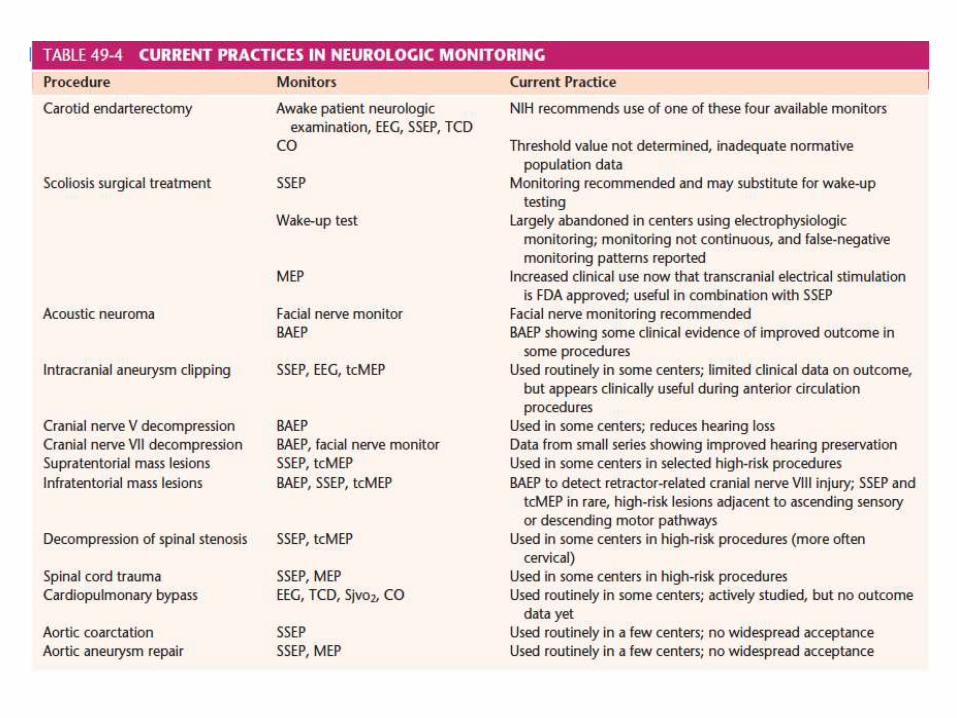
Uses of EEG
1. Carotid endarterectomy
2. Cerebral aneurysm surgery when temporary clipping is used.
3. Cardiopulmonary bypass procedure
4. Extracranial-intracranial bypass procedure
5. Deliberate metabolic supression for cerebral protection.
Surgery that place the brain at risk (difficulties: restricted access)
Seizure monitoring in ICU
Processed EEG
The gold standard for intra-op EEG monitoring: continuous visual inspection of a 16- to 32-channel analog EEG by experienced electroencephalographer
“Processed EEG”: methods of converting raw EEG to a plot showing voltage, frequency, and time Monitors fewer channels, less experience required Reasonable results obtained.
The common processing techniques used are time domain analysis and frequency domain analysis.
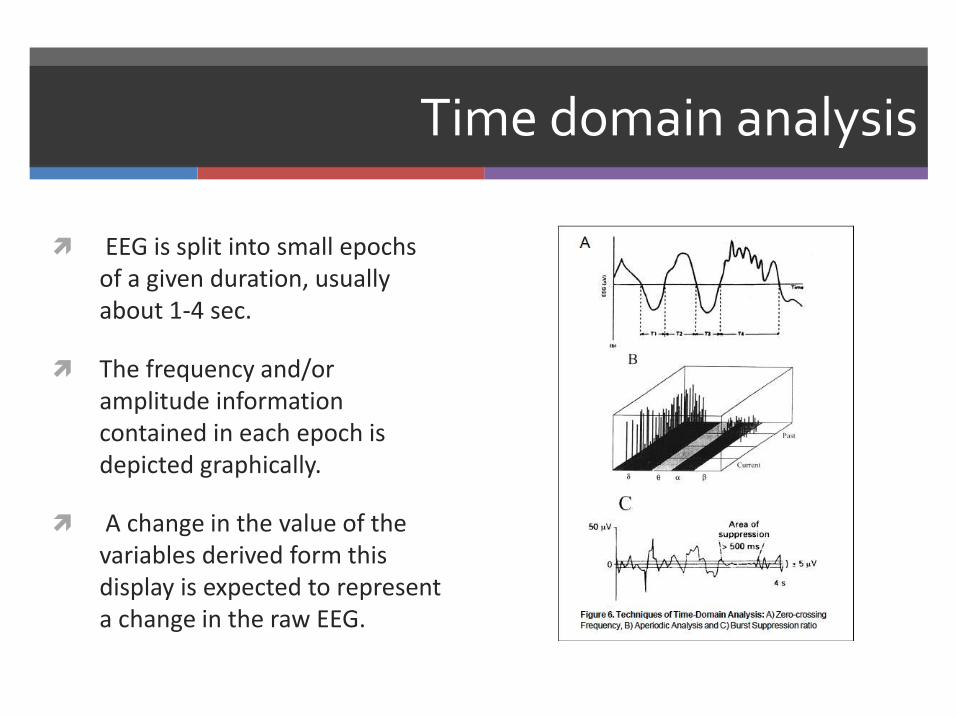
Time domain analysis
EEG is split into small epochs of a given duration, usually about 1-4 sec.
The frequency and/or amplitude information contained in each epoch is depicted graphically.
A change in the value of the variables derived form this display is expected to represent a change in the raw EEG.
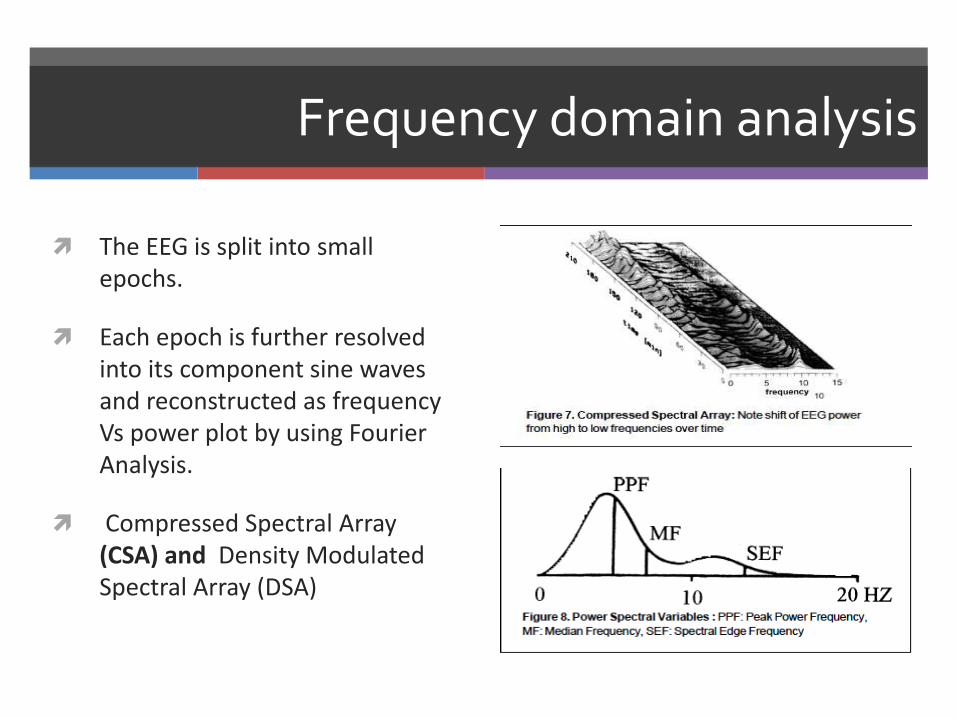
Frequency domain analysis
The EEG is split into small epochs.
Each epoch is further resolved into its component sine waves and reconstructed as frequency Vs power plot by using Fourier Analysis.
Compressed Spectral Array (CSA) and Density Modulated Spectral Array (DSA)
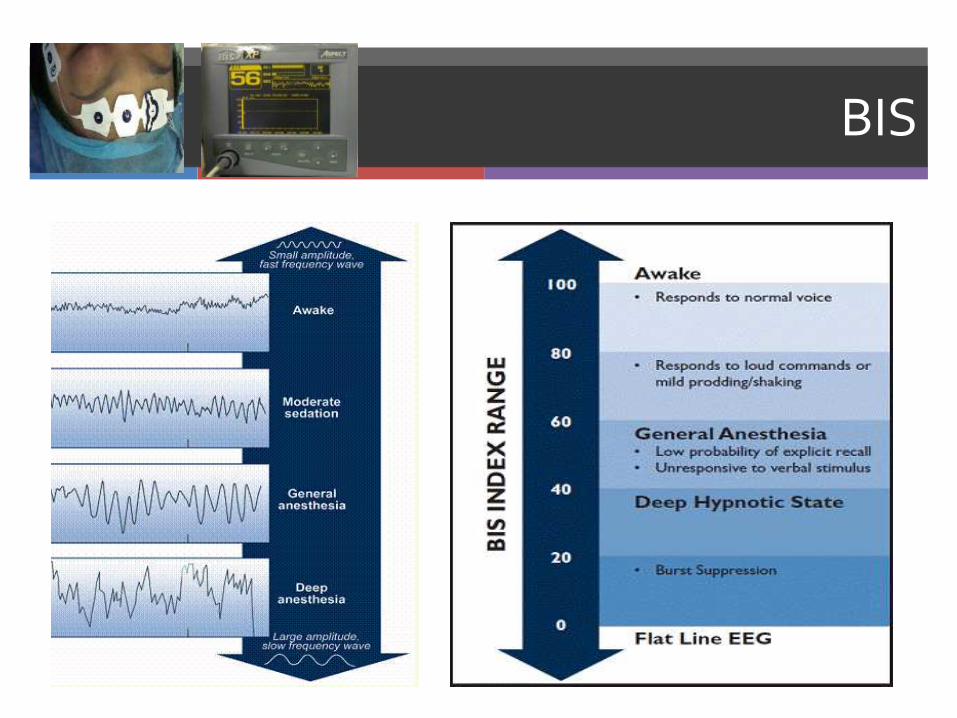
BIS
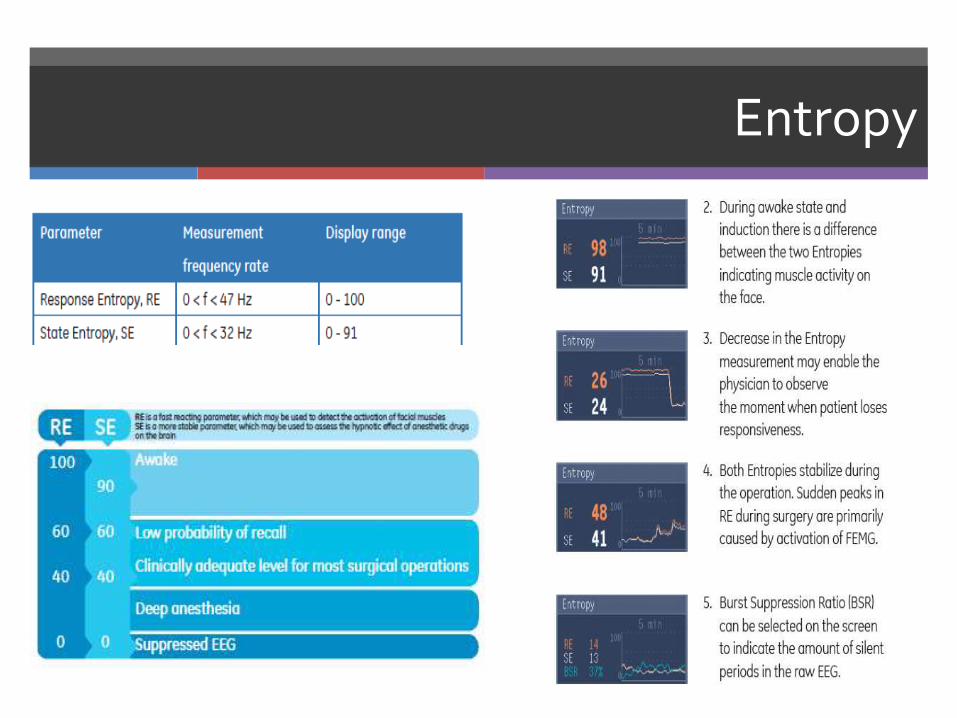
Entropy

EVOKED POTENTIALS
Sensory Evoked Potential
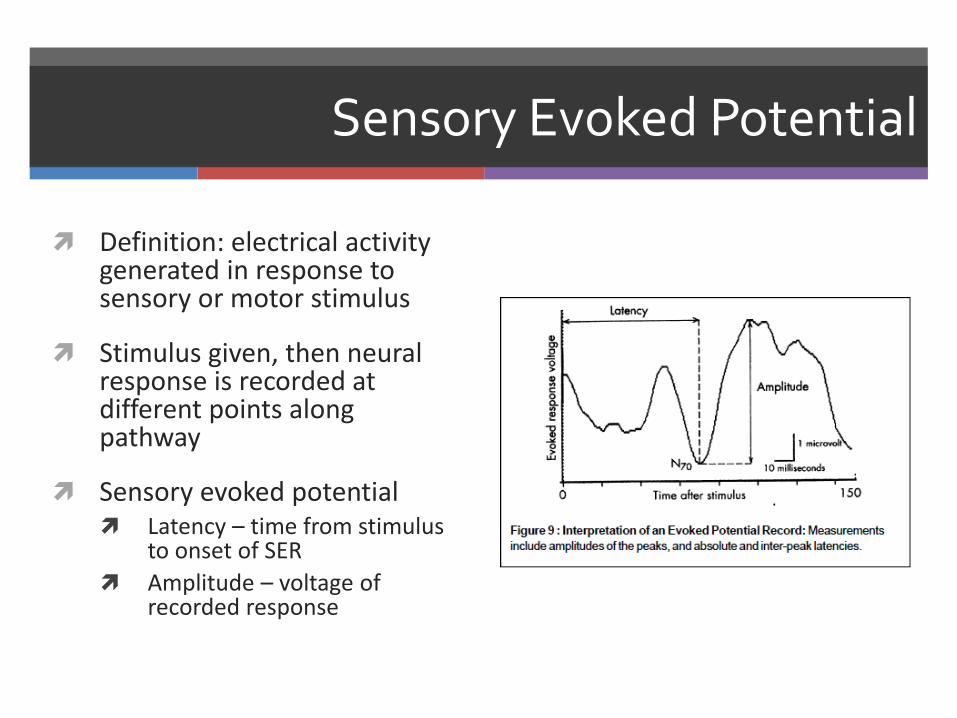
Definition: electrical activity generated in response to sensory or motor stimulus
Stimulus given, then neural response is recorded at different points along pathway
Sensory evoked potential Latency – time from stimulus
to onset of SER
Amplitude – voltage of recorded response
SEP
Sensory evoked potentials Somatosensory (SSEP) Auditory (BAEP) Visual (VEP)
SSEP – produced by electrically stimulating a cranial or peripheral nerve If peripheral n. stimulated – can record proximally
along entire tract (peripheral n., spinal cord, brainstem, thalamus, cerebral cortex)
As opposed to EEG, records subcortically
SSEP
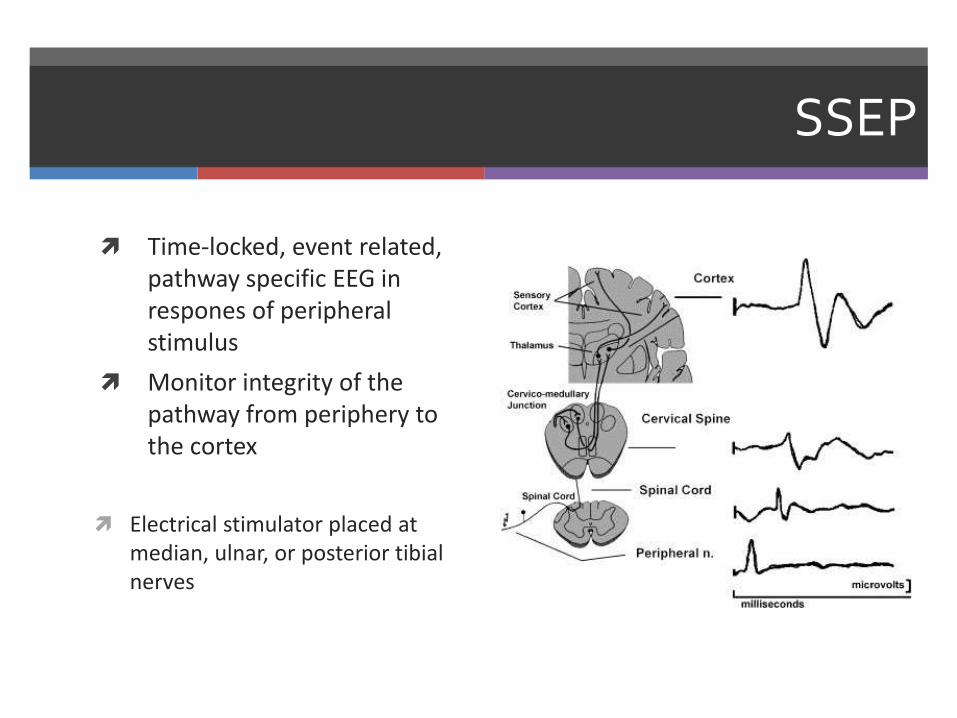
Time-locked, event related, pathway specific EEG in respones of peripheral stimulus
Monitor integrity of the pathway from periphery to the cortex
Electrical stimulator placed at median, ulnar, or posterior tibial nerves
Indications for SSEP
Indications: Scoliosis correction Spinal cord decompression and stabilization
after acute injury Brachial plexus exploration Resection of spinal cord tumor Resection of intracranial lesions involving
sensory cortex Clipping of intracranial aneurysms Carotid endarterectomy Thoracic aortic aneurysm repair
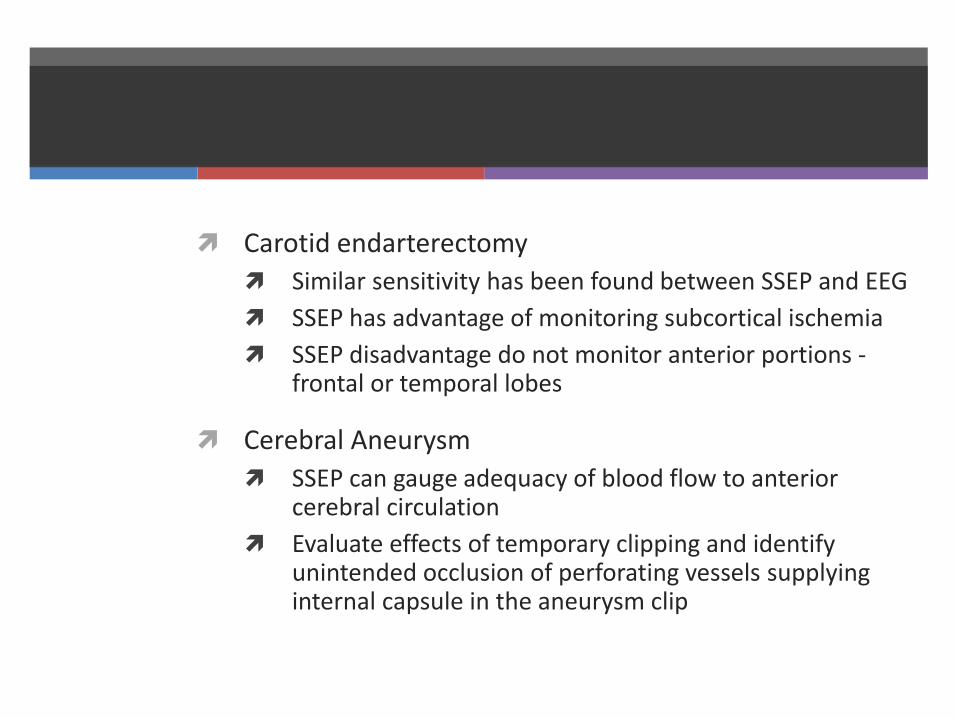
Carotid endarterectomy
Similar sensitivity has been found between SSEP and EEG
SSEP has advantage of monitoring subcortical ischemia
SSEP disadvantage do not monitor anterior portions -frontal or temporal lobes
Cerebral Aneurysm
SSEP can gauge adequacy of blood flow to anterior cerebral circulation
Evaluate effects of temporary clipping and identify unintended occlusion of perforating vessels supplying internal capsule in the aneurysm clip
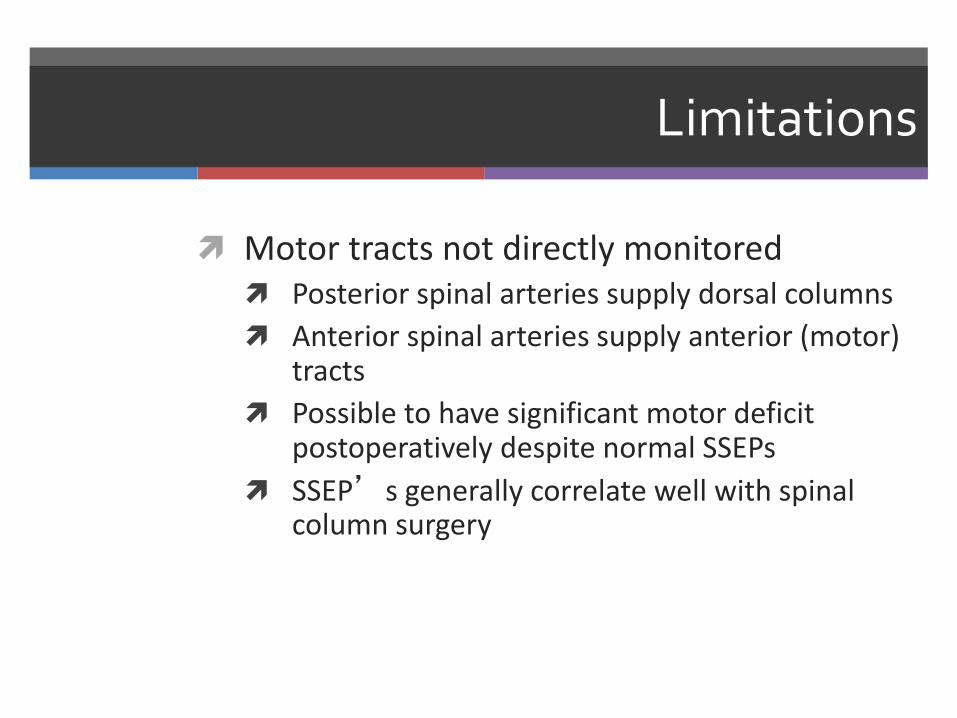
Limitations
Motor tracts not directly monitored Posterior spinal arteries supply dorsal columns
Anterior spinal arteries supply anterior (motor) tracts
Possible to have significant motor deficit postoperatively despite normal SSEPs
SSEP’s generally correlate well with spinal column surgery
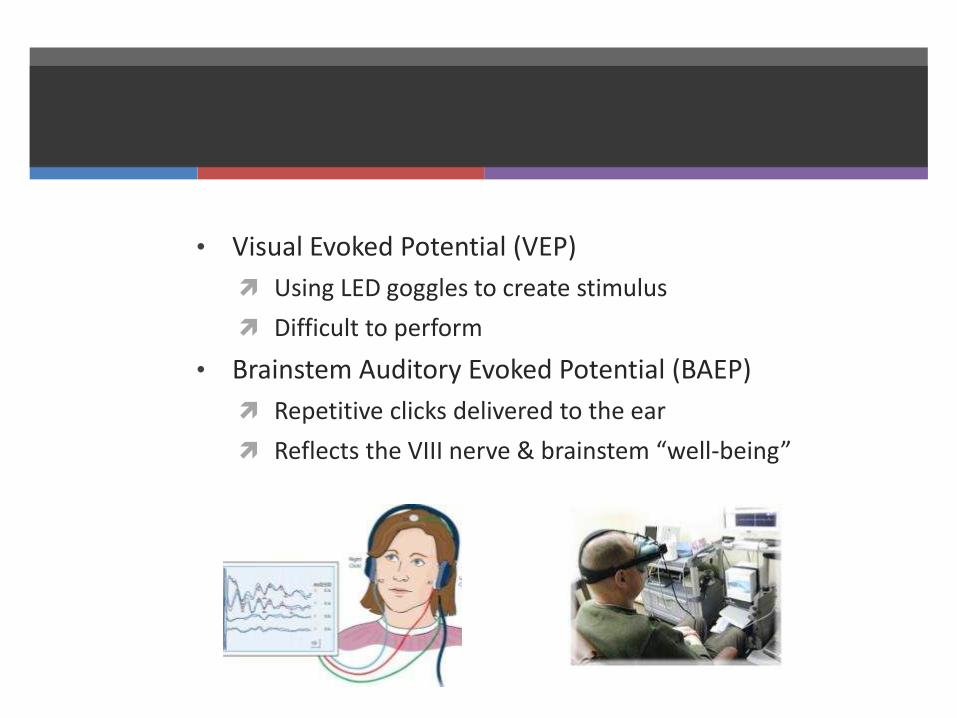
• Visual Evoked Potential (VEP)
Using LED goggles to create stimulus
Difficult to perform
• Brainstem Auditory Evoked Potential (BAEP)
Repetitive clicks delivered to the ear
Reflects the VIII nerve & brainstem “well-being”
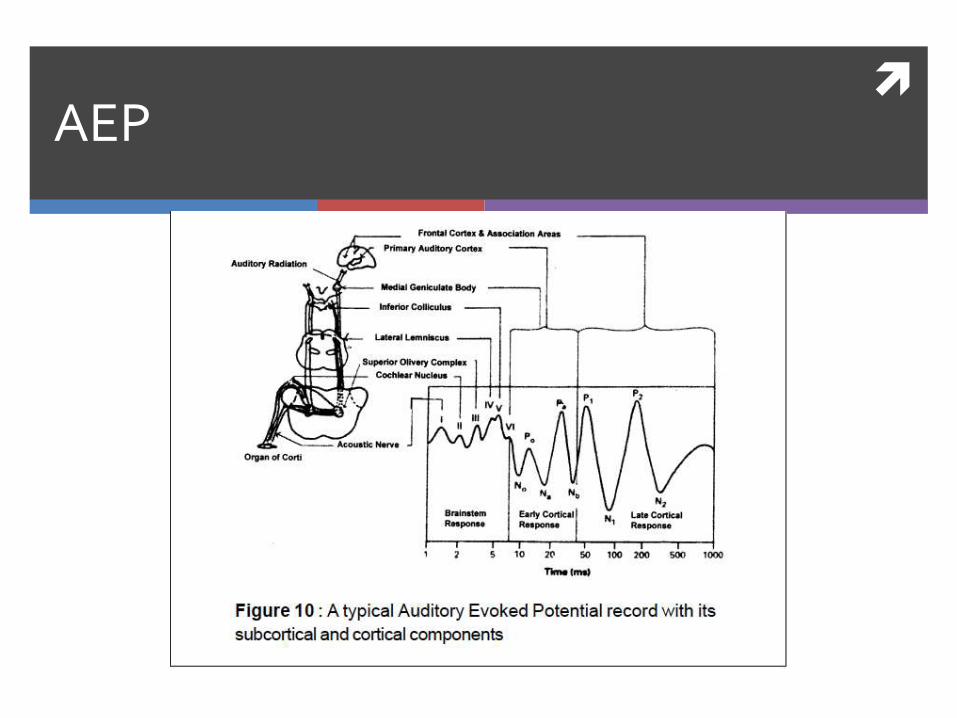
AEP
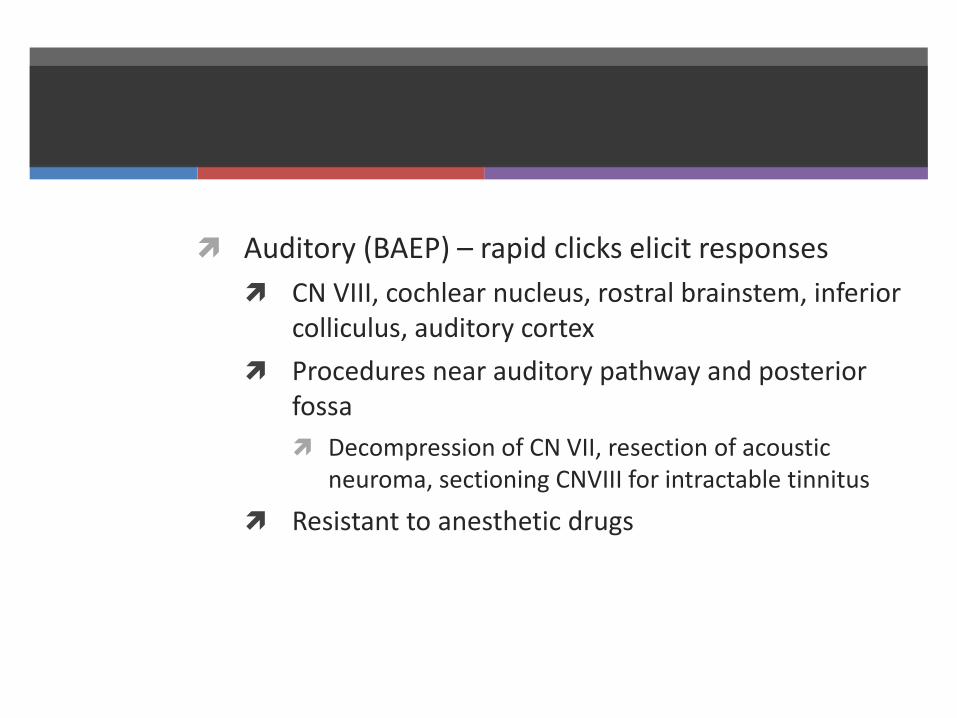
Auditory (BAEP) – rapid clicks elicit responses
CN VIII, cochlear nucleus, rostral brainstem, inferior colliculus, auditory cortex
Procedures near auditory pathway and posterior fossa
Decompression of CN VII, resection of acoustic neuroma, sectioning CNVIII for intractable tinnitus
Resistant to anesthetic drugs

Limitations
Responds to injury by increased latency, decreased amplitude, ultimately disappearance
Problem is response non-specific Surgical injury
Hypoperfusion/ischemia
Changes in anesthetic drugs
Temperature changes
Signals easily disrupted by background electrical activity (ECG, EMG activity of muscle movement, etc)
Baseline is essential to subsequent interpretation
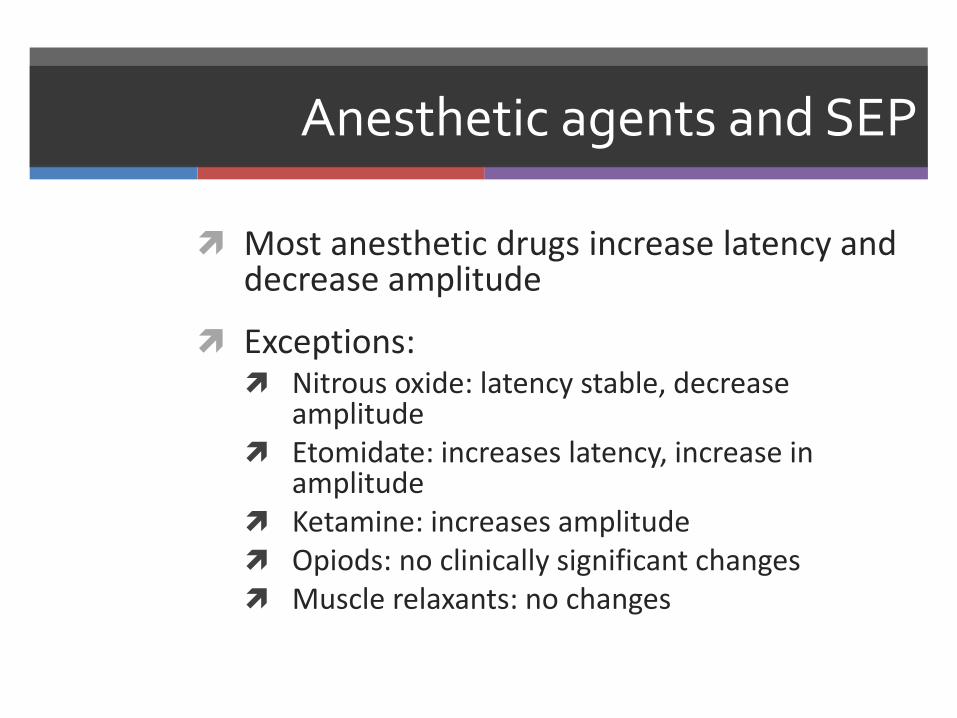
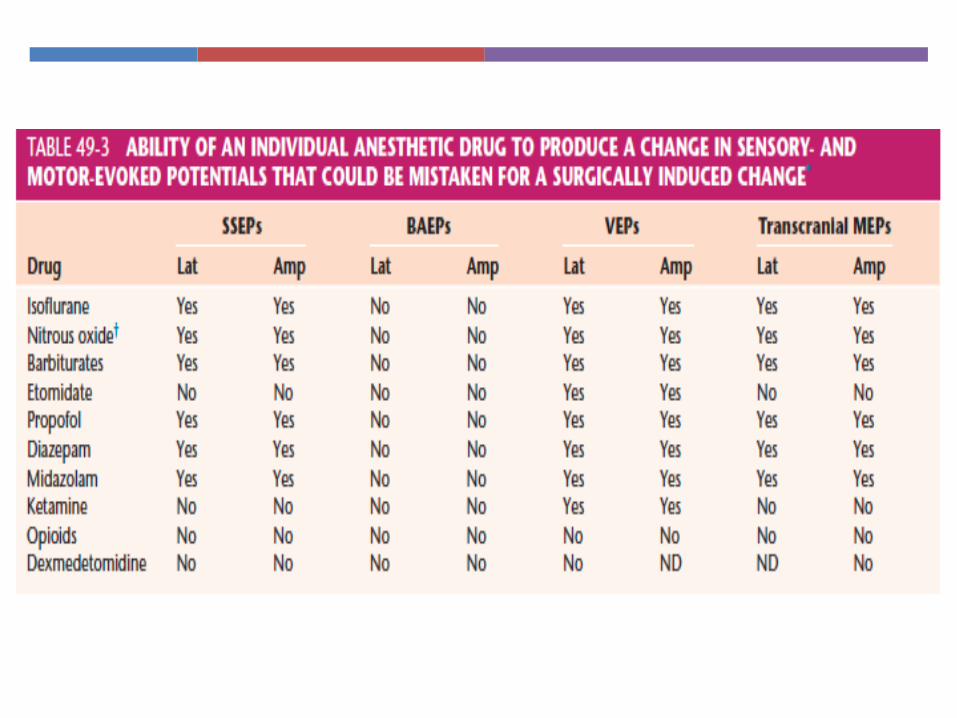
Anesthetic agents and SEP
Most anesthetic drugs increase latency and decrease amplitude
Exceptions: Nitrous oxide: latency stable, decrease
amplitude Etomidate: increases latency, increase in
amplitude Ketamine: increases amplitude Opiods: no clinically significant changes Muscle relaxants: no changes
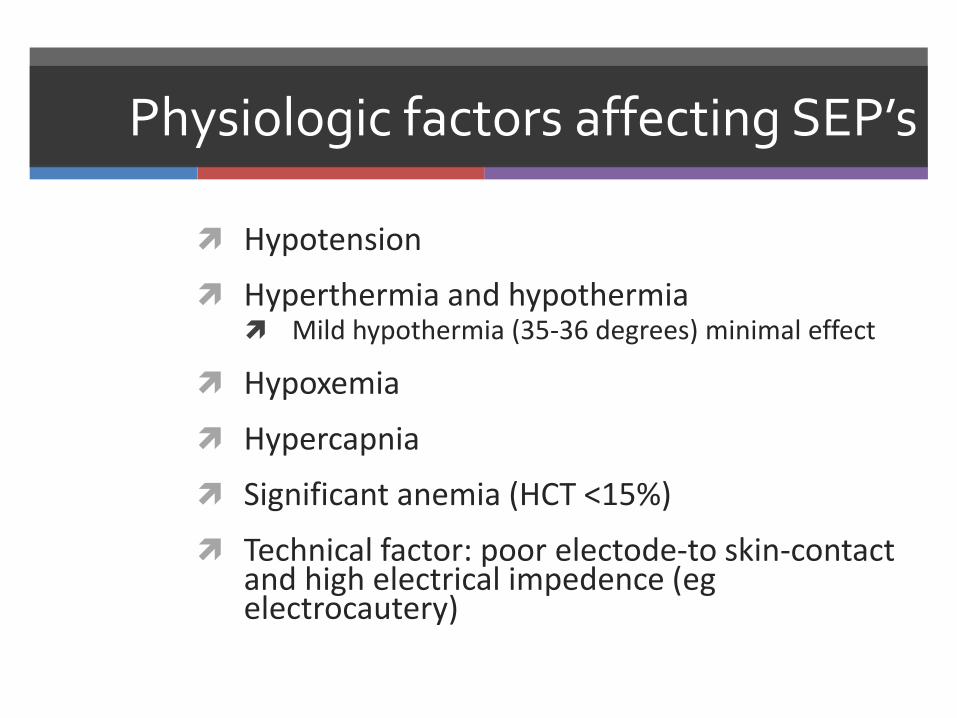
Physiologic factors affecting SEP’s
Hypotension
Hyperthermia and hypothermia Mild hypothermia (35-36 degrees) minimal effect
Hypoxemia
Hypercapnia
Significant anemia (HCT <15%)
Technical factor: poor electode-to skin-contact and high electrical impedence (egelectrocautery)
Motor Evoked Potentials
Motor EP:
- Transcranial magnetic MEP
- Transcranial electric MEP
- Direct spinal cord stimulation
Motor Evoked Potentials
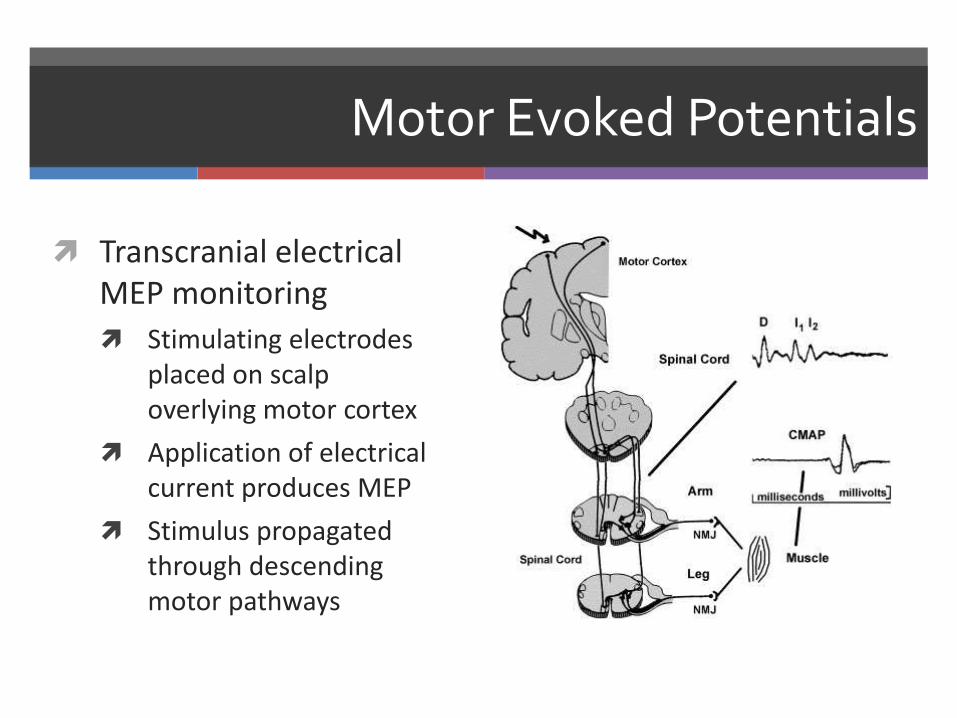
Transcranial electrical MEP monitoring
Stimulating electrodes placed on scalp overlying motor cortex
Application of electrical current produces MEP
Stimulus propagated through descending motor pathways
Motor Evoked Potentials
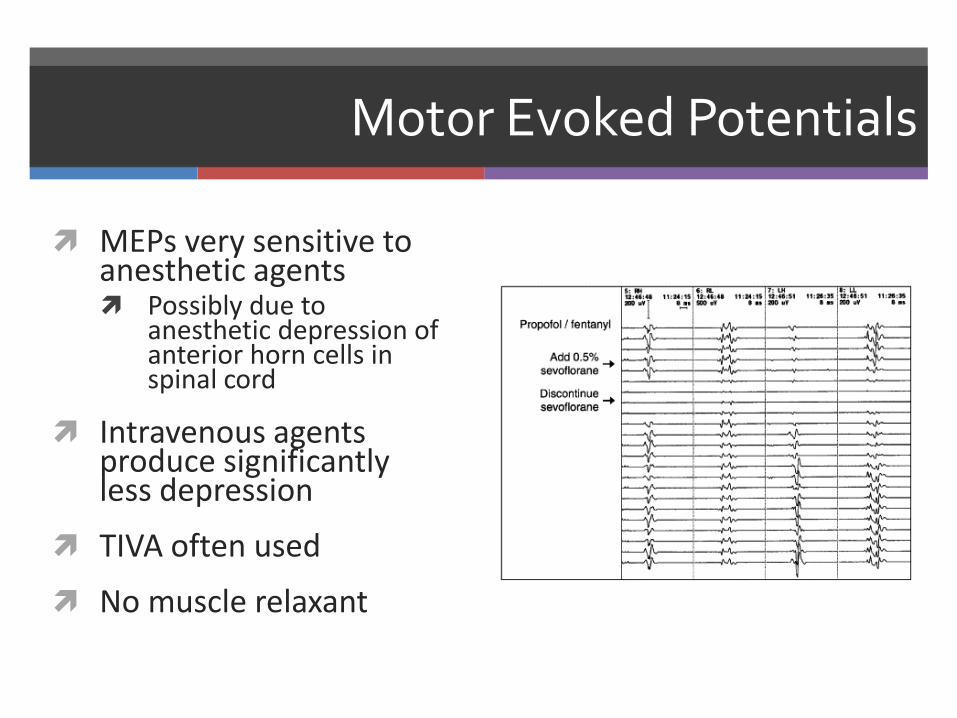
MEPs very sensitive to anesthetic agents Possibly due to
anesthetic depression of anterior horn cells in spinal cord
Intravenous agents produce significantly less depression
TIVA often used
No muscle relaxant
EMG
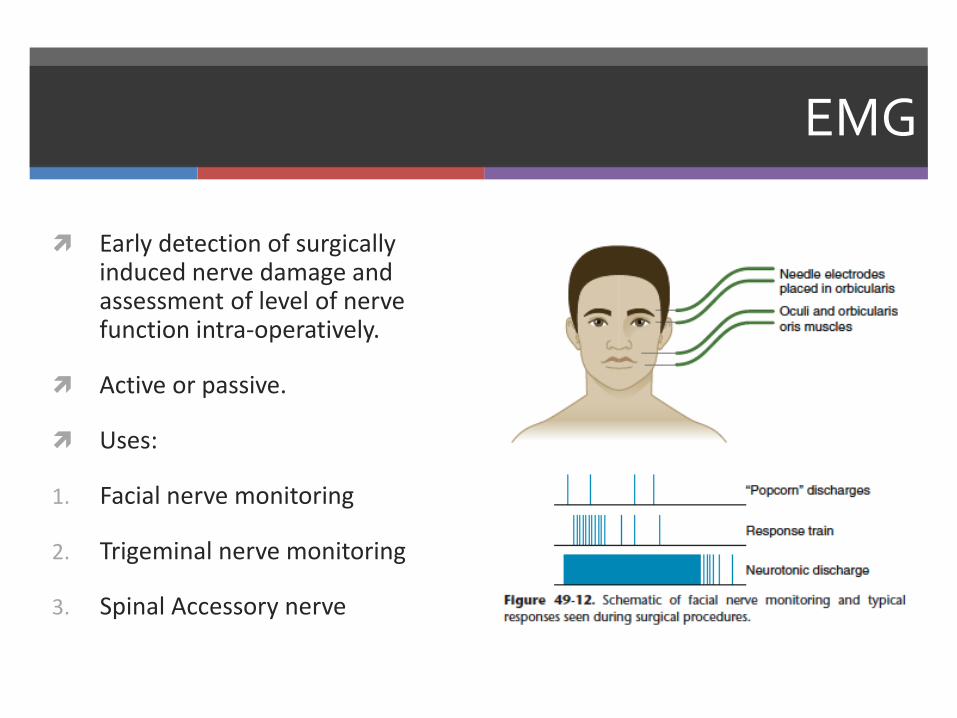
Early detection of surgically induced nerve damage and assessment of level of nerve function intra-operatively.
Active or passive.
Uses:
1. Facial nerve monitoring
2. Trigeminal nerve monitoring
3. Spinal Accessory nerve
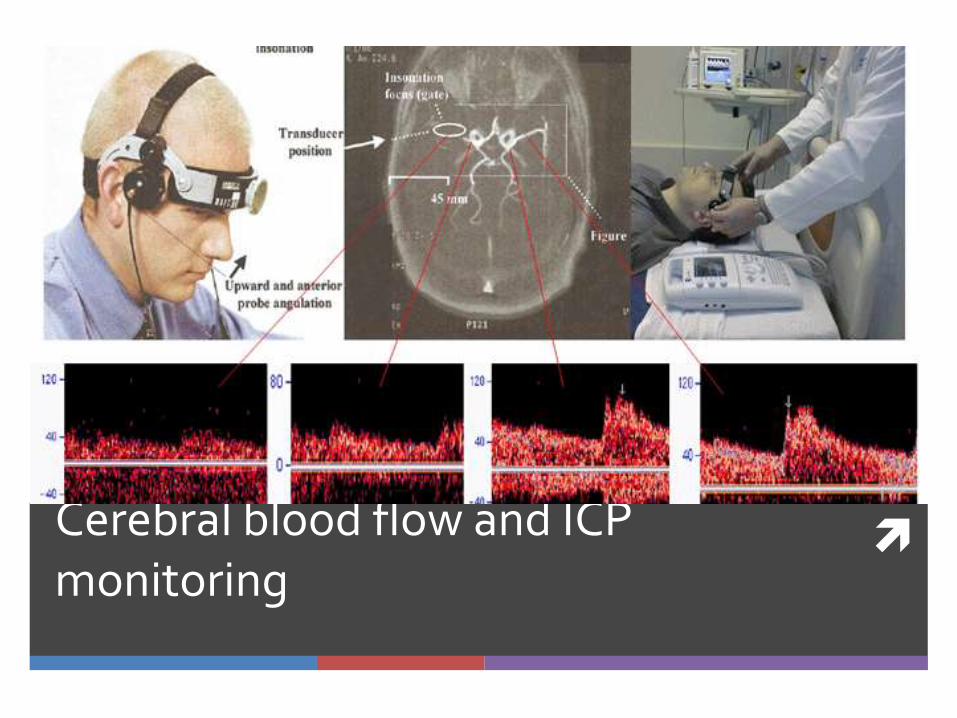
Cerebral blood flow and ICP monitoring
Intra-cranial Pressure
The pressure inside the lateral ventricles/lumbar subarachnoid space in supine position.
The normal value of ICP is 10-15 mm Hg in adults.
Indications for ICP monitoring
1. Head Injury
2. Brain Tumors
3. Subarachnoid Heamorrhage
4. Hydrocephalus
5. Neuromedical conditions
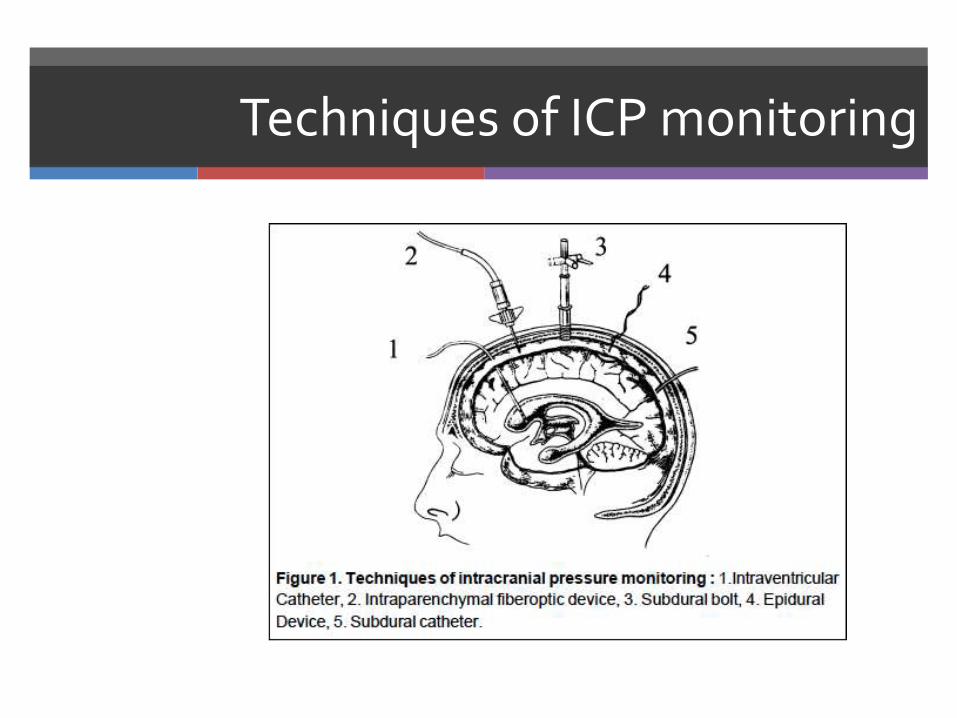
Techniques of ICP monitoring
ICP waveforms
ICP shows a pulsatile recording with slow respiratory component superimposed on a biphasic recording synchronous with cardiac cycle.
Normally, respiratory oscillations are greater than the cardiac oscillations, but when ICP increases, arterial pulsations also assume greater amplitude
Abnormalities of ICP waveforms
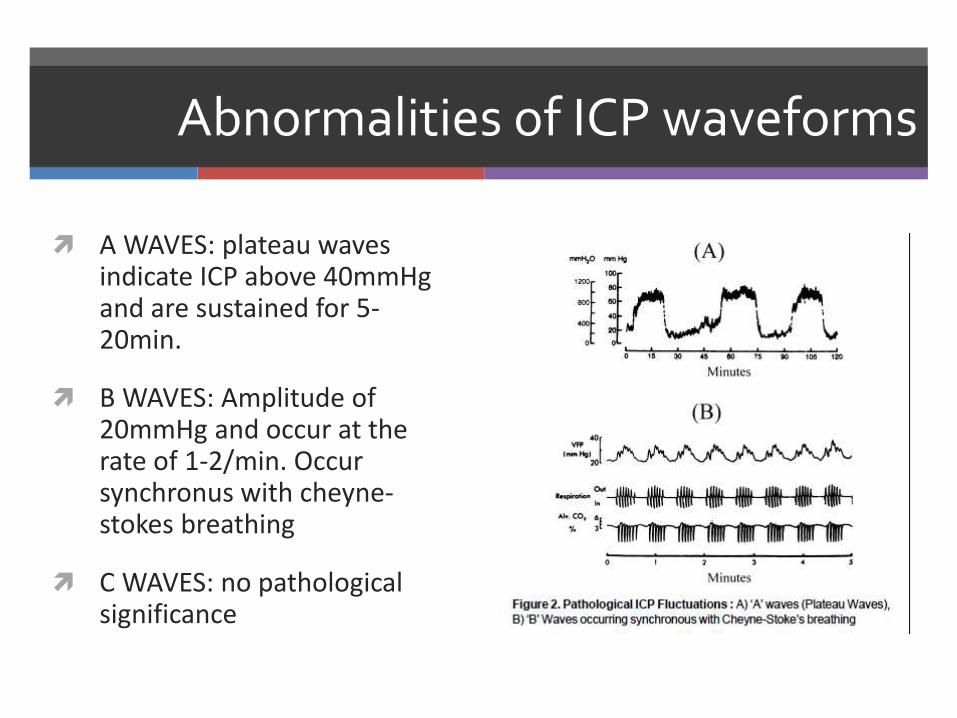
A WAVES: plateau waves indicate ICP above 40mmHg and are sustained for 5-20min.
B WAVES: Amplitude of 20mmHg and occur at the rate of 1-2/min. Occur synchronus with cheyne-stokes breathing
C WAVES: no pathological significance
Transcranial Doppler
Measures the blood flow velocity in major cerebral blood vessles.
Examination carried out through the temporal window, orbital foramen or foramen magnum.
Using 2MHz probe.
MCA commonly used.
Change in velocity is proportional to change in flow considering the vessel diameter is constant.
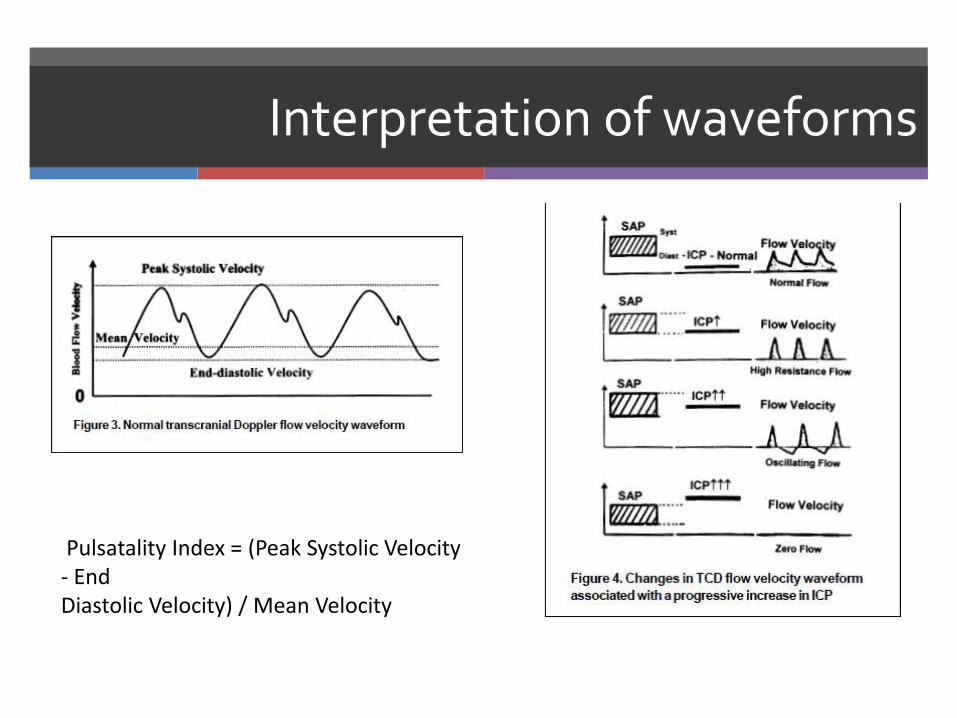
Interpretation of waveforms
Pulsatality Index = (Peak Systolic Velocity - EndDiastolic Velocity) / Mean Velocity
Clinical applications of TCD
1. It is useful as a noninvasive monitor of CBF.
2. It is helpful to diagnose cerebral vasospasm and monitor response to therapy in patients with subarachnoid haemorrhage and head injury.
3. It is used to study autoregulation of CBF and cerebral vascular response to carbon dioxide.
4. It can be used to assess intracranial circulatory status in raised ICP.
5. It can be a useful tool to identify intraoperative cerebral embolisation during surgery on carotid artery and cardiopulmonary bypass procedures.
6. It can be used to optimise CPP and hyperventilationin patients with head injury.
Intravascular tracer compounds
Method originally described by Kety and Schmidt.
Administration of radioactive isotope of xenon-133
Measurement of radioactivity washout with gamma detectors.
Disadvantages: 1.Exposure to radioactivity
2.Cumbersome detector equipment
3.Focal areas of hypoperfusion missed
4.Snapshot of CBF not continuous monitor.
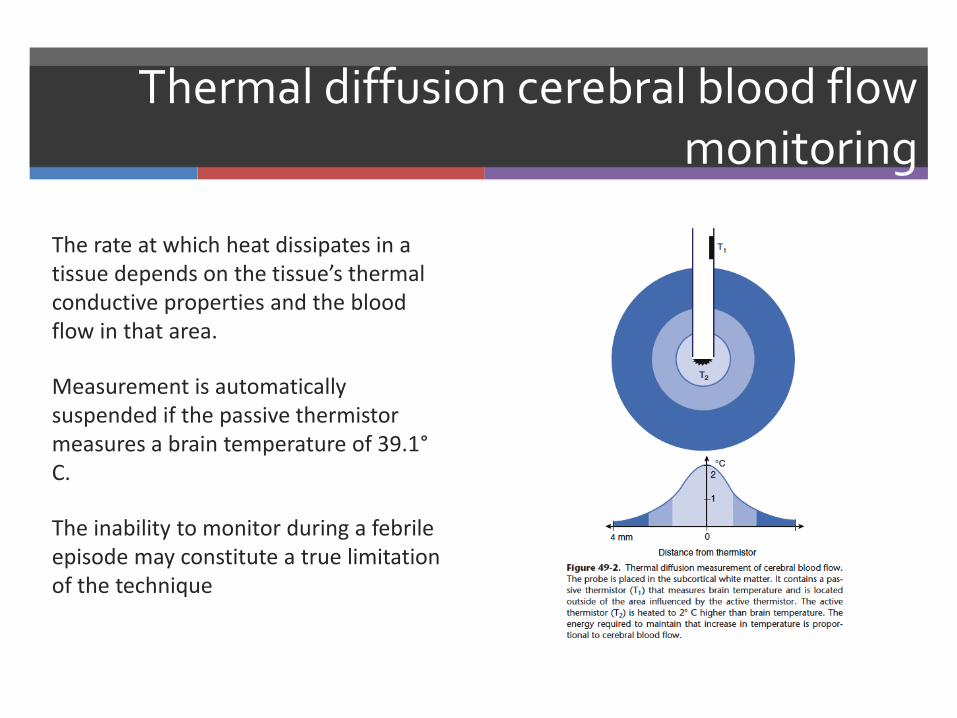
Thermal diffusion cerebral blood flow monitoring
The rate at which heat dissipates in a tissue depends on the tissue’s thermal conductive properties and the blood flow in that area.
Measurement is automatically suspended if the passive thermistor measures a brain temperature of 39.1°C.
The inability to monitor during a febrile episode may constitute a true limitation of the technique
Monitoring of cerebral oxygenation and metabloism
Monitoring of cerebral oxygenation and metabloism
Brain tissue oxygenation
Jugular bulb venous oximetry monitoring
Microdialysis catheter
Near Infrared Spectroscopy (NIRS)

Jugular venous oximetry :principle
(A-V)DO2 x CBF = CMRO2
When CMRO2 is constant, any change in CBF is associated with a reciprocal change in the cerebral arteriovenous oxygen difference.
Based on the principle of reflectance oximetry.

Jugular venous oximetry
Continuous monitoring of jugular venous oxygen saturation (SjVO2 ) is carried out by a catheter placed retrograde through the internal jugular vein intothejugular bulb.
For accurate measurement, the tip of the catheter must be within 1 cm of the jugular bulb.
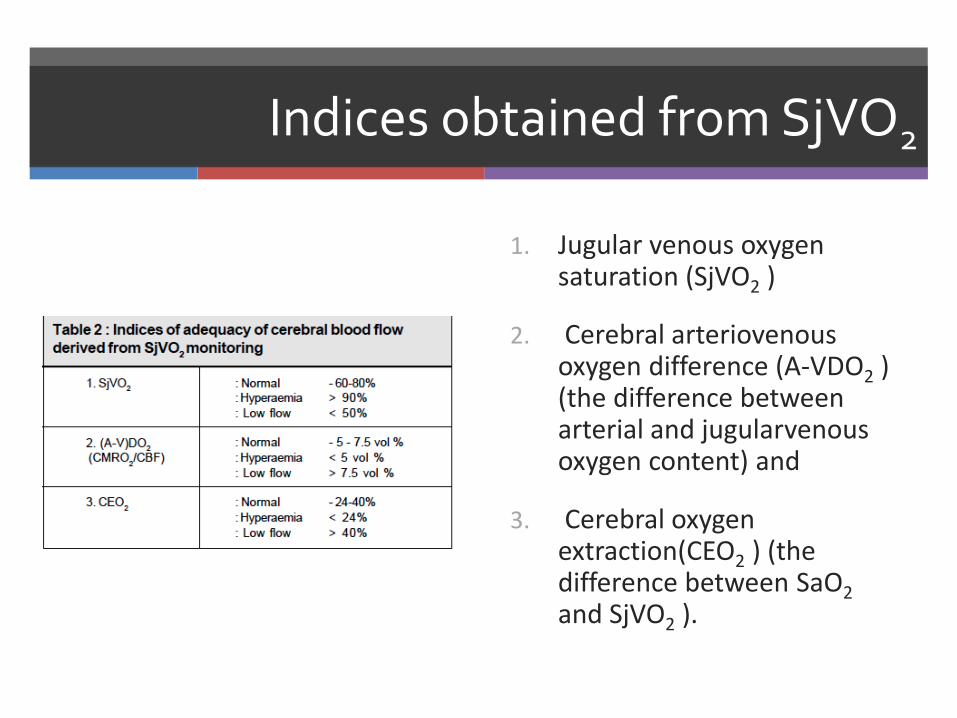
Indices obtained from SjVO2
1. Jugular venous oxygen saturation (SjVO2 )
2. Cerebral arteriovenousoxygen difference (A-VDO2 ) (the difference between arterial and jugularvenousoxygen content) and
3. Cerebral oxygen extraction(CEO2 ) (the difference between SaO2
and SjVO2 ).
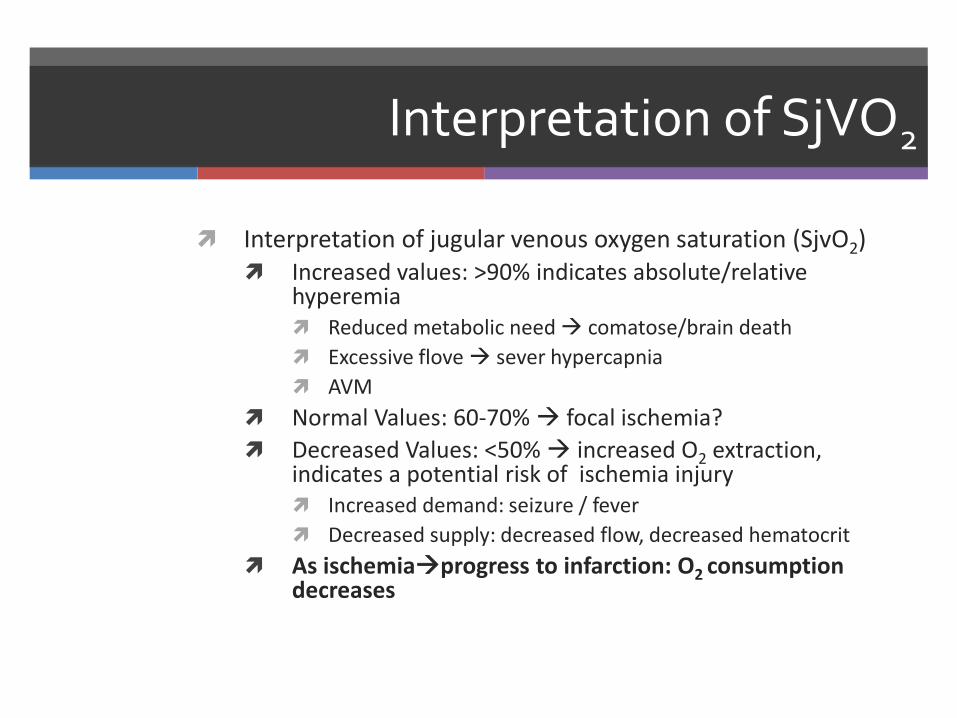
Interpretation of SjVO2
Interpretation of jugular venous oxygen saturation (SjvO2) Increased values: >90% indicates absolute/relative
hyperemia Reduced metabolic need comatose/brain death
Excessive flove sever hypercapnia
AVM
Normal Values: 60-70% focal ischemia?
Decreased Values: <50% increased O2 extraction,indicates a potential risk of ischemia injury Increased demand: seizure / fever
Decreased supply: decreased flow, decreased hematocrit
As ischemiaprogress to infarction: O2 consumption decreases
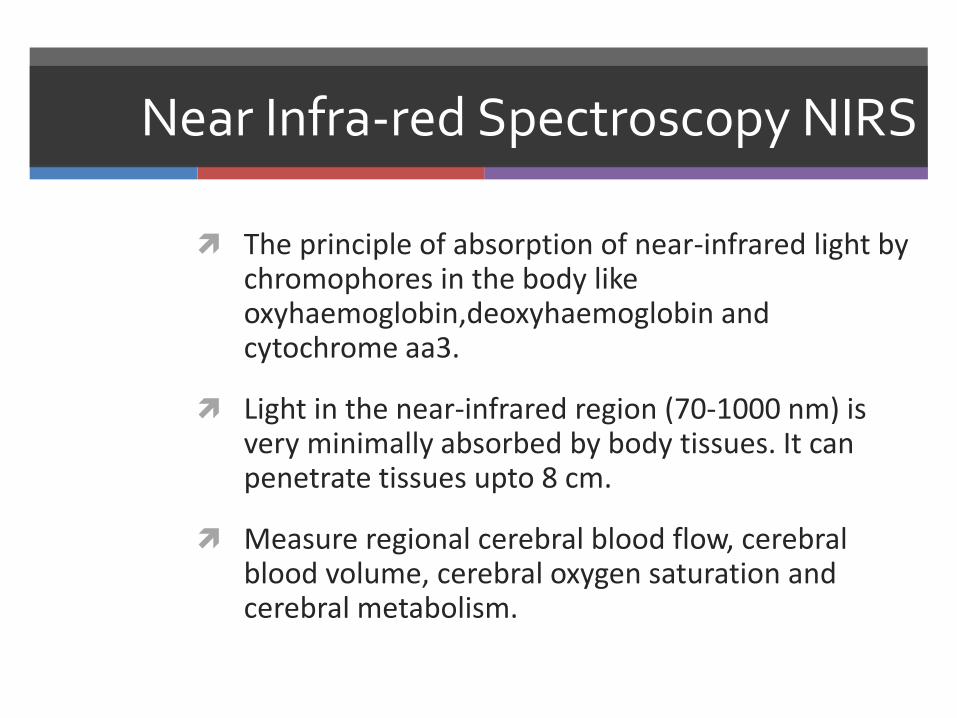
Near Infra-red Spectroscopy NIRS
The principle of absorption of near-infrared light by chromophores in the body like oxyhaemoglobin,deoxyhaemoglobin and cytochrome aa3.
Light in the near-infrared region (70-1000 nm) is very minimally absorbed by body tissues. It can penetrate tissues upto 8 cm.
Measure regional cerebral blood flow, cerebral blood volume, cerebral oxygen saturation and cerebral metabolism.
NIRS limitations
Inability to assess the contribution of extracranial tissue to the signal changes.
Presence of intracranial blood in the form of haematomas and contusions can interfere with the measurements.
Measures small portion of frontal cortex, contributions from non-brain sources
Temperature changes affect NIR absorption water spectrum Degree of contamination of the signal by chromophores in
the skin can be appreciable and are variable Not validated – threshold for regional oxygen saturation not
known (20% reduction from baseline?)
Tissue partial pressure oxygen monitoring:
Based on an oxygen-sensitive electrode originally described by Clark.
The diffusion of oxygen molecules through an oxygen-permeable membrane into an electrolyte solution causes an electric current that is proportional to Po2.
The catheter is placed into the brain tissue through a twist drill hole into the subcortical white matter.
Normal values for brain tissue oxygen tension are 20-40 mmHg.
In patients with cerebral ischaemia the values are 10 ± 5 mmHg as against 37 ± 12 mmHg in normal individuals

Cerebral Microdialysis
Small catheter inserted with ICP/tissue PO2
monitor
Artificial cerebrospinal fluid,equilibrates with extracellular fluid,chemical composition analysis
Markers:
○ Lactate/pyruvate ratio : onset of ischemia
○ High level glycerol: inadequate energy to maintain cellular integrity- membrane breakdown
○ Glutamate: neuronal injury and a factor in its exacerbation
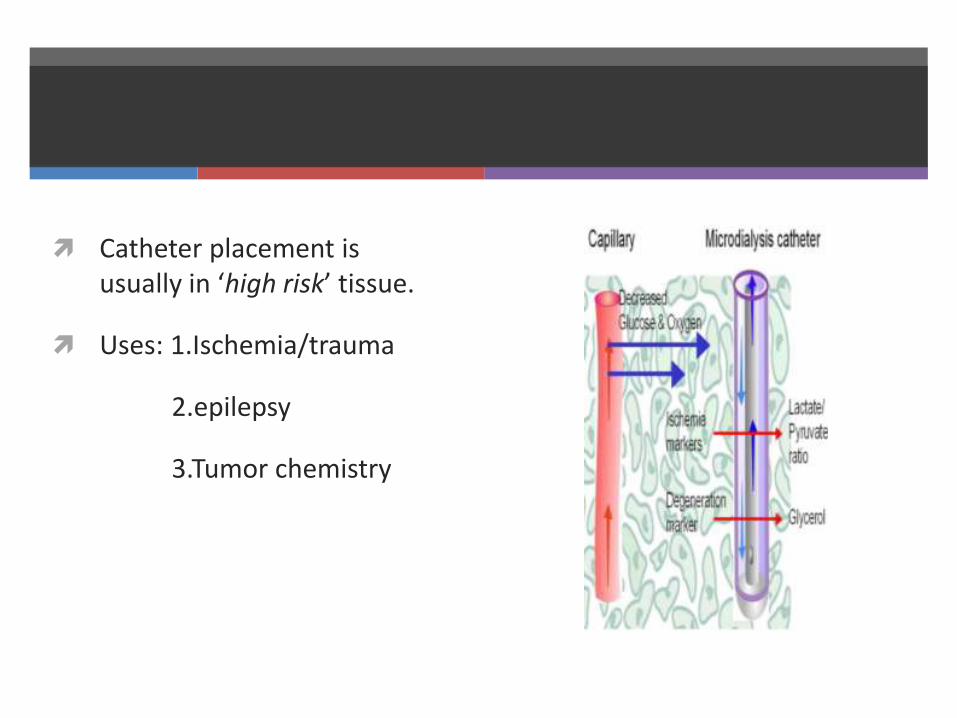
Catheter placement is usually in ‘high risk’ tissue.
Uses: 1.Ischemia/trauma
2.epilepsy
3.Tumor chemistry
References
Millers anesthesia 8th edition
Neurological monitoring. Dr. G S Rao IJA 2002;46(4)
Advances in neuroanesthesia monitoring Dr. Pramod Bithal AIIMS new delhi. 2006 ISACON
GE-Datex Ohmeda Entropy monitor manual
Coviden BIS monitor users manual

ThankyouThe end


![Neuromonitoring [PDF, 2.5 MB]](https://img.pdfslide.net/doc/110x75/586f5f371a28abf0508bd912/neuromonitoring-pdf-25-mb.jpg)