Embed Size (px)
DESCRIPTION
This study estimated the impacts of transportation and geography on use of health care services by adults aged 60 or older in North Dakota, South Dakota, Montana, and Wyoming. The results were based on survey responses received from 543 individuals living in these states. This research studied whether long travel distances to health care facilities contribute to lower health care usage in rural areas and whether ability to drive, access to public transportation, or having others in the household who can drive have any influence on the number of health care trips taken.
Citation preview
Transportation and Health Care
Use for Older Adults in Rural and
Small Urban Areas
Jeremy MattsonSmall Urban & Rural Transit CenterNorth Dakota State University
Transportation Research Board, 91st Annual Meeting
Washington, DC
January 24, 2012
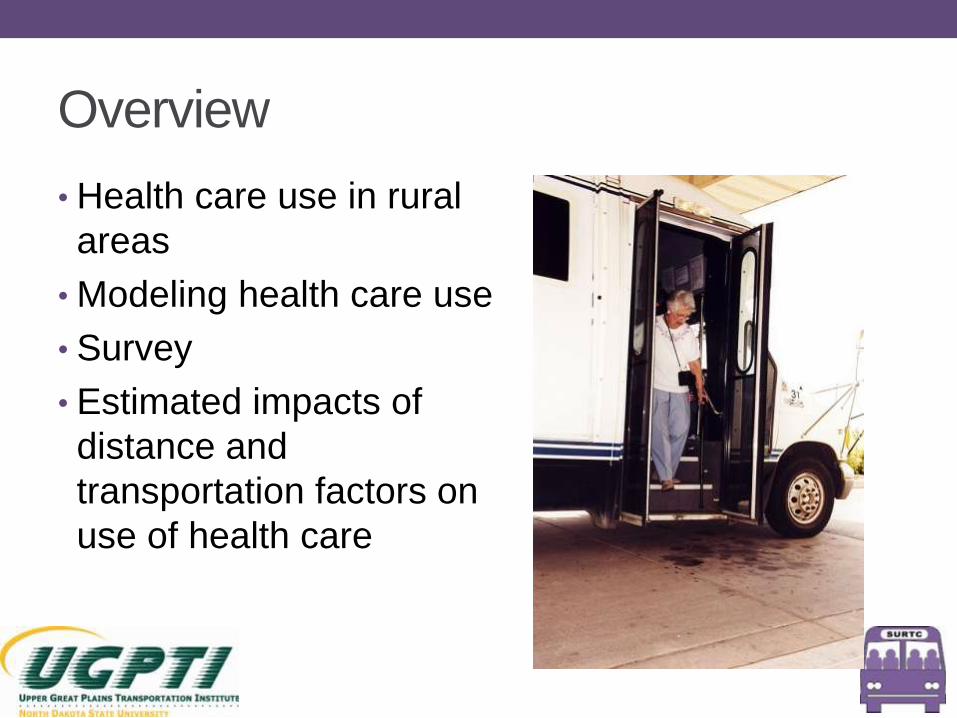
Overview
• Health care use in rural
areas
• Modeling health care use
• Survey
• Estimated impacts of
distance and
transportation factors on
use of health care
Previous Research
• Health care utilization is lower in rural areas
• Fewer physicians in rural areas
• Differences in individual characteristics
• Longer travel distances (Nemet and Bailey 2000, Arcury et al.
2005, …)
• Transportation and health care
• Those who can drive make more trips (Arcury et al. 2005)
• Provision of NEMT has net societal benefits (Wallace et al. 2006)
Modeling Health Care Use• Health Behavior Model says use of health services is
determined by:
• Predisposition to use services
• Demographic characteristics
• Health beliefs
• Enabling factors
• Availability of services
• Income
• Health insurance
• Regular source of care
• Transportation
• Need for care
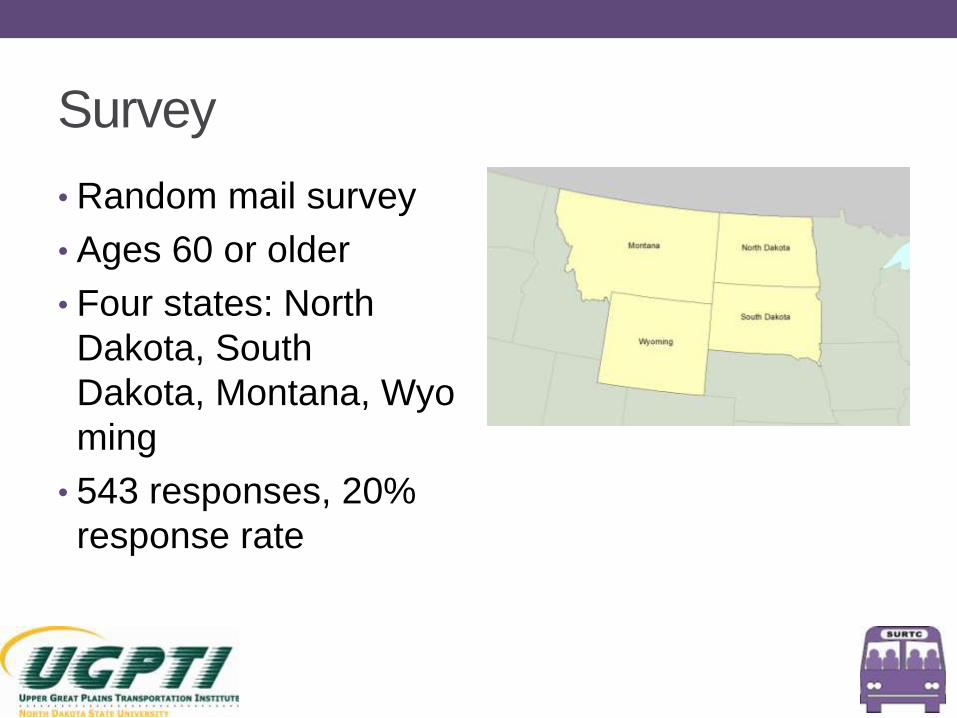
Survey
• Random mail survey
• Ages 60 or older
• Four states: North
Dakota, South
Dakota, Montana, Wyo
ming
• 543 responses, 20%
response rate
Survey Questions
• Number of health care trips taken over last year
• Routine health checkups
• Chronic care visits
• Emergency care
• Number of health care trips missed or delayed over last
year
• Distance to health care facilities
• Transportation options available
• Demographic characteristics
• Propensity to seek care
• Health status
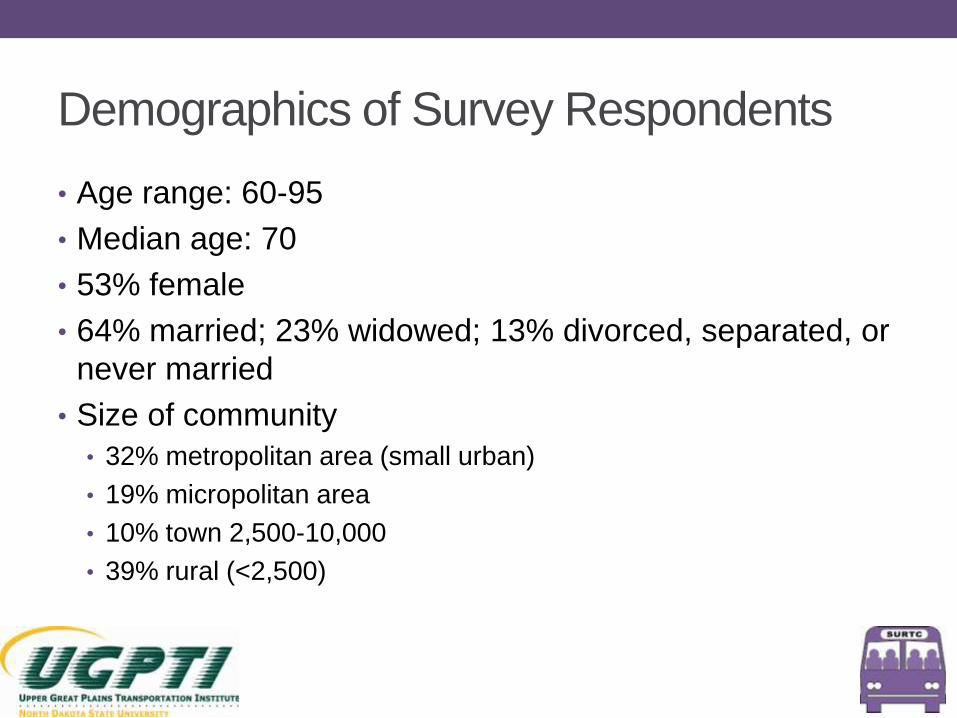
Demographics of Survey Respondents
• Age range: 60-95
• Median age: 70
• 53% female
• 64% married; 23% widowed; 13% divorced, separated, or
never married
• Size of community
• 32% metropolitan area (small urban)
• 19% micropolitan area
• 10% town 2,500-10,000
• 39% rural (<2,500)
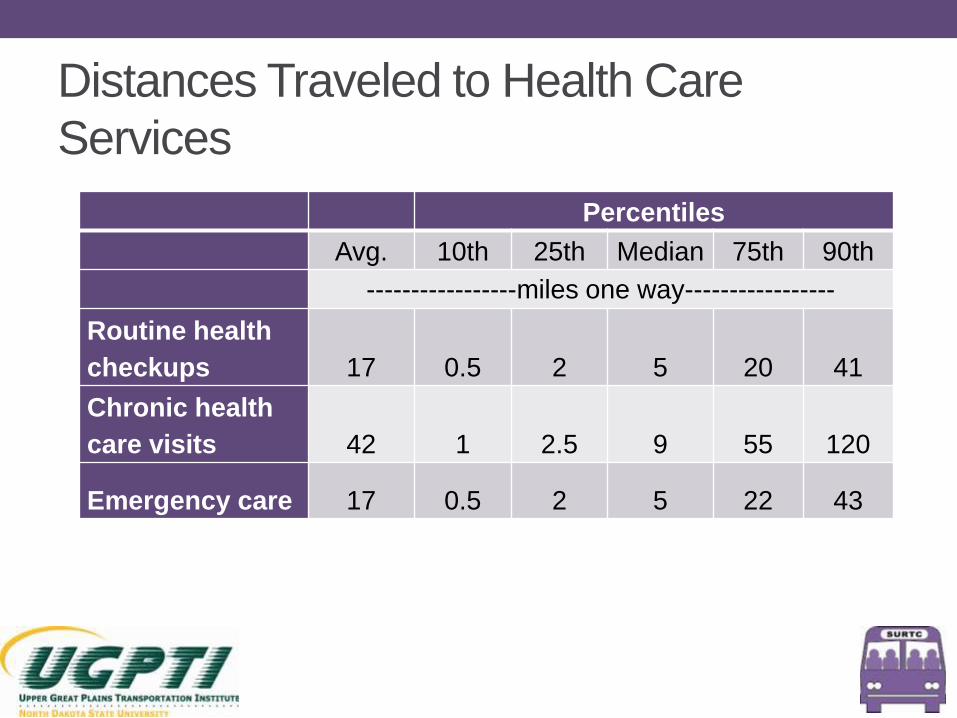
Distances Traveled to Health Care
Services
Percentiles
Avg. 10th 25th Median 75th 90th
-----------------miles one way-----------------
Routine health
checkups 17 0.5 2 5 20 41
Chronic health
care visits 42 1 2.5 9 55 120
Emergency care 17 0.5 2 5 22 43
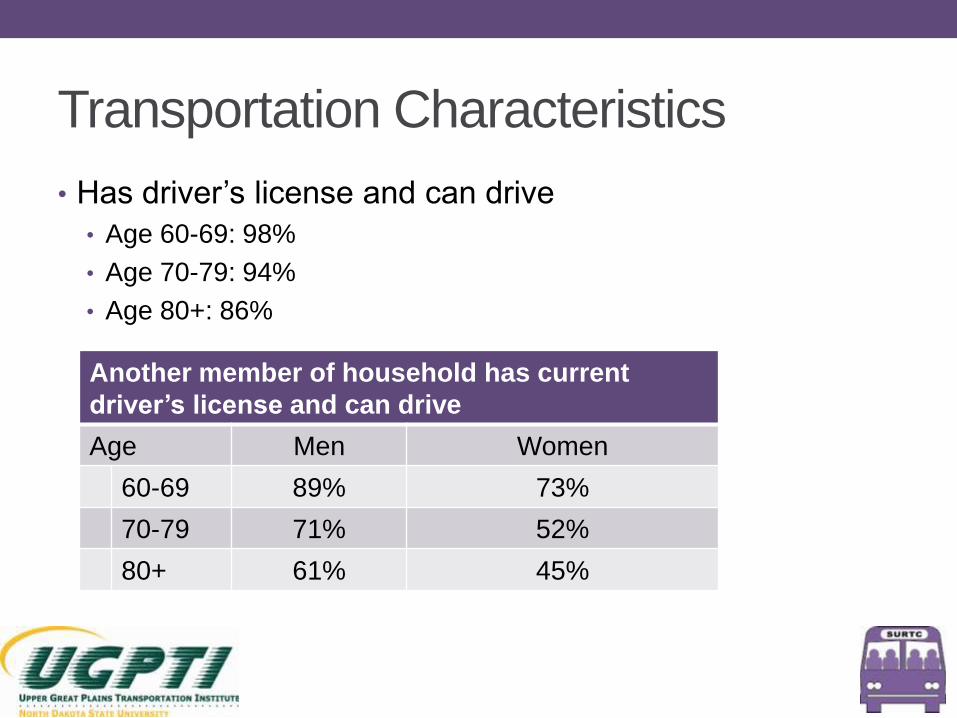
Transportation Characteristics
• Has driver’s license and can drive
• Age 60-69: 98%
• Age 70-79: 94%
• Age 80+: 86%
Another member of household has current
driver’s license and can drive
Age Men Women
60-69 89% 73%
70-79 71% 52%
80+ 61% 45%
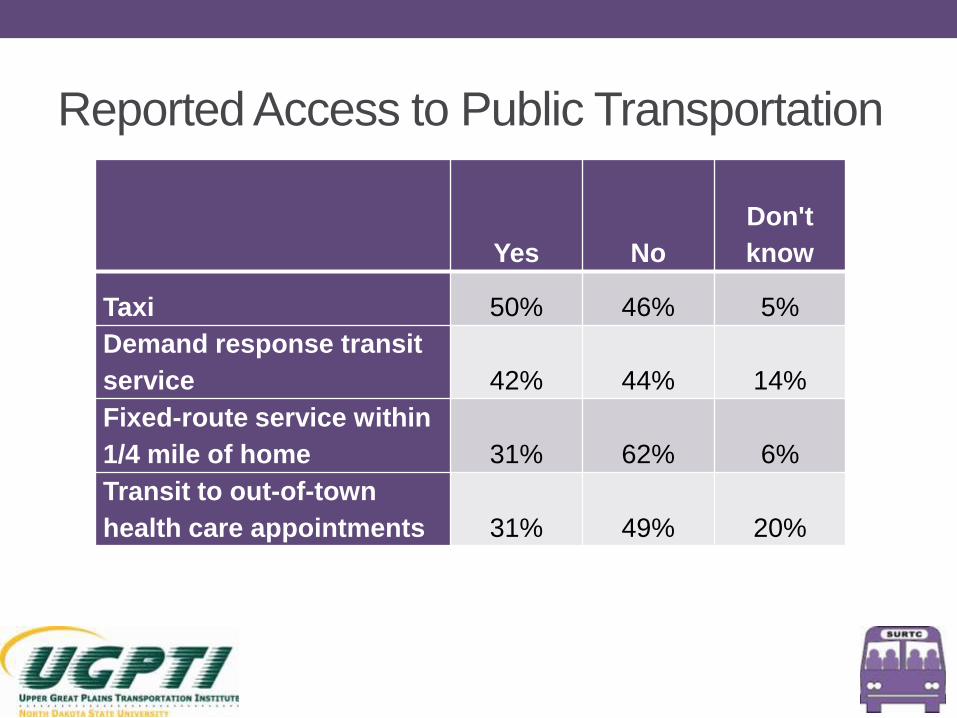
Reported Access to Public Transportation
Yes No
Don't
know
Taxi 50% 46% 5%
Demand response transit
service 42% 44% 14%
Fixed-route service within
1/4 mile of home 31% 62% 6%
Transit to out-of-town
health care appointments 31% 49% 20%
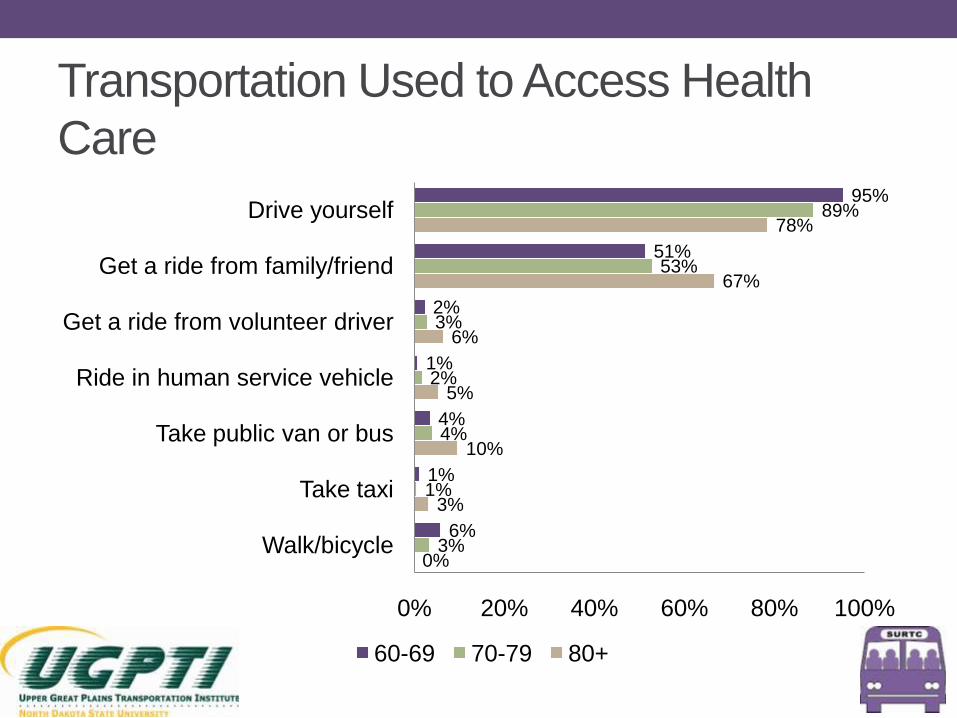
Transportation Used to Access Health
Care95%
51%
2%
1%
4%
1%
6%
89%
53%
3%
2%
4%
1%
3%
78%
67%
6%
5%
10%
3%
0%
0% 20% 40% 60% 80% 100%
Drive yourself
Get a ride from family/friend
Get a ride from volunteer driver
Ride in human service vehicle
Take public van or bus
Take taxi
Walk/bicycle
60-69 70-79 80+
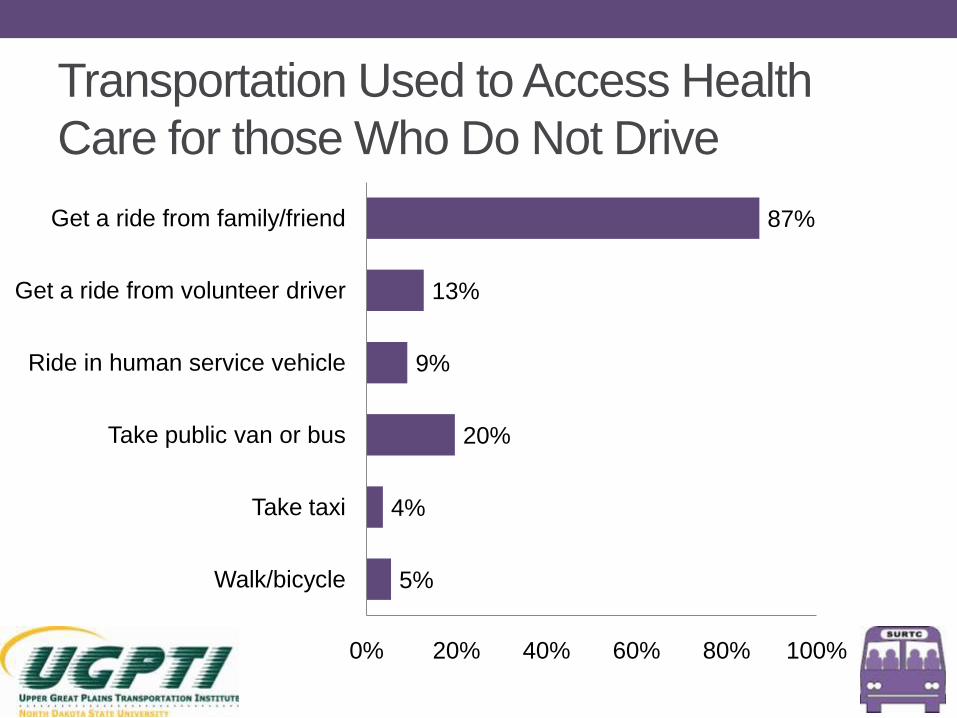
Transportation Used to Access Health
Care for those Who Do Not Drive
87%
13%
9%
20%
4%
5%
0% 20% 40% 60% 80% 100%
Get a ride from family/friend
Get a ride from volunteer driver
Ride in human service vehicle
Take public van or bus
Take taxi
Walk/bicycle
Empirical Analysis
• Trip frequency
• Ordered probit model
• Missed or delayed trips
• Binary probit model
• Difficulty getting transportation
• Ordered probit model
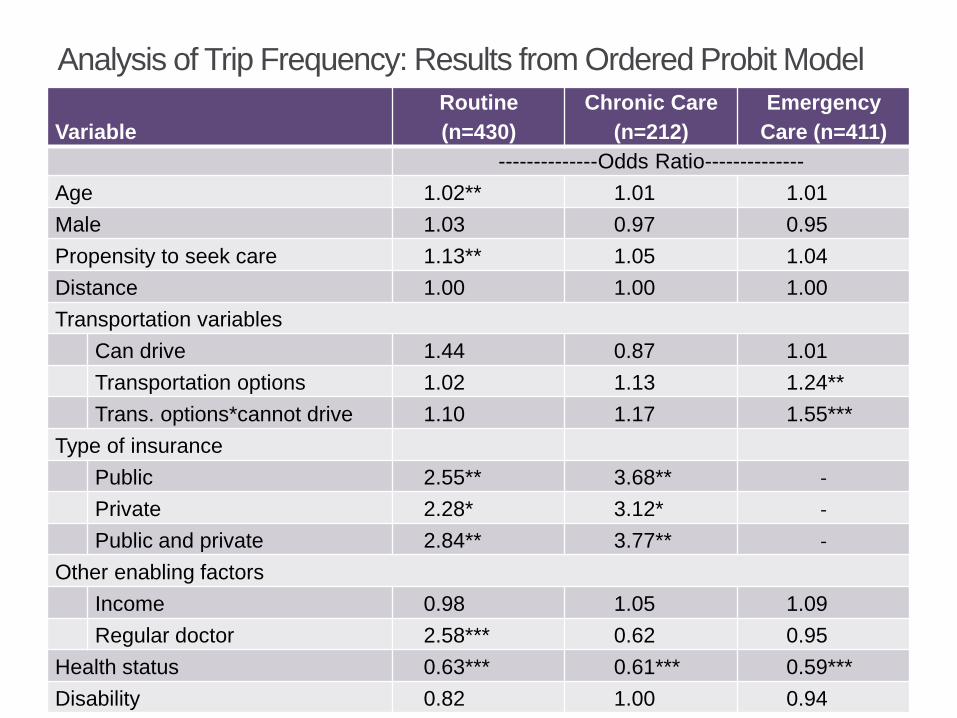
Analysis of Trip Frequency: Results from Ordered Probit Model
Variable
Routine
(n=430)
Chronic Care
(n=212)
Emergency
Care (n=411)
--------------Odds Ratio--------------
Age 1.02** 1.01 1.01
Male 1.03 0.97 0.95
Propensity to seek care 1.13** 1.05 1.04
Distance 1.00 1.00 1.00
Transportation variables
Can drive 1.44 0.87 1.01
Transportation options 1.02 1.13 1.24**
Trans. options*cannot drive 1.10 1.17 1.55***
Type of insurance
Public 2.55** 3.68** -
Private 2.28* 3.12* -
Public and private 2.84** 3.77** -
Other enabling factors
Income 0.98 1.05 1.09
Regular doctor 2.58*** 0.62 0.95
Health status 0.63*** 0.61*** 0.59***
Disability 0.82 1.00 0.94
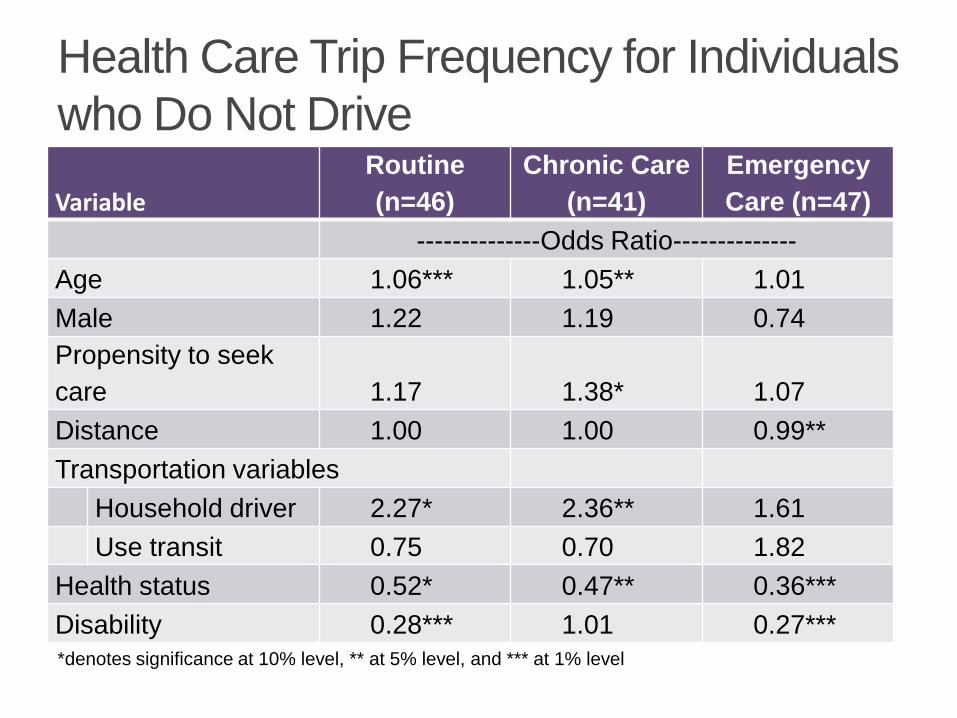
Health Care Trip Frequency for Individuals
who Do Not Drive
Variable
Routine
(n=46)
Chronic Care
(n=41)
Emergency
Care (n=47)
--------------Odds Ratio--------------
Age 1.06*** 1.05** 1.01
Male 1.22 1.19 0.74
Propensity to seek
care 1.17 1.38* 1.07
Distance 1.00 1.00 0.99**
Transportation variables
Household driver 2.27* 2.36** 1.61
Use transit 0.75 0.70 1.82
Health status 0.52* 0.47** 0.36***
Disability 0.28*** 1.01 0.27***
*denotes significance at 10% level, ** at 5% level, and *** at 1% level
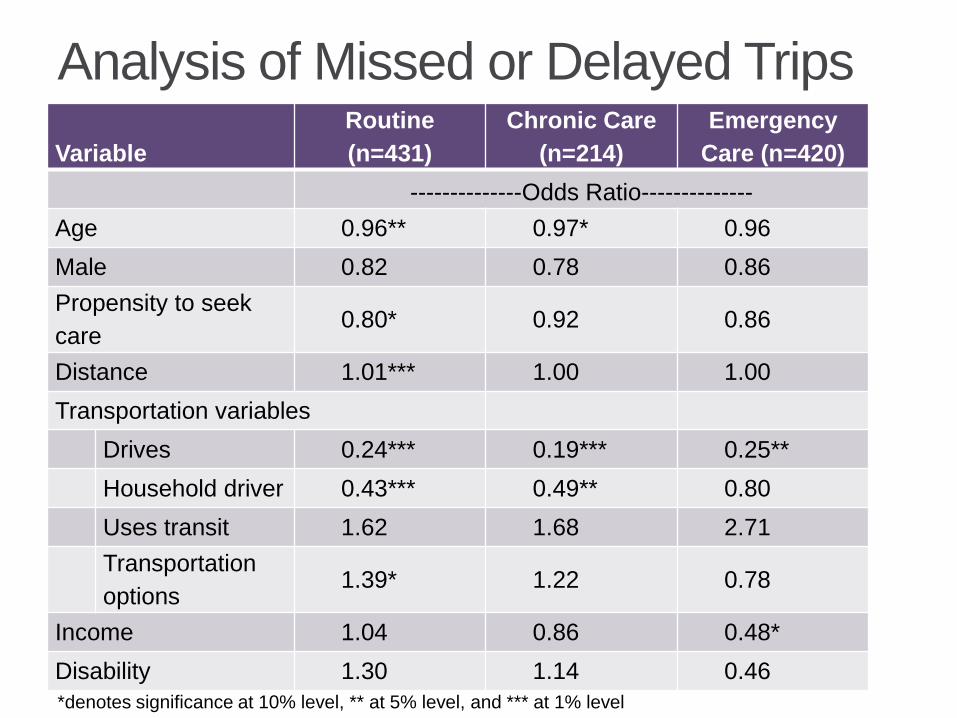
Analysis of Missed or Delayed Trips
Variable
Routine
(n=431)
Chronic Care
(n=214)
Emergency
Care (n=420)
--------------Odds Ratio--------------
Age 0.96** 0.97* 0.96
Male 0.82 0.78 0.86
Propensity to seek
care0.80* 0.92 0.86
Distance 1.01*** 1.00 1.00
Transportation variables
Drives 0.24*** 0.19*** 0.25**
Household driver 0.43*** 0.49** 0.80
Uses transit 1.62 1.68 2.71
Transportation
options1.39* 1.22 0.78
Income 1.04 0.86 0.48*
Disability 1.30 1.14 0.46
*denotes significance at 10% level, ** at 5% level, and *** at 1% level
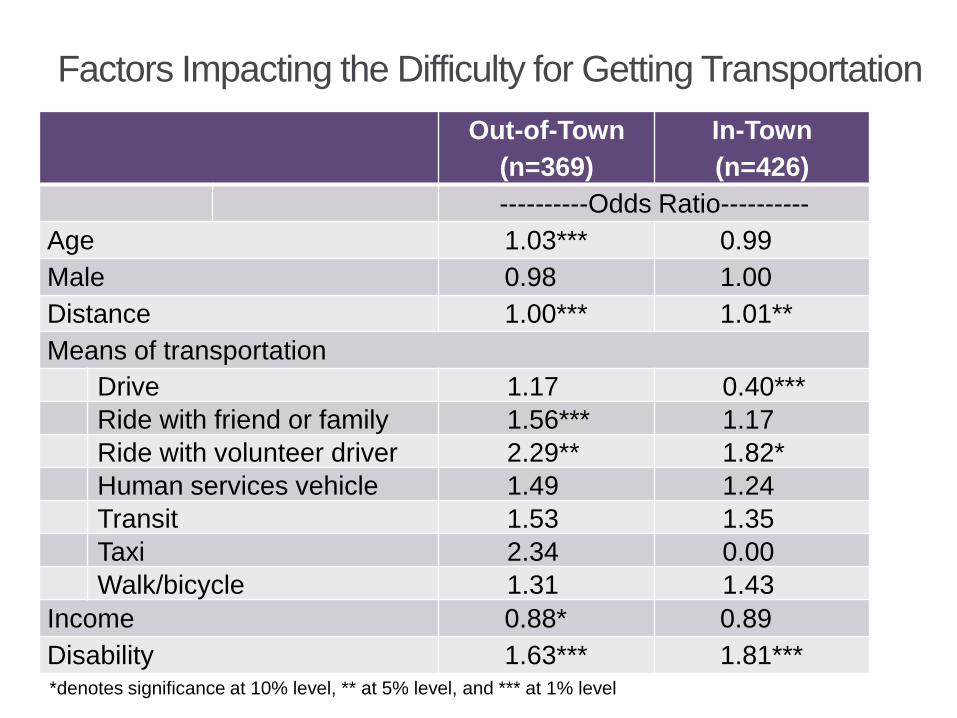
Factors Impacting the Difficulty for Getting Transportation
Out-of-Town
(n=369)
In-Town
(n=426)
----------Odds Ratio----------
Age 1.03*** 0.99
Male 0.98 1.00
Distance 1.00*** 1.01**
Means of transportation
Drive 1.17 0.40***
Ride with friend or family 1.56*** 1.17
Ride with volunteer driver 2.29** 1.82*
Human services vehicle 1.49 1.24
Transit 1.53 1.35
Taxi 2.34 0.00
Walk/bicycle 1.31 1.43
Income 0.88* 0.89
Disability 1.63*** 1.81****denotes significance at 10% level, ** at 5% level, and *** at 1% level
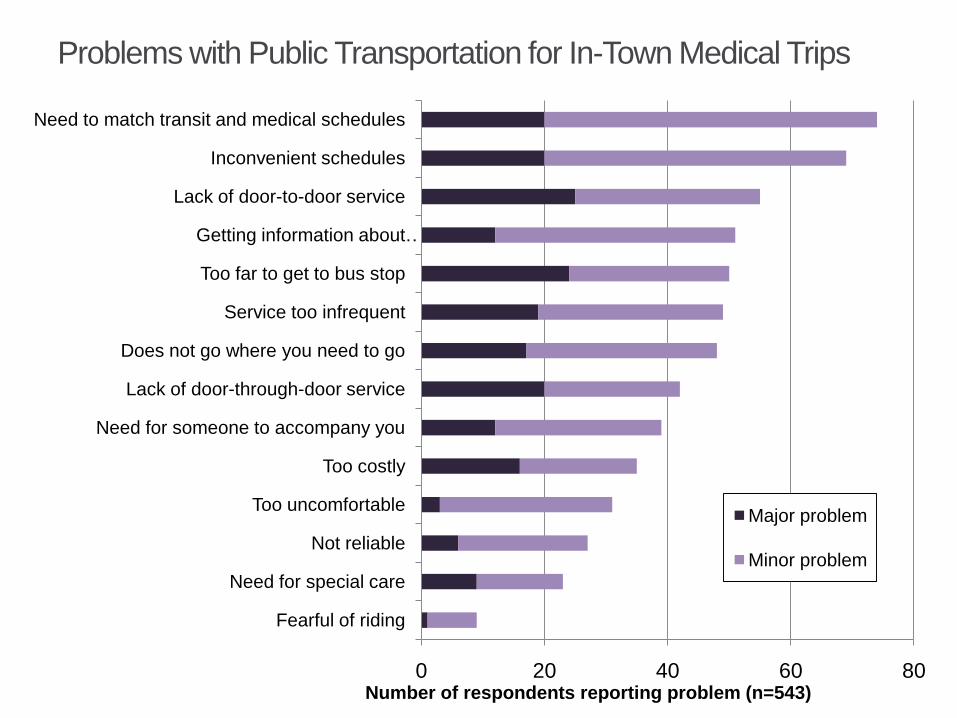
Problems with Public Transportation for In-Town Medical Trips
0 20 40 60 80
Fearful of riding
Need for special care
Not reliable
Too uncomfortable
Too costly
Need for someone to accompany you
Lack of door-through-door service
Does not go where you need to go
Service too infrequent
Too far to get to bus stop
Getting information about …
Lack of door-to-door service
Inconvenient schedules
Need to match transit and medical schedules
Number of respondents reporting problem (n=543)
Major problem
Minor problem
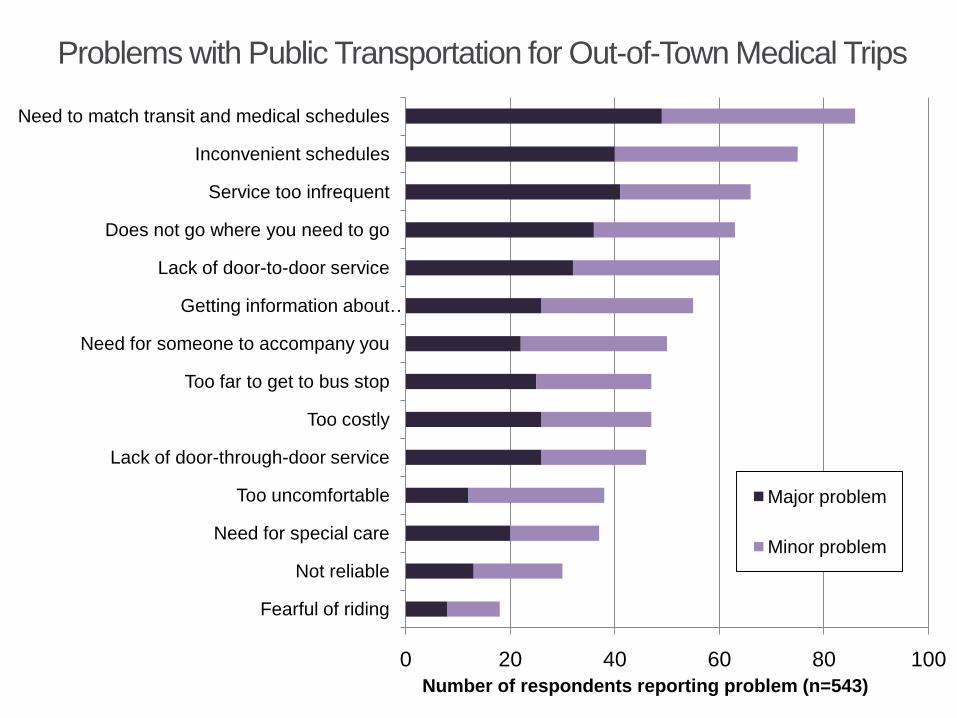
Problems with Public Transportation for Out-of-Town Medical Trips
0 20 40 60 80 100
Fearful of riding
Not reliable
Need for special care
Too uncomfortable
Lack of door-through-door service
Too costly
Too far to get to bus stop
Need for someone to accompany you
Getting information about …
Lack of door-to-door service
Does not go where you need to go
Service too infrequent
Inconvenient schedules
Need to match transit and medical schedules
Number of respondents reporting problem (n=543)
Major problem
Minor problem
Other Comments
• “Although I do not need it at this point, I feel it is extremely
important that it is available for those who do need it.”
• “At this stage of my life I do not need it yet. But should it
be a necessity, I would be very lucky if I had access to it.”
• “My son has to take time off work to take me.”
• “This year my daughter lost her job so therefore she was
able to take me to my appointments.”
• “Would probably need to move into town if critical health
conditions were to develop.”
• “If I were unable to drive, all medical would be a problem!
Being realistic, that could happen at any time!”
Conclusions
• Those who cannot drive make more health care trips if
someone else in the household can drive.
• Distance and access to transportation impact the
likelihood that someone will miss or delay a trip. If trips
are delayed, the level of care required may become more
severe and more costly.
• Difficulty reported in making trips is significantly affected
by distance and availability of transportation options.
• The type of transit service provided needs to be
convenient and frequent enough, and the transit and
medical schedules need to be coordinated.
QUESTIONS?
Jeremy Mattson
Associate Research Fellow
Small Urban & Rural Transit Center
Upper Great Plains Transportation Institute
North Dakota State University
www.surtc.org