Embed Size (px)
Citation preview
Pathophysiology of Diabetes: The Ominous Octet
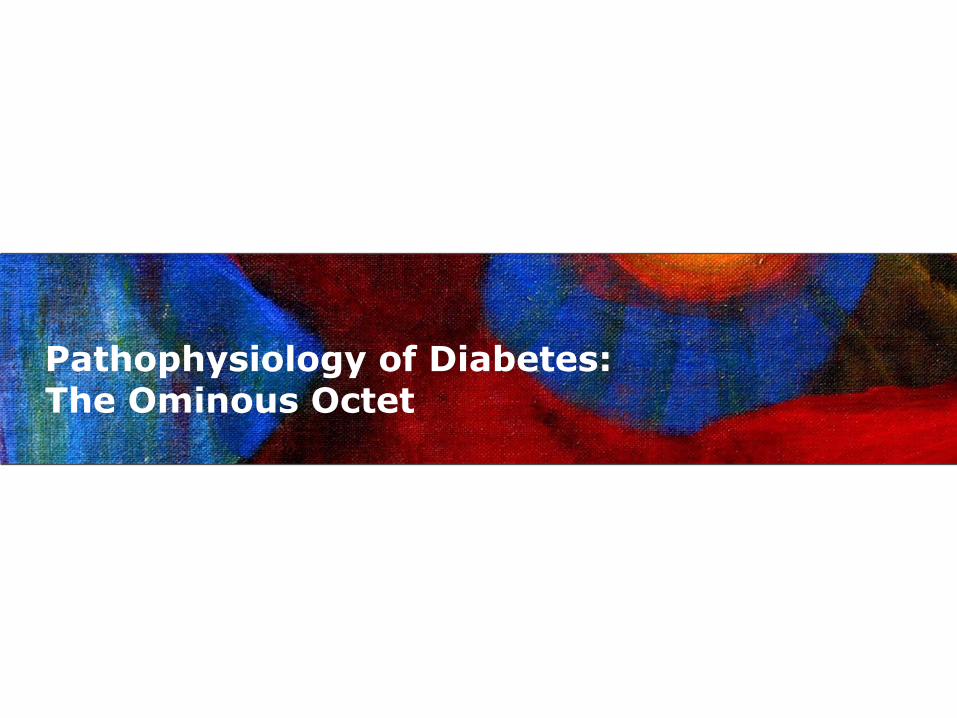
Etiology of -cell dysfunction in type 2 diabetes
-Celldysfunction
LipotoxicityFree
Fatty Acids
GlucoseToxicity
Age
InsulinResistance
Amyloid Deposition
Genetics(TCF 7L2)
IncretinEffect
Adapted from De Fronzo RA. Diabetes 2009;58:773-95.
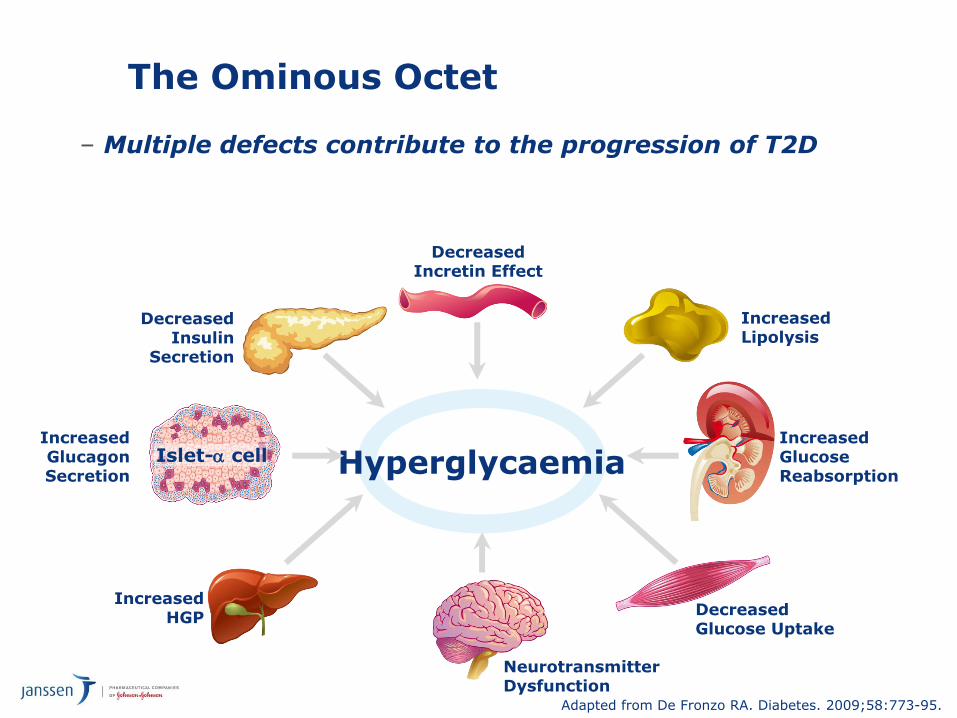
The Ominous Octet
– Multiple defects contribute to the progression of T2D
Adapted from De Fronzo RA. Diabetes. 2009;58:773-95.
Hyperglycaemia
DecreasedInsulin
Secretion
IncreasedGlucagonSecretion
NeurotransmitterDysfunction
DecreasedIncretin Effect
IncreasedHGP
DecreasedGlucose Uptake
IncreasedGlucoseReabsorption
IncreasedLipolysis
Islet-a cell
The Role of the Kidney in Diabetes
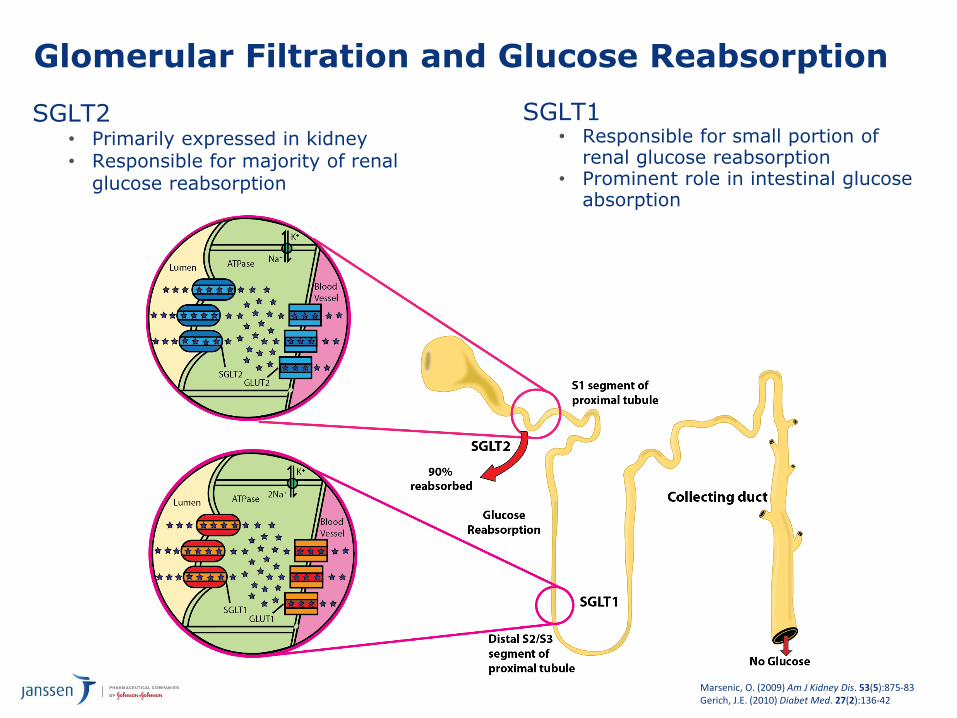
Glomerular Filtration and Glucose Reabsorption
Marsenic, O. (2009) Am J Kidney Dis. 53(5):875-83Gerich, J.E. (2010) Diabet Med. 27(2):136-42
SGLT2• Primarily expressed in kidney• Responsible for majority of renal
glucose reabsorption
SGLT1• Responsible for small portion of
renal glucose reabsorption• Prominent role in intestinal glucose
absorption
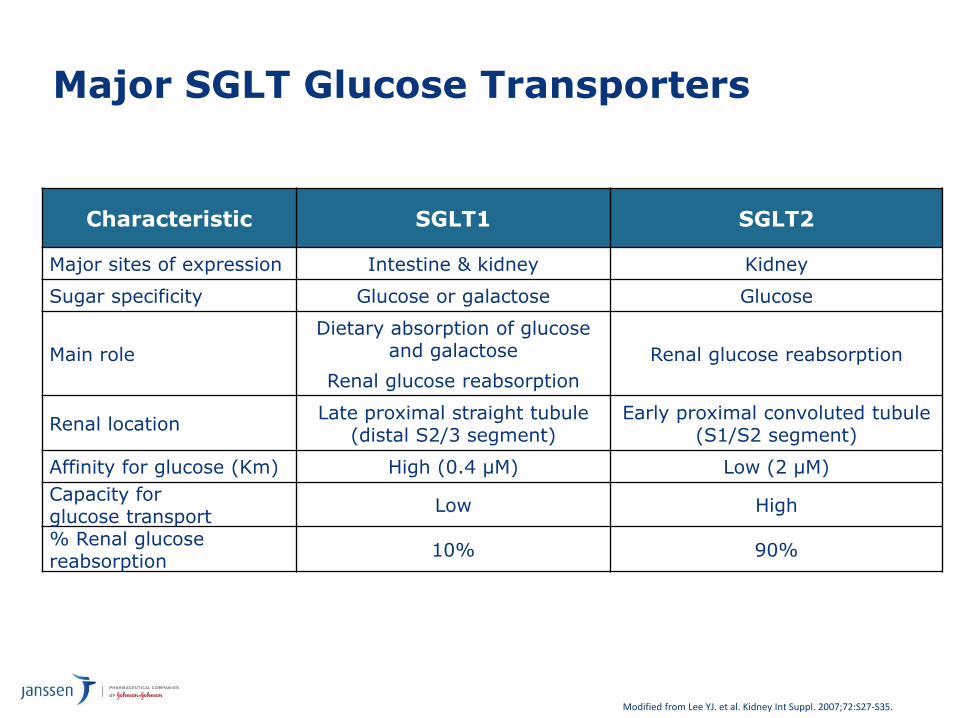
Major SGLT Glucose Transporters
Modified from Lee YJ. et al. Kidney Int Suppl. 2007;72:S27-S35.
Characteristic SGLT1 SGLT2
Major sites of expression Intestine & kidney Kidney
Sugar specificity Glucose or galactose Glucose
Main role
Dietary absorption of glucose and galactose
Renal glucose reabsorption
Renal glucose reabsorption
Renal locationLate proximal straight tubule
(distal S2/3 segment)Early proximal convoluted tubule
(S1/S2 segment)
Affinity for glucose (Km) High (0.4 μM) Low (2 μM)
Capacity for glucose transport
Low High
% Renal glucose reabsorption
10% 90%
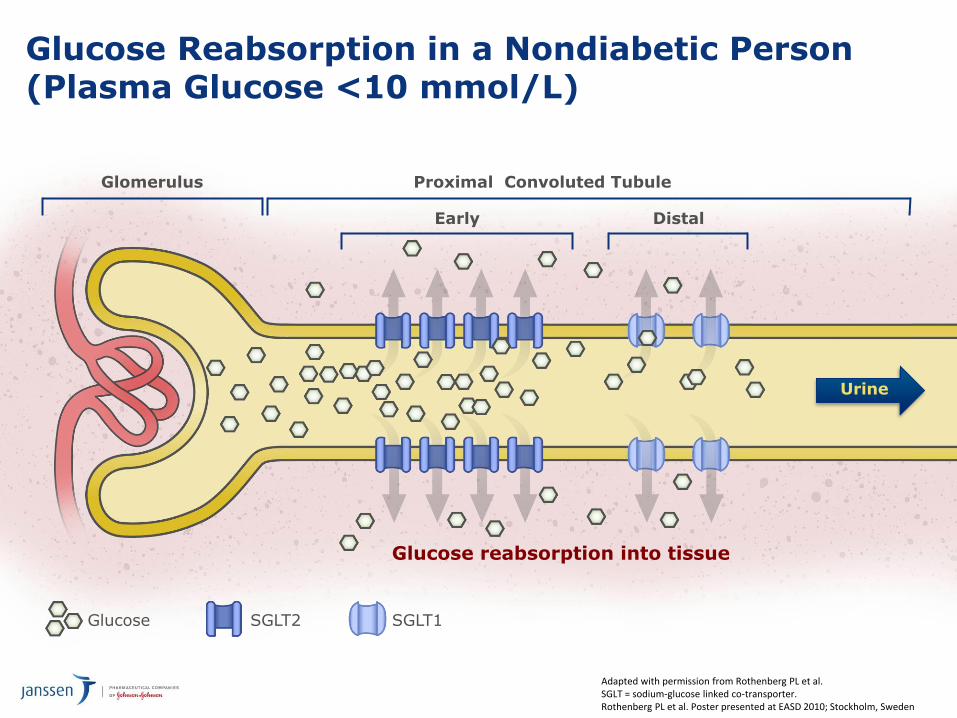
Glucose Reabsorption in a Nondiabetic Person (Plasma Glucose <10 mmol/L)
Glomerulus Proximal Convoluted Tubule
Glucose reabsorption into tissue
Early Distal
Glucose SGLT1SGLT2
Urine
Adapted with permission from Rothenberg PL et al. SGLT = sodium-glucose linked co-transporter.Rothenberg PL et al. Poster presented at EASD 2010; Stockholm, Sweden
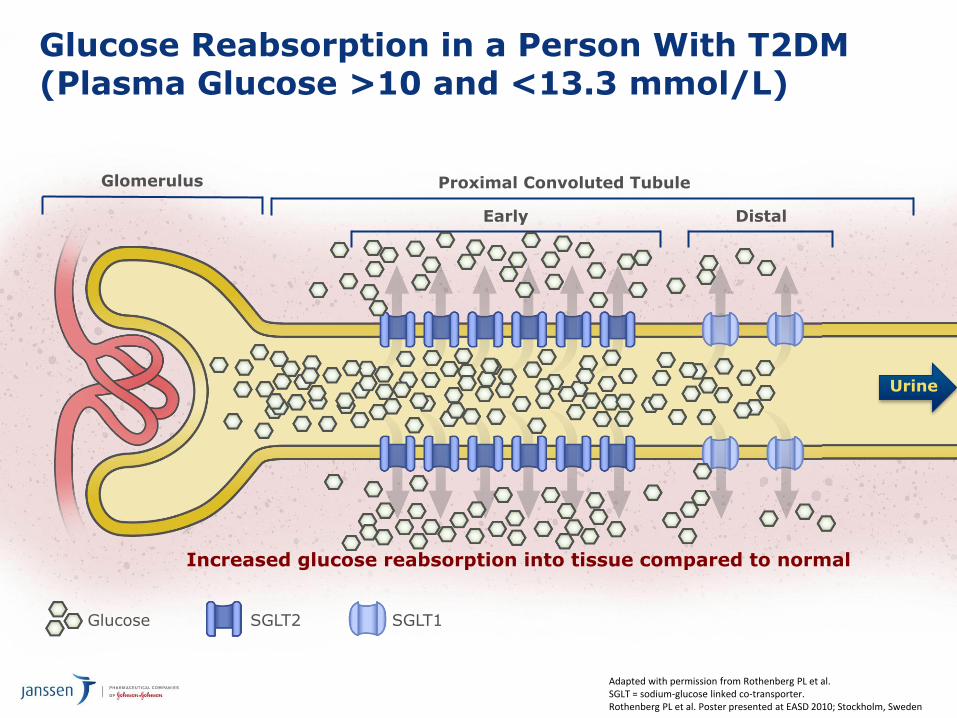
Glucose Reabsorption in a Person With T2DM (Plasma Glucose >10 and <13.3 mmol/L)
Glomerulus Proximal Convoluted Tubule
Increased glucose reabsorption into tissue compared to normal
Early Distal
Urine
Adapted with permission from Rothenberg PL et al. SGLT = sodium-glucose linked co-transporter.Rothenberg PL et al. Poster presented at EASD 2010; Stockholm, Sweden
Glucose SGLT1SGLT2
Urin
ary G
luco
se
Excreti
on
(g/d
)
0
100
50
25
0
Plasma Glucose (mmol/L)
150
75
125
1412108642
Below RTG
Minimal Glucosuria OccursAbove RTG
Glucosuria Occurs
Healthy RTG
~10 mmol/L
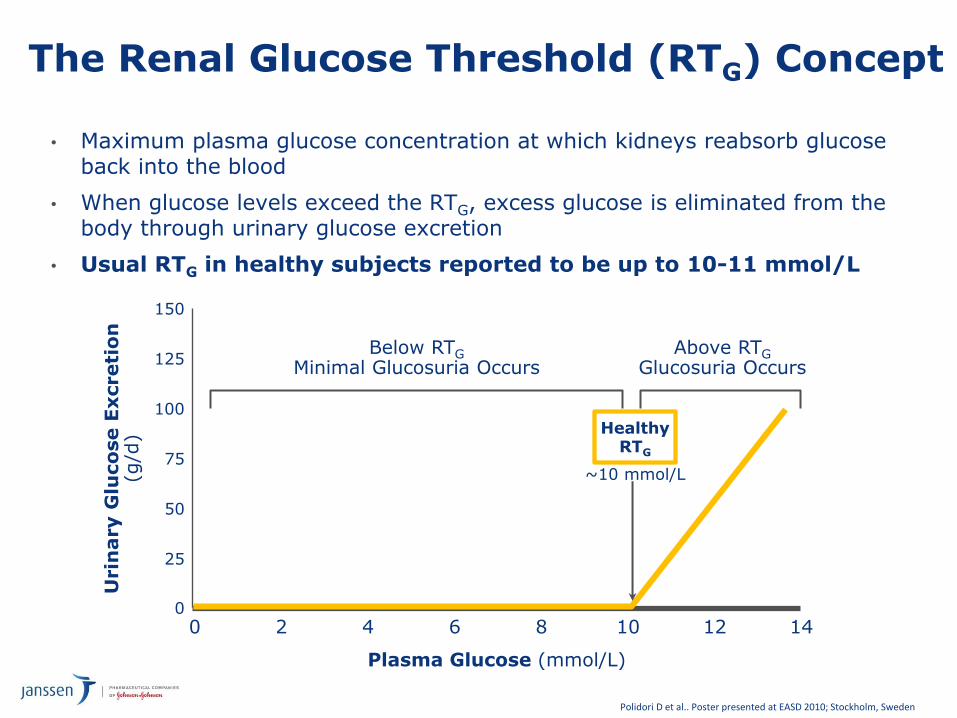
The Renal Glucose Threshold (RTG) Concept
• Maximum plasma glucose concentration at which kidneys reabsorb glucose back into the blood
• When glucose levels exceed the RTG, excess glucose is eliminated from the body through urinary glucose excretion
• Usual RTG in healthy subjects reported to be up to 10-11 mmol/L
Polidori D et al.. Poster presented at EASD 2010; Stockholm, Sweden

Urin
ary G
luco
se E
xcreti
on
(g/d
ay)
0
75
100
50
150
Plasma Glucose (mmol/L)
125
25
4 6 8 1610 14
Below RTG minimal glucosuria occurs
12
Healthy RTG
T2DMRTG
Above RTG glucosuria occurs
~13.8 mmol/L~10 mmol/L
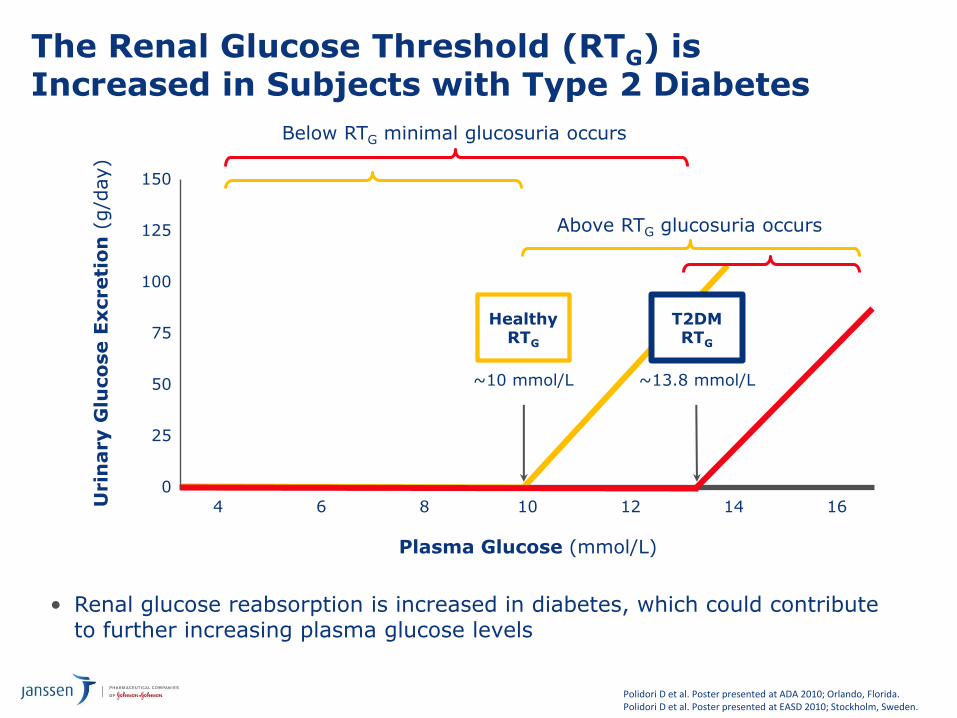
The Renal Glucose Threshold (RTG) is Increased in Subjects with Type 2 Diabetes
Polidori D et al. Poster presented at ADA 2010; Orlando, Florida.Polidori D et al. Poster presented at EASD 2010; Stockholm, Sweden.
• Renal glucose reabsorption is increased in diabetes, which could contribute to further increasing plasma glucose levels
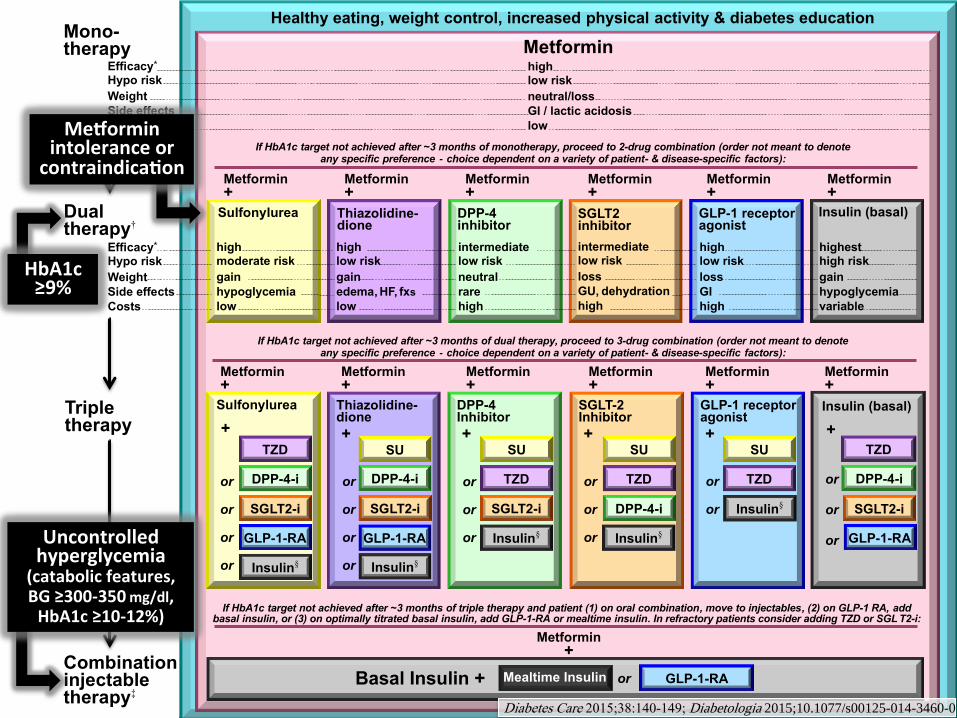
Healthy eating, weight control, increased physical activity & diabetes education
Metformin high low risk
neutral/loss
GI / lactic acidosis
low
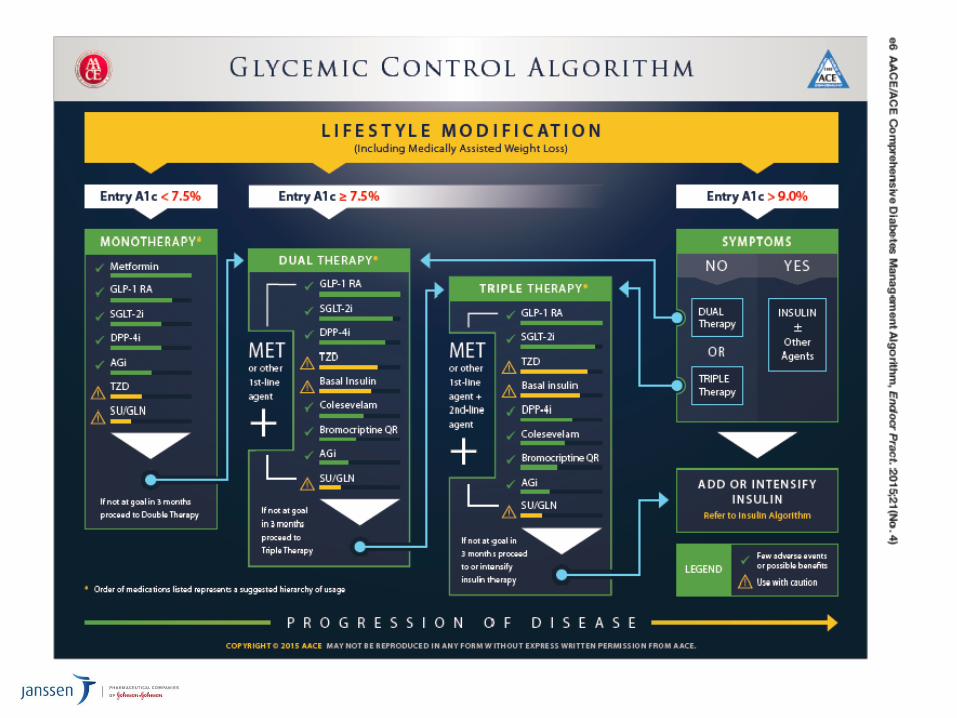
If HbA1c target not achieved after ~3 months of monotherapy, proceed to 2-drug combination (order not meant to denote any specific preference - choice dependent on a variety of patient- & disease-specific factors):
Metformin +
Metformin +
Metformin +
Metformin +
Metformin +
high low risk
gain
edema, HF, fxs
low
Thiazolidine- dione
intermediate low risk
neutral
rare
high
DPP-4 inhibitor
highest high risk
gain
hypoglycemia
variable
Insulin (basal)
Metformin +
Metformin +
Metformin +
Metformin +
Metformin +
Basal Insulin +
Sulfonylurea
+
TZD
DPP-4-i
GLP-1-RA
Insulin§
or
or
or
or
Thiazolidine-dione
+ SU
DPP-4-i
GLP-1-RA
Insulin§
TZD
DPP-4-i
GLP-1-RA
high low risk
loss
GI
high
GLP-1 receptor agonist
Sulfonylurea
high moderate risk
gain
hypoglycemia
low
SGLT2 inhibitor
intermediate low risk
loss
GU, dehydration
high
SU
TZD
Insulin§
GLP-1 receptor agonist
+
SGLT-2 Inhibitor +
SU
TZD
Insulin§
Metformin +
Metformin +
or
or
or
or
SGLT2-i
or
or
or
SGLT2-i
Mono- therapy
Efficacy* Hypo risk
Weight
Side effects
Costs
Dual therapy†
Efficacy* Hypo risk
Weight
Side effects
Costs
Triple therapy
or
or
DPP-4 Inhibitor
+ SU
TZD
Insulin§
SGLT2-i
or
or
or
SGLT2-i
or
DPP-4-i
If HbA1c target not achieved after ~3 months of dual therapy, proceed to 3-drug combination (order not meant to denote any specific preference - choice dependent on a variety of patient- & disease-specific factors):
If HbA1c target not achieved after ~3 months of triple therapy and patient (1) on oral combination, move to injectables, (2) on GLP-1 RA, add basal insulin, or (3) on optimally titrated basal insulin, add GLP-1-RA or mealtime insulin. In refractory patients consider adding TZD or SGL T2-i:
Metformin +
Combination injectable therapy‡
GLP-1-RA Mealtime Insulin
HbA1c≥9%
Me orminintoleranceorcontraindica on
Uncontrolledhyperglycemia
(catabolicfeatures,BG≥300-350mg/dl,HbA1c≥10-12%)
Insulin (basal)
+
or
or
or
Diabetes Care 2015;38:140-149; Diabetologia 2015;10.1077/s00125-014-3460-0
Urin
ary G
luco
se E
xcreti
on
(g/d
ay)
0
75
100
50
150
Plasma Glucose (mmol/L)
125
25
4 6 8 1610 14
Below RTG minimal glucosuria occurs
12
Healthy RTG
T2DMRTG
Above RTG glucosuria occurs
~13.8 mmol/L~10 mmol/L
The Renal Glucose Threshold (RTG) is Increased in Subjects with Type 2 Diabetes
Polidori D et al. Poster presented at ADA 2010; Orlando, Florida.Polidori D et al. Poster presented at EASD 2010; Stockholm, Sweden.
• Renal glucose reabsorption is increased in diabetes, which could contribute to further increasing plasma glucose levels
Urin
ary
Glu
co
se
Excreti
on
(g/d
)
0
100
50
25
0
Plasma Glucose (mmol/L)
150
75
125
1412108642
Below RTG minimal glucosuria occurs
Above RTG glucosuria occurs
RTGRTG
Untreatedhealthy
SGLT2i-treatedT2DM
UntreatedT2DM
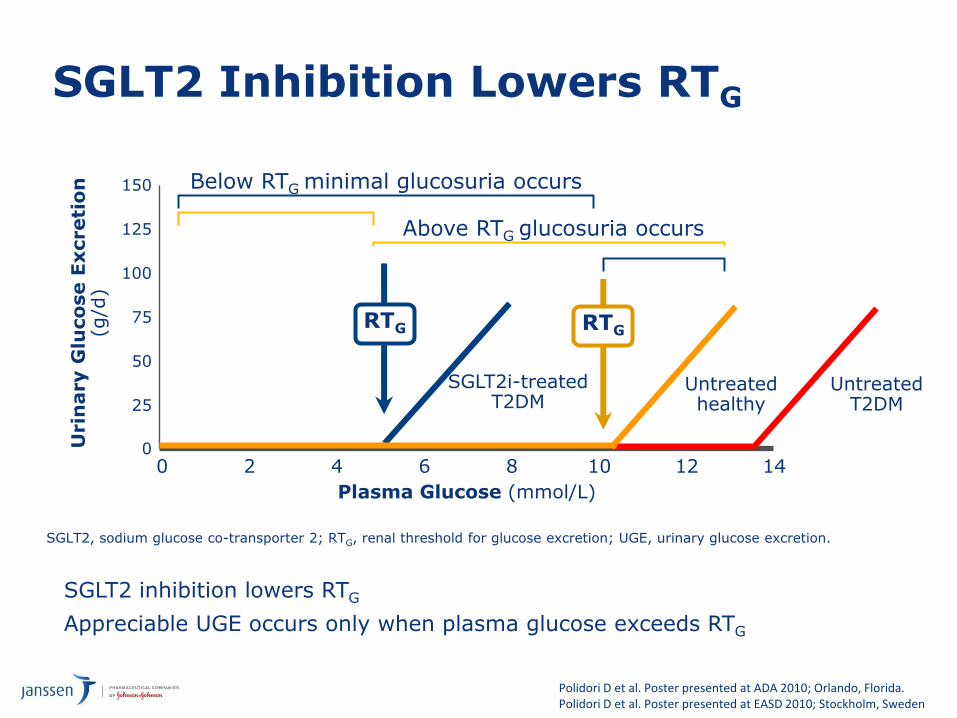
SGLT2, sodium glucose co-transporter 2; RTG, renal threshold for glucose excretion; UGE, urinary glucose excretion.
SGLT2 inhibition lowers RTG
Appreciable UGE occurs only when plasma glucose exceeds RTG
Polidori D et al. Poster presented at ADA 2010; Orlando, Florida.Polidori D et al. Poster presented at EASD 2010; Stockholm, Sweden
SGLT2 Inhibition Lowers RTG
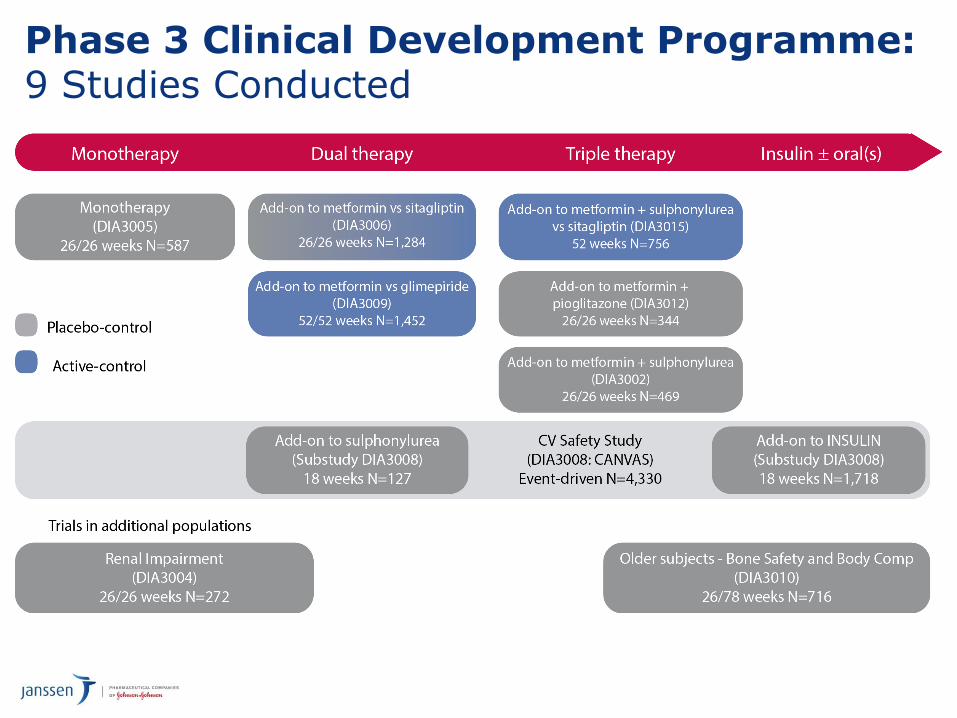
Phase 3 Clinical Development Programme: 9 Studies Conducted
Canagliflozin Head to Head StudiesAdd-on to MET Study: Canagliflozin vs Sitagliptin (DIA3006)
16
Screening Visit
Week–2
Day 1Baseline
AHA Adjustment Period Start
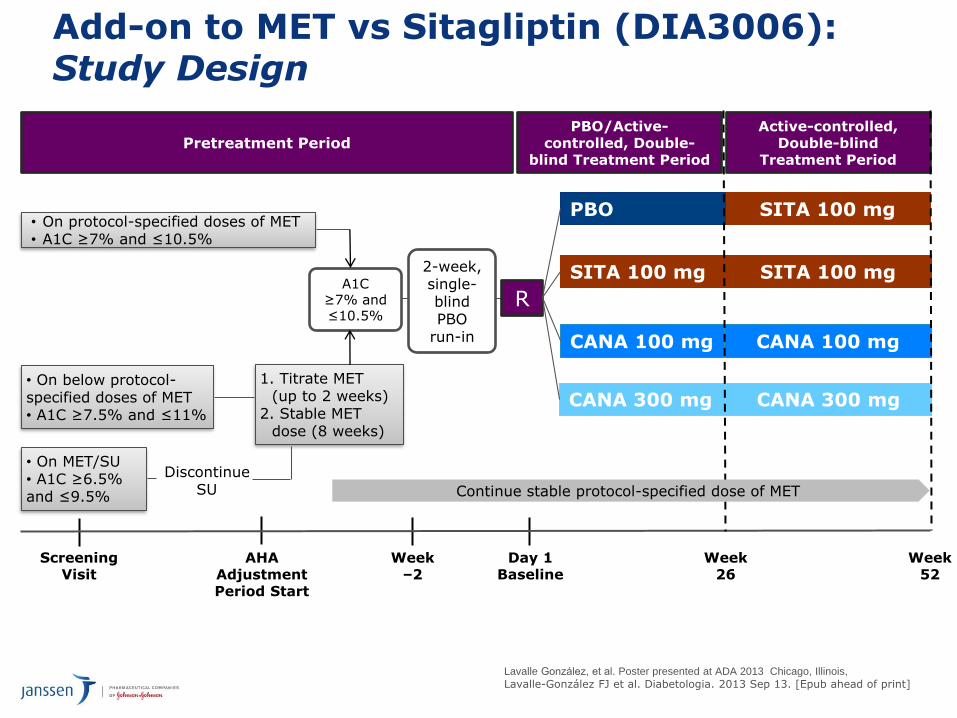
• On protocol-specified doses of MET• A1C ≥7% and ≤10.5%
Week52
CANA 300 mg
SITA 100 mg
PBO
A1C≥7% and ≤10.5%
R
SITA 100 mg
SITA 100 mg
CANA 300 mg
Week26
CANA 100 mg CANA 100 mg
• On below protocol-specified doses of MET• A1C ≥7.5% and ≤11%
1. Titrate MET (up to 2 weeks)
2. Stable MET dose (8 weeks)
• On MET/SU• A1C ≥6.5% and ≤9.5%
Add-on to MET vs Sitagliptin (DIA3006): Study Design
Pretreatment PeriodPBO/Active-
controlled, Double-blind Treatment Period
Active-controlled, Double-blind
Treatment Period
PBO
Continue stable protocol-specified dose of MET
2-week, single-blind PBO
run-in
Discontinue SU
17
Lavalle González, et al. Poster presented at ADA 2013 Chicago, Illinois,
Lavalle-González FJ et al. Diabetologia. 2013 Sep 13. [Epub ahead of print]
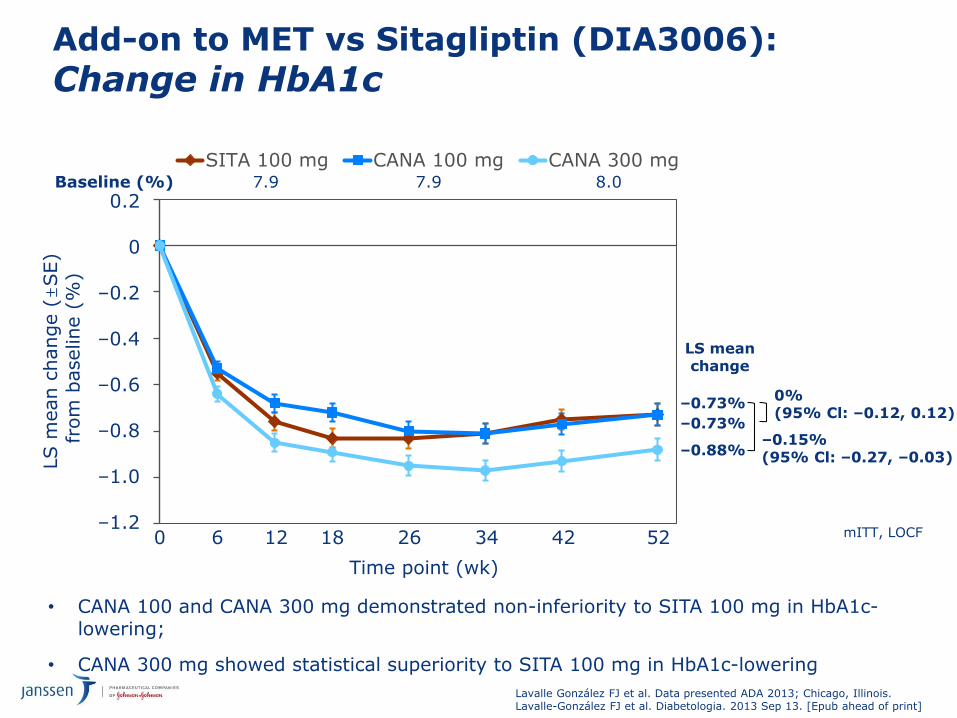
Add-on to MET vs Sitagliptin (DIA3006):
Change in HbA1c
SITA 100 mg CANA 100 mg CANA 300 mg
Time point (wk)
LS m
ean c
hange (±SE)
from
baseline (
%)
Baseline (%) 7.9 7.9 8.0
LS meanchange
0%(95% Cl: –0.12, 0.12)
–0.73%
–0.73%
–0.88%–0.15%(95% Cl: –0.27, –0.03)
0 6 12 18 26 34 42 52
0.2
0
–0.2
–0.4
–0.6
–0.8
–1.0
–1.2mITT, LOCF
Lavalle González FJ et al. Data presented ADA 2013; Chicago, Illinois.Lavalle-González FJ et al. Diabetologia. 2013 Sep 13. [Epub ahead of print]
• CANA 100 and CANA 300 mg demonstrated non-inferiority to SITA 100 mg in HbA1c-lowering;
• CANA 300 mg showed statistical superiority to SITA 100 mg in HbA1c-lowering
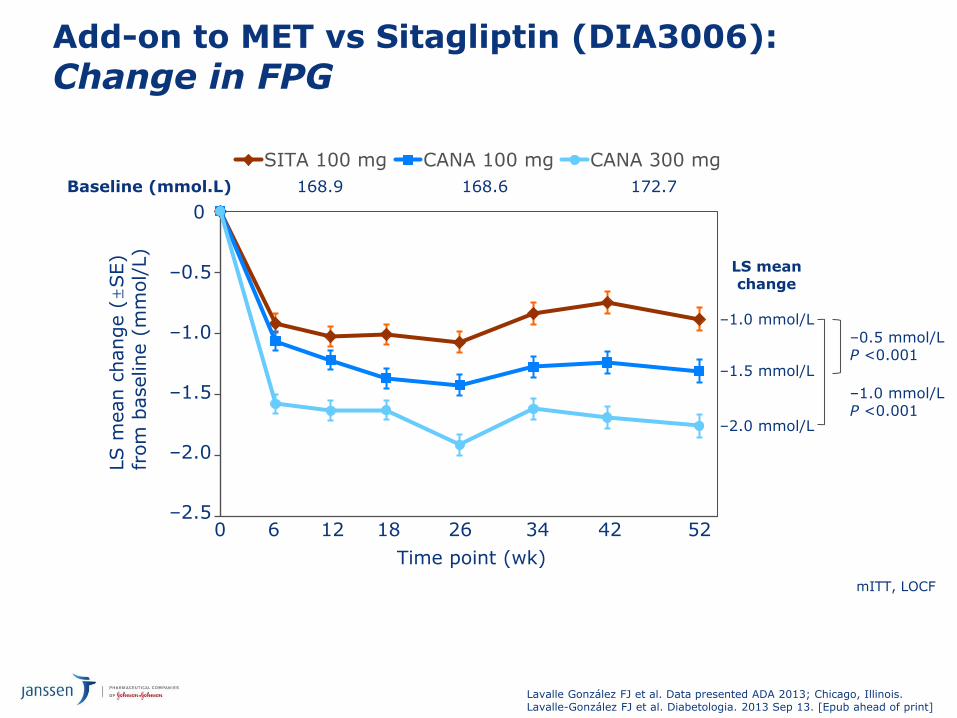
Add-on to MET vs Sitagliptin (DIA3006):
Change in FPG
SITA 100 mg CANA 100 mg CANA 300 mg
LS m
ean c
hange (±SE)
from
baseline (
mm
ol/
L)
Baseline (mmol.L) 168.9 168.6 172.7
LS mean change
–0.5 mmol/LP <0.001
–1.0 mmol/LP <0.001
–1.0 mmol/L
–1.5 mmol/L
–2.0 mmol/L
Time point (wk)
0 6 12 18 26 34 42 52
0
–0.5
–1.0
–1.5
–2.0
–2.5
mITT, LOCF
Lavalle González FJ et al. Data presented ADA 2013; Chicago, Illinois.Lavalle-González FJ et al. Diabetologia. 2013 Sep 13. [Epub ahead of print]
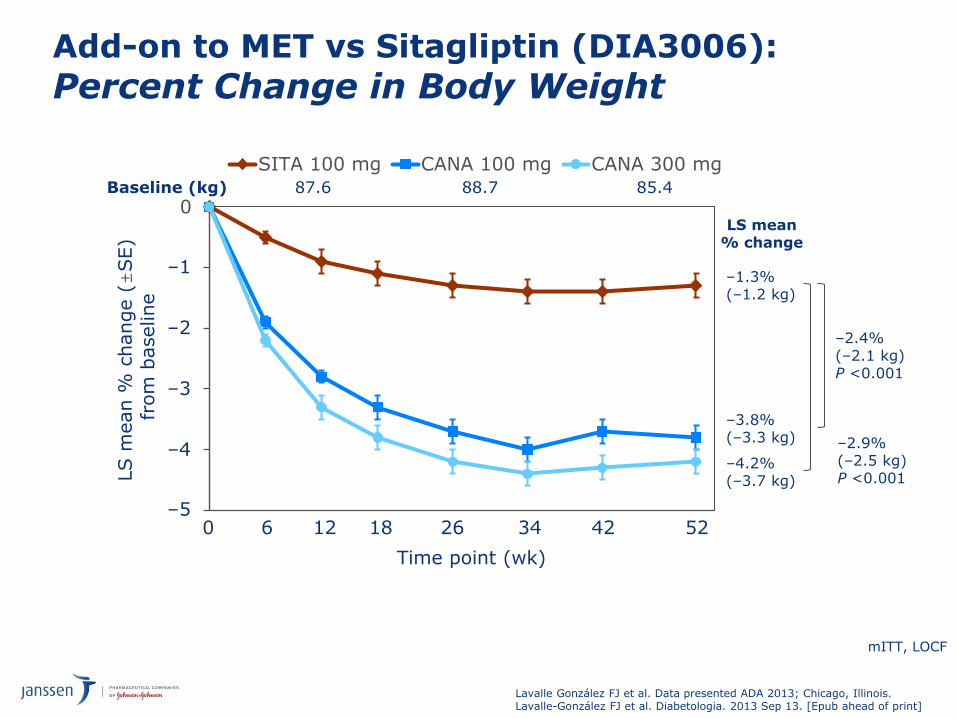
Add-on to MET vs Sitagliptin (DIA3006):
Percent Change in Body WeightLS m
ean %
change (±SE)
from
baseline
Baseline (kg) 87.6 88.7 85.4
LS mean % change
–2.4% (–2.1 kg)P <0.001
–2.9% (–2.5 kg)P <0.001
–1.3%(–1.2 kg)
–3.8%(–3.3 kg)
–4.2%(–3.7 kg)
Time point (wk)
-5
-4
-3
-2
-1
0
SITA 100 mg CANA 100 mg CANA 300 mg
0 6 12 18 26 34 42 52
–4
–5
–3
–2
–1
mITT, LOCF
Lavalle González FJ et al. Data presented ADA 2013; Chicago, Illinois.Lavalle-González FJ et al. Diabetologia. 2013 Sep 13. [Epub ahead of print]
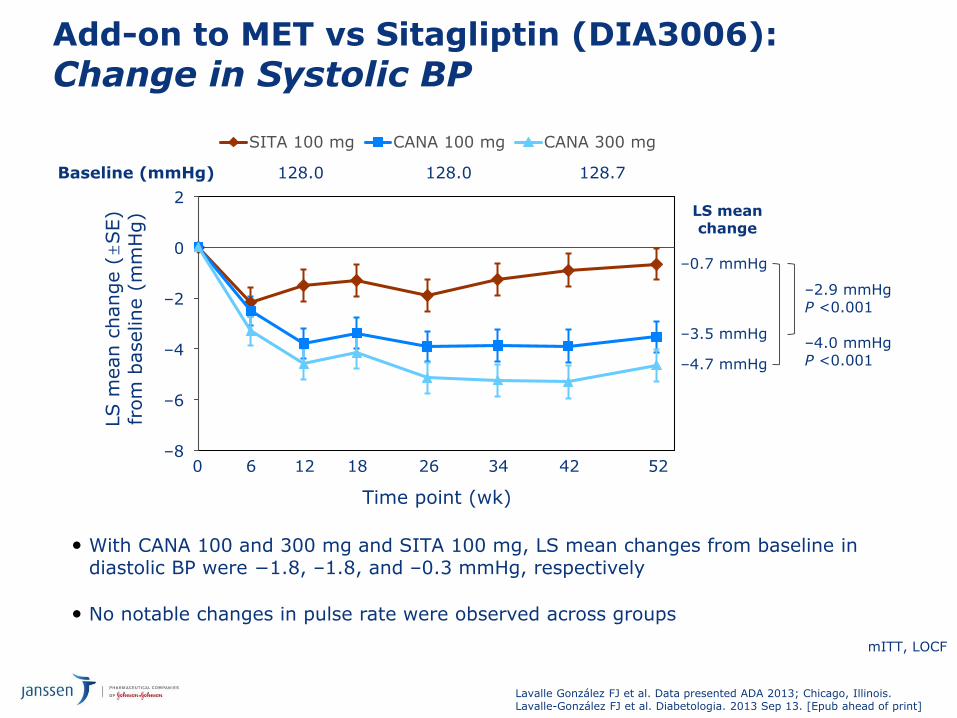
Add-on to MET vs Sitagliptin (DIA3006):
Change in Systolic BP
• With CANA 100 and 300 mg and SITA 100 mg, LS mean changes from baseline in diastolic BP were −1.8, –1.8, and –0.3 mmHg, respectively
• No notable changes in pulse rate were observed across groups
LS m
ean c
hange (±SE)
from
baseline (
mm
Hg)
SITA 100 mg CANA 100 mg CANA 300 mg
–2
–4
–6
2
0
–8
Baseline (mmHg) 128.0 128.0 128.7
LS mean change
–2.9 mmHgP <0.001
–4.0 mmHgP <0.001
–0.7 mmHg
–3.5 mmHg
–4.7 mmHg
Time point (wk)
0 6 12 18 26 34 42 52
mITT, LOCF
Lavalle González FJ et al. Data presented ADA 2013; Chicago, Illinois.Lavalle-González FJ et al. Diabetologia. 2013 Sep 13. [Epub ahead of print]
Canagliflozin Head to Head StudiesAdd-on to MET Study: Canagliflozin vs Glimepiride (DIA3009)
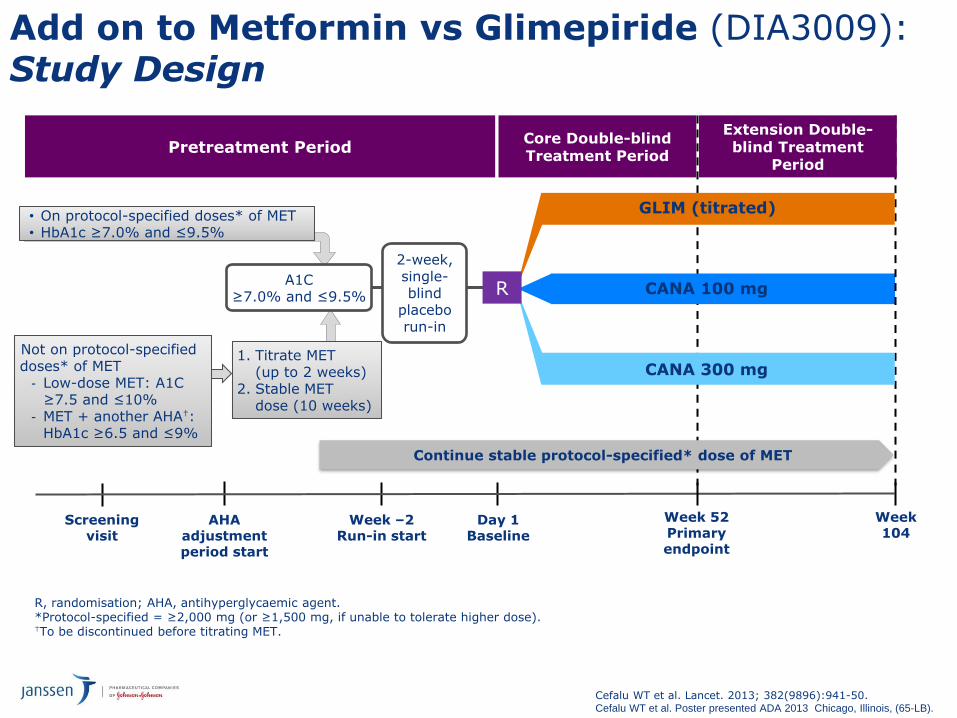
Add on to Metformin vs Glimepiride (DIA3009): Study Design
R, randomisation; AHA, antihyperglycaemic agent.*Protocol-specified = ≥2,000 mg (or ≥1,500 mg, if unable to tolerate higher dose).†To be discontinued before titrating MET.
Pretreatment PeriodCore Double-blind Treatment Period
Screening visit
Week –2Run-in start
Day 1Baseline
AHA adjustment period start
• On protocol-specified doses* of MET• HbA1c ≥7.0% and ≤9.5%
Week 104
Continue stable protocol-specified* dose of MET
CANA 300 mg
CANA 100 mg
GLIM (titrated)
Not on protocol-specified doses* of MET
- Low-dose MET: A1C ≥7.5 and ≤10%
- MET + another AHA†: HbA1c ≥6.5 and ≤9%
1. Titrate MET(up to 2 weeks)
2. Stable MET dose (10 weeks)
A1C≥7.0% and ≤9.5%
2-week, single-blind
placebo run-in
R
Extension Double-blind Treatment
Period
Week 52Primary endpoint
Cefalu WT et al. Lancet. 2013; 382(9896):941-50. Cefalu WT et al. Poster presented ADA 2013 Chicago, Illinois, (65-LB).
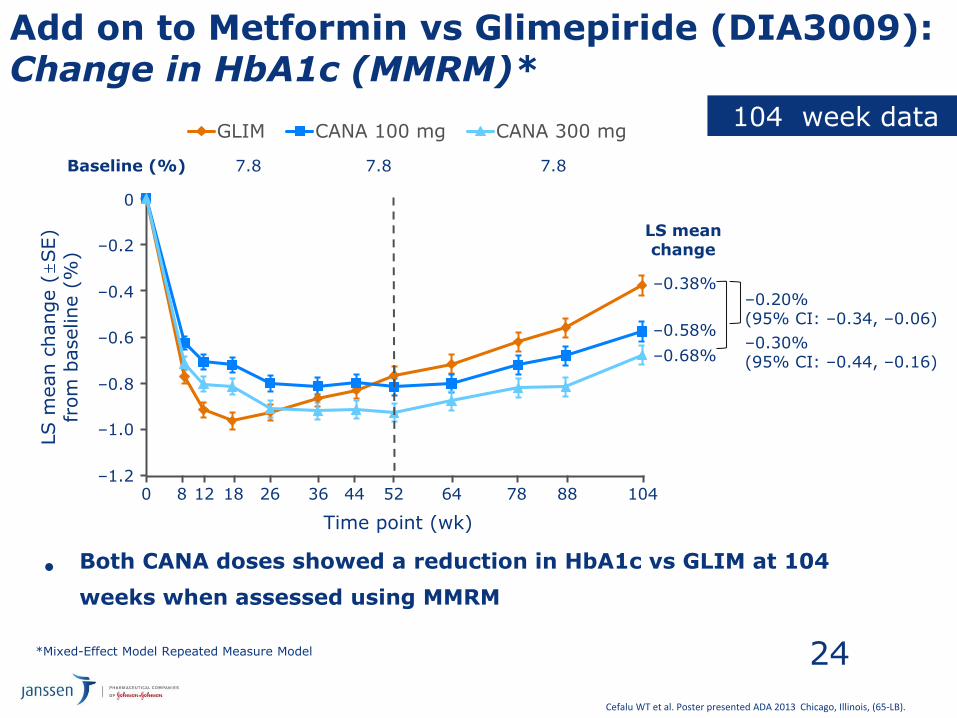
Add on to Metformin vs Glimepiride (DIA3009): Change in HbA1c (MMRM)*
24
GLIM CANA 100 mg CANA 300 mg
0 8 12 18 26 36 44 52
Time point (wk)
Baseline (%)
64 78 88 104
LS meanchange
–0.68%
–0.58%
–0.38%–0.20%(95% CI: –0.34, –0.06)
–0.30%(95% CI: –0.44, –0.16)
7.8 7.8 7.8
*Mixed-Effect Model Repeated Measure Model
–1.2
–1.0
–0.8
–0.6
–0.4
–0.2
0
LS m
ean c
hange (±SE)
from
baseline (
%)
104 week data
Cefalu WT et al. Poster presented ADA 2013 Chicago, Illinois, (65-LB).
• Both CANA doses showed a reduction in HbA1c vs GLIM at 104
weeks when assessed using MMRM
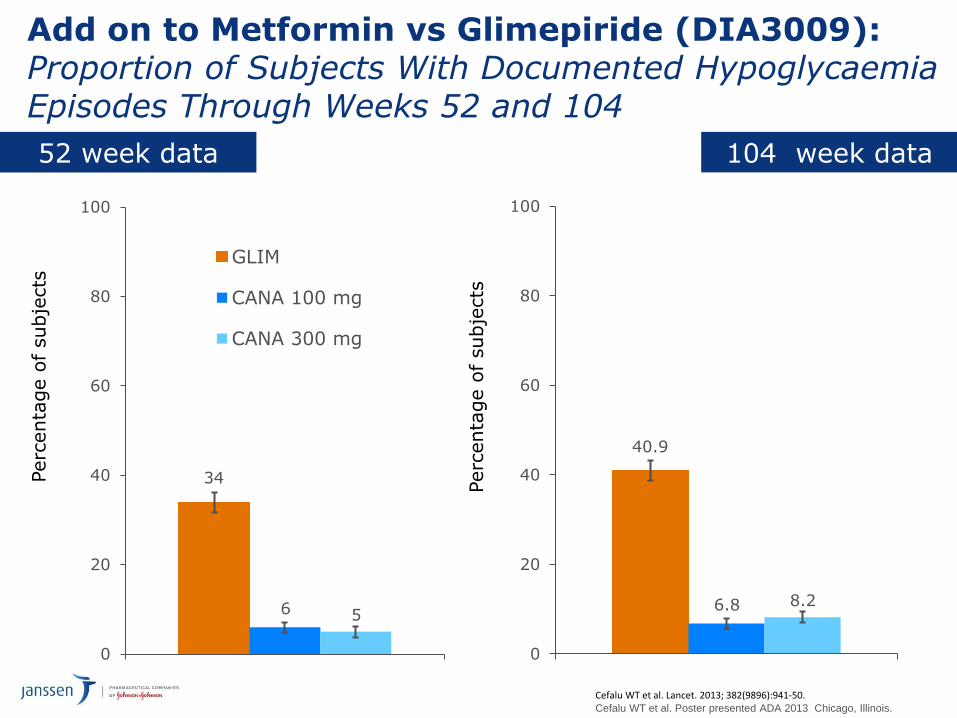
Add on to Metformin vs Glimepiride (DIA3009):Proportion of Subjects With Documented HypoglycaemiaEpisodes Through Weeks 52 and 104
25
40.9
6.8 8.2
0
20
40
60
80
100
Perc
enta
ge o
f subje
cts
104 week data
Cefalu WT et al. Lancet. 2013; 382(9896):941-50. Cefalu WT et al. Poster presented ADA 2013 Chicago, Illinois.
34
6 5
0
20
40
60
80
100
GLIM
CANA 100 mg
CANA 300 mg
Perc
enta
ge o
f subje
cts
52 week data
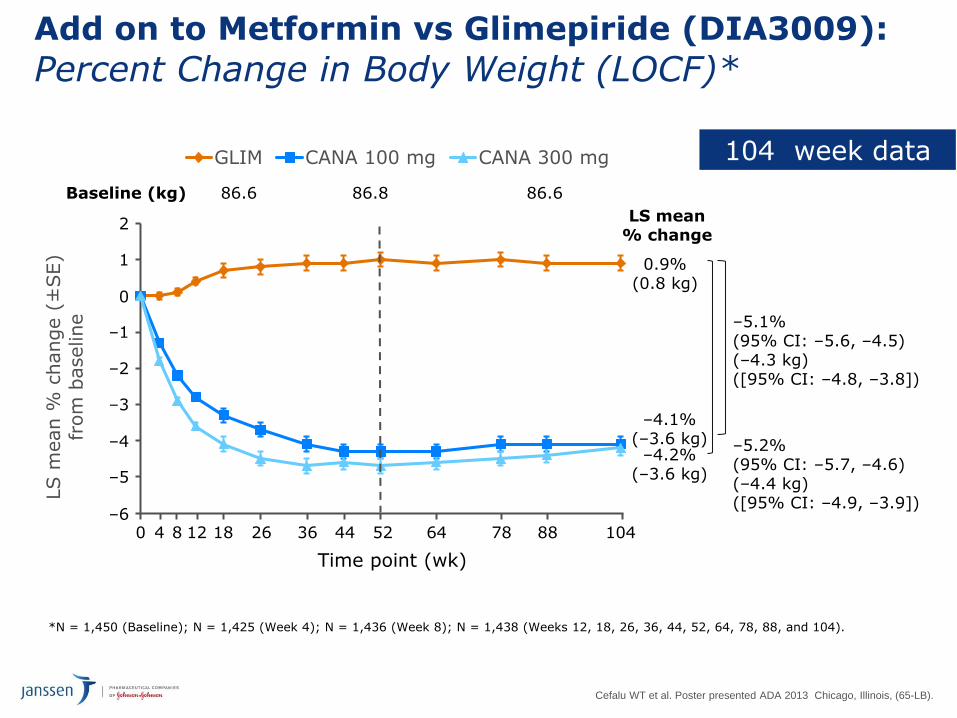
Add on to Metformin vs Glimepiride (DIA3009):
Percent Change in Body Weight (LOCF)*
26
LS m
ean %
change (
±SE)
from
baseline
GLIM CANA 100 mg CANA 300 mg
0 8 12 18 26 36 44 52
Time point (wk)
Baseline (kg)
64 78 88 104
LS mean% change
–4.2%(–3.6 kg)
–4.1%(–3.6 kg)
0.9%(0.8 kg)
–5.1% (95% CI: –5.6, –4.5)(–4.3 kg)([95% CI: –4.8, –3.8])
–5.2% (95% CI: –5.7, –4.6)(–4.4 kg)([95% CI: –4.9, –3.9])
86.6 86.8 86.6
4
*N = 1,450 (Baseline); N = 1,425 (Week 4); N = 1,436 (Week 8); N = 1,438 (Weeks 12, 18, 26, 36, 44, 52, 64, 78, 88, and 104).
–6
–5
–4
–3
–2
–1
0
1
2
104 week data
Cefalu WT et al. Poster presented ADA 2013 Chicago, Illinois, (65-LB).
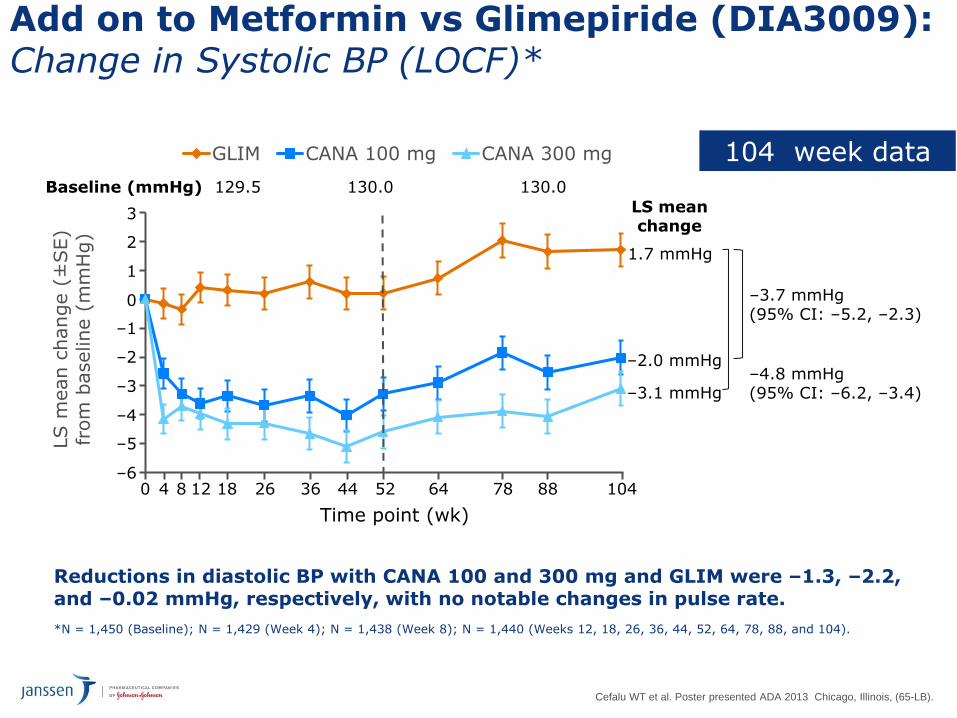
Add on to Metformin vs Glimepiride (DIA3009): Change in Systolic BP (LOCF)*
27
LS m
ean c
hange (
±SE)
from
baseline (
mm
Hg)
GLIM CANA 100 mg CANA 300 mg
0 8 12 18 26 36 44 52
Time point (wk)
Baseline (mmHg)
64 78 88 104
LS meanchange
–3.1 mmHg
–2.0 mmHg
1.7 mmHg
–3.7 mmHg(95% CI: –5.2, –2.3)
–4.8 mmHg(95% CI: –6.2, –3.4)
129.5 130.0 130.0
4
Reductions in diastolic BP with CANA 100 and 300 mg and GLIM were –1.3, –2.2, and –0.02 mmHg, respectively, with no notable changes in pulse rate.
*N = 1,450 (Baseline); N = 1,429 (Week 4); N = 1,438 (Week 8); N = 1,440 (Weeks 12, 18, 26, 36, 44, 52, 64, 78, 88, and 104).
–6
–5
–4
–3
–2
–1
0
1
2
3
104 week data
Cefalu WT et al. Poster presented ADA 2013 Chicago, Illinois, (65-LB).
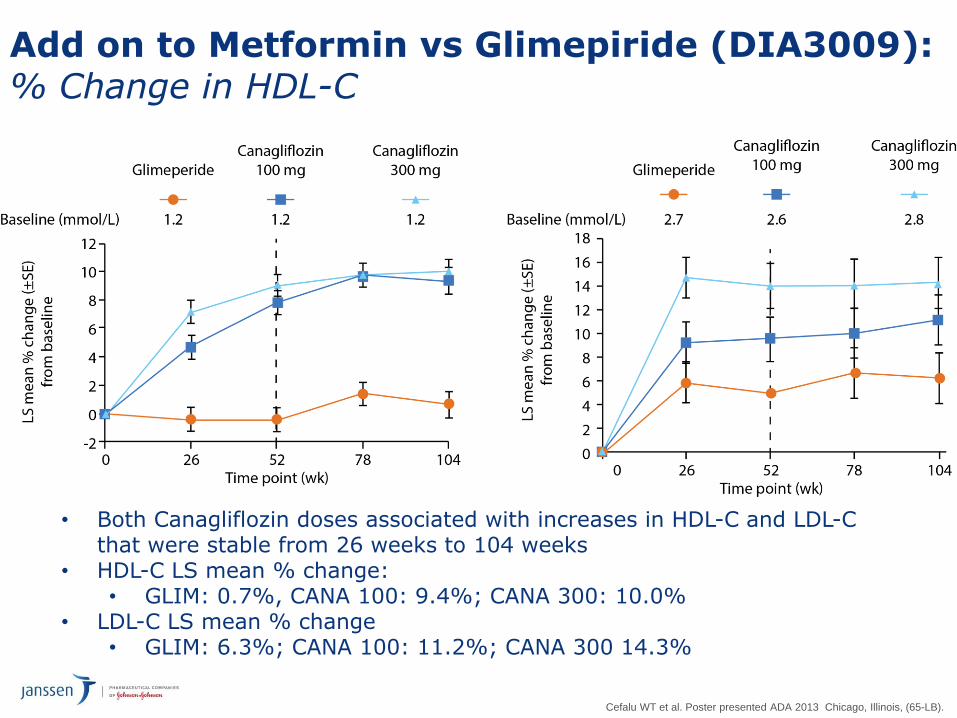
Add on to Metformin vs Glimepiride (DIA3009): % Change in HDL-C
Cefalu WT et al. Poster presented ADA 2013 Chicago, Illinois, (65-LB).
• Both Canagliflozin doses associated with increases in HDL-C and LDL-C that were stable from 26 weeks to 104 weeks
• HDL-C LS mean % change:• GLIM: 0.7%, CANA 100: 9.4%; CANA 300: 10.0%
• LDL-C LS mean % change• GLIM: 6.3%; CANA 100: 11.2%; CANA 300 14.3%
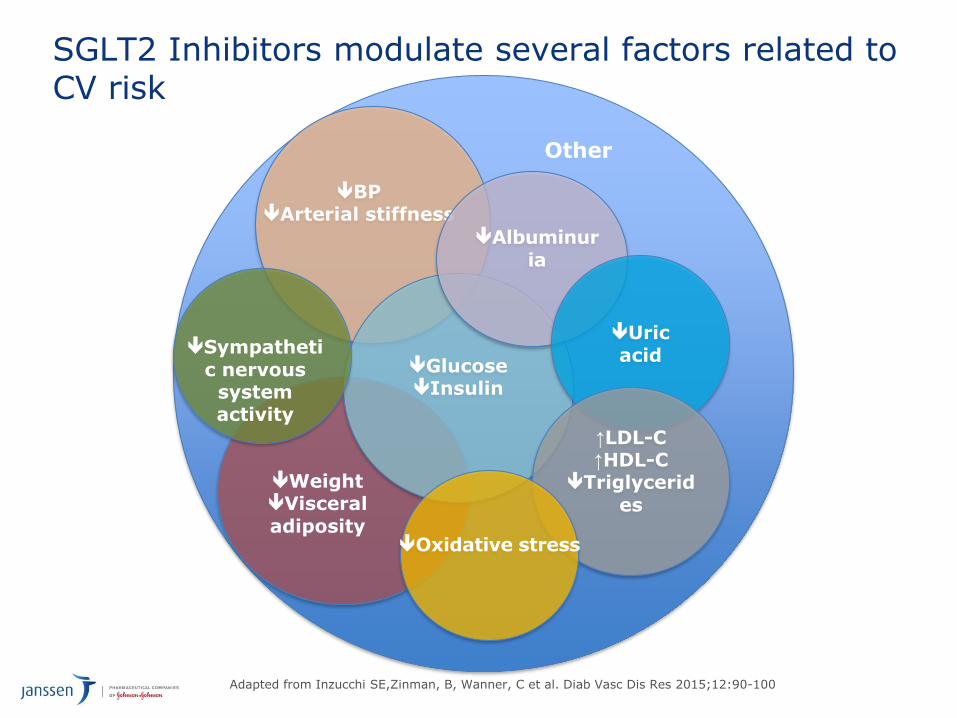
SGLT2 Inhibitors modulate several factors related to CV risk
Adapted from Inzucchi SE,Zinman, B, Wanner, C et al. Diab Vasc Dis Res 2015;12:90-100
BPArterial stiffness
GlucoseInsulin
Albuminur
ia
Uric
acid
Other
↑LDL-C↑HDL-C
Triglycerid
es
Oxidative stress
Sympatheti
c nervous system activity
WeightVisceral
adiposity
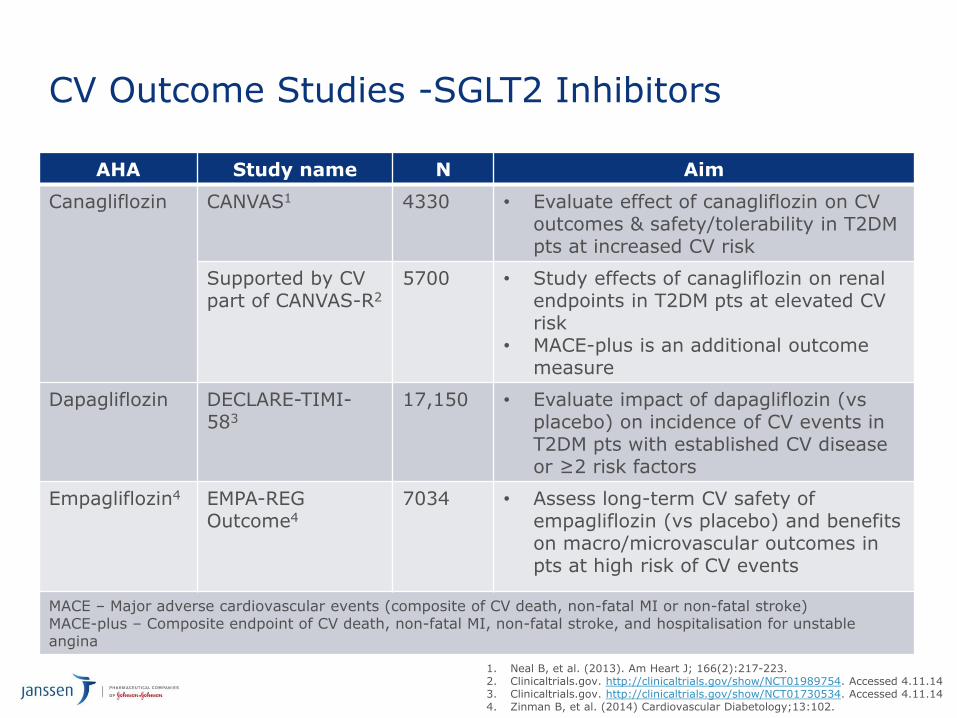
AHA Study name N Aim
Canagliflozin CANVAS1 4330 • Evaluate effect of canagliflozin on CV outcomes & safety/tolerability in T2DMpts at increased CV risk
Supported by CV part of CANVAS-R2
5700 • Study effects of canagliflozin on renal endpoints in T2DM pts at elevated CV risk
• MACE-plus is an additional outcome measure
Dapagliflozin DECLARE-TIMI-583
17,150 • Evaluate impact of dapagliflozin (vsplacebo) on incidence of CV events in T2DM pts with established CV disease or ≥2 risk factors
Empagliflozin4 EMPA-REG Outcome4
7034 • Assess long-term CV safety of empagliflozin (vs placebo) and benefits on macro/microvascular outcomes in pts at high risk of CV events
MACE – Major adverse cardiovascular events (composite of CV death, non-fatal MI or non-fatal stroke)MACE-plus – Composite endpoint of CV death, non-fatal MI, non-fatal stroke, and hospitalisation for unstable angina
CV Outcome Studies -SGLT2 Inhibitors
1. Neal B, et al. (2013). Am Heart J; 166(2):217-223.2. Clinicaltrials.gov. http://clinicaltrials.gov/show/NCT01989754. Accessed 4.11.143. Clinicaltrials.gov. http://clinicaltrials.gov/show/NCT01730534. Accessed 4.11.144. Zinman B, et al. (2014) Cardiovascular Diabetology;13:102.
John M Lachin, ScD
Professor of Biostatistics and Epidemiology, and Statistics, The George Washington University,
Rockville, USA
31
EMPA-REG OUTCOME®
• Randomised, double-blind, placebo-controlled CV outcomes trial
•ObjectiveTo examine the long-term effects of empagliflozin versus placebo, in addition to standard of care, on CV morbidity and mortality in patients with type 2 diabetes and high risk of CV events
32
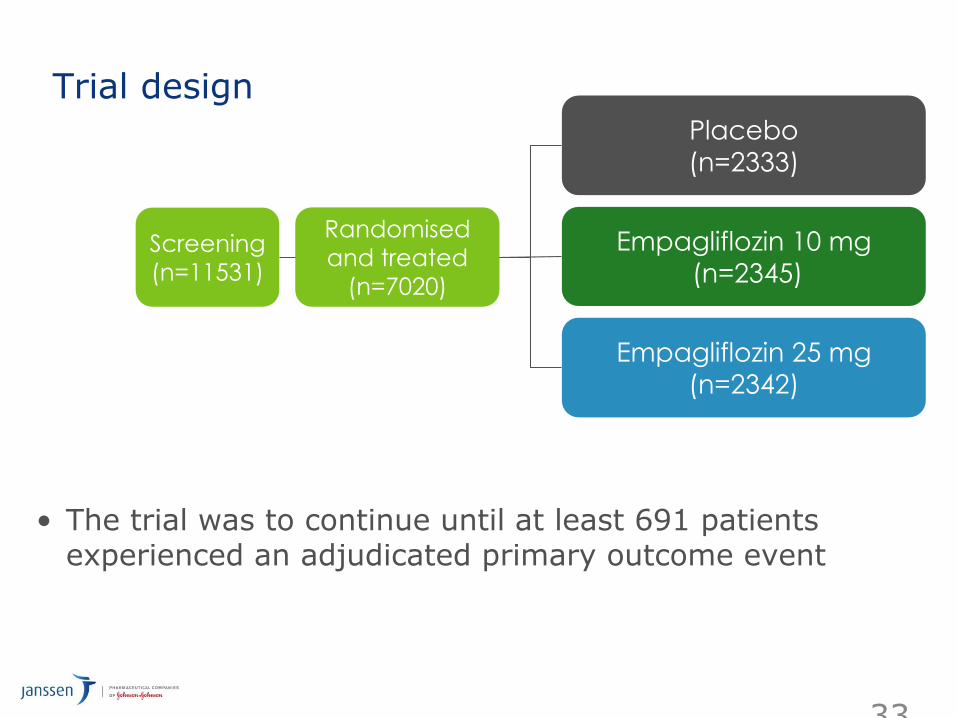
Trial design
• The trial was to continue until at least 691 patients experienced an adjudicated primary outcome event
33
Randomised
and treated
(n=7020)
Empagliflozin 10 mg
(n=2345)
Empagliflozin 25 mg
(n=2342)
Placebo
(n=2333)
Screening
(n=11531)
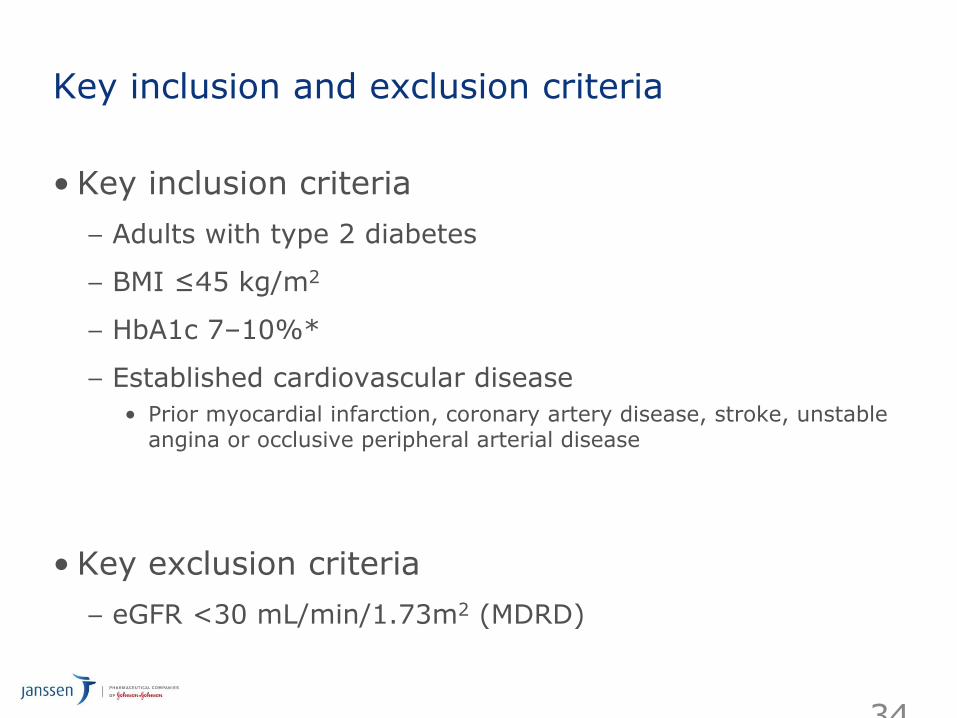
Key inclusion and exclusion criteria
• Key inclusion criteria
– Adults with type 2 diabetes
– BMI ≤45 kg/m2
– HbA1c 7–10%*
– Established cardiovascular disease
• Prior myocardial infarction, coronary artery disease, stroke, unstable angina or occlusive peripheral arterial disease
• Key exclusion criteria
– eGFR <30 mL/min/1.73m2 (MDRD)
34
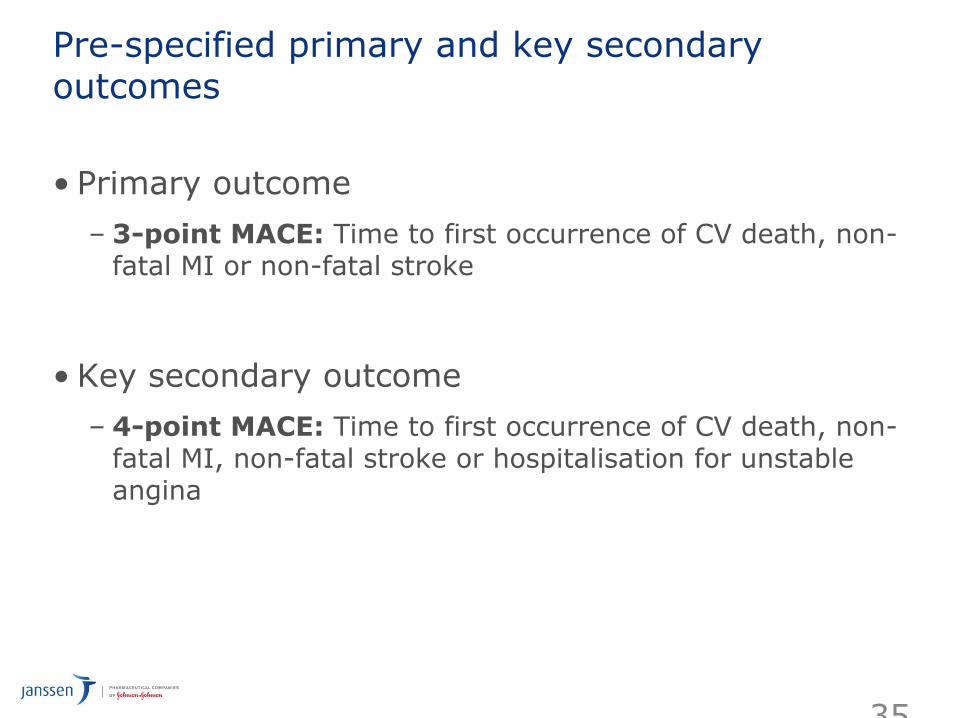
Pre-specified primary and key secondary outcomes
• Primary outcome
– 3-point MACE: Time to first occurrence of CV death, non-fatal MI or non-fatal stroke
• Key secondary outcome
– 4-point MACE: Time to first occurrence of CV death, non-fatal MI, non-fatal stroke or hospitalisation for unstable angina
35
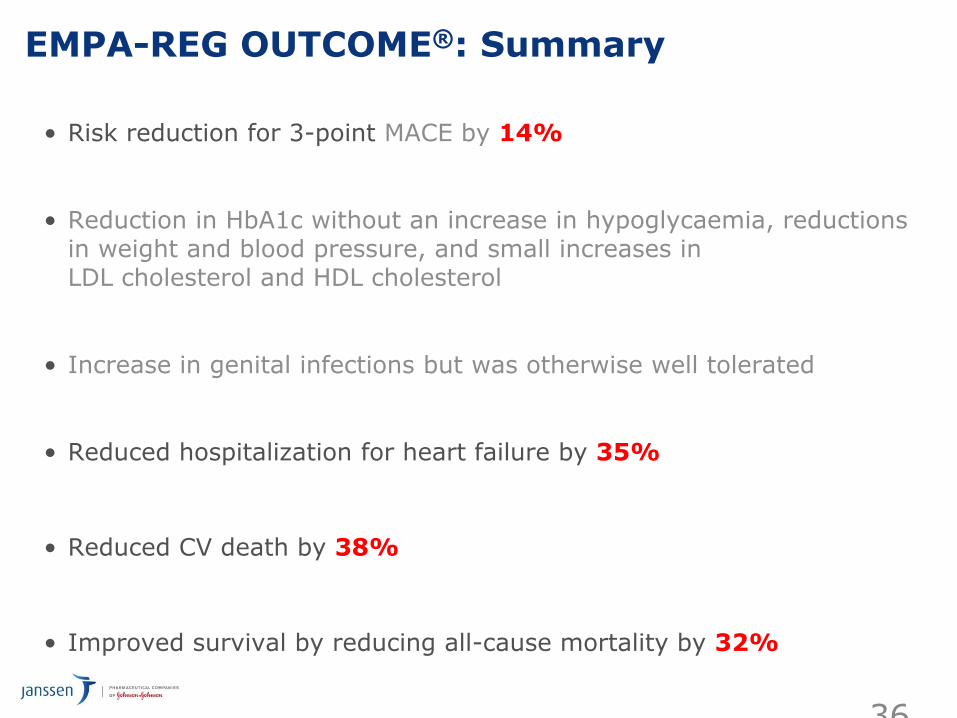
EMPA-REG OUTCOME®: Summary
• Risk reduction for 3-point MACE by 14%
• Reduction in HbA1c without an increase in hypoglycaemia, reductions in weight and blood pressure, and small increases in LDL cholesterol and HDL cholesterol
• Increase in genital infections but was otherwise well tolerated
• Reduced hospitalization for heart failure by 35%
• Reduced CV death by 38%
• Improved survival by reducing all-cause mortality by 32%
36
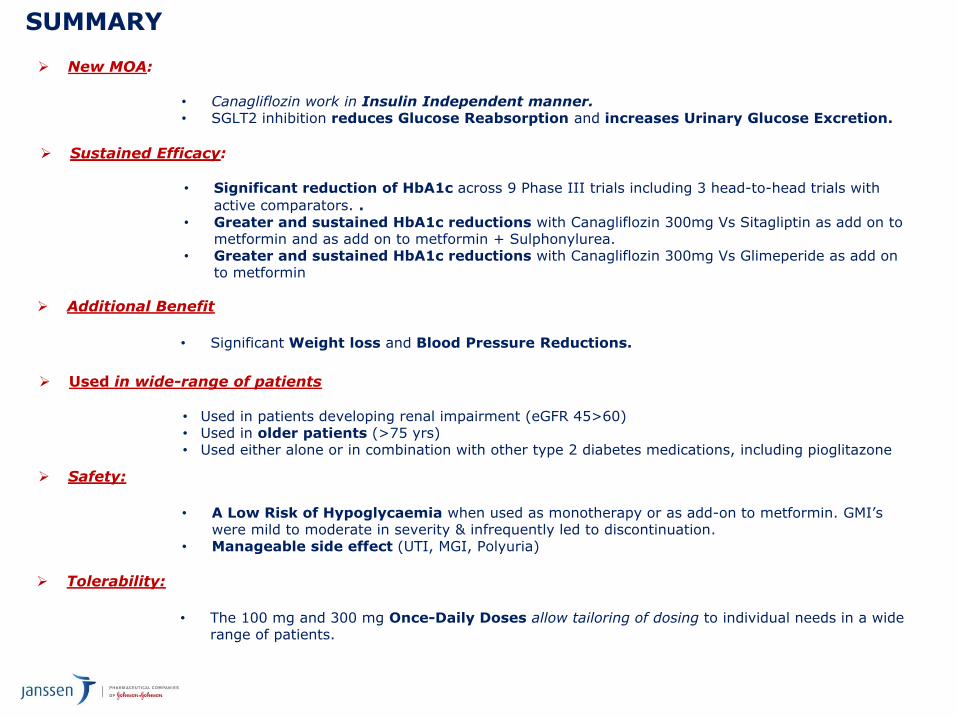
SUMMARY
New MOA:
• Canagliflozin work in Insulin Independent manner. • SGLT2 inhibition reduces Glucose Reabsorption and increases Urinary Glucose Excretion.
Safety:
• A Low Risk of Hypoglycaemia when used as monotherapy or as add-on to metformin. GMI’s were mild to moderate in severity & infrequently led to discontinuation.
• Manageable side effect (UTI, MGI, Polyuria)
Additional Benefit
• Significant Weight loss and Blood Pressure Reductions.
Used in wide-range of patients
• Used in patients developing renal impairment (eGFR 45>60)• Used in older patients (>75 yrs)• Used either alone or in combination with other type 2 diabetes medications, including pioglitazone
Tolerability:
• The 100 mg and 300 mg Once-Daily Doses allow tailoring of dosing to individual needs in a wide range of patients.
Sustained Efficacy:
• Significant reduction of HbA1c across 9 Phase III trials including 3 head-to-head trials with
active comparators. .• Greater and sustained HbA1c reductions with Canagliflozin 300mg Vs Sitagliptin as add on to
metformin and as add on to metformin + Sulphonylurea.• Greater and sustained HbA1c reductions with Canagliflozin 300mg Vs Glimeperide as add on
to metformin

Thank you