Embed Size (px)
DESCRIPTION
Citation preview
E u r o p e a n A g e n c y f o r S a f e t y a n d H e a l t h a t W o r k
EUROPEAN RISK OBSERVATORY REPORT
OSH in figures:stress at work — facts and figures
en 9
9en
OSH in figures: stress at work —
facts and figuresEU
ROPEA
N R
ISK O
BSERVATORY R
EPORT
In order to improve the working environment, as regards the protection of the safety and health of workers as provided for in the Treaty and successive Community strategies and action programmes concerning health and safety at the workplace, the aim of the Agency shall be to provide the Community bodies, the Member States, the social partners and those involved in the field with the technical, scientific and economic information of use in the field of safety and health at work.
TE-81-08-478-EN-C
ISSN 1830-5946
Gran Vía 33, E-48009 BilbaoTel.: +34 944794360Fax: + 34 944794383E-mail: [email protected] (excluding VAT) in Luxembourg: EUR 15
Eu
ro
pe
an
A
ge
nc
y
fo
r
Sa
fe
ty
a
nd
H
ea
lt
h
at
W
or
k
ht
tp
:/
/o
sh
a.
eu
ro
pa
.e
u

How to obtain EU publications
Publications for sale:
via EU Bookshop (http://bookshop.europa.eu);•
from your bookseller by quoting the title, publisher and/or ISBN number;•
by contacting one of our sales agents directly. You can obtain their contact details on •the Internet (http://bookshop.europa.eu) or by sending a fax to +352 2929-42758.
Free publications:
via EU Bookshop (http://bookshop.europa.eu);•
at the European Commission’s representations or delegations. You can obtain their •contact details on the Internet (http://ec.europa.eu) or by sending a fax to +352 2929-42758.
European Agency for Safety and Health at Work
OSH in figures: stress at work — facts and figures
Luxembourg: Office for Official Publications of the European Communities
2009 — 132 pp. — 21 x 29.7 cm
ISBN 978-92-9191-224-7
Price (excluding VAT) in Luxembourg: EUR 15
E u r o p e a n A g e n c y f o r S a f e t y a n d H e a l t h a t W o r k
EUROPEAN RISK OBSERVATORY REPORT
OSH in fi gures:stress at work — facts and fi gures
Authors:European Agency for Safety and Health at Work:Malgorzata Milczarek, Elke Schneider, Eusebio Rial González
Topic Centre Risk Observatory:CIOP-PIB, Poland: Maria Widerszal-Bazyl, Anna Łuczak, Anna Kazenas, Magdalena Warszewska-Makuch, Dorota Żołnierczyk-Zreda, Andrzej Najmiec
National Data provided by:Austria: Angelika Hauke, Eva Flaspöler, Stefan Gabriel, DGUV, GermanyBelgium: Marthe Verjans, Lieven Eeckelaert, Veronique De Broeck, PreventCyprus: Marios Charalambous, Labour InspectorateCzech Republic: Vladimir Janousek – VUBP-OPPZHFinland: Simo Virtanen, Krista Pahkin – FIOHFrance: Laurence Poly, Claire Tissot – INRS Germany: Rosemarie Baumann, Frank Brenscheidt, Meike Bödefeld, Ellen Zwink – BAuAGreece: Antonis Targoutzidis – ELINYAEHungary: Katalin Balogh – Public Foundation for Research on Occupational SafetyIreland: Nadia Clarkin – Work Research Centre Latvia: Maiija Eglite –Institute of Occupational and Environmental Health, Riga Stradins University, Dace Avena, State Labour InspectorateMalta: Romina Rieck Zahra, Occupational Health and Safety Authority,The Netherlands: Karin Jettinghoff, Irene Houtman – TNO Arbeid, Portugal: Sergio Miguel – SPOSHO, Universidade do MinhoSlovenia: Saša Žebovec – Institute of Occupational Safety Spain: Mercedes Tejedor, Olga Fernández – INSHTUnited Kingdom: Geoffrey David – Robens Centre for Health Ergonomics, University of Surrey
More information on the European Union is available on the Internet (http://europa.eu).
Cataloguing data can be found at the end of this publication.
Luxembourg: Office for Official Publications of the European Communities, 2009
ISBN 978-92-9191-224-7
© European Communities, 2009Reproduction is authorised provided the source is acknowledged.
Printed in Luxembourg
Printed on white chlorine-free PaPer
Europe Direct is a service to help you find answers to your questions about the European Union
Freephone number (*):
00 800 6 7 8 9 10 11(*) Certain mobile telephone operators do not allow access to 00 800 numbers, or these calls may
be billed.
OSH in fi gures: stress at work — facts and fi gures E
uro
pEan ag
Ency fo
r SafEty an
d HEaltH at W
ork
3
Abbreviations . . . . . . . . . . . . . . . . . . . . . . . . . . . . . . . . . . . . . . . . . . . . . . . . . . . . . . . . . . . . . . . . . . . . . . . . . 5
Country codes . . . . . . . . . . . . . . . . . . . . . . . . . . . . . . . . . . . . . . . . . . . . . . . . . . . . . . . . . . . . . . . . . . . . . . . . . 5
Executive summary . . . . . . . . . . . . . . . . . . . . . . . . . . . . . . . . . . . . . . . . . . . . . . . . . . . . . . . . . . . . . . . . . . . . 9
1. Introduction . . . . . . . . . . . . . . . . . . . . . . . . . . . . . . . . . . . . . . . . . . . . . . . . . . . . . . . . . . . . . . . . . . . . . 13
2. Prevalence of stress at work . . . . . . . . . . . . . . . . . . . . . . . . . . . . . . . . . . . . . . . . . . . . . . . . . . . . . . . . 19 2 .1 . Stress at work — general prevalence and time trends . . . . . . . . . . . . . . . . . . . . . . . . . . . . . . . . . . . . . 20 2 .2 . Information from the Member States . . . . . . . . . . . . . . . . . . . . . . . . . . . . . . . . . . . . . . . . . . . . . . . . . . . . 29 Belgium . . . . . . . . . . . . . . . . . . . . . . . . . . . . . . . . . . . . . . . . . . . . . . . . . . . . . . . . . . . . . . . . . . . . . . . . . . . . . 29 Cyprus . . . . . . . . . . . . . . . . . . . . . . . . . . . . . . . . . . . . . . . . . . . . . . . . . . . . . . . . . . . . . . . . . . . . . . . . . . . . . . . 29 Finland . . . . . . . . . . . . . . . . . . . . . . . . . . . . . . . . . . . . . . . . . . . . . . . . . . . . . . . . . . . . . . . . . . . . . . . . . . . . . . 29 France . . . . . . . . . . . . . . . . . . . . . . . . . . . . . . . . . . . . . . . . . . . . . . . . . . . . . . . . . . . . . . . . . . . . . . . . . . . . . . . 30 Ireland . . . . . . . . . . . . . . . . . . . . . . . . . . . . . . . . . . . . . . . . . . . . . . . . . . . . . . . . . . . . . . . . . . . . . . . . . . . . . . 32 Latvia . . . . . . . . . . . . . . . . . . . . . . . . . . . . . . . . . . . . . . . . . . . . . . . . . . . . . . . . . . . . . . . . . . . . . . . . . . . . . . . 32 Spain . . . . . . . . . . . . . . . . . . . . . . . . . . . . . . . . . . . . . . . . . . . . . . . . . . . . . . . . . . . . . . . . . . . . . . . . . . . . . . . . 34 The Netherlands . . . . . . . . . . . . . . . . . . . . . . . . . . . . . . . . . . . . . . . . . . . . . . . . . . . . . . . . . . . . . . . . . . . . . . 36 United Kingdom . . . . . . . . . . . . . . . . . . . . . . . . . . . . . . . . . . . . . . . . . . . . . . . . . . . . . . . . . . . . . . . . . . . . . . 38
3. Stress by age . . . . . . . . . . . . . . . . . . . . . . . . . . . . . . . . . . . . . . . . . . . . . . . . . . . . . . . . . . . . . . . . . . . . . 41 3 .1 . Relationship with age — general prevalence and time trends . . . . . . . . . . . . . . . . . . . . . . . . . . . . . . . 42 3 .2 . Information from the Member States . . . . . . . . . . . . . . . . . . . . . . . . . . . . . . . . . . . . . . . . . . . . . . . . . . . . 45 Belgium . . . . . . . . . . . . . . . . . . . . . . . . . . . . . . . . . . . . . . . . . . . . . . . . . . . . . . . . . . . . . . . . . . . . . . . . . . . . . 45 Finland . . . . . . . . . . . . . . . . . . . . . . . . . . . . . . . . . . . . . . . . . . . . . . . . . . . . . . . . . . . . . . . . . . . . . . . . . . . . . . 45 Germany . . . . . . . . . . . . . . . . . . . . . . . . . . . . . . . . . . . . . . . . . . . . . . . . . . . . . . . . . . . . . . . . . . . . . . . . . . . . . 46 Spain . . . . . . . . . . . . . . . . . . . . . . . . . . . . . . . . . . . . . . . . . . . . . . . . . . . . . . . . . . . . . . . . . . . . . . . . . . . . . . . . 47 The Netherlands . . . . . . . . . . . . . . . . . . . . . . . . . . . . . . . . . . . . . . . . . . . . . . . . . . . . . . . . . . . . . . . . . . . . . . 48 United Kingdom . . . . . . . . . . . . . . . . . . . . . . . . . . . . . . . . . . . . . . . . . . . . . . . . . . . . . . . . . . . . . . . . . . . . . . 48
4. Stress by gender . . . . . . . . . . . . . . . . . . . . . . . . . . . . . . . . . . . . . . . . . . . . . . . . . . . . . . . . . . . . . . . . . . 51 4 .1 . Relationship with gender — general prevalence and trends . . . . . . . . . . . . . . . . . . . . . . . . . . . . . . . . 52 4 .2 . Information from the Member States . . . . . . . . . . . . . . . . . . . . . . . . . . . . . . . . . . . . . . . . . . . . . . . . . . . . 55 Belgium . . . . . . . . . . . . . . . . . . . . . . . . . . . . . . . . . . . . . . . . . . . . . . . . . . . . . . . . . . . . . . . . . . . . . . . . . . . . . 55 Finland . . . . . . . . . . . . . . . . . . . . . . . . . . . . . . . . . . . . . . . . . . . . . . . . . . . . . . . . . . . . . . . . . . . . . . . . . . . . . . 56 Germany . . . . . . . . . . . . . . . . . . . . . . . . . . . . . . . . . . . . . . . . . . . . . . . . . . . . . . . . . . . . . . . . . . . . . . . . . . . . . 56 Ireland . . . . . . . . . . . . . . . . . . . . . . . . . . . . . . . . . . . . . . . . . . . . . . . . . . . . . . . . . . . . . . . . . . . . . . . . . . . . . . 57 Poland . . . . . . . . . . . . . . . . . . . . . . . . . . . . . . . . . . . . . . . . . . . . . . . . . . . . . . . . . . . . . . . . . . . . . . . . . . . . . . 58 Slovenia . . . . . . . . . . . . . . . . . . . . . . . . . . . . . . . . . . . . . . . . . . . . . . . . . . . . . . . . . . . . . . . . . . . . . . . . . . . . . 58 Spain . . . . . . . . . . . . . . . . . . . . . . . . . . . . . . . . . . . . . . . . . . . . . . . . . . . . . . . . . . . . . . . . . . . . . . . . . . . . . . . . 58 The Netherlands . . . . . . . . . . . . . . . . . . . . . . . . . . . . . . . . . . . . . . . . . . . . . . . . . . . . . . . . . . . . . . . . . . . . . . 59 United Kingdom . . . . . . . . . . . . . . . . . . . . . . . . . . . . . . . . . . . . . . . . . . . . . . . . . . . . . . . . . . . . . . . . . . . . . . 60
5. Stress by sector and occupation . . . . . . . . . . . . . . . . . . . . . . . . . . . . . . . . . . . . . . . . . . . . . . . . . . . . . 63 5 .1 . Relationship with sector and occupation — general prevalence and trends . . . . . . . . . . . . . . . . . . . . 64 5 .2 . Information from the Member States . . . . . . . . . . . . . . . . . . . . . . . . . . . . . . . . . . . . . . . . . . . . . . . . . . . . 75 Belgium . . . . . . . . . . . . . . . . . . . . . . . . . . . . . . . . . . . . . . . . . . . . . . . . . . . . . . . . . . . . . . . . . . . . . . . . . . . . . 75 France . . . . . . . . . . . . . . . . . . . . . . . . . . . . . . . . . . . . . . . . . . . . . . . . . . . . . . . . . . . . . . . . . . . . . . . . . . . . . . . 76 Germany . . . . . . . . . . . . . . . . . . . . . . . . . . . . . . . . . . . . . . . . . . . . . . . . . . . . . . . . . . . . . . . . . . . . . . . . . . . . . 78 Greece . . . . . . . . . . . . . . . . . . . . . . . . . . . . . . . . . . . . . . . . . . . . . . . . . . . . . . . . . . . . . . . . . . . . . . . . . . . . . . 80 Hungary . . . . . . . . . . . . . . . . . . . . . . . . . . . . . . . . . . . . . . . . . . . . . . . . . . . . . . . . . . . . . . . . . . . . . . . . . . . . . 80 Ireland . . . . . . . . . . . . . . . . . . . . . . . . . . . . . . . . . . . . . . . . . . . . . . . . . . . . . . . . . . . . . . . . . . . . . . . . . . . . . . 81
TA
BL
E O
F C
ON
TE
NT
S
OSH in figures: stress at work — facts and figuresEu
ropE
an a
gEn
cy f
or
SafE
ty a
nd
HEal
tH a
t W
ork
4
Latvia . . . . . . . . . . . . . . . . . . . . . . . . . . . . . . . . . . . . . . . . . . . . . . . . . . . . . . . . . . . . . . . . . . . . . . . . . . . . . . . 81 Poland . . . . . . . . . . . . . . . . . . . . . . . . . . . . . . . . . . . . . . . . . . . . . . . . . . . . . . . . . . . . . . . . . . . . . . . . . . . . . . 82 Portugal . . . . . . . . . . . . . . . . . . . . . . . . . . . . . . . . . . . . . . . . . . . . . . . . . . . . . . . . . . . . . . . . . . . . . . . . . . . . . 83 Slovenia . . . . . . . . . . . . . . . . . . . . . . . . . . . . . . . . . . . . . . . . . . . . . . . . . . . . . . . . . . . . . . . . . . . . . . . . . . . . . 83 Spain . . . . . . . . . . . . . . . . . . . . . . . . . . . . . . . . . . . . . . . . . . . . . . . . . . . . . . . . . . . . . . . . . . . . . . . . . . . . . . . . 83 The Netherlands . . . . . . . . . . . . . . . . . . . . . . . . . . . . . . . . . . . . . . . . . . . . . . . . . . . . . . . . . . . . . . . . . . . . . . 84 United Kingdom . . . . . . . . . . . . . . . . . . . . . . . . . . . . . . . . . . . . . . . . . . . . . . . . . . . . . . . . . . . . . . . . . . . . . . 87
6. Stress by employment status . . . . . . . . . . . . . . . . . . . . . . . . . . . . . . . . . . . . . . . . . . . . . . . . . . . . . . 91 6 .1 . Relationship with employment status — general prevalence and trends . . . . . . . . . . . . . . . . . . . . . 92 6 .2 . Information from the Member States . . . . . . . . . . . . . . . . . . . . . . . . . . . . . . . . . . . . . . . . . . . . . . . . . . . . 94 Belgium . . . . . . . . . . . . . . . . . . . . . . . . . . . . . . . . . . . . . . . . . . . . . . . . . . . . . . . . . . . . . . . . . . . . . . . . . . . . . 94 Finland . . . . . . . . . . . . . . . . . . . . . . . . . . . . . . . . . . . . . . . . . . . . . . . . . . . . . . . . . . . . . . . . . . . . . . . . . . . . . . 95 Germany . . . . . . . . . . . . . . . . . . . . . . . . . . . . . . . . . . . . . . . . . . . . . . . . . . . . . . . . . . . . . . . . . . . . . . . . . . . . . 96 Spain . . . . . . . . . . . . . . . . . . . . . . . . . . . . . . . . . . . . . . . . . . . . . . . . . . . . . . . . . . . . . . . . . . . . . . . . . . . . . . . . 97
7. Emerging psychosocial risks — Experts’ surveys . . . . . . . . . . . . . . . . . . . . . . . . . . . . . . . . . . . . . 101 7 .1 . Expert forecast on emerging psychosocial risks . . . . . . . . . . . . . . . . . . . . . . . . . . . . . . . . . . . . . . . . . . . 102 7 .2 . Combined exposure to psychosocial and physical risks . . . . . . . . . . . . . . . . . . . . . . . . . . . . . . . . . . . . . 108
8. Costs of stress-related health problems . . . . . . . . . . . . . . . . . . . . . . . . . . . . . . . . . . . . . . . . . . . . . 111
9. Legislation . . . . . . . . . . . . . . . . . . . . . . . . . . . . . . . . . . . . . . . . . . . . . . . . . . . . . . . . . . . . . . . . . . . . . . 115
10. Conclusions . . . . . . . . . . . . . . . . . . . . . . . . . . . . . . . . . . . . . . . . . . . . . . . . . . . . . . . . . . . . . . . . . . . . . 119
11. More information . . . . . . . . . . . . . . . . . . . . . . . . . . . . . . . . . . . . . . . . . . . . . . . . . . . . . . . . . . . . . . . . 121
12. Data collection methodology . . . . . . . . . . . . . . . . . . . . . . . . . . . . . . . . . . . . . . . . . . . . . . . . . . . . . . 123
References . . . . . . . . . . . . . . . . . . . . . . . . . . . . . . . . . . . . . . . . . . . . . . . . . . . . . . . . . . . . . . . . . . . . . . . . . 127
Annex 1 – Stress in figures – National Links . . . . . . . . . . . . . . . . . . . . . . . . . . . . . . . . . . . . . . . . . . . . . 133
OSH in figures: stress at work — facts and figuresE
uro
pEan ag
Ency fo
r SafEty an
d HEaltH at W
ork
5
a b b r E v i a t i o n S
EWCS . . . . . . . . . . . . . . . . . . . . . . . . . . . . . . . . . . . . . . . . . . . . . . . .European Working Conditions Survey ISCO . . . . . . . . . . . . . . . . . . . . . . . . . . . . . . . . . .International Standard Classifications of Occupations LFS . . . . . . . . . . . . . . . . . . . . . . . . . . . . . . . . . . . . . . . . . . . . . . . . . . . . . . . . . . . . . . . . . . .Labour Force Survey EU15 . . . . . . . . . . . . . . . . . . . . . . . . 15 Member States of the EU before the accession in May 2004 CC12 . . . . . . . . . . . . . . . . .12 Candidate Countries which (10 of them) joined the EU in May 2004 EU10, NMS10 . . . . . . . . . . . . . . . . . . . . . . . . . . . . . . . 10 countries which joined the EU in May 2004 AC 2 . . . . . . .Acceding Countries (Romania and Bulgaria) which joined the EU in January 2007 EU25 . . . . . . . . . . . . . . . . . . . . . . . . . . . . . . . . . . . . . . . 25 Member States of the EU until January 2007 EU27 . . . . . . . . . . . . . . . . . . . . . . . 27 Member States of the EU after the accession in January 2007
c o u n t r y c o d E S
AT . . . . . . . . . . . . . . . . . . . . . . . . . . . . . . . . . . . . . . . . . . . . . . . . . . . . . . . . . . . . . . . . . . . . . . . . . . . . . . . . . Austria BE . . . . . . . . . . . . . . . . . . . . . . . . . . . . . . . . . . . . . . . . . . . . . . . . . . . . . . . . . . . . . . . . . . . . . . . . . . . . . . . . Belgium BG . . . . . . . . . . . . . . . . . . . . . . . . . . . . . . . . . . . . . . . . . . . . . . . . . . . . . . . . . . . . . . . . . . . . . . . . . . . . . . . . Bulgaria CY . . . . . . . . . . . . . . . . . . . . . . . . . . . . . . . . . . . . . . . . . . . . . . . . . . . . . . . . . . . . . . . . . . . . . . . . . . . . . . . . . Cyprus CZ . . . . . . . . . . . . . . . . . . . . . . . . . . . . . . . . . . . . . . . . . . . . . . . . . . . . . . . . . . . . . . . . . . . . . . . . .Czech Republic DE . . . . . . . . . . . . . . . . . . . . . . . . . . . . . . . . . . . . . . . . . . . . . . . . . . . . . . . . . . . . . . . . . . . . . . . . . . . . . . . Germany DK . . . . . . . . . . . . . . . . . . . . . . . . . . . . . . . . . . . . . . . . . . . . . . . . . . . . . . . . . . . . . . . . . . . . . . . . . . . . . . . Denmark EE . . . . . . . . . . . . . . . . . . . . . . . . . . . . . . . . . . . . . . . . . . . . . . . . . . . . . . . . . . . . . . . . . . . . . . . . . . . . . . . . . Estonia EL . . . . . . . . . . . . . . . . . . . . . . . . . . . . . . . . . . . . . . . . . . . . . . . . . . . . . . . . . . . . . . . . . . . . . . . . . . . . . . . . . . Greece ES . . . . . . . . . . . . . . . . . . . . . . . . . . . . . . . . . . . . . . . . . . . . . . . . . . . . . . . . . . . . . . . . . . . . . . . . . . . . . . . . . . .Spain FI . . . . . . . . . . . . . . . . . . . . . . . . . . . . . . . . . . . . . . . . . . . . . . . . . . . . . . . . . . . . . . . . . . . . . . . . . . . . . . . . . . Finland FR . . . . . . . . . . . . . . . . . . . . . . . . . . . . . . . . . . . . . . . . . . . . . . . . . . . . . . . . . . . . . . . . . . . . . . . . . . . . . . . . . .France HU . . . . . . . . . . . . . . . . . . . . . . . . . . . . . . . . . . . . . . . . . . . . . . . . . . . . . . . . . . . . . . . . . . . . . . . . . . . . . . . .Hungary IE . . . . . . . . . . . . . . . . . . . . . . . . . . . . . . . . . . . . . . . . . . . . . . . . . . . . . . . . . . . . . . . . . . . . . . . . . . . . . . . . . . Ireland IT . . . . . . . . . . . . . . . . . . . . . . . . . . . . . . . . . . . . . . . . . . . . . . . . . . . . . . . . . . . . . . . . . . . . . . . . . . . . . . . . . . . . . Italy LV . . . . . . . . . . . . . . . . . . . . . . . . . . . . . . . . . . . . . . . . . . . . . . . . . . . . . . . . . . . . . . . . . . . . . . . . . . . . . . . . . . Latvia LT . . . . . . . . . . . . . . . . . . . . . . . . . . . . . . . . . . . . . . . . . . . . . . . . . . . . . . . . . . . . . . . . . . . . . . . . . . . . . . . . Lithuania LU . . . . . . . . . . . . . . . . . . . . . . . . . . . . . . . . . . . . . . . . . . . . . . . . . . . . . . . . . . . . . . . . . . . . . . . . . . . Luxembourg MT . . . . . . . . . . . . . . . . . . . . . . . . . . . . . . . . . . . . . . . . . . . . . . . . . . . . . . . . . . . . . . . . . . . . . . . . . . . . . . . . . . .Malta NL . . . . . . . . . . . . . . . . . . . . . . . . . . . . . . . . . . . . . . . . . . . . . . . . . . . . . . . . . . . . . . . . . . . . . . . . . . . . Netherlands PL . . . . . . . . . . . . . . . . . . . . . . . . . . . . . . . . . . . . . . . . . . . . . . . . . . . . . . . . . . . . . . . . . . . . . . . . . . . . . . . . . Poland PT . . . . . . . . . . . . . . . . . . . . . . . . . . . . . . . . . . . . . . . . . . . . . . . . . . . . . . . . . . . . . . . . . . . . . . . . . . . . . . . .Portugal RO . . . . . . . . . . . . . . . . . . . . . . . . . . . . . . . . . . . . . . . . . . . . . . . . . . . . . . . . . . . . . . . . . . . . . . . . . . . . . . . Romania SE . . . . . . . . . . . . . . . . . . . . . . . . . . . . . . . . . . . . . . . . . . . . . . . . . . . . . . . . . . . . . . . . . . . . . . . . . . . . . . . . Sweden SI . . . . . . . . . . . . . . . . . . . . . . . . . . . . . . . . . . . . . . . . . . . . . . . . . . . . . . . . . . . . . . . . . . . . . . . . . . . . . . . . . Slovenia SK . . . . . . . . . . . . . . . . . . . . . . . . . . . . . . . . . . . . . . . . . . . . . . . . . . . . . . . . . . . . . . . . . . . . . . . . . . . . . . . . Slovakia UK . . . . . . . . . . . . . . . . . . . . . . . . . . . . . . . . . . . . . . . . . . . . . . . . . . . . . . . . . . . . . . . . . . . . . . . .United Kingdom

OSH in figures: stress at work — facts and figuresE
uro
pEan ag
Ency fo
r SafEty an
d HEaltH at W
ork
7
f o r E W o r d
Work-related stress is one of the biggest health and safety challenges that we face in Europe. Stress is the second most frequently reported work-related health problem, affecting 22% of workers from the EU 27 (in 2005), and the number of people suffering from stress-related conditions caused or made worse by work is likely to increase.
The changing world of work is making increased demands on workers; downsizing and outsourcing, the greater need for flexibility in terms of both function and skills, increasing use of temporary contracts, increased job insecurity, higher workloads and more pressure, and poor work-life balance are all factors which contribute to work-related stress. Studies suggest that stress is a factor in between 50% and 60% of all lost working days. This represents a huge cost in terms of both human distress and impaired economic performance.
This report discusses the prevalence of stress and the trends in work-related stress in the Member States of the European Union (based on international and national data), identifying those groups particularly exposed to stress in their working lives, subdivided by age, gender, sector, occupation, and employment status. Areas for future research and action are also indicated.
The Agency would like to thank the members of the Topic Centre for their contributions to the information used in this report. It would also like to thank its Focal Points, Expert Group and Advisory Group for their valuable comments and suggestions.
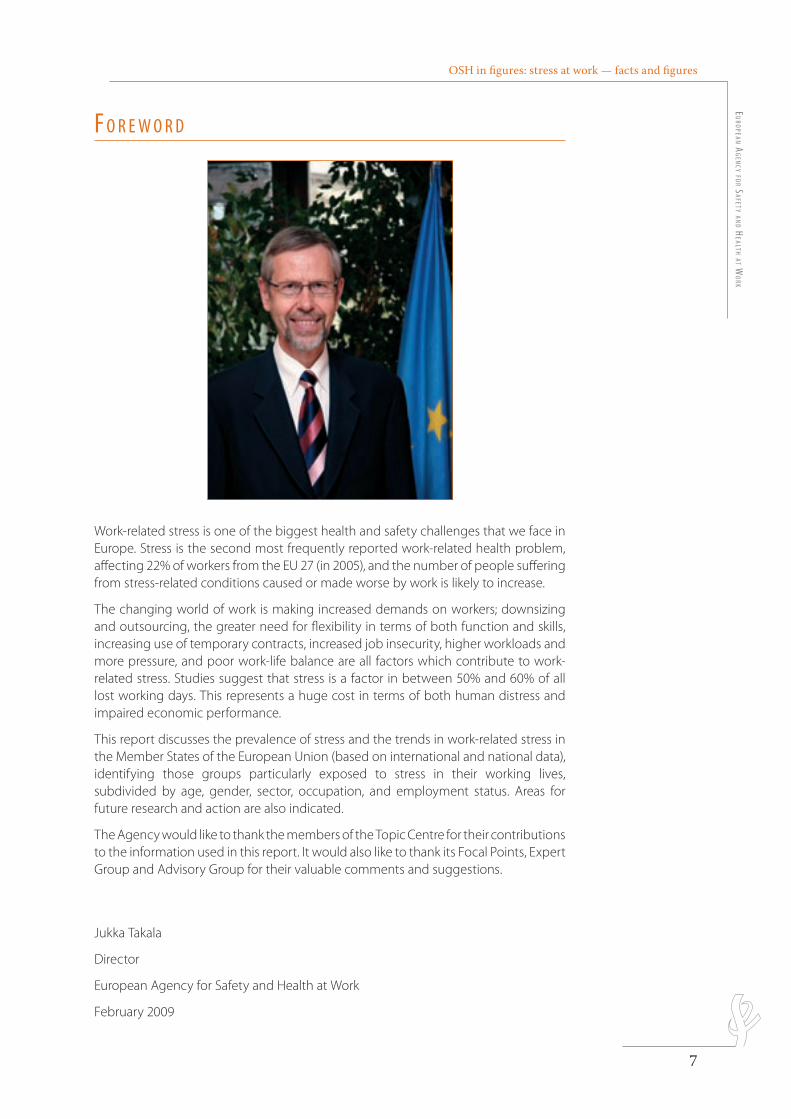
Jukka Takala
Director
European Agency for Safety and Health at Work
February 2009

OSH in figures: stress at work — facts and figuresE
uro
pEan ag
Ency fo
r SafEty an
d HEaltH at W
ork
9
E x E c u t i v E S u m m a r y
Stress at work is common throughout Europe. In surveys carried out every five years by the European Foundation for the Improvement of Living and Working Conditions, respondents name it as the second most common threat posed by the working environment. Only musculoskeletal problems are seen as more likely to damage workers’ health. According to the fourth European Survey of Working Conditions, carried out in 2005 in all Member States, stress was experienced by an average 22% of working Europeans. In 2002, the annual economic cost of work-related stress in the EU15 was estimated at EUR 20,000 million.
P r e v a l e n c e o f s t r e s s i n t h e E U M e m b e r S t a t e s
In 2005, the level of reported stress was lower in EU15 (20%) than in EU10 (30%) or in two Acceding Countries (Bulgaria and Romania; 31%). However, significant differences were also observed among the countries within these groups. The highest levels of stress were reported in Greece (55%), and in Slovenia (38%), Sweden (38%), and Latvia (37%), and the lowest levels noted in the United Kingdom (12%), Germany, Ireland, and the Netherlands (16%) as well as in the Czech Republic (17%), France and Bulgaria (18%).
Stress prevalence in EU15 in 2000 (28%) did not differ significantly from the levels reported in the previous survey carried out five years earlier. In 2000-2005 however, stress prevalence in the EU15 diminished. Overall fatigue, headaches and irritability indices also dropped during this time period, with sleeping problems and anxiety remaining at the same level. The opposite trend was identified in the 12 candidate countries, 10 of which became Member States before the end of this period on 1 May 2004. Stress prevalence grew slightly in those countries in 2001–2005 (from 28% to 30%). Some stress-related outcomes also increased.
Quantitative work demands, which are considered to be an important source of stress, are concurrently affected by two reverse trends: a positive one, shorter working hours, which would be likely to reduce stress prevalence (in EU15); and a negative one, greater work intensity, which generates higher stress levels.
In the EU25 countries, in 2005, fewer people (on average 14%) were forced to work long hours (a working week of 48 hours or more) than in previous years. At the same time workers were being asked to work faster and to tighter deadlines. Although generally the required speed of work is increasing, there is substantial variation between various Member Countries. In 2005, Sweden, Finland and Denmark had the highest percentage of workers who reported high-speed working “around half of the time or more” (85%, 77% and 76% respectively), whereas Ireland, Poland and Latvia had the lowest percentages (42%, 40% and 40% respectively).
Low job control is recognised as another important source of stress. In 1990-1995 in the EU15 an increase in control was observed and a smaller percentage of employees reported no control over work method and speed. Figures in the 2000 survey were similar, although levels of job control among the new EU countries were lower than among the EU15.
Another source of work-related stress is harassment. In 2005 about 5% of all workers from the EU25 and AC2 countries said they were subject to some form of violence or harassment (bullying), and about 2% reported experiencing unwanted sexual attention.
In 2005 stress was experienced by 22% of EU workers
Although on average working hours in EU are decreasing, work intensity is growing
OSH in figures: stress at work — facts and figuresEu
ropE
an a
gEn
cy f
or
SafE
ty a
nd
HEal
tH a
t W
ork
10
In the EU15, the level of reported violence increased slightly during the 1995-2005 period. There are significant differences in the prevalence of violence and, particularly, harassment in different European countries. The highest level of harassment was reported in Finland (17%), followed by the Netherlands (12%), and Lithuania (10%); the lowest levels were reported in Italy and Bulgaria (2%).
S t r e s s b y a g e
According to the EWCS (1995-2005) respondents from all age categories report that work affects their health. However, this opinion is most common in the 45-54 age group, and in most of the Member States there is a statistical peak in middle age in the relationship between age and stress. The highest stress levels are observed among middle aged workers, and the lowest among older and younger workers. It is also true, however, that physical violence is most often reported by workers from the 25-39 age group, and harassment and unwanted sexual attention by the youngest group (“24 or less”).
It is also worth mentioning that between 2000 and 2005, stress prevalence in the 40-54 age group decreased by 9 percentage points, from 32% in 2000 to 23% in 2005 (EU15). However, anxiety and irritability indices remained almost at the same level for this age group. Sleeping problems, anxiety, and irritability increased slightly in the 25-39 and +55 age groups. The overall fatigue indicator has dropped in all age categories.
S t r e s s b y g e n d e r
The figures from the EWCS carried out in 1995, 2000/2001 and 2005 show small differences between men and women’s work-related stress and also in stress indicators. However, the latest survey (2005) did show that stress is a little more prevalent among men (23%) compared to women (20%). Stress indicators, with the exception of anxiety, were slightly more prevalent among men. Women are more at risk of harassment than men, but the prevalence of physical violence is similar for both genders.
S t r e s s b y s e c t o r a n d o c c u p a t i o n
In 2005 stress was most common in the education and health sectors, and in agriculture, hunting, forestry & fishing (28.5%). The largest group of employees who suffered from anxiety at work were those employed in education and health, public administration and defence and in agriculture, hunting, forestry & fishing. Irritability was most prevalent in education and health, transport and communication, hotels and restaurants, and public administration and defence.
The threat of physical violence was mostly reported by workers employed in education and health (14.6%) and public administration and defence (11.6%), transport and communication (9.8%), hotels and restaurants (9.3%), and service, shop and market sales (9.2%). Actual physical violence - from people outside the workplace - was experienced by 8.8% of workers in public administration and defence and by 8.4% of workers in education and health. Harassment was more often reported in sectors such as hotels and restaurants (8.6% of workers) and education and health (7.8%). Unwanted sexual attention was reported by 3.9% of employees from hotels and restaurants, 2.7% in education and health, and 2.5% of those in service, shop and market sales.
From 1995 to 2000, the percentage of employees reporting stress at work in most economic sectors dropped or remained relatively unchanged. The most significant drop was in the agriculture, hunting, forestry & fishing sectors. The following five years
The highest stress level is observed among middle aged workers
The prevalence of stress among men and women is similar
Stress is especially prevalent in education and health, agriculture, hunting, forestry & fishing sectors
OSH in figures: stress at work — facts and figuresE
uro
pEan ag
Ency fo
r SafEty an
d HEaltH at W
ork
11
revealed an even stronger falling trend in the percentage of employees under stress at work. This trend is strong in transport and communication, in financial intermediation and in real estate activity. The only sectors where stress was rising was in agriculture, hunting, and forestry & fishing. However, in some Member States the number of workers reporting stress in sectors where its level has decreased in previous years, such as transport and communication, was significantly high (above 40%).
S t r e s s b y e m p l o y m e n t s t a t u s
The ‘well-being’ scores for self-employed workers are lower than for employed workers: 41% of those who are self-employed consider that work has an adverse impact on their health, and 25% suffer from stress while doing their jobs. The corresponding figures for employed workers are 33% and 21% respectively (2005). The figures for specific well-being indices, such as irritability, overall fatigue, sleeping problems and anxiety were also worse for the self-employed. Nevertheless, it is worth noting that the results of the survey from 2001 suggested that stress more often affected the self-employed who are themselves employers (40%), than it did the employed (29%) or those self-employed people who worked alone (24%).
Among employed workers, the type of employment contract they have affects stress levels and detailed stress-related indices. Among the four contract types - permanent contract, fixed term contract, temporary contract and apprenticeship - workers with permanent contracts displayed the highest stress levels both in 1995 and 2000. Some detailed well-being indices, such as irritability and sleeping problems, were also less favourable for this group.
National data present a deeper picture of the problem related to work-related stress in some of the Member States.
The well-being scores for self-employed workers are lower than for employed workers

E u r o p e a n A g e n c y f o r S a f e t y a n d H e a l t h a t W o r k
EUROPEAN RISK OBSERVATORY REPORT
E u r o p e a n A g e n c y f o r S a f e t y a n d H e a l t h a t W o r k
EUROPEAN RISK OBSERVATORY REPORT
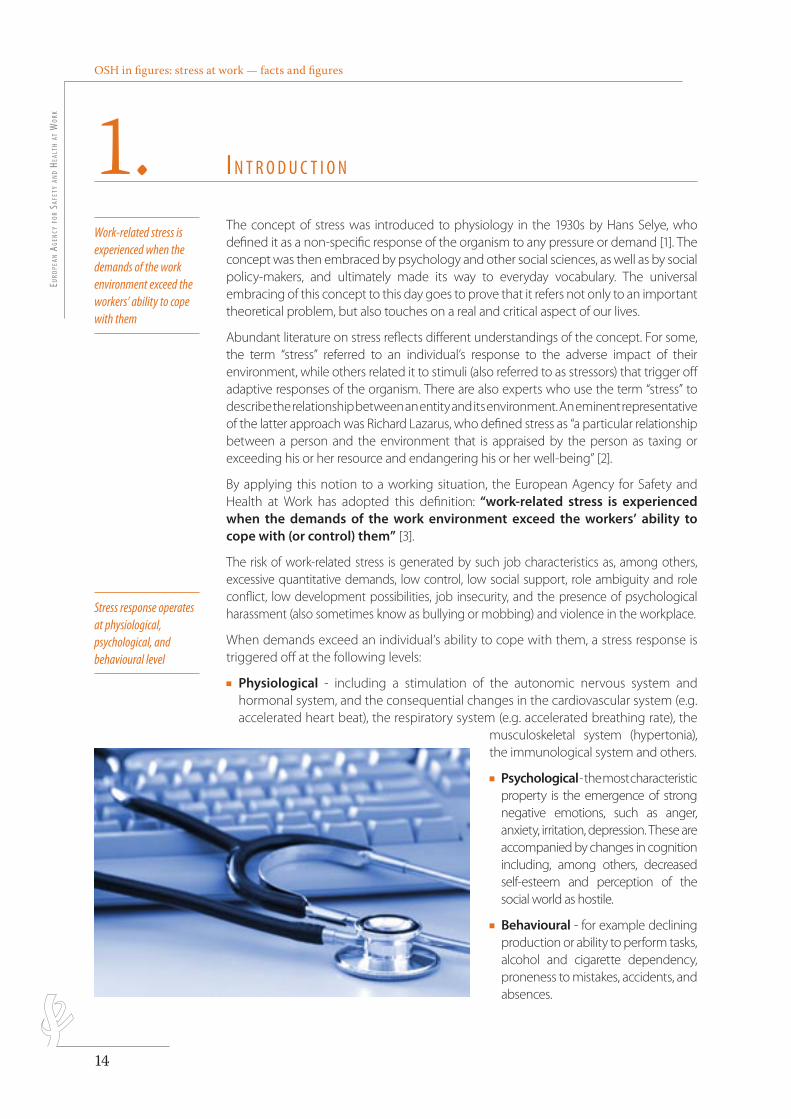
1.INTRODUCTION
OSH in figures: stress at work — facts and figuresEu
ropE
an a
gEn
cy f
or
SafE
ty a
nd
HEal
tH a
t W
ork
14
The concept of stress was introduced to physiology in the 1930s by Hans Selye, who defined it as a non-specific response of the organism to any pressure or demand [1]. The concept was then embraced by psychology and other social sciences, as well as by social policy-makers, and ultimately made its way to everyday vocabulary. The universal embracing of this concept to this day goes to prove that it refers not only to an important theoretical problem, but also touches on a real and critical aspect of our lives.
Abundant literature on stress reflects different understandings of the concept. For some, the term “stress” referred to an individual’s response to the adverse impact of their environment, while others related it to stimuli (also referred to as stressors) that trigger off adaptive responses of the organism. There are also experts who use the term “stress” to describe the relationship between an entity and its environment. An eminent representative of the latter approach was Richard Lazarus, who defined stress as “a particular relationship between a person and the environment that is appraised by the person as taxing or exceeding his or her resource and endangering his or her well-being” [2].
By applying this notion to a working situation, the European Agency for Safety and Health at Work has adopted this definition: “work-related stress is experienced when the demands of the work environment exceed the workers’ ability to cope with (or control) them” [3].
The risk of work-related stress is generated by such job characteristics as, among others, excessive quantitative demands, low control, low social support, role ambiguity and role conflict, low development possibilities, job insecurity, and the presence of psychological harassment (also sometimes know as bullying or mobbing) and violence in the workplace.
When demands exceed an individual’s ability to cope with them, a stress response is triggered off at the following levels:
n Physiological - including a stimulation of the autonomic nervous system and hormonal system, and the consequential changes in the cardiovascular system (e.g. accelerated heart beat), the respiratory system (e.g. accelerated breathing rate), the
musculoskeletal system (hypertonia), the immunological system and others.
n Psychological - the most characteristic property is the emergence of strong negative emotions, such as anger, anxiety, irritation, depression. These are accompanied by changes in cognition including, among others, decreased self-esteem and perception of the social world as hostile.
n Behavioural - for example declining production or ability to perform tasks, alcohol and cigarette dependency, proneness to mistakes, accidents, and absences.
Work-related stress is experienced when the demands of the work environment exceed the workers’ ability to cope with them
Stress response operates at physiological, psychological, and behavioural level
1. i n t r o d u c t i o n
OSH in figures: stress at work — facts and figuresE
uro
pEan ag
Ency fo
r SafEty an
d HEaltH at W
ork
15
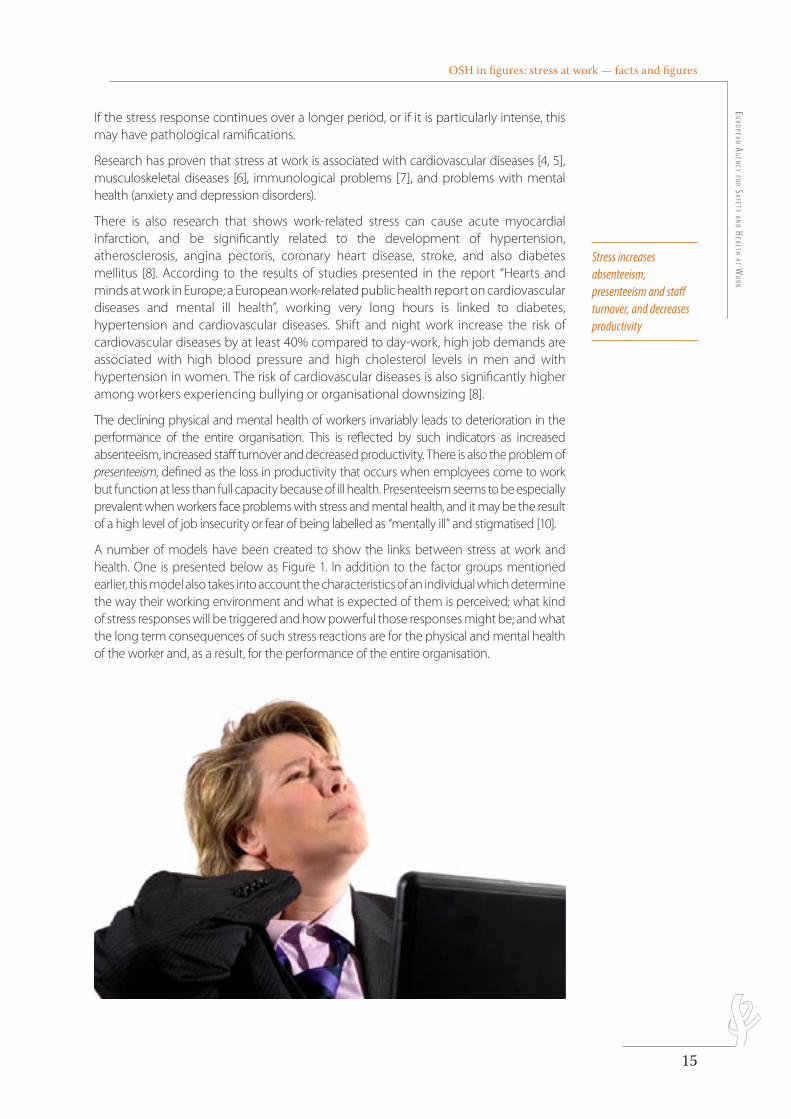
If the stress response continues over a longer period, or if it is particularly intense, this may have pathological ramifications.
Research has proven that stress at work is associated with cardiovascular diseases [4, 5], musculoskeletal diseases [6], immunological problems [7], and problems with mental health (anxiety and depression disorders).
There is also research that shows work-related stress can cause acute myocardial infarction, and be significantly related to the development of hypertension, atherosclerosis, angina pectoris, coronary heart disease, stroke, and also diabetes mellitus [8]. According to the results of studies presented in the report “Hearts and minds at work in Europe; a European work-related public health report on cardiovascular diseases and mental ill health”, working very long hours is linked to diabetes, hypertension and cardiovascular diseases. Shift and night work increase the risk of cardiovascular diseases by at least 40% compared to day-work, high job demands are associated with high blood pressure and high cholesterol levels in men and with hypertension in women. The risk of cardiovascular diseases is also significantly higher among workers experiencing bullying or organisational downsizing [8].
The declining physical and mental health of workers invariably leads to deterioration in the performance of the entire organisation. This is reflected by such indicators as increased absenteeism, increased staff turnover and decreased productivity. There is also the problem of presenteeism, defined as the loss in productivity that occurs when employees come to work but function at less than full capacity because of ill health. Presenteeism seems to be especially prevalent when workers face problems with stress and mental health, and it may be the result of a high level of job insecurity or fear of being labelled as “mentally ill” and stigmatised [10].
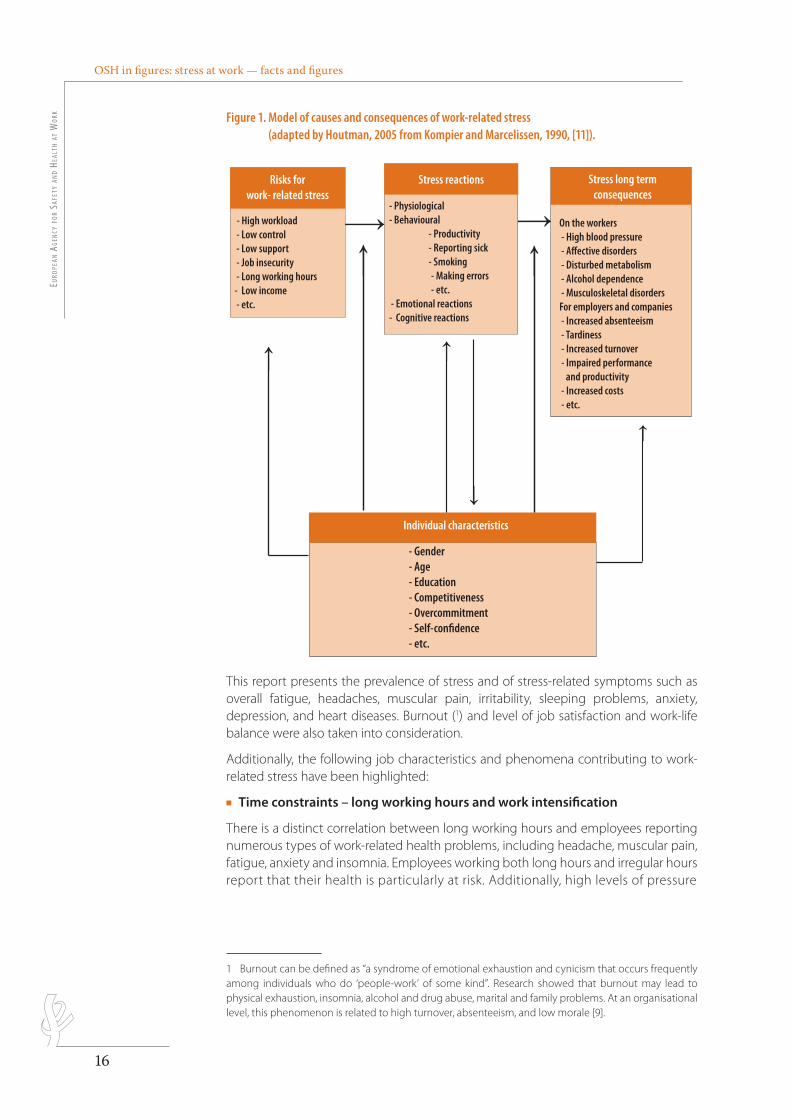
A number of models have been created to show the links between stress at work and health. One is presented below as Figure 1. In addition to the factor groups mentioned earlier, this model also takes into account the characteristics of an individual which determine the way their working environment and what is expected of them is perceived; what kind of stress responses will be triggered and how powerful those responses might be; and what the long term consequences of such stress reactions are for the physical and mental health of the worker and, as a result, for the performance of the entire organisation.
Stress increases absenteeism, presenteeism and staff turnover, and decreases productivity
OSH in figures: stress at work — facts and figuresEu
ropE
an a
gEn
cy f
or
SafE
ty a
nd
HEal
tH a
t W
ork
16
Figure 1. Model of causes and consequences of work-related stress (adapted by Houtman, 2005 from Kompier and Marcelissen, 1990, [11]).
This report presents the prevalence of stress and of stress-related symptoms such as overall fatigue, headaches, muscular pain, irritability, sleeping problems, anxiety, depression, and heart diseases. Burnout (1) and level of job satisfaction and work-life balance were also taken into consideration.
Additionally, the following job characteristics and phenomena contributing to work-related stress have been highlighted:
n Time constraints – long working hours and work intensification
There is a distinct correlation between long working hours and employees reporting numerous types of work-related health problems, including headache, muscular pain, fatigue, anxiety and insomnia. Employees working both long hours and irregular hours report that their health is particularly at risk. Additionally, high levels of pressure
1 Burnout can be defined as “a syndrome of emotional exhaustion and cynicism that occurs frequently among individuals who do ‘people-work’ of some kind”. Research showed that burnout may lead to physical exhaustion, insomnia, alcohol and drug abuse, marital and family problems. At an organisational level, this phenomenon is related to high turnover, absenteeism, and low morale [9].
OSH in figures: stress at work — facts and figuresE
uro
pEan ag
Ency fo
r SafEty an
d HEaltH at W
ork
17
stemming from high-speed tasks and strict deadlines also significantly increase the level of stress experienced by workers. Health and safety outcomes related to irregular working hours, high work pressure and high demands are presented in the Agency report Expert forecast on emerging psychosocial risks related to occupational safety and health [12].
n Job control
Job control describes the influence workers have on the way in which they perform the tasks required of them at work, including what choice they have about the methods they use and how they organise their tasks. Lack of job control may significantly increase the level of work-related stress. According to Karasek’s job demands-control model [13], when control is low and demands are high, a job can be characterised as high-straining or high-stressing, increasing the risk of work-related illness or injury. Moreover, research shows that the risk for a range of mental and physical health problems increases when high job-strain is combined with low workplace social support.
n Job insecurity
Job insecurity is defined as a continual concern about whether the job will exist in the future and also as any perceived threat to various aspects of a job, such as position within an organisation or career development opportunities. This phenomenon is particularly seen when organisational change happens, including reorganisation, outsourcing, mergers and acquisitions, and redundancies. Management may perceive these events as a way of increasing overall competitiveness, but research shows that an individual’s perception that their job is not secure increases work-related stress and leads to poorer mental and physical health [12].
n Violence and harassment
Workplace violence may be third party violence, which refers to physical violence, verbal aggression, or the threat of physical violence from an aggressor who is not a colleague - the customer, client or patient receiving goods or services. Harassment (also described as bullying, mobbing, or psychological violence) refers to repeated, unreasonable behaviour directed towards an employee or group of employees designed to victimise, humiliate, undermine or threaten them. It may also take the form of sexual harassment (unwanted sexual attention). Research shows that for the victims as well as for witnesses, both third party violence and harassment lead to stress and may seriously affect both mental and physical health; depression, reduced self-esteem, phobias, sleep disturbances, digestive and musculoskeletal problems, and post traumatic stress disorder are all possible outcomes [12].
This report:
— Presents the prevalence of stress and trends in work-related stress in the Member States of the European Union based on international and national data.
— Identifies those groups particularly exposed to stress at work, subdivided by age, gender, sector and occupation, and employment status.
The figures are illustrated by examples of studies and initiatives dealing with work-related stress. The possible cost related to problems with stress at work is also presented. Additionally, the report shows the main results of the expert forecast on emerging psychosocial risks which uses the framework established by the European Risk Observatory. The final sections present the main legislative documents related to workplace stress, areas for future research in this field, and sources of additional information on the subject.
Time constraints, lack of job control, job insecurity, violence and harassment contribute to work-related stress
OSH in fi gures: stress at work — facts and fi gures Eu
ropE
an a
gEn
cy f
or
SafE
ty a
nd
HEal
tH a
t W
ork
18
E u r o p e a n A g e n c y f o r S a f e t y a n d H e a l t h a t W o r k
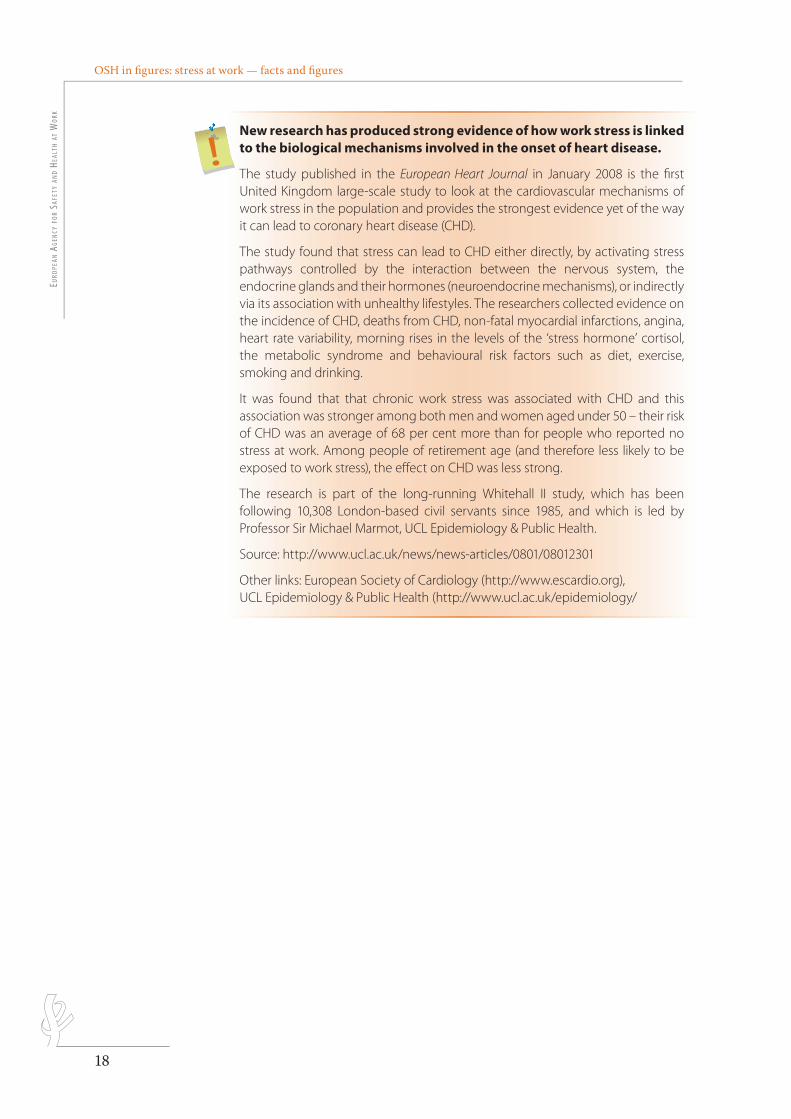
EUROPEAN RISK OBSERVATORY REPORTNew research has produced strong evidence of how work stress is linked to the biological mechanisms involved in the onset of heart disease.
The study published in the European Heart Journal in January 2008 is the fi rst United Kingdom large-scale study to look at the cardiovascular mechanisms of work stress in the population and provides the strongest evidence yet of the way it can lead to coronary heart disease (CHD).
The study found that stress can lead to CHD either directly, by activating stress pathways controlled by the interaction between the nervous system, the endocrine glands and their hormones (neuroendocrine mechanisms), or indirectly via its association with unhealthy lifestyles. The researchers collected evidence on the incidence of CHD, deaths from CHD, non-fatal myocardial infarctions, angina, heart rate variability, morning rises in the levels of the ‘stress hormone’ cortisol, the metabolic syndrome and behavioural risk factors such as diet, exercise, smoking and drinking.
It was found that that chronic work stress was associated with CHD and this association was stronger among both men and women aged under 50 – their risk of CHD was an average of 68 per cent more than for people who reported no stress at work. Among people of retirement age (and therefore less likely to be exposed to work stress), the eff ect on CHD was less strong.
The research is part of the long-running Whitehall II study, which has been following 10,308 London-based civil servants since 1985, and which is led by Professor Sir Michael Marmot, UCL Epidemiology & Public Health.
Source: http://www.ucl.ac.uk/news/news-articles/0801/08012301
Other links: European Society of Cardiology (http://www.escardio.org), UCL Epidemiology & Public Health (http://www.ucl.ac.uk/epidemiology/
E u r o p e a n A g e n c y f o r S a f e t y a n d H e a l t h a t W o r k
EUROPEAN RISK OBSERVATORY REPORT
PREVALENCE OF STRESS AT WORK
2.
OSH in figures: stress at work — facts and figuresEu
ropE
an a
gEn
cy f
or
SafE
ty a
nd
HEal
tH a
t W
ork
20
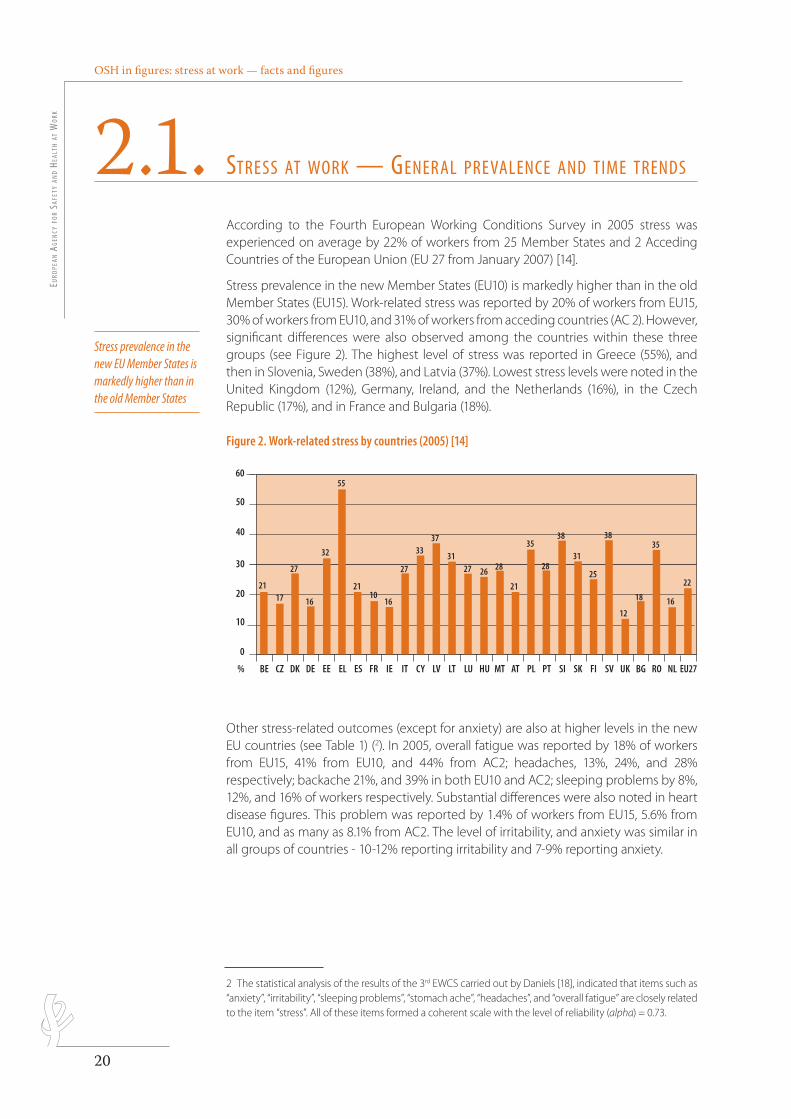
According to the Fourth European Working Conditions Survey in 2005 stress was experienced on average by 22% of workers from 25 Member States and 2 Acceding Countries of the European Union (EU 27 from January 2007) [14].
Stress prevalence in the new Member States (EU10) is markedly higher than in the old Member States (EU15). Work-related stress was reported by 20% of workers from EU15, 30% of workers from EU10, and 31% of workers from acceding countries (AC 2). However, significant differences were also observed among the countries within these three groups (see Figure 2). The highest level of stress was reported in Greece (55%), and then in Slovenia, Sweden (38%), and Latvia (37%). Lowest stress levels were noted in the United Kingdom (12%), Germany, Ireland, and the Netherlands (16%), in the Czech Republic (17%), and in France and Bulgaria (18%).
Figure 2. Work-related stress by countries (2005) [14]
60
50
40
30
20
10
0
% BE CZ DK DE EE EL ES FR IE IT CY LV LT LU HU MT AT PL PT SI SK FI SV UK BG RO NL EU27
2117
27
16
32
2110
16
27
3337
3127 26 28
21
35
28
38
31
25
38
12
18
35
16
22
55
police : Myriad pro semibold condensed 11 pt
ordre des couleurs : dernier dossier dans la palette(la couleur du fond est la première de la palette, les autres suivent dans l’ordre)
légende : à droite ou en dessous du graphique
Les repères dépassent de 2 mm et tous les traits sont à 0.5 ptles barres n’ont pas de contours
carrés sans contours 4x4 mm
Other stress-related outcomes (except for anxiety) are also at higher levels in the new EU countries (see Table 1) (2). In 2005, overall fatigue was reported by 18% of workers from EU15, 41% from EU10, and 44% from AC2; headaches, 13%, 24%, and 28% respectively; backache 21%, and 39% in both EU10 and AC2; sleeping problems by 8%, 12%, and 16% of workers respectively. Substantial differences were also noted in heart disease figures. This problem was reported by 1.4% of workers from EU15, 5.6% from EU10, and as many as 8.1% from AC2. The level of irritability, and anxiety was similar in all groups of countries - 10-12% reporting irritability and 7-9% reporting anxiety.
2.1. StrESS at Work — gEnEr al prEvalEncE and timE trEndS
Stress prevalence in the new EU member States is markedly higher than in the old member States
2 The statistical analysis of the results of the 3rd EWCS carried out by Daniels [18], indicated that items such as “anxiety”, “irritability”, “sleeping problems”, “stomach ache”, “headaches”, and “overall fatigue” are closely related to the item “stress”. All of these items formed a coherent scale with the level of reliability (alpha) = 0.73.
OSH in figures: stress at work — facts and figuresE
uro
pEan ag
Ency fo
r SafEty an
d HEaltH at W
ork
21
Table 1. Stress and stress-related outcomes - prevalence and time trends (% yes) [13, 15, 16, 17]
Question EU15 CC12 NMS10 AC2
1995 2000 2005 2001 2005 2005
Does your work affect your health 57 60 31 69 56 53
Stress 28 28 20 28 30 31
Overall fatigue 20 23 18 41 41 44
Headaches 13 15 13 15 24 28
Backache 30 33 21 34 39 39
Irritability 11 11 10 11 12 11
Sleeping problems 7 8 8 8 12 16
Anxiety 7 7 8 7 7 9
Heart disease 1 1 1.4 4.8 5.6 8.1
Time trends
According to the European Working Conditions Survey (EWCS) carried out in 2000, 28% of workers in the EU15 suffered from stress at work [15]. The survey carried out a year later in candidate countries revealed similar trends: 28% of workers from the 12 candidate countries suffered from stress [16].
Some other stress-related conditions were less common. In terms of figures, 23% of workers from the EU15 reported that work affects overall fatigue, 15% reported that work causes headaches, 11% that work causes irritability, 8% reported sleeping problems, and 7% anxiety. In the 2001 survey carried out in the candidate countries, the figures follow the same trends (see Table 1), except for overall fatigue which was nearly two times higher in the candidate countries than in the EU 15 (41% and 23% respectively).
Stress prevalence in 2000 did not differ significantly from the levels reported by the EWCS carried out in 1995 [17]. In 2000-2005 however, stress prevalence in the EU15 diminished. Overall fatigue, headaches and irritability indices also dropped between surveys, with sleeping problems at the same level and a slightly higher level of anxiety. A reverse trend was seen in the 12 candidate countries, 10 of which became Member States before the end of this period on 1 May 2004. Stress figures increased slightly in those countries between 2001 and 2005, from 28% to 30% in the 10 new Member States (NMS), and to 31% in the two Acceding Countries. Some stress-related outcomes also increased, such as sleeping problems which rose from 8% to 12% in the new Member States and to 16% in the ACs, and headaches which rose from 15% to 24% in the new Member States and 28% in the ACs. As a result of these reverse trends, the difference in stress prevalence between the old and new Member States in 2005 also grew compared to the figures from 2000/2001 (see Table 1).
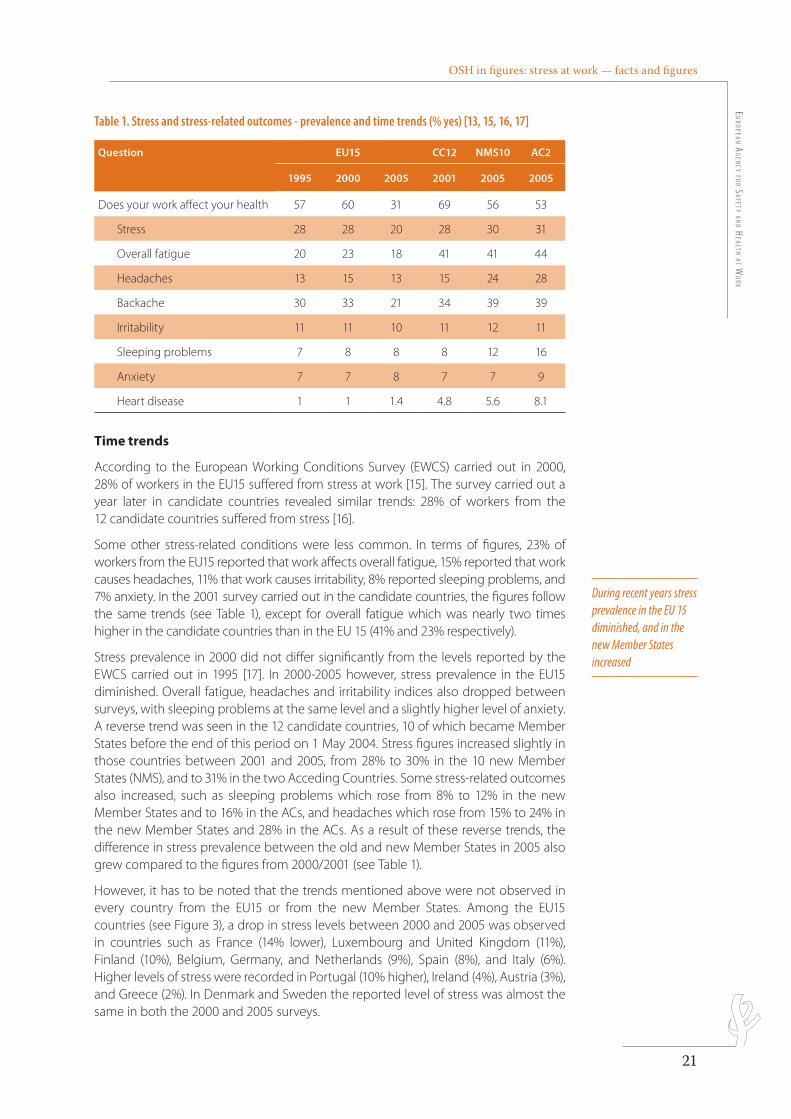
However, it has to be noted that the trends mentioned above were not observed in every country from the EU15 or from the new Member States. Among the EU15 countries (see Figure 3), a drop in stress levels between 2000 and 2005 was observed in countries such as France (14% lower), Luxembourg and United Kingdom (11%), Finland (10%), Belgium, Germany, and Netherlands (9%), Spain (8%), and Italy (6%). Higher levels of stress were recorded in Portugal (10% higher), Ireland (4%), Austria (3%), and Greece (2%). In Denmark and Sweden the reported level of stress was almost the same in both the 2000 and 2005 surveys.
During recent years stress prevalence in the EU 15 diminished, and in the new member States increased
OSH in figures: stress at work — facts and figuresEu
ropE
an a
gEn
cy f
or
SafE
ty a
nd
HEal
tH a
t W
ork
22
Figure 3. Work-related stress, EU15 [14, 15, 17]
Aust
ria
Belg
ium
Denm
ark
Finl
and
Fran
ce
Germ
any
Gree
ce
Irela
nd
Italy
Luxe
mbo
urg
Neth
erla
nds
Port
ugal
Spai
n
Swed
en UK
EU15
60%
50
30
40
10
20
0
1995
2000
2005
police : Myriad pro semibold condensed 11 pt
ordre des couleurs : dernier dossier dans la palette(la couleur du fond est la première de la palette, les autres suivent dans l’ordre)
légende : à droite ou en dessous du graphique
Les repères dépassent de 2 mm et tous les traits sont à 0.5 ptles barres n’ont pas de contours
carrés sans contours 4x4 mm
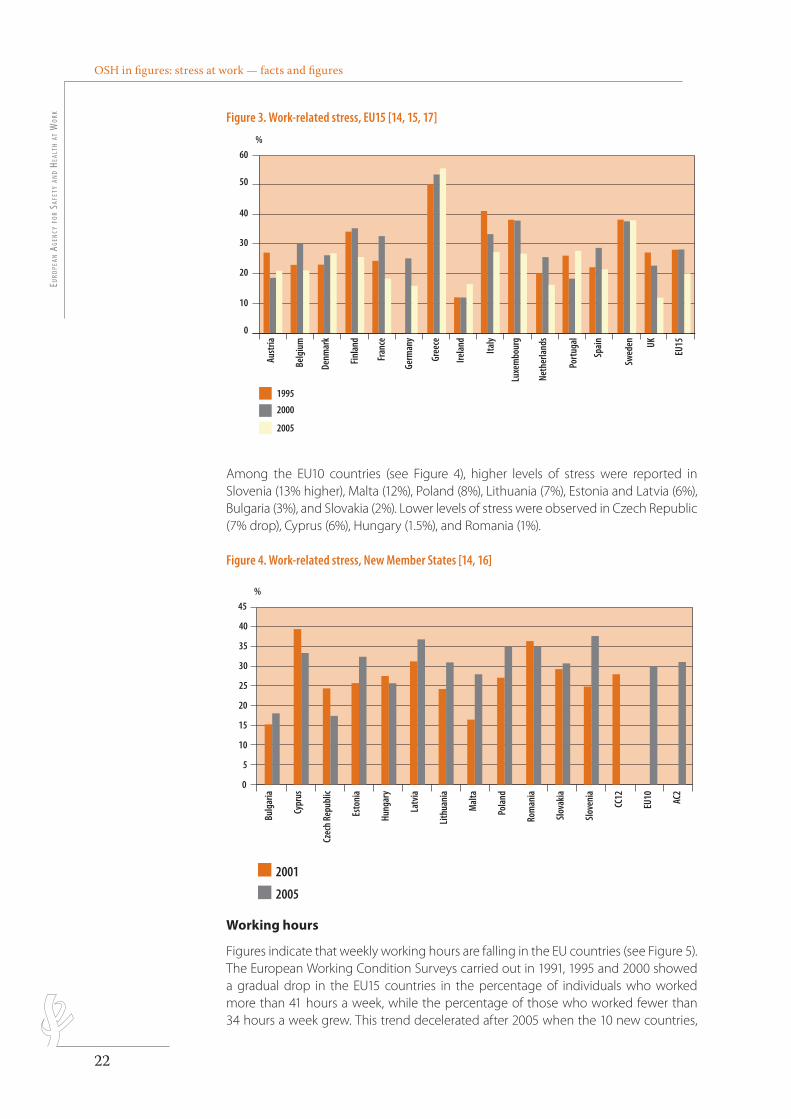
Among the EU10 countries (see Figure 4), higher levels of stress were reported in Slovenia (13% higher), Malta (12%), Poland (8%), Lithuania (7%), Estonia and Latvia (6%), Bulgaria (3%), and Slovakia (2%). Lower levels of stress were observed in Czech Republic (7% drop), Cyprus (6%), Hungary (1.5%), and Romania (1%).
Figure 4. Work-related stress, New Member States [14, 16]
Bulg
aria
Cypr
us
Esto
nia
Hung
ary
Latv
ia
Lith
uani
a
Mal
ta
Pola
nd
Rom
ania
Slov
akia
Slov
enia
CC12
EU10 AC
2
Czec
h Re
publ
ic
45%
25
30
35
40
15
20
10
5
0
2001
2005
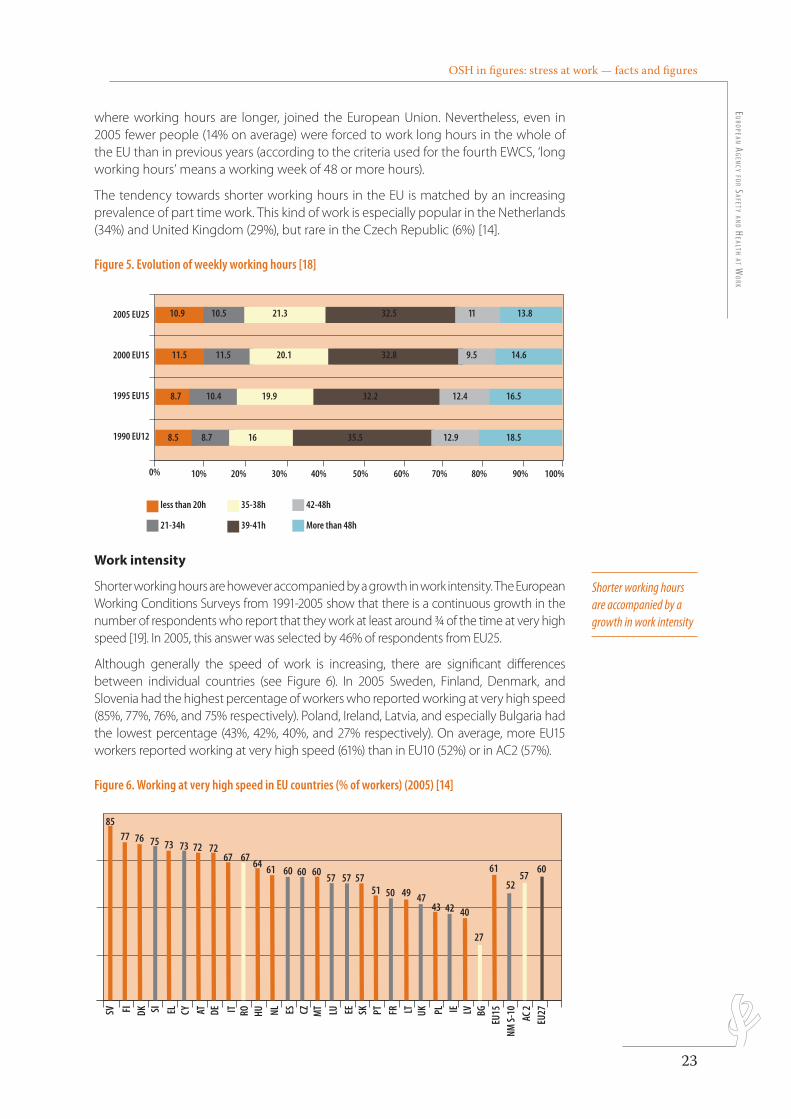
Working hours
Figures indicate that weekly working hours are falling in the EU countries (see Figure 5). The European Working Condition Surveys carried out in 1991, 1995 and 2000 showed a gradual drop in the EU15 countries in the percentage of individuals who worked more than 41 hours a week, while the percentage of those who worked fewer than 34 hours a week grew. This trend decelerated after 2005 when the 10 new countries,
OSH in figures: stress at work — facts and figuresE
uro
pEan ag
Ency fo
r SafEty an
d HEaltH at W
ork
23
where working hours are longer, joined the European Union. Nevertheless, even in 2005 fewer people (14% on average) were forced to work long hours in the whole of the EU than in previous years (according to the criteria used for the fourth EWCS, ‘long working hours’ means a working week of 48 or more hours).
The tendency towards shorter working hours in the EU is matched by an increasing prevalence of part time work. This kind of work is especially popular in the Netherlands (34%) and United Kingdom (29%), but rare in the Czech Republic (6%) [14].
Figure 5. Evolution of weekly working hours [18]
10% 20% 30% 40% 50% 60% 70% 80% 90% 100%0%
2005 EU25
2000 EU15
1995 EU15
1990 EU12
less than 20h
21-34h
35-38h
39-41h
42-48h
More than 48h
10.510.9 21.3 32.5 13.811
11.5 11.5 32.8 9.5 14.620.1
8.7 10.4 32.2 12.4 16.519.9
8.5 8.7 35.5 12.9 18.516
police : Myriad pro semibold condensed 11 pt
ordre des couleurs : dernier dossier dans la palette(la couleur du fond est la première de la palette, les autres suivent dans l’ordre)
légende : à droite ou en dessous du graphique
Les repères dépassent de 2 mm et tous les traits sont à 0.5 ptles barres n’ont pas de contours
carrés sans contours 4x4 mm Work intensity
Shorter working hours are however accompanied by a growth in work intensity. The European Working Conditions Surveys from 1991-2005 show that there is a continuous growth in the number of respondents who report that they work at least around ¾ of the time at very high speed [19]. In 2005, this answer was selected by 46% of respondents from EU25.
Although generally the speed of work is increasing, there are significant differences between individual countries (see Figure 6). In 2005 Sweden, Finland, Denmark, and Slovenia had the highest percentage of workers who reported working at very high speed (85%, 77%, 76%, and 75% respectively). Poland, Ireland, Latvia, and especially Bulgaria had the lowest percentage (43%, 42%, 40%, and 27% respectively). On average, more EU15 workers reported working at very high speed (61%) than in EU10 (52%) or in AC2 (57%).
Figure 6. Working at very high speed in EU countries (% of workers) (2005) [14]
SV FI DK SI EL CY AT DE IT HU NL ES CZ MT LU EE SK PT FR LT UK PL IE LV BG
EU15
NM S-
10AC
2EU
27RO
8577 76 75 73 73 72 72
67 67 64 61 60 60 60 6057 57 57 57
51 50 49 4743 42 40
27
61
52
police : Myriad pro semibold condensed 11 pt
ordre des couleurs : dernier dossier dans la palette(la couleur du fond est la première de la palette, les autres suivent dans l’ordre)
légende : à droite ou en dessous du graphique
Les repères dépassent de 2 mm et tous les traits sont à 0.5 ptles barres n’ont pas de contours
carrés sans contours 4x4 mm
Shorter working hours are accompanied by a growth in work intensity
OSH in figures: stress at work — facts and figuresEu
ropE
an a
gEn
cy f
or
SafE
ty a
nd
HEal
tH a
t W
ork
24
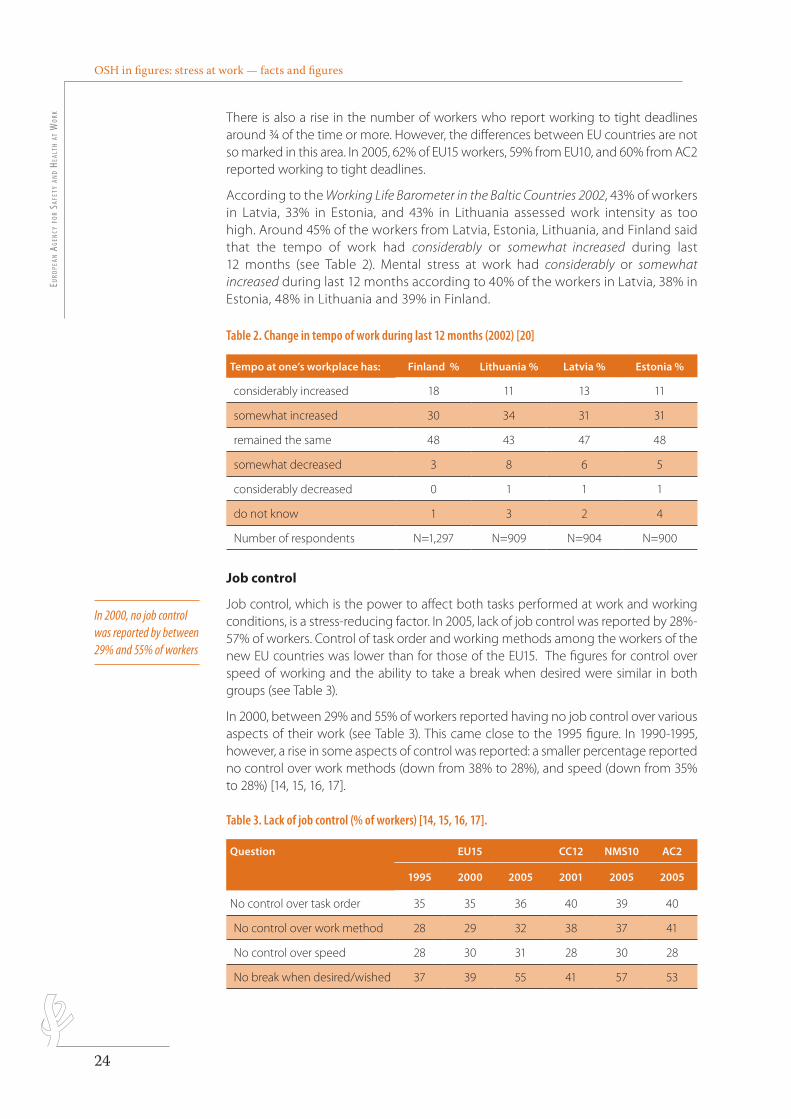
There is also a rise in the number of workers who report working to tight deadlines around ¾ of the time or more. However, the differences between EU countries are not so marked in this area. In 2005, 62% of EU15 workers, 59% from EU10, and 60% from AC2 reported working to tight deadlines.
According to the Working Life Barometer in the Baltic Countries 2002, 43% of workers in Latvia, 33% in Estonia, and 43% in Lithuania assessed work intensity as too high. Around 45% of the workers from Latvia, Estonia, Lithuania, and Finland said that the tempo of work had considerably or somewhat increased during last 12 months (see Table 2). Mental stress at work had considerably or somewhat increased during last 12 months according to 40% of the workers in Latvia, 38% in Estonia, 48% in Lithuania and 39% in Finland.
Table 2. Change in tempo of work during last 12 months (2002) [20]
Tempo at one’s workplace has: Finland % Lithuania % Latvia % Estonia %
considerably increased 18 11 13 11
somewhat increased 30 34 31 31
remained the same 48 43 47 48
somewhat decreased 3 8 6 5
considerably decreased 0 1 1 1
do not know 1 3 2 4
Number of respondents N=1,297 N=909 N=904 N=900
Job control
Job control, which is the power to affect both tasks performed at work and working conditions, is a stress-reducing factor. In 2005, lack of job control was reported by 28%-57% of workers. Control of task order and working methods among the workers of the new EU countries was lower than for those of the EU15. The figures for control over speed of working and the ability to take a break when desired were similar in both groups (see Table 3).
In 2000, between 29% and 55% of workers reported having no job control over various aspects of their work (see Table 3). This came close to the 1995 figure. In 1990-1995, however, a rise in some aspects of control was reported: a smaller percentage reported no control over work methods (down from 38% to 28%), and speed (down from 35% to 28%) [14, 15, 16, 17].
Table 3. Lack of job control (% of workers) [14, 15, 16, 17].
Question EU15 CC12 NMS10 AC2
1995 2000 2005 2001 2005 2005
No control over task order 35 35 36 40 39 40
No control over work method 28 29 32 38 37 41
No control over speed 28 30 31 28 30 28
No break when desired/wished 37 39 55 41 57 53
In 2000, no job control was reported by between 29% and 55% of workers
OSH in figures: stress at work — facts and figuresE
uro
pEan ag
Ency fo
r SafEty an
d HEaltH at W
ork
25
Job insecurity is significantly more prevalent in the New member States compared to the EU15
Around 5% of all EU workers declared being subjected to some form of violence or harassment
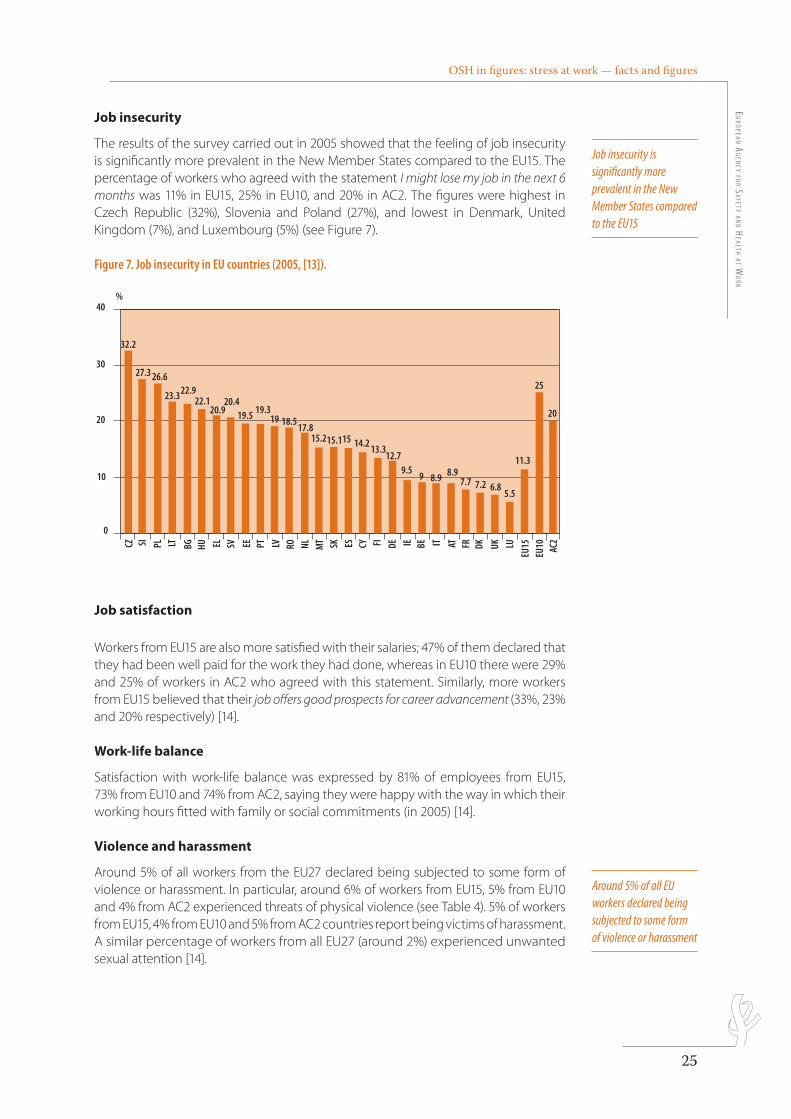
Job insecurity
The results of the survey carried out in 2005 showed that the feeling of job insecurity is significantly more prevalent in the New Member States compared to the EU15. The percentage of workers who agreed with the statement I might lose my job in the next 6 months was 11% in EU15, 25% in EU10, and 20% in AC2. The figures were highest in Czech Republic (32%), Slovenia and Poland (27%), and lowest in Denmark, United Kingdom (7%), and Luxembourg (5%) (see Figure 7).
Figure 7. Job insecurity in EU countries (2005, [13]).
police : Myriad pro semibold condensed 11 pt
ordre des couleurs : dernier dossier dans la palette(la couleur du fond est la première de la palette, les autres suivent dans l’ordre)
légende : à droite ou en dessous du graphique
Les repères dépassent de 2 mm et tous les traits sont à 0.5 ptles barres n’ont pas de contours
carrés sans contours 4x4 mm
30
40%
32.2
27.3 26.6
23.322.922.1
20.920.4
19.5 19.319 18.5
17.815.215.115 14.2
13.312.7
9.59 8.9 8.9
7.7 7.2 6.85.5
11.3
25
2020
10
0
CZ SI PL LT BG HU EL SV EE LV RO NL MT SK ES CY FI DE IE BE IT AT FR DK UK LU
EU15
EU10 AC
2PT
Job satisfaction
Workers from EU15 are also more satisfied with their salaries; 47% of them declared that they had been well paid for the work they had done, whereas in EU10 there were 29% and 25% of workers in AC2 who agreed with this statement. Similarly, more workers from EU15 believed that their job offers good prospects for career advancement (33%, 23% and 20% respectively) [14].
Work-life balance
Satisfaction with work-life balance was expressed by 81% of employees from EU15, 73% from EU10 and 74% from AC2, saying they were happy with the way in which their working hours fitted with family or social commitments (in 2005) [14].
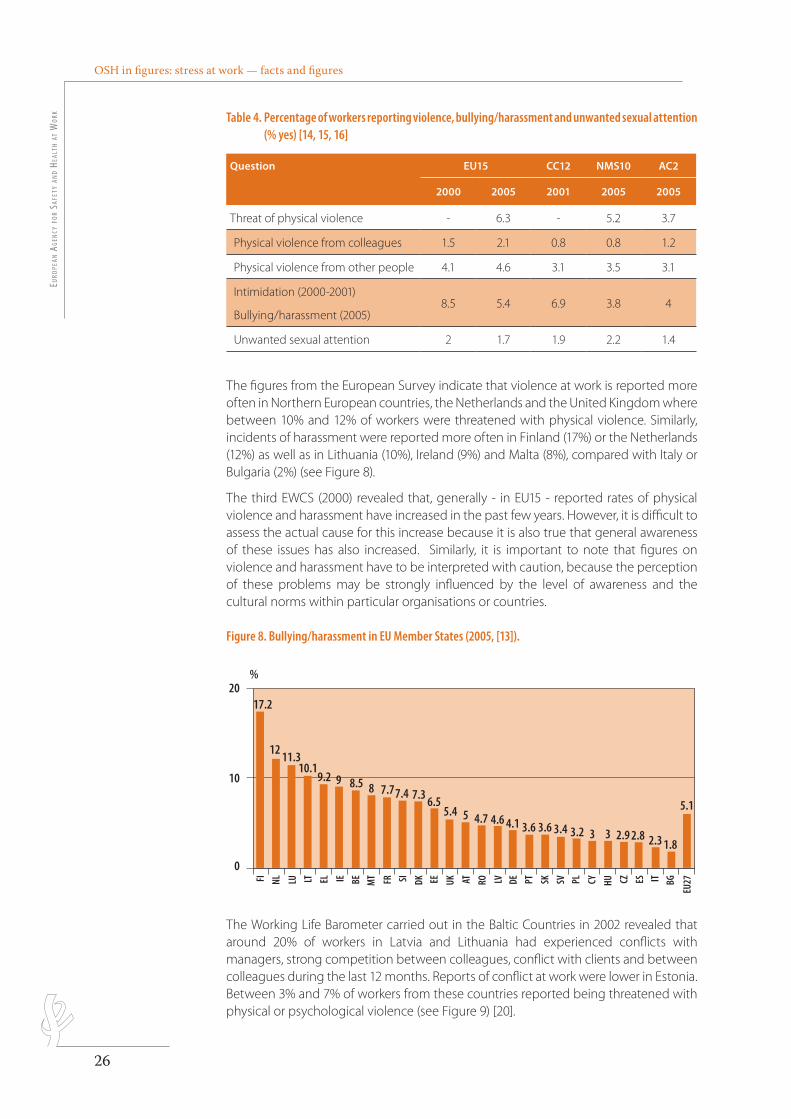
Violence and harassment
Around 5% of all workers from the EU27 declared being subjected to some form of violence or harassment. In particular, around 6% of workers from EU15, 5% from EU10 and 4% from AC2 experienced threats of physical violence (see Table 4). 5% of workers from EU15, 4% from EU10 and 5% from AC2 countries report being victims of harassment. A similar percentage of workers from all EU27 (around 2%) experienced unwanted sexual attention [14].
OSH in figures: stress at work — facts and figuresEu
ropE
an a
gEn
cy f
or
SafE
ty a
nd
HEal
tH a
t W
ork
26
Table 4. Percentage of workers reporting violence, bullying/harassment and unwanted sexual attention (% yes) [14, 15, 16]
Question EU15 CC12 NMS10 AC2
2000 2005 2001 2005 2005
Threat of physical violence - 6.3 - 5.2 3.7
Physical violence from colleagues 1.5 2.1 0.8 0.8 1.2
Physical violence from other people 4.1 4.6 3.1 3.5 3.1
Intimidation (2000-2001)
Bullying/harassment (2005)8.5 5.4 6.9 3.8 4
Unwanted sexual attention 2 1.7 1.9 2.2 1.4
The figures from the European Survey indicate that violence at work is reported more often in Northern European countries, the Netherlands and the United Kingdom where between 10% and 12% of workers were threatened with physical violence. Similarly, incidents of harassment were reported more often in Finland (17%) or the Netherlands (12%) as well as in Lithuania (10%), Ireland (9%) and Malta (8%), compared with Italy or Bulgaria (2%) (see Figure 8).
The third EWCS (2000) revealed that, generally - in EU15 - reported rates of physical violence and harassment have increased in the past few years. However, it is difficult to assess the actual cause for this increase because it is also true that general awareness of these issues has also increased. Similarly, it is important to note that figures on violence and harassment have to be interpreted with caution, because the perception of these problems may be strongly influenced by the level of awareness and the cultural norms within particular organisations or countries.
Figure 8. Bullying/harassment in EU Member States (2005, [13]).
20%
17.2
1211.3
10.19.2 9 8.5 8 7.77.4 7.3 6.5 5.15.4 5 4.7 4.6 4.1 3.6 3.6 3.4 3.2 3 3 2.9 2.8 2.3 1.8
10
0
FI NL LU LT EL IE BE MT FR SI DK EE UK AT RO LV DE PT SK SV PL CY HU CZ ES IT BG
EU27
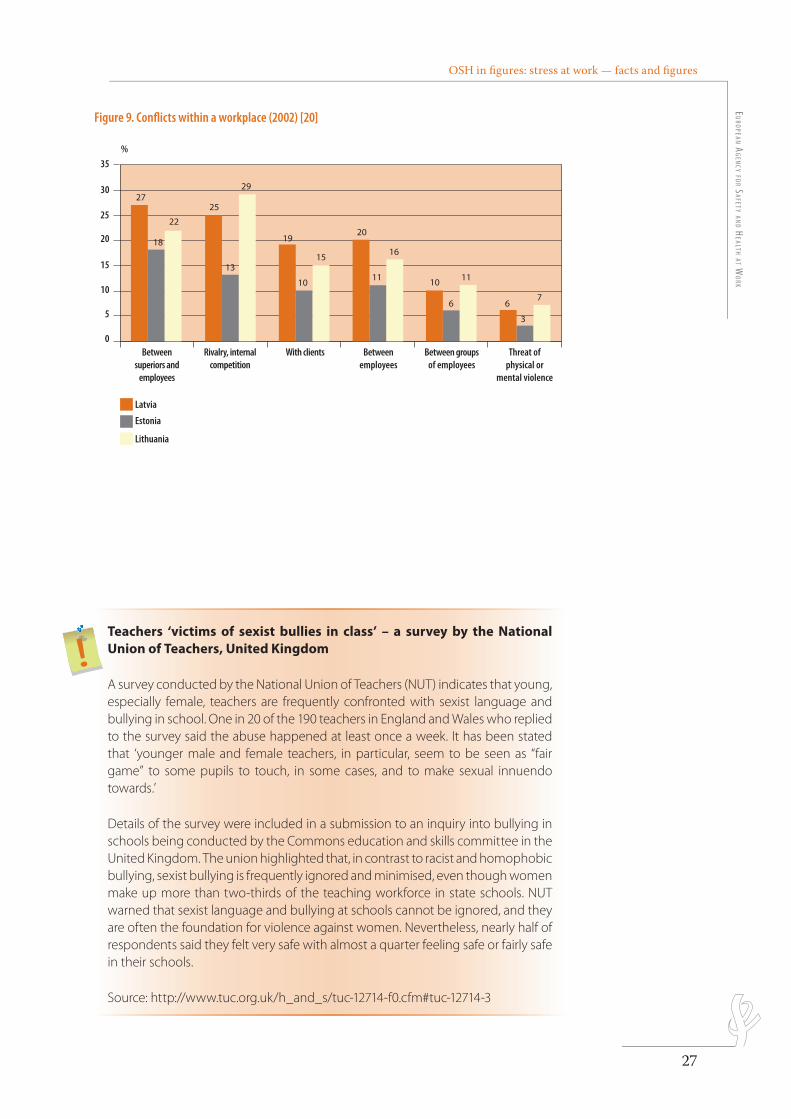
The Working Life Barometer carried out in the Baltic Countries in 2002 revealed that around 20% of workers in Latvia and Lithuania had experienced conflicts with managers, strong competition between colleagues, conflict with clients and between colleagues during the last 12 months. Reports of conflict at work were lower in Estonia. Between 3% and 7% of workers from these countries reported being threatened with physical or psychological violence (see Figure 9) [20].
OSH in fi gures: stress at work — facts and fi gures E
uro
pEan ag
Ency fo
r SafEty an
d HEaltH at W
ork
27
Figure 9. Confl icts within a workplace (2002) [20]
35
27
18
22
25
20
11
16
10 11
6 6
3
7
29
19
15
10
13
30
%
25
20
15
10
5
0Threat of
physical ormental violence
Between groupsof employees
Between employees
With clientsRivalry, internalcompetition
Betweensuperiors and
employees
Latvia
Estonia
Lithuania
police : Myriad pro semibold condensed 11 pt
ordre des couleurs : dernier dossier dans la palette(la couleur du fond est la première de la palette, les autres suivent dans l’ordre)
légende : à droite ou en dessous du graphique
Les repères dépassent de 2 mm et tous les traits sont à 0.5 ptles barres n’ont pas de contours
carrés sans contours 4x4 mm
Teachers ‘victims of sexist bullies in class’ – a survey by the National Union of Teachers, United Kingdom
A survey conducted by the National Union of Teachers (NUT) indicates that young, especially female, teachers are frequently confronted with sexist language and bullying in school. One in 20 of the 190 teachers in England and Wales who replied to the survey said the abuse happened at least once a week. It has been stated that ‘younger male and female teachers, in particular, seem to be seen as “fair game” to some pupils to touch, in some cases, and to make sexual innuendo towards.’
Details of the survey were included in a submission to an inquiry into bullying in schools being conducted by the Commons education and skills committee in the United Kingdom. The union highlighted that, in contrast to racist and homophobic bullying, sexist bullying is frequently ignored and minimised, even though women make up more than two-thirds of the teaching workforce in state schools. NUT warned that sexist language and bullying at schools cannot be ignored, and they are often the foundation for violence against women. Nevertheless, nearly half of respondents said they felt very safe with almost a quarter feeling safe or fairly safe in their schools.
Source: http://www.tuc.org.uk/h_and_s/tuc-12714-f0.cfm#tuc-12714-3
OSH in fi gures: stress at work — facts and fi gures Eu
ropE
an a
gEn
cy f
or
SafE
ty a
nd
HEal
tH a
t W
ork
28
Psychosocial Risk Management – European Framework (PRIMA-EF)
PRIMA-EF is the collaborative project funded by the EC 6th Framework Programme, focusing on the development of a European framework for psychosocial risk management with a special focus on work-related stress and workplace violence (including harassment, bullying and mobbing). The 24-month initiative was launched in at the beginning of 2007. The consortium is led by Institute of Work, Health and Organisations (I-WHO), University of Nottingham, United Kingdom and is constituted by several European and international (WHO, ILO) organisations which deal with occupational health and safety.
The Project aims to:
n develop existing knowledge in reviewing available methodologies to evaluate the prevalence and impact of psychosocial risks at work and work-related stress
n identify appropriate means of collecting sensitive data in relation to these issues
n develop international standards and indicators on stress and violence at work in order to promote harmonisation in the area of psychosocial risk management and enhance best business practice
n develop detailed recommendations and evidence-based best-practice guidance on the management of these issues at the workplace to promote clarity and a unifi ed European approach that will enable stakeholders to put the guidance in practice to improve the quality of working life
n disseminate the results of the project to stakeholders and social partners including small and medium-sized enterprises (SMEs) in order to raise awareness and promote understanding, engagement and best practice in relation to the issues of concern
The consortium will work in synergy with partners in candidate and third countries and national regulatory bodies to ensure a wide impact of the project outcomes and the initiation of the development of an international network of centres of excellence in psychosocial risk management.
Source and more information: http://prima-ef.org/default.aspx
OSH in figures: stress at work — facts and figuresE
uro
pEan ag
Ency fo
r SafEty an
d HEaltH at W
ork
29
i n f o r m a t i o n f r o m t H E m E m b E r St a t E S 2.2.B e l g i u m
According to the 4th EWCS, 21% of Belgian workers believed that their health was at risk because of work-related stress. The results of the Flemish Workability Monitor (2004 [21]) showed that more - 28.9% of employees - have to contend with stress at work. Of these, 10% have to deal with acute work stress complaints. It has been demonstrated that employees with acute work stress are significantly more at risk from health problems than employees without work stress. They are:
n 7.3 times more at risk of serious sleeping problems
n 8.2 times more at risk of emotional problems (anxiety and depression)
n 4.6 times more at risk of heart complaints
Moreover, absenteeism of workers who suffer from acute work-related stress is higher than those who do not report such problems. Long term absence among these two groups is 14.8% and 7.2% respectively.
C y p r u s
A study “Assessment of the situation regarding physical and mental diseases of the working population” [22] carried out in 2006 covered 1,200 households, and there were 2,257 interviews with people who currently work or have worked in the past (aged 18-63). The results indicated that 37% of respondents believed that their safety and health was at risk because of their job (34% according to 4th EWCS), and 19% said that they faced health problems caused or aggravated by the profession they have now or had in the past. The most prevalent were musculoskeletal problems - 71% of those who reported health problems and 13% of the total sample. Next came general fatigue - 32% of those reporting health problems and 6% of the total sample, and finally stress - 23% and 4% respectively. A significant number of respondents also reported heart disease or other circulatory system problems - 9% of those who reported health problems and 1.6% of the total sample. In the case of the teaching profession, the most prevalent health problem was associated with stress.
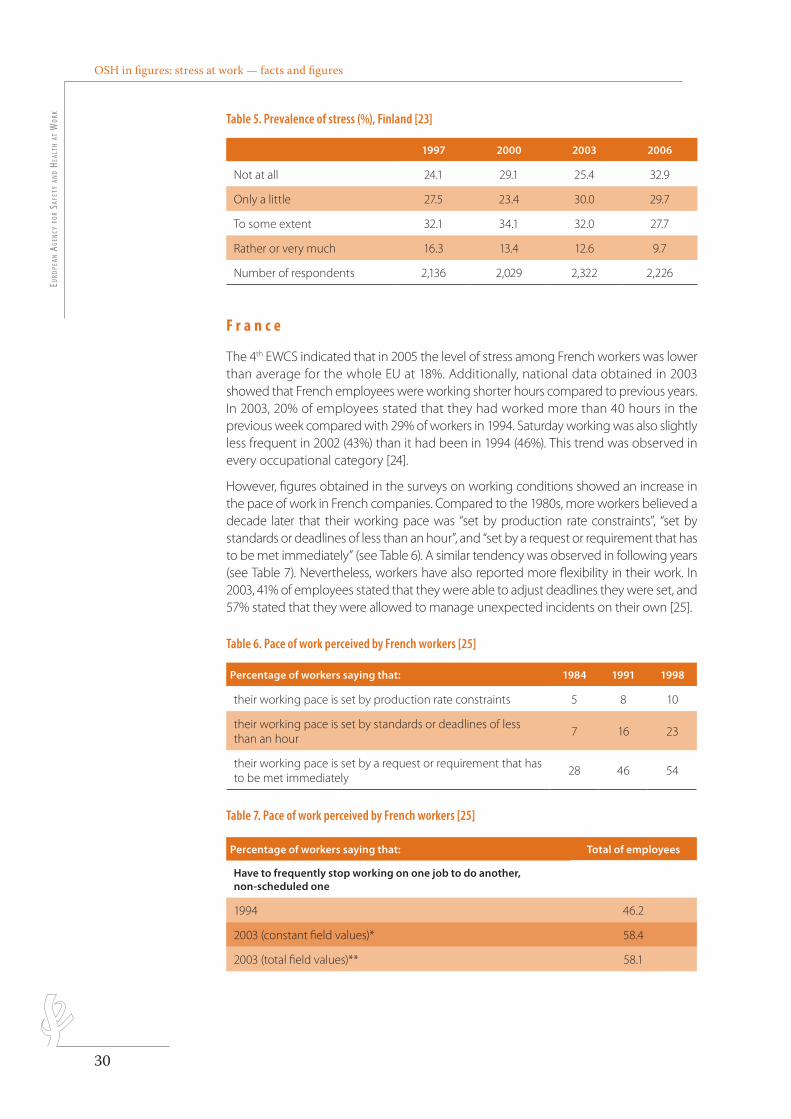
F i n l a n d
The results of the Finnish “Work and health” surveys (1997-2006) [23] indicate that the proportion of workers reporting “rather or very much” stress has decreased during the past few years (see Table 5). However, these surveys do not make a distinction between work-related stress and stress from other sources (3). In 2006 experiencing stress to some extent was reported by 28% of workers, and rather or very much by 10%. According to the 4th EWCS (2005) work-related stress is a problem for 25% of workers.
There is also data (from 2000) suggesting that 2.5% of Finnish workers aged 30-64 years suffered from severe work-related ‘burnout’, and another 25% from mild burnout [23].
3 The respondents were asked to answer the following question: “Stress refers to a situation in which a person feels tense, restless, nervous, or anxious, or is unable to sleep at night because the mind is troubled all the time. Do you feel that kind of stress these days?”
OSH in figures: stress at work — facts and figuresEu
ropE
an a
gEn
cy f
or
SafE
ty a
nd
HEal
tH a
t W
ork
30
Table 5. Prevalence of stress (%), Finland [23]
1997 2000 2003 2006
Not at all 24.1 29.1 25.4 32.9
Only a little 27.5 23.4 30.0 29.7
To some extent 32.1 34.1 32.0 27.7
Rather or very much 16.3 13.4 12.6 9.7
Number of respondents 2,136 2,029 2,322 2,226
F r a n c e
The 4th EWCS indicated that in 2005 the level of stress among French workers was lower than average for the whole EU at 18%. Additionally, national data obtained in 2003 showed that French employees were working shorter hours compared to previous years. In 2003, 20% of employees stated that they had worked more than 40 hours in the previous week compared with 29% of workers in 1994. Saturday working was also slightly less frequent in 2002 (43%) than it had been in 1994 (46%). This trend was observed in every occupational category [24].
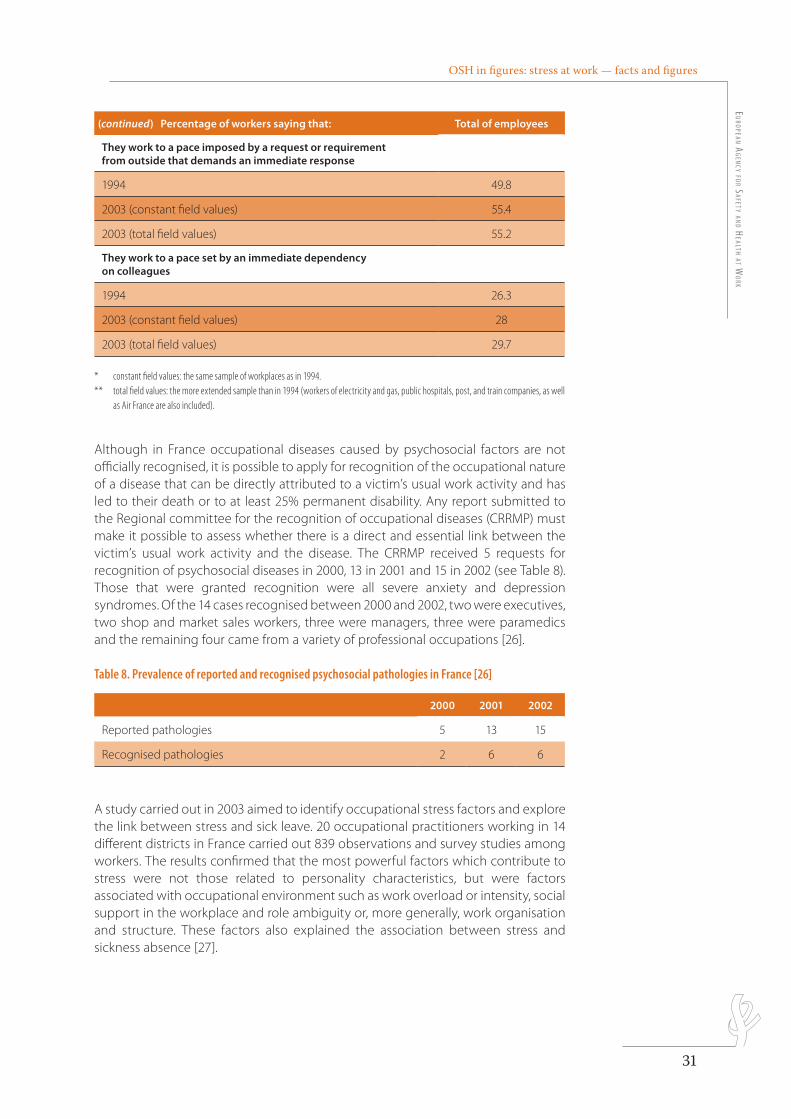
However, figures obtained in the surveys on working conditions showed an increase in the pace of work in French companies. Compared to the 1980s, more workers believed a decade later that their working pace was “set by production rate constraints”, “set by standards or deadlines of less than an hour”, and “set by a request or requirement that has to be met immediately” (see Table 6). A similar tendency was observed in following years (see Table 7). Nevertheless, workers have also reported more flexibility in their work. In 2003, 41% of employees stated that they were able to adjust deadlines they were set, and 57% stated that they were allowed to manage unexpected incidents on their own [25].
Table 6. Pace of work perceived by French workers [25]
Percentage of workers saying that: 1984 1991 1998
their working pace is set by production rate constraints 5 8 10
their working pace is set by standards or deadlines of less than an hour
7 16 23
their working pace is set by a request or requirement that has to be met immediately
28 46 54
Table 7. Pace of work perceived by French workers [25]
Percentage of workers saying that: Total of employees
Have to frequently stop working on one job to do another, non-scheduled one
1994 46.2
2003 (constant field values)* 58.4
2003 (total field values)** 58.1
OSH in figures: stress at work — facts and figuresE
uro
pEan ag
Ency fo
r SafEty an
d HEaltH at W
ork
31
(continued) Percentage of workers saying that: Total of employees
They work to a pace imposed by a request or requirement from outside that demands an immediate response
1994 49.8
2003 (constant field values) 55.4
2003 (total field values) 55.2
They work to a pace set by an immediate dependency on colleagues
1994 26.3
2003 (constant field values) 28
2003 (total field values) 29.7
* constant field values: the same sample of workplaces as in 1994. ** total field values: the more extended sample than in 1994 (workers of electricity and gas, public hospitals, post, and train companies, as well
as Air France are also included).
Although in France occupational diseases caused by psychosocial factors are not officially recognised, it is possible to apply for recognition of the occupational nature of a disease that can be directly attributed to a victim’s usual work activity and has led to their death or to at least 25% permanent disability. Any report submitted to the Regional committee for the recognition of occupational diseases (CRRMP) must make it possible to assess whether there is a direct and essential link between the victim’s usual work activity and the disease. The CRRMP received 5 requests for recognition of psychosocial diseases in 2000, 13 in 2001 and 15 in 2002 (see Table 8). Those that were granted recognition were all severe anxiety and depression syndromes. Of the 14 cases recognised between 2000 and 2002, two were executives, two shop and market sales workers, three were managers, three were paramedics and the remaining four came from a variety of professional occupations [26].
Table 8. Prevalence of reported and recognised psychosocial pathologies in France [26]
2000 2001 2002
Reported pathologies 5 13 15
Recognised pathologies 2 6 6
A study carried out in 2003 aimed to identify occupational stress factors and explore the link between stress and sick leave. 20 occupational practitioners working in 14 different districts in France carried out 839 observations and survey studies among workers. The results confirmed that the most powerful factors which contribute to stress were not those related to personality characteristics, but were factors associated with occupational environment such as work overload or intensity, social support in the workplace and role ambiguity or, more generally, work organisation and structure. These factors also explained the association between stress and sickness absence [27].
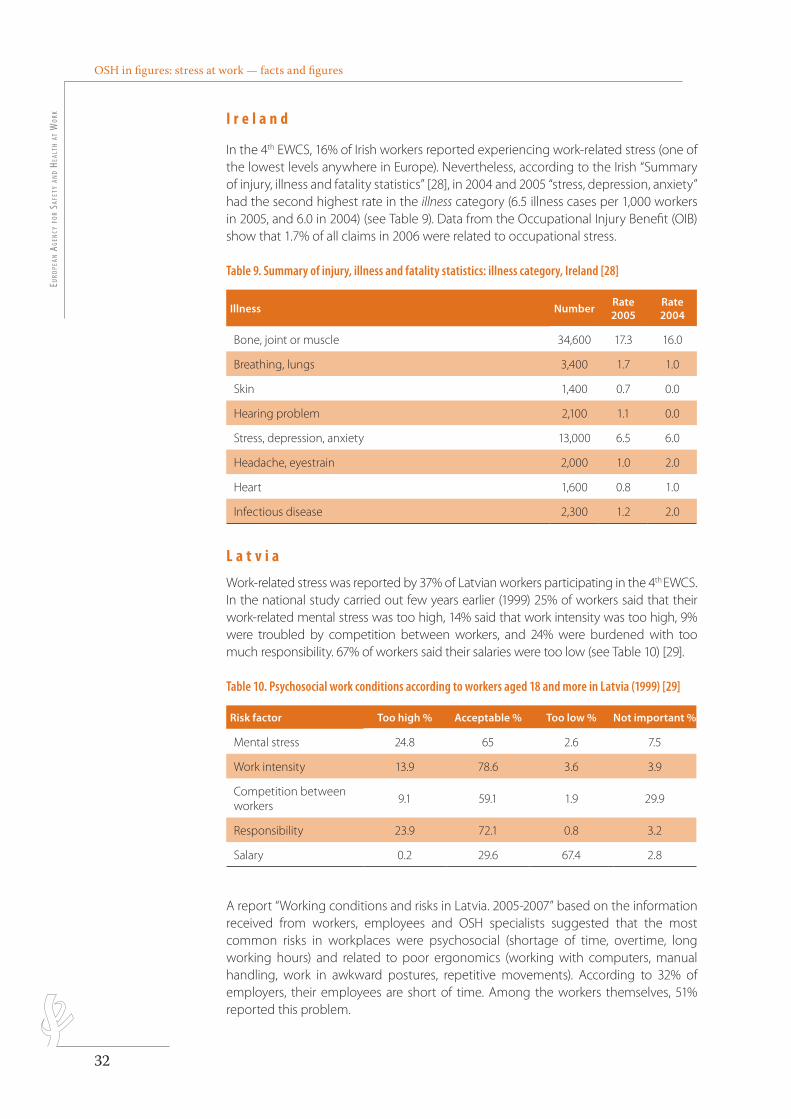
OSH in figures: stress at work — facts and figuresEu
ropE
an a
gEn
cy f
or
SafE
ty a
nd
HEal
tH a
t W
ork
32
I r e l a n d
In the 4th EWCS, 16% of Irish workers reported experiencing work-related stress (one of the lowest levels anywhere in Europe). Nevertheless, according to the Irish “Summary of injury, illness and fatality statistics” [28], in 2004 and 2005 “stress, depression, anxiety” had the second highest rate in the illness category (6.5 illness cases per 1,000 workers in 2005, and 6.0 in 2004) (see Table 9). Data from the Occupational Injury Benefit (OIB) show that 1.7% of all claims in 2006 were related to occupational stress.
Table 9. Summary of injury, illness and fatality statistics: illness category, Ireland [28]
Illness NumberRate 2005
Rate 2004
Bone, joint or muscle 34,600 17.3 16.0
Breathing, lungs 3,400 1.7 1.0
Skin 1,400 0.7 0.0
Hearing problem 2,100 1.1 0.0
Stress, depression, anxiety 13,000 6.5 6.0
Headache, eyestrain 2,000 1.0 2.0
Heart 1,600 0.8 1.0
Infectious disease 2,300 1.2 2.0
L a t v i a
Work-related stress was reported by 37% of Latvian workers participating in the 4th EWCS. In the national study carried out few years earlier (1999) 25% of workers said that their work-related mental stress was too high, 14% said that work intensity was too high, 9% were troubled by competition between workers, and 24% were burdened with too much responsibility. 67% of workers said their salaries were too low (see Table 10) [29].
Table 10. Psychosocial work conditions according to workers aged 18 and more in Latvia (1999) [29]
Risk factor Too high % Acceptable % Too low % Not important %
Mental stress 24.8 65 2.6 7.5
Work intensity 13.9 78.6 3.6 3.9
Competition between workers
9.1 59.1 1.9 29.9
Responsibility 23.9 72.1 0.8 3.2
Salary 0.2 29.6 67.4 2.8
A report “Working conditions and risks in Latvia. 2005-2007” based on the information received from workers, employees and OSH specialists suggested that the most common risks in workplaces were psychosocial (shortage of time, overtime, long working hours) and related to poor ergonomics (working with computers, manual handling, work in awkward postures, repetitive movements). According to 32% of employers, their employees are short of time. Among the workers themselves, 51% reported this problem.
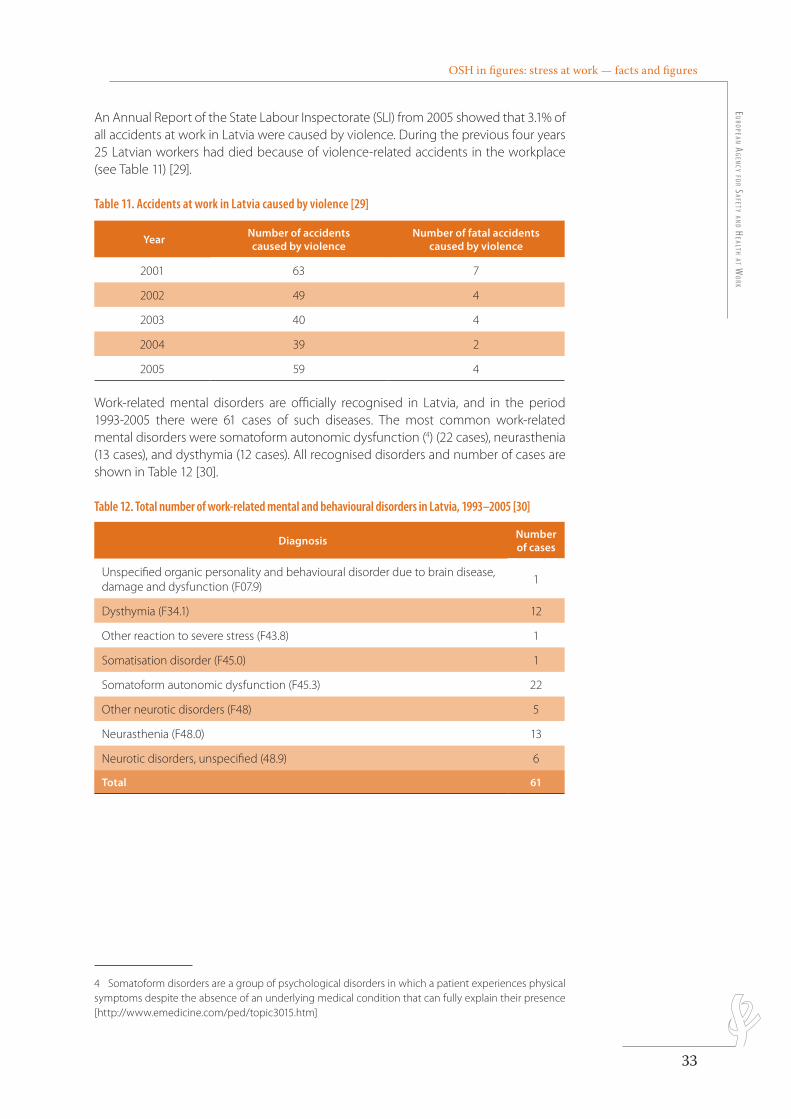
OSH in figures: stress at work — facts and figuresE
uro
pEan ag
Ency fo
r SafEty an
d HEaltH at W
ork
33
An Annual Report of the State Labour Inspectorate (SLI) from 2005 showed that 3.1% of all accidents at work in Latvia were caused by violence. During the previous four years 25 Latvian workers had died because of violence-related accidents in the workplace (see Table 11) [29].
Table 11. Accidents at work in Latvia caused by violence [29]
YearNumber of accidents caused by violence
Number of fatal accidents caused by violence
2001 63 7
2002 49 4
2003 40 4
2004 39 2
2005 59 4
Work-related mental disorders are officially recognised in Latvia, and in the period 1993-2005 there were 61 cases of such diseases. The most common work-related mental disorders were somatoform autonomic dysfunction (4) (22 cases), neurasthenia (13 cases), and dysthymia (12 cases). All recognised disorders and number of cases are shown in Table 12 [30].
Table 12. Total number of work-related mental and behavioural disorders in Latvia, 1993–2005 [30]
DiagnosisNumber of cases
Unspecified organic personality and behavioural disorder due to brain disease, damage and dysfunction (F07.9)
1
Dysthymia (F34.1) 12
Other reaction to severe stress (F43.8) 1
Somatisation disorder (F45.0) 1
Somatoform autonomic dysfunction (F45.3) 22
Other neurotic disorders (F48) 5
Neurasthenia (F48.0) 13
Neurotic disorders, unspecified (48.9) 6
Total 61
4 Somatoform disorders are a group of psychological disorders in which a patient experiences physical symptoms despite the absence of an underlying medical condition that can fully explain their presence [http://www.emedicine.com/ped/topic3015.htm]
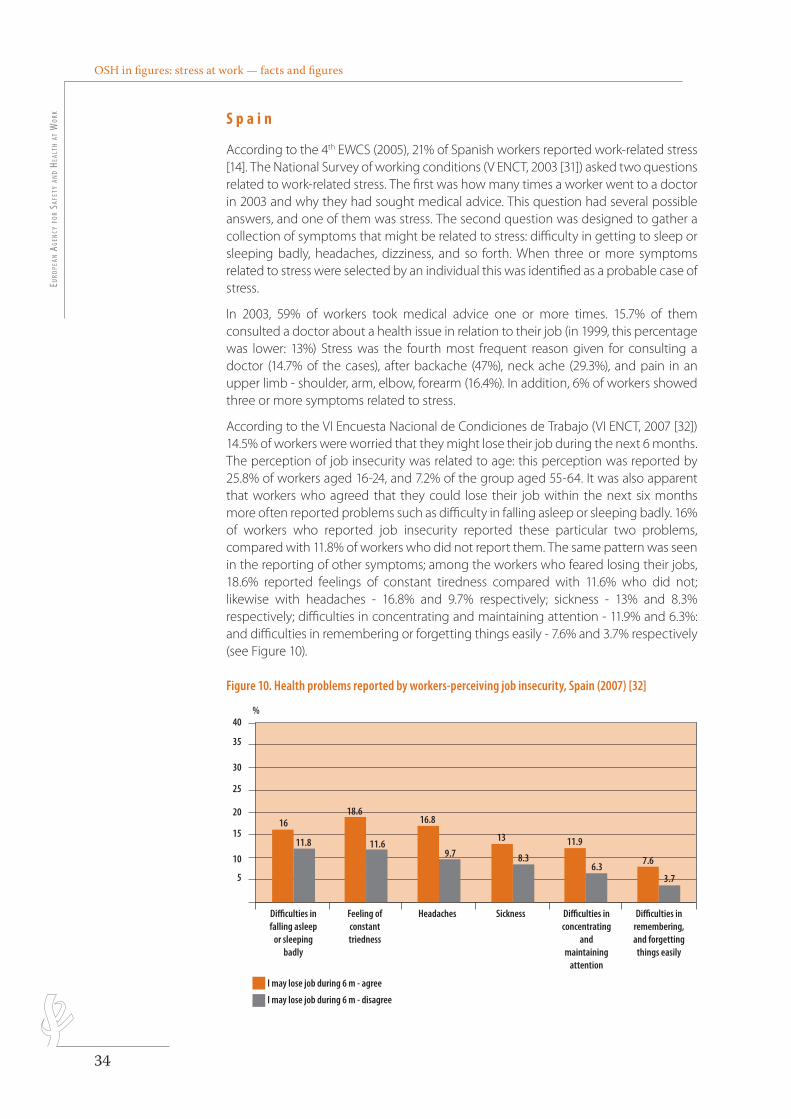
OSH in figures: stress at work — facts and figuresEu
ropE
an a
gEn
cy f
or
SafE
ty a
nd
HEal
tH a
t W
ork
34
S p a i n
According to the 4th EWCS (2005), 21% of Spanish workers reported work-related stress [14]. The National Survey of working conditions (V ENCT, 2003 [31]) asked two questions related to work-related stress. The first was how many times a worker went to a doctor in 2003 and why they had sought medical advice. This question had several possible answers, and one of them was stress. The second question was designed to gather a collection of symptoms that might be related to stress: difficulty in getting to sleep or sleeping badly, headaches, dizziness, and so forth. When three or more symptoms related to stress were selected by an individual this was identified as a probable case of stress.
In 2003, 59% of workers took medical advice one or more times. 15.7% of them consulted a doctor about a health issue in relation to their job (in 1999, this percentage was lower: 13%) Stress was the fourth most frequent reason given for consulting a doctor (14.7% of the cases), after backache (47%), neck ache (29.3%), and pain in an upper limb - shoulder, arm, elbow, forearm (16.4%). In addition, 6% of workers showed three or more symptoms related to stress.
According to the VI Encuesta Nacional de Condiciones de Trabajo (VI ENCT, 2007 [32]) 14.5% of workers were worried that they might lose their job during the next 6 months. The perception of job insecurity was related to age: this perception was reported by 25.8% of workers aged 16-24, and 7.2% of the group aged 55-64. It was also apparent that workers who agreed that they could lose their job within the next six months more often reported problems such as difficulty in falling asleep or sleeping badly. 16% of workers who reported job insecurity reported these particular two problems, compared with 11.8% of workers who did not report them. The same pattern was seen in the reporting of other symptoms; among the workers who feared losing their jobs, 18.6% reported feelings of constant tiredness compared with 11.6% who did not; likewise with headaches - 16.8% and 9.7% respectively; sickness - 13% and 8.3% respectively; difficulties in concentrating and maintaining attention - 11.9% and 6.3%: and difficulties in remembering or forgetting things easily - 7.6% and 3.7% respectively (see Figure 10).
Figure 10. Health problems reported by workers-perceiving job insecurity, Spain (2007) [32]
Difficulties in falling asleep
or sleeping badly
Feeling ofconstanttriedness
Headaches Sickness Difficulties in concentrating
and maintaining
attention
Difficulties in remembering,and forgetting
things easily
40
16
11.8
18.6
11.6 11.9
16.8
9.7
13
8.36.3
7.6
3.7
35
30
25
20
15
5
10
%
I may lose job during 6 m - agree
I may lose job during 6 m - disagree
police : Myriad pro semibold condensed 11 pt
ordre des couleurs : dernier dossier dans la palette(la couleur du fond est la première de la palette, les autres suivent dans l’ordre)
légende : à droite ou en dessous du graphique
Les repères dépassent de 2 mm et tous les traits sont à 0.5 ptles barres n’ont pas de contours
carrés sans contours 4x4 mm
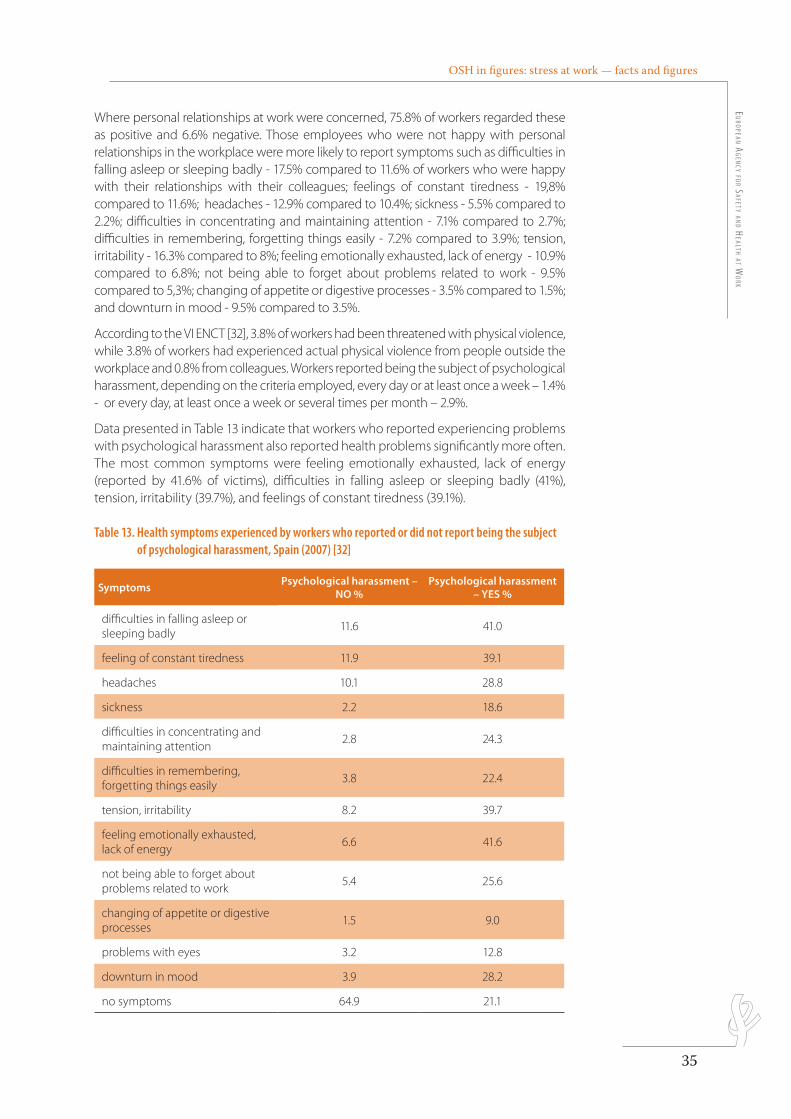
OSH in figures: stress at work — facts and figuresE
uro
pEan ag
Ency fo
r SafEty an
d HEaltH at W
ork
35
Where personal relationships at work were concerned, 75.8% of workers regarded these as positive and 6.6% negative. Those employees who were not happy with personal relationships in the workplace were more likely to report symptoms such as difficulties in falling asleep or sleeping badly - 17.5% compared to 11.6% of workers who were happy with their relationships with their colleagues; feelings of constant tiredness - 19,8% compared to 11.6%; headaches - 12.9% compared to 10.4%; sickness - 5.5% compared to 2.2%; difficulties in concentrating and maintaining attention - 7.1% compared to 2.7%; difficulties in remembering, forgetting things easily - 7.2% compared to 3.9%; tension, irritability - 16.3% compared to 8%; feeling emotionally exhausted, lack of energy - 10.9% compared to 6.8%; not being able to forget about problems related to work - 9.5% compared to 5,3%; changing of appetite or digestive processes - 3.5% compared to 1.5%; and downturn in mood - 9.5% compared to 3.5%.
According to the VI ENCT [32], 3.8% of workers had been threatened with physical violence, while 3.8% of workers had experienced actual physical violence from people outside the workplace and 0.8% from colleagues. Workers reported being the subject of psychological harassment, depending on the criteria employed, every day or at least once a week – 1.4% - or every day, at least once a week or several times per month – 2.9%.
Data presented in Table 13 indicate that workers who reported experiencing problems with psychological harassment also reported health problems significantly more often. The most common symptoms were feeling emotionally exhausted, lack of energy (reported by 41.6% of victims), difficulties in falling asleep or sleeping badly (41%), tension, irritability (39.7%), and feelings of constant tiredness (39.1%).
Table 13. Health symptoms experienced by workers who reported or did not report being the subject of psychological harassment, Spain (2007) [32]
SymptomsPsychological harassment –
NO %Psychological harassment
– YES %
difficulties in falling asleep or sleeping badly
11.6 41.0
feeling of constant tiredness 11.9 39.1
headaches 10.1 28.8
sickness 2.2 18.6
difficulties in concentrating and maintaining attention
2.8 24.3
difficulties in remembering, forgetting things easily
3.8 22.4
tension, irritability 8.2 39.7
feeling emotionally exhausted, lack of energy
6.6 41.6
not being able to forget about problems related to work
5.4 25.6
changing of appetite or digestive processes
1.5 9.0
problems with eyes 3.2 12.8
downturn in mood 3.9 28.2
no symptoms 64.9 21.1
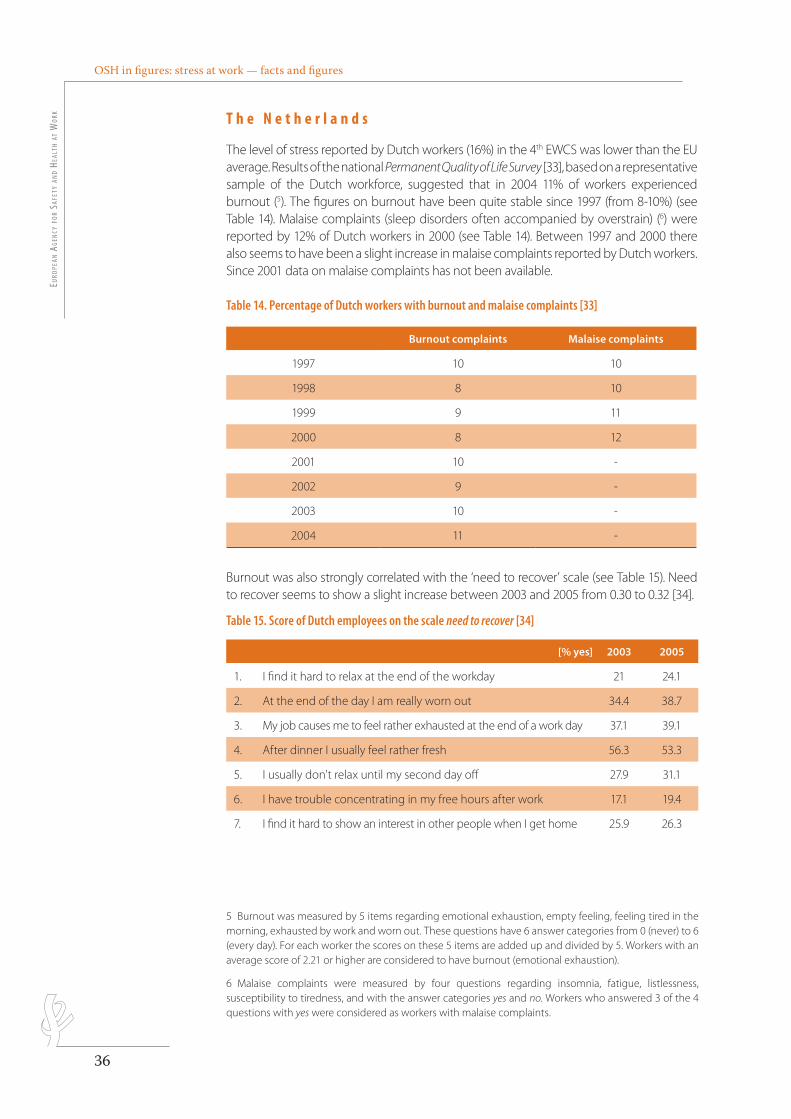
OSH in figures: stress at work — facts and figuresEu
ropE
an a
gEn
cy f
or
SafE
ty a
nd
HEal
tH a
t W
ork
36
T h e N e t h e r l a n d s
The level of stress reported by Dutch workers (16%) in the 4th EWCS was lower than the EU average. Results of the national Permanent Quality of Life Survey [33], based on a representative sample of the Dutch workforce, suggested that in 2004 11% of workers experienced burnout (5). The figures on burnout have been quite stable since 1997 (from 8-10%) (see Table 14). Malaise complaints (sleep disorders often accompanied by overstrain) (6) were reported by 12% of Dutch workers in 2000 (see Table 14). Between 1997 and 2000 there also seems to have been a slight increase in malaise complaints reported by Dutch workers. Since 2001 data on malaise complaints has not been available.
Table 14. Percentage of Dutch workers with burnout and malaise complaints [33]
Burnout complaints Malaise complaints
1997 10 10
1998 8 10
1999 9 11
2000 8 12
2001 10 -
2002 9 -
2003 10 -
2004 11 -
Burnout was also strongly correlated with the ‘need to recover’ scale (see Table 15). Need to recover seems to show a slight increase between 2003 and 2005 from 0.30 to 0.32 [34].
Table 15. Score of Dutch employees on the scale need to recover [34]
[% yes] 2003 2005
1. I find it hard to relax at the end of the workday 21 24.1
2. At the end of the day I am really worn out 34.4 38.7
3. My job causes me to feel rather exhausted at the end of a work day 37.1 39.1
4. After dinner I usually feel rather fresh 56.3 53.3
5. I usually don't relax until my second day off 27.9 31.1
6. I have trouble concentrating in my free hours after work 17.1 19.4
7. I find it hard to show an interest in other people when I get home 25.9 26.3
5 Burnout was measured by 5 items regarding emotional exhaustion, empty feeling, feeling tired in the morning, exhausted by work and worn out. These questions have 6 answer categories from 0 (never) to 6 (every day). For each worker the scores on these 5 items are added up and divided by 5. Workers with an average score of 2.21 or higher are considered to have burnout (emotional exhaustion).
6 Malaise complaints were measured by four questions regarding insomnia, fatigue, listlessness, susceptibility to tiredness, and with the answer categories yes and no. Workers who answered 3 of the 4 questions with yes were considered as workers with malaise complaints.
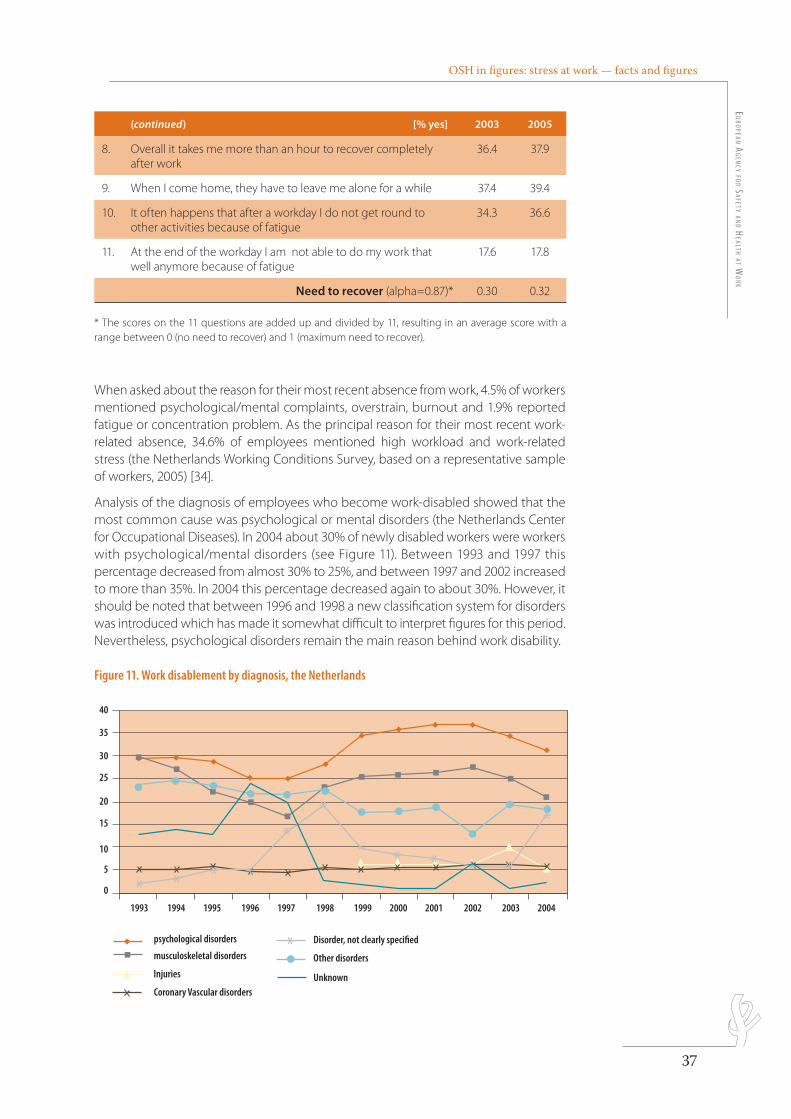
OSH in figures: stress at work — facts and figuresE
uro
pEan ag
Ency fo
r SafEty an
d HEaltH at W
ork
37
(continued) [% yes] 2003 2005
8. Overall it takes me more than an hour to recover completely after work
36.4 37.9
9. When I come home, they have to leave me alone for a while 37.4 39.4
10. It often happens that after a workday I do not get round to other activities because of fatigue
34.3 36.6
11. At the end of the workday I am not able to do my work that well anymore because of fatigue
17.6 17.8
Need to recover (alpha=0.87)* 0.30 0.32
* The scores on the 11 questions are added up and divided by 11, resulting in an average score with a range between 0 (no need to recover) and 1 (maximum need to recover).
When asked about the reason for their most recent absence from work, 4.5% of workers mentioned psychological/mental complaints, overstrain, burnout and 1.9% reported fatigue or concentration problem. As the principal reason for their most recent work-related absence, 34.6% of employees mentioned high workload and work-related stress (the Netherlands Working Conditions Survey, based on a representative sample of workers, 2005) [34].
Analysis of the diagnosis of employees who become work-disabled showed that the most common cause was psychological or mental disorders (the Netherlands Center for Occupational Diseases). In 2004 about 30% of newly disabled workers were workers with psychological/mental disorders (see Figure 11). Between 1993 and 1997 this percentage decreased from almost 30% to 25%, and between 1997 and 2002 increased to more than 35%. In 2004 this percentage decreased again to about 30%. However, it should be noted that between 1996 and 1998 a new classification system for disorders was introduced which has made it somewhat difficult to interpret figures for this period. Nevertheless, psychological disorders remain the main reason behind work disability.
Figure 11. Work disablement by diagnosis, the Netherlands
1993 1994 1995 1996 1997 1998 1999 2000 2001 2002 2003 2004
40
35
25
15
5
30
20
10
0 * * * *
*
*
*
* * * * *
*
psychological disorders Disorder, not clearly specified
Other disorders
Unknown
musculoskeletal disorders
Injuries
Coronary Vascular disorders
police : Myriad pro semibold condensed 11 pt
ordre des couleurs : dernier dossier dans la palette(la couleur du fond est la première de la palette, les autres suivent dans l’ordre)
légende : à droite ou en dessous du graphique
Les repères dépassent de 2 mm et tous les traits sont à 0.5 ptles barres n’ont pas de contours
carrés sans contours 4x4 mm
OSH in figures: stress at work — facts and figuresEu
ropE
an a
gEn
cy f
or
SafE
ty a
nd
HEal
tH a
t W
ork
38
U n i t e d K i n g d o m
The 4th EWCS indicates that the United Kingdom is the country with the lowest level of stress reported by workers (12%), and that there has been a significant drop in this since 1995 (in 1995 stress was reported by 27% of workers, in 2000 by 23%) [14].
The survey of self-reported work-related illness (SWI04/05) [35] shows that in 2004/05 an estimated 509,000 people in Great Britain had suffered from a stress-related condition which, in their opinion, was caused or made worse by their current job or work they’d done in the past (see Table 16). This equates to a rate of 1.2 per 100 people who have ever done paid work in Great Britain. However, the actual figure may be greater than this since evidence suggests that most of those reporting work-related heart disease ascribed its cause to work stress. As a result, most of the additional estimated 56,000 sufferers may also indirectly report work stress, and this suggests that well over half a million people were reporting work-related stress at a level that was making them ill.
In each of the six surveys of self-reported work-related illness commissioned for the years 1990, 1995, 1998/9, 2001/2, 2003/4 and 2004/5, stress and conditions closely related to it were the second most commonly reported type of work-related ill-health.
Table 16. Estimated rate of self-reported stress, depression or anxiety for people ever employed, UK [35]
Year Type of complaintSample
casesEstimated prevalence (thousands) 95% C.I.
central lower upper
2004/05Stress, depression or anxiety 981 509 477 542
All complaints 3,963 2,006 1,942 2,070
2003/04Stress, depression or anxiety 1,098 557 523 590
All complaints 4,531 2,233 2,167 2,300
2001/02Stress, depression or anxiety 1,183 548 516 580
All complaints 5,008 2,276 2,211 2,340
The SWI04/05 data also indicate that an estimated 12.8 million working days were lost due to work-related stress conditions in Great Britain. This represents an estimated average of 30.9 working days lost per year per affected case and makes stress, depression or anxiety one of the largest contributors to the overall estimated annual days lost from work-related ill-health. Similar levels of working days lost were found for the two previous surveys. Days-lost estimates are available from the surveys for 1995, 2001/02, 2003/04 and 2004/05. Comparisons suggest that the number of days lost which were attributed to stress and related conditions rose between 1995 and 2001/02, due in part to an increase in the average days lost per case. However, there was no significant change in total days lost or in days lost per case attributed to work-related stress, depression or anxiety between 2001/02, 2003/04 and 2004/05.
The authors of the SWI series of surveys point out that the results are not always directly comparable, but the best available comparable estimates across these studies suggest that the prevalence of self-reported work-related stress and related conditions more or less doubled between the 1990 and 1998/99 surveys, but remained at a fairly constant level in the surveys for 2001/02, 2003/04 and 2004/05. However, any comparisons still have limited value in assessing trends because of differences in survey designs and reliance on the simple self-reporting of stress. Self-reporting of stress may be affected by many factors – for instance, awareness of the concept and its symptoms and value judgements about stress – and these may vary markedly with time.
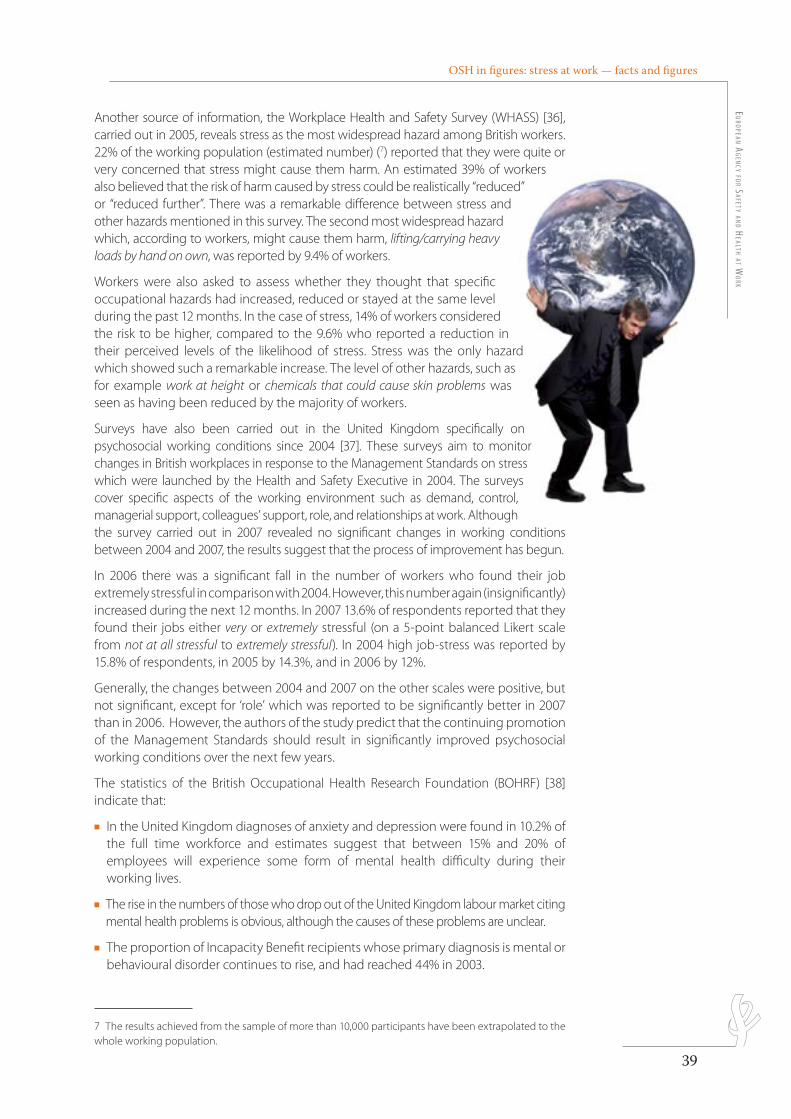
OSH in figures: stress at work — facts and figuresE
uro
pEan ag
Ency fo
r SafEty an
d HEaltH at W
ork
39
Another source of information, the Workplace Health and Safety Survey (WHASS) [36], carried out in 2005, reveals stress as the most widespread hazard among British workers. 22% of the working population (estimated number) (7) reported that they were quite or very concerned that stress might cause them harm. An estimated 39% of workers also believed that the risk of harm caused by stress could be realistically “reduced” or “reduced further”. There was a remarkable difference between stress and other hazards mentioned in this survey. The second most widespread hazard which, according to workers, might cause them harm, lifting/carrying heavy loads by hand on own, was reported by 9.4% of workers.
Workers were also asked to assess whether they thought that specific occupational hazards had increased, reduced or stayed at the same level during the past 12 months. In the case of stress, 14% of workers considered the risk to be higher, compared to the 9.6% who reported a reduction in their perceived levels of the likelihood of stress. Stress was the only hazard which showed such a remarkable increase. The level of other hazards, such as for example work at height or chemicals that could cause skin problems was seen as having been reduced by the majority of workers.
Surveys have also been carried out in the United Kingdom specifically on psychosocial working conditions since 2004 [37]. These surveys aim to monitor changes in British workplaces in response to the Management Standards on stress which were launched by the Health and Safety Executive in 2004. The surveys cover specific aspects of the working environment such as demand, control, managerial support, colleagues’ support, role, and relationships at work. Although the survey carried out in 2007 revealed no significant changes in working conditions between 2004 and 2007, the results suggest that the process of improvement has begun.
In 2006 there was a significant fall in the number of workers who found their job extremely stressful in comparison with 2004. However, this number again (insignificantly) increased during the next 12 months. In 2007 13.6% of respondents reported that they found their jobs either very or extremely stressful (on a 5-point balanced Likert scale from not at all stressful to extremely stressful). In 2004 high job-stress was reported by 15.8% of respondents, in 2005 by 14.3%, and in 2006 by 12%.
Generally, the changes between 2004 and 2007 on the other scales were positive, but not significant, except for ‘role’ which was reported to be significantly better in 2007 than in 2006. However, the authors of the study predict that the continuing promotion of the Management Standards should result in significantly improved psychosocial working conditions over the next few years.
The statistics of the British Occupational Health Research Foundation (BOHRF) [38] indicate that:
n In the United Kingdom diagnoses of anxiety and depression were found in 10.2% of the full time workforce and estimates suggest that between 15% and 20% of employees will experience some form of mental health difficulty during their working lives.
n The rise in the numbers of those who drop out of the United Kingdom labour market citing mental health problems is obvious, although the causes of these problems are unclear.
n The proportion of Incapacity Benefit recipients whose primary diagnosis is mental or behavioural disorder continues to rise, and had reached 44% in 2003.
7 The results achieved from the sample of more than 10,000 participants have been extrapolated to the whole working population.
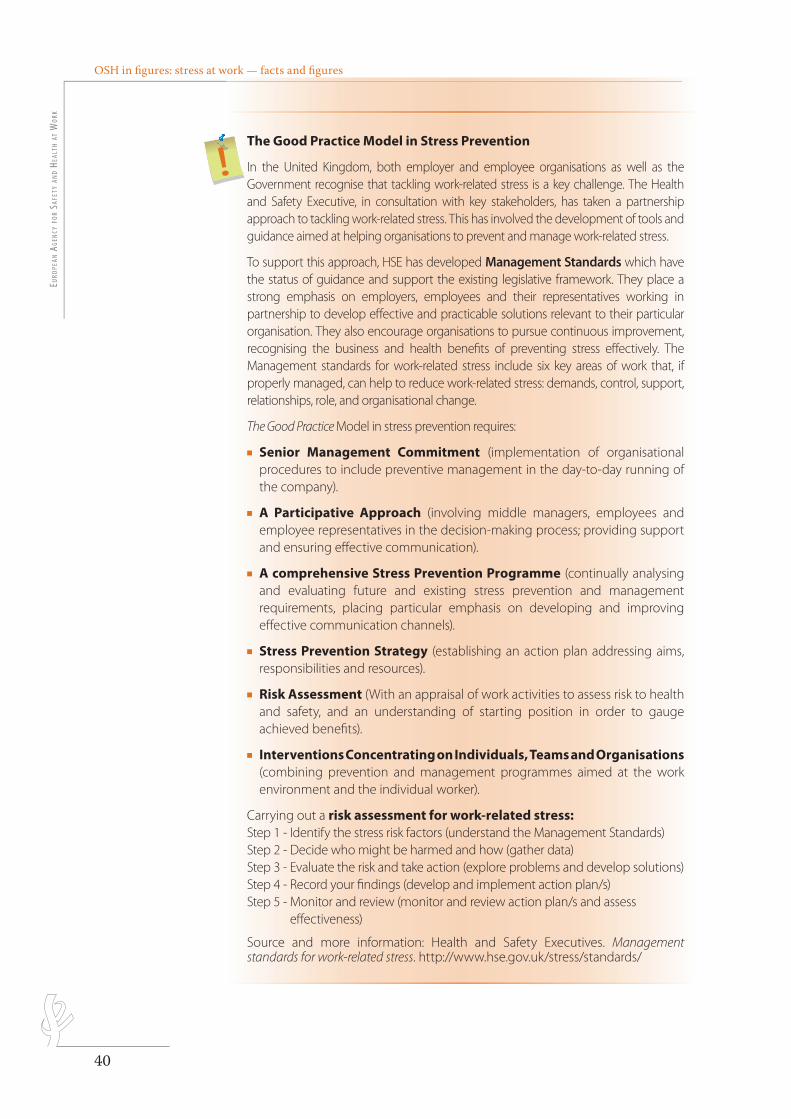
OSH in fi gures: stress at work — facts and fi gures Eu
ropE
an a
gEn
cy f
or
SafE
ty a
nd
HEal
tH a
t W
ork
40
E u r o p e a n A g e n c y f o r S a f e t y a n d H e a l t h a t W o r k
EUROPEAN RISK OBSERVATORY REPORT
The Good Practice Model in Stress Prevention
In the United Kingdom, both employer and employee organisations as well as the Government recognise that tackling work-related stress is a key challenge. The Health and Safety Executive, in consultation with key stakeholders, has taken a partnership approach to tackling work-related stress. This has involved the development of tools and guidance aimed at helping organisations to prevent and manage work-related stress.
To support this approach, HSE has developed Management Standards which have the status of guidance and support the existing legislative framework. They place a strong emphasis on employers, employees and their representatives working in partnership to develop eff ective and practicable solutions relevant to their particular organisation. They also encourage organisations to pursue continuous improvement, recognising the business and health benefi ts of preventing stress eff ectively. The Management standards for work-related stress include six key areas of work that, if properly managed, can help to reduce work-related stress: demands, control, support, relationships, role, and organisational change.
The Good Practice Model in stress prevention requires:
n Senior Management Commitment (implementation of organisational procedures to include preventive management in the day-to-day running of the company).
n A Participative Approach (involving middle managers, employees and employee representatives in the decision-making process; providing support and ensuring eff ective communication).
n A comprehensive Stress Prevention Programme (continually analysing and evaluating future and existing stress prevention and management requirements, placing particular emphasis on developing and improving eff ective communication channels).
n Stress Prevention Strategy (establishing an action plan addressing aims, responsibilities and resources).
n Risk Assessment (With an appraisal of work activities to assess risk to health and safety, and an understanding of starting position in order to gauge achieved benefi ts).
n Interventions Concentrating on Individuals, Teams and Organisations (combining prevention and management programmes aimed at the work environment and the individual worker).
Carrying out a risk assessment for work-related stress:Step 1 - Identify the stress risk factors (understand the Management Standards)Step 2 - Decide who might be harmed and how (gather data)Step 3 - Evaluate the risk and take action (explore problems and develop solutions)Step 4 - Record your fi ndings (develop and implement action plan/s)Step 5 - Monitor and review (monitor and review action plan/s and assess
eff ectiveness)
Source and more information: Health and Safety Executives. Management standards for work-related stress. http://www.hse.gov.uk/stress/standards/
E u r o p e a n A g e n c y f o r S a f e t y a n d H e a l t h a t W o r k
EUROPEAN RISK OBSERVATORY REPORT
STRESS BY AGE
3.
OSH in figures: stress at work — facts and figuresEu
ropE
an a
gEn
cy f
or
SafE
ty a
nd
HEal
tH a
t W
ork
42
Stress is most often reported by workers from the 40-54 and 25-39 age groups
r E l a t i o n S H i p W i t H a g E — g E n E r a l p r E v a l E n c E a n d t i m E t r E n d S3.1.According to data from 2005 (see Figure 12), stress was most often reported by workers in the 40-54 age group (24%), followed by the 25-39 age group (23%). A lower percentage of workers older than 55 (18%) or younger than 24 (13%) believed that their health was at risk because of work-related stress. Similar trends were observed for other stress-related symptoms such as overall fatigue, sleeping problems, anxiety and irritability [14].
Figure 12. Workers (%) reporting stress, overall fatigue, sleeping problems, anxiety, and irritability by age (2005) [14]
stress
30
10
%
20
13.1
23.224.3
17.9
14.3
2223.4
19.1
3.5
8.29.9
7.7
3
7.99.4
7.15.5
1112.1
8.5
0
sleeping problems anxiety irritabilityoverall fatigue
-24
25-39
40-54
55+
police : Myriad pro semibold condensed 11 pt
ordre des couleurs : dernier dossier dans la palette(la couleur du fond est la première de la palette, les autres suivent dans l’ordre)
légende : à droite ou en dessous du graphique
Les repères dépassent de 2 mm et tous les traits sont à 0.5 ptles barres n’ont pas de contours
carrés sans contours 4x4 mm
The results from the previous European Working Condition Surveys showed similar tendencies (see Table 17). The relationship between age and stress peaks in mid-working life: stress is lowest in the youngest group, then its level increases, and in the oldest group (+55) it decreases again. The relationship between age and anxiety, sleeping problems and irritability is similar. This means that these symptoms are highest in the 45-54 group (and high in the 35-44 group), and lower among the youngest and oldest workers. But for overall fatigue the pattern is linear: the higher the age, the more common feelings of fatigue [15, 17].
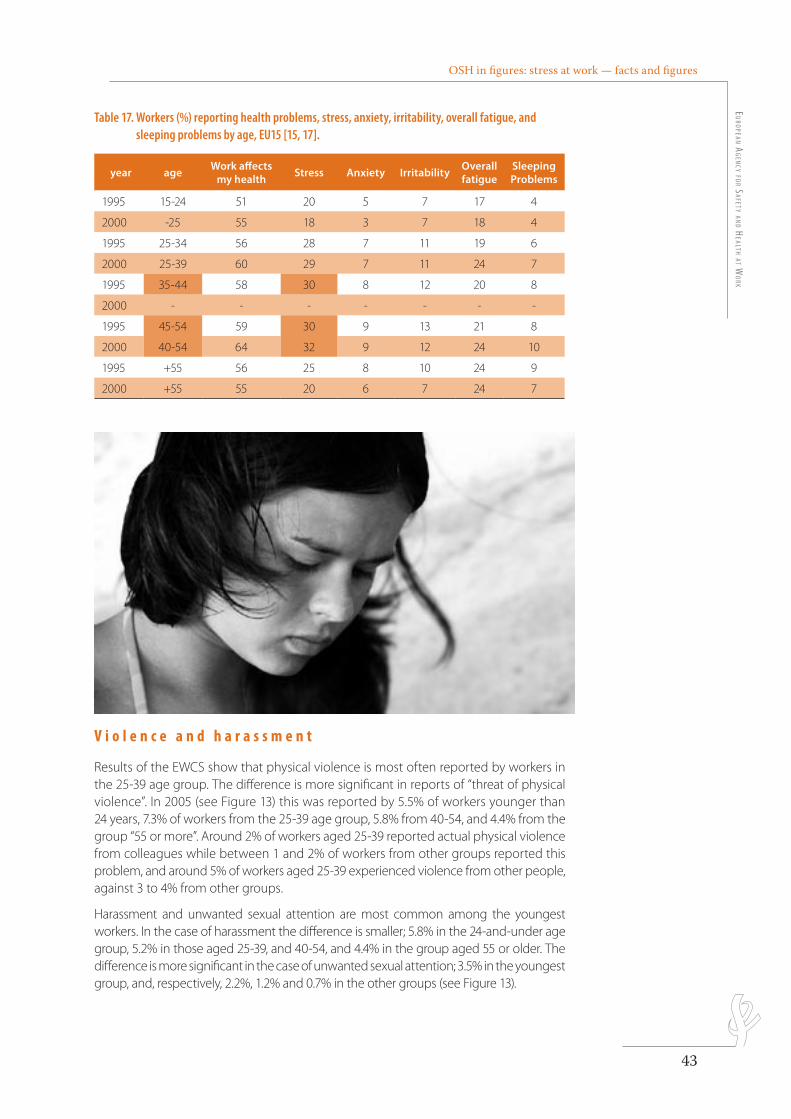
OSH in figures: stress at work — facts and figuresE
uro
pEan ag
Ency fo
r SafEty an
d HEaltH at W
ork
43
Table 17. Workers (%) reporting health problems, stress, anxiety, irritability, overall fatigue, and sleeping problems by age, EU15 [15, 17].
year ageWork affects
my healthStress Anxiety Irritability
Overallfatigue
SleepingProblems
1995 15-24 51 20 5 7 17 4
2000 -25 55 18 3 7 18 4
1995 25-34 56 28 7 11 19 6
2000 25-39 60 29 7 11 24 7
1995 35-44 58 30 8 12 20 8
2000 - - - - - - -
1995 45-54 59 30 9 13 21 8
2000 40-54 64 32 9 12 24 10
1995 +55 56 25 8 10 24 9
2000 +55 55 20 6 7 24 7
V i o l e n c e a n d h a r a s s m e n t
Results of the EWCS show that physical violence is most often reported by workers in the 25-39 age group. The difference is more significant in reports of “threat of physical violence”. In 2005 (see Figure 13) this was reported by 5.5% of workers younger than 24 years, 7.3% of workers from the 25-39 age group, 5.8% from 40-54, and 4.4% from the group “55 or more”. Around 2% of workers aged 25-39 reported actual physical violence from colleagues while between 1 and 2% of workers from other groups reported this problem, and around 5% of workers aged 25-39 experienced violence from other people, against 3 to 4% from other groups.
Harassment and unwanted sexual attention are most common among the youngest workers. In the case of harassment the difference is smaller; 5.8% in the 24-and-under age group, 5.2% in those aged 25-39, and 40-54, and 4.4% in the group aged 55 or older. The difference is more significant in the case of unwanted sexual attention; 3.5% in the youngest group, and, respectively, 2.2%, 1.2% and 0.7% in the other groups (see Figure 13).
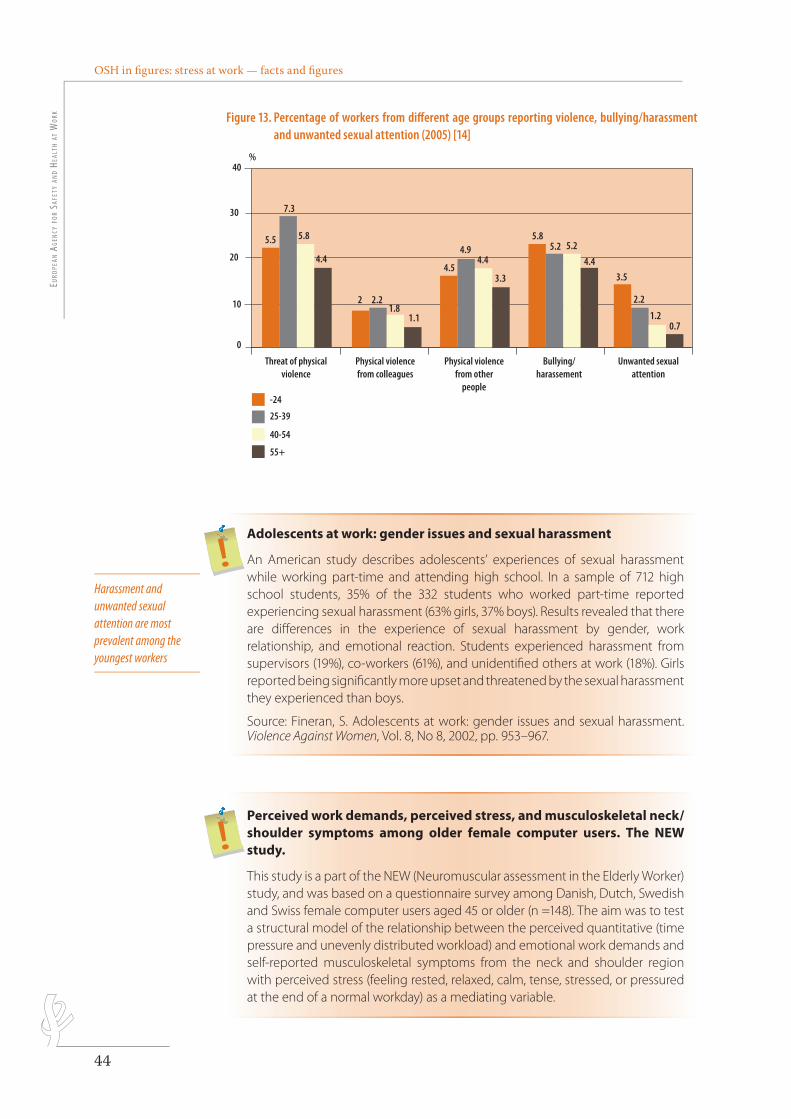
OSH in fi gures: stress at work — facts and fi gures Eu
ropE
an a
gEn
cy f
or
SafE
ty a
nd
HEal
tH a
t W
ork
44
Adolescents at work: gender issues and sexual harassment
An American study describes adolescents’ experiences of sexual harassment while working part-time and attending high school. In a sample of 712 high school students, 35% of the 332 students who worked part-time reported experiencing sexual harassment (63% girls, 37% boys). Results revealed that there are diff erences in the experience of sexual harassment by gender, work relationship, and emotional reaction. Students experienced harassment from supervisors (19%), co-workers (61%), and unidentifi ed others at work (18%). Girls reported being signifi cantly more upset and threatened by the sexual harassment they experienced than boys.
Source: Fineran, S. Adolescents at work: gender issues and sexual harassment. Violence Against Women, Vol. 8, No 8, 2002, pp. 953–967.
Perceived work demands, perceived stress, and musculoskeletal neck/shoulder symptoms among older female computer users. The NEW study.
This study is a part of the NEW (Neuromuscular assessment in the Elderly Worker) study, and was based on a questionnaire survey among Danish, Dutch, Swedish and Swiss female computer users aged 45 or older (n =148). The aim was to test a structural model of the relationship between the perceived quantitative (time pressure and unevenly distributed workload) and emotional work demands and self-reported musculoskeletal symptoms from the neck and shoulder region with perceived stress (feeling rested, relaxed, calm, tense, stressed, or pressured at the end of a normal workday) as a mediating variable.
Harassment and unwanted sexual attention are most prevalent among the youngest workers
Figure 13. Percentage of workers from diff erent age groups reporting violence, bullying/harassment and unwanted sexual attention (2005) [14]
Threat of physicalviolence
Physical violencefrom colleagues
Physical violencefrom other
people
Bullying/harassement
Unwanted sexualattention
40%
30
20
10
0
-24
25-39
40-54
55+
5.5
7.3
5.8
4.4
2 2.21.8
1.1
4.5
4.94.4
3.3
5.85.2 5.2
4.4
3.5
2.2
1.20.7
police : Myriad pro semibold condensed 11 pt
ordre des couleurs : dernier dossier dans la palette(la couleur du fond est la première de la palette, les autres suivent dans l’ordre)
légende : à droite ou en dessous du graphique
Les repères dépassent de 2 mm et tous les traits sont à 0.5 ptles barres n’ont pas de contours
carrés sans contours 4x4 mm
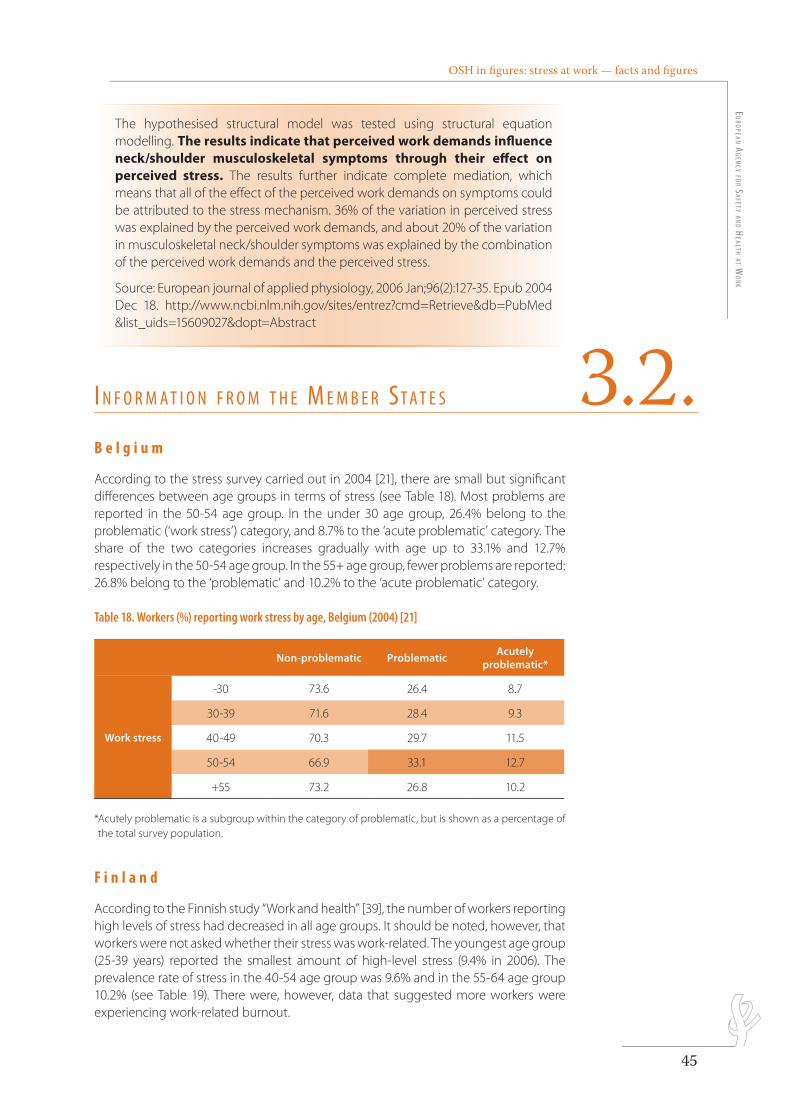
OSH in fi gures: stress at work — facts and fi gures E
uro
pEan ag
Ency fo
r SafEty an
d HEaltH at W
ork
45
The hypothesised structural model was tested using structural equation modelling. The results indicate that perceived work demands infl uence neck/shoulder musculoskeletal symptoms through their eff ect on perceived stress. The results further indicate complete mediation, which means that all of the eff ect of the perceived work demands on symptoms could be attributed to the stress mechanism. 36% of the variation in perceived stress was explained by the perceived work demands, and about 20% of the variation in musculoskeletal neck/shoulder symptoms was explained by the combination of the perceived work demands and the perceived stress.
Source: European journal of applied physiology, 2006 Jan;96(2):127-35. Epub 2004 Dec 18. http://www.ncbi.nlm.nih.gov/sites/entrez?cmd=Retrieve&db=PubMed&list_uids=15609027&dopt=Abstract
i n f o r m a t i o n f r o m t H E m E m b E r St a t E S 3.2. B e l g i u m
According to the stress survey carried out in 2004 [21], there are small but signifi cant diff erences between age groups in terms of stress (see Table 18). Most problems are reported in the 50-54 age group. In the under 30 age group, 26.4% belong to the problematic (‘work stress’) category, and 8.7% to the ‘acute problematic’ category. The share of the two categories increases gradually with age up to 33.1% and 12.7% respectively in the 50-54 age group. In the 55+ age group, fewer problems are reported: 26.8% belong to the ‘problematic’ and 10.2% to the ‘acute problematic’ category.
Table 18. Workers (%) reporting work stress by age, Belgium (2004) [21]
Non-problematic ProblematicAcutely
problematic*
Work stress
-30 73.6 26.4 8.7
30-39 71.6 28.4 9.3
40-49 70.3 29.7 11.5
50-54 66.9 33.1 12.7
+55 73.2 26.8 10.2
* Acutely problematic is a subgroup within the category of problematic, but is shown as a percentage of the total survey population.
F i n l a n d
According to the Finnish study “Work and health” [39], the number of workers reporting high levels of stress had decreased in all age groups. It should be noted, however, that workers were not asked whether their stress was work-related. The youngest age group (25-39 years) reported the smallest amount of high-level stress (9.4% in 2006). The prevalence rate of stress in the 40-54 age group was 9.6% and in the 55-64 age group 10.2% (see Table 19). There were, however, data that suggested more workers were experiencing work-related burnout.
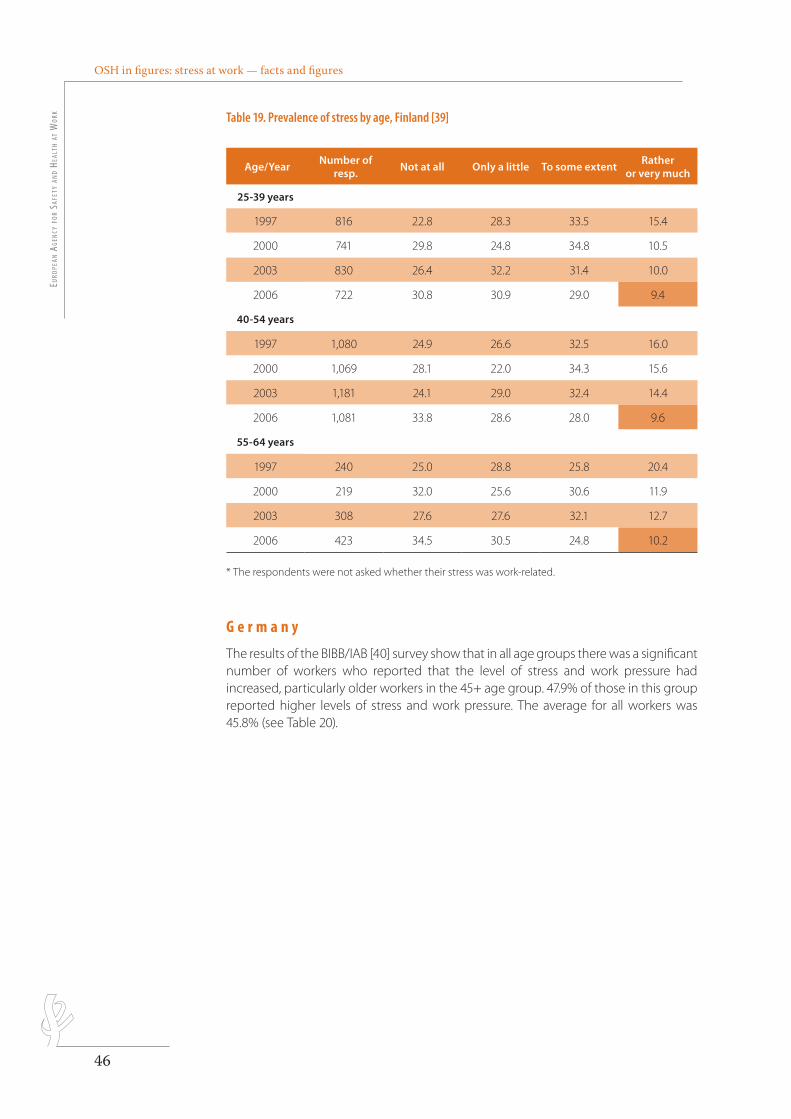
OSH in figures: stress at work — facts and figuresEu
ropE
an a
gEn
cy f
or
SafE
ty a
nd
HEal
tH a
t W
ork
46
Table 19. Prevalence of stress by age, Finland [39]
Age/YearNumber of
resp.Not at all Only a little To some extent
Ratheror very much
25-39 years
1997 816 22.8 28.3 33.5 15.4
2000 741 29.8 24.8 34.8 10.5
2003 830 26.4 32.2 31.4 10.0
2006 722 30.8 30.9 29.0 9.4
40-54 years
1997 1,080 24.9 26.6 32.5 16.0
2000 1,069 28.1 22.0 34.3 15.6
2003 1,181 24.1 29.0 32.4 14.4
2006 1,081 33.8 28.6 28.0 9.6
55-64 years
1997 240 25.0 28.8 25.8 20.4
2000 219 32.0 25.6 30.6 11.9
2003 308 27.6 27.6 32.1 12.7
2006 423 34.5 30.5 24.8 10.2
* The respondents were not asked whether their stress was work-related.
G e r m a n y
The results of the BIBB/IAB [40] survey show that in all age groups there was a significant number of workers who reported that the level of stress and work pressure had increased, particularly older workers in the 45+ age group. 47.9% of those in this group reported higher levels of stress and work pressure. The average for all workers was 45.8% (see Table 20).
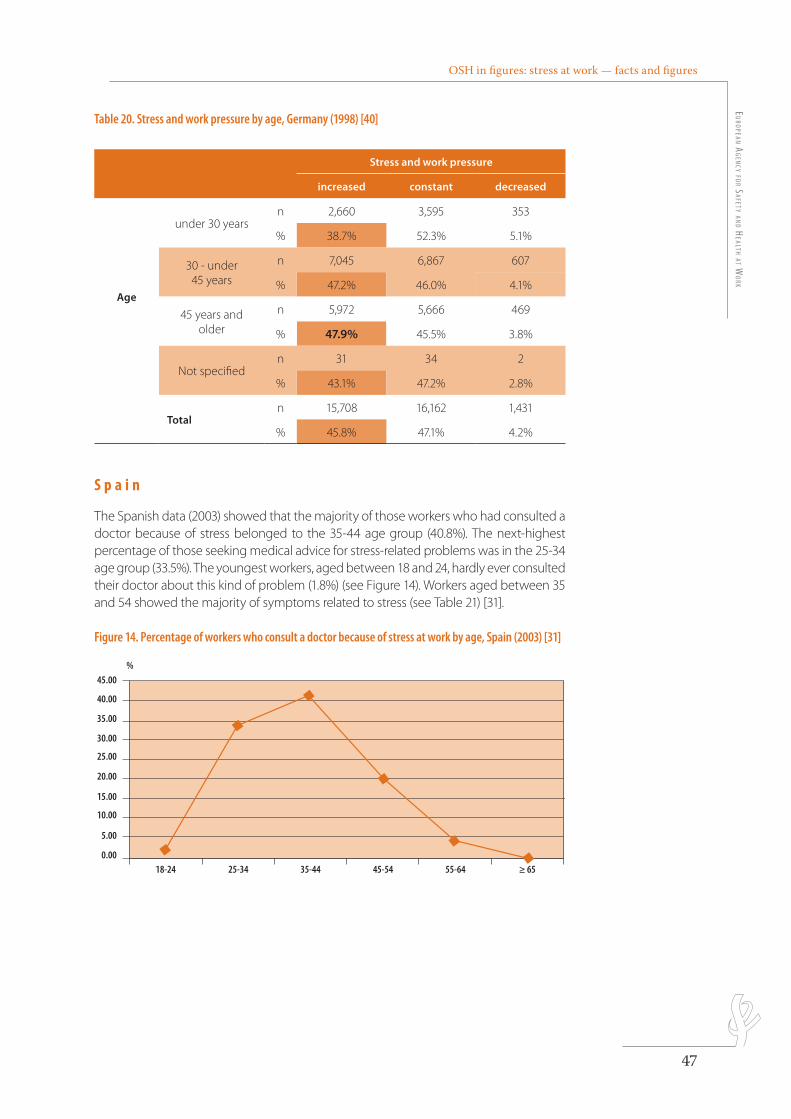
OSH in figures: stress at work — facts and figuresE
uro
pEan ag
Ency fo
r SafEty an
d HEaltH at W
ork
47
Table 20. Stress and work pressure by age, Germany (1998) [40]
Stress and work pressure
increased constant decreased
Age
under 30 yearsn 2,660 3,595 353
% 38.7% 52.3% 5.1%
30 - under 45 years
n 7,045 6,867 607
% 47.2% 46.0% 4.1%
45 years and older
n 5,972 5,666 469
% 47.9% 45.5% 3.8%
Not specifiedn 31 34 2
% 43.1% 47.2% 2.8%
Totaln 15,708 16,162 1,431
% 45.8% 47.1% 4.2%
S p a i n
The Spanish data (2003) showed that the majority of those workers who had consulted a doctor because of stress belonged to the 35-44 age group (40.8%). The next-highest percentage of those seeking medical advice for stress-related problems was in the 25-34 age group (33.5%). The youngest workers, aged between 18 and 24, hardly ever consulted their doctor about this kind of problem (1.8%) (see Figure 14). Workers aged between 35 and 54 showed the majority of symptoms related to stress (see Table 21) [31].
Figure 14. Percentage of workers who consult a doctor because of stress at work by age, Spain (2003) [31]
18-24
45.00
40.00
30.00
15.00
%
35.00
25.00
20.00
10.00
5.00
0.0025-34 35-44 45-54 55-64 ≥ 65
police : Myriad pro semibold condensed 11 pt
ordre des couleurs : dernier dossier dans la palette(la couleur du fond est la première de la palette, les autres suivent dans l’ordre)
légende : à droite ou en dessous du graphique
Les repères dépassent de 2 mm et tous les traits sont à 0.5 ptles barres n’ont pas de contours
carrés sans contours 4x4 mm
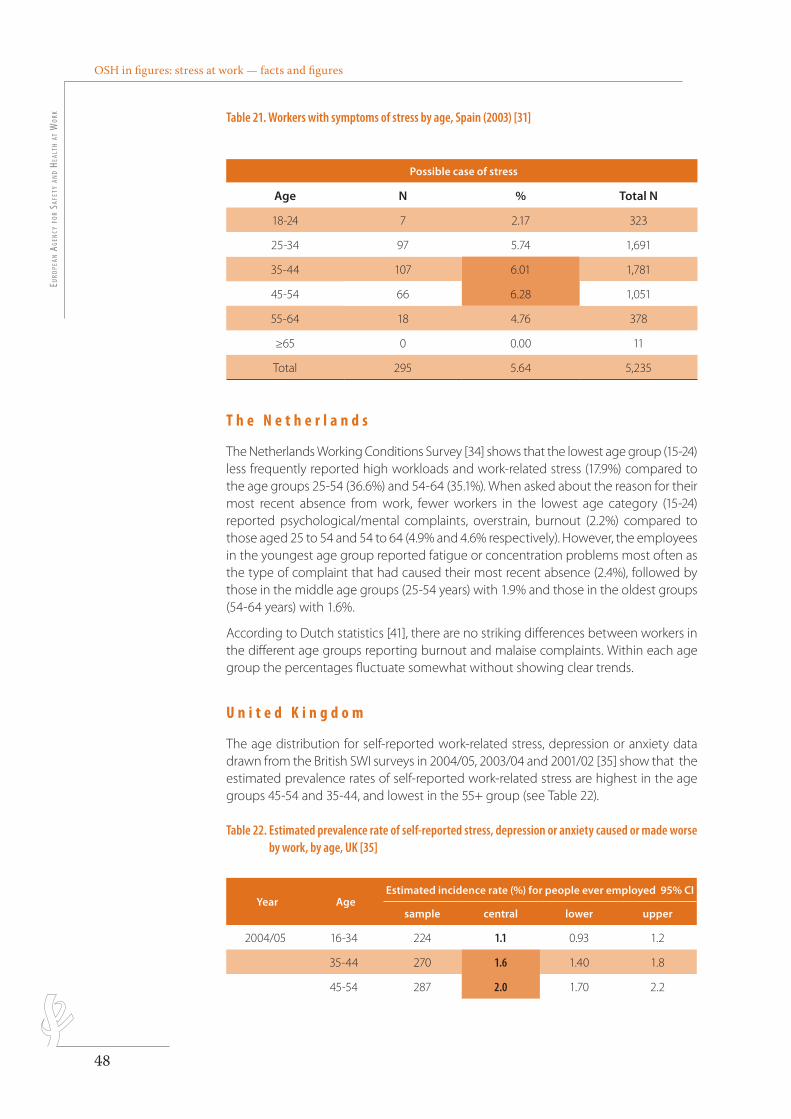
OSH in figures: stress at work — facts and figuresEu
ropE
an a
gEn
cy f
or
SafE
ty a
nd
HEal
tH a
t W
ork
48
Table 21. Workers with symptoms of stress by age, Spain (2003) [31]
Possible case of stress
Age N % Total N
18-24 7 2.17 323
25-34 97 5.74 1,691
35-44 107 6.01 1,781
45-54 66 6.28 1,051
55-64 18 4.76 378
≥65 0 0.00 11
Total 295 5.64 5,235
T h e N e t h e r l a n d s
The Netherlands Working Conditions Survey [34] shows that the lowest age group (15-24) less frequently reported high workloads and work-related stress (17.9%) compared to the age groups 25-54 (36.6%) and 54-64 (35.1%). When asked about the reason for their most recent absence from work, fewer workers in the lowest age category (15-24) reported psychological/mental complaints, overstrain, burnout (2.2%) compared to those aged 25 to 54 and 54 to 64 (4.9% and 4.6% respectively). However, the employees in the youngest age group reported fatigue or concentration problems most often as the type of complaint that had caused their most recent absence (2.4%), followed by those in the middle age groups (25-54 years) with 1.9% and those in the oldest groups (54-64 years) with 1.6%.
According to Dutch statistics [41], there are no striking differences between workers in the different age groups reporting burnout and malaise complaints. Within each age group the percentages fluctuate somewhat without showing clear trends.
U n i t e d K i n g d o m
The age distribution for self-reported work-related stress, depression or anxiety data drawn from the British SWI surveys in 2004/05, 2003/04 and 2001/02 [35] show that the estimated prevalence rates of self-reported work-related stress are highest in the age groups 45-54 and 35-44, and lowest in the 55+ group (see Table 22).
Table 22. Estimated prevalence rate of self-reported stress, depression or anxiety caused or made worse by work, by age, UK [35]
Year AgeEstimated incidence rate (%) for people ever employed 95% CI
sample central lower upper
2004/05 16-34 224 1.1 0.93 1.2
35-44 270 1.6 1.40 1.8
45-54 287 2.0 1.70 2.2
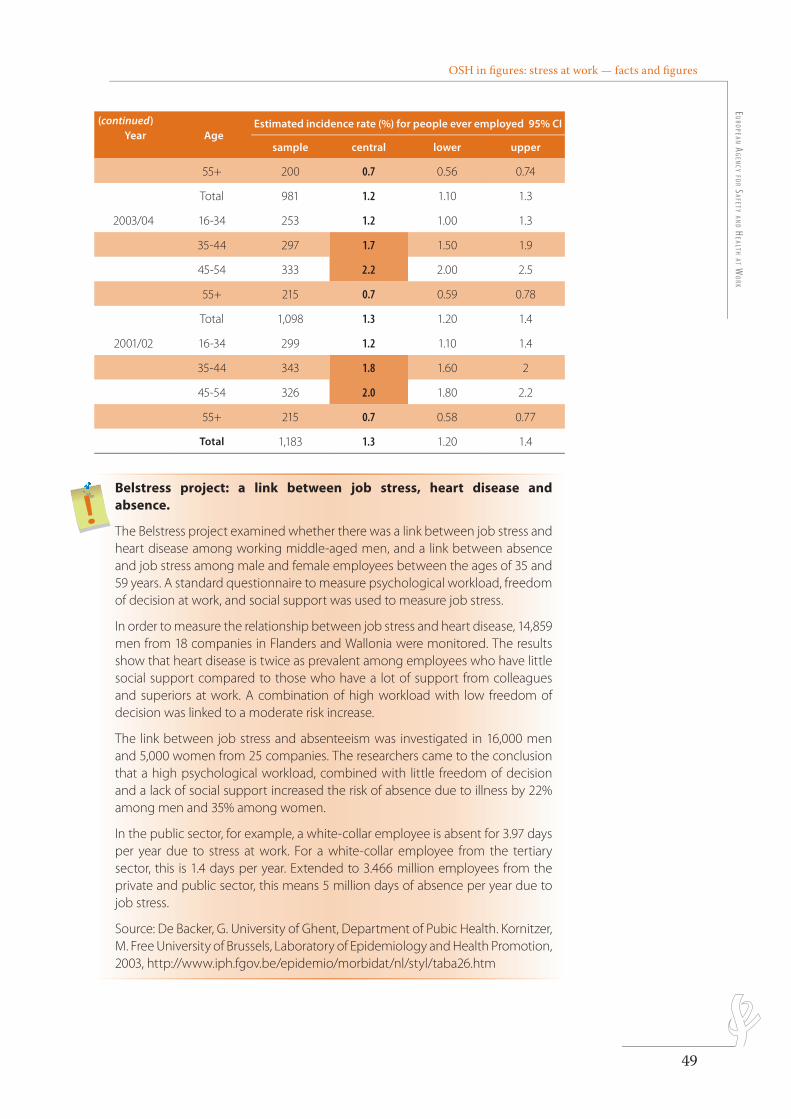
OSH in fi gures: stress at work — facts and fi gures E
uro
pEan ag
Ency fo
r SafEty an
d HEaltH at W
ork
49
Year AgeEstimated incidence rate (%) for people ever employed 95% CI
sample central lower upper
55+ 200 0.7 0.56 0.74
Total 981 1.2 1.10 1.3
2003/04 16-34 253 1.2 1.00 1.3
35-44 297 1.7 1.50 1.9
45-54 333 2.2 2.00 2.5
55+ 215 0.7 0.59 0.78
Total 1,098 1.3 1.20 1.4
2001/02 16-34 299 1.2 1.10 1.4
35-44 343 1.8 1.60 2
45-54 326 2.0 1.80 2.2
55+ 215 0.7 0.58 0.77
Total 1,183 1.3 1.20 1.4
Belstress project: a link between job stress, heart disease and absence.
The Belstress project examined whether there was a link between job stress and heart disease among working middle-aged men, and a link between absence and job stress among male and female employees between the ages of 35 and 59 years. A standard questionnaire to measure psychological workload, freedom of decision at work, and social support was used to measure job stress.
In order to measure the relationship between job stress and heart disease, 14,859 men from 18 companies in Flanders and Wallonia were monitored. The results show that heart disease is twice as prevalent among employees who have little social support compared to those who have a lot of support from colleagues and superiors at work. A combination of high workload with low freedom of decision was linked to a moderate risk increase.
The link between job stress and absenteeism was investigated in 16,000 men and 5,000 women from 25 companies. The researchers came to the conclusion that a high psychological workload, combined with little freedom of decision and a lack of social support increased the risk of absence due to illness by 22% among men and 35% among women.
In the public sector, for example, a white-collar employee is absent for 3.97 days per year due to stress at work. For a white-collar employee from the tertiary sector, this is 1.4 days per year. Extended to 3.466 million employees from the private and public sector, this means 5 million days of absence per year due to job stress.
Source: De Backer, G. University of Ghent, Department of Pubic Health. Kornitzer, M. Free University of Brussels, Laboratory of Epidemiology and Health Promotion, 2003, http://www.iph.fgov.be/epidemio/morbidat/nl/styl/taba26.htm
(continued)

E u r o p e a n A g e n c y f o r S a f e t y a n d H e a l t h a t W o r k
EUROPEAN RISK OBSERVATORY REPORT

E u r o p e a n A g e n c y f o r S a f e t y a n d H e a l t h a t W o r k
EUROPEAN RISK OBSERVATORY REPORT
STRESS BY GENDER
4.
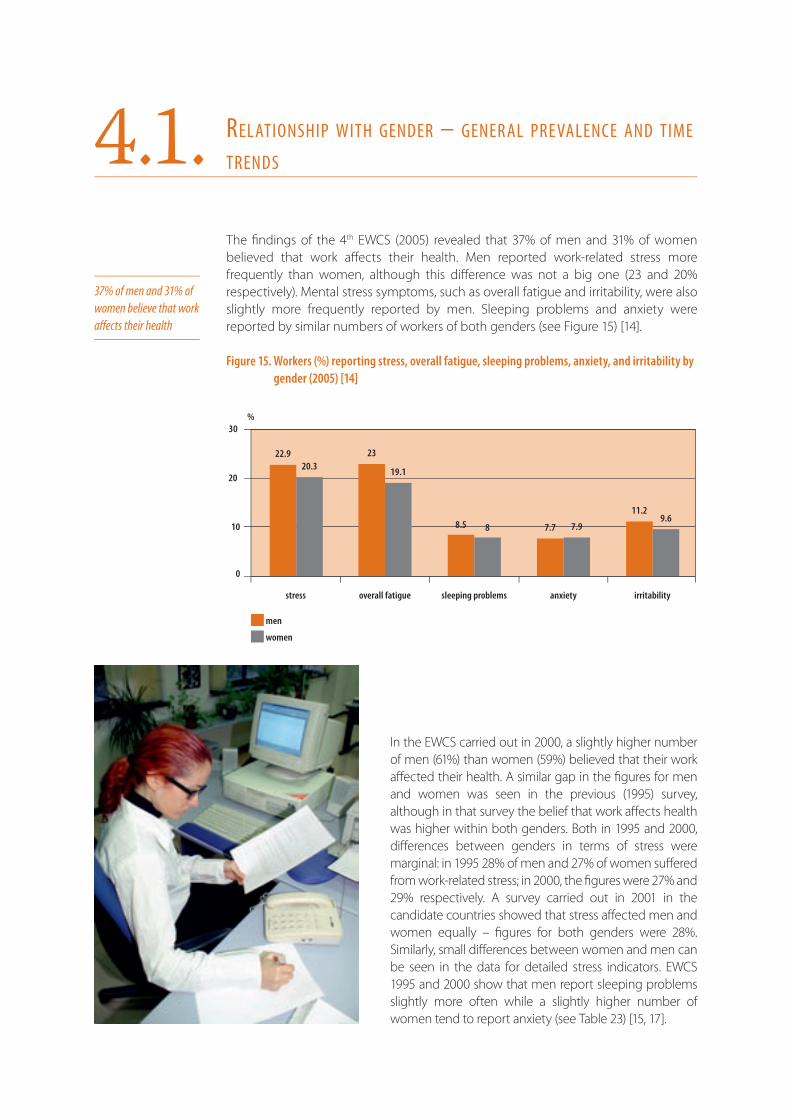
The fi ndings of the 4th EWCS (2005) revealed that 37% of men and 31% of women believed that work aff ects their health. Men reported work-related stress more frequently than women, although this diff erence was not a big one (23 and 20% respectively). Mental stress symptoms, such as overall fatigue and irritability, were also slightly more frequently reported by men. Sleeping problems and anxiety were reported by similar numbers of workers of both genders (see Figure 15) [14].
Figure 15. Workers (%) reporting stress, overall fatigue, sleeping problems, anxiety, and irritability by gender (2005) [14]
stress
men
22.920.3
23
19.1
8.5 8 7.7 7.9
11.29.6
%30
20
10
0
sleeping problems anxiety irritabilityoverall fatigue
women
In the EWCS carried out in 2000, a slightly higher number of men (61%) than women (59%) believed that their work aff ected their health. A similar gap in the fi gures for men and women was seen in the previous (1995) survey, although in that survey the belief that work aff ects health was higher within both genders. Both in 1995 and 2000, diff erences between genders in terms of stress were marginal: in 1995 28% of men and 27% of women suff ered from work-related stress; in 2000, the fi gures were 27% and 29% respectively. A survey carried out in 2001 in the candidate countries showed that stress aff ected men and women equally – fi gures for both genders were 28%. Similarly, small diff erences between women and men can be seen in the data for detailed stress indicators. EWCS 1995 and 2000 show that men report sleeping problems slightly more often while a slightly higher number of women tend to report anxiety (see Table 23) [15, 17].
rEl ationSHip WitH gEndEr – gEnEr al prEvalEncE and timE trEndS4.1.
37% of men and 31% of women believe that work aff ects their health
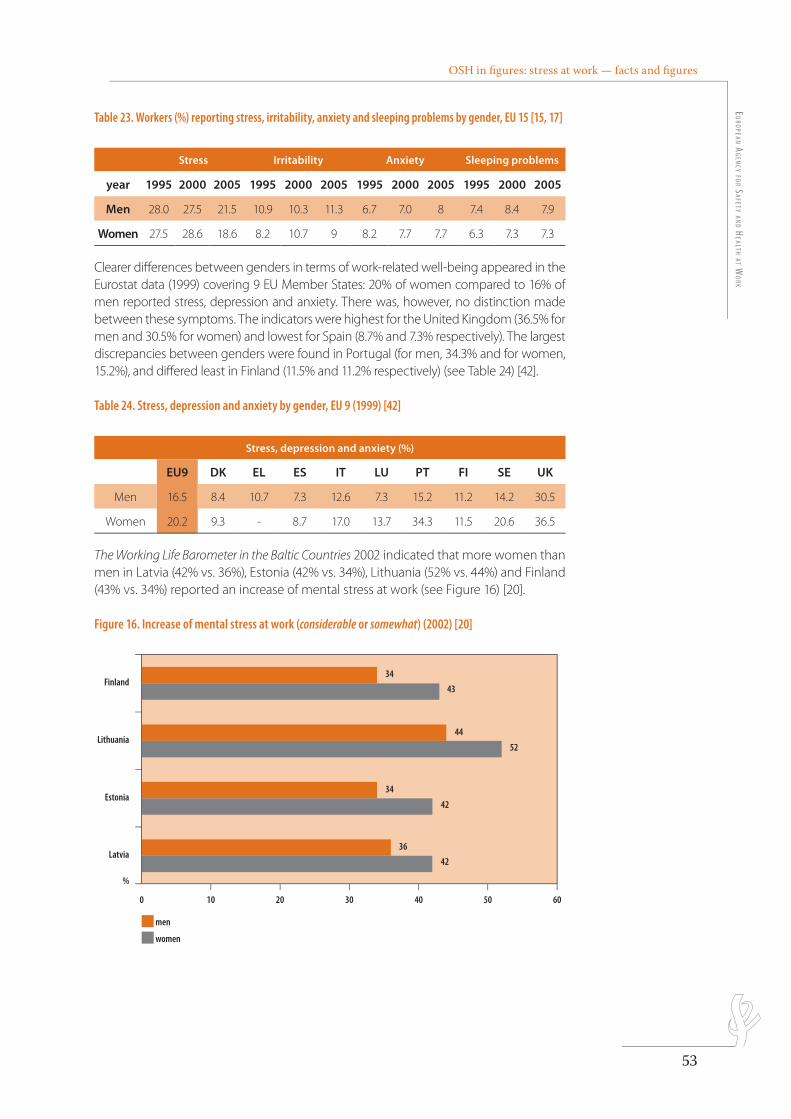
OSH in fi gures: stress at work — facts and fi gures E
uro
pEan ag
Ency fo
r SafEty an
d HEaltH at W
ork
53
Table 23. Workers (%) reporting stress, irritability, anxiety and sleeping problems by gender, EU 15 [15, 17]
Stress Irritability Anxiety Sleeping problems
year 1995 2000 2005 1995 2000 2005 1995 2000 2005 1995 2000 2005
Men 28.0 27.5 21.5 10.9 10.3 11.3 6.7 7.0 8 7.4 8.4 7.9
Women 27.5 28.6 18.6 8.2 10.7 9 8.2 7.7 7.7 6.3 7.3 7.3
Clearer diff erences between genders in terms of work-related well-being appeared in the Eurostat data (1999) covering 9 EU Member States: 20% of women compared to 16% of men reported stress, depression and anxiety. There was, however, no distinction made between these symptoms. The indicators were highest for the United Kingdom (36.5% for men and 30.5% for women) and lowest for Spain (8.7% and 7.3% respectively). The largest discrepancies between genders were found in Portugal (for men, 34.3% and for women, 15.2%), and diff ered least in Finland (11.5% and 11.2% respectively) (see Table 24) [42].
Table 24. Stress, depression and anxiety by gender, EU 9 (1999) [42]
Stress, depression and anxiety (%)
EU9 DK EL ES IT LU PT FI SE UK
Men 16.5 8.4 10.7 7.3 12.6 7.3 15.2 11.2 14.2 30.5
Women 20.2 9.3 - 8.7 17.0 13.7 34.3 11.5 20.6 36.5
The Working Life Barometer in the Baltic Countries 2002 indicated that more women than men in Latvia (42% vs. 36%), Estonia (42% vs. 34%), Lithuania (52% vs. 44%) and Finland (43% vs. 34%) reported an increase of mental stress at work (see Figure 16) [20].
Figure 16. Increase of mental stress at work (considerable or somewhat) (2002) [20]
34
43
44
52
34
42
36
42
0 10 20 30 40 50 60
Finland
Lithuania
Estonia
Latvia
%
women
men
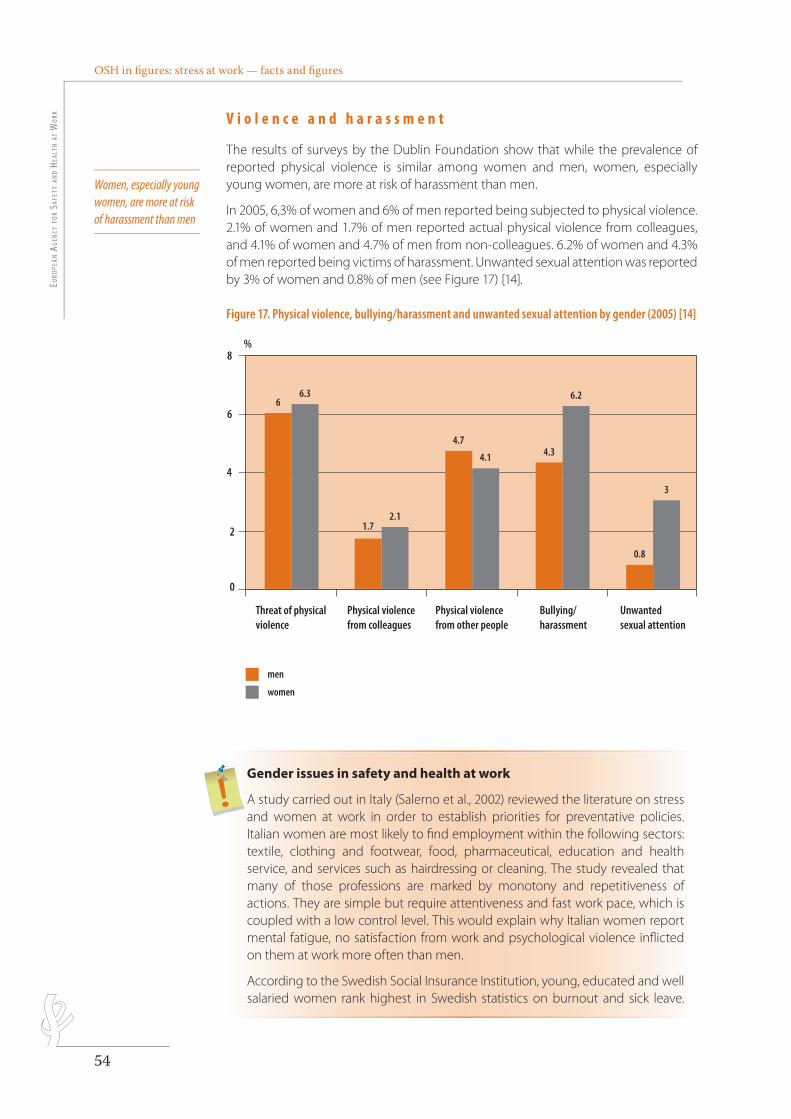
OSH in fi gures: stress at work — facts and fi gures Eu
ropE
an a
gEn
cy f
or
SafE
ty a
nd
HEal
tH a
t W
ork
54
V i o l e n c e a n d h a r a s s m e n t
The results of surveys by the Dublin Foundation show that while the prevalence of reported physical violence is similar among women and men, women, especially young women, are more at risk of harassment than men.
In 2005, 6,3% of women and 6% of men reported being subjected to physical violence. 2.1% of women and 1.7% of men reported actual physical violence from colleagues, and 4.1% of women and 4.7% of men from non-colleagues. 6.2% of women and 4.3% of men reported being victims of harassment. Unwanted sexual attention was reported by 3% of women and 0.8% of men (see Figure 17) [14].
Figure 17. Physical violence, bullying/harassment and unwanted sexual attention by gender (2005) [14]
Threat of physical violence
men
66.3
1.72.1
4.7
4.1 4.3
6.2
0.8
3
%8
6
4
2
0
Physical violence from other people
Bullying/harassment
Unwanted sexual attention
Physical violence from colleagues
women
Gender issues in safety and health at work
A study carried out in Italy (Salerno et al., 2002) reviewed the literature on stress and women at work in order to establish priorities for preventative policies. Italian women are most likely to fi nd employment within the following sectors: textile, clothing and footwear, food, pharmaceutical, education and health service, and services such as hairdressing or cleaning. The study revealed that many of those professions are marked by monotony and repetitiveness of actions. They are simple but require attentiveness and fast work pace, which is coupled with a low control level. This would explain why Italian women report mental fatigue, no satisfaction from work and psychological violence infl icted on them at work more often than men.
According to the Swedish Social Insurance Institution, young, educated and well salaried women rank highest in Swedish statistics on burnout and sick leave.
Women, especially young women, are more at risk of harassment than men
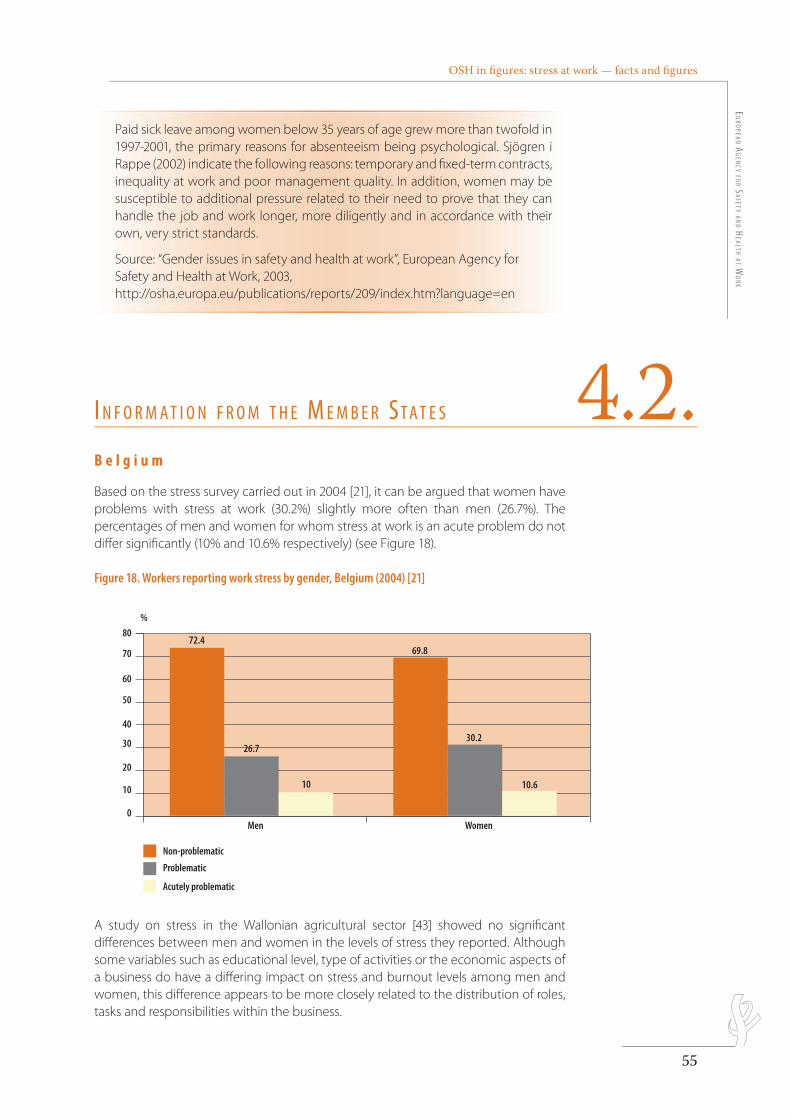
OSH in fi gures: stress at work — facts and fi gures E
uro
pEan ag
Ency fo
r SafEty an
d HEaltH at W
ork
55
Paid sick leave among women below 35 years of age grew more than twofold in 1997-2001, the primary reasons for absenteeism being psychological. Sjögren i Rappe (2002) indicate the following reasons: temporary and fi xed-term contracts, inequality at work and poor management quality. In addition, women may be susceptible to additional pressure related to their need to prove that they can handle the job and work longer, more diligently and in accordance with their own, very strict standards.
Source: “Gender issues in safety and health at work”, European Agency for Safety and Health at Work, 2003, http://osha.europa.eu/publications/reports/209/index.htm?language=en
B e l g i u m
Based on the stress survey carried out in 2004 [21], it can be argued that women have problems with stress at work (30.2%) slightly more often than men (26.7%). The percentages of men and women for whom stress at work is an acute problem do not diff er signifi cantly (10% and 10.6% respectively) (see Figure 18).
Figure 18. Workers reporting work stress by gender, Belgium (2004) [21]
8072.4
26.7
10
69.8
30.2
10.6
70
%
60
50
40
30
20
10
0WomenMen
Non-problematic
Problematic
Acutely problematic
police : Myriad pro semibold condensed 11 pt
ordre des couleurs : dernier dossier dans la palette(la couleur du fond est la première de la palette, les autres suivent dans l’ordre)
légende : à droite ou en dessous du graphique
Les repères dépassent de 2 mm et tous les traits sont à 0.5 ptles barres n’ont pas de contours
carrés sans contours 4x4 mm A study on stress in the Wallonian agricultural sector [43] showed no signifi cant diff erences between men and women in the levels of stress they reported. Although some variables such as educational level, type of activities or the economic aspects of a business do have a diff ering impact on stress and burnout levels among men and women, this diff erence appears to be more closely related to the distribution of roles, tasks and responsibilities within the business.
i n f o r m a t i o n f r o m t H E m E m b E r St a t E S 4.2.
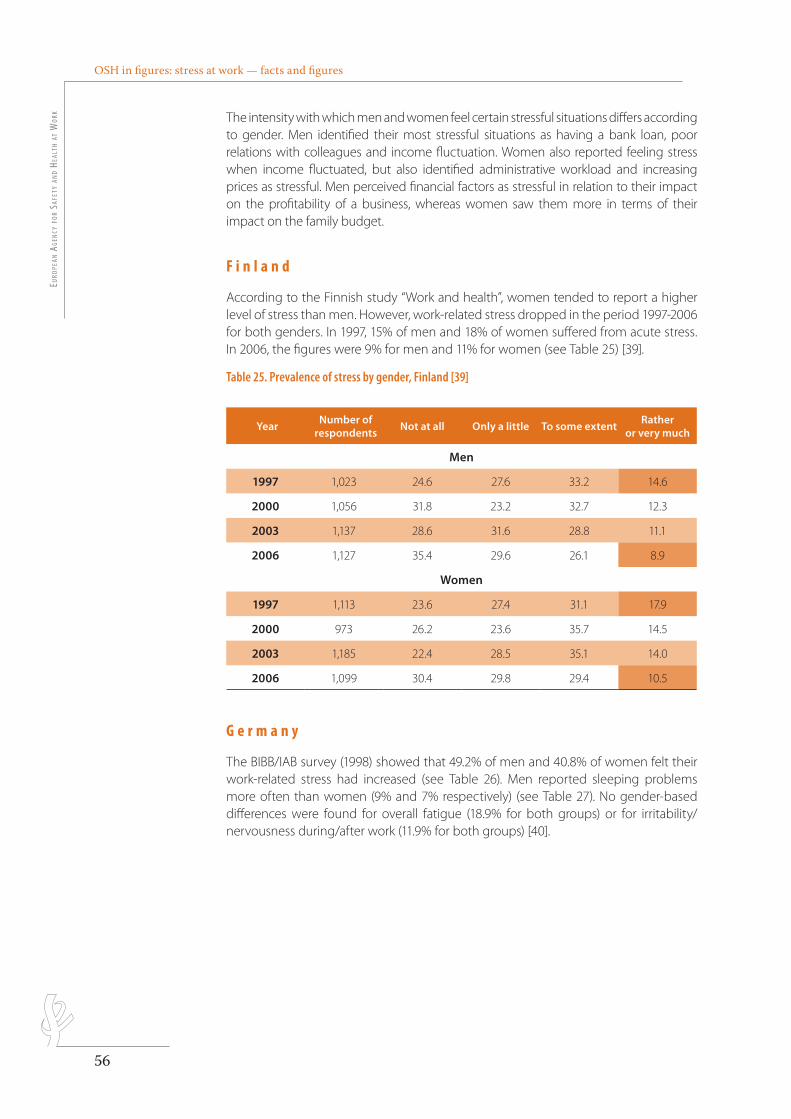
OSH in figures: stress at work — facts and figuresEu
ropE
an a
gEn
cy f
or
SafE
ty a
nd
HEal
tH a
t W
ork
56
The intensity with which men and women feel certain stressful situations differs according to gender. Men identified their most stressful situations as having a bank loan, poor relations with colleagues and income fluctuation. Women also reported feeling stress when income fluctuated, but also identified administrative workload and increasing prices as stressful. Men perceived financial factors as stressful in relation to their impact on the profitability of a business, whereas women saw them more in terms of their impact on the family budget.
F i n l a n d
According to the Finnish study “Work and health”, women tended to report a higher level of stress than men. However, work-related stress dropped in the period 1997-2006 for both genders. In 1997, 15% of men and 18% of women suffered from acute stress. In 2006, the figures were 9% for men and 11% for women (see Table 25) [39].
Table 25. Prevalence of stress by gender, Finland [39]
YearNumber of
respondentsNot at all Only a little To some extent
Ratheror very much
Men
1997 1,023 24.6 27.6 33.2 14.6
2000 1,056 31.8 23.2 32.7 12.3
2003 1,137 28.6 31.6 28.8 11.1
2006 1,127 35.4 29.6 26.1 8.9
Women
1997 1,113 23.6 27.4 31.1 17.9
2000 973 26.2 23.6 35.7 14.5
2003 1,185 22.4 28.5 35.1 14.0
2006 1,099 30.4 29.8 29.4 10.5
G e r m a n y
The BIBB/IAB survey (1998) showed that 49.2% of men and 40.8% of women felt their work-related stress had increased (see Table 26). Men reported sleeping problems more often than women (9% and 7% respectively) (see Table 27). No gender-based differences were found for overall fatigue (18.9% for both groups) or for irritability/nervousness during/after work (11.9% for both groups) [40].
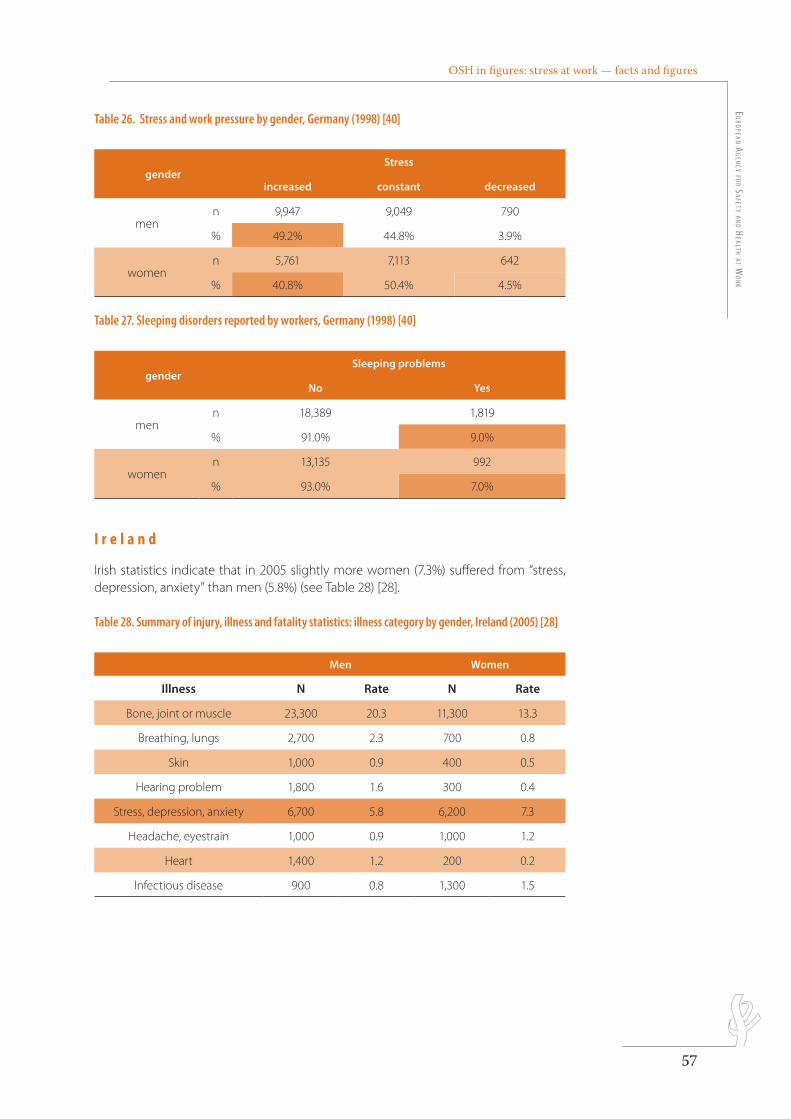
OSH in figures: stress at work — facts and figuresE
uro
pEan ag
Ency fo
r SafEty an
d HEaltH at W
ork
57
Table 26. Stress and work pressure by gender, Germany (1998) [40]
genderStress
increased constant decreased
menn 9,947 9,049 790
% 49.2% 44.8% 3.9%
womenn 5,761 7,113 642
% 40.8% 50.4% 4.5%
Table 27. Sleeping disorders reported by workers, Germany (1998) [40]
genderSleeping problems
No Yes
menn 18,389 1,819
% 91.0% 9.0%
womenn 13,135 992
% 93.0% 7.0%
I r e l a n d
Irish statistics indicate that in 2005 slightly more women (7.3%) suffered from “stress, depression, anxiety” than men (5.8%) (see Table 28) [28].
Table 28. Summary of injury, illness and fatality statistics: illness category by gender, Ireland (2005) [28]
Men Women
Illness N Rate N Rate
Bone, joint or muscle 23,300 20.3 11,300 13.3
Breathing, lungs 2,700 2.3 700 0.8
Skin 1,000 0.9 400 0.5
Hearing problem 1,800 1.6 300 0.4
Stress, depression, anxiety 6,700 5.8 6,200 7.3
Headache, eyestrain 1,000 0.9 1,000 1.2
Heart 1,400 1.2 200 0.2
Infectious disease 900 0.8 1,300 1.5
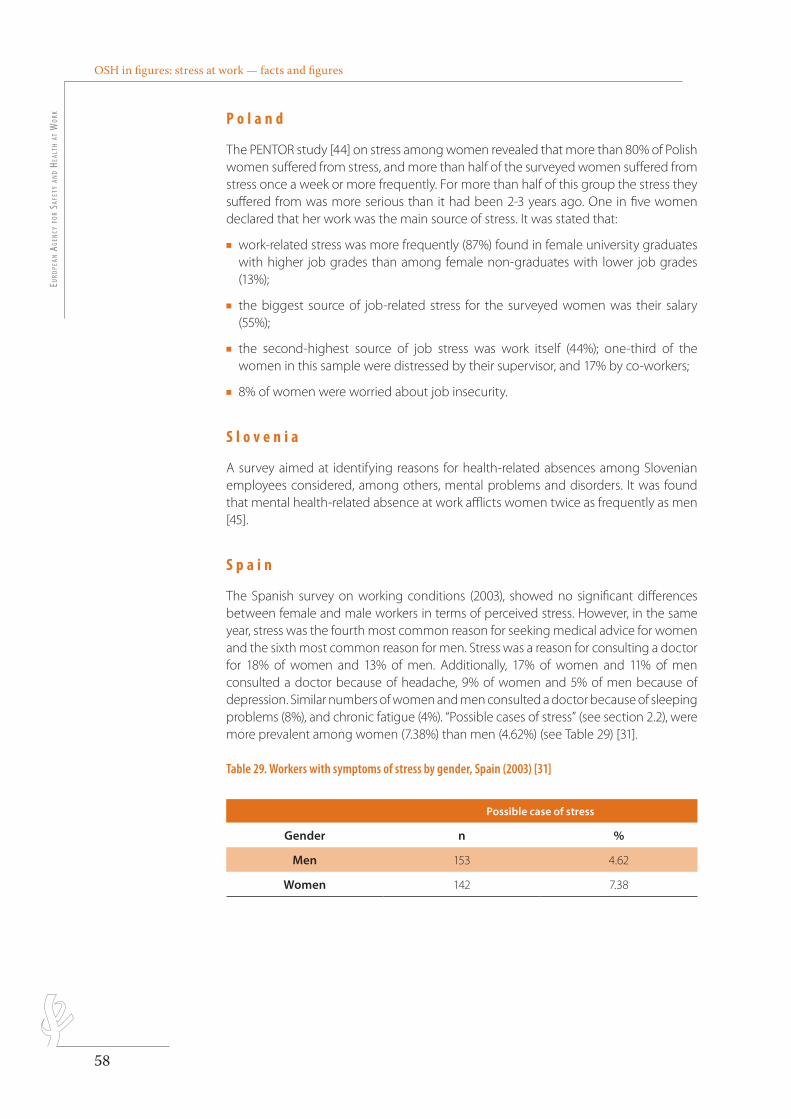
OSH in figures: stress at work — facts and figuresEu
ropE
an a
gEn
cy f
or
SafE
ty a
nd
HEal
tH a
t W
ork
58
P o l a n d
The PENTOR study [44] on stress among women revealed that more than 80% of Polish women suffered from stress, and more than half of the surveyed women suffered from stress once a week or more frequently. For more than half of this group the stress they suffered from was more serious than it had been 2-3 years ago. One in five women declared that her work was the main source of stress. It was stated that:
n work-related stress was more frequently (87%) found in female university graduates with higher job grades than among female non-graduates with lower job grades (13%);
n the biggest source of job-related stress for the surveyed women was their salary (55%);
n the second-highest source of job stress was work itself (44%); one-third of the women in this sample were distressed by their supervisor, and 17% by co-workers;
n 8% of women were worried about job insecurity.
S l o v e n i a
A survey aimed at identifying reasons for health-related absences among Slovenian employees considered, among others, mental problems and disorders. It was found that mental health-related absence at work afflicts women twice as frequently as men [45].
S p a i n
The Spanish survey on working conditions (2003), showed no significant differences between female and male workers in terms of perceived stress. However, in the same year, stress was the fourth most common reason for seeking medical advice for women and the sixth most common reason for men. Stress was a reason for consulting a doctor for 18% of women and 13% of men. Additionally, 17% of women and 11% of men consulted a doctor because of headache, 9% of women and 5% of men because of depression. Similar numbers of women and men consulted a doctor because of sleeping problems (8%), and chronic fatigue (4%). “Possible cases of stress” (see section 2.2), were more prevalent among women (7.38%) than men (4.62%) (see Table 29) [31].
Table 29. Workers with symptoms of stress by gender, Spain (2003) [31]
Possible case of stress
Gender n %
Men 153 4.62
Women 142 7.38
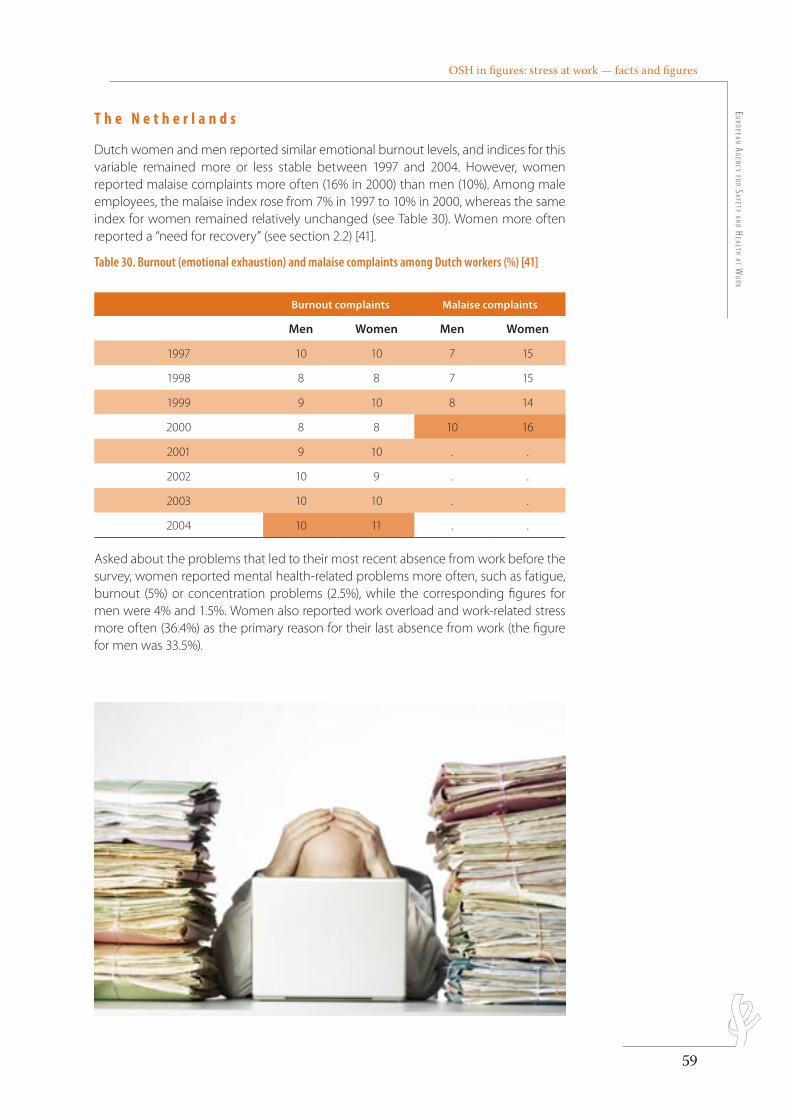
OSH in figures: stress at work — facts and figuresE
uro
pEan ag
Ency fo
r SafEty an
d HEaltH at W
ork
59
T h e N e t h e r l a n d s
Dutch women and men reported similar emotional burnout levels, and indices for this variable remained more or less stable between 1997 and 2004. However, women reported malaise complaints more often (16% in 2000) than men (10%). Among male employees, the malaise index rose from 7% in 1997 to 10% in 2000, whereas the same index for women remained relatively unchanged (see Table 30). Women more often reported a “need for recovery” (see section 2.2) [41].
Table 30. Burnout (emotional exhaustion) and malaise complaints among Dutch workers (%) [41]
Burnout complaints Malaise complaints
Men Women Men Women
1997 10 10 7 15
1998 8 8 7 15
1999 9 10 8 14
2000 8 8 10 16
2001 9 10 . .
2002 10 9 . .
2003 10 10 . .
2004 10 11 . .
Asked about the problems that led to their most recent absence from work before the survey, women reported mental health-related problems more often, such as fatigue, burnout (5%) or concentration problems (2.5%), while the corresponding figures for men were 4% and 1.5%. Women also reported work overload and work-related stress more often (36.4%) as the primary reason for their last absence from work (the figure for men was 33.5%).
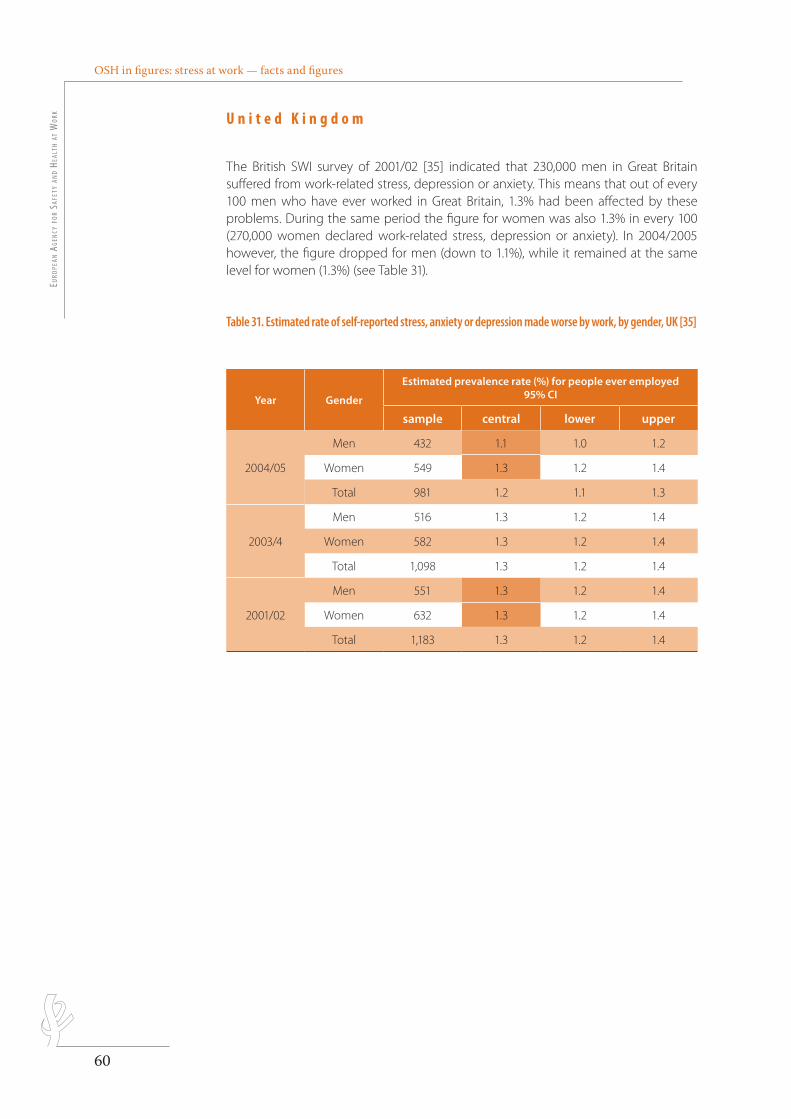
OSH in figures: stress at work — facts and figuresEu
ropE
an a
gEn
cy f
or
SafE
ty a
nd
HEal
tH a
t W
ork
60
U n i t e d K i n g d o m
The British SWI survey of 2001/02 [35] indicated that 230,000 men in Great Britain suffered from work-related stress, depression or anxiety. This means that out of every 100 men who have ever worked in Great Britain, 1.3% had been affected by these problems. During the same period the figure for women was also 1.3% in every 100 (270,000 women declared work-related stress, depression or anxiety). In 2004/2005 however, the figure dropped for men (down to 1.1%), while it remained at the same level for women (1.3%) (see Table 31).
Table 31. Estimated rate of self-reported stress, anxiety or depression made worse by work, by gender, UK [35]
Year Gender
Estimated prevalence rate (%) for people ever employed 95% CI
sample central lower upper
2004/05
Men 432 1.1 1.0 1.2
Women 549 1.3 1.2 1.4
Total 981 1.2 1.1 1.3
2003/4
Men 516 1.3 1.2 1.4
Women 582 1.3 1.2 1.4
Total 1,098 1.3 1.2 1.4
2001/02
Men 551 1.3 1.2 1.4
Women 632 1.3 1.2 1.4
Total 1,183 1.3 1.2 1.4
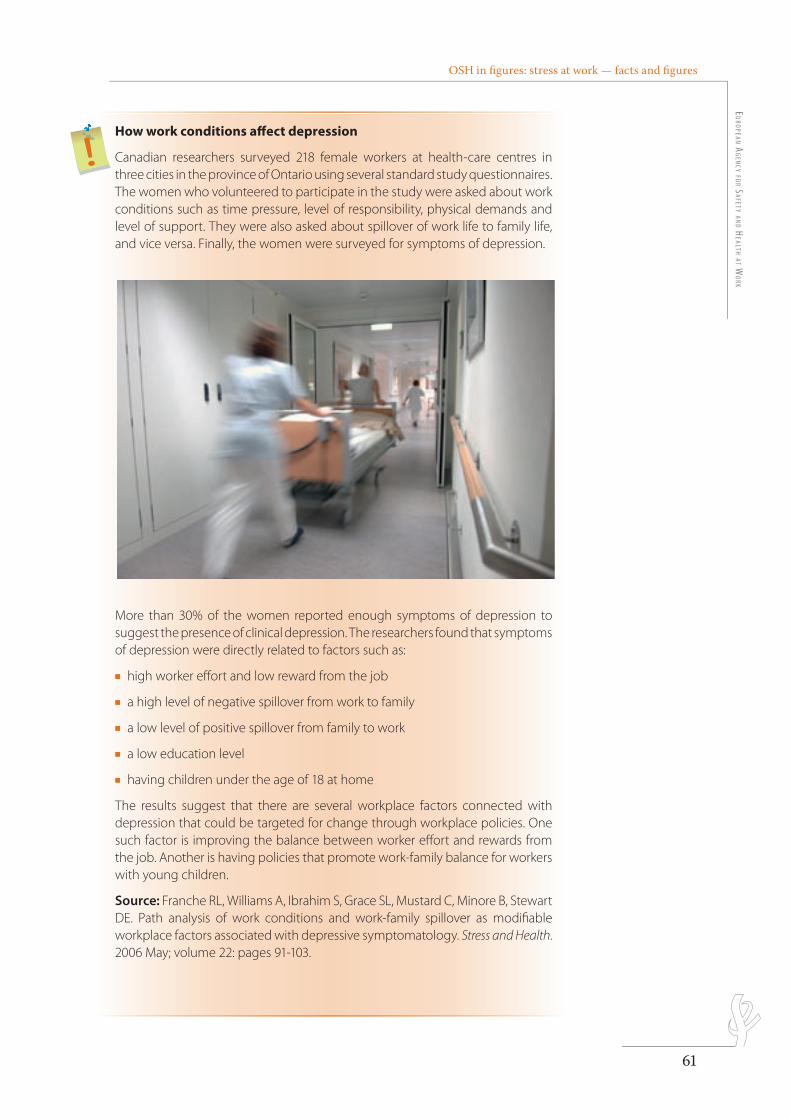
OSH in fi gures: stress at work — facts and fi gures E
uro
pEan ag
Ency fo
r SafEty an
d HEaltH at W
ork
61
How work conditions aff ect depression
Canadian researchers surveyed 218 female workers at health-care centres in three cities in the province of Ontario using several standard study questionnaires. The women who volunteered to participate in the study were asked about work conditions such as time pressure, level of responsibility, physical demands and level of support. They were also asked about spillover of work life to family life, and vice versa. Finally, the women were surveyed for symptoms of depression.
More than 30% of the women reported enough symptoms of depression to suggest the presence of clinical depression. The researchers found that symptoms of depression were directly related to factors such as:
n high worker eff ort and low reward from the job
n a high level of negative spillover from work to family
n a low level of positive spillover from family to work
n a low education level
n having children under the age of 18 at home
The results suggest that there are several workplace factors connected with depression that could be targeted for change through workplace policies. One such factor is improving the balance between worker eff ort and rewards from the job. Another is having policies that promote work-family balance for workers with young children.
Source: Franche RL, Williams A, Ibrahim S, Grace SL, Mustard C, Minore B, Stewart DE. Path analysis of work conditions and work-family spillover as modifi able workplace factors associated with depressive symptomatology. Stress and Health. 2006 May; volume 22: pages 91-103.

E u r o p e a n A g e n c y f o r S a f e t y a n d H e a l t h a t W o r k
EUROPEAN RISK OBSERVATORY REPORT

E u r o p e a n A g e n c y f o r S a f e t y a n d H e a l t h a t W o r k
EUROPEAN RISK OBSERVATORY REPORT
STRESS BY SECTOR AND OCCUPATION
5.
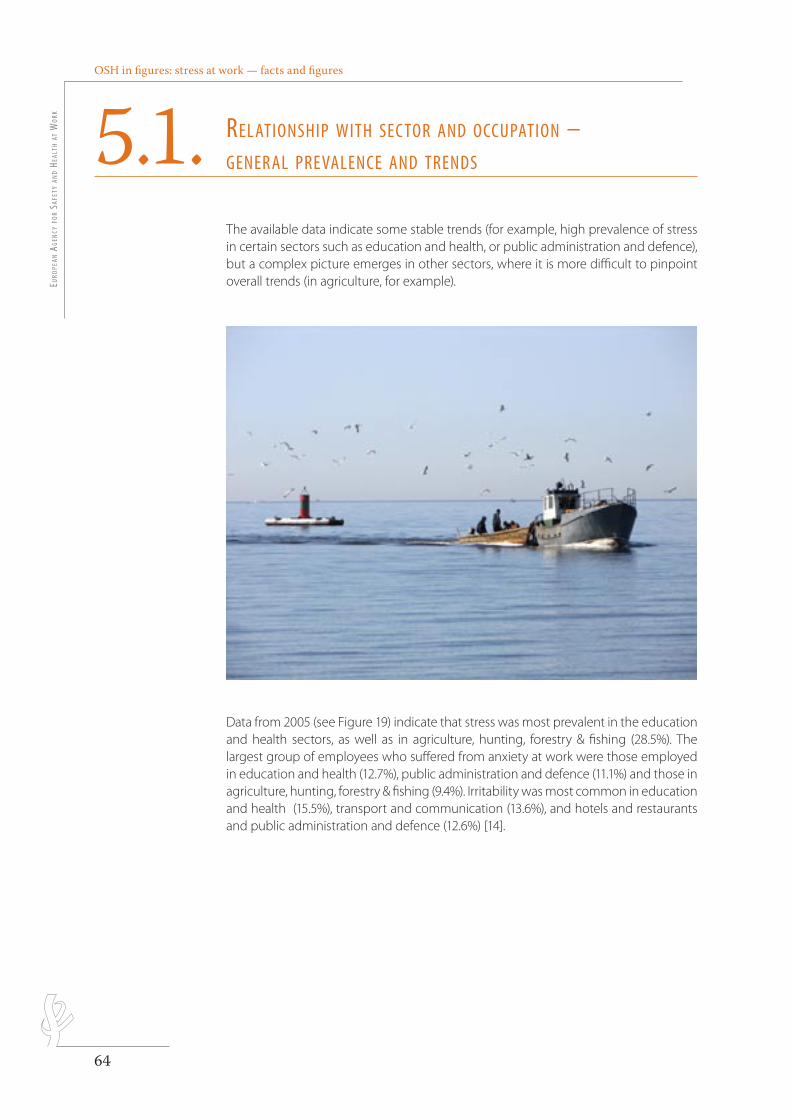
OSH in figures: stress at work — facts and figuresEu
ropE
an a
gEn
cy f
or
SafE
ty a
nd
HEal
tH a
t W
ork
64
The available data indicate some stable trends (for example, high prevalence of stress in certain sectors such as education and health, or public administration and defence), but a complex picture emerges in other sectors, where it is more difficult to pinpoint overall trends (in agriculture, for example).
Data from 2005 (see Figure 19) indicate that stress was most prevalent in the education and health sectors, as well as in agriculture, hunting, forestry & fishing (28.5%). The largest group of employees who suffered from anxiety at work were those employed in education and health (12.7%), public administration and defence (11.1%) and those in agriculture, hunting, forestry & fishing (9.4%). Irritability was most common in education and health (15.5%), transport and communication (13.6%), and hotels and restaurants and public administration and defence (12.6%) [14].
rEl ationSHip WitH SEc tor and occupation – gEnEr al prEvalEncE and trEndS5.1.
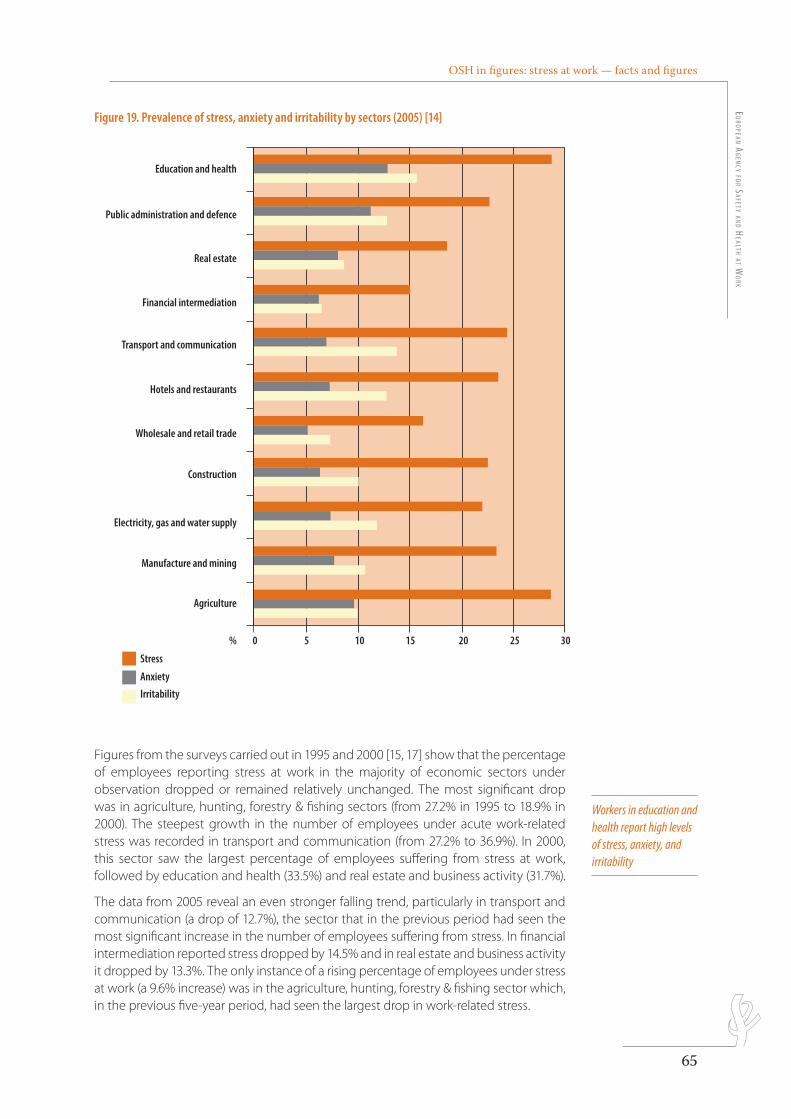
OSH in figures: stress at work — facts and figuresE
uro
pEan ag
Ency fo
r SafEty an
d HEaltH at W
ork
65
Figure 19. Prevalence of stress, anxiety and irritability by sectors (2005) [14]
302520151050%
Education and health
Public administration and defence
Real estate
Financial intermediation
Transport and communication
Hotels and restaurants
Wholesale and retail trade
Construction
Manufacture and mining
Electricity, gas and water supply
Agriculture
Stress
Anxiety
Irritability
police : Myriad pro semibold condensed 11 pt
ordre des couleurs : dernier dossier dans la palette(la couleur du fond est la première de la palette, les autres suivent dans l’ordre)
légende : à droite ou en dessous du graphique
Les repères dépassent de 2 mm et tous les traits sont à 0.5 ptles barres n’ont pas de contours
carrés sans contours 4x4 mm
Figures from the surveys carried out in 1995 and 2000 [15, 17] show that the percentage of employees reporting stress at work in the majority of economic sectors under observation dropped or remained relatively unchanged. The most significant drop was in agriculture, hunting, forestry & fishing sectors (from 27.2% in 1995 to 18.9% in 2000). The steepest growth in the number of employees under acute work-related stress was recorded in transport and communication (from 27.2% to 36.9%). In 2000, this sector saw the largest percentage of employees suffering from stress at work, followed by education and health (33.5%) and real estate and business activity (31.7%).
The data from 2005 reveal an even stronger falling trend, particularly in transport and communication (a drop of 12.7%), the sector that in the previous period had seen the most significant increase in the number of employees suffering from stress. In financial intermediation reported stress dropped by 14.5% and in real estate and business activity it dropped by 13.3%. The only instance of a rising percentage of employees under stress at work (a 9.6% increase) was in the agriculture, hunting, forestry & fishing sector which, in the previous five-year period, had seen the largest drop in work-related stress.
Workers in education and health report high levels of stress, anxiety, and irritability
OSH in figures: stress at work — facts and figuresEu
ropE
an a
gEn
cy f
or
SafE
ty a
nd
HEal
tH a
t W
ork
66
The percentage of employees in 2000 who suffered from anxiety was highest in education and health (9.4%), electricity, gas and water (9.4%) and financial intermediation (9.3%). In the two latter sectors, a significant rise in the level of anxiety at work was recorded, from 5.7% in 1995 to 9.4% in 2000, and from 5.1% to 9.3% respectively. In 1995–2000, a marked growth in the percentage of employees who suffered from anxiety was recorded in the hotels and restaurants sector (a rise of 3.0%) and in transport and communication (a rise of 3.4%). The real estate sector saw the most significant drop in the number of employees suffering from work-related anxiety (from 15.2% in 1995 to 8.4% in 2000). In 2005, a growth in the number of workers who suffered from anxiety was noted compared to the previous five-year period in public administration and defence (a rise of 2.2%) as well as in agriculture, hunting, forestry & fishing (a rise of 9.4%).
In 2000, 10.5% of the surveyed population in the EU15 reported irritability. The largest percentage of employees reporting irritability worked in transport and communication (14.4%), followed by education and health (12.5%), public administration and defence (12.3%). The transport and communication sector showed the largest growth in the number of employees who suffered from irritability (up from 10.4% to 14.4%), while the most significant drops were recorded in the agriculture, hunting, forestry & fishing sector (down from 9.9% to 6.1%) and in the real estate sector (down from 13.8% to 10.9%). In 2005, the share of employees suffering from irritability at work grew slightly compared with the 2000 figure. The most serious increase was recorded in the education and health sector (by 3%), and its 15.5% was the highest share among all sectors under consideration.
The figures on stress from different Member States show that in the education and health sector, work-related stress is most common in Slovenia (reported by 60% of workers), followed by Greece and Latvia (where stress was reported by 54% and 52% of health and education workers respectively). Even in the countries where the general level of stress was lower than the EU average, such as the United Kingdom, Czech Republic or the Netherlands, more than 20% of workers from the education and health sector reported work-related stress (see Figure 20).
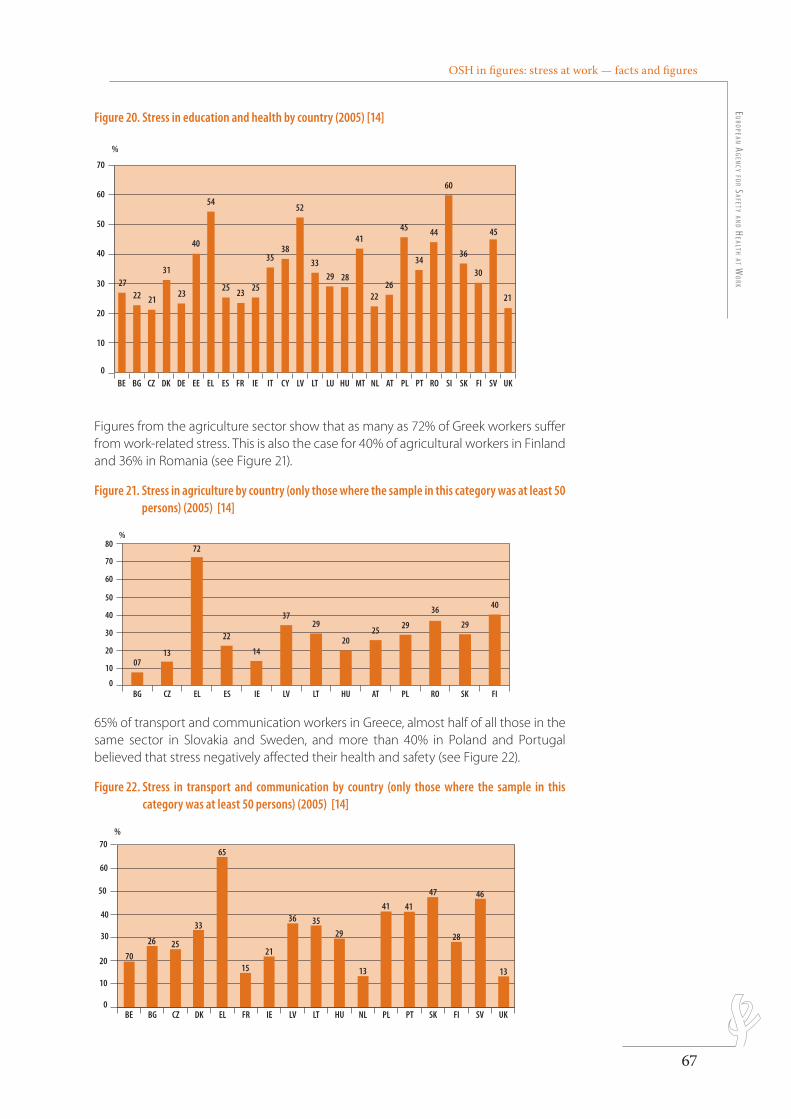
OSH in figures: stress at work — facts and figuresE
uro
pEan ag
Ency fo
r SafEty an
d HEaltH at W
ork
67
Figure 20. Stress in education and health by country (2005) [14]
2722 21
31
23
40
54
25 23 25
3538
52
3329 28
41
2226
45
34
44
60
36
30
21
45
%
70
50
60
40
10
20
30
0BE BG CZ DK DE EE EL ES FR IE IT CY LV LT LU HU MT NL AT PL PT RO SI SK FI SV UK
Figures from the agriculture sector show that as many as 72% of Greek workers suffer from work-related stress. This is also the case for 40% of agricultural workers in Finland and 36% in Romania (see Figure 21).
Figure 21. Stress in agriculture by country (only those where the sample in this category was at least 50 persons) (2005) [14]
police : Myriad pro semibold condensed 11 pt
ordre des couleurs : dernier dossier dans la palette(la couleur du fond est la première de la palette, les autres suivent dans l’ordre)
légende : à droite ou en dessous du graphique
Les repères dépassent de 2 mm et tous les traits sont à 0.5 ptles barres n’ont pas de contours
carrés sans contours 4x4 mm
0713
72
22
14
3729
2025 29
36
29
40
%80
60
70
10
20
30
40
50
0BG CZ EL ES IE LV LT HU AT PL RO SK FI
65% of transport and communication workers in Greece, almost half of all those in the same sector in Slovakia and Sweden, and more than 40% in Poland and Portugal believed that stress negatively affected their health and safety (see Figure 22).
Figure 22. Stress in transport and communication by country (only those where the sample in this category was at least 50 persons) (2005) [14]
BE BG CZ DK EL FR IE LV LT HU NL PL PT SK FI SV UK
70%
50
60
40
30
20
10
0
70
26 25
33
15
21
36 3529
13
41 41
47
28
46
13
65police : Myriad pro semibold condensed 11 pt
ordre des couleurs : dernier dossier dans la palette(la couleur du fond est la première de la palette, les autres suivent dans l’ordre)
légende : à droite ou en dessous du graphique
Les repères dépassent de 2 mm et tous les traits sont à 0.5 ptles barres n’ont pas de contours
carrés sans contours 4x4 mm
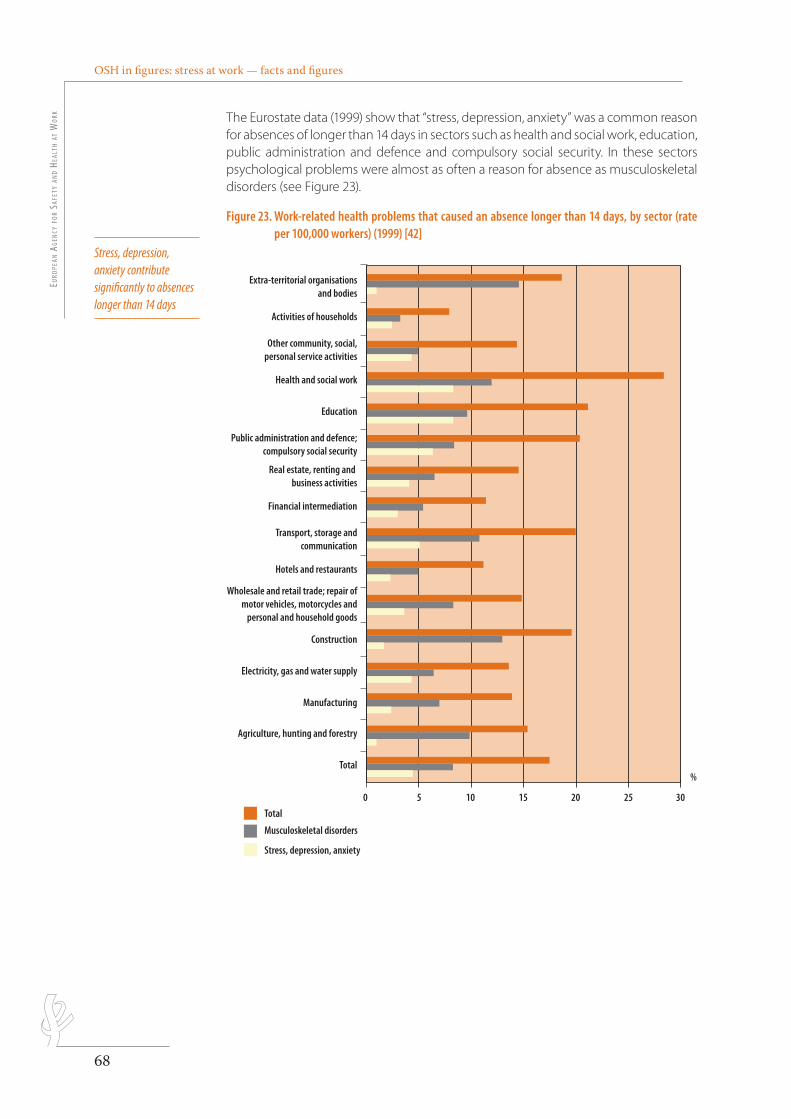
OSH in figures: stress at work — facts and figuresEu
ropE
an a
gEn
cy f
or
SafE
ty a
nd
HEal
tH a
t W
ork
68
The Eurostate data (1999) show that “stress, depression, anxiety” was a common reason for absences of longer than 14 days in sectors such as health and social work, education, public administration and defence and compulsory social security. In these sectors psychological problems were almost as often a reason for absence as musculoskeletal disorders (see Figure 23).
Figure 23. Work-related health problems that caused an absence longer than 14 days, by sector (rate per 100,000 workers) (1999) [42]
30
%
2520151050
Extra-territorial organisationsand bodies
Activities of households
Other community, social,personal service activities
Health and social work
Education
Public administration and defence; compulsory social security
Real estate, renting and business activities
Financial intermediation
Transport, storage and communication
Hotels and restaurants
Wholesale and retail trade; repair of motor vehicles, motorcycles and
personal and household goods
Electricity, gas and water supply
Construction
Manufacturing
Agriculture, hunting and forestry
Total
Total
Musculoskeletal disorders
Stress, depression, anxiety
police : Myriad pro semibold condensed 11 pt
ordre des couleurs : dernier dossier dans la palette(la couleur du fond est la première de la palette, les autres suivent dans l’ordre)
légende : à droite ou en dessous du graphique
Les repères dépassent de 2 mm et tous les traits sont à 0.5 ptles barres n’ont pas de contours
carrés sans contours 4x4 mm
Stress, depression, anxiety contribute significantly to absences longer than 14 days
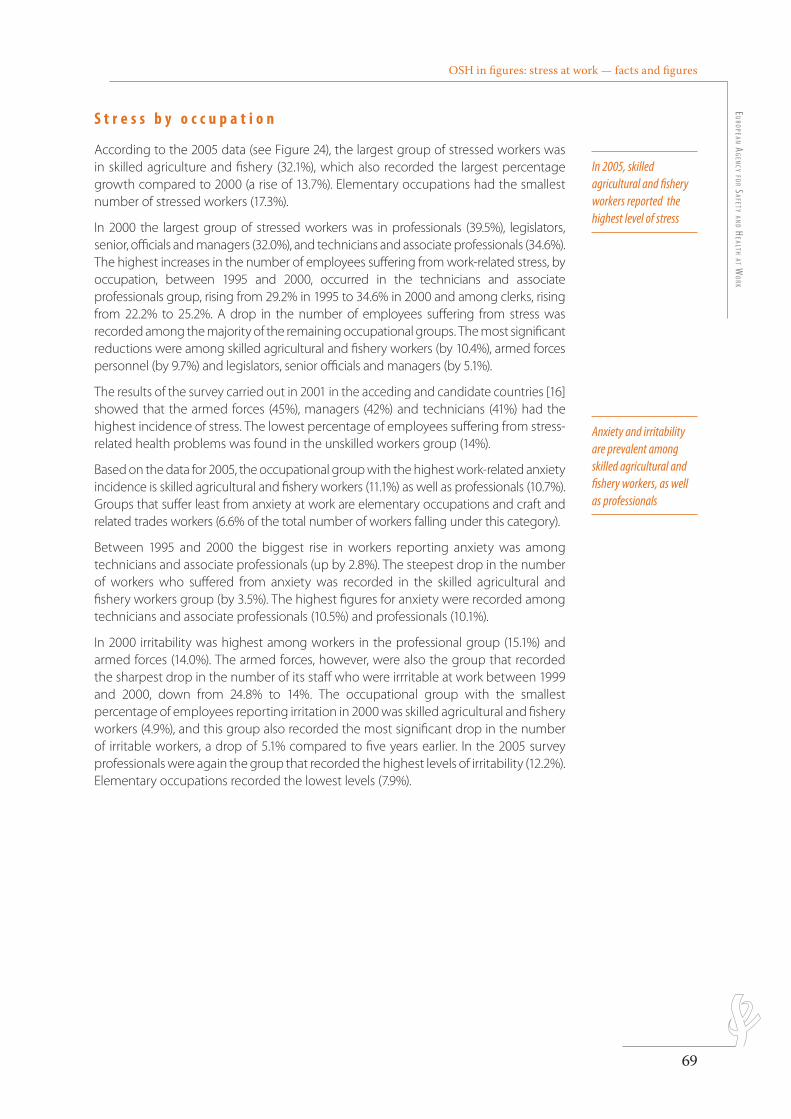
OSH in figures: stress at work — facts and figuresE
uro
pEan ag
Ency fo
r SafEty an
d HEaltH at W
ork
69
Anxiety and irritability are prevalent among skilled agricultural and fishery workers, as well as professionals
In 2005, skilled agricultural and fishery workers reported the highest level of stress
S t r e s s b y o c c u p a t i o n
According to the 2005 data (see Figure 24), the largest group of stressed workers was in skilled agriculture and fishery (32.1%), which also recorded the largest percentage growth compared to 2000 (a rise of 13.7%). Elementary occupations had the smallest number of stressed workers (17.3%).
In 2000 the largest group of stressed workers was in professionals (39.5%), legislators, senior, officials and managers (32.0%), and technicians and associate professionals (34.6%). The highest increases in the number of employees suffering from work-related stress, by occupation, between 1995 and 2000, occurred in the technicians and associate professionals group, rising from 29.2% in 1995 to 34.6% in 2000 and among clerks, rising from 22.2% to 25.2%. A drop in the number of employees suffering from stress was recorded among the majority of the remaining occupational groups. The most significant reductions were among skilled agricultural and fishery workers (by 10.4%), armed forces personnel (by 9.7%) and legislators, senior officials and managers (by 5.1%).
The results of the survey carried out in 2001 in the acceding and candidate countries [16] showed that the armed forces (45%), managers (42%) and technicians (41%) had the highest incidence of stress. The lowest percentage of employees suffering from stress-related health problems was found in the unskilled workers group (14%).
Based on the data for 2005, the occupational group with the highest work-related anxiety incidence is skilled agricultural and fishery workers (11.1%) as well as professionals (10.7%). Groups that suffer least from anxiety at work are elementary occupations and craft and related trades workers (6.6% of the total number of workers falling under this category).
Between 1995 and 2000 the biggest rise in workers reporting anxiety was among technicians and associate professionals (up by 2.8%). The steepest drop in the number of workers who suffered from anxiety was recorded in the skilled agricultural and fishery workers group (by 3.5%). The highest figures for anxiety were recorded among technicians and associate professionals (10.5%) and professionals (10.1%).
In 2000 irritability was highest among workers in the professional group (15.1%) and armed forces (14.0%). The armed forces, however, were also the group that recorded the sharpest drop in the number of its staff who were irrritable at work between 1999 and 2000, down from 24.8% to 14%. The occupational group with the smallest percentage of employees reporting irritation in 2000 was skilled agricultural and fishery workers (4.9%), and this group also recorded the most significant drop in the number of irritable workers, a drop of 5.1% compared to five years earlier. In the 2005 survey professionals were again the group that recorded the highest levels of irritability (12.2%). Elementary occupations recorded the lowest levels (7.9%).
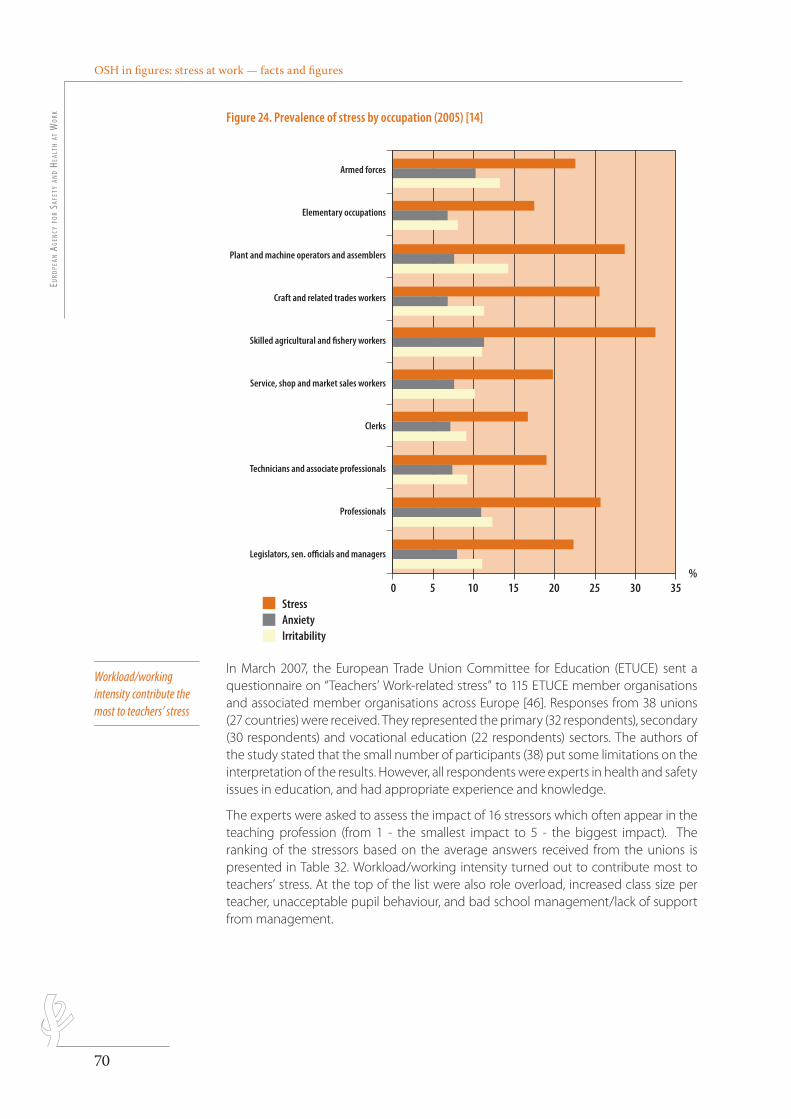
OSH in figures: stress at work — facts and figuresEu
ropE
an a
gEn
cy f
or
SafE
ty a
nd
HEal
tH a
t W
ork
70
Figure 24. Prevalence of stress by occupation (2005) [14]
35%
302520151050
Armed forces
Elementary occupations
Plant and machine operators and assemblers
Craft and related trades workers
Skilled agricultural and fishery workers
Service, shop and market sales workers
Clerks
Technicians and associate professionals
Professionals
Legislators, sen. officials and managers
StressAnxietyIrritability
police : Myriad pro semibold condensed 11 pt
ordre des couleurs : dernier dossier dans la palette(la couleur du fond est la première de la palette, les autres suivent dans l’ordre)
légende : à droite ou en dessous du graphique
Les repères dépassent de 2 mm et tous les traits sont à 0.5 ptles barres n’ont pas de contours
carrés sans contours 4x4 mm
In March 2007, the European Trade Union Committee for Education (ETUCE) sent a questionnaire on “Teachers’ Work-related stress” to 115 ETUCE member organisations and associated member organisations across Europe [46]. Responses from 38 unions (27 countries) were received. They represented the primary (32 respondents), secondary (30 respondents) and vocational education (22 respondents) sectors. The authors of the study stated that the small number of participants (38) put some limitations on the interpretation of the results. However, all respondents were experts in health and safety issues in education, and had appropriate experience and knowledge.
The experts were asked to assess the impact of 16 stressors which often appear in the teaching profession (from 1 - the smallest impact to 5 - the biggest impact). The ranking of the stressors based on the average answers received from the unions is presented in Table 32. Workload/working intensity turned out to contribute most to teachers’ stress. At the top of the list were also role overload, increased class size per teacher, unacceptable pupil behaviour, and bad school management/lack of support from management.
Workload/working intensity contribute the most to teachers’ stress
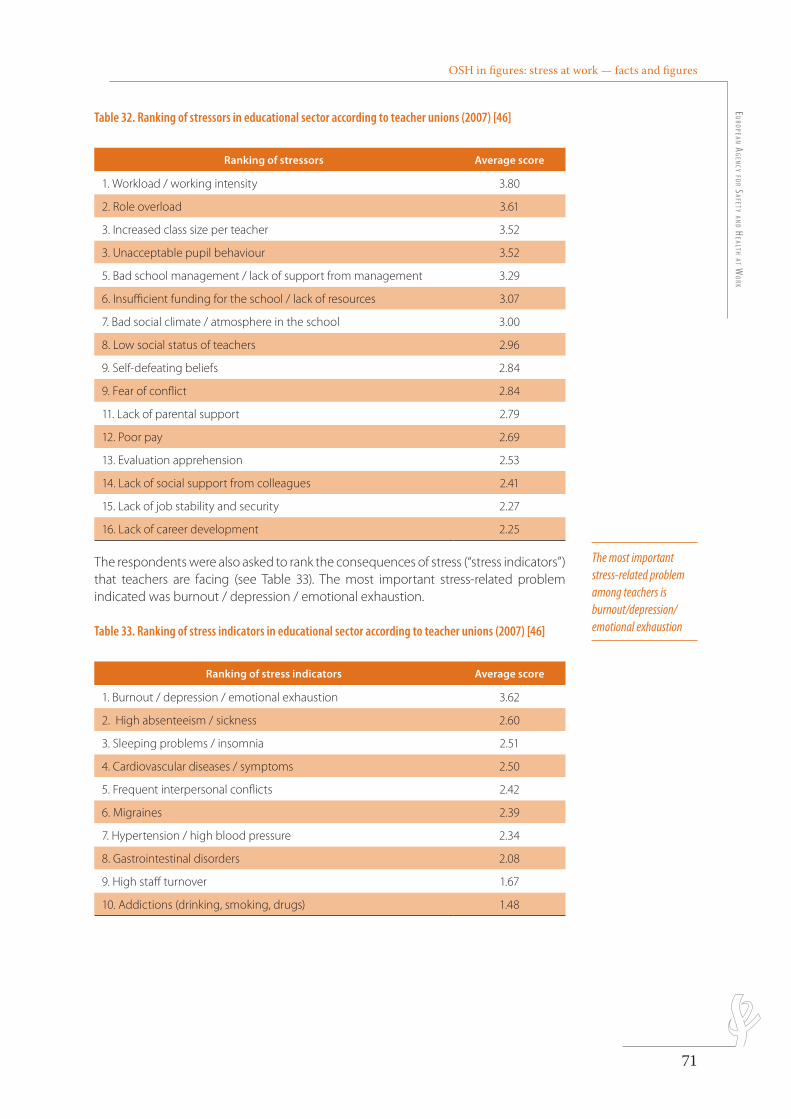
OSH in figures: stress at work — facts and figuresE
uro
pEan ag
Ency fo
r SafEty an
d HEaltH at W
ork
71
Table 32. Ranking of stressors in educational sector according to teacher unions (2007) [46]
Ranking of stressors Average score
1. Workload / working intensity 3.80
2. Role overload 3.61
3. Increased class size per teacher 3.52
3. Unacceptable pupil behaviour 3.52
5. Bad school management / lack of support from management 3.29
6. Insufficient funding for the school / lack of resources 3.07
7. Bad social climate / atmosphere in the school 3.00
8. Low social status of teachers 2.96
9. Self-defeating beliefs 2.84
9. Fear of conflict 2.84
11. Lack of parental support 2.79
12. Poor pay 2.69
13. Evaluation apprehension 2.53
14. Lack of social support from colleagues 2.41
15. Lack of job stability and security 2.27
16. Lack of career development 2.25
The respondents were also asked to rank the consequences of stress (“stress indicators”) that teachers are facing (see Table 33). The most important stress-related problem indicated was burnout / depression / emotional exhaustion.
Table 33. Ranking of stress indicators in educational sector according to teacher unions (2007) [46]
Ranking of stress indicators Average score
1. Burnout / depression / emotional exhaustion 3.62
2. High absenteeism / sickness 2.60
3. Sleeping problems / insomnia 2.51
4. Cardiovascular diseases / symptoms 2.50
5. Frequent interpersonal conflicts 2.42
6. Migraines 2.39
7. Hypertension / high blood pressure 2.34
8. Gastrointestinal disorders 2.08
9. High staff turnover 1.67
10. Addictions (drinking, smoking, drugs) 1.48
The most important stress-related problem among teachers is burnout/depression/emotional exhaustion
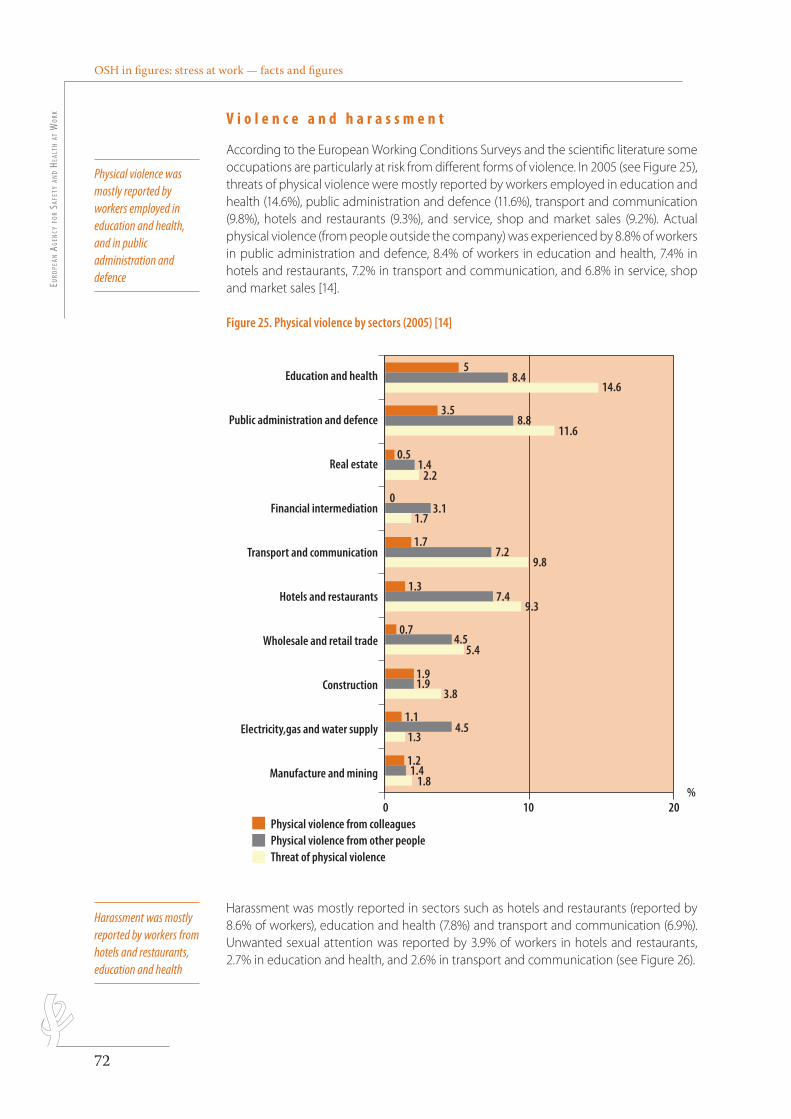
OSH in figures: stress at work — facts and figuresEu
ropE
an a
gEn
cy f
or
SafE
ty a
nd
HEal
tH a
t W
ork
72
V i o l e n c e a n d h a r a s s m e n t
According to the European Working Conditions Surveys and the scientific literature some occupations are particularly at risk from different forms of violence. In 2005 (see Figure 25), threats of physical violence were mostly reported by workers employed in education and health (14.6%), public administration and defence (11.6%), transport and communication (9.8%), hotels and restaurants (9.3%), and service, shop and market sales (9.2%). Actual physical violence (from people outside the company) was experienced by 8.8% of workers in public administration and defence, 8.4% of workers in education and health, 7.4% in hotels and restaurants, 7.2% in transport and communication, and 6.8% in service, shop and market sales [14].
Figure 25. Physical violence by sectors (2005) [14]
20%
100
Education and health
Public administration and defence
Real estate
Financial intermediation
Transport and communication
Hotels and restaurants
Wholesale and retail trade
Construction
Electricity,gas and water supply
Manufacture and mining
Physical violence from colleaguesPhysical violence from other peopleThreat of physical violence
58.4
14.6
3.5
0.51.4
2.2
03.1
1.7
1.7
1.37.4
0.74.5
5.4
1.91.9
3.8
1.14.5
1.3
1.21.4
1.8
9.3
7.29.8
8.811.6
Harassment was mostly reported in sectors such as hotels and restaurants (reported by 8.6% of workers), education and health (7.8%) and transport and communication (6.9%). Unwanted sexual attention was reported by 3.9% of workers in hotels and restaurants, 2.7% in education and health, and 2.6% in transport and communication (see Figure 26).
Physical violence was mostly reported by workers employed in education and health, and in public administration and defence
Harassment was mostly reported by workers from hotels and restaurants, education and health
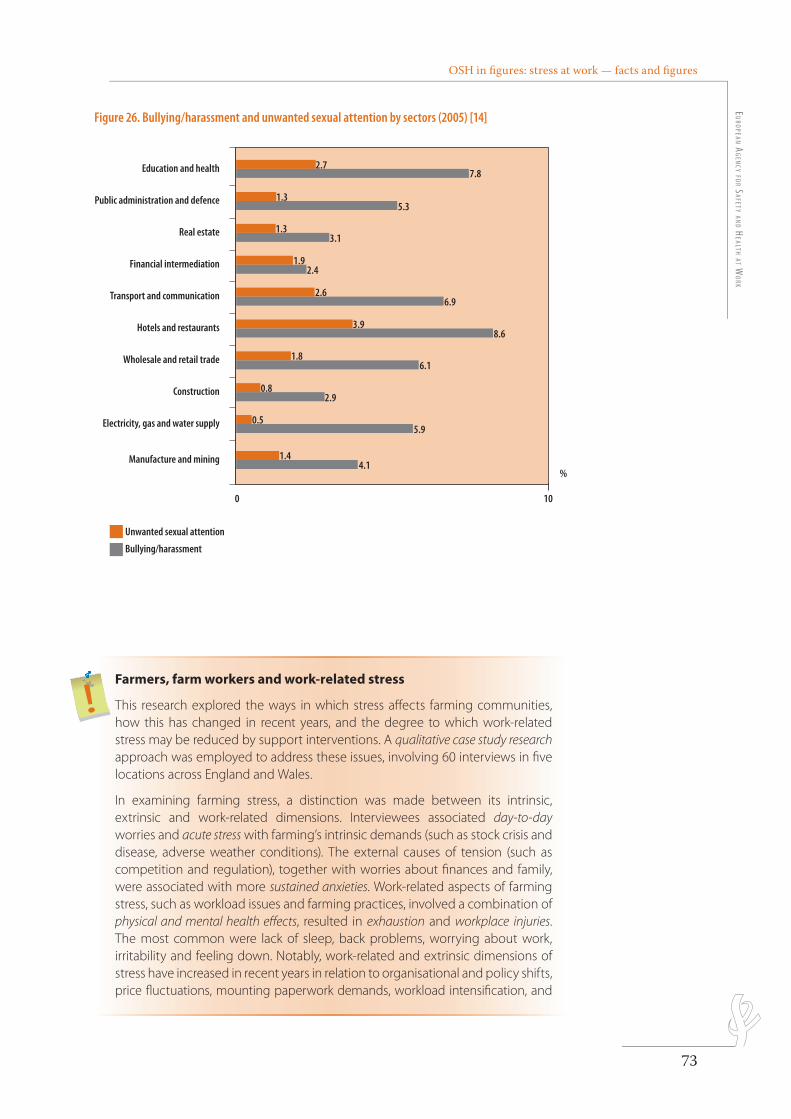
OSH in fi gures: stress at work — facts and fi gures E
uro
pEan ag
Ency fo
r SafEty an
d HEaltH at W
ork
73
Figure 26. Bullying/harassment and unwanted sexual attention by sectors (2005) [14]
10
%
0
Education and health 2.77.8
1.35.3
1.33.1
1.92.4
1.86.1
0.82.9
1.44.1
0.55.9
2.66.9
3.98.6
Public administration and defence
Real estate
Financial intermediation
Transport and communication
Hotels and restaurants
Wholesale and retail trade
Construction
Electricity, gas and water supply
Manufacture and mining
Unwanted sexual attention
Bullying/harassment
police : Myriad pro semibold condensed 11 pt
ordre des couleurs : dernier dossier dans la palette(la couleur du fond est la première de la palette, les autres suivent dans l’ordre)
légende : à droite ou en dessous du graphique
Les repères dépassent de 2 mm et tous les traits sont à 0.5 ptles barres n’ont pas de contours
carrés sans contours 4x4 mm
Farmers, farm workers and work-related stress
This research explored the ways in which stress aff ects farming communities, how this has changed in recent years, and the degree to which work-related stress may be reduced by support interventions. A qualitative case study research approach was employed to address these issues, involving 60 interviews in fi ve locations across England and Wales.
In examining farming stress, a distinction was made between its intrinsic, extrinsic and work-related dimensions. Interviewees associated day-to-day worries and acute stress with farming’s intrinsic demands (such as stock crisis and disease, adverse weather conditions). The external causes of tension (such as competition and regulation), together with worries about fi nances and family, were associated with more sustained anxieties. Work-related aspects of farming stress, such as workload issues and farming practices, involved a combination of physical and mental health eff ects, resulted in exhaustion and workplace injuries. The most common were lack of sleep, back problems, worrying about work, irritability and feeling down. Notably, work-related and extrinsic dimensions of stress have increased in recent years in relation to organisational and policy shifts, price fl uctuations, mounting paperwork demands, workload intensifi cation, and
OSH in fi gures: stress at work — facts and fi gures Eu
ropE
an a
gEn
cy f
or
SafE
ty a
nd
HEal
tH a
t W
ork
74
changes in agricultural regulation. These have prompted an escalation in the aspects of the work that farming communities feel powerless to control, and represent a major area for policy intervention.
It was emphasised that support agencies need to overcome the stigma attached to asking for help among farming communities and off er a range of responsive and proactive services. Support must be multidimensional, refl ecting the wide range of stressors and their impacts among farming communities.
Source: Research Report 362 prepared by Policy Studies Institutes for the Health and Safety Executive, 2005. http://www.hse.gov.uk/RESEARCH/rrhtm/rr362.htm
Stress management in the catering trades
The catering trades are a high-risk sector for stress, which not only harms human health but also damages performance and competitiveness. Most of the stress arises from conditions that are characteristic of the sector. These include shift work, long periods standing up, heat, and emotional stress in dealing with customers.
The project was aimed at providing resources to help meet these challenges. It took the form of preparing general guidelines, coaching schemes and the establishment of ‘stress hotlines’. Training formats were tailored to the individual trades and included: workplace design, management style, work organisation and time management, stress management, handling complaints, employee and customer communications, recommendations for female entrepreneurs, and practical operating advice. For example, in Flanders, the team carried out a study into psychosocial stress in four diff erent small businesses (two restaurants, one training centre and one catering fi rm). By using the participatory risk analysis method, they identifi ed the psychosocial stresses and their causes and drew up options to alleviate them. Two workshops on psychosocial stress in the catering trade were run in Ghent and Turnhout, publicised in two specialist magazines and on the partners’ websites. The 20 German, Dutch and Belgian institutions representing more than 600,000 small and medium-sized enterprises (SMEs) were involved in the project.
Source: European Agency for Safety and Health at Work. http://sme.osha.europa.eu/publications/fs2002/2003/en/index_12.htm
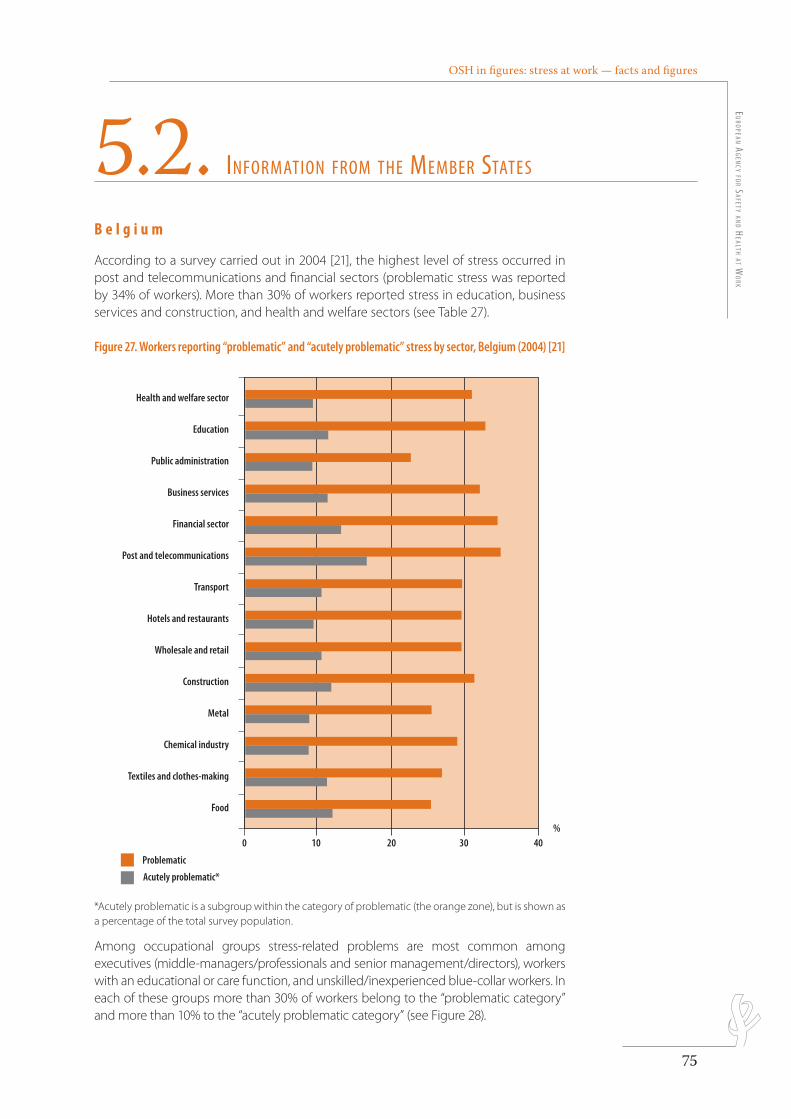
OSH in figures: stress at work — facts and figuresE
uro
pEan ag
Ency fo
r SafEty an
d HEaltH at W
ork
75
5.2. information from tHE mEmbEr StatES
B e l g i u m
According to a survey carried out in 2004 [21], the highest level of stress occurred in post and telecommunications and financial sectors (problematic stress was reported by 34% of workers). More than 30% of workers reported stress in education, business services and construction, and health and welfare sectors (see Table 27).
Figure 27. Workers reporting “problematic” and “acutely problematic” stress by sector, Belgium (2004) [21]
40%
3020100
Health and welfare sector
Education
Public administration
Business services
Financial sector
Post and telecommunications
Transport
Hotels and restaurants
Wholesale and retail
Construction
Metal
Textiles and clothes-making
Chemical industry
Food
Problematic
Acutely problematic*
police : Myriad pro semibold condensed 11 pt
ordre des couleurs : dernier dossier dans la palette(la couleur du fond est la première de la palette, les autres suivent dans l’ordre)
légende : à droite ou en dessous du graphique
Les repères dépassent de 2 mm et tous les traits sont à 0.5 ptles barres n’ont pas de contours
carrés sans contours 4x4 mm
*Acutely problematic is a subgroup within the category of problematic (the orange zone), but is shown as a percentage of the total survey population.
Among occupational groups stress-related problems are most common among executives (middle-managers/professionals and senior management/directors), workers with an educational or care function, and unskilled/inexperienced blue-collar workers. In each of these groups more than 30% of workers belong to the “problematic category” and more than 10% to the “acutely problematic category” (see Figure 28).
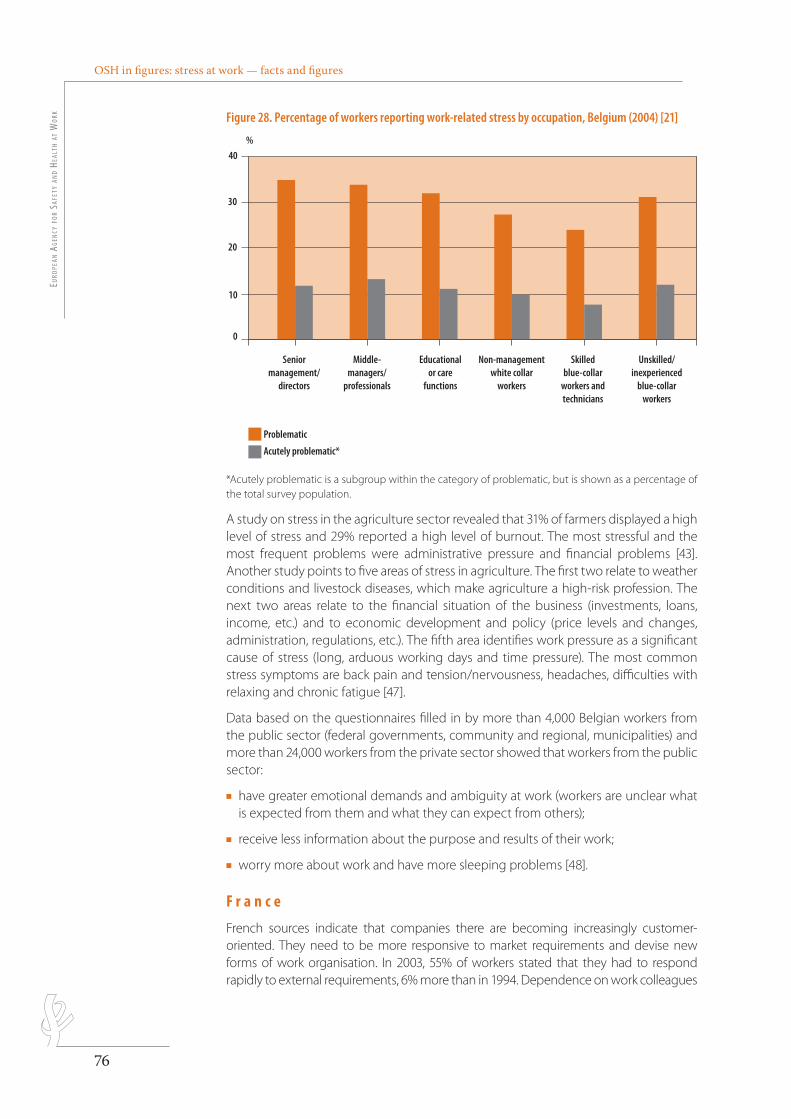
OSH in figures: stress at work — facts and figuresEu
ropE
an a
gEn
cy f
or
SafE
ty a
nd
HEal
tH a
t W
ork
76
Figure 28. Percentage of workers reporting work-related stress by occupation, Belgium (2004) [21]
Senior management/
directors
Middle-managers/
professionals
Educational or care
functions
Non-management white collar
workers
Skilled blue-collar
workers and technicians
Unskilled/inexperienced
blue-collar workers
40%
30
20
10
0
Problematic
Acutely problematic*
police : Myriad pro semibold condensed 11 pt
ordre des couleurs : dernier dossier dans la palette(la couleur du fond est la première de la palette, les autres suivent dans l’ordre)
légende : à droite ou en dessous du graphique
Les repères dépassent de 2 mm et tous les traits sont à 0.5 ptles barres n’ont pas de contours
carrés sans contours 4x4 mm
*Acutely problematic is a subgroup within the category of problematic, but is shown as a percentage of the total survey population.
A study on stress in the agriculture sector revealed that 31% of farmers displayed a high level of stress and 29% reported a high level of burnout. The most stressful and the most frequent problems were administrative pressure and financial problems [43]. Another study points to five areas of stress in agriculture. The first two relate to weather conditions and livestock diseases, which make agriculture a high-risk profession. The next two areas relate to the financial situation of the business (investments, loans, income, etc.) and to economic development and policy (price levels and changes, administration, regulations, etc.). The fifth area identifies work pressure as a significant cause of stress (long, arduous working days and time pressure). The most common stress symptoms are back pain and tension/nervousness, headaches, difficulties with relaxing and chronic fatigue [47].
Data based on the questionnaires filled in by more than 4,000 Belgian workers from the public sector (federal governments, community and regional, municipalities) and more than 24,000 workers from the private sector showed that workers from the public sector:
n have greater emotional demands and ambiguity at work (workers are unclear what is expected from them and what they can expect from others);
n receive less information about the purpose and results of their work;
n worry more about work and have more sleeping problems [48].
F r a n c e
French sources indicate that companies there are becoming increasingly customer-oriented. They need to be more responsive to market requirements and devise new forms of work organisation. In 2003, 55% of workers stated that they had to respond rapidly to external requirements, 6% more than in 1994. Dependence on work colleagues
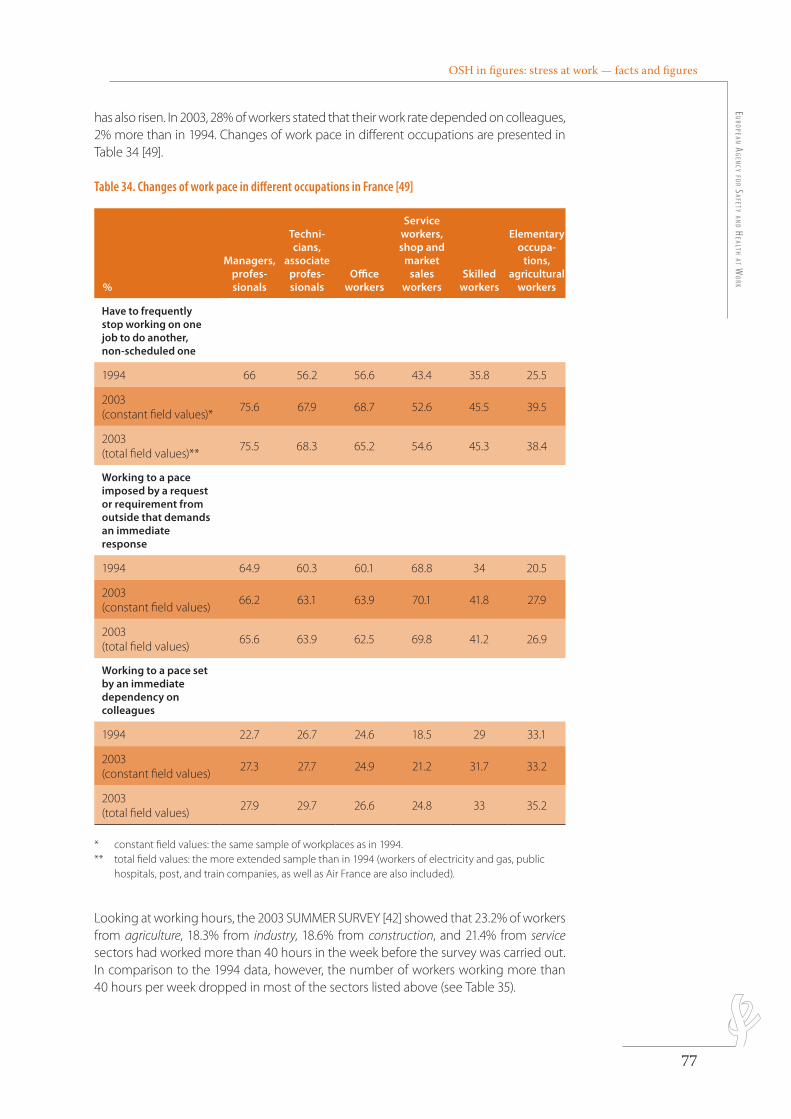
OSH in figures: stress at work — facts and figuresE
uro
pEan ag
Ency fo
r SafEty an
d HEaltH at W
ork
77
has also risen. In 2003, 28% of workers stated that their work rate depended on colleagues, 2% more than in 1994. Changes of work pace in different occupations are presented in Table 34 [49].
Table 34. Changes of work pace in different occupations in France [49]
%
Managers, profes-sionals
Techni-cians,
associate profes-sionals
Office workers
Service workers,shop and
marketsales
workersSkilled
workers
Elementary occupa-
tions, agricultural
workers
Have to frequently stop working on one job to do another, non-scheduled one
1994 66 56.2 56.6 43.4 35.8 25.5
2003 (constant field values)*
75.6 67.9 68.7 52.6 45.5 39.5
2003 (total field values)**
75.5 68.3 65.2 54.6 45.3 38.4
Working to a pace imposed by a request or requirement from outside that demands an immediate response
1994 64.9 60.3 60.1 68.8 34 20.5
2003 (constant field values)
66.2 63.1 63.9 70.1 41.8 27.9
2003 (total field values)
65.6 63.9 62.5 69.8 41.2 26.9
Working to a pace set by an immediate dependency on colleagues
1994 22.7 26.7 24.6 18.5 29 33.1
2003 (constant field values)
27.3 27.7 24.9 21.2 31.7 33.2
2003 (total field values)
27.9 29.7 26.6 24.8 33 35.2
* constant field values: the same sample of workplaces as in 1994. ** total field values: the more extended sample than in 1994 (workers of electricity and gas, public
hospitals, post, and train companies, as well as Air France are also included).
Looking at working hours, the 2003 SUMMER SURVEY [42] showed that 23.2% of workers from agriculture, 18.3% from industry, 18.6% from construction, and 21.4% from service sectors had worked more than 40 hours in the week before the survey was carried out. In comparison to the 1994 data, however, the number of workers working more than 40 hours per week dropped in most of the sectors listed above (see Table 35).
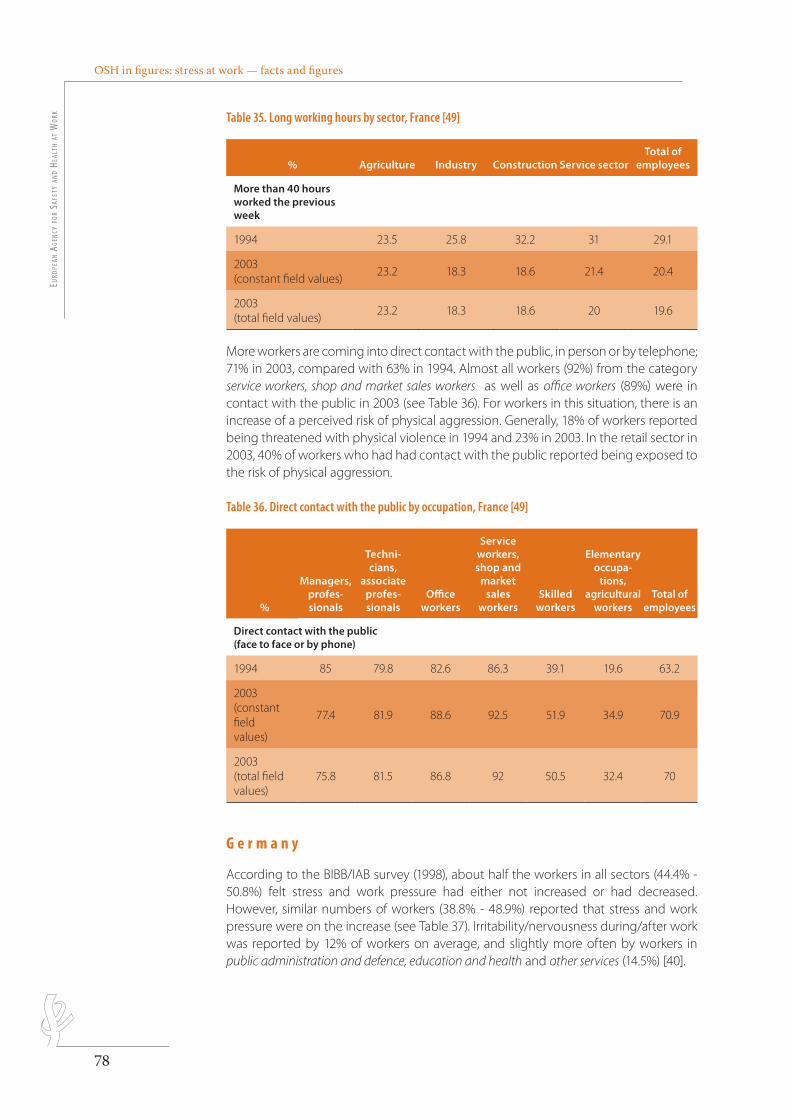
OSH in figures: stress at work — facts and figuresEu
ropE
an a
gEn
cy f
or
SafE
ty a
nd
HEal
tH a
t W
ork
78
Table 35. Long working hours by sector, France [49]
% Agriculture Industry Construction Service sectorTotal of
employees
More than 40 hours worked the previous week
1994 23.5 25.8 32.2 31 29.1
2003 (constant field values)
23.2 18.3 18.6 21.4 20.4
2003 (total field values)
23.2 18.3 18.6 20 19.6
More workers are coming into direct contact with the public, in person or by telephone; 71% in 2003, compared with 63% in 1994. Almost all workers (92%) from the category service workers, shop and market sales workers as well as office workers (89%) were in contact with the public in 2003 (see Table 36). For workers in this situation, there is an increase of a perceived risk of physical aggression. Generally, 18% of workers reported being threatened with physical violence in 1994 and 23% in 2003. In the retail sector in 2003, 40% of workers who had had contact with the public reported being exposed to the risk of physical aggression.
Table 36. Direct contact with the public by occupation, France [49]
%
Managers,profes-sionals
Techni-cians,
associate profes-sionals
Office workers
Service workers,shop and
marketsales
workersSkilled
workers
Elementary occupa-
tions, agricultural
workersTotal of
employees
Direct contact with the public (face to face or by phone)
1994 85 79.8 82.6 86.3 39.1 19.6 63.2
2003 (constant field values)
77.4 81.9 88.6 92.5 51.9 34.9 70.9
2003 (total field values)
75.8 81.5 86.8 92 50.5 32.4 70
G e r m a n y
According to the BIBB/IAB survey (1998), about half the workers in all sectors (44.4% - 50.8%) felt stress and work pressure had either not increased or had decreased. However, similar numbers of workers (38.8% - 48.9%) reported that stress and work pressure were on the increase (see Table 37). Irritability/nervousness during/after work was reported by 12% of workers on average, and slightly more often by workers in public administration and defence, education and health and other services (14.5%) [40].
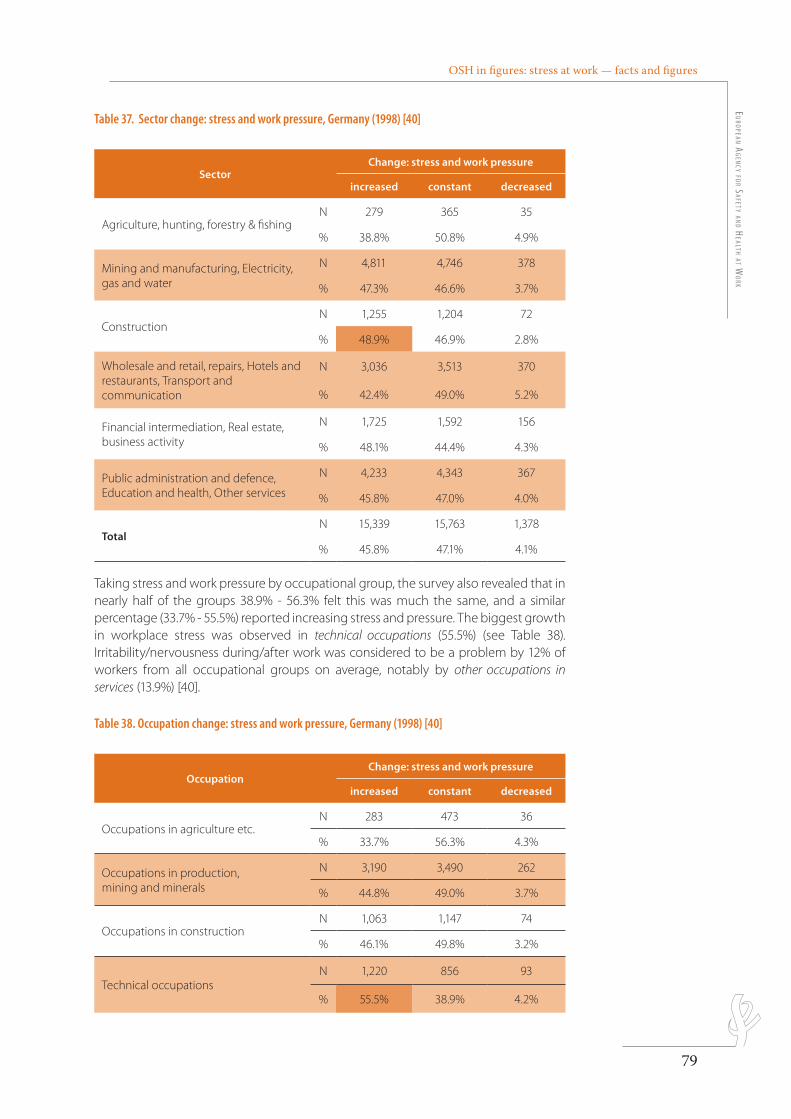
OSH in figures: stress at work — facts and figuresE
uro
pEan ag
Ency fo
r SafEty an
d HEaltH at W
ork
79
Table 37. Sector change: stress and work pressure, Germany (1998) [40]
SectorChange: stress and work pressure
increased constant decreased
Agriculture, hunting, forestry & fishingN 279 365 35
% 38.8% 50.8% 4.9%
Mining and manufacturing, Electricity, gas and water
N 4,811 4,746 378
% 47.3% 46.6% 3.7%
ConstructionN 1,255 1,204 72
% 48.9% 46.9% 2.8%
Wholesale and retail, repairs, Hotels and restaurants, Transport and communication
N 3,036 3,513 370
% 42.4% 49.0% 5.2%
Financial intermediation, Real estate, business activity
N 1,725 1,592 156
% 48.1% 44.4% 4.3%
Public administration and defence, Education and health, Other services
N 4,233 4,343 367
% 45.8% 47.0% 4.0%
TotalN 15,339 15,763 1,378
% 45.8% 47.1% 4.1%
Taking stress and work pressure by occupational group, the survey also revealed that in nearly half of the groups 38.9% - 56.3% felt this was much the same, and a similar percentage (33.7% - 55.5%) reported increasing stress and pressure. The biggest growth in workplace stress was observed in technical occupations (55.5%) (see Table 38). Irritability/nervousness during/after work was considered to be a problem by 12% of workers from all occupational groups on average, notably by other occupations in services (13.9%) [40].
Table 38. Occupation change: stress and work pressure, Germany (1998) [40]
OccupationChange: stress and work pressure
increased constant decreased
Occupations in agriculture etc.N 283 473 36
% 33.7% 56.3% 4.3%
Occupations in production, mining and minerals
N 3,190 3,490 262
% 44.8% 49.0% 3.7%
Occupations in constructionN 1,063 1,147 74
% 46.1% 49.8% 3.2%
Technical occupationsN 1,220 856 93
% 55.5% 38.9% 4.2%
OSH in figures: stress at work — facts and figuresEu
ropE
an a
gEn
cy f
or
SafE
ty a
nd
HEal
tH a
t W
ork
80
OccupationChange: stress and work pressure
increased constant decreased
TradersN 2,014 2,181 229
% 43.9% 47.5% 5.0%
Occupations in transportN 942 978 77
% 45.7% 47.4% 3.7%
Occupations in administration, in officesN 3,204 2,680 270
% 50.5% 42.3% 4.3%
Other occupations in servicesN 3,792 4,357 390
% 42.7% 49.1% 4.4%
TotalN 15,708 16,162 1,431
% 45.8% 47.1% 4.2%
G r e e c e
The survey carried out by the Hellenic Institute for Occupational Health and Safety (ELINYAE) [50] on the hotel sector revealed that 43.6% of workers suffered from stress “rather often”, or “often or almost always”. Among the workers who said they were required to work at a high speed, the majority (67.3%) suffered from stress “often or almost always”. Similarly, among workers who shouldered high responsibility, 65.4% reported suffering from stress “often or almost always”.
H u n g a r y
According to the ILO report “Safety and Health at the Workplace - Trade Union Experiences in Central and Eastern Europe” [51], serious complaints about stress, irritability, high blood pressure, and depression were reported in between 10% and 30% of Hungarian workplaces. Stress affected workers in primary production (in 38.6% of workplaces), services (30.8%), manufacturing (30.6%), and construction and energy (22.1%). The primary production sector also has the highest rate of stress symptoms such as irritability (25.9% of workplaces), depression (25.8%) and high blood pressure (24.1%) (see Figure 29).
(continued)
OSH in figures: stress at work — facts and figuresE
uro
pEan ag
Ency fo
r SafEty an
d HEaltH at W
ork
81
Figure 29. Stress-related symptoms in the workplaces of different industries, Hungary (2000) [51]
Primary Manufacturing Construction and energy Services
50
38.6
25.925.8 24.1
30.6
21.2
6.5
20.9 22.1
7.4
0
30.8
23.3
3.8
22.3
11.8
%
40
30
20
10
0
Stress
Irritability
Depression
High blood pressure
police : Myriad pro semibold condensed 11 pt
ordre des couleurs : dernier dossier dans la palette(la couleur du fond est la première de la palette, les autres suivent dans l’ordre)
légende : à droite ou en dessous du graphique
Les repères dépassent de 2 mm et tous les traits sont à 0.5 ptles barres n’ont pas de contours
carrés sans contours 4x4 mm
I r e l a n d
Irish data on accidents and injuries show that workers from public administration and health and social work sectors are, when compared to other sectors, particularly at risk of injuries caused by “shock, fright, violence of others” (between 4% and 7% of all reported injuries each year since 2004) and they were on the receiving end of incidents described as “injured by person – violent” (between 5% and 7% of all reported injuries in the same period) [28].
L a t v i a
The report “Working conditions and risks in Latvia. 2005-2007” shows that 51% of workers have contact with people from outside the company (buyers, passengers), and 42% of workers reported sometimes coming into conflict with people from outside. Conflicts with clients are most common in education (reported by 55% of respondents), and in health and social care sectors (52%). Health and social care workers are most exposed to physical violence or violence threats (18%), against the average for all respondents of 7%. They are also more likely to experience psychological harassment (31%) and sexual harassment (4%). Both physical and psychological violence are more prevalent in the public sector than in private companies.
Additionally, a significant number of workers admit that they have had workplace conflicts with managers (59%), colleagues (49%), and between groups of workers (27%). 35% of respondents say that discord they have experienced was caused by internal competition between workers. Discord between workers and managers is most prevalent in education (69%) and in metal, metal products and equipment mechanism manufacturing companies (68%). The majority of conflicts between workers occur in education (60%) and timber, wood and cork products, furniture sectors (65%). Conflicts between groups of workers and internal competition between workers are most common in the education sector (38% reporting conflict between groups of workers, and 54% internal competition between workers) [29].
OSH in figures: stress at work — facts and figuresEu
ropE
an a
gEn
cy f
or
SafE
ty a
nd
HEal
tH a
t W
ork
82
P o l a n d
The results of the study on the prevalence of work-related stress in different occupations, carried out by the means of a validated Polish questionnaire based on the Demand-Control-Support model of job stress, showed that the highest level of work-related stress was experienced by the following occupations: teachers (34%), medical staff (30.6%), government administration clerks (30.2%) and bank workers (29.6%) (see Figure 30) [52].
Figure 30. Prevalence of work-related stress in different occupations, Poland (1997- 2000) [52]
10
%
30 4020
Bank workers
Middle medical staff
Construction workers
Salesmen
Government and local government administration clerks
IT specialists
Public transport drivers
Teachers All occupations
29.6
30.6
18.1
24.8
30.2
21.2
34
22.9
26.6
Additionally, another study on psychosocial work conditions based on the same questionnaire and carried out among the same occupational groups revealed that [53]:
n Teachers (M=3.42) and drivers (M=3.41) obtained the highest scores on work demands. The lowest score was observed in construction workers (M=2.87).
n The lowest level of job control was observed in drivers (M=3.06), the highest one in computer scientists (M=3.44) and salesmen (M=3.43).
n Drivers scored lowest in social support (M=2.84), while the highest social support levels were reported among banking and insurance specialists (M=3.44).
n The highest level of well-being at work was reported by computer scientists (M=3.88), and the worst by teachers (M=3.65) and mid-level medical personnel (M=3.69).
The results of a study which aimed to diagnose post-traumatic stress disorder among policemen and firemen, suggested that 8.4% of the latter, and 4.4% of the former group were affected by PTSD (in 2003) [54]. Policemen and firemen involved in traumatic events coped with impaired well-being by taking sick leave (14.9%), or by taking medicine and tranquillisers (7.5%).
There is also data confirming that work-related violence is a significant problem among social workers, labourers and finance inspectors [55]. The most frequent forms of aggression are abuse and insults, but 14% of workers also said that they had been physically attacked at work. This problem was more frequently reported by women, and the group at the greatest risk of violence was social workers.
OSH in figures: stress at work — facts and figuresE
uro
pEan ag
Ency fo
r SafEty an
d HEaltH at W
ork
83
P o r t u g a l
A survey carried out by the General Direction of Health (DGS) in 2004 shows that 81% of hospitals and 77% of local health centres have registered complains about violence against health professionals, 54% of which involved physical assault [56].
A study on work-related stress in production companies (2005) [57] revealed that 14.7% of workers from this sector presented a high risk of developing health problems because of work-related stress, and 37.6% reported feeling the need to reduce stress.
S l o v e n i a
A study carried out among doctors revealed that 37% of them feel they are exposed to high stress at work, whereas 40% reported moderate stress, and 27% of doctors reported low stress at work. The reasons given for high stress levels were related to work duties, high demands and responsibility at work, work with patients who were ‘a nuisance’, high numbers of patients, having to report bad news about patients’ health and dealing with death. Physicians employed in the public sector were at highest risk of experiencing stress at work [58].
S p a i n
The Encuesta Nacional de Condiciones de Trabajo (2003, [31]) indicated that the sectors most influenced by stress are financial intermediation, and social services and other services. Workers from the financial intermediation sector were the ones who consulted a doctor most often about stress-related health issues (42.9%), while workers from the construction sectors were least likely to consult a doctor about stress at work (0.40%) (see Figure 31). Stress-related symptoms were most common in financial intermediation, social services and other services (around 6-7%), and least common in Construction (1%).
By occupation, stress was the most common reason for seeking medical advice among clerks (29%) and technicians (24%) (see Figure 32). Technicians, non-qualified workers, clerks and service workers were the occupations where an above-average percentage of workers reported stress-related symptoms (around 7-8%).
Figure 31. Workers who consulted a doctor for stress by sector, Spain (2003) [31]
Fina
ncia
l int
erm
edia
tion
Socia
l ser
vice
s
Who
lesa
le an
d re
tail/
hote
ls an
d re
stau
rant
s
Othe
r man
ufac
turin
g in
dust
ries
Othe
r ser
vice
s
Othe
r ind
ustri
es
Cons
truct
ion
Chem
istry
Met
al
50%
30
40
20
10
00,41,11,4
4,3
13,113,9
19,9
42,9
3
police : Myriad pro semibold condensed 11 pt
ordre des couleurs : dernier dossier dans la palette(la couleur du fond est la première de la palette, les autres suivent dans l’ordre)
légende : à droite ou en dessous du graphique
Les repères dépassent de 2 mm et tous les traits sont à 0.5 ptles barres n’ont pas de contours
carrés sans contours 4x4 mm
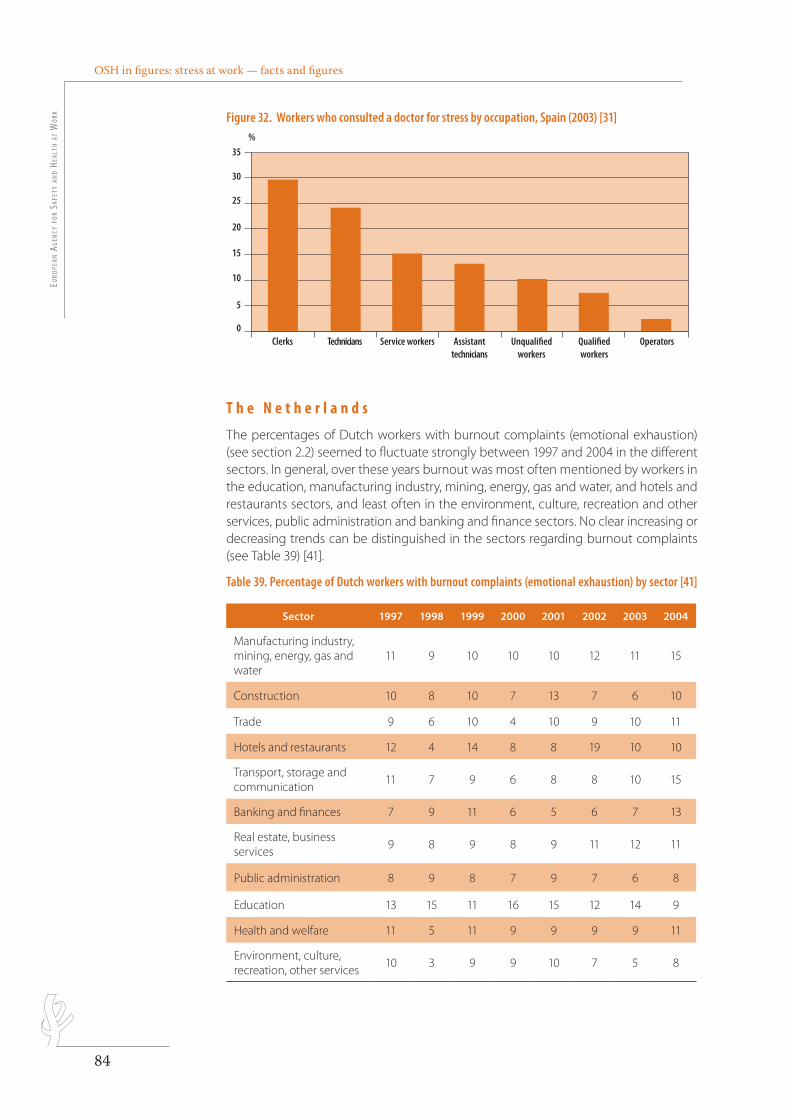
OSH in figures: stress at work — facts and figuresEu
ropE
an a
gEn
cy f
or
SafE
ty a
nd
HEal
tH a
t W
ork
84
Figure 32. Workers who consulted a doctor for stress by occupation, Spain (2003) [31]
Clerks Technicians Service workers Assistanttechnicians
Unqualifiedworkers
Qualified workers
Operators
35
30
%
25
20
15
10
5
0
police : Myriad pro semibold condensed 11 pt
ordre des couleurs : dernier dossier dans la palette(la couleur du fond est la première de la palette, les autres suivent dans l’ordre)
légende : à droite ou en dessous du graphique
Les repères dépassent de 2 mm et tous les traits sont à 0.5 ptles barres n’ont pas de contours
carrés sans contours 4x4 mm
T h e N e t h e r l a n d s
The percentages of Dutch workers with burnout complaints (emotional exhaustion) (see section 2.2) seemed to fluctuate strongly between 1997 and 2004 in the different sectors. In general, over these years burnout was most often mentioned by workers in the education, manufacturing industry, mining, energy, gas and water, and hotels and restaurants sectors, and least often in the environment, culture, recreation and other services, public administration and banking and finance sectors. No clear increasing or decreasing trends can be distinguished in the sectors regarding burnout complaints (see Table 39) [41].
Table 39. Percentage of Dutch workers with burnout complaints (emotional exhaustion) by sector [41]
Sector 1997 1998 1999 2000 2001 2002 2003 2004
Manufacturing industry, mining, energy, gas and water
11 9 10 10 10 12 11 15
Construction 10 8 10 7 13 7 6 10
Trade 9 6 10 4 10 9 10 11
Hotels and restaurants 12 4 14 8 8 19 10 10
Transport, storage and communication
11 7 9 6 8 8 10 15
Banking and finances 7 9 11 6 5 6 7 13
Real estate, business services
9 8 9 8 9 11 12 11
Public administration 8 9 8 7 9 7 6 8
Education 13 15 11 16 15 12 14 9
Health and welfare 11 5 11 9 9 9 9 11
Environment, culture, recreation, other services
10 3 9 9 10 7 5 8
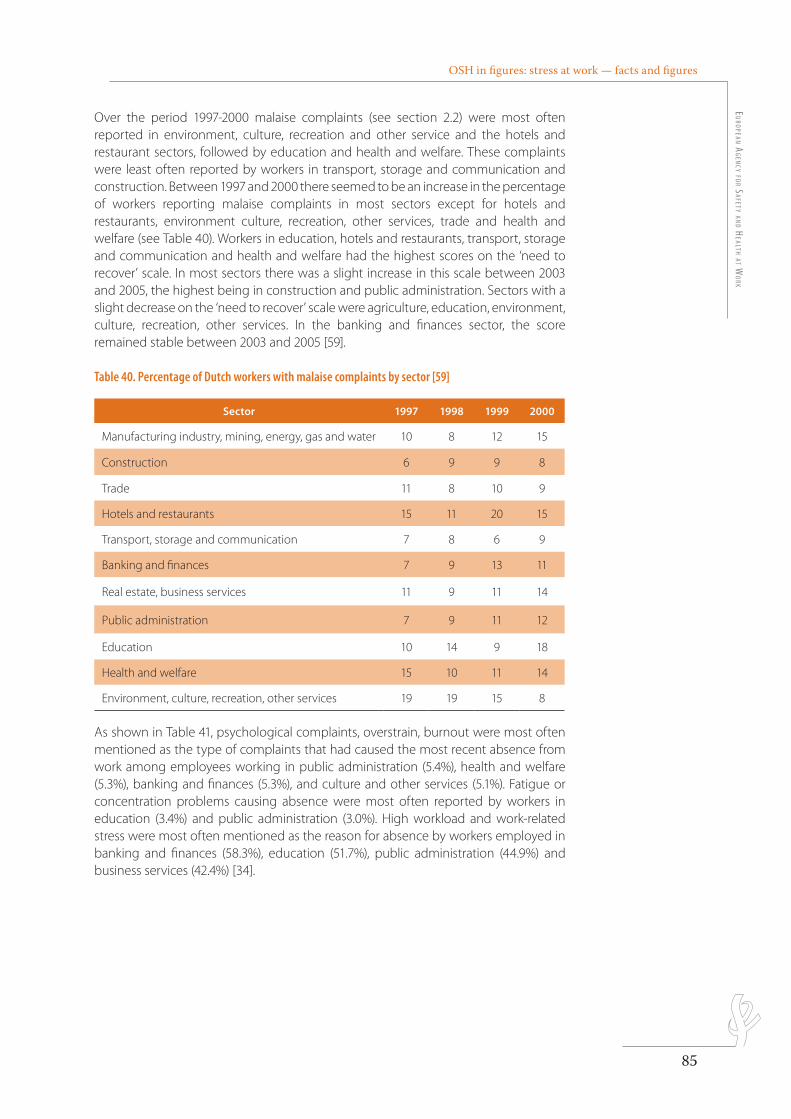
OSH in figures: stress at work — facts and figuresE
uro
pEan ag
Ency fo
r SafEty an
d HEaltH at W
ork
85
Over the period 1997-2000 malaise complaints (see section 2.2) were most often reported in environment, culture, recreation and other service and the hotels and restaurant sectors, followed by education and health and welfare. These complaints were least often reported by workers in transport, storage and communication and construction. Between 1997 and 2000 there seemed to be an increase in the percentage of workers reporting malaise complaints in most sectors except for hotels and restaurants, environment culture, recreation, other services, trade and health and welfare (see Table 40). Workers in education, hotels and restaurants, transport, storage and communication and health and welfare had the highest scores on the ‘need to recover’ scale. In most sectors there was a slight increase in this scale between 2003 and 2005, the highest being in construction and public administration. Sectors with a slight decrease on the ‘need to recover’ scale were agriculture, education, environment, culture, recreation, other services. In the banking and finances sector, the score remained stable between 2003 and 2005 [59].
Table 40. Percentage of Dutch workers with malaise complaints by sector [59]
Sector 1997 1998 1999 2000
Manufacturing industry, mining, energy, gas and water 10 8 12 15
Construction 6 9 9 8
Trade 11 8 10 9
Hotels and restaurants 15 11 20 15
Transport, storage and communication 7 8 6 9
Banking and finances 7 9 13 11
Real estate, business services 11 9 11 14
Public administration 7 9 11 12
Education 10 14 9 18
Health and welfare 15 10 11 14
Environment, culture, recreation, other services 19 19 15 8
As shown in Table 41, psychological complaints, overstrain, burnout were most often mentioned as the type of complaints that had caused the most recent absence from work among employees working in public administration (5.4%), health and welfare (5.3%), banking and finances (5.3%), and culture and other services (5.1%). Fatigue or concentration problems causing absence were most often reported by workers in education (3.4%) and public administration (3.0%). High workload and work-related stress were most often mentioned as the reason for absence by workers employed in banking and finances (58.3%), education (51.7%), public administration (44.9%) and business services (42.4%) [34].
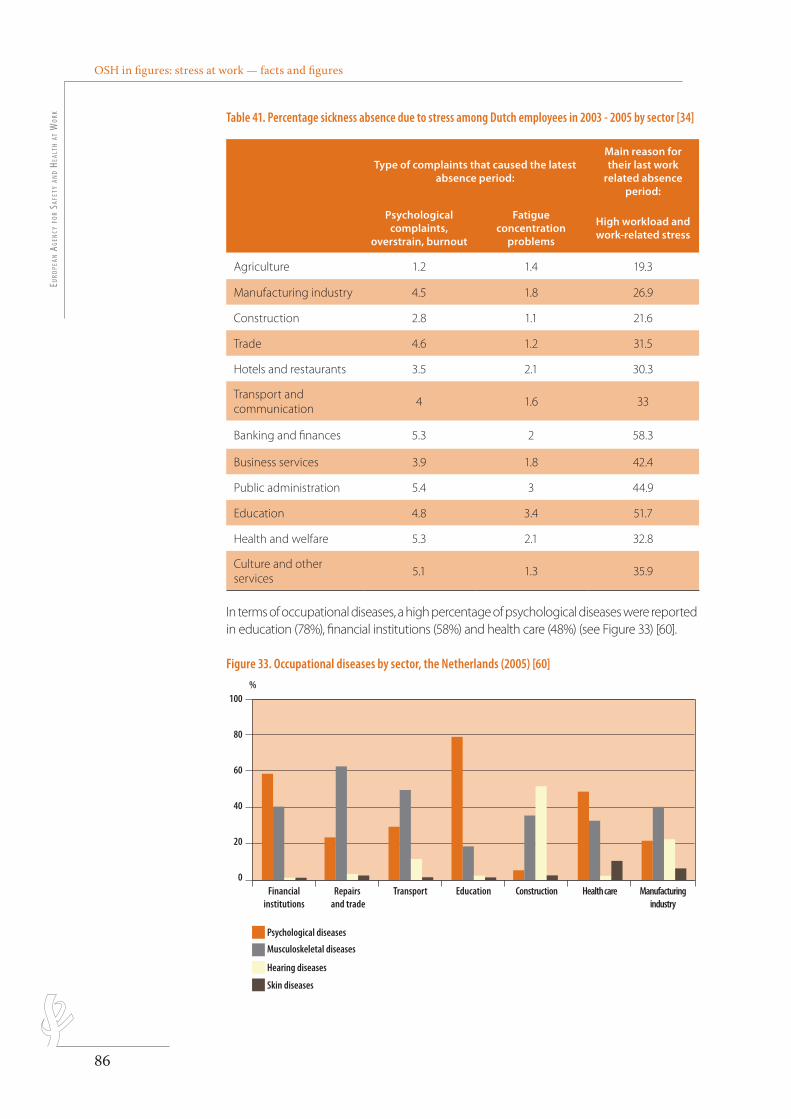
OSH in figures: stress at work — facts and figuresEu
ropE
an a
gEn
cy f
or
SafE
ty a
nd
HEal
tH a
t W
ork
86
Table 41. Percentage sickness absence due to stress among Dutch employees in 2003 - 2005 by sector [34]
Type of complaints that caused the latest absence period:
Main reason for their last work
related absence period:
Psychological complaints,
overstrain, burnout
Fatigue concentration
problems
High workload and work-related stress
Agriculture 1.2 1.4 19.3
Manufacturing industry 4.5 1.8 26.9
Construction 2.8 1.1 21.6
Trade 4.6 1.2 31.5
Hotels and restaurants 3.5 2.1 30.3
Transport and communication
4 1.6 33
Banking and finances 5.3 2 58.3
Business services 3.9 1.8 42.4
Public administration 5.4 3 44.9
Education 4.8 3.4 51.7
Health and welfare 5.3 2.1 32.8
Culture and other services
5.1 1.3 35.9
In terms of occupational diseases, a high percentage of psychological diseases were reported in education (78%), financial institutions (58%) and health care (48%) (see Figure 33) [60].
Figure 33. Occupational diseases by sector, the Netherlands (2005) [60]
100%
80
20
40
60
0Financial
institutionsRepairs
and tradeTransport Education Manufacturing
industryHealth careConstruction
Psychological diseases
Musculoskeletal diseases
Hearing diseases
Skin diseases
police : Myriad pro semibold condensed 11 pt
ordre des couleurs : dernier dossier dans la palette(la couleur du fond est la première de la palette, les autres suivent dans l’ordre)
légende : à droite ou en dessous du graphique
Les repères dépassent de 2 mm et tous les traits sont à 0.5 ptles barres n’ont pas de contours
carrés sans contours 4x4 mm
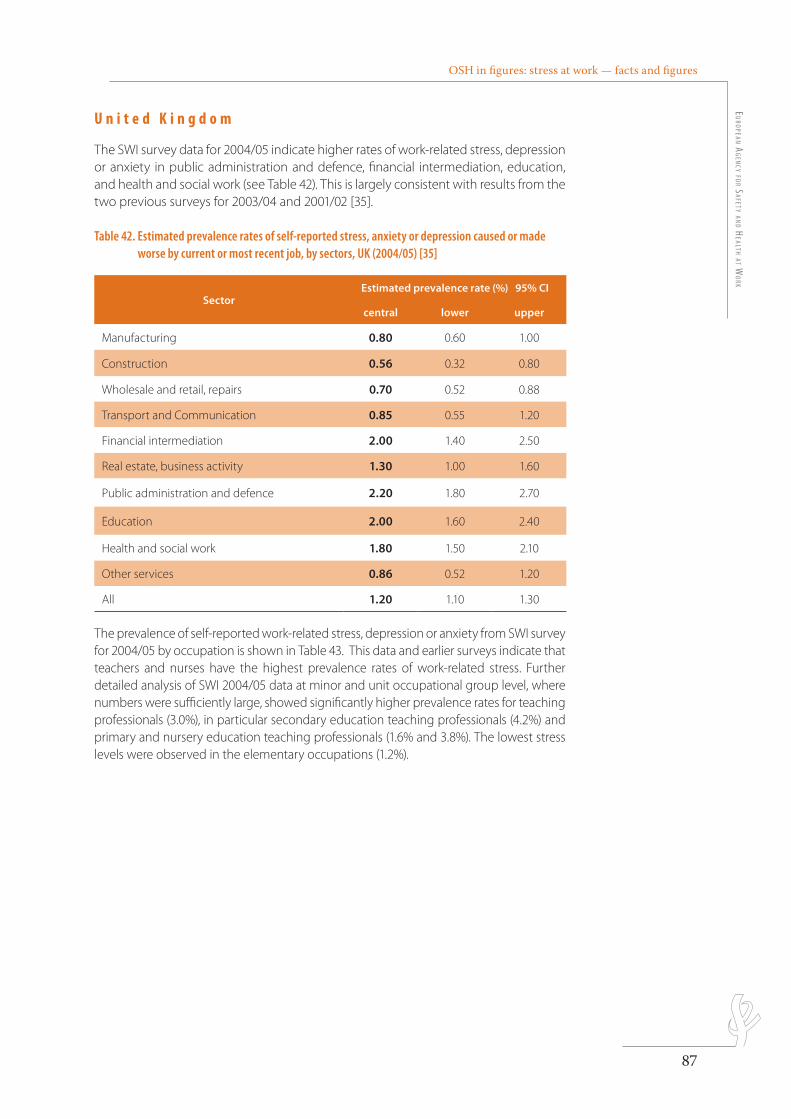
OSH in figures: stress at work — facts and figuresE
uro
pEan ag
Ency fo
r SafEty an
d HEaltH at W
ork
87
U n i t e d K i n g d o m
The SWI survey data for 2004/05 indicate higher rates of work-related stress, depression or anxiety in public administration and defence, financial intermediation, education, and health and social work (see Table 42). This is largely consistent with results from the two previous surveys for 2003/04 and 2001/02 [35].
Table 42. Estimated prevalence rates of self-reported stress, anxiety or depression caused or made worse by current or most recent job, by sectors, UK (2004/05) [35]
SectorEstimated prevalence rate (%) 95% CI
central lower upper
Manufacturing 0.80 0.60 1.00
Construction 0.56 0.32 0.80
Wholesale and retail, repairs 0.70 0.52 0.88
Transport and Communication 0.85 0.55 1.20
Financial intermediation 2.00 1.40 2.50
Real estate, business activity 1.30 1.00 1.60
Public administration and defence 2.20 1.80 2.70
Education 2.00 1.60 2.40
Health and social work 1.80 1.50 2.10
Other services 0.86 0.52 1.20
All 1.20 1.10 1.30
The prevalence of self-reported work-related stress, depression or anxiety from SWI survey for 2004/05 by occupation is shown in Table 43. This data and earlier surveys indicate that teachers and nurses have the highest prevalence rates of work-related stress. Further detailed analysis of SWI 2004/05 data at minor and unit occupational group level, where numbers were sufficiently large, showed significantly higher prevalence rates for teaching professionals (3.0%), in particular secondary education teaching professionals (4.2%) and primary and nursery education teaching professionals (1.6% and 3.8%). The lowest stress levels were observed in the elementary occupations (1.2%).
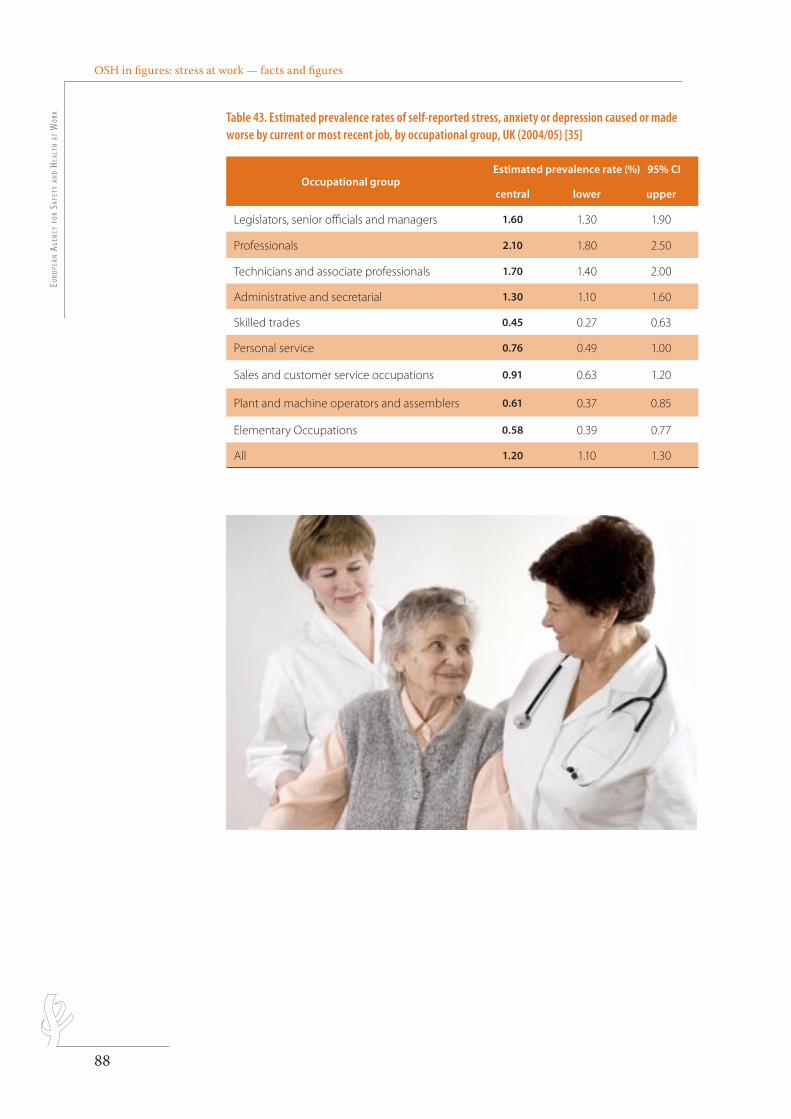
OSH in figures: stress at work — facts and figuresEu
ropE
an a
gEn
cy f
or
SafE
ty a
nd
HEal
tH a
t W
ork
88
Table 43. Estimated prevalence rates of self-reported stress, anxiety or depression caused or made worse by current or most recent job, by occupational group, UK (2004/05) [35]
Occupational groupEstimated prevalence rate (%) 95% CI
central lower upper
Legislators, senior officials and managers 1.60 1.30 1.90
Professionals 2.10 1.80 2.50
Technicians and associate professionals 1.70 1.40 2.00
Administrative and secretarial 1.30 1.10 1.60
Skilled trades 0.45 0.27 0.63
Personal service 0.76 0.49 1.00
Sales and customer service occupations 0.91 0.63 1.20
Plant and machine operators and assemblers 0.61 0.37 0.85
Elementary Occupations 0.58 0.39 0.77
All 1.20 1.10 1.30
OSH in fi gures: stress at work — facts and fi gures E
uro
pEan ag
Ency fo
r SafEty an
d HEaltH at W
ork
89
Preventing burnout in psychiatric care
Burnout often aff ects people working in the caring professions and notably in psychiatry. It may be damaging not only to the person concerned, but also to family and friends, organisation, colleagues and patients, and can in some cases force staff to leave their jobs altogether.
The aim of the Italian project was to develop training activities and procedures to combat burnout in psychiatric care in Italy and Greece. It set out to acquaint staff with the potential risks posed by their working environment and by their interpersonal relationships; to introduce preventive training in order to foresee and manage stress; to train managers in order to eliminate the organisational and psychosocial factors contributing to burnout; and to train staff in relaxation techniques and in improved stress management strategies.
During the fi rst stage, an eight-page information leafl et on burnout was widely distributed in Italy and Greece. It described the project, burnout and its symptoms, the problems it causes and suggested remedies. In Greece a CD on relaxation techniques was also produced. Subsequently, a handbook that covered the syndrome and its symptoms; remedial measures; useful strategies to prevent stress caused by ’disturbing emotions’ arising from contact with psychiatric patients; ways to manage interpersonal relations with colleagues in order to prevent stress; self-protection strategies to cope with interpersonal and organisational stress; and organisational methods most likely to avoid burnout in caring institutions was produced. The project was publicised by newspaper articles, and television and radio broadcasts in Italy and Greece.
Source: European Agency for Safety and Health at Work http://sme.osha.europa.eu/publications/fs2002/2003/en/index_14.htm
The European NEXT-Study
The NEXT-Study investigated the reasons, circumstances and consequences surrounding premature departure from the nursing profession. The project was fi nanced by the European Commission, coordinated by the University of Wuppertal (Germany), and carried out simultaneously in Belgium, Finland, France, Germany, Great Britain, Italy, the Netherlands, Poland, Sweden and Slovakia. The study began in February 2002 and run until June 2005, and it brought together interdisciplinary expertise from e.g. nurses, nursing scientists, (occupational health) physicians, psychologists, sociologists and statisticians.
The situation of nurses in diff erent European countries was analysed in relation to aspects such as burnout, commitment, eff ort-reward-imbalance, infl uence at work/decision latitude, intention to leave nursing, job satisfaction, meaning of work, physical load, social work environment, work ability index, and work-home interference. The results of the studies carried out in the frame of this project are available at http://www.next.uni-wuppertal.de/index.html.
OSH in fi gures: stress at work — facts and fi gures Eu
ropE
an a
gEn
cy f
or
SafE
ty a
nd
HEal
tH a
t W
ork
90
E u r o p e a n A g e n c y f o r S a f e t y a n d H e a l t h a t W o r k
EUROPEAN RISK OBSERVATORY REPORT
Combating stress in vehicle repair shops
An Austrian vehicle repair company was already aware of an increase in stress levels among its workforce, arising from changing and more demanding tasks, and believed that these were an important contributory factor to sickness and absenteeism. The research carried out in the course of this project seemed to bear out their concerns as they found a much higher than average rate of absenteeism through sickness.
This project was about the management and prevention of stress within the wider context of occupational safety and health and the quality of the working environment in a vehicle repair workshop and dealership. They sought to tackle the problem through a health management system and through health forums in which staff could talk about their problems and discuss measures to improve the quality of the working environment. They adopted a ‘bottom up’ approach, involving staff heavily in the implementation of the project. This had the advantage of gaining wider and more sustained acceptance within the company. Through questionnaires and an outside analysis of sick leave they tried to get an accurate picture of stress factors in the company’s working life. They refi ned this and looked for solutions during a series of regular health forums for each of six departments, moderated by external health professionals. There were 43 meetings in all with a total of 37 staff for a minimum of two hours each session. All staff were invited to attend on a voluntary basis, but top management were excluded to avoid unduly infl uencing staff .
The results were summarised in a set of guidelines on ‘Stress in the workplace in an automotive company’. These were infl uenced by a variety of factors specifi c to the company, but are likely to be of value to other similar companies as well.
Source: European Agency for Safety and Health at Work http://sme.osha.europa.eu/publications/fs2002/2003/en/index_24.htm
E u r o p e a n A g e n c y f o r S a f e t y a n d H e a l t h a t W o r k
EUROPEAN RISK OBSERVATORY REPORT
STRESS BY EMPLOYMENT STATUS
6.
OSH in figures: stress at work — facts and figuresEu
ropE
an a
gEn
cy f
or
SafE
ty a
nd
HEal
tH a
t W
ork
92
The EWCS data (2005) revealed that well-being scores for self-employed workers are lower than for employed workers: 41% of the former consider that work has an adverse impact on their health, and 25% suffer from stress at work. The corresponding figures for employed workers are 33% and 21% respectively. The figures for detailed well-being indices, such as irritability, overall fatigue, sleeping problems and anxiety were also less advantageous for the self-employed (see Figure 34). However, it is worth noting that the results of the 2001 survey showed stress more often affected the self-employed who employed staff (40%), than the employed (29%), or those self-employed who did not hire any staff (24%) [14].
Figure 34. Workers reporting health problems and stress by employment status (2005) [14]
stress overallfatigue
sleepingproblems
anxiety irritability headaches heartdisease
30%
20
24.9
21.3
27.3
20.2
9.48.1 9
7.6
11.2 10.4
14.3
17.3
3.31.8
10
0
Self-employed
Employee
police : Myriad pro semibold condensed 11 pt
ordre des couleurs : dernier dossier dans la palette(la couleur du fond est la première de la palette, les autres suivent dans l’ordre)
légende : à droite ou en dessous du graphique
Les repères dépassent de 2 mm et tous les traits sont à 0.5 ptles barres n’ont pas de contours
carrés sans contours 4x4 mmThe above trend was already discernable in the results from EWCS 1995 and 2000 [15, 17], although it was much less evident when compared to the 2005 figures. Also, in 1995 and 2000, self-employed workers tended to report more often than other groups that work adversely impacted their health, but stress indices were higher for this group only in 1995 and had not increased in the 2000 survey (see Table 44). The number of self-employed workers reporting irritability was particularly low. However, other stress indices such as overall fatigue and anxiety were higher (see Table 45).
Among employed workers, the type of employment contract they have affects stress levels and detailed stress-related indices. Identifying four contract types – permanent contract, fixed term contract, temporary contract and apprenticeship – the studies showed that workers with permanent contracts displayed the highest stress levels both in 1995 and 2000. Some detailed well-being indices were also less favourable for this group in the 2000 survey, including irritability, sleeping problems, and anxiety (see Tables 44 and 45). The higher levels of stress, depression and anxiety among workers with permanent contracts compared to those with temporary contracts was also seen in Eurostat’s data (from 1999) [42].
6.1. rEl ationSHip WitH EmploymEnt StatuS – gEnEr al prEvalEncE and trEndS
Well-being scores for self-employed workers are lower than for employed workers
Workers with permanent contracts display the highest levels of stress
OSH in figures: stress at work — facts and figuresE
uro
pEan ag
Ency fo
r SafEty an
d HEaltH at W
ork
93
Table 44. Percentage of workers reporting health problems and stress by employment status, EU15 [15, 17]
Employment statusWork affects my health Stress
1995 2000 1995 2000
Self-employed 60.3 63.2 33.1 27.4
Employed 55.8 59.4 26.8 28.2
Employed, on a permanent basis 56.8 59.6 27.9 29.5
Employed, on a fixed term contract 50.6 62.3 21.7 25.7
Employed, on a temporary employment agency contract
55.8 48.7 23.7 14.1
On apprenticeship or other training scheme
44.0 61.0 14.1 18.6
EU 56.6 59.9 27.8 28.0
Table 45. Percentage of workers reporting stress-related symptoms by employment status, EU15 [15, 17]
Employment statusIrritability
Overall fatigue
Sleeping problems
Anxiety
1995 2000 1995 2000 1995 2000 1995 2000
Self-employed 10.4 9.4 23.1 28.6 7.6 6.8 11.5 9.5
Employed 11.1 10.8 19.1 22.3 6.8 8.2 6.5 6.9
Employed, on a permanent basis
11.2 11.1 18.5 21.8 7.3 8.8 6.6 7.1
Employed, on a fixed term contract
11.0 9.2 22.9 25.6 5.0 5.9 5.2 6.6
Employed, on a temporary employment agency contract
10.4 7.6 22.1 23.7 4.6 2.9 7.3 5.5
On apprenticeship or other training scheme
7.3 9.7 16.1 17.0 2.5 4.6 6.7 4.3
EU 10.9 10.5 19.9 23.2 6.4 7.9 7.3 7.3
V i o l e n c e a n d h a r a s s m e n t
While reported threats of physical violence are more prevalent among employees than self-employed workers (6.4% and 4.9% respectively in 2005), actual physical violence is reported by a similar number of workers from both groups (4.5% of employees and 4.4% of the self-employed).
Employees are more often subjected to harassment (5.6% in 2005) than the self-employed (2.8%). For unwanted sexual attention the figures are similar; 1.8% in the former group, and 1.5% in the latter [14].
OSH in fi gures: stress at work — facts and fi gures Eu
ropE
an a
gEn
cy f
or
SafE
ty a
nd
HEal
tH a
t W
ork
94
Tackling psychosocial problems in the workplace
The Spanish project “PSICORISC” sets out to help organisations identify, understand, and manage psychosocial risks and problems. The overall objective was to improve the health of workplaces and reduce the accidents and absenteeism that arise from stress, fatigue and a generally unsatisfactory working environment.
Using the web page, businesses interested in the project could register and members of their workforce could take tests that enabled the project team to evaluate the psychosocial risks at their workplace. The business would then receive the results and specifi c recommendations. They chiefl y focused on ways to overcome stress, avoid burnout, improve work environment, prevent mobbing (harassment), improve relationships within the workplace, enhance employees’ self-esteem, and provide incentives for further training. As a result, a ‘Manual of healthy workplace behaviour’, as wells as reports and conclusions from participating companies were produced. An e-mail service for dealing with queries was also provided.
The project also carried out a public relations campaign to raise awareness of psychosocial risks in the workplace, aiming in particular at those sections of the media specialising in labour aff airs and business news. A number of radio stations carried stories, interviews and debates. There were also newspaper and magazine articles and reports about the project and the issues that arose.
Source: European Agency for Safety and Health at Work http://sme.osha.europa.eu/publications/fs2002/2003/en/index_69.htm
6.2. information from tHE mEmbEr StatES
B e l g i u m
The WBM study (2004) revealed small but remarkable discrepancies between permanent and temporary workers in terms of stress. 29% of permanent workers and 25.5% of temporary workers reported that work-related stress posed a problem for them (see Figure 35). The survey also captured the diff erences between full-time and non-full-time workers. The full-time workers more often tended to report stress as a problem - 29% - and 10.4% of them considered stress to be an acute problem (the respective fi gures for non-full-time workers were 24.7% and 8.4%) [21].
OSH in figures: stress at work — facts and figuresE
uro
pEan ag
Ency fo
r SafEty an
d HEaltH at W
ork
95
Figure 35. Workers reporting work stress by employment status, Belgium (2004) [21]
10090
80
70
60
71
29
10.3
74.5
25.5
8.8
50
40
30
20
10
0
%
TemporaryFixed
Non - problematic
Problematic
Acutely problematic
police : Myriad pro semibold condensed 11 pt
ordre des couleurs : dernier dossier dans la palette(la couleur du fond est la première de la palette, les autres suivent dans l’ordre)
légende : à droite ou en dessous du graphique
Les repères dépassent de 2 mm et tous les traits sont à 0.5 ptles barres n’ont pas de contours
carrés sans contours 4x4 mm *Acutely problematic is a subgroup within the category of problematic, but is shown as a percentage of the total survey population
F i n l a n d
The Finnish study Work and Health (1997-2006) [39] revealed the highest level of stress among seasonal workers (16.7% in 2006). Work-related stress also appears to be more common among the self-employed with no staff than among the employed. Finnish permanent workers reported higher stress levels than fixed-term contract employees. Nevertheless, in 2006, in all of these groups, the level of stress was almost the same (10.1% among the self-employed, 9.9% among fixed-term contract employees and 9.4% among the permanently employed).
It should be noted that 2006 saw a significant fall in the stress index for the self-employed (10.1% in comparison to 19.7% in 1997), for workers employed on permanent contracts (from 16% in 1997 to 9.4% in 2006) and for fixed-term contract holders (from 13.2% to 9.9%). In the case of seasonal and casual workers, an increase of the level of stress experienced was seen in 2000 and 2003 (from 12.5% in 1997 to 16.7% in 2000 and 19.4% in 2003). There was a small decrease in these figures in 2006 (to 16.7%) (see Table 46). Respondents from this group were largely employed in sectors such as construction, health service and other service sectors.
Table 46. Prevalence of stress by employment status, Finland [39]
Year N Not at all Only a little To some extent Rather
Permanent
1997 1,558 24.4 26.4 33.1 16.0
2000 1,508 28.3 23.3 34.9 13.5
2003 1,739 26.1 30.5 31.7 11.7
OSH in figures: stress at work — facts and figuresEu
ropE
an a
gEn
cy f
or
SafE
ty a
nd
HEal
tH a
t W
ork
96
Year N Not at all Only a little To some extent Rather
2006 1,643 33.0 29.9 27.6 9.4
Fixed-term contract
1997 213 23.0 37.6 26.3 13.2
2000 221 32.1 23.5 34.4 10.0
2003 261 25.3 32.6 32.2 10.0
2006 232 29.3 30.2 30.6 9.9
Seasonal or irregular
1997 40 32.5 30.0 25.0 12.5
2000 35 48.6 14.3 20.0 17.1
2003 31 22.6 16.1 41.9 19.4
2006 36 38.9 27.8 16.7 16.7
Self-employed
1997 218 22.0 26.2 32.1 19.7
2000 199 28.6 21.6 33.2 16.6
2003 213 20.2 26.3 32.4 21.1
2006 237 32.5 28.7 28.7 10.1
G e r m a n y
The BIBB/IAB surveys revealed that permanent workers are more likely to be affected by increased work-related stress (46.5% in 1998) than temporary workers (34%) (see Table 47). Work under time pressure was also more common among permanent workers (15% reported that they worked under pressure virtually always, and 29% often) than among temporary workers (12.1% and 23.8% respectively). Health problem figures were also slightly lower for temporary workers (see Figure 36) [40].
Table 47. Change in stress and work pressure by employment status, Germany (1998) [40]
Employment statusChange: stress and work pressure
increased constant decreased
temporaryN 978 1,503 204
% 34.0% 52.2% 7.1%
permanentN 11,563 11,792 901
% 46.5% 47.4% 3.6%
(continued)
OSH in figures: stress at work — facts and figuresE
uro
pEan ag
Ency fo
r SafEty an
d HEaltH at W
ork
97
Figure 36. Health problems by employment status, Germany (1998) [40]
Generalfatigue
Headache Sleepingdisorders
Irritability /nervousness
Digestivedisorders
Heartcomplaints
2017.9 18.6
17 17.5
6.47.8
9.6
3.54.8
1.72.9
11.5
10
0
Temporary
Permanent
%
S p a i n
Spanish permanent workers were the group most likely to seek a doctor’s advice in relation to their work-related stress (as many as 92.1% of all employed in 2003) (see Table 48). However, the group in which stress symptoms were most common and yet where individuals did not seek medical advice were apprentices or participants in training courses (28.4%) (see Table 49) [31].
Table 48. Workers (%) who consult a doctor for stress by employment status, Spain (2003) [31]
Employment status Stress Total
Employed, on a permanent basis 92.10 84.00
Employed, on a fixed-term contract 2.70 11.40
On apprenticeship or other training scheme 1.40 2.80
Other 3.50 1.40
Table 49. Workers with symptoms of stress by employment status, Spain (2003) [31]
Possible case of stress
Employment status n % n total
Employed, on a permanent basis 253 5.89 4,298
Employed, on a fixed-term contract 19 4.55 675
On apprenticeship or other training scheme
16 28.44 170
Other 7 16.67 42
OSH in figures: stress at work — facts and figuresEu
ropE
an a
gEn
cy f
or
SafE
ty a
nd
HEal
tH a
t W
ork
98
The VI ENCT carried out in 2007 showed that workers employed on temporary contracts have less control over their work compared to those with permanent contracts (see Figure 37). Not being allowed to take a holiday at the time of their choosing was reported by 24.2% of workers with permanent contracts and 36.5% of workers with temporary contracts, not being allowed to put their own ideas into practice: 11.2% and 19.5% respectively, to decide the order of tasks: 22.2% and 35.1%, to choose methods of work: 24.5% and 36.8%, rhythm of work: 23.7% and 35.7, and when to take breaks: 24.3% and 36.9% [32].
Figure 37. Lack of control at work reported by workers on permanent and temporary contracts, Spain (2007) [32]
Terms ofholidays
Methods ofwork
BreaksRhythm of workOrder of tasksEmploying own ideas
100
90
80
70
60
50
40
20
10
30
0
24.4
36.5
11.219.5 22.2
35.1
21.5
36.8
23.7
35.7
24.3
36.9
Permanent
Temporary
police : Myriad pro semibold condensed 11 pt
ordre des couleurs : dernier dossier dans la palette(la couleur du fond est la première de la palette, les autres suivent dans l’ordre)
légende : à droite ou en dessous du graphique
Les repères dépassent de 2 mm et tous les traits sont à 0.5 ptles barres n’ont pas de contours
carrés sans contours 4x4 mm
OSH in fi gures: stress at work — facts and fi gures E
uro
pEan ag
Ency fo
r SafEty an
d HEaltH at W
ork
99
Diagnosing psychosocial problems in SMEs
The Danish project was aimed at improving working conditions, psychosocial health, and reducing stress in small businesses by developing methods to diagnose risk and strengthen work on safety and health issues.
A series of seminars and interviews with medium-sized companies (50-500 employees) were organised. The companies chosen had had substantial experience of improving the psychosocial working environment, in order to agree on good practice in this fi eld. Through interviews and discussions diagnostic tools to identify psychosocial risks, and a methodology that could easily be used by companies of a similar size, were developed.
As a result of the project, a manual “One big family – making the small business an attractive workplace” (available in Danish and English) was developed. It consists of the following chapters:
1. Why bother about the psychosocial climate when everything’s running so smoothly?
2. Visible problems and warning signs.
3. The small business – a productive family. A chapter about the importance of social relations.
4. The production process. A chapter about the relation between the production process and the psychosocial working environment.
5. Doing a job you enjoy.
6. Is there a good way to fi nd good solutions?
7. Typical situations and interventions that address a range of stress-related problems.
8. Shifting the focus to the demands of the job – a checklist.
A website that carries a more interactive version of the manual, leading the reader from one issue to other related chapters, descriptions and tools was also launched.
Source: European Agency for Safety and Health at Work http://sme.osha.europa.eu/publications/fs2002/2003/en/index_28.htm

E u r o p e a n A g e n c y f o r S a f e t y a n d H e a l t h a t W o r k
EUROPEAN RISK OBSERVATORY REPORT
E u r o p e a n A g e n c y f o r S a f e t y a n d H e a l t h a t W o r k
EUROPEAN RISK OBSERVATORY REPORT
7.EMERGING PSYCHOSOCIAL RISKS -
EXPERTS’ SURVEYS
OSH in fi gures: stress at work — facts and fi gures Eu
ropE
an a
gEn
cy f
or
SafE
ty a
nd
HEal
tH a
t W
ork
102
Signifi cant changes in the world of work during recent decades bring new challenges for workers’ safety and health. The need to identify and anticipate emerging risks related to occupational safety and health (OSH) has been emphasised on several occasions at the European level. More particularly, the Community strategy on health and safety at work 2002-2006 mandated the European Agency for Safety and Health at Work to set up a risk observatory. In order to realise its objectives, the European Risk Observatory identifi ed and explored emerging occupational safety and health risks by two means; fi rstly, an expert survey using the Delphi method and, secondly, the analysis of scientifi c literature. In this way, the targeting of resources and the development of interventions and strategies to tackle emerging risks can be made more timely, better planned, and overall eff ectiveness enhanced.
The forecast on psychosocial risks refl ects the views of experts in the fi eld who completed three questionnaire-based surveys in 2003 and 2004 [12]. 62 experts in the fi rst survey round, and 79 experts in the second and third rounds, were invited to participate in the survey. The response rate varied between 45% (fi rst survey round), 27% (second survey round) and 21% (third survey round). The experts represented 13 Member States of the European Union, the USA and International Labour Organisation (ILO), and they had at least fi ve years’ experience in the fi eld of OSH and psychosocial risks. They mostly worked in the fi eld of psychological research and many were also involved in consulting, teaching and training activities. Some had roles in labour inspection and policy development.
What are emerging risks?
An ‘emerging OSH risk’ has been defi ned as any occupational risk that is both new and increasing.
By new, it is meant that:
n the risk was previously unknown and is caused by new processes, new technologies, new types of workplace, or social or organisational change; or
n a long-standing issue is newly considered as a risk due to a change in social or public perceptions; or
n new scientifi c knowledge allows a long-standing issue to be identifi ed as a risk.
The risk is increasing if:
n the number of hazards leading to the risk is growing; or
n the likelihood of exposure to the hazard leading to the risk is increasing (exposure level and/or the number of people exposed); or
n the eff ect of the hazard on workers’ health is getting worse (seriousness of health eff ects and/or the number of people aff ected).
7.1. E x p E r t f o r E c a S t o n E m E r g i n g p S y c H o S o c i a l r i S k S
Three questionnaire-based surveys were carried out to identify emerging psychosocial risks
Emerging risks were identifi ed by means of the Delphi method and the analysis of scientifi c literature
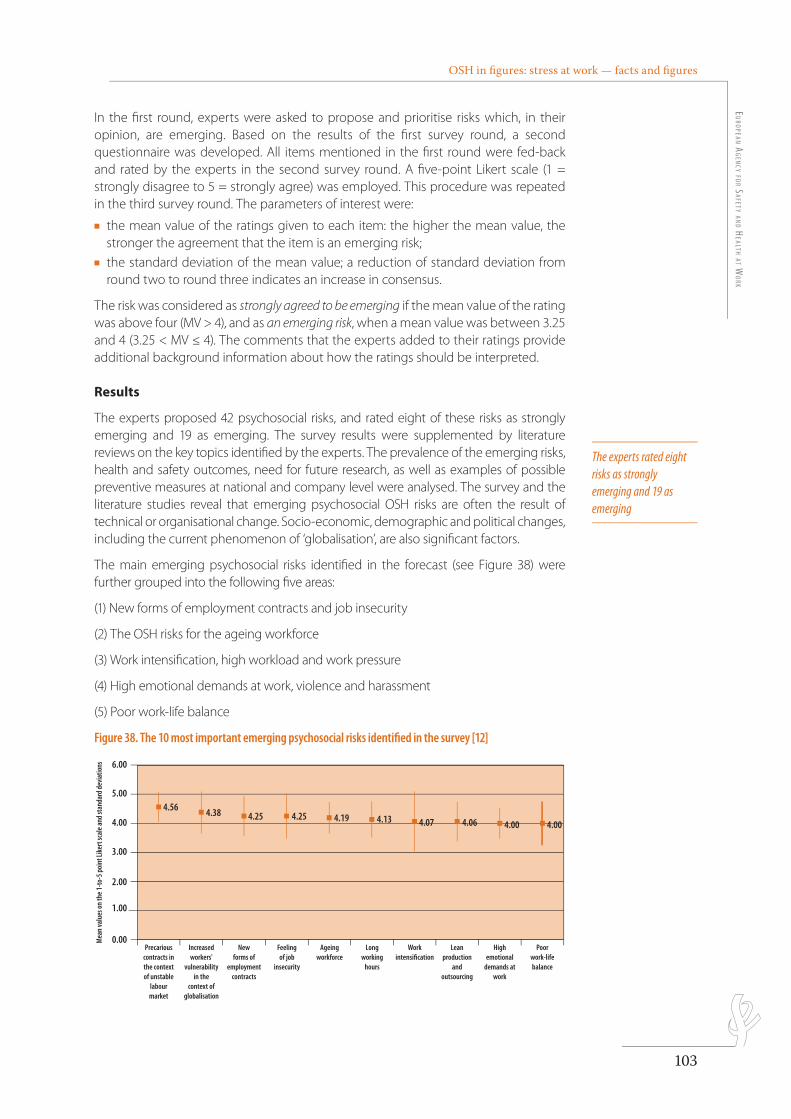
OSH in fi gures: stress at work — facts and fi gures E
uro
pEan ag
Ency fo
r SafEty an
d HEaltH at W
ork
103
In the fi rst round, experts were asked to propose and prioritise risks which, in their opinion, are emerging. Based on the results of the fi rst survey round, a second questionnaire was developed. All items mentioned in the fi rst round were fed-back and rated by the experts in the second survey round. A fi ve-point Likert scale (1 = strongly disagree to 5 = strongly agree) was employed. This procedure was repeated in the third survey round. The parameters of interest were:
n the mean value of the ratings given to each item: the higher the mean value, the stronger the agreement that the item is an emerging risk;
n the standard deviation of the mean value; a reduction of standard deviation from round two to round three indicates an increase in consensus.
The risk was considered as strongly agreed to be emerging if the mean value of the rating was above four (MV > 4), and as an emerging risk, when a mean value was between 3.25 and 4 (3.25 < MV ≤ 4). The comments that the experts added to their ratings provide additional background information about how the ratings should be interpreted.
Results
The experts proposed 42 psychosocial risks, and rated eight of these risks as strongly emerging and 19 as emerging. The survey results were supplemented by literature reviews on the key topics identifi ed by the experts. The prevalence of the emerging risks, health and safety outcomes, need for future research, as well as examples of possible preventive measures at national and company level were analysed. The survey and the literature studies reveal that emerging psychosocial OSH risks are often the result of technical or organisational change. Socio-economic, demographic and political changes, including the current phenomenon of ‘globalisation’, are also signifi cant factors.
The main emerging psychosocial risks identifi ed in the forecast (see Figure 38) were further grouped into the following fi ve areas:
(1) New forms of employment contracts and job insecurity
(2) The OSH risks for the ageing workforce
(3) Work intensifi cation, high workload and work pressure
(4) High emotional demands at work, violence and harassment
(5) Poor work-life balance
Figure 38. The 10 most important emerging psychosocial risks identifi ed in the survey [12]
The experts rated eight risks as strongly emerging and 19 as emerging
6.00
5.00
4.00
3.00
2.00
1.00
0.00
4.384.564.25 4.25 4.19 4.13 4.07 4.06 4.00 4.00
Precarious contracts in the context of unstable
labour market
Increased workers'
vulnerability in the
context of globalisation
New forms of
employment contracts
Feeling of job
insecurity
Ageing workforce
Mea
n va
lues
on
the 1
-to-5
poi
nt Li
kert
scal
e and
stan
dard
dev
iatio
ns
Long working
hours
Work intensification
Lean production
and outsourcing
High emotional
demands at work
Poor work-life balance
police : Myriad pro semibold condensed 11 pt
ordre des couleurs : dernier dossier dans la palette(la couleur du fond est la première de la palette, les autres suivent dans l’ordre)
légende : à droite ou en dessous du graphique
Les repères dépassent de 2 mm et tous les traits sont à 0.5 ptles barres n’ont pas de contours
carrés sans contours 4x4 mm
OSH in figures: stress at work — facts and figuresEu
ropE
an a
gEn
cy f
or
SafE
ty a
nd
HEal
tH a
t W
ork
104
New forms of employment contracts and job insecurity
The experts said that the use of more precarious employment contracts, together with the trend towards ‘lean’ production (producing goods and services with less waste) and outsourcing (using outside organisations for certain tasks), can affect workers’ health and safety. Workers on precarious contracts tend to carry out the most hazardous jobs, work in poorer conditions and receive less OSH training. The experts also highlighted the risk of marginalisation as a result of successive short-term contracts and the resulting discontinuity in careers. Workers’ isolation caused by new working patterns such as telework or temporary work was also put forward. In unstable labour markets these developments increase workers’ feelings of job insecurity, which augments the level of work-related stress and may have a negative impact on workers’ health.
Scientific literature supports the results of the experts’ forecast. An increasing number of jobs are described as precarious, and in scientific literature this is often associated with ‘non-standard’ forms of work, such as temporary, part-time, on-call, day-hire or short-term positions, and with the increase in the prevalence of self-employment. Additionally, home-working and individuals with multiple jobs contribute to the increasing significance of non-standard forms of work. Research shows that workers on non-standard contracts face higher job insecurity, poorer job conditions, higher job demands and a higher risk of occupational accidents. Stress-related tension and exhaustion also appear to be more severe for precariously employed workers than for workers in permanent jobs, although it should be noted that there are studies where this has not been proven. Some of the figures presented in this report indicate that workers on permanent contracts report higher levels of work-related stress than short-term workers. More research is needed in this area.
There is a growth in employment that has a low level of continuity certainty, mainly due to the rise in the number of temporary contracts in recent decades, although this trend is not seen in all European countries [61, 62]. According to the Eurostat data [62], temporary contracts are most common in Spain (33% of all employees had this kind of contract in 2005), and quite common in Portugal (19%), Finland (16.5%) and Sweden (16%). They are rather rare in the United Kingdom (6%), Luxembourg (5.3%) and Ireland (4%) (see Figure 39). Among EU12 countries, this kind of work is more popular in Poland (26% in 2005) and Slovenia (17%), and less widespread in Malta (4%) and Estonia (3%). Overall, in 2005, 14.5% of employees from EU25 countries had a temporary job. By sector, the Fourth EWCS (2005) [14] showed that temporary contracts were most prevalent in hotels and restaurants (21%), education and health (15%) and the wholesale and retail trade (14%).
An increasing number of jobs are described as precarious
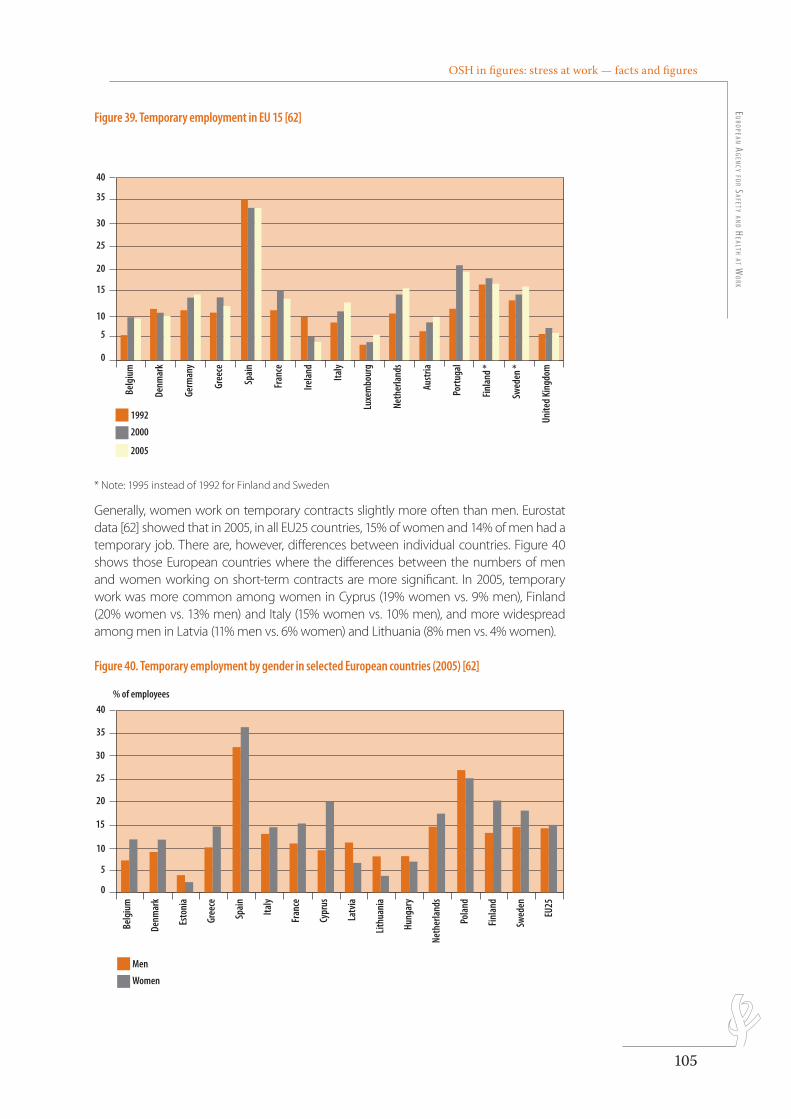
OSH in figures: stress at work — facts and figuresE
uro
pEan ag
Ency fo
r SafEty an
d HEaltH at W
ork
105
Figure 39. Temporary employment in EU 15 [62]Be
lgiu
m
Denm
ark
Germ
any
Gree
ce
Spai
n
Fran
ce
Irela
nd
Italy
Luxe
mbo
urg
Neth
erla
nds
Aust
ria
Port
ugal
Finl
and
*
Swed
en *
Unite
d Ki
ngdo
m
40
35
30
25
20
15
10
5
0
1992
2000
2005
police : Myriad pro semibold condensed 11 pt
ordre des couleurs : dernier dossier dans la palette(la couleur du fond est la première de la palette, les autres suivent dans l’ordre)
légende : à droite ou en dessous du graphique
Les repères dépassent de 2 mm et tous les traits sont à 0.5 ptles barres n’ont pas de contours
carrés sans contours 4x4 mm* Note: 1995 instead of 1992 for Finland and Sweden
Generally, women work on temporary contracts slightly more often than men. Eurostat data [62] showed that in 2005, in all EU25 countries, 15% of women and 14% of men had a temporary job. There are, however, differences between individual countries. Figure 40 shows those European countries where the differences between the numbers of men and women working on short-term contracts are more significant. In 2005, temporary work was more common among women in Cyprus (19% women vs. 9% men), Finland (20% women vs. 13% men) and Italy (15% women vs. 10% men), and more widespread among men in Latvia (11% men vs. 6% women) and Lithuania (8% men vs. 4% women).
Figure 40. Temporary employment by gender in selected European countries (2005) [62]
Belg
ium
Denm
ark
Esto
nia
Gree
ce
Spai
n
Fran
ce
Italy
Cypr
us
Latv
ia
Lith
uani
a
Hung
ary
Neth
erla
nds
Pola
nd
Finl
and
Swed
en
EU25
40
35
% of employees
30
20
25
10
5
15
0
Men
Women
police : Myriad pro semibold condensed 11 pt
ordre des couleurs : dernier dossier dans la palette(la couleur du fond est la première de la palette, les autres suivent dans l’ordre)
légende : à droite ou en dessous du graphique
Les repères dépassent de 2 mm et tous les traits sont à 0.5 ptles barres n’ont pas de contours
carrés sans contours 4x4 mm
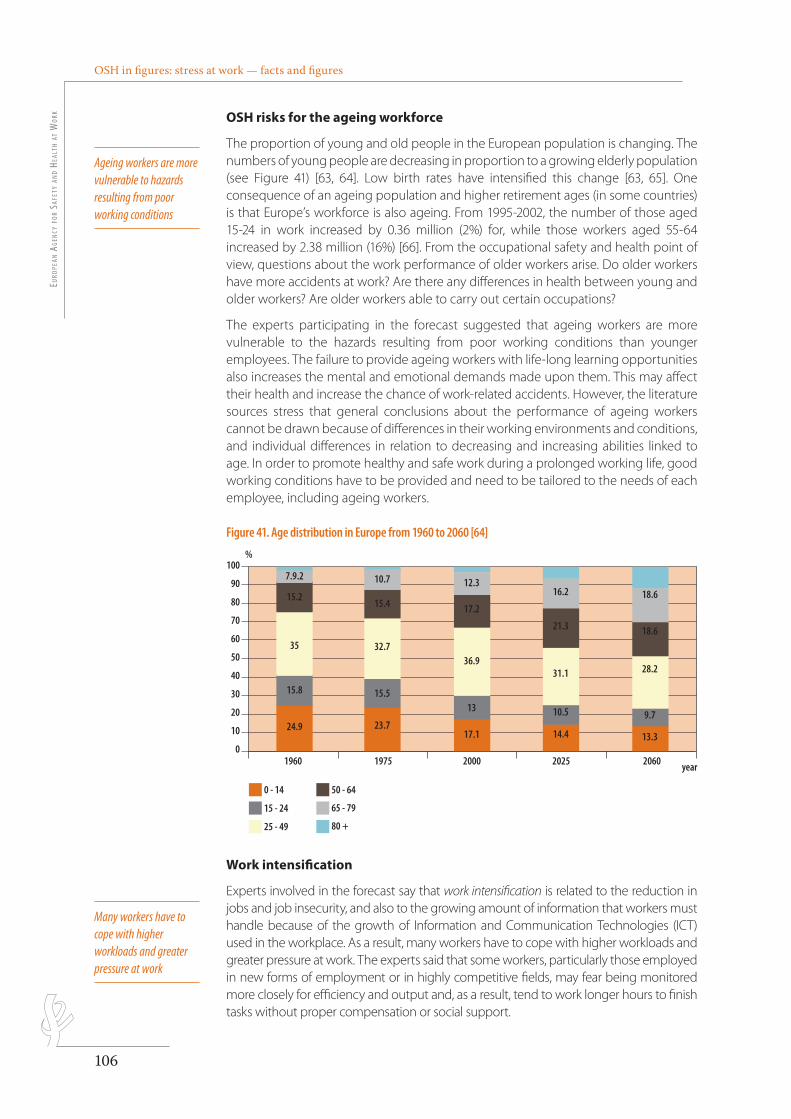
OSH in figures: stress at work — facts and figuresEu
ropE
an a
gEn
cy f
or
SafE
ty a
nd
HEal
tH a
t W
ork
106
OSH risks for the ageing workforce
The proportion of young and old people in the European population is changing. The numbers of young people are decreasing in proportion to a growing elderly population (see Figure 41) [63, 64]. Low birth rates have intensified this change [63, 65]. One consequence of an ageing population and higher retirement ages (in some countries) is that Europe’s workforce is also ageing. From 1995-2002, the number of those aged 15-24 in work increased by 0.36 million (2%) for, while those workers aged 55-64 increased by 2.38 million (16%) [66]. From the occupational safety and health point of view, questions about the work performance of older workers arise. Do older workers have more accidents at work? Are there any differences in health between young and older workers? Are older workers able to carry out certain occupations?
The experts participating in the forecast suggested that ageing workers are more vulnerable to the hazards resulting from poor working conditions than younger employees. The failure to provide ageing workers with life-long learning opportunities also increases the mental and emotional demands made upon them. This may affect their health and increase the chance of work-related accidents. However, the literature sources stress that general conclusions about the performance of ageing workers cannot be drawn because of differences in their working environments and conditions, and individual differences in relation to decreasing and increasing abilities linked to age. In order to promote healthy and safe work during a prolonged working life, good working conditions have to be provided and need to be tailored to the needs of each employee, including ageing workers.
Figure 41. Age distribution in Europe from 1960 to 2060 [64]
1960 1975 2000 2025 2060
100%
year
90
70
60
50
40
30
20
10
0
80
0 - 14
25 - 49 80 +
15 - 24
50 - 64
65 - 79
24.9
15.8
35
15.2
7.9.2 10.7 12.316.2 18.6
18.6
28.2
9.7
13.3
21.3
31.1
10.5
14.4
17.2
36.9
13
17.1
15.4
32.7
15.5
23.7
police : Myriad pro semibold condensed 11 pt
ordre des couleurs : dernier dossier dans la palette(la couleur du fond est la première de la palette, les autres suivent dans l’ordre)
légende : à droite ou en dessous du graphique
Les repères dépassent de 2 mm et tous les traits sont à 0.5 ptles barres n’ont pas de contours
carrés sans contours 4x4 mm Work intensification
Experts involved in the forecast say that work intensification is related to the reduction in jobs and job insecurity, and also to the growing amount of information that workers must handle because of the growth of Information and Communication Technologies (ICT) used in the workplace. As a result, many workers have to cope with higher workloads and greater pressure at work. The experts said that some workers, particularly those employed in new forms of employment or in highly competitive fields, may fear being monitored more closely for efficiency and output and, as a result, tend to work longer hours to finish tasks without proper compensation or social support.
many workers have to cope with higher workloads and greater pressure at work
Ageing workers are more vulnerable to hazards resulting from poor working conditions
OSH in figures: stress at work — facts and figuresE
uro
pEan ag
Ency fo
r SafEty an
d HEaltH at W
ork
107
Both the figures presented in this report and the literature review show that work intensification has been one of the most significant of the many changes that have happened in companies in most developed countries since the 1980s. The relevant literature broadly associates work intensification with deterioration in working conditions, whether this is assessed in terms of physical or psychological discomfort, nuisance or occupational risk.
High emotional demands at work, including violence and harassment
Some experts involved in the Delphi study are of the opinion that although high emotional demands on workers are not new, they are a matter of great concern, particularly in the growing and increasingly competitive healthcare and service sectors. Violence and harassment at work were identified as contributing factors to the increased emotional demands being made on workers. Research shows that for both the victims and witnesses, violence and harassment result in stress and may seriously affect both mental and physical health.
A growing social preoccupation and awareness of the problem of third party violence and harassment at work has been observed in recent years. There is a need for a further, deeper analysis of the problem, sharing experiences across sectors and countries, as well as disseminating appropriate preventive measures.
Poor work-life balance
The experts stressed that all of the changes in work organisation mentioned above may lead to higher pressure on workers and could spill over into private life. The literature sources also confirm that uncertain casual work, high workloads and variable or unpredictable working hours, especially when there is no possibility for the employee to adjust them to their personal needs, can lead to a conflict between the demands of work and private life. The result is a poor work-life balance, which has a detrimental effect on a worker’s well-being.
Other phenomena, such as more women joining the workforce, contribute to the fact that a poor work-life balance is affecting more and more people. The 2005 study indicates that the number of women taking on management roles has been steadily rising for the last ten years. Overall, between 1991 and 2005 the proportion of women in the workforce grew (40% in 1991, 44% in 2005) (see Figure 42) [19].
Changes in work organisation may lead to higher pressure on workers and can spill over into private life
High emotional demands may be especially problematic in the growing and increasingly competitive healthcare and service sectors
OSH in figures: stress at work — facts and figuresEu
ropE
an a
gEn
cy f
or
SafE
ty a
nd
HEal
tH a
t W
ork
108
Figure 42. EU workforce by gender [19]
1991 (EU12) 1995 (EU15) 2000 (EU15) 2005 (EU25)
250
Millions
300
150
100
50
0
Male
Female
40.1%
59.9% 58.3% 57.3%
42.7%
44.2%
55.8%
41.7%
police : Myriad pro semibold condensed 11 pt
ordre des couleurs : dernier dossier dans la palette(la couleur du fond est la première de la palette, les autres suivent dans l’ordre)
légende : à droite ou en dessous du graphique
Les repères dépassent de 2 mm et tous les traits sont à 0.5 ptles barres n’ont pas de contours
carrés sans contours 4x4 mm
Psychosocial risks were also mentioned in European Risk Observatory’s expert forecast which dealt with physical risks. The expert forecast on emerging physical risks related to occupational safety and health, carried out in 2002-2004, was based on a three consecutive questionnaire-based survey following the Delphi method [67].
Growing concern about multi-factorial issues and combined exposure to musculoskeletal disorders (MSDs) risk factors and psychosocial risk factors was particularly emphasised in this forecast. According to the experts, ‘job insecurity’ and ‘fear of the future’ resulting from an unstable labour market both accentuate the effects of physical risk factors such as poor ergonomic design, thus contributing to an increase in the incidence of MSDs.
The relevant research shows that workers highly exposed to a combination of occupational physical and psychosocial risk factors are more likely to report MSDs than workers highly exposed to just one of these factors. Typical psychosocial factors include: job demands
that are too high or too low; complex tasks leading to mental exhaustion; high time pressure; low job control and low decision level; poor support from colleagues and from the hierarchy; fear of downsizing, job insecurity and fear of unemployment; and violence and harassment at work.
The physical characteristics of workplaces, such as poor ergonomic design of human–machine interfaces, also augment workers’ mental and emotional strain. Complaints of problems with the shoulder/neck region and low back area due to poor physical and psychosocial aspects of the working environment are often seen in workers in the healthcare sector, for instance, among nurses and dentists,
c o m b i n E d E x p o S u r E t o p S y c H o S o c i a l a n d p H y S i c a l r i S k S 7.2.There is a growing concern for multi-factorial issues and combined exposure to mSDs risk factors and psychosocial risk factors
OSH in fi gures: stress at work — facts and fi gures E
uro
pEan ag
Ency fo
r SafEty an
d HEaltH at W
ork
109
Physical discomfort among visual display terminal users – a study of prevalence and relation to psychosocial and physical/ergonomic factors
The study was aimed at assessing the relationship between psychosocial and physical/ergonomics risk factors and the visual and musculoskeletal discomforts among video display terminal (VDT) users in a semiconductor manufacturing company (n = 119). Based on the data collected by means of questionnaire surveys, multivariate logistic regression models were developed to predict physical discomforts of 11 body areas.
The prevalence of upper extremity discomfort was 42%, which is similar to the prevalence among VDT users in telecommunication companies and the newspaper industry. Full-time VDT users (data-entry personnel, programming engineers, and CAD engineers) had signifi cantly higher rates of physical discomfort (66%) than part-time VDT users (fabrication engineers) (41%). Physical/ergonomic variables were found to be more dominant than psychosocial factors for visual and upper extremity discomforts. However, psychosocial variables were dominant for back and lower extremity discomfort when compared with the subjectively characterised physical/ergonomic factors. Because both physical/ergonomics variables and psychosocial factors and some of their interactions were associated with visual and musculoskeletal discomfort, integrating psychosocial prevention with physical/ergonomic design improvements is an eff ective approach to reducing the prevalence of discomfort.
Source: Hsu, W.-H. and Wang, M.-J.: ‘Physical discomfort among visual display terminal users in a semiconductor manufacturing company: A Study of Prevalence and Relation to Psychosocial and Physical/Ergonomic Factors’, American Industrial Hygiene Association Journal, vol. 64, pp. 276–282, 2003.
call centre agents and visual display terminal users. An example of the kind of workplace where multiple exposure to these factors is common is in the increasing number of call centres, where workers can be exposed to prolonged sitting, background noise, inadequate headsets, poor ergonomics, low job control, high time pressure, and high mental and emotional demands. MSDs, varicose veins, nose and throat diseases, voice disorders, fatigue, stress and burnout are often seen in call centre agents.

E u r o p e a n A g e n c y f o r S a f e t y a n d H e a l t h a t W o r k
EUROPEAN RISK OBSERVATORY REPORT
E u r o p e a n A g e n c y f o r S a f e t y a n d H e a l t h a t W o r k
EUROPEAN RISK OBSERVATORY REPORT
COSTS OF STRESS-RELATED HEALTH PROBLEMS
8.
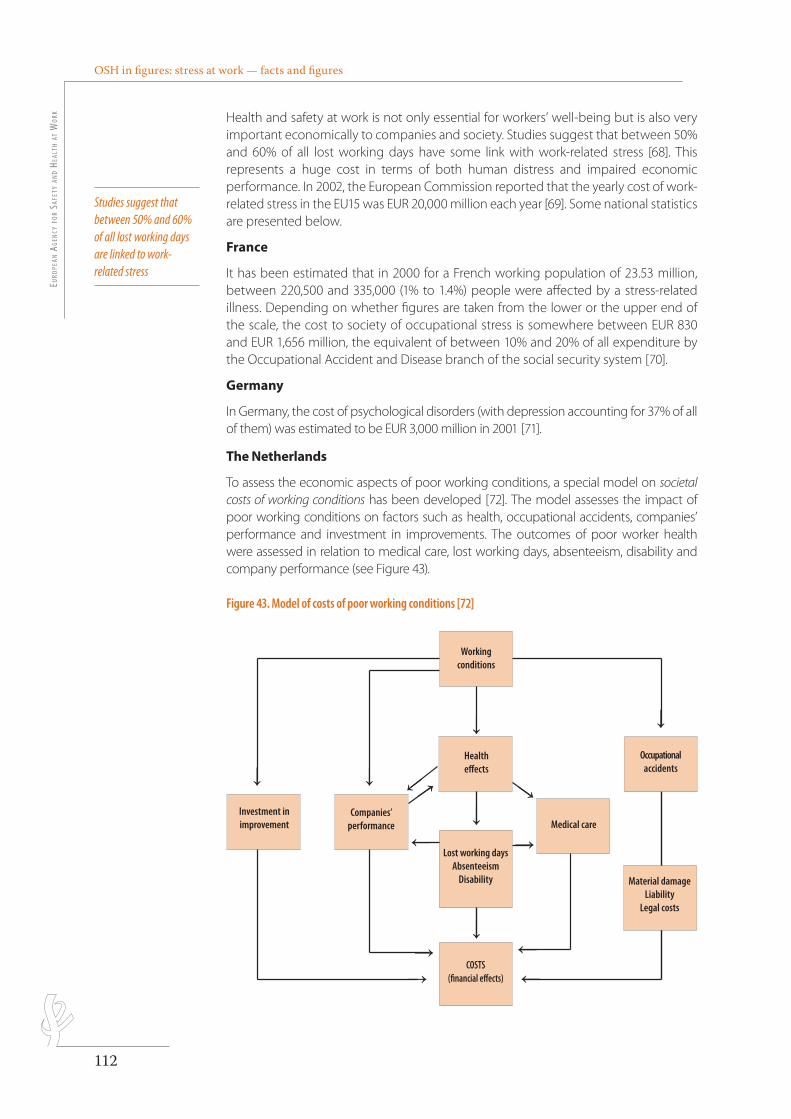
OSH in figures: stress at work — facts and figuresEu
ropE
an a
gEn
cy f
or
SafE
ty a
nd
HEal
tH a
t W
ork
112
Health and safety at work is not only essential for workers’ well-being but is also very important economically to companies and society. Studies suggest that between 50% and 60% of all lost working days have some link with work-related stress [68]. This represents a huge cost in terms of both human distress and impaired economic performance. In 2002, the European Commission reported that the yearly cost of work-related stress in the EU15 was EUR 20,000 million each year [69]. Some national statistics are presented below.
France
It has been estimated that in 2000 for a French working population of 23.53 million, between 220,500 and 335,000 (1% to 1.4%) people were affected by a stress-related illness. Depending on whether figures are taken from the lower or the upper end of the scale, the cost to society of occupational stress is somewhere between EUR 830 and EUR 1,656 million, the equivalent of between 10% and 20% of all expenditure by the Occupational Accident and Disease branch of the social security system [70].
Germany
In Germany, the cost of psychological disorders (with depression accounting for 37% of all of them) was estimated to be EUR 3,000 million in 2001 [71].
The Netherlands
To assess the economic aspects of poor working conditions, a special model on societal costs of working conditions has been developed [72]. The model assesses the impact of poor working conditions on factors such as health, occupational accidents, companies’ performance and investment in improvements. The outcomes of poor worker health were assessed in relation to medical care, lost working days, absenteeism, disability and company performance (see Figure 43).
Figure 43. Model of costs of poor working conditions [72]
Workingconditions
Health effects
Lost working daysAbsenteeism
Disability
COSTS(financial effects)
Investment in improvement
Companies’ performance Medical care
Occupational accidents
Material damageLiability
Legal costs
→ →
→ →
→
→
→
→
→ →→
→
→
→→
police : Myriad pro semibold condensed 11 pt
ordre des couleurs : dernier dossier dans la palette(la couleur du fond est la première de la palette, les autres suivent dans l’ordre)
légende : à droite ou en dessous du graphique
Les repères dépassent de 2 mm et tous les traits sont à 0.5 ptles barres n’ont pas de contours
carrés sans contours 4x4 mm
Studies suggest that between 50% and 60% of all lost working days are linked to work-related stress
OSH in figures: stress at work — facts and figuresE
uro
pEan ag
Ency fo
r SafEty an
d HEaltH at W
ork
113
The analysis of the data from 2001 indicates that the estimated total cost of poor working conditions in the Netherlands that year was up to EUR 6,000 million, equivalent to 2.96% of GNP. Most of the costs to society of poor working conditions come from work-related absence and disability, which are mainly (83% of the all diagnoses) caused by musculoskeletal disorders (43%) and psychological diseases (40%). Other diagnoses associated with high costs were heart and vascular diseases (5%), problems with the nervous system including the eyes and ears (4%), and occupational accidents (4%). The detailed analysis is presented in Table 50.
Table 50. Estimated total costs of work-related illness per worker in 2001, the Netherlands [72]
All sectors and services
EUR per worker % of total
Costs as a result of work-related illness 1,368 77.3
Cost of resulting absenteeism 527 29.8
Cost of occupational disability 609 34.4
Cost of reintegration grants 103 5.8
Cost of curative health care 129 7.3
Cost of prevention 400 22.7
Preventive occupational health and safety (OSH) measures 120 6.8
Company investment and expenses for prevention 157 8.9
OSH research and development 10 0.6
Judicial cost 2 0.1
Administration by companies 102 5.8
Legislation and inspection 6 0.3
Subventions and grants for improvement 3 0.2
Total costs per worker per year 1,768 100
United Kingdom
In the United Kingdom, 70 million days are lost every year through poor mental health, and 10 million of these are the result of anxiety, depression, and stress which, according to employees, is directly caused by their work or working conditions [10].
In 2005/6 work-related stress, depression and anxiety cost Great Britain in excess of £530 million. The number of workers who had sought medical advice for what they believed to be work-related stress increased by 110,000 to an estimated 530,000 [73].
OSH in fi gures: stress at work — facts and fi gures Eu
ropE
an a
gEn
cy f
or
SafE
ty a
nd
HEal
tH a
t W
ork
114
E u r o p e a n A g e n c y f o r S a f e t y a n d H e a l t h a t W o r k
EUROPEAN RISK OBSERVATORY REPORT
Recognition of occupational stress as a cause of heart attack and suicide in France
In 2007, the French Social Security recognised a heart attack as an “occupational accident, mainly due to chronic stress and multiple eff orts resulting from his function as team leader”. The victim, aged 52, died 20 days after collapsing at his workplace, a pneumatic plant, with a myocardial infarct. The head of the production unit refuted the link between work and the infarct and consequently the Social Security, in its fi rst decision, had refused to recognise the infarct as an occupational accident. However, the Social Security reviewed and changed its decision on the basis of medical evidence presented after the widow appeal.
A few months earlier the management of a car company had refused to recognise the suicide of a technician employed in one of its centres as an occupational accident. But the Social Security had decided that there were pressures and stressors in the workplace that had triggered the worker’s extreme action. Also, according to the newspaper Le Monde in September 2007, the regional health insurance representation of the “Haut-de-Seine” region confi rmed that 3 suicides among workers in a car company had been recognised as occupational accidents.
Source: http://www.lemonde.fr/web/article/0,1-0,36-955210,0.html
E u r o p e a n A g e n c y f o r S a f e t y a n d H e a l t h a t W o r k
EUROPEAN RISK OBSERVATORY REPORT
LEGISLATION
9.
OSH in figures: stress at work — facts and figuresEu
ropE
an a
gEn
cy f
or
SafE
ty a
nd
HEal
tH a
t W
ork
116
Framework Directive 89/391/EEC
Work-related stress is not specifically mentioned in European legislation. However, the main document referring to this issue, the EU Health and Safety Framework Directive 89/391/EEC, says that the employers have a legal obligation “to ensure the safety and health of workers in every aspect related to their work”, and that prevention should include “avoiding risks”, “combating the risk at source”, and “assessing risks”. Because work-related stress is a risk factor, the Framework Directive refers to it, too.
Article 6 of the Framework Directive obliges employers to:
n “adapt the work to the individual, especially as regards the design of workplaces, the choice of work equipment and the choice of working and production methods, with a view, in particular, to alleviating work and work at a predetermined work-rate and to reducing their effects on health” (&2(d)).
n “ensure that the planning and introduction of new technologies are the subject of consultation with the workers and/or their representatives, as regards the consequences of the choice of equipment, the working conditions and the working environment for the safety and health of workers” (& 3 (c)).
Framework agreements
The “Framework agreement on work-related stress” [74] was signed by the social partners in October 2004. Its objective is “to provide employers and workers with a framework to identify and prevent or manage problems of work-related stress”. The agreement commits the members of all signatory organisations (workers’ and employers’ representatives at EU level) to implement formulated demands to prevent work-related stress within three years, in accordance with the procedures and practices specific to management and labour in the Member States and in the countries of the European Economic Area.
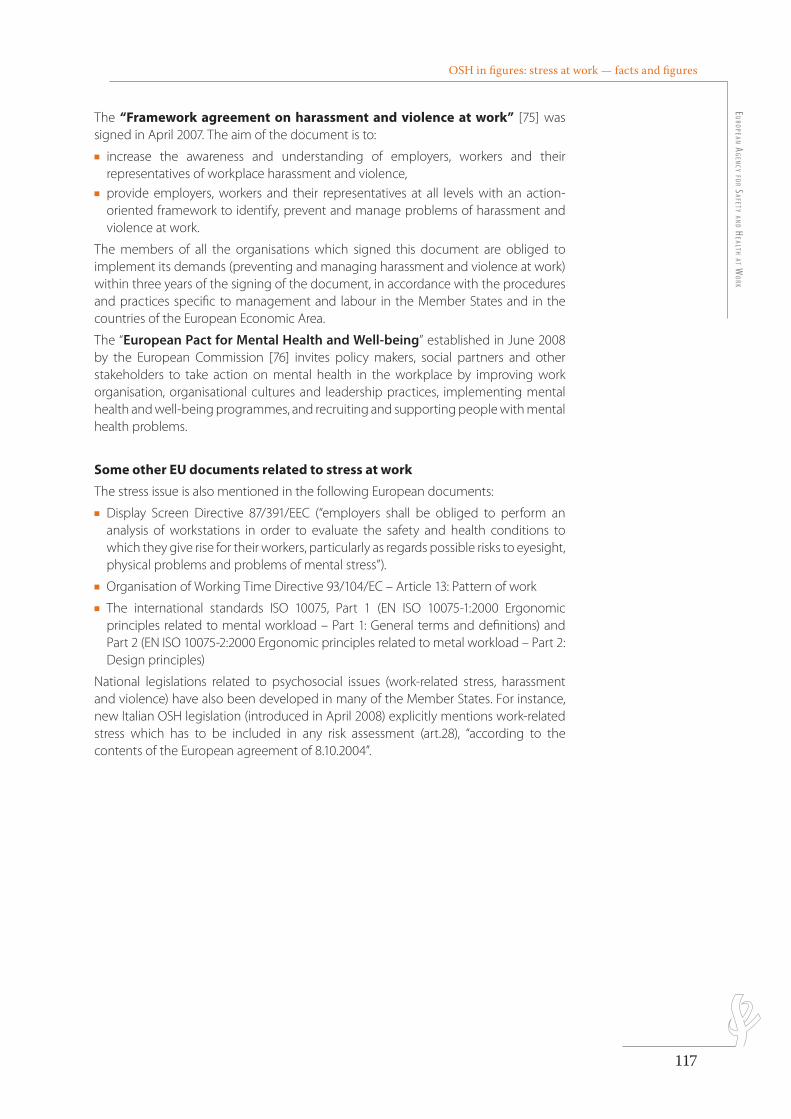
OSH in figures: stress at work — facts and figuresE
uro
pEan ag
Ency fo
r SafEty an
d HEaltH at W
ork
117
The “Framework agreement on harassment and violence at work” [75] was signed in April 2007. The aim of the document is to:
n increase the awareness and understanding of employers, workers and their representatives of workplace harassment and violence,
n provide employers, workers and their representatives at all levels with an action-oriented framework to identify, prevent and manage problems of harassment and violence at work.
The members of all the organisations which signed this document are obliged to implement its demands (preventing and managing harassment and violence at work) within three years of the signing of the document, in accordance with the procedures and practices specific to management and labour in the Member States and in the countries of the European Economic Area.
The “European Pact for Mental Health and Well-being” established in June 2008 by the European Commission [76] invites policy makers, social partners and other stakeholders to take action on mental health in the workplace by improving work organisation, organisational cultures and leadership practices, implementing mental health and well-being programmes, and recruiting and supporting people with mental health problems.
Some other EU documents related to stress at work
The stress issue is also mentioned in the following European documents:
n Display Screen Directive 87/391/EEC (“employers shall be obliged to perform an analysis of workstations in order to evaluate the safety and health conditions to which they give rise for their workers, particularly as regards possible risks to eyesight, physical problems and problems of mental stress”).
n Organisation of Working Time Directive 93/104/EC – Article 13: Pattern of work
n The international standards ISO 10075, Part 1 (EN ISO 10075-1:2000 Ergonomic principles related to mental workload – Part 1: General terms and definitions) and Part 2 (EN ISO 10075-2:2000 Ergonomic principles related to metal workload – Part 2: Design principles)
National legislations related to psychosocial issues (work-related stress, harassment and violence) have also been developed in many of the Member States. For instance, new Italian OSH legislation (introduced in April 2008) explicitly mentions work-related stress which has to be included in any risk assessment (art.28), “according to the contents of the European agreement of 8.10.2004”.

E u r o p e a n A g e n c y f o r S a f e t y a n d H e a l t h a t W o r k
EUROPEAN RISK OBSERVATORY REPORT
E u r o p e a n A g e n c y f o r S a f e t y a n d H e a l t h a t W o r k
EUROPEAN RISK OBSERVATORY REPORT
CONCLUSIONS
10.
OSH in fi gures: stress at work — facts and fi gures Eu
ropE
an a
gEn
cy f
or
SafE
ty a
nd
HEal
tH a
t W
ork
120
E u r o p e a n A g e n c y f o r S a f e t y a n d H e a l t h a t W o r k
EUROPEAN RISK OBSERVATORY REPORTEuropean and national statistics related to work-related stress and psychosocial risks presented in this report indicate that stress at work may be a problem for a signifi cant number of European workers. It has knock-on eff ects for health problems, work absence and lower productivity, and generates cost for enterprises and societies.
In the surveys carried out every fi ve years by the European Foundation for the Improvement of Living and Working Conditions, respondents rated stress as the second most prevalent threat posed by the working environment, preceded only by musculoskeletal problems. According to the fourth EWCS (2005), stress is experienced by 22% of working Europeans on average. Although there was a decrease in the average level of work-related stress in the whole EU in 2005, this trend was observed mainly in the EU15 countries. The average level of work-related stress in EU12 has increased in the last few years. Nevertheless, there are signifi cant diff erences between individual countries from both groups in the levels of stress and the levels of other stress indicators. An analysis of national data is essential to gain a clearer picture and deeper understanding of this problem in each of the EU Member States.
Future research should focus on:
1. Further investigation of the level of awareness and the prevalence of psychosocial risks and work-related stress, as well as of preventive measures employed by the Member States.
2. Analysing cultural diff erences related to the perception and reporting of work-related stress and psychosocial risks in workplaces.
3. Exploring diff erent possible indicators of work-related stress.
4. Developing appropriate preventive measures (at national and company level) to deal with work-related stress and psychosocial risks, and methods of assessing their effi ciency.
5. Investigating, especially in longitudinal studies, the possible eff ects on workers’ health and safety of emerging risks and current trends in the world of work, such as work intensifi cation, job insecurity, third party violence, harassment, demographic changes including an ageing workforce and more women in the workplace, new forms of employment contracts such as temporary and part-time work, and variable, irregular or unpredictable working hours.
An analysis of national data is essential to give a clearer picture and deeper understanding of stress-related problems in each of the EU member States
Perceived risk from occupational stress: a survey of 15 European countries
The analysis aimed to assess whether socio-cultural factors infl uence the level of work-related stress perceived by workers (according to the 3rd EWCS, 2000) from 15 European countries. The results indicated that, indeed, factors such as demographics, perceived job conditions, and job satisfaction do not explain all of the diff erences between countries in terms of work-related stress. This means that the level of perceived stress and health problems in a given country are infl uenced by cultural norms, such as risk tolerance, or the role of media in highlighting these health issues. It turned out, for instance, that workers in Austria and Ireland are least likely to believe that work causes stress and stress-related health problems, whereas workers in Greece are most likely to believe it.
Source: Daniels, K . Perceived risk from occupational stress: a survey of 15 European countries. Occup. Environ. Med. 2004;61;467-470.
E u r o p e a n A g e n c y f o r S a f e t y a n d H e a l t h a t W o r k
EUROPEAN RISK OBSERVATORY REPORT
MORE INFORMATION
11.
OSH in figures: stress at work — facts and figuresEu
ropE
an a
gEn
cy f
or
SafE
ty a
nd
HEal
tH a
t W
ork
122
E u r o p e a n A g e n c y f o r S a f e t y a n d H e a l t h a t W o r k
EUROPEAN RISK OBSERVATORY REPORTEuropean Week 2002 “Preventing psychosocial risks at work”
In 2002, stress and psychosocial risks at work were chosen as the focus of a campaign organised and co-ordinated by the European Agency for Safety and Health at Work in all EU Member States and other European countries (8). More information about this campaign, as well as a wide range of publications related to stress and psychosocial issues are available on http://ew2002.osha.europa.eu/.
The Agency’s publications which deal with work-related stress and psychosocial risks:
n Factsheets: Research on work-related stress (Facts 8); Work-related stress (Facts 22); Bullying at work (Facts 23); Violence at work (Facts 24); Practical Advice for Workers on Tackling Work-related Stress and its Causes (Facts 31); How to Tackle Psychosocial Issues and Reduce Work-related Stress (Facts 32); Expert forecast on emerging psychosocial risks related to occupational safety and health (OSH) (Facts 74).
n Reports: “Research on Work-related Stress”; “How to Tackle Psychosocial Issues and Reduce Work-related Stress”; “Good Practice: Prevention of psychosocial risks and stress at work in practice”.
n Magazine “Working on Stress” (no 5)
n Forum “The Changing World of Work” (no 5)
n Publications on work-related stress related to different groups of workers: “Gender issues in safety and health at work - a review”; “Young workers – Facts and figures”; “Literature study on migrant workers”.
All the information published by the European Agency for Safety and Health at Work is available on http://osha.europa.eu/ . The work carried out by the European Risk Observatory is available on http://riskobservatory.osha.europa.eu.
(8) The Agency’s campaigns are aimed at rising the awareness of a given topic, and provides a good opportunity to focus attention on it, as well as provide people involved in occupational safety and health matters (safety and health institutions and occupational insurance organisations, trade unions and employers’ organisations, companies, managers, employees and safety representatives) with relevant information.
E u r o p e a n A g e n c y f o r S a f e t y a n d H e a l t h a t W o r k
EUROPEAN RISK OBSERVATORY REPORT
DATA COLLECTION METHODOLOGY
12.
OSH in figures: stress at work — facts and figuresEu
ropE
an a
gEn
cy f
or
SafE
ty a
nd
HEal
tH a
t W
ork
124
The data presented in this report have been collected from surveys carried out at the EU level, as well as from studies carried out in individual Member States. All statistics have been collected from published sources or sources available online.
The most important types of data sources were as follows.
Surveys
European surveys on working conditions
The European working conditions surveys are carried out every five years by the European Foundations for the Improvement of Living and Working Conditions. The first three surveys (1990, 1995 and 2000) included only the old EU members. However, in 2001 the survey applying the same methodology was carried out for the first time in candidate countries. It was published under the title “Working conditions in the acceding and candidates countries”. In 2005, the European survey was carried out in all 25 EU countries, and in two acceding countries (Romania and Bulgaria).
The European surveys provide information on psychosocial and physical working conditions in the European countries. They contain questions concerning work-related stress, as well as phenomena closely related to stress, such as overall fatigue, anxiety, and irritability. Information concerning stress-provoking job characteristics, such as tight deadlines, working at very high speed, lack of job control and others can also be obtained from the database of these surveys. In the present report, the results of the European Surveys of Working Conditions, carried out in 1991, 1995, 2000/2001 and 2005, as well as comparative analyses of the results of these surveys developed by the European Foundation for Improving Living and Working Conditions - for example “Fifteen years of working conditions in the EU: charting the trends” - were used.
Additionally, data collected by the EUROSTAT, as well as the international study “Working Life Barometer in the Baltic Countries” were used.
National surveys on working conditions and health
In some countries it was possible to use data from national surveys. The weak point of this type of data is the fact that comparison is difficult. Nevertheless, they may offer deeper and more detailed characteristics of a given country. Examples of this kind of sources are:
n In Germany: the BIBB/IAB surveys. These are large representative surveys of 0.1% of the labour force in Germany gathering information about qualifications, career history and current occupational situations.
n In France: Working Conditions surveys carried out by the French Ministry of labour in 1978, 1984, 1991, 1998, and the “Medical surveillance of occupational risk” survey. The latter were compiled in 1987, 1994, and 2003, and covered, among other things, such as working time and organisational constraints.
n In Spain: “National survey of working conditions”. The first edition of this survey was in 1987 and the sixth edition, the most recent, was published in 2007.
OSH in figures: stress at work — facts and figuresE
uro
pEan ag
Ency fo
r SafEty an
d HEaltH at W
ork
125
Administrative data sources
In some countries, administrative national data sources have been used to present statistical data concerning work-related problems, such as mental disorders like depression or anxiety.
This report summarises the most important information collected at international and national level in order to obtain, as far as possible, a picture of stress that is both reliable and general. An attempt was also made to identify the trends that underpin work-related stress so that it would be possible to forecast its future dynamics and to determine the necessary preventive measures. Statistics from European and national sources were complemented by examples of initiatives and research on work-related stress.

E u r o p e a n A g e n c y f o r S a f e t y a n d H e a l t h a t W o r k
EUROPEAN RISK OBSERVATORY REPORT
E u r o p e a n A g e n c y f o r S a f e t y a n d H e a l t h a t W o r k
EUROPEAN RISK OBSERVATORY REPORT
REFERENCES
OSH in figures: stress at work — facts and figuresEu
ropE
an a
gEn
cy f
or
SafE
ty a
nd
HEal
tH a
t W
ork
128
[1] Selye, H. The Stress of Life, New York, McGraw-Hill, 1956.
[2] Lazarus, R.S., Folkman S. Stress, appraisal and coping, New York, Springer Publishing Company, 1984.
[3] Factsheet 22: Work-related stress, European Agency for Safety and Health at Work; http://osha.europa.eu/en/publications/factsheets/22/view
[4] Schnall, K. Belkić, P. Landsbergis, Baker, D. (Eds). The workplace and cardiovascular disease, Occupational Medicine: State of the art - reviews, 15, 1 (January-March), 2000, 24-46.
[5] Theorell, T., Tsutsumi, A., Hallquist, J., Reuterwall, C., Hogstedt, C., Fredlund, P., Emlund, N., Johnson, J. V., at al. Decision Latitude, Job Strain, and Myocardial Infarction: A study of working Men in Stockholm, American Journal of Public Health, 88, 1998, 382-388.
[6] Bongers, P. M., de Winter, C., Kompier, M. A. J. Psychosocial factors at work and musculoskeletal disease, Scandinavian Journal of Work, Environment and Health, 19, 1993, 297-312.
[7] Kawakami, N., Tanigawa, T., Araki S., Nakata, A., Sakurai, S., Yokoyama, K., Morita, Y. Effects of Job Strain on Helper-Inducer (D4+CD29+)and Suppressor-Inducer (CD4+CD45RA+) T Cells in Japanese Blue-Collar Workers, Psychotherapy and Psychosomatics, 66, 1997, 192-198.
[8] Boedeker, W., Klindworth, H. Hearts and minds at work in Europe. A European work-related public health report on cardiovascular diseases and mental ill health. BKK Bundesverband, Federal Association of Company Health Insurance Funds, Essen, 2007.
[9] Maslach, C.; Jackson, S. E. The measurement of experienced burnout, Journal of Occupational Behaviour, 2, 1981, 99-113 http://www.rci.rutgers.edu/~sjacksox/PDF/TheMeasurementofExperiencedBurnout.pdf
[10] The Sainsbury Centre for Mental Health, Mental health at work: developing the business case, Policy Paper 8, London, December 2007. http://www.scmh.org.uk/publications/MH_at_work.aspx?ID=575
[11] Houtman I. Work-related stress. European Foundation for the Improvement of Living and Working Conditions, 2005. http://www.eurofound.europa.eu/
[12] European Agency for Safety and Health at Work, Expert forecast on emerging psychosocial risks related to occupational health and safety, Office for Official Publications of the European Communities, Luxembourg, 2007. http://osha.europa.eu/en/publications/reports/7807118/view
[13] Karasek, R. A. & Theorell, T. Healthy Work: Stress, Productivity and the Reconstruction of Working Life. New York, Basic Books, 1990.
[14] European Foundation for the Improvement of Living and Working Conditions, Fourth European Working Conditions Survey, Office for Official Publications of the European Communities, Luxembourg, 2006. http://www.eurofound.europa.eu/ewco/surveys/EWCS2005/index.htm
[15] Paoli, P. & Merllié, D., Third European Working Conditions Survey 2000, European Foundation for the Improvement of Living and Working Conditions, Office for Official Publications of the European Communities, Luxembourg, 2001. http://eurofound.europa.eu/publications/htmlfiles/ef0121.htm
[16] Paoli, P. & Parent-Thirion, A., Working Conditions in the acceding and candidate countries, European Foundation for the Improvement of Living and Working Conditions, Office for Official Publications of the European Communities, Luxembourg, 2003. http://www.eurofound.europa.eu/publications/htmlfiles/ef0306.htm
OSH in figures: stress at work — facts and figuresE
uro
pEan ag
Ency fo
r SafEty an
d HEaltH at W
ork
129
[17] Paoli, P. Second European Working Conditions Survey, European Foundation for the Improvement of Living and Working Conditions, Office for Official Publications of the European Communities, Luxembourg, 1997. http://www.eurofound.europa.eu/publications/htmlfiles/ef9726.htm
[18] Daniels, K. Perceived risk from occupational stress: a survey of 15 European countries, Occupational and Environmental Medicine, 61, 2004, 467-470.
[19] European Foundation for the Improvement of Living and Working Conditions Fifteen years of working conditions in the EU: Charting the trends, Office for Official Publications of the European Communities, Luxembourg, 2007. http://www.eurofound.europa.eu/publications/htmlfiles/ef0685.htm
[20] Antila, J., Ylöstalo, P. Working Life Barometer in the Baltic Countries 2002, Ministry of Labour Finland Labour, Policy Studies No. 247, Helsinki, 2003.
[21] Flemish Workability Monitor, SERV, STV- Innovatie & Arbeid, Belgium (Flanders), 2004. http://www.serv.be/uitgaven/603.pdf
[22] Assessment of the situation regarding physical and mental diseases of the working labour. CYMAR Market Research Ltd., on behalf of the Department of Labour Inspection of the Ministry of Labour and Social Insurance. 9-26/10/2006. Unpublished report.
[23] Health and functional capacity in Finland: Baseline results of the Health 2000 health examination survey. National Public Health Institute, Helsinki, 2004. http://www.ktl.fi/attachments/suomi/julkaisut/julkaisusarja_b/2004b12.pdf
[24] L’exposition aux risques et aux pénibilités du travail de 1994 à 2003. Premiers résultats de l’enquête SUMER 2003. DARES, Premières informations et premières synthèses, 2004 http://www.travail.gouv.fr/IMG/pdf/publication_pips_200412_n-52-1_exposition-risques-penibilites-travail.pdf
[25] Le stress au travail, ND 5021, INRS, 2003, http://www.inrs.fr. Le stress au travail, dossier web, http://www.inrs.fr/dossiers/stress.html
[26] Pathologies psychiques liées au travail: quelle reconnaissance en Europe, EUROGIP, Paris, 2004. http://www.eurogip.fr/docs/DP_Pathologies_psychiques.pdf
[27] CHINI B. Les facteurs de stress professionnel. Enquête auprès de salariés des services interentreprises. Archives des Maladies Professionnelles et de l’Environnement, 64, 5, 2003, 297-309.
[28] Summary of injury, illness and fatality statistics, 2005-2006. Health and Safety Authority, Dublin, 2007.http://publications.hsa.ie/index.asp?locID=17&docID=234
[29] Working conditions and risks in Latvia, 2005-2007. A/S “Inspecta Latvia” & RSU DVVI, Ryga, 2007.
[30] Eglite, M. Work-related stress in Latvia, Institute of Occupational and Environmental Health, Riga Stradins University, Report provided to the European Agency for Safety and Health at Work, 2007.
[31] V Encuesta Nacional de Condiciones de Trabajo. INSHT Spain, 2003. http://www.oect.es/Observatorio/Contenidos/InformesPropios/Desarrollados/Ficheros/Informe_V_ENCT.pdf
[32] VI Encuesta Nacional de Condiciones de Trabajo. INSHT Spain, 2007. http://www.oect.es/Observatorio/Contenidos/InformesPropios/Desarrollados/Ficheros/Informe_VI_ENCT.pdf
[33] Permanent Quality of Life Survey, CBS, Statline 2006, http://statline.cbs.nl
[34] The Netherlands Working Conditions Survey (Nationale Enquete Arbeidsomstandigheden – NEA), 2003, 2005.
OSH in figures: stress at work — facts and figuresEu
ropE
an a
gEn
cy f
or
SafE
ty a
nd
HEal
tH a
t W
ork
130
[35] Self Reported Work-Related Surveys (SWI), Health and Safety Statistics, HSE, http://www.hse.gov.uk/statistics/sources.htm
[36] Workplace Health and Safety Survey (WHASS), Health and safety statistics, HSE, http://www.hse.gov.uk/statistics/sources.htm
[37] Webster, S. Buckley, P. Rose, I. Psychosocial Working Conditions in Britain in 2007. Health at Work Group, Statistics Branch, HSE, http://www.hse.gov.uk/statistics/pdf/pwc2007.pdf
[38] British Occupational Health Research Foundation (BOHRF), http://www.bohrf.org.uk/
[39] Työ ja terveys -haastattelututkimus (Work and health survey), Finnish Institute of Occupational Health, 1997-2006.
[40] BIBB/IAB survey. BIBB/IAB-Erhebungen, Germany, 1998. http://www.bibb.de/de/index.htm
[41] Permanent Quality of Life Survey, The Netherlands, CBS, Statline 2006, http://statline.cbs.nl
[42] Work and health in the EU - A statistical portrait. Data 1994-2002. Eurostat 2003. http://epp.eurostat.ec.europa.eu/
[43] N. De Cuyper N, De Witte, H, Catholic University of Louvain (Flanders), Bossut M, University of Liège (Walloon region). Study on stress in the agriculture sector in Belgium, 2002.
[44] Stres wśród Polek (Stress among Polish women). Research International Pentor, Warsaw, 2003, http://bi.gazeta.pl/im/2/1443/m1443282.pdf
[45] Data on temporary and permanent absence from work on account of illness, injury, care and other causes. Institute of Public Health of the Republic of Slovenia http://www.ivz.si/index.php?akcija=podkategorija&p=50
[46] Billehoj, H. Report on the ETUCE survey on teachers’ work-related stress. European Trade Union Committee for Education (ETUCE), Brussels, 2007. www.csee-etuce.org
[47] Everaet H. (1999). Stress bij de boerin. Werk & Welzijn, 5, 1999, 20-24.
[48] Notelaers, G., Hoedemakers, C., De Witte, H., and Pepermans, R. Werken binnen de overheidssector: een verhaal met veel kleuren. Vlaams Tijdschrift voor Overheidsmanagement (Flemish Journal of Government Management), 10, 3, 2005, 37 – 49. http://soc.kuleuven.be/io/ned/publicaties/detail/iovtom.htm
[49] L’exposition aux risques et aux pénibilités du travail de 1994 à 2003. Premiers résultats de l’enquête SUMER 2003. DARES, Premières informations et premières synthèses, 2004.
[50] Hotels sectoral survey (ELINYAE 2006). Hellenic Institute for Occupational Health and Safety, http://www.elinyae.gr/en/index.jsp
[51] Safety and Health at the Workplace – Trade Union Experiences in Central and Eastern Europe, International Labour Organisation, 2000, http://www.ilo.org/public/english/region/eurpro/budapest/social/safety_cd/hungary/index.htm
[52] Cieślak R. and Widerszal-Bazyl M. Psychospołeczne warunki pracy (Psycho-social Working Conditions). Central Institute for Labour Protection, Warsaw, 2000, http://www.ciop.pl/
[53] Cieślak R. and Widerszal-Bazyl M. Psychospołeczne Warunki Pracy. Normy. Klucz do kwestionariusza (Psychosocial Work Conditions: Manual). Central Institute for Labour Protection, Warsaw, 2000, http://www.ciop.pl/
OSH in figures: stress at work — facts and figuresE
uro
pEan ag
Ency fo
r SafEty an
d HEaltH at W
ork
131
[54] Dudek, B. Zaburzenia po stresie traumatycznym (Post-traumatic stress disorders), Gdańsk, GWP, 2003.
[55] Dudek B.; Koniarek, J.; Nowicka, M.; Szymczak, M. Narażenie na agresję związaną z pracą jako źródło stresu ostrego (Exposure to work-related aggression as a source of acute stress). Nofer Institute of Occupational Medicine, Lodz, 1999, http://www.imp.lodz.pl/
[56] Ministry of Health. General Direction of Health (Dirección General de Sanidad, DGS), Portugal, 2004.
[57] Tavares, A.S.R. (2005) in: Miguel, S. Work-related stress: literature study report, Portuguese Society for Occupational Safety and Health, SPOSHO, Universidade do Minho, Report provided to the European Agency for Safety and Health at Work, 2007.
[58] Novak, N. Stres pri delu zdravnikov (Physicians and stress at work), Master Thesis, University of Ljubljana, 2002. http://www.cek.ef.uni-lj.si/magister/novak371.pdf
[59] NEA 2003-2005, The Netherlands Centre for Occupational Diseases (NCvB), http://www.occupationaldiseases.nl/index.php?LanguageID=1
[60] The Netherlands Centre for Occupational Diseases (NCvB), http://www.onderzoekinformatie.nl/en/oi/nod/organisatie/ORG1241610/
[61] EU LFS Ad hoc module , 1999 http://circa.europa.eu/irc/dsis/employment/info/data/eu_lfs/LFS_MAIN/Adhoc_modules/Adhoc_modules_mainpage.htm
[62] Labour Force Survey 2005; Employment rate in the EU25 was 63.8% in 2005. Statistical Office of the European Communities. News Release 118/2006, 11 September 2006 http://europa.eu/rapid/pressReleasesAction.do?reference=STAT/06/118&format=HTML&aged=0&language=EN&guiLanguage=fr
[63] Live longer, work longer. Organisation for Economic Co-operation and Development, Paris, OECD, 2006. http://www.oecd.org/document/42/0,3343,en_2649_34747_36104426_1_1_1_1,00.html
[64] Europe in figures: Eurostat yearbook 2005. Statistical Office of the European Communities, Luxembourg, Office for Official Publications of the European Communities, 2005. http://epp.eurostat.ec.europa.eu
[65] Buck, H., Kistler, E. & Mendius, H. G. Demographic change in the world of work. Opportunities for an innovative approach to work – a German point of view. Bundesministerium für Bildung und Forschung, Stuttgart, 2002. http://publica.fraunhofer.de/eprints/urn:nbn:de:0011-n-104854.pdf
[66] European Agency for Safety and Health at Work, Ageing workers and occupational safety and health. Prevention report. Luxembourg; Office for Official Publications of the European Communities, in preparation.
[67] Expert forecast on emerging physical risks related to occupational health and safety. European Agency for Safety and Health at Work, Luxembourg, Office for Official Publications of the European Communities, 2005. http://osha.europa.eu/en/publications/reports/6805478/view
[68] Cox, T., Griffiths, A. J., & Rial-Gonzalez, E. Research on Work-related Stress. Report to the European Agency for Safety and Health at Work. Luxembourg, Office for Official Publications of the European Communities, 2000. http://osha.europa.eu/en/publications/reports/203/view
[69] Levi L. and Levi I. Guidance on work-related stress – Spice of life or kiss of death? Luxembourg, Office for Official Publications of the European Communities, 2000.
OSH in figures: stress at work — facts and figuresEu
ropE
an a
gEn
cy f
or
SafE
ty a
nd
HEal
tH a
t W
ork
132
E u r o p e a n A g e n c y f o r S a f e t y a n d H e a l t h a t W o r k
EUROPEAN RISK OBSERVATORY REPORT[70] Le stress au travail, Dossier web, INRS, http://www.inrs.fr/dossiers/stress.html
[71] Work-Life-Balance - Betriebliche Strategien zur Vereinbarkeit von Beruf, Familie und Privatleben. Fehlzeiten-Report 2003, http://wido.de/fzr_2003.html
[72] Koningsveld, E. The costs incurred by poor working conditions: a burden to society, a prospect to companies. TNO, Hoofddorp, 2003. http://www.eanpc.org/pdfs/EPC/Thu_Soc_1330_Koningsveld.pdf
[73] Workplace stress costs Great Britain in excess of £530 million. Press release C021:07 7 November 2007, HSE. http://www.hse.gov.uk/press/2007/c07021.htm
[74] European Social Dialogue: Framework Agreement on Work-related Stress. http://ec.europa.eu/employment_social/news/2004/oct/stress_agreement_en.pdf
[75] European Social Dialogue: Framework Agreement on Harassment and Violence at Work. (http://www.ueapme.com/docs/joint_position/2007_Framework_Agreement_Harassment_and_Violence_at_Work.pdf)
[76] “European Pact for Mental Health and Well-being”. EU High-Level Conference “Together for Mental Health and Wellbeing”, Brussels, 12-13 June 2008. http://ec.europa.eu/health/ph_determinants/life_style/mental/docs/pact_en.pdf
E u r o p e a n A g e n c y f o r S a f e t y a n d H e a l t h a t W o r k
EUROPEAN RISK OBSERVATORY REPORT
ANNEX 1 – STRESS IN FIGURES – NATIONAL LINKS
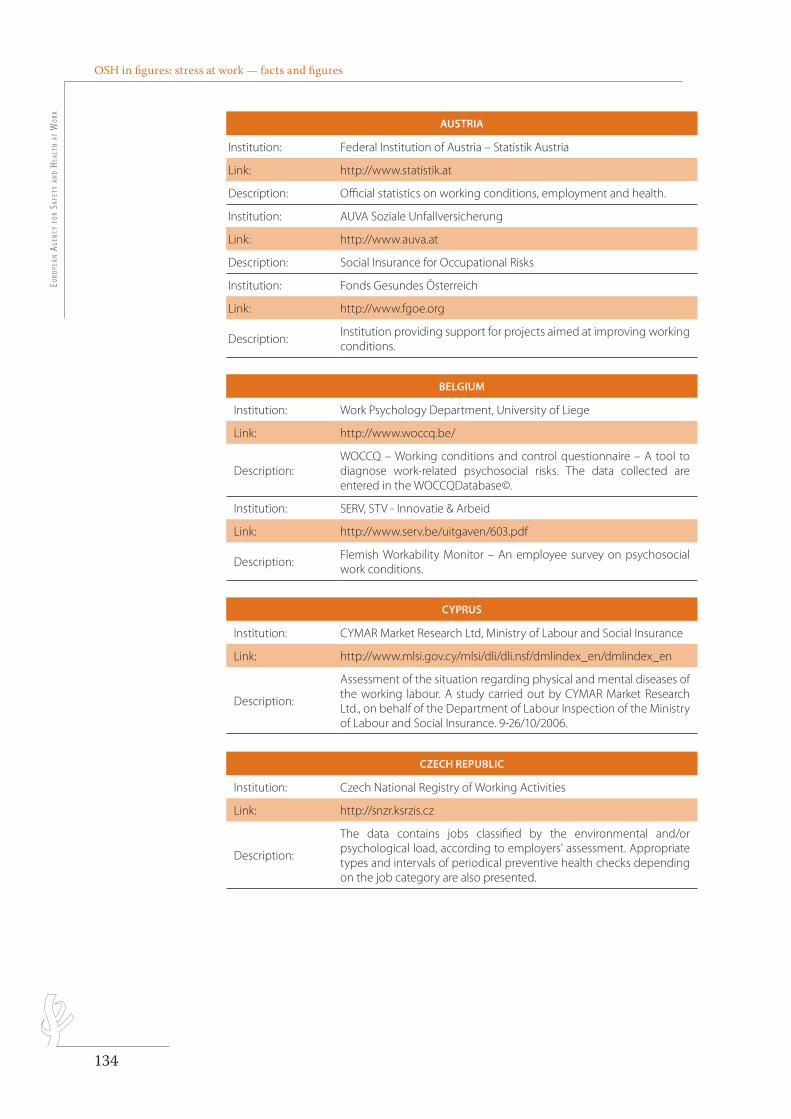
OSH in figures: stress at work — facts and figuresEu
ropE
an a
gEn
cy f
or
SafE
ty a
nd
HEal
tH a
t W
ork
134
AUSTRIA
Institution: Federal Institution of Austria – Statistik Austria
Link: http://www.statistik.at
Description: Official statistics on working conditions, employment and health.
Institution: AUVA Soziale Unfallversicherung
Link: http://www.auva.at
Description: Social Insurance for Occupational Risks
Institution: Fonds Gesundes Österreich
Link: http://www.fgoe.org
Description:Institution providing support for projects aimed at improving working conditions.
BELGIUM
Institution: Work Psychology Department, University of Liege
Link: http://www.woccq.be/
Description:WOCCQ – Working conditions and control questionnaire – A tool to diagnose work-related psychosocial risks. The data collected are entered in the WOCCQDatabase©.
Institution: SERV, STV - Innovatie & Arbeid
Link: http://www.serv.be/uitgaven/603.pdf
Description:Flemish Workability Monitor – An employee survey on psychosocial work conditions.
CZECH REPUBLIC
Institution: Czech National Registry of Working Activities
Link: http://snzr.ksrzis.cz
Description:
The data contains jobs classified by the environmental and/or psychological load, according to employers’ assessment. Appropriate types and intervals of periodical preventive health checks depending on the job category are also presented.
CYPRUS
Institution: CYMAR Market Research Ltd, Ministry of Labour and Social Insurance
Link: http://www.mlsi.gov.cy/mlsi/dli/dli.nsf/dmlindex_en/dmlindex_en
Description:
Assessment of the situation regarding physical and mental diseases of the working labour. A study carried out by CYMAR Market Research Ltd., on behalf of the Department of Labour Inspection of the Ministry of Labour and Social Insurance. 9-26/10/2006.
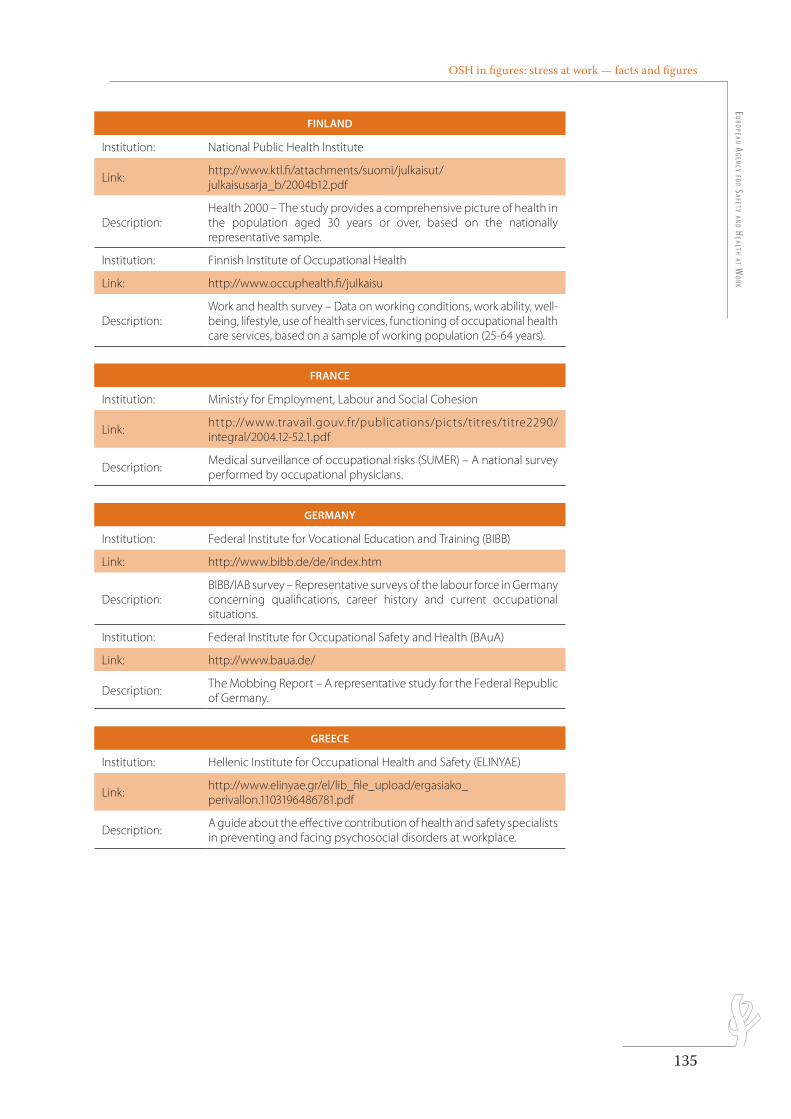
OSH in figures: stress at work — facts and figuresE
uro
pEan ag
Ency fo
r SafEty an
d HEaltH at W
ork
135
FINLAND
Institution: National Public Health Institute
Link:http://www.ktl.fi/attachments/suomi/julkaisut/julkaisusarja_b/2004b12.pdf
Description:Health 2000 – The study provides a comprehensive picture of health in the population aged 30 years or over, based on the nationally representative sample.
Institution: Finnish Institute of Occupational Health
Link: http://www.occuphealth.fi/julkaisu
Description:Work and health survey – Data on working conditions, work ability, well-being, lifestyle, use of health services, functioning of occupational health care services, based on a sample of working population (25-64 years).
GERMANY
Institution: Federal Institute for Vocational Education and Training (BIBB)
Link: http://www.bibb.de/de/index.htm
Description:BIBB/IAB survey – Representative surveys of the labour force in Germany concerning qualifications, career history and current occupational situations.
Institution: Federal Institute for Occupational Safety and Health (BAuA)
Link: http://www.baua.de/
Description:The Mobbing Report – A representative study for the Federal Republic of Germany.
FRANCE
Institution: Ministry for Employment, Labour and Social Cohesion
Link:http://www.travail.gouv.fr/publications/picts/titres/titre2290/integral/2004.12-52.1.pdf
Description:Medical surveillance of occupational risks (SUMER) – A national survey performed by occupational physicians.
GREECE
Institution: Hellenic Institute for Occupational Health and Safety (ELINYAE)
Link:http://www.elinyae.gr/el/lib_file_upload/ergasiako_perivallon.1103196486781.pdf
Description:A guide about the effective contribution of health and safety specialists in preventing and facing psychosocial disorders at workplace.
OSH in figures: stress at work — facts and figuresEu
ropE
an a
gEn
cy f
or
SafE
ty a
nd
HEal
tH a
t W
ork
136
GREECE
Institution: Hellenic Institute for Occupational Health and Safety (ELINYAE)
Link: http://www.elinyae.gr/en/index.jsp
Description: Hotels sectoral survey (2006)
HUNGARY
Institution: National Institute of Occupational Health (NIOH)
Link: http://mentalhealth.epha.org/ppt/NIOH Richard Plette.pps
Description: Efforts against mental disorders in Hungary – PPT Presentation.
IRELAND
Institution: Health and Safety Authority
Link: http://publications.hsa.ie/index.asp?locID=17&docID=234
Description: Summary of injury, illness and fatality statistics, 2005-2006.
LATVIA
Institution: AS “Inspecta Latvia” & RSU DVVI, Ryga, 2007
Link:http://www.darbatirgus.gov.lv/doc_upl/Darba_apstakli_un_riski_Latvija_ENG.pdf
Description:Working conditions and risks in Latvia – The study was carried out in frame of the National Programme “Labour Market Studies” financed by European Structural Fund.
NETHERLANDS
Institution:TNO Work and Employment in cooperation with the Ministry of Social Affairs and Employment and the Statistics Netherlands (CBS).
Link:http://www.tno.nl/content.cfm?&context=markten&content=case&laag1=52&item_id=107&Taal=2
Description:Netherlands Working Conditions Survey. An employee survey, based on representative sample of the Dutch labour force 15 - 64 years (excluding self-employed).
OSH in figures: stress at work — facts and figuresE
uro
pEan ag
Ency fo
r SafEty an
d HEaltH at W
ork
137
SPAIN
Institution: Instituto Nacional de Seguridad e Higiene en el Trabajo (INSHT)
Link:
http://www.oect.es/portal/site/Observatorio/menuitem.1a9b11e0bf717527e0f945100bd061ca/?vgnextoid=61e5e39fd7218110VgnVCM100000 b 8 0 c a8 c 0 RCR D & vgn e x tchann el = dbb5b 8 f 81a8 c 9110Vgn VCM1000000705350aRCRD
Description: National Survey of working conditions.
NETHERLANDS
Institution: The Netherlands Centre for Occupational Diseases (NCvB)
Link:ht tp://www.onderzoekinformatie.nl/en/oi/nod/organisatie/ORG1241610/
Description:An institution aimed to improve the quality in the prevention, (early) diagnosis, treatment and supervision of occupational diseases and work-related disorders.
Institution: Central Bureau of Statistics (CBS)
Link: http://statline.cbs.nl
Description: A household survey – Permanent Quality of Life Survey.
POLAND
Institution:University of Finance and Management and Social Monitoring Council
Link: http://www.diagnoza.com/
Description:Social Diagnosis. A national survey on conditions and quality of life of Poles.
Institution: PENTOR
Link: http://bi.gazeta.pl/im/2/1443/m1443282.pdf
Description: Stress among Polish women. A representative survey.
Institution: Central Institute for Labour Protection – National Research Institute
Link: http://www.ciop.pl
Description:Psychosocial Work Conditions Questionnaire – A questionnaire on psychosocial work environment.
OSH in figures: stress at work — facts and figuresEu
ropE
an a
gEn
cy f
or
SafE
ty a
nd
HEal
tH a
t W
ork
138
UNITED KINGDOM
Institution: Health and Safety Executive (HSE)
Link: http://www.hse.gov.uk/statistics/sources.htm
Description:Self Reported Work-Related Surveys (SWI) – Health and Safety statistics.
Institution: Health and Safety Executive (HSE)
Link: http://www.hse.gov.uk/statistics/sources.htm
Description:Workplace Health and Safety Survey (WHASS) – Health and Safety statistics.
Institution: British Occupational Health Research Foundation (BOHRF)
Link: http://www.bohrf.org.uk//
Description:An institution supporting research that contributes to good employee health.
Institution: Health and Safety Executive (HSE)
Link: http://www.hse.gov.uk/statistics/pdf/pwc2007.pdf
Description: An annual survey on psychosocial working conditions.
MALTA
Institution: Institute of Health Care, University of Malta
Link: http://home.um.edu.mt/ihc/
Description: Information about scientific studies carried out within the Institute.
SLOVENIA
Institution: Institute of Public Health of the Republic of Slovenia
Link: http://www.ivz.si/index.php?akcija=podkategorija&p=50
Description: Data on temporary and permanent absence from work.
Institution: Institute of Public Health of the Republic of Slovenia
Link:ht tp: //w w w. iv z .s i /publikaci je/arhiv/ lp_ 2003/ Vsebina/ iv z _letopis_2003_v1.htm
Description:Health Statistical Yearbook-Slovenia 2003 – Chapter 10: Monitoring of health status of employees.
OSH in figures: stress at work — facts and figuresE
uro
pEan ag
Ency fo
r SafEty an
d HEaltH at W
ork
139
DENMARK
Institution: National Research Centre for the Working Environment
Link:http://www.arbejdsmiljoforskning.dk/Sp%C3%B8rgeskemaer/Psykisk%20arbejdsmilj%C3%B8.aspx
Description:A Copenhagen Psychosocial Questionnaire (COPSOQ). A questionnaire to monitor psychosocial working conditions for companies and for scientific purposes.
SWEDEN
Institution: Stress Research Institute, Stockholm University
Link: http://www.stressforskning.su.se/pub/jsp/polopoly.jsp?d=4746
Description: A national knowledge centre focusing on stress and health.
How to obtain EU publications
Publications for sale:
via EU Bookshop (http://bookshop.europa.eu);•
from your bookseller by quoting the title, publisher and/or ISBN number;•
by contacting one of our sales agents directly. You can obtain their contact details on •the Internet (http://bookshop.europa.eu) or by sending a fax to +352 2929-42758.
Free publications:
via EU Bookshop (http://bookshop.europa.eu);•
at the European Commission’s representations or delegations. You can obtain their •contact details on the Internet (http://ec.europa.eu) or by sending a fax to +352 2929-42758.
European Agency for Safety and Health at Work
OSH in figures: stress at work — facts and figures
Luxembourg: Office for Official Publications of the European Communities
2009 — 132 pp. — 21 x 29.7 cm
ISBN 978-92-9191-224-7
Price (excluding VAT) in Luxembourg: EUR 15
E u r o p e a n A g e n c y f o r S a f e t y a n d H e a l t h a t W o r k
EUROPEAN RISK OBSERVATORY REPORT
OSH in figures:stress at work — facts and figures
en 9
9en
OSH in figures: stress at work —
facts and figuresEU
ROPEA
N R
ISK O
BSERVATORY R
EPORT
In order to improve the working environment, as regards the protection of the safety and health of workers as provided for in the Treaty and successive Community strategies and action programmes concerning health and safety at the workplace, the aim of the Agency shall be to provide the Community bodies, the Member States, the social partners and those involved in the field with the technical, scientific and economic information of use in the field of safety and health at work.
TE-81-08-478-EN-C
ISSN 1830-5946
Gran Vía 33, E-48009 BilbaoTel.: +34 944794360Fax: + 34 944794383E-mail: [email protected] (excluding VAT) in Luxembourg: EUR 15
Eu
ro
pe
an
A
ge
nc
y
fo
r
Sa
fe
ty
a
nd
H
ea
lt
h
at
W
or
k
ht
tp
:/
/o
sh
a.
eu
ro
pa
.e
u