Embed Size (px)
Citation preview
Harmonizing Healthcare Financing for Health Equity: Case Studies of Cross-subsidization in Thai Public Hospitals
Asst. Prof. Borwornsom Leerapan, MD PhD
JCMS2015: Health Equity Through Innovation and Collaboration June 6th, 2015
Pix source: Jirapat Mobkhuntod “Treatment of human equality” (PMAC 2015 World Art Contest, 9-13 years old)
Special thanks to:
Ø Phatta Kirdruang, PhD
Ø Thaworn Sakulpanich, MD, MSc.
Ø Patchanee Thamwanna
Ø Utoomporn Wongsin
Ø Nutnitima Changprajuck
Ø Health Insurance System Research Office (HISRO) & Health System Research Institute (HSRI)
① Concept of cross-subsidization
– Who cross-subsidies what to whom?
② Case studies of Cross-subsidization in Thai Public Hospitals
– Study objectives, methods, results
③ Implications for policy and practice
– What’s next for researchers & policymakers?
Presentation Outline
Pix source: online.wsj.com
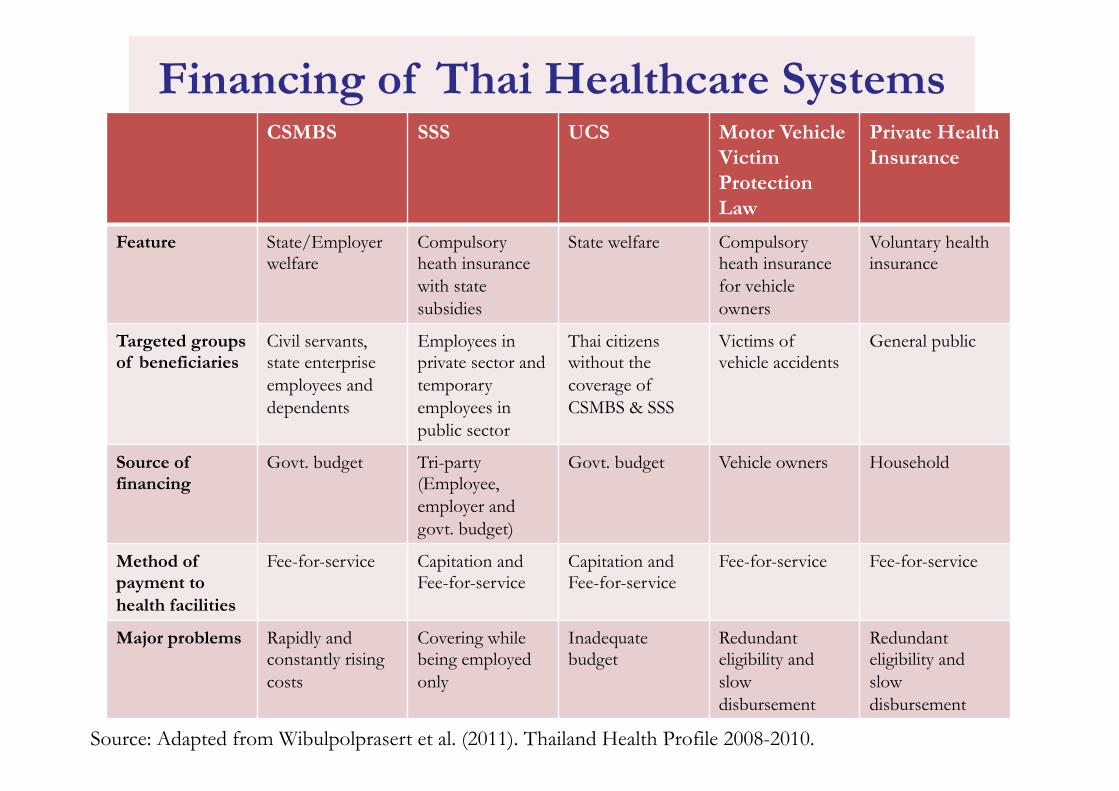
Financing of Thai Healthcare Systems CSMBS SSS UCS Motor Vehicle
Victim Protection Law
Private Health Insurance
Feature State/Employer welfare
Compulsory heath insurance with state subsidies
State welfare Compulsory heath insurance for vehicle owners
Voluntary health insurance
Targeted groups of beneficiaries
Civil servants, state enterprise employees and dependents
Employees in private sector and temporary employees in public sector
Thai citizens without the coverage of CSMBS & SSS
Victims of vehicle accidents
General public
Source of financing
Govt. budget
Tri-party (Employee, employer and govt. budget)
Govt. budget
Vehicle owners Household
Method of payment to health facilities
Fee-for-service Capitation and Fee-for-service
Capitation and Fee-for-service
Fee-for-service Fee-for-service
Major problems Rapidly and constantly rising costs
Covering while being employed only
Inadequate budget
Redundant eligibility and slow disbursement
Redundant eligibility and slow disbursement
Source: Adapted from Wibulpolprasert et al. (2011). Thailand Health Profile 2008-2010.
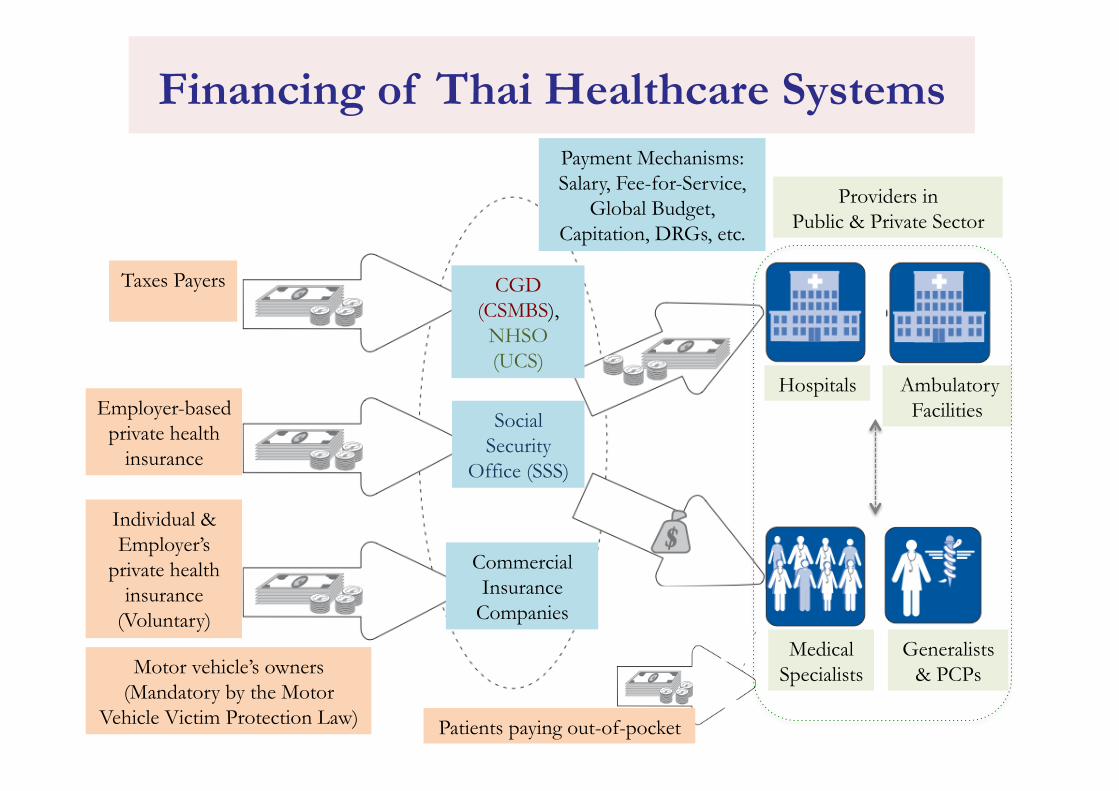
CGD (CSMBS),
NHSO (UCS)
Taxes Payers
Employer-based private health
insurance
Individual & Employer’s
private health insurance
(Voluntary)
Hospitals
Medical Specialists
Generalists & PCPs
Patients paying out-of-pocket
Ambulatory Facilities
Payment Mechanisms: Salary, Fee-for-Service,
Global Budget, Capitation, DRGs, etc.
Financing of Thai Healthcare Systems
Providers in Public & Private Sector
Commercial Insurance
Companies
Social Security
Office (SSS)
Motor vehicle’s owners (Mandatory by the Motor
Vehicle Victim Protection Law)

Study Rationale: High Expenditures?
Figure source: Benjaporn (2007) 14
of the former period grew about 68 percent, 26 percent and 41 percent, respectively,
while during the latter period they were about 224 percent, 43 percent and 127 percent.
Furthermore, when consider growth of expenditure compare year on year; growth rate
of the out-patient expenditure during the second period showed an upward trend and
had very rapid growth in the last two years, 2006 and 2007 (graph 2.5).
With respect to expenditure per patient, this study can merely consider the average in-
patient expenditure, because of data limitations. According to data from the electronic
payment system, the average in-patient expenditure in 2003-2006 increased over time as
shown in graph 2.6.
Graph 2.4: CSMBS expenditure during the fiscal years 1996-2007
Source: The Comptroller General’s Department and the Government Fiscal
Management Information System (GFMIS)
Note: 1 Euro = 49.4450 Baht, as of January 8, 2008
4,826 5,625 5,866 6,206 7,007 8,123
9,509
11,350 13,905
16,943
21,896
30,833
8,761 9,877 10,574 9,048 10,050 11,058 10,967
11,335 12,138 12,437 15,109
15,649
13,587 15,502
16,440 15,253
17,058 19,181 20,476 22,686
26,043
29,380
37,004
46,481
0 5,000
10,000 15,000 20,000 25,000 30,000 35,000 40,000 45,000 50,000
1996 1997 1998 1999 2000 2001 2002 2003 2004 2005 2006 2007
Mill
ion
Bah
t
Year
CSMBS Expenditure in the fiscal years 1996-2007
Out-patient In-patient Total
Ø Common assumptions of what causes increasing healthcare expenditures of CSMBS: • Overuse of NED drug?
• Overuse of brand-named drugs?
• Limited EBM practices?
• Corruption in healthcare sector?
Ø Cross-‐subsidiza,on can be a missing piece!
Study Rationale: Cross-subsidy?
Figure source: www.be2hand.com; www.imdb.com; workwithbrianandfelicia.com
Ø “Do hospitals use payments of a type of health services to subsidize or support financing of other services?”
• If so, how?, at which level?, at what degree?
Literature Review
Ø Concepts of “cross-subsidization” or “cost-shifting” from developed countries such as the U.S. (Morrisey 1994, Cutler 1998, Dranove 1988, Feldman et al. 1998, Frakt 2010 & 2011).
Ø Such theorectical concepts might not be applicable in Thailand’s healthcare systems, especially that Thai public hospitals do not have the “ability to set prices” by themselves.
Ø There was no empirical study of cross-subsidization in the contexts of Thai healthcare systems.

Study Objectives
1. To explore motivations and existing practices of the administrators of Thai public hospitals that potentially can lead to cross-subsidization (“to use payments of a type of health services to support financing of other services”).
2. To demonstrate an empirical evidence related to cross-subsidization at the hospital level, including the cost difference and the difference of excess of revenues over expenses among health schemes.

Methodology: Research Design
Ø No existing empirical studies of cross-subsidization in the contexts of Thai healthcare system.
Ø Theoretical concepts developed in countries like the U.S. might not be applicable in Thailand.
Ø Mixed-‐methods research (MMR) with the concurrent embedded research design (Creswell et al., 2009).
Source: Creswell (2009). Research design: Qualitative, quantitative, and mixed methods approaches. 3rrd ed.
Ø Primarily, the QUAL analysis.
Ø The QUAN analysis is used to compliment the QUAL analysis.
Methodology: Source of Data
Ø Data was based on three selected public hospitals: Ø Two medical centers with 1,000 and 1,134 beds
Ø One teaching hospital with 1,378 beds.
Ø Hospitals were purposefully selected, based on the accessibility to the hospital administrators and the availability of the datasets of unit cost, claims, and reimbursement.
Methodology: Data Collection
Ø Qualitative data: Ø Semi-structure interviews and focus-group interviews.
Ø 30 key informants who are responsible for the administration of the three hospitals.
Ø Verbatim was transcribed and analyzed using ATLAS.ti 7.
Ø Quantitative data: Ø Secondary data of inpatient care, collected at the patient level,
from the two medical centers.
Ø Unit-cost, charge, reimbursement, patient’s health scheme, DRG codes, and basic demographic characteristics.
Ø Analysis was conducted using Stata 12.
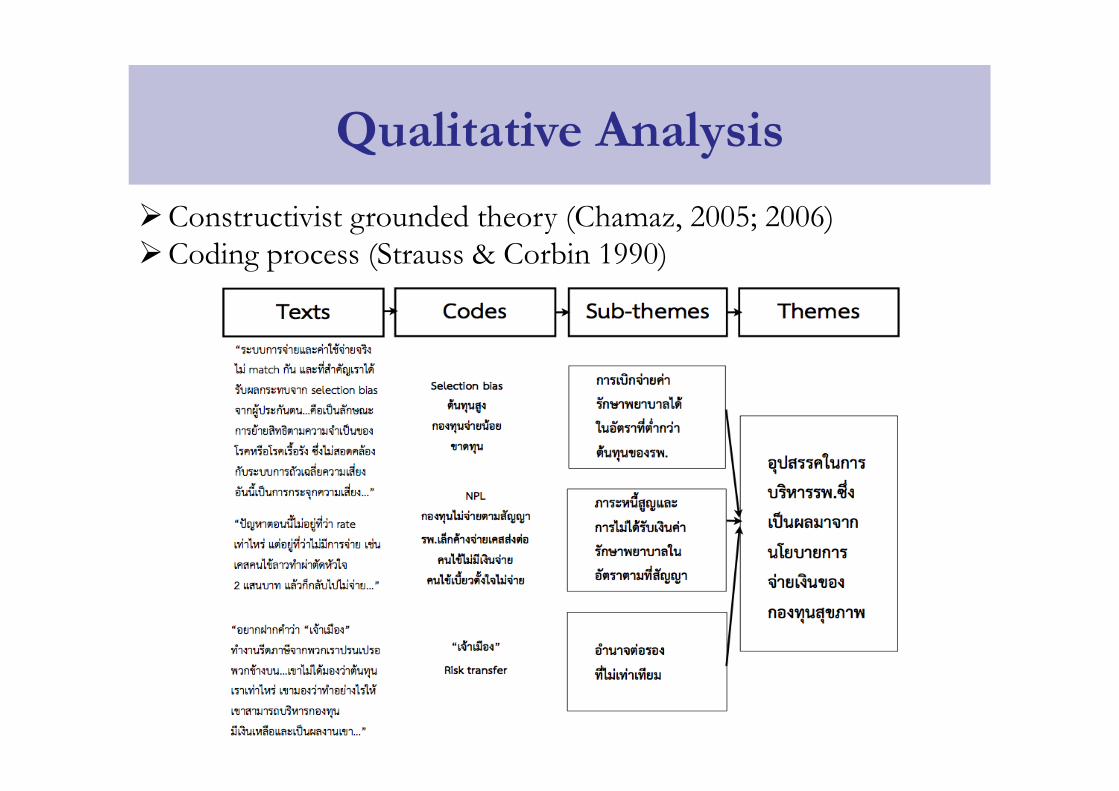
Qualitative Analysis
Ø Constructivist grounded theory (Chamaz, 2005; 2006) Ø Coding process (Strauss & Corbin 1990)
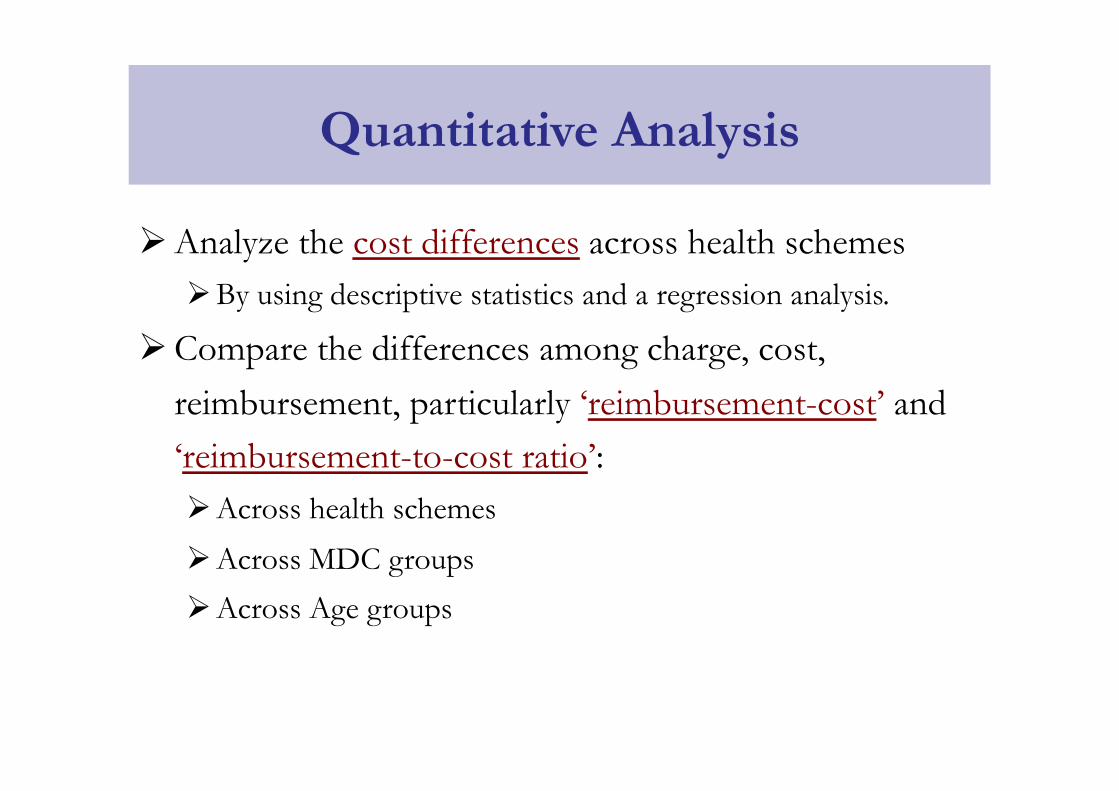
Ø Analyze the cost differences across health schemes Ø By using descriptive statistics and a regression analysis.
Ø Compare the differences among charge, cost, reimbursement, particularly ‘reimbursement-cost’ and ‘reimbursement-to-cost ratio’: Ø Across health schemes
Ø Across MDC groups
Ø Across Age groups
Quantitative Analysis
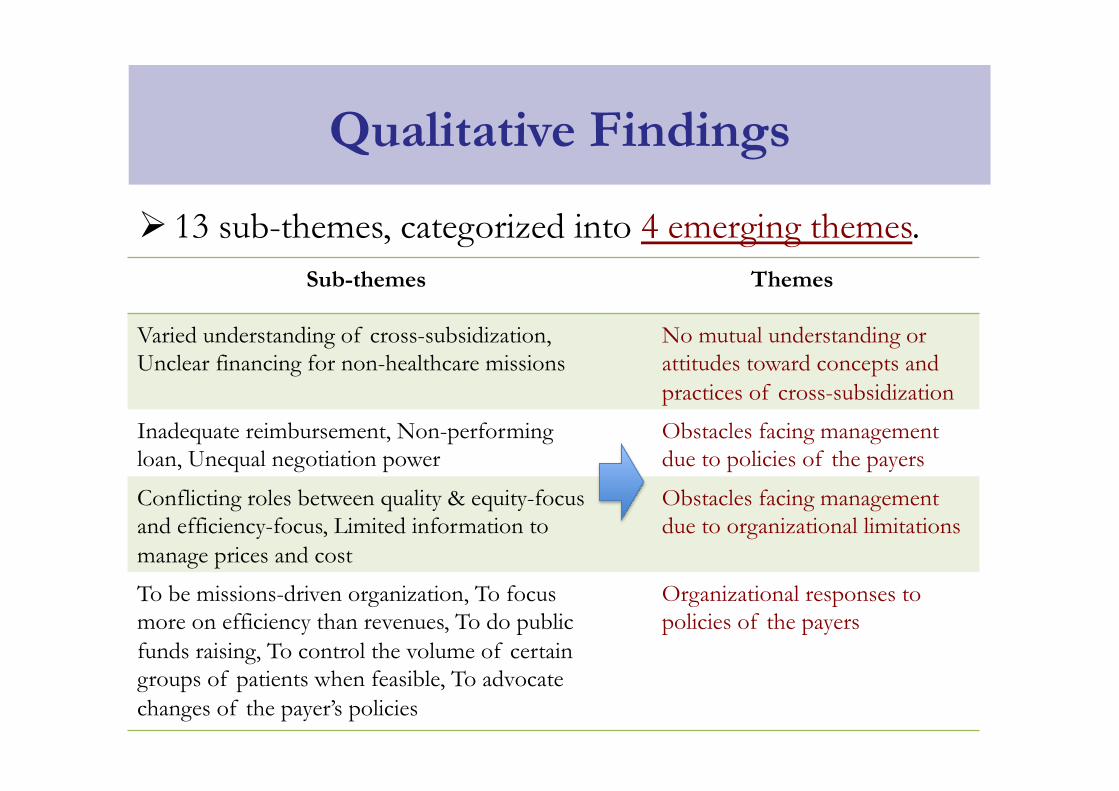
Ø 13 sub-themes, categorized into 4 emerging themes.
Qualitative Findings
Sub-themes Themes
Varied understanding of cross-subsidization, Unclear financing for non-healthcare missions
No mutual understanding or attitudes toward concepts and practices of cross-subsidization
Inadequate reimbursement, Non-performing loan, Unequal negotiation power
Obstacles facing management due to policies of the payers
Conflicting roles between quality & equity-focus and efficiency-focus, Limited information to manage prices and cost
Obstacles facing management due to organizational limitations
To be missions-driven organization, To focus more on efficiency than revenues, To do public funds raising, To control the volume of certain groups of patients when feasible, To advocate changes of the payer’s policies
Organizational responses to policies of the payers

#1 No Mutual Understanding or Attitudes
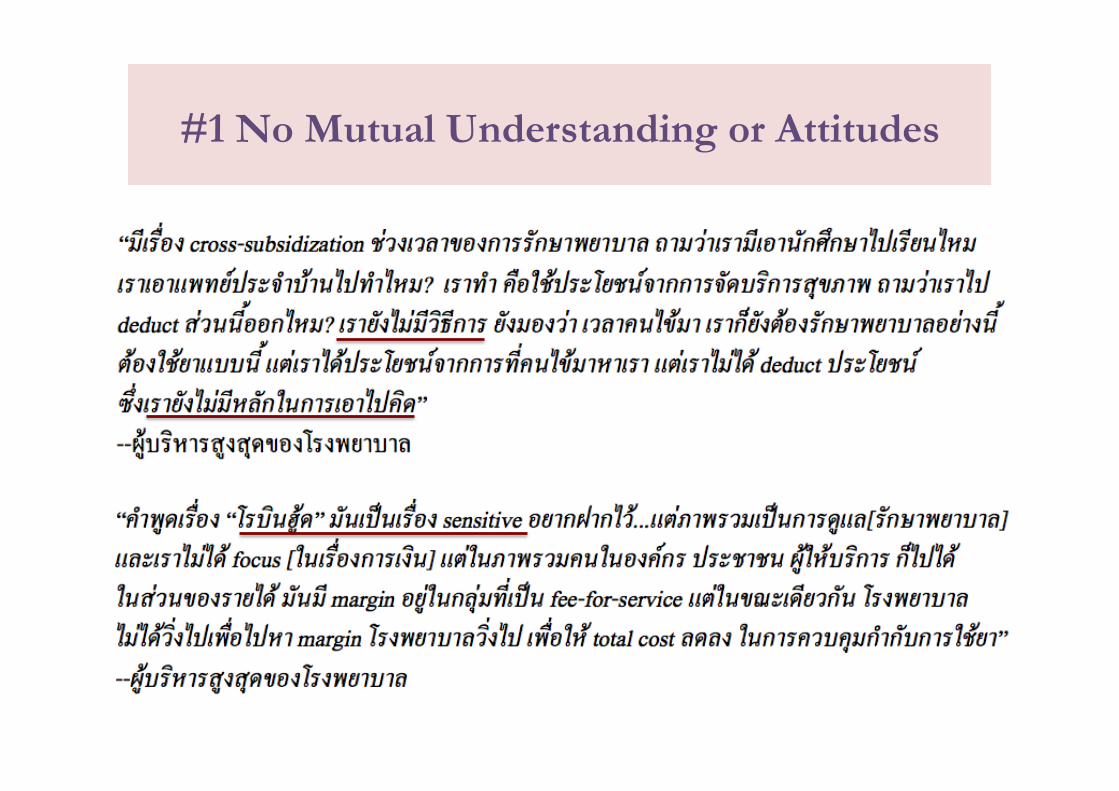
#1 No Mutual Understanding or Attitudes
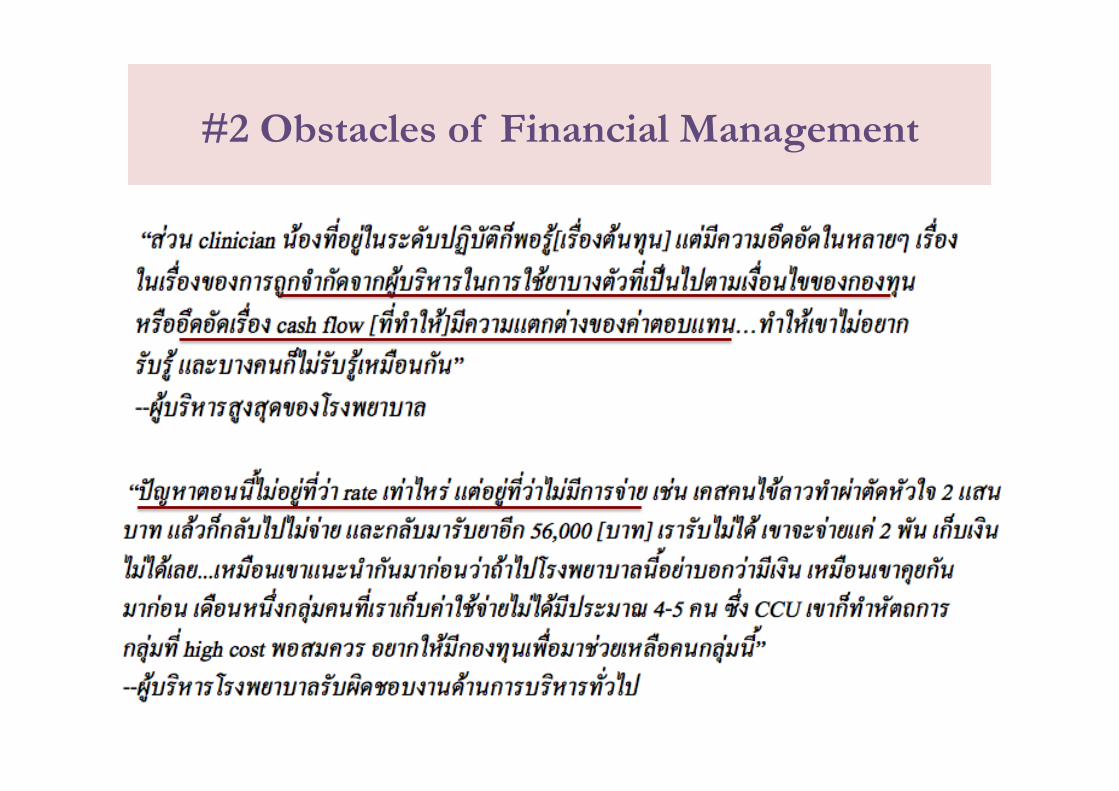
#2 Obstacles of Financial Management
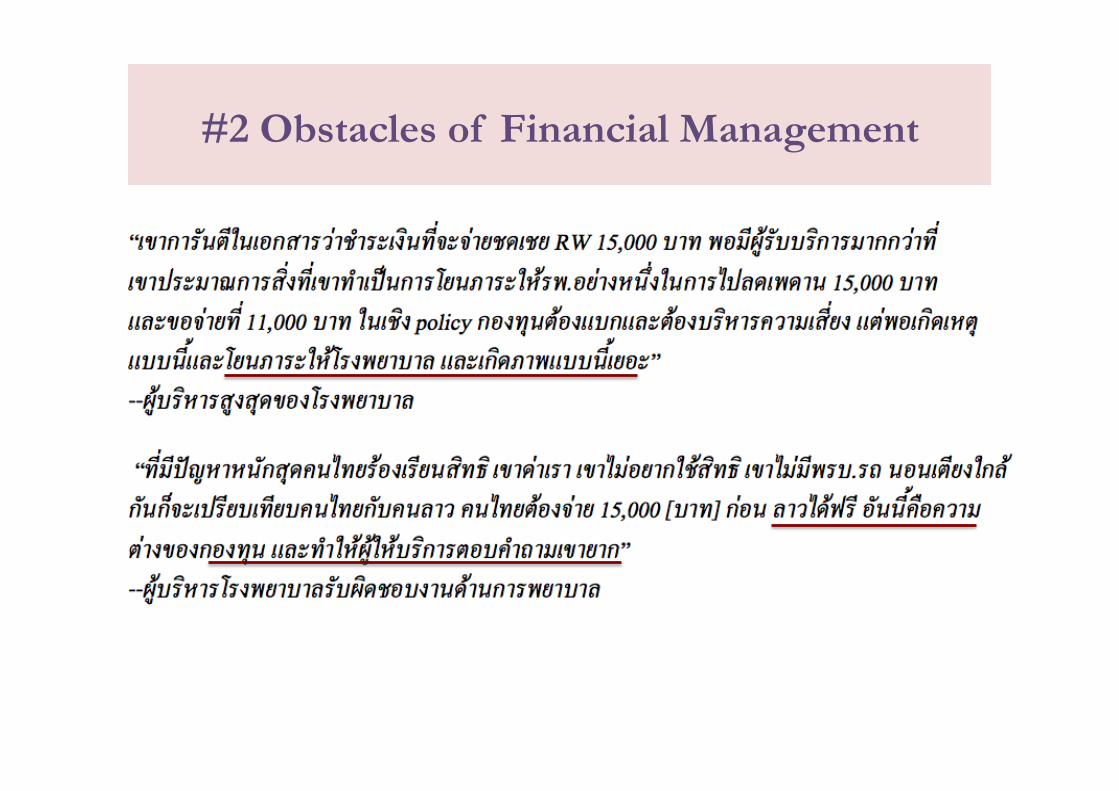
#2 Obstacles of Financial Management
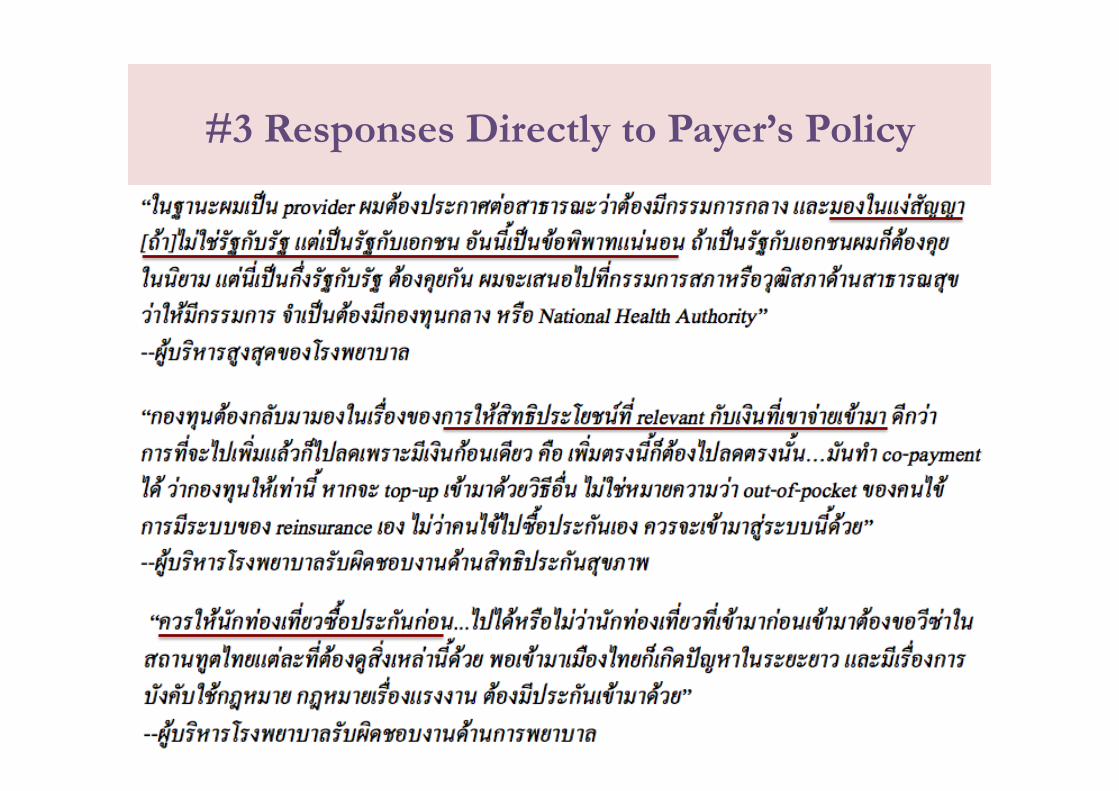
#3 Responses Directly to Payer’s Policy
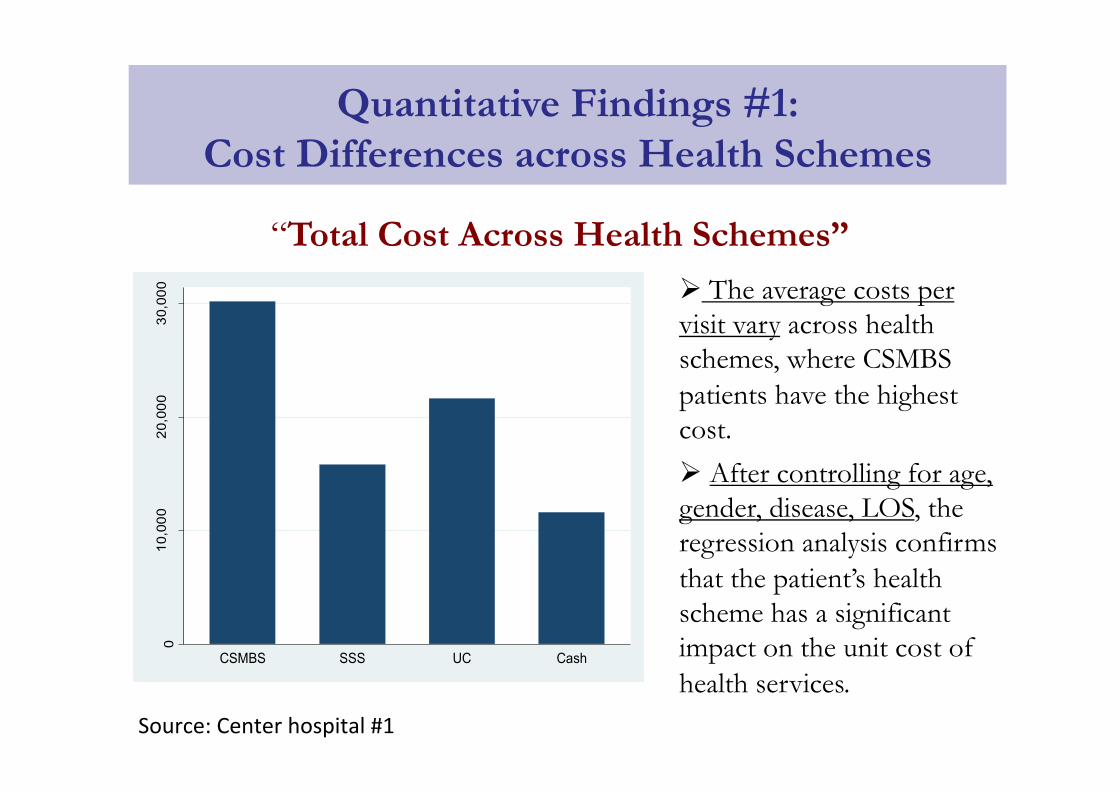
Quantitative Findings #1: Cost Differences across Health Schemes
“Total Cost Across Health Schemes”
010
,000
20,0
0030
,000
mea
n of
tota
lcos
t
CSMBS SSS UC Cash
Source: Center hospital #1
Ø The average costs per visit vary across health schemes, where CSMBS patients have the highest cost.
Ø After controlling for age, gender, disease, LOS, the regression analysis confirms that the patient’s health scheme has a significant impact on the unit cost of health services.
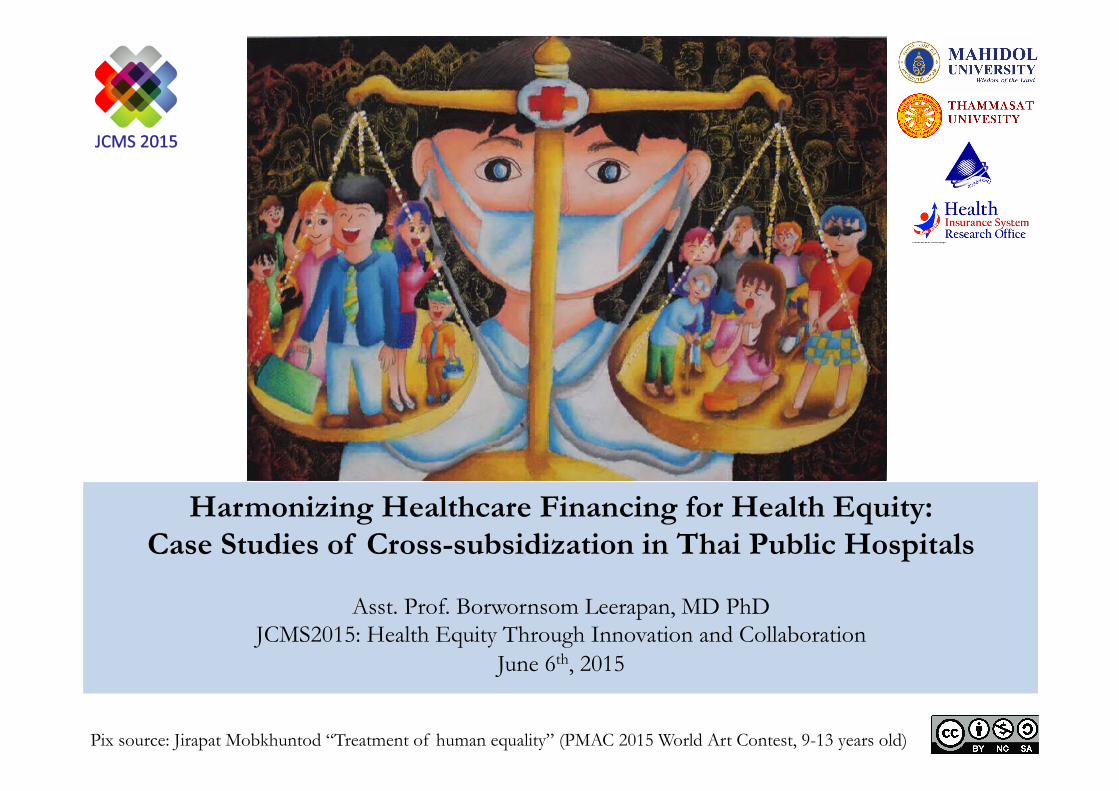
Quantitative Findings #2: Profit or Loss across Health Schemes
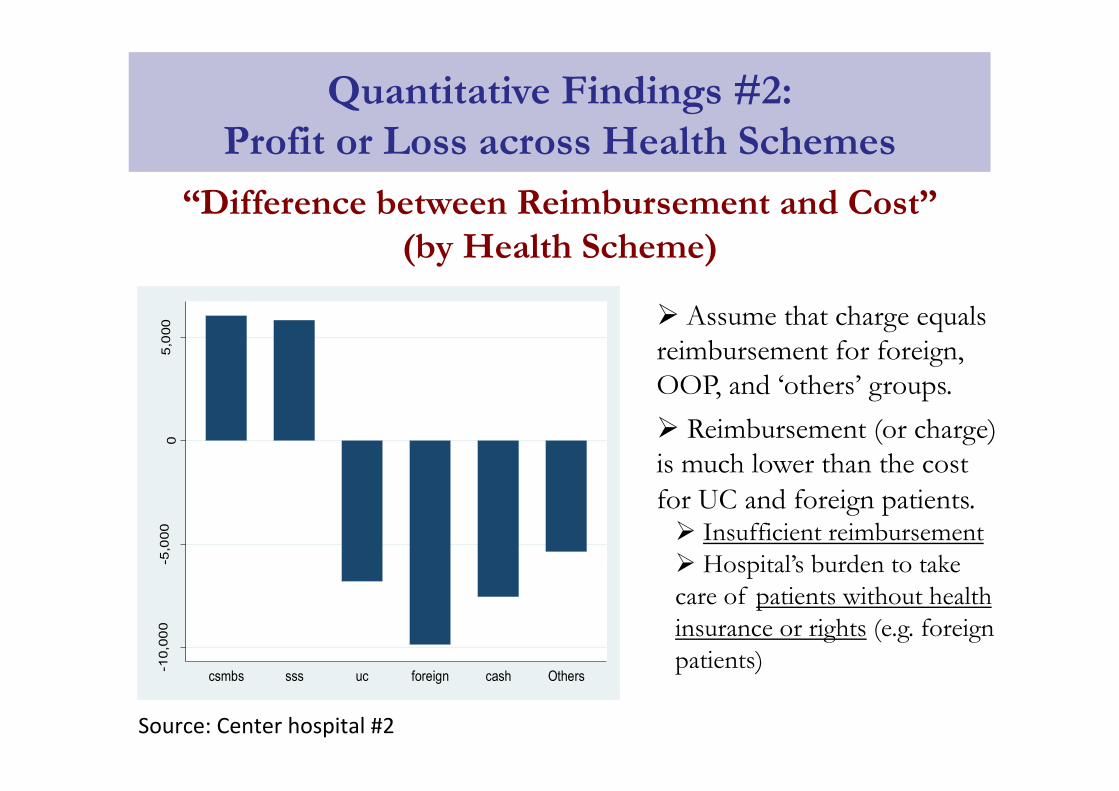
“Difference between Reimbursement and Cost” (by Health Scheme)
-10,
000
-5,0
000
5,0
00
me
an o
f rei
mb_
cost
_diff
csmbs sss uc foreign cash Others
Source: Center hospital #2
Ø Assume that charge equals reimbursement for foreign, OOP, and ‘others’ groups.
Ø Reimbursement (or charge) is much lower than the cost for UC and foreign patients. Ø Insufficient reimbursement Ø Hospital’s burden to take care of patients without health insurance or rights (e.g. foreign patients)
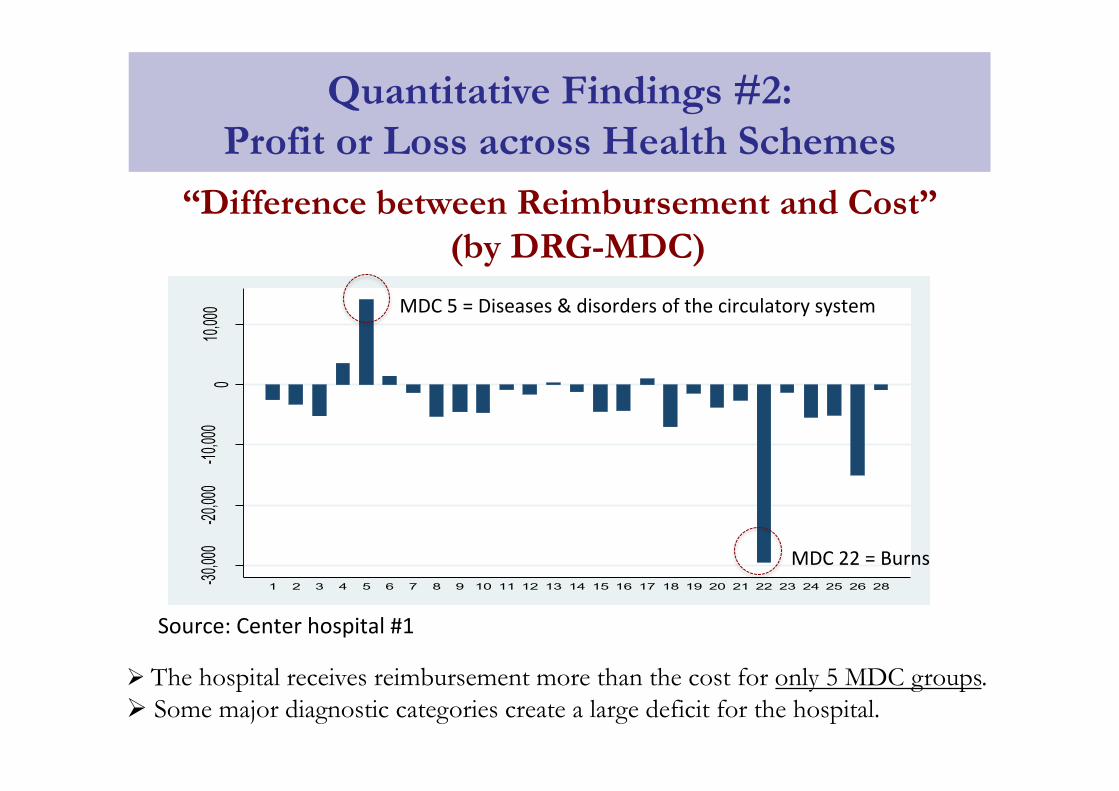
“Difference between Reimbursement and Cost” (by DRG-MDC)
-30,00
0-20
,000
-10,00
00
10,000
mean
of reim
b_cost
_diff
1 2 3 4 5 6 7 8 9 10 11 12 13 14 15 16 17 18 19 20 21 22 23 24 25 26 28
Source: Center hospital #1
Ø The hospital receives reimbursement more than the cost for only 5 MDC groups. Ø Some major diagnostic categories create a large deficit for the hospital.
MDC 5 = Diseases & disorders of the circulatory system
MDC 22 = Burns
Quantitative Findings #2: Profit or Loss across Health Schemes
Quantitative Findings #2: Profit or Loss across Health Schemes
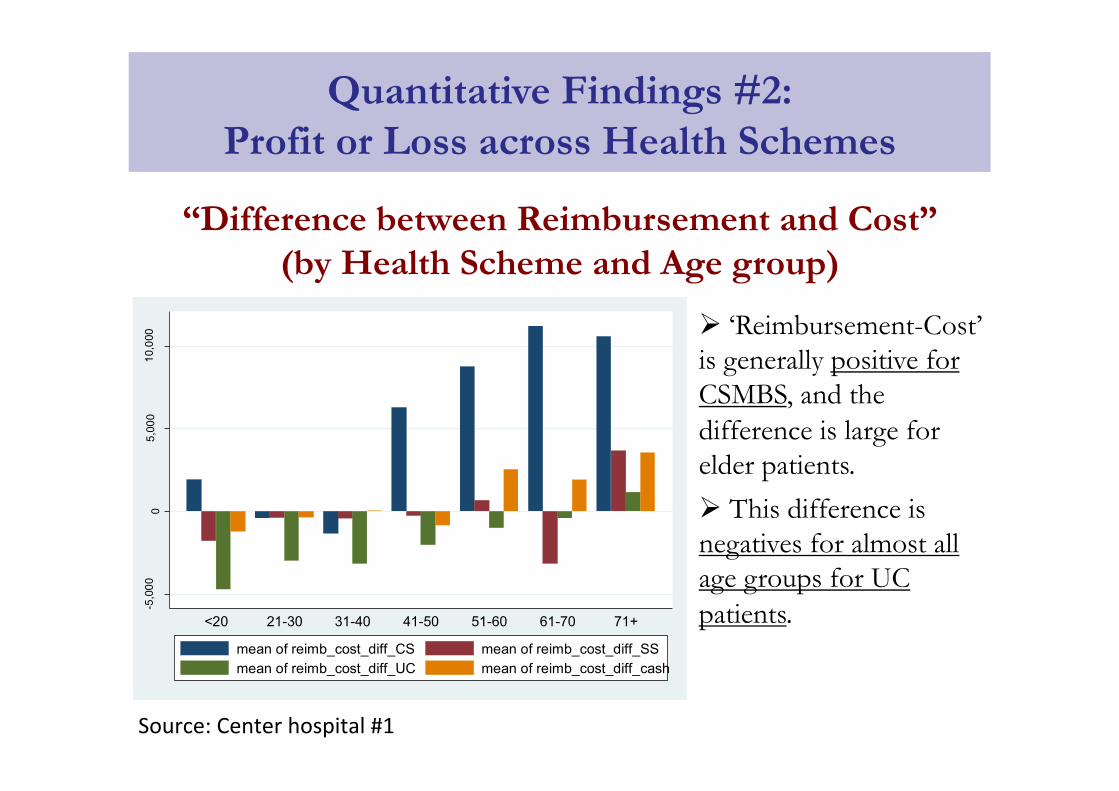
“Difference between Reimbursement and Cost” (by Health Scheme and Age group)
-5,0
000
5,00
010
,000
<20 21-30 31-40 41-50 51-60 61-70 71+
mean of reimb_cost_diff_CS mean of reimb_cost_diff_SSmean of reimb_cost_diff_UC mean of reimb_cost_diff_cash
Source: Center hospital #1
Ø ‘Reimbursement-Cost’ is generally positive for CSMBS, and the difference is large for elder patients.
Ø This difference is negatives for almost all age groups for UC patients.
• Given our limited datasets, we found no direct evidence that suggests hospitals cost-shift by increasing prices charged to out-of-pocket payment (OPP) patients to compensate for the loss.
• Yet, patterns of decision-making of hospital administrators related to cross-subsidization were found.
• Therefore, financing policies of one health scheme also impact other patients groups within the hospitals.
What Do Findings Tell Us?

Mental Models of Hospital Administrators
Implications for Policy and Practice
Ø To policymakers: • Demonstrates an empirical evidence of
that current healthcare financing of hospitals still inappropriate/inadequate.
• Suggests that payments from particular payers potentially can be used as a “buffer” for hospitals, potentially leading to “passive cross-subsidization” and inequity issues of healthcare access.
• Suggests the needs to “harmonize” healthcare financing in a more efficient and equitable fashion.