Embed Size (px)
Citation preview

Serge FerrariService and Laboratory of Bone Diseases
Geneva University Hospital and Faculty of Medicine
Switzerland
Diabetes and bone fragility: challenges and opportunities

Diabetes increases with age and longevity
Cornier, Endo Rev 2008; Yach, Nat med 2006

Bone fragility in diabetics – A historical perspective► Decreased skeletal mass and bone development in children with longstanding
diabetes (Morrison LB & Bogan IK. Am J Med Sci 1927)
► Cases of diabetes associated with vertebral crush fractures from the Joslin clinic (Root HF, White P & Marble A. Arch Intern Med 1934)
► Bone fragility in diabetic patients (Albright F & Reifenstein EC. Parathyroid glands and metabolic bone disease: selected studies. Baltimore: Williams and Wilkins 1948)
► Osteoporosis in cadaveric bones more severe in young adults with diabetes (Hernberg CA. Acta Med Scand 1952)
► Diabetes increases fracture risk (Alffram PA. An Epidemiologic Study of Cervical and Trochanteric Fractures of the Femur in an Urban Population. Analysis of 1,664 Cases with Special Reference to Etiologic Factors. Acta Orthop Scand Suppl 1968)
► Decreased elastic response of bone in vivo by ulnar resonant frequency in osteoporotic, diabetic and normal subjects (Jurist JM. Phys Med Biol 1970)
► BMD 36-48% lower in insulin-requiring diabetics (Ringe JD, Kuhlencordt F & Kruse HP. AJR Am J Roentgenol 1976).

Diabetes mellitus and Fracture Risk
Type 1 Diabetes Type 2 Diabetes
Any fracture 1.30 (1.16, 1.46) 1.19 (1.11, 1.27)
Hip fracture 1.70 (1.31, 2.21) 1.38 (1.18, 1.60)
Wrist fracture 1.04 (0.76, 1.44) 1.21 (1.01, 1.45)
Spine fracture 2.48 (1.33, 4.62) 1.34 (0.97, 1.86)
Vestergaard et al, Diabetologia 2005, 48: 1292
Case-control study (Denmark)N=124‘655 cases, n=373‘962 controls (age 43 yrs)*Adjusted for multiple clinical covariables

Type 1 and fractures – meta-analysis
Shah, Diabet Med 2015
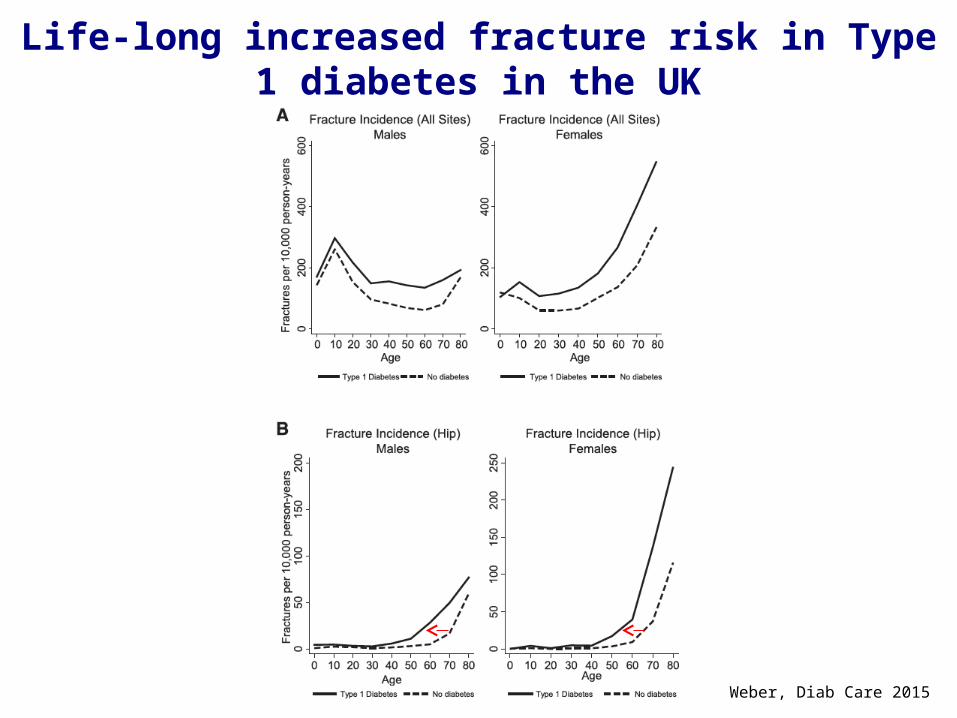
Life-long increased fracture risk in Type 1 diabetes in the UK
Weber, Diab Care 2015

Low BMD in type 1 diabetesB
one
mas
s
10 20
yrs
Diabetes
Adapted from Sylvester, Inflamm Bow Dis 2005

Decreased bone formation in children with Diabetes
Maggio, JPEM 2010

Decreased bone size in children/adolescent T1D - pQCT
Saha, OI 2009Bechtold , Diabetes Care 2007
Females
Males

MVC: Correlation to microvascular diseaseGC: Correlation to glucose control Hough, Ferrari et al., Eur J Endocrinol 2016

Microstructural alterations in young adults with T1D– micro-MRI
Abdalrahaman , JBMR 2015
Mean age 22 yrs
Significantly lower IGF-1(Increased bone marrow adiposity)

Group A
PA< PROT<
(N=40)
Group B
PA > PROT <
(N=26)
Group C
PA < PROT >
(N=24)
Group D
PA> PROT >
(N=34)
P
Total vBMD (mg HA/cm2) 245 ± 46 264 ± 54 276 ± 43 267 ± 40 0.747
Cortical vBMD (mg HA/cm2) 726 ± 56 736 ± 54 739 ± 54 731 ± 56 0.807
Trabecular vBMD (mg HA/cm2) 199 ± 27 195 ± 31 205 ± 25 205 ± 27 0.413
BV/TV (%) 16.6 ± 2.2 16.3 ± 2.6 17.1 ± 2.1 17.1 ± 2.2 0.415
Tb.N (mm-1) 2.04 ± 0.23 2.00 ± 0.23 2.10 ± 0.25 2.21 ± 0.35 0.015
Tb.Th (m) 81.6 ± 10.5 81.6 ± 12.0 82.3 ± 10.9 78.3 ± 10.9 0.474
Tb.Sp (m) 415 ± 50 424 ± 57 402 ± 61 385 ± 65 0.044
Ct.Th (m) 798 ± 324 832 ± 367 878 ± 321 814 ± 298 0.809
CSA (mm2) 833 ± 126 854 ± 120 847 ± 111 955 ± 172 0.001
Impact of Physical Activity and Protein Intake on Bone Density and Microstructure at Distal Tibia in Healthy
Adolescent BoysHR-pQCT
Chevalley et al, JBMR 2014
PA : Physical activityPROT: Protein Intake

Low turnover, Higher non-enzymatic collagen crosslinks and degreee of mineralization in T1D
Farlay, JBMR 2015
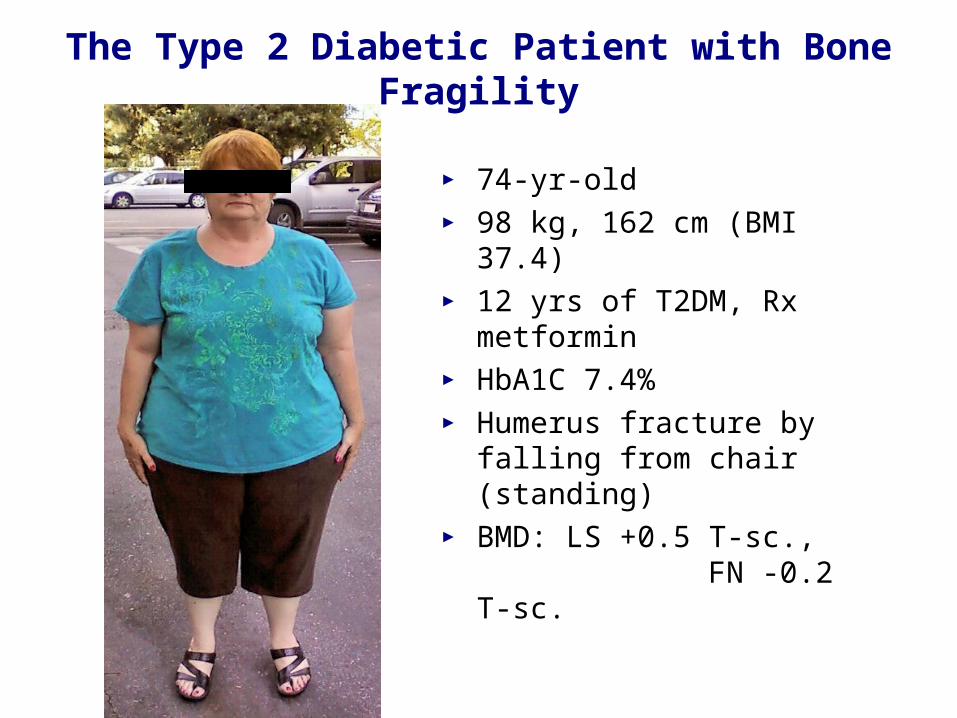
The Type 2 Diabetic Patient with Bone Fragility
► 74-yr-old► 98 kg, 162 cm (BMI 37.4)► 12 yrs of T2DM, Rx
metformin► HbA1C 7.4%► Humerus fracture by falling
from chair (standing)► BMD: LS +0.5 T-sc.,
FN -0.2 T-sc.

Fracture Risk in Type 2 Diabetes: WHI
RR (95%CI)*
Any fracture 1.20 (1.11, 1.30)
Hip, pelvis, upper leg 1.46 (1.17, 1.83)
Lower leg, ankle, knee 1.13 (0.95, 1.34)
Foot 1.32 (1.07, 1.62)
Upper arm, shoulder 1.13 (0.90, 1.41)
Lower arm, wrist, hand 1.02 (0.85, 1.22)
Spine 1.27 (1.00, 1.61)
*adjusted for age, ethnicity, weight, height, fall history, previous fracture, history of osteoporosis, smokung, alcohol, exercise, medication incl. Calcium, vitamin d estrogen and bisphosphonates
Bonds et al, J Clin Endocrinol Metab 2006, 91: 3404
Women‘s Health Initiative Observational Study(follow-up 7 yrs)n=93‘676, age at baseline 64 yrs (DM2, n=5285)

Linear increase in hip fracture incidence with increasing HbA1c.
Li et al.J Bone Miner Res 2015 30: 1338–46.
A1c>10
A1c<6

Hip fracture risk in Diabetes:9 years Cohort study of 35’000 subjects 50+ from
Norway
Forsen, Diabetologia 1999

Impact of Antidiabetic Therapy on Bone
Palermo, OI 2015

BMD in Type 2 Diabetes: WHI
Bonds et al, J Clin Endocrinol Metab 2006, 91: 3404
BMD 5-10% higher in diabetics

10-yrs fracture risk higher at every BMD level in diabetics
A Schwartz et al., JAMA 2011

MOF – FRAX with BMDAge 40+, 6455 Diabetic vs 55,958 Non-diabetic
Without diabetes With diabetes
MODEL 1 HR (95% CI) HR (95% CI) p-interactionAge (per 10 y) 1.43 (1.38-1.47) 1.39 (1.27-1.53) 0.781Sex (male vs female) 0.90 (0.79-1.02) 1.04 (0.78-1.39) 0.407
BMI (per 5 kg/m2) 0.98 (0.95-1.02) 0.90 (0.83-0.98) 0.080Current smoking 1.31 (1.06-1.64) 1.75 (1.06-2.87) 0.392Parental hip fracture 0.82 (0.64-1.04) 0.69 (0.37-1.29) 0.584Glucocorticoid use 1.30 (1.14-1.48) 1.13 (0.83-1.54) 0.398
Rheumatoid arthritis 1.43 (1.24-1.64) 1.74 (1.21-2.49) 0.325High alcohol use 2.02 (1.70-2.41) 1.98 (1.27-3.09) 0.941Any prior fracture 1.62 (1.51-1.74) 1.72 (1.42-2.07) 0.588Femoral neck T-score 1.68 (1.61-1.75) 1.60 (1.44-1.79) 0.456
omnibus test of all interactions: p-value 0.140
Leslie WD. Osteoporos Int. 2014; 25:2817
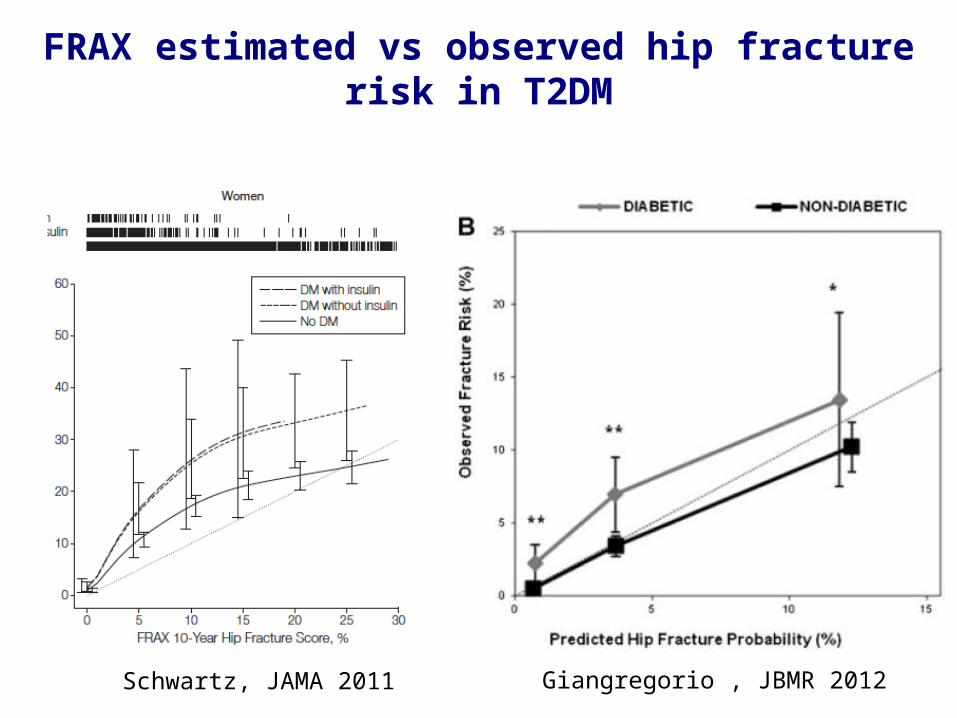
FRAX estimated vs observed hip fracture risk in T2DM
Schwartz, JAMA 2011 Giangregorio , JBMR 2012

Clinical Implications
► Fracture prediction tools in diabetes can still use conventional risk factors:
– Lower BMD increases risk for fracture in DM– Higher BMI protective for fracture in DM
► Diabetes was a risk factor for fracture:– MOF adjusted HR 1.32 [95% CI 1.20-1.46]
Leslie WD. Osteoporos Int. 2014; 25:2817

Is TBS Helpful in Diabetes?29,407 women ≥50 years with baseline DXA
BMD (g/cm2)
Diabetes – No diabetes
Mean (95% CI)Lumbar
spine +0.031(+0.024 : +0.038)
Femoral neck +0.012
(+0.007 : +0.016)
Trochanter +0.008(+0.003 : +0.013)
Total hip +0.019(+0.014 : +0.025)
TBS -0.051(-0.056 : -0.046)* Adjusted for age, BMI, glucocorticoids, prior major fracture, rheumatoid
arthritis, COPD, alcohol abuse and osteoporosis therapy.
Leslie WD et al. JCEM 2013.
TBS predicted incident major OP fractures - With DM: aHR 1.27 - Without DM: aHR 1.31 - No interaction

FRAX ± TBS in T2D
With TBS 1.15, fracture probability 16% (hip 1%)

Influence of fat on TBS
Amnuaywattakom et al., BMC Musculoskel Dis 2016

Trunk fat mass and TBS in GERICO(n=738 post-menopausal women)

Conceptual framework for diabetes and fractures
-6 -5 -4 -3 -2 -1 0 1
Rela
tive
risk
MO
F
BMD T-score
No DM DM
DIO=diabetes induced
osteoporosis
Osteoporosis unrelated
to DM
DBD=diabetic bone
disease
Adapted from Leslie WD. Osteoporos Int. 2014; 25:2817

Increased cortical porosity in T2DM with fractures (HR-pQCT)
Patsch, JBMR 2013Burghardt, JCEM 2010

Increased cortical porosity in T2DM is associated with microvascular disease
Radius (HR-pQCT)
Shanbhogue, Eur J Endocrinol 2016

Altered bone material strength in diabetes
Farr, JBMR 2014
Merlotti 2010

Algorithm for Management of Osteoporosis in Postmenopausal women and men over 50 years with T 2DM IOF/CSA Working Group-in preparation
Rapid BMD loss on follow-upAdjusted Frax probability (TBS?) / Lower intervention
thresholdsNew Markers ?
Women & men with T2DM
No
Measure BMD (T-score
Typical osteoporotic fracture*
> -2.5
Consider specific anti-fracture medication Life-style measures only Yes
Yes
≤ -2.5
NoIGF-1AGEs
?
*Fracture of spine, hip, pelvis or
humerus
# CRFs, substitute RA with T2DM •Advanced age•Prior #•F/H of hip #•Alcohol, smoking•GCs, hypogonadism•High fall propensity•Insulin therapy
?

Conclusions► Diabetes increases the risk of fragility fractures (T1D > T2D)
► Bone fragility in diabetes is characterized by predominant alterations of bone quality (microarchitecture, material properties) with or without reductions of BMD (T1D < T2D)
– In T2D bone quality alterations overcome the higher BMD
► Bone fragility increases with poor glucose control, diabetes duration, microvascular complications, need of insulin and some antidiabetics (glitazones, ? Canaglifozin,..)
► New markers of fracture risk in diabetes, specially type 2, which reflect alterations in « bone quality » need to be developed and evaluated
► The effects of osteoporosis drugs on reducing bone fragility in diabetes remain to be prospectively evaluated

AcknowledgementsIOF Diabetes & Bone WG:Stephen Hough (co-chair)Bo Abrahamsen Mohammed-Salleh Ardawi Massimo Benedetti Manju Chandran Cyrus Cooper Richard Eastell Ghada Eli Hajj Fullheihan Bob Josse David Kendler Marius Kraenzlin Bill Leslie Nicola Napoli Dominique Pierroz Atsushi Suzuki Ann Schwartz
Geneva Bone Diseases Clinical Research group:
Emmanuel BiverThierry ChevalleyRené RizzoliFanny MerminodAnne SigaudMagaly HarsChantal GenetJulio Conicella