Embed Size (px)
Citation preview

Saczynski, Micah L. Thorp, Grace Hsu, Sue Hee Sung and Alan S. GoLarry A. Allen, David J. Magid, Jerry H. Gurwitz, David H. Smith, Robert J. Goldberg, Jane
Contemporary Heart Failure PopulationRisk Factors for Adverse Outcomes by Left Ventricular Ejection Fraction in a
Print ISSN: 1941-3289. Online ISSN: 1941-3297 Copyright © 2013 American Heart Association, Inc. All rights reserved.
75231is published by the American Heart Association, 7272 Greenville Avenue, Dallas, TXCirculation: Heart Failure
doi: 10.1161/CIRCHEARTFAILURE.112.0001802013;6:635-646; originally published online May 24, 2013;Circ Heart Fail.
http://circheartfailure.ahajournals.org/content/6/4/635World Wide Web at:
The online version of this article, along with updated information and services, is located on the
http://circheartfailure.ahajournals.org/content/suppl/2013/05/24/CIRCHEARTFAILURE.112.000180.DC1.htmlData Supplement (unedited) at:
http://circheartfailure.ahajournals.org//subscriptions/
is online at: Circulation: Heart Failure Information about subscribing to Subscriptions:
http://www.lww.com/reprints Information about reprints can be found online at: Reprints:
document. Permissions and Rights Question and Answer about this process is available in the
located, click Request Permissions in the middle column of the Web page under Services. Further information isthe Editorial Office. Once the online version of the published article for which permission is being requested
can be obtained via RightsLink, a service of the Copyright Clearance Center, notCirculation: Heart Failurein Requests for permissions to reproduce figures, tables, or portions of articles originally publishedPermissions:
by guest on November 30, 2013http://circheartfailure.ahajournals.org/Downloaded from by guest on November 30, 2013http://circheartfailure.ahajournals.org/Downloaded from by guest on November 30, 2013http://circheartfailure.ahajournals.org/Downloaded from by guest on November 30, 2013http://circheartfailure.ahajournals.org/Downloaded from by guest on November 30, 2013http://circheartfailure.ahajournals.org/Downloaded from by guest on November 30, 2013http://circheartfailure.ahajournals.org/Downloaded from by guest on November 30, 2013http://circheartfailure.ahajournals.org/Downloaded from by guest on November 30, 2013http://circheartfailure.ahajournals.org/Downloaded from

635
Heart failure (HF) is associated with high morbidity and mortality,1 but prognosis can vary significantly between
individual patients. Accurate risk stratification is important for understanding patient factors associated with poor outcomes and, by extension, communicating expectations with patients, identifying potential targets for intervention, tailoring the intensity of care decisions, and creating risk-standardized out-comes measures.2
Clinical Perspective on p 646
Although several different HF prognostic models have been published,3–9 existing models are limited by several factors, including a lack of standardization in the choice
and evaluation of candidate predictor variables, derivation and validation within narrow patient cohorts, and a focus on death alone as the outcome of interest. As a consequence, we have limited insights into how various factors relate to prog-nosis across different categories of left ventricular ejection fraction (LVEF) for both fatal and nonfatal end points. With the changing epidemiology of HF during the past several decades, the majority of patients with HF in the United States now have preserved LVEF (HF-PEF) rather than reduced LVEF (HF-REF).10 Although HF-PEF patients have high rates of adverse outcomes,11,12 there are very limited clinical trial data to guide treatment in these patients. Another notable knowledge gap involves the subset of patients with neither
Original Article
© 2013 American Heart Association, Inc.
Circ Heart Fail is available at http://circheartfailure.ahajournals.org DOI: 10.1161/CIRCHEARTFAILURE.112.000180
10.1161/CIRCHEARTFAILURE.112.000180
2013
16
July
6
4
635
646
© 2013 American Heart Association, Inc.
2013
Received July 6, 2012; accepted May 21, 2013.From the Institute for Health Research, Kaiser Permanente Colorado, Denver, CO (L.A.A., D.J.M.); Colorado Cardiovascular Outcomes Research
Consortium (L.A.A., D.J.M.), Division of Cardiology, Department of Medicine (L.A.A.), and Department of Emergency Medicine (D.J.M.), University of Colorado School of Medicine, Aurora, CO; Meyers Primary Care Institute and University of Massachusetts Medical School, Worcester, MA (J.H.G., R.J.G., J.S.); Kaiser Permanente Center for Health Research, Portland, OR (D.H.S., M.L.T.); Division of Research, Kaiser Permanente of Northern California, Oakland, CA (G.H., S.H.S., A.S.G.); Departments of Epidemiology, Biostatistics, and Medicine, University of California, San Francisco, CA (A.S.G.); Department of Health Research and Policy, Stanford University School of Medicine, Palo Alto, CA (A.S.G.).
The online-only Data Supplement is available at http://circheartfailure.ahajournals.org/lookup/suppl/doi:10.1161/CIRCHEARTFAILURE. 112.000180/-/DC1.
Correspondence to Larry A. Allen, MD, MHS, Anschutz Medical Campus, Academic Office 1, 12631 East 17th Ave, Mailstop B130, Aurora, CO 80045. E-mail [email protected].
Allen et al Prognostic Factors by LVEF Group
Background—Although heart failure (HF) is a syndrome with important differences in response to therapy by left ventricular ejection fraction (LVEF), existing risk stratification models typically group all HF patients together. The relative importance of common predictor variables for important clinical outcomes across strata of LVEF is relatively unknown.
Methods and Results—We identified all members with HF between 2005 and 2008 from 4 integrated healthcare systems in the Cardiovascular Research Network. LVEF was categorized as preserved (LVEF ≥50% or normal), borderline (41%–49% or mildly reduced), and reduced (≤40% or moderately to severely reduced). We used Cox regression models to identify independent predictors of death and hospitalization by LVEF category. Among 30 094 ambulatory adults with HF, mean age was 74 years and 46% were women. LVEF was preserved in 49.5%, borderline in 16.2%, and reduced in 34.3% of patients. During a median follow-up of 1.8 years (interquartile range, 0.8–3.1), 8060 (26.8%) patients died, 8108 (26.9%) were hospitalized for HF, and 20 272 (67.4%) were hospitalized for any reason. In multivariable models, nearly all tested covariates performed similarly across LVEF strata for the outcome of death from any cause, as well as for HF-related and all-cause hospitalizations.
Conclusions—We found that in a large, diverse contemporary HF population, risk assessment was strikingly similar across all LVEF categories. These data suggest that, although many HF therapies are uniquely applied to patients with reduced LVEF, individual prognostic factor performance does not seem to be significantly related to level of left ventricular systolic function. (Circ Heart Fail. 2013;6:635-646.)
Key Words: heart failure ■ outcomes assessment (health care) ■ prognosis ■ risk factors
Risk Factors for Adverse Outcomes by Left Ventricular Ejection Fraction in a Contemporary
Heart Failure PopulationLarry A. Allen, MD, MHS; David J. Magid, MD, MPH; Jerry H. Gurwitz, MD;
David H. Smith, RPh, MHA, PhD; Robert J. Goldberg, PhD; Jane Saczynski, PhD; Micah L. Thorp, DO, MPH; Grace Hsu, MPH; Sue Hee Sung, MPH; Alan S. Go, MD
100,110
by guest on November 30, 2013http://circheartfailure.ahajournals.org/Downloaded from

636 Circ Heart Fail July 2013
Table 1. Baseline Characteristics Among 30 094 Patients Identified Between 2005 and 2008, Overall and Stratified by Left Ventricular Ejection Fraction
CharacteristicsOverall Cohort
(N=30 094)Preserved LVEF
(n=14 907)Borderline LVEF
(n=4862)Reduced LVEF
(n=10 325)D Values Reduced
vs PreservedD Values Reduced
vs Borderline
Age, y; mean (SD) 73.7 (12.4) 75.6 (11.6) 73.0 (12.2) 71.2 (13.0)
Age categories, y 0.29 0.09
<45 694 (2.3) 212 (1.4) 102 (2.1) 380 (3.7)
45–54 1823 (6.1) 636 (4.3) 326 (6.7) 861 (8.3)
55–64 4408 (14.7) 1757 (11.8) 778 (16.0) 1873 (18.1)
65–74 7496 (24.9) 3553 (23.8) 1277 (26.3) 2666 (25.8)
75–84 10 388 (34.5) 5608 (37.6) 1597 (32.9) 3183 (30.8)
≥85 5285 (17.6) 3141 (21.1) 782 (16.1) 1362 (13.2)
Women, n (%) 13 848 (46.0) 8610 (57.8) 1920 (39.5) 3318 (32.1)
Medical history, n (%)
Prevalent heart failure 18 090 (60.1) 8695 (58.3) 2990 (61.5) 6405 (62.0) 0.09 0.01
Acute myocardial Infraction 4172 (13.9) 1588 (10.7) 861 (17.7) 1723 (16.7) 0.31 0.04
Unstable angina 2129 (7.1) 1026 (6.9) 411 (8.5) 692 (6.7) 0.02 0.15
Coronary artery bypass surgery 1938 (6.4) 911 (6.1) 402 (8.3) 625 (6.1) 0.006 0.20
Percutaneous coronary intervention 3220 (10.7) 1294 (8.7) 674 (13.9) 1252 (12.1) 0.23 0.09
Ischemic stroke or transient ischemic attack 2422 (8.1) 1299 (8.7) 378 (7.8) 745 (7.2) 0.12 0.05
Cerebrovascular disease 6361 (21.1) 3299 (22.1) 1069 (22.0) 1993 (19.3) 0.10 0.10
Other thromboembolic event 252 (0.8) 126 (0.9) 48 (1.0) 78 (0.8) 0.07 0.16
Atrial fibrillation or flutter 11 363 (37.8) 6353 (42.6) 1812 (37.3) 3198 (31.0) 0.31 0.17
Ventricular tachycardia or fibrillation 975 (3.2) 245 (1.6) 180 (3.7) 550 (5.3) 0.74 0.23
Mitral and aortic valvular disease 7330 (24.4) 4094 (27.5) 1173 (24.1) 2063 (20.0) 0.25 0.15
Peripheral arterial disease 2782 (9.2) 1417 (9.5) 502 (10.3) 863 (8.4) 0.09 0.14
Rheumatic heart disease 705 (2.3) 421 (2.8) 93 (1.9) 191 (1.9) 0.26 0.02
Cardiac resynchronization therapy 82 (0.3) 16 (0.1) 25 (0.5) 41 (0.4) 0.79 0.16
Implantable cardioverter defibrillator 1007 (3.4) 164 (1.1) 151 (3.1) 692 (6.7) 1.13 0.49
Pacemaker 2104 (7.0) 974 (6.5) 363 (7.5) 767 (7.4) 0.08 0.003
Dyslipidemia 20 229 (67.2) 9866 (66.2) 3427 (70.5) 6936 (67.2) 0.03 0.09
Hypertension 23 613 (78.5) 12 615 (84.6) 3850 (79.2) 7148 (69.2) 0.54 0.32
Diabetes mellitus 7219 (24.0) 3552 (23.8) 1208 (24.9) 2459 (23.8) <0.001 0.03
Hospitalized bleeds 2014 (6.7) 1158 (7.8) 319 (6.6) 537 (5.2) 0.26 0.15
Diagnosed dementia 2193 (7.3) 1226 (8.2) 329 (6.8) 638 (6.2) 0.19 0.06
Diagnosed depression 5526 (18.4) 2984 (20.0) 911 (18.7) 1631 (15.8) 0.17 0.13
Chronic lung disease 12 369 (41.1) 6706 (45.0) 1920 (39.5) 3743 (36.3) 0.22 0.08
Chronic liver disease 1197 (4.0) 626 (4.2) 182 (3.7) 389 (3.8) 0.07 0.004
Mechanical fall 1042 (3.5) 618 (4.2) 166 (3.4) 258 (2.5) 0.32 0.19
Systemic cancer 2234 (7.4) 1192 (8.0) 346 (7.1) 696 (6.7) 0.11 0.04
Hemoglobin, g/L; mean (SD) 13.1 (1.9) 12.8 (1.8) 13.1 (1.9) 13.5 (1.9)
Hemoglobin category, g/L, n (%) 0.19 0.11
>16.0 1655 (5.5) 597 (4.0) 261 (5.4) 797 (7.7)
15.0–15.9 2736 (9.1) 1057 (7.1) 462 (9.5) 1217 (11.8)
14.0–14.9 4818 (16.0) 2146 (14.4) 788 (16.2) 1884 (18.3)
13.0–13.9 5938 (19.7) 3047 (20.4) 951 (19.6) 1940 (18.8)
12.0–12.9 5367 (17.8) 2946 (19.8) 845 (17.4) 1576 (15.3)
11.0–11.9 3919 (13.0) 2228 (15.0) 648 (13.3) 1043 (10.1)
10.0–10.9 2328 (7.7) 1374 (9.2) 387 (8.0) 567 (5.5)
9.0–9.9 1045 (3.5) 632 (4.2) 154 (3.2) 259 (2.5)
<9.0 427 (1.4) 258 (1.7) 77 (1.6) 92 (0.9)
(Continued )
by guest on November 30, 2013http://circheartfailure.ahajournals.org/Downloaded from

Allen et al Prognostic Factors by LVEF Group 637
preserved nor frankly reduced LVEF (ie, borderline or mildly reduced LVEF [HF-BREF]). As such, it is unclear under what circumstances and to what extent we can and should be grouping HF patients together with varying level of LVEF for
risk assessment, versus considering risk uniquely in different HF patient populations.
Understanding the relative importance of common predic-tor variables for important clinical outcomes among different
Table 1. Continued
CharacteristicsOverall Cohort
(N=30 094)Preserved LVEF
(n=14 907)Borderline LVEF
(n=4862)Reduced LVEF
(n=10 325)D Values Reduced
vs PreservedD Values Reduced
vs Borderline
Missing 1861 (6.2) 622 (4.2) 289 (5.9) 950 (9.2)
Systolic blood pressure, mm Hg; mean (SD) 131.1 (19.4) 133.4 (19.9) 131.2 (19.1) 127.7 (18.2)
Systolic blood pressure category, mm Hg; n (%) 0.28 0.19
≥180 689 (2.3) 433 (2.9) 109 (2.2) 147 (1.4)
160–179 1832 (6.1) 1124 (7.5) 291 (6.0) 417 (4.0)
140–159 5217 (17.3) 2906 (19.5) 866 (17.8) 1445 (14.0)
130–139 5646 (18.8) 2943 (19.7) 914 (18.8) 1789 (17.3)
121–129 4496 (14.9) 2238 (15.0) 729 (15.0) 1529 (14.8)
110–120 8275 (27.5) 3564 (23.9) 1363 (28.0) 3348 (32.4)
100–109 1571 (5.2) 679 (4.6) 235 (4.8) 657 (6.4)
<100 904 (3.0) 345 (2.3) 142 (2.9) 417 (4.0)
Missing 1464 (4.9) 675 (4.5) 213 (4.4) 576 (5.6)
HDL cholesterol, g/dL; mean (SD) 47.4 (14.7)
HDL cholesterol category, g/dL; n (%) 0.16 0.05
≥60 4736 (15.7) 2669 (17.9) 691 (14.2) 1376 (13.3)
50–50.9 5153 (17.1) 2676 (18.0) 789 (16.2) 1688 (16.4)
40–49.9 8188 (27.2) 4056 (27.2) 1348 (27.7) 2784 (27.0)
35–39.9 4134 (13.7) 1969 (13.2) 702 (14.4) 1463 (14.2)
<35 4728 (15.7) 2105 (14.1) 873 (18.0) 1750 (17.0)
Missing 3155 (10.5) 1432 (9.6) 459 (9.4) 1264 (12.2)
LDL cholesterol, g/dL; mean (SD) 96.5 (34.2)
LDL cholesterol category, g/dL; n (%) 0.02 0.03
≥200 262 (0.9) 108 (0.7) 50 (1.0) 104 (1.0)
160–199.9 1011 (3.4) 477 (3.2) 165 (3.4) 369 (3.6)
130–159.9 2820 (9.4) 1357 (9.1) 462 (9.5) 1001 (9.7)
100–129.9 6442 (21.4) 3304 (22.2) 1011 (20.8) 2127 (20.6)
70–99.9 10 617 (35.3) 5355 (35.9) 1725 (35.5) 3537 (34.3)
<70 5539 (18.4) 2763 (18.5) 956 (19.7) 1820 (17.6)
Missing 3403 (11.3) 1543 (10.4) 493 (10.1) 1367 (13.2)
Total cholesterol, g/dL; mean (SD) 173.4 (44.2) 173.8 (43.2) 172.5 (45.8) 173.2 (44.9)
Total cholesterol category, g/dL; n (%) 0.04 0.05
>240 1817 (6.0) 876 (5.9) 313 (6.4) 628 (6.1)
200–240 4667 (15.5) 2367 (15.9) 730 (15.0) 1570 (15.2)
<200 20 764 (69.0) 10 378 (69.6) 3418 (70.3) 6968 (67.5)
Missing 2846 (9.5) 1286 (8.6) 401 (8.2) 1159 (11.2)
Serum sodium, mmol/L; mean (SD) 139.7 (3.5) 139.6 (3.6) 139.8 (3.7) 139.7 (3.3)
Serum sodium category, mmol/L; n (%) 0.15 0.07
≥150 16 (0.1) 9 (0.1) 3 (0.1) 4 (0.0)
140–149 15503 (51.5) 7854 (52.7) 2506 (51.5) 5143 (49.8)
130–139 11299 (37.5) 5751 (38.6) 1796 (36.9) 3752 (36.3)
<130 310 (1.0) 195 (1.3) 41 (0.8) 74 (0.7)
Missing 2966 (9.9) 1098 (7.4) 516 (10.6) 1352 (13.1)
HDL indicates high-density lipoprotein; LDL, low-density lipoprotein; and LVEF, left ventricular ejection fraction.
by guest on November 30, 2013http://circheartfailure.ahajournals.org/Downloaded from

638 Circ Heart Fail July 2013
groups of left ventricular systolic function should provide needed clarity to the field of HF risk prediction. Therefore, the objective of this study was to model a common set of demographic and clinical characteristics across categories of LVEF for predicting death and hospitalization in a large, multicenter, community-based, contemporary cohort of adults with HF.
MethodsPatientsThe Cardiovascular Research Network served as the source pop-ulation.13 Participating sites for the current analysis were Kaiser Permanente Northern California, Kaiser Permanente Colorado, Kaiser Permanente Northwest, and the Fallon Community Health Plan.14 Participating sites provide care to an ethnically
DeathA PreservedLVEF
BorderlineLVEF
ReducedLVEF
Age group, year <45 40-54 55-64 65-74 75-84 >85 Women Medical History Prevalent heart failure Acute myocardial infarction Unstable anginaCoronary artery bypass surgery Percutaneous coronary interventionIschemic stroke or TIAOther thromboembolic event Atrial fibrillation or flutter Ventricular fibrillation or tachycardia Mitral or aortic valve disease Peripheral arterial disease Rheumatic heart disease Cardiac resynchronization therapy Implantable cardioverter defribillator Pacemaker Dyslipidemia Hypertension Diabetes mellitus Hospitalized bleed Diagnosed dementia Diagnosed depression Chronic lung disease Chronic liver disease Mechanical fallSystemic cancer Hemoglobin, g/L> 16 15.0-15.9 14-14.9 13.0-13.9 12.0-12.9 11.0-11.9 10.0-10.9 9.0-9.9 <9.0 Missing Systolic blood pressure, mmHg≥180 160-179 140-159 130-139 121-129 110-120 100-109 <100 MissingTotal cholesterol, g/dL>240200-240<200Missing LDL cholesterol category, g/dL>200160-199130-159100-12970-99<70MissingSerum sodium, mmol/L≥150140-149130-139<130Missing
0.1 1.0 10.0 0.1 1.0 10.0 0.1 1.0 10.0
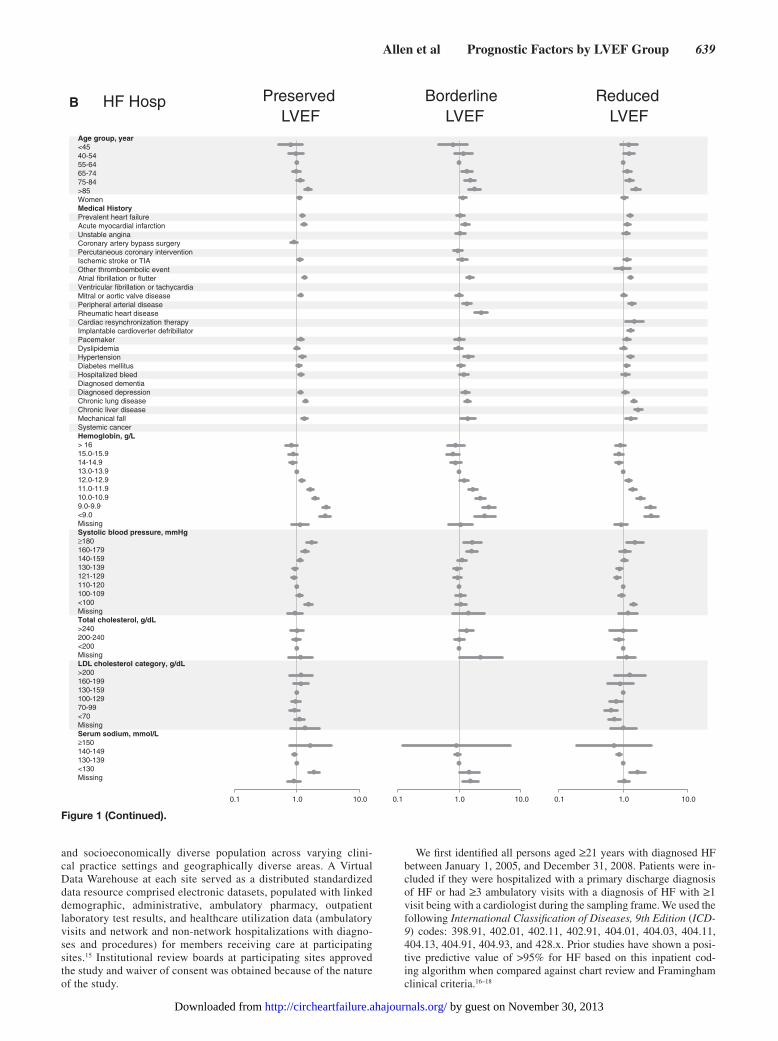
Figure 1. Multivariable predictors of various clinical outcomes among 30 056 adults with heart failure and documented left ventricular systolic function assessment (2005–2008). A, Death from any cause across left ventricular ejection fraction (LVEF) strata; (B) hospitaliza-tion for heart failure across LVEF strata; and (C) hospitalization for any cause across LVEF strata. High-density lipoprotein included in modeling, but not shown in Forest plots; see Material in the online-only Data supplement for full model details. HF indicates heart failure; LDL, low-density lipoprotein; and TIA, transient ischemic attack.
by guest on November 30, 2013http://circheartfailure.ahajournals.org/Downloaded from
Allen et al Prognostic Factors by LVEF Group 639
and socioeconomically diverse population across varying clini-cal practice settings and geographically diverse areas. A Virtual Data Warehouse at each site served as a distributed standardized data resource comprised electronic datasets, populated with linked demographic, administrative, ambulatory pharmacy, outpatient laboratory test results, and healthcare utilization data (ambulatory visits and network and non-network hospitalizations with diagno-ses and procedures) for members receiving care at participating sites.15 Institutional review boards at participating sites approved the study and waiver of consent was obtained because of the nature of the study.
We first identified all persons aged ≥21 years with diagnosed HF between January 1, 2005, and December 31, 2008. Patients were in-cluded if they were hospitalized with a primary discharge diagnosis of HF or had ≥3 ambulatory visits with a diagnosis of HF with ≥1 visit being with a cardiologist during the sampling frame. We used the following International Classification of Diseases, 9th Edition (ICD-9) codes: 398.91, 402.01, 402.11, 402.91, 404.01, 404.03, 404.11, 404.13, 404.91, 404.93, and 428.x. Prior studies have shown a posi-tive predictive value of >95% for HF based on this inpatient cod-ing algorithm when compared against chart review and Framingham clinical criteria.16–18
HF Hosp B PreservedLVEF
BorderlineLVEF
ReducedLVEF
Age group, year <45 40-54 55-64 65-74 75-84 >85 Women Medical History Prevalent heart failure Acute myocardial infarction Unstable anginaCoronary artery bypass surgery Percutaneous coronary interventionIschemic stroke or TIAOther thromboembolic event Atrial fibrillation or flutter Ventricular fibrillation or tachycardia Mitral or aortic valve disease Peripheral arterial disease Rheumatic heart disease Cardiac resynchronization therapy Implantable cardioverter defribillator Pacemaker Dyslipidemia Hypertension Diabetes mellitus Hospitalized bleed Diagnosed dementia Diagnosed depression Chronic lung disease Chronic liver disease Mechanical fallSystemic cancer Hemoglobin, g/L> 16 15.0-15.9 14-14.9 13.0-13.9 12.0-12.9 11.0-11.9 10.0-10.9 9.0-9.9 <9.0 Missing Systolic blood pressure, mmHg≥180 160-179 140-159 130-139 121-129 110-120 100-109 <100 MissingTotal cholesterol, g/dL>240200-240<200Missing LDL cholesterol category, g/dL>200160-199130-159100-12970-99<70MissingSerum sodium, mmol/L≥150140-149130-139<130Missing
0.1 1.0 10.00.1 1.0 10.0 0.1 1.0 10.0
Figure 1 (Continued).
by guest on November 30, 2013http://circheartfailure.ahajournals.org/Downloaded from

640 Circ Heart Fail July 2013
CovariatesAssessments of left ventricular systolic function were ascertained for each HF patient from echocardiograms, radionuclide scintigraphy, other nuclear imaging modalities, and left ventriculography test re-sults available from site-specific databases complemented by manual chart review. We defined 3 categories of left ventricular systolic func-tion: preserved (HF-PEF) as a reported quantitative LVEF ≥50% or a physician’s qualitative assessment of preserved or normal LVEF; borderline reduced (HF-BREF) as LVEF 41% to 49% or mildly de-creased; and reduced (HF-REF) as LVEF ≤40% or moderately or
severely reduced.19 If the quantitative and qualitative assessments disagreed, the summary qualitative measure was used. The measure obtained closest to but after the index date of study entry was used. Patients without a documented LVEF measurement were excluded from the cohort (n=6998; 18.9%).
Variables included in the respective models were chosen a priori on the basis of previously published HF prognostic models3–9 and avail-ability within the virtual data warehouse (VDW). We determined the presence of coexisting illnesses on the basis of diagnoses or proce-dures using relevant ICD-9 codes, laboratory results, or filled outpa-tient prescriptions from health plan databases, as well as site-specific
All-Cause HospC PreservedLVEF
BorderlineLVEF
ReducedLVEF
Age group, year <45 40-54 55-64 65-74 75-84 >85 Women Medical History Prevalent heart failure Acute myocardial infarction Unstable anginaCoronary artery bypass surgery Percutaneous coronary interventionIschemic stroke or TIAOther thromboembolic event Atrial fibrillation or flutter Ventricular fibrillation or tachycardia Mitral or aortic valve disease Peripheral arterial disease Rheumatic heart disease Cardiac resynchronization therapy Implantable cardioverter defribillator Pacemaker Dyslipidemia Hypertension Diabetes mellitus Hospitalized bleed Diagnosed dementia Diagnosed depression Chronic lung disease Chronic liver disease Mechanical fallSystemic cancer Hemoglobin, g/L> 16 15.0-15.9 14-14.9 13.0-13.9 12.0-12.9 11.0-11.9 10.0-10.9 9.0-9.9 <9.0 Missing Systolic blood pressure, mmHg≥180 160-179 140-159 130-139 121-129 110-120 100-109 <100 MissingTotal cholesterol, g/dL>240200-240<200Missing LDL cholesterol category, g/dL>200160-199130-159100-12970-99<70MissingSerum sodium, mmol/L≥150140-149130-139<130Missing
0.1 1.0 10.0 0.1 1.0 10.0 0.1 1.0 10.0
Figure 1 (Continued).
by guest on November 30, 2013http://circheartfailure.ahajournals.org/Downloaded from

Allen et al Prognostic Factors by LVEF Group 641
Table 2. Baseline Multivariable Interactions Between Predictors and Documented Left Ventricular Systolic Function Assessment for Death From Any Cause, Hospitalization For Heart Failure, and Hospitalization for Any Reason Among 30 094 Adults With Heart Failure (2005–2008)
Variable
Death From Any Cause Adjusted Hazard Ratio
(95% Confidence Interval); Reference=Reduced LVEF
Heart Failure HospitalizationAdjusted Hazard Ratio
(95% Confidence Interval); Reference=Reduced LVEF
Hospitalization for Any CauseAdjusted Hazard Ratio
(95% Confidence Interval); Reference=Reduced LVEF
Preserved vs Reduced (n=14 907)
Borderline vs Reduced (n=4862)
Preserved vs Reduced (n=14 907)
Borderline vs Reduced (n=4862)
Preserved vs Reduced (n=14 907)
Borderline vs Reduced (n=4862)
Age group, y P=0.77 P=0.10 P=0.35 P=0.003 P=0.35 P=0.003
<65 1.10 (0.94–1.29) 1.45 (1.16–1.80) 1.29 (1.15–1.44) 1.48 (1.27–1.72) 1.29 (1.16–1.45) 1.48 (1.27–1.72)
>65 1.13 (1.07–1.19) 1.19 (1.11–1.28) 1.21 (1.15–1.28) 1.14 (1.06–1.23) 1.22 (1.15–1.29) 1.14 (1.06–1.23)
Sex P=0.44 P=0.65 P=0.02 P=0.08 P=0.01 P=0.05
Men 1.15 (1.07–1.23) 1.23 (1.13–1.35) 1.30 (1.21–1.39) 1.26 (1.16–1.38) 1.31 (1.22–1.40) 1.27 (1.16–1.38)
Women 1.10 (1.02–1.19) 1.19 (1.07–1.33) 1.15 (1.06–1.24) 1.12 (1.01–1.24) 1.15 (1.07–1.24) 1.11 (1.00–1.23)
Prevalent heart failure P=0.81 P=0.05 P=0.21 P=0.52 P=0.24 P=0.58
Not present at baseline 1.11 (1.01–1.23) 1.09 (0.95–1.24) 1.29 (1.18–1.41) 1.16 (1.03–1.31) 1.29 (1.18–1.41) 1.17 (1.04–1.32)
Present at baseline 1.13 (1.06–1.20) 1.27 (1.17–1.37) 1.20 (1.13–1.28) 1.22 (1.13–1.32) 1.21 (1.14–1.29) 1.22 (1.13–1.32)
Acute myocardial infarction P=0.84 P=0.61 P=0.51 P=0.85 P=0.62 P=0.82
Not present at baseline 1.12 (1.06–1.19) 1.21 (1.12–1.30) 1.24 (1.17–1.31) 1.21 (1.12–1.30) 1.24 (1.17–1.31) 1.21 (1.12–1.30)
Present at baseline 1.14 (1.01–1.29) 1.26 (1.08–1.47) 1.18 (1.04–1.34) 1.19 (1.02–1.38) 1.20 (1.05–1.36) 1.18 (1.02–1.38)
Unstable angina P=0.01 P=0.44 P=0.11 P=0.23 P=0.04 P=0.24
Not present at baseline 1.11 (1.05–1.17) 1.21 (1.12–1.30) 1.21 (1.15–1.28) 1.19 (1.11–1.27) 1.21 (1.15–1.28) 1.19 (1.11–1.27)
Present at baseline 1.44 (1.19–1.74) 1.33 (1.05–1.68) 1.41 (1.18–1.67) 1.37 (1.10–1.70) 1.47 (1.23–1.74) 1.36 (1.10–1.69)
Coronary artery bypass P=0.21 P=0.04 P=0.66 N/A N/A N/A
Not present at baseline 1.12 (1.06–1.18) 1.20 (1.11–1.28) 1.22 (1.16–1.29) N/A N/A N/A
Present at baseline 1.29 (1.03–1.61) 1.65 (1.23–2.22) 1.28 (1.05–1.56) N/A N/A N/A
Percutaneous coronary intervention P=0.88 P=0.41 N/A P=0.50 P=0.89 P=0.50
Not present at baseline 1.13 (1.07–1.19) 1.21 (1.12–1.30) N/A 1.19 (1.11–1.28) 1.23 (1.17–1.30) 1.19 (1.11–1.28)
Present at baseline 1.11 (0.94–1.31) 1.32 (1.07–1.63) N/A 1.28 (1.06–1.53) 1.22 (1.05–1.42) 1.28 (1.06–1.53)
Ischemic stroke or transient ischemic attack P=0.49 P=0.44 P=0.05 P=0.42 P=0.05 P=0.38
Not present at baseline 1.13 (1.07–1.20) 1.23 (1.14–1.32) 1.25 (1.18–1.32) 1.21 (1.13–1.30) 1.25 (1.19–1.32) 1.21 (1.13–1.30)
Present at baseline 1.07 (0.92–1.24) 1.13 (0.92–1.38) 1.05 (0.89–1.24) 1.11 (0.89–1.37) 1.06 (0.90–1.24) 1.10 (0.89–1.36)
Other thromboembolic event P=0.84 P=0.98 P=0.52 P=0.59 P=0.53 P=0.58
Not present at baseline 1.12 (1.07–1.19) 1.22 (1.14–1.31) 1.23 (1.16–1.29) 1.20 (1.12–1.28) 1.23 (1.17–1.30) 1.20 (1.12–1.28)
Present at baseline 1.18 (0.74–1.88) 1.23 (0.67–2.25) 1.45 (0.88–2.38) 1.44 (0.75–2.76) 1.45 (0.88–2.39) 1.45 (0.75–2.77)
Atrial fibrillation or flutter P=0.49 P=0.91 P=0.11 P=0.11 P=0.10 P=0.11
Not present at baseline 1.11 (1.04–1.19) 1.22 (1.12–1.34) 1.27 (1.19–1.35) 1.26 (1.15–1.37) 1.27 (1.19–1.36) 1.25 (1.15–1.36)
Present at baseline 1.15 (1.06–1.24) 1.21 (1.09–1.35) 1.17 (1.08–1.26) 1.12 (1.01–1.25) 1.17 (1.08–1.27) 1.12 (1.01–1.25)
Ventricular tachycardia or fibrillation P=0.43 P=0.83 N/A N/A P=0.96 P=0.79
Not present at baseline 1.12 (1.06–1.18) 1.22 (1.13–1.30) N/A N/A 1.23 (1.17–1.30) 1.21 (1.13–1.29)
Present at baseline 1.26 (0.95–1.68) 1.26 (0.90–1.77) N/A N/A 1.24 (0.92–1.68) 1.15 (0.83–1.59)
Mitral or aortic valve disease P=0.60 P=0.95 P=0.83 P=0.50 P=0.84 P=0.46
Not present at baseline 1.12 (1.05–1.19) 1.22 (1.13–1.32) 1.23 (1.16–1.31) 1.22 (1.13–1.32) 1.24 (1.17–1.31) 1.22 (1.13–1.32)
Present at baseline 1.15 (1.05–1.27) 1.21 (1.07–1.38) 1.22 (1.10–1.34) 1.16 (1.02–1.32) 1.22 (1.11–1.35) 1.15 (1.01–1.31)
Peripheral arterial disease P=0.86 P=0.83 P=0.57 P=0.53 P=0.50 P=0.50
Not present at baseline 1.12 (1.06–1.19) 1.22 (1.13–1.32) 1.22 (1.16–1.29) 1.21 (1.13–1.30) 1.23 (1.16–1.29) 1.21 (1.13–1.30)
Present at baseline 1.14 (0.99–1.31) 1.20 (0.99–1.44) 1.28 (1.10–1.49) 1.14 (0.94–1.38) 1.30 (1.11–1.51) 1.13 (0.93–1.37)
Rheumatic heart disease P=0.35 P=0.08 N/A P=0.05 N/A N/A
Not present at baseline 1.12 (1.06–1.18) 1.23 (1.15–1.32) N/A 1.22 (1.14–1.30) N/A N/A
Present at baseline 1.27 (0.98–1.65) 0.88 (0.62–1.27) N/A 0.78 (0.50–1.20) N/A N/A
(Continued )
by guest on November 30, 2013http://circheartfailure.ahajournals.org/Downloaded from

642 Circ Heart Fail July 2013
Table 2. Continued
Variable
Death From Any Cause Adjusted Hazard Ratio
(95% Confidence Interval); Reference=Reduced LVEF
Heart Failure HospitalizationAdjusted Hazard Ratio
(95% Confidence Interval); Reference=Reduced LVEF
Hospitalization for Any CauseAdjusted Hazard Ratio
(95% Confidence Interval); Reference=Reduced LVEF
Preserved vs Reduced (n=14 907)
Borderline vs Reduced (n=4862)
Preserved vs Reduced (n=14 907)
Borderline vs Reduced (n=4862)
Preserved vs Reduced (n=14 907)
Borderline vs Reduced (n=4862)
Cardiac resynchronization therapy P=0.17 P=0.59 P=0.13 P=0.26 P=0.15 P=0.27
Not present at baseline 1.12 (1.07–1.18) 1.22 (1.14–1.30) 1.23 (1.16–1.29) 1.20 (1.12–1.28) 1.23 (1.17–1.30) 1.20 (1.12–1.28)
Present at baseline 2.69 (0.78–9.32) 1.54 (0.65–3.65) 3.88 (0.89–16.90) 2.02 (0.83–4.93) 3.68 (0.84–16.04) 1.98 (0.81–4.84)
Implantable cardioverter defibrillator P=0.19 N/A P=0.38 P=0.38 P=0.31 P=0.39
Not present at baseline 1.12 (1.06–1.18) N/A 1.22 (1.16–1.29) 1.20 (1.12–1.28) 1.23 (1.17–1.29) 1.20 (1.12–1.28)
Present at baseline 1.42 (1.00–2.02) N/A 1.43 (1.01–2.04) 1.41 (0.99–2.00) 1.48 (1.04–2.10) 1.40 (0.99–2.00)
Pacemaker P=0.92 P=0.53 P=0.77 P=0.65 P=0.83 P=0.62
Not present at baseline 1.12 (1.07–1.19) 1.21 (1.13–1.30) 1.22 (1.16–1.29) 1.21 (1.13–1.30) 1.23 (1.17–1.30) 1.21 (1.13–1.30)
Present at baseline 1.13 (0.96–1.34) 1.30 (1.04–1.63) 1.26 (1.06–1.50) 1.15 (0.92–1.43) 1.26 (1.05–1.50) 1.14 (0.92–1.42)
Dyslipidemia P=0.005 P=0.13 P=0.50 P=0.47 P=0.44 P=0.42
Not present at baseline 1.02 (0.93–1.11) 1.12 (0.99–1.27) 1.20 (1.09–1.31) 1.16 (1.02–1.31) 1.20 (1.09–1.31) 1.15 (1.01–1.31)
Present at baseline 1.18 (1.11–1.26) 1.26 (1.16–1.37) 1.24 (1.17–1.32) 1.22 (1.13–1.32) 1.25 (1.17–1.33) 1.22 (1.13–1.32)
Hypertension P <0.001 P=0.66 P=0.99 P=0.67 P=0.95 P=0.67
Not present at baseline 0.92 (0.83–1.03) 1.18 (1.00–1.38) 1.23 (1.09–1.38) 1.24 (1.06–1.45) 1.23 (1.09–1.38) 1.24 (1.06–1.45)
Present at baseline 1.18 (1.12–1.25) 1.23 (1.14–1.32) 1.23 (1.16–1.30) 1.20 (1.11–1.29) 1.23 (1.17–1.31) 1.20 (1.11–1.29)
Diabetes mellitus P=0.22 P=0.57 P=0.16 P=0.13 P=0.19 P=0.11
Not present at baseline 1.11 (1.04–1.17) 1.20 (1.11–1.30) 1.20 (1.13–1.28) 1.17 (1.08–1.26) 1.21 (1.14–1.28) 1.17 (1.08–1.26)
Present at baseline 1.18 (1.07–1.30) 1.26 (1.10–1.43) 1.30 (1.18–1.43) 1.31 (1.15–1.48) 1.30 (1.18–1.43) 1.31 (1.16–1.49)
Hospitalized bleed P=0.40 P=0.59 P=0.62 P=0.87 P=0.78 P=0.85
Not present at baseline 1.13 (1.07–1.20) 1.23 (1.14–1.32) 1.23 (1.17–1.30) 1.21 (1.13–1.29) 1.24 (1.17–1.30) 1.21 (1.13–1.29)
Present at baseline 1.05 (0.90–1.24) 1.15 (0.92–1.43) 1.18 (0.99–1.40) 1.18 (0.94–1.49) 1.20 (1.01–1.44) 1.18 (0.93–1.49)
Diagnosed dementia P=0.50 P=0.67 N/A N/A N/A P=0.24
Not present at baseline 1.12 (1.06–1.18) 1.22 (1.14–1.32) N/A N/A N/A 1.22 (1.14–1.30)
Present at baseline 1.18 (1.02–1.36) 1.17 (0.96–1.43) N/A N/A N/A 1.04 (0.81–1.34)
Diagnosed depression P=0.048 P=0.48 P=0.81 P=0.28 P=0.64 P=0.33
Not present at baseline 1.10 (1.04–1.16) 1.20 (1.12–1.30) 1.22 (1.16–1.30) 1.23 (1.14–1.32) 1.23 (1.16–1.30) 1.22 (1.14–1.32)
Present at baseline 1.25 (1.11–1.40) 1.28 (1.09–1.50) 1.24 (1.11–1.39) 1.12 (0.97–1.30) 1.26 (1.13–1.41) 1.13 (0.98–1.30)
Chronic lung disease P=0.13 P=0.42 P=0.54 P=0.31 P=0.58 P=0.31
Not present at baseline 1.16 (1.09–1.25) 1.19 (1.09–1.30) 1.24 (1.16–1.33) 1.17 (1.07–1.28) 1.25 (1.17–1.33) 1.17 (1.07–1.27)
Not present at baseline 1.08 (1.00–1.16) 1.26 (1.13–1.40) 1.21 (1.12–1.30) 1.25 (1.13–1.39) 1.21 (1.13–1.31) 1.25 (1.13–1.39)
Chronic liver disease P=0.83 N/A P=0.84 P=0.12 N/A N/A
Not present at baseline 1.13 (1.07–1.19) N/A 1.23 (1.16–1.29) 1.19 (1.11–1.27) N/A N/A
Present at baseline 1.10 (0.87–1.39) N/A 1.26 (0.99–1.59) 1.56 (1.12–2.18) N/A N/A
Mechanical fall P=0.455 P=0.99 P=0.19 P=0.21 P=0.21 P=0.17
Not present at baseline 1.13 (1.07–1.19) 1.22 (1.13–1.31) 1.23 (1.17–1.30) 1.21 (1.14–1.30) 1.24 (1.18–1.31) 1.21 (1.14–1.30)
Present at baseline 1.04 (0.85–1.28) 1.22 (0.92–1.62) 1.04 (0.80–1.34) 0.98 (0.71–1.36) 1.05 (0.81–1.35) 0.96 (0.70–1.34)
Systemic cancer P=0.10 P=0.34 N/A N/A N/A P=0.50
Not present at baseline 1.14 (1.08–1.21) 1.23 (1.15–1.32) N/A N/A N/A 1.20 (1.12–1.28)
Present at baseline 0.99 (0.85–1.16) 1.10 (0.89–1.37) N/A N/A N/A 1.30 (1.03–1.65)
Hemoglobin, g/L P=0.04 P=0.55 P=0.03 P=0.003 P=0.04 P=0.002
<13.0 1.18 (1.10–1.26) 1.24 (1.13–1.36) 1.16 (1.08–1.25) 1.09 (0.99–1.19) 1.17 (1.08–1.26) 1.08 (0.98–1.19)
>13.0 or missing 1.07 (0.99–1.15) 1.19 (1.08–1.32) 1.29 (1.20–1.38) 1.32 (1.20–1.45) 1.29 (1.21–1.39) 1.32 (1.21–1.45)
Systolic blood pressure, mm Hg P=0.39 P=0.31 P=0.003 P=0.18 P=0.002 P=0.19
(Continued )
by guest on November 30, 2013http://circheartfailure.ahajournals.org/Downloaded from

Allen et al Prognostic Factors by LVEF Group 643
diabetes mellitus and cancer registries. We collected baseline and fol-low-up data on diagnoses and procedures on the basis of previously described ICD-9 codes and current procedural terminology procedure codes.20 We ascertained available ambulatory results for blood pres-sure, cholesterol measurements, and hemoglobin level on or before the index hospitalization and during follow-up from health plan am-bulatory visit and laboratory databases. Some potentially available factors known to correspond with risk were, nonetheless, excluded because of technical issues. Covariates notably missing from model construction included medication use, serum natriuretic peptide lev-els, and measures of renal function.
OutcomesDeaths were identified from hospital and billing claims databases, administrative health plan databases, state death certificate registries, and Social Security Administration files as available at each site. These approaches have yielded >97% vital status information in prior studies.14,17 Hospitalizations were determined from each site’s VDW. Hospitalizations for HF were identified from each site’s VDW on the basis of a primary discharge diagnosis for HF using the same inclu-sion criteria ICD-9 codes described previously.
Statistical AnalysisAll analyses were conducted using SAS statistical software, version 9.1 (Cary, NC). We characterized baseline patient demographic and clinical characteristics stratified by LVEF categories. Continuous variables were categorized using cut points chosen based on clinical-ly meaningful values. Missing covariate data for continuous variables were treated as a separate category. Because of large sample size, in addition to P values, we also calculated D values from the standard-ized difference between mean values across LVEF strata to compare the magnitude of difference between groups. We considered a value of D>0.1 to signify a meaningful difference.
We constructed multivariable extended Cox regression models for each outcome stratified by LVEF category. All variables listed in
Table 1 were considered for model inclusion and those with a P value of ≤0.2 at baseline comparison for each outcome within each LVEF strata were included in the final regression model. Subjects were cen-sored at the time they disenrolled from the health plan or reached the end of study follow-up on December 31, 2008; patients were also censored at the time of death for hospitalization models. We applied a robust sandwich estimator to account for clustering of multiple ob-servations within the same subject and explored whether additional adjustment for clustering at the site level was necessary.
To assess whether the association of a potential predictor variable dif-fered based on LVEF category, we calculated interaction model results for HF-PEF versus HF-REF and separately for HF-BREF versus HF-REF for each of the 3 outcomes. To maintain simplicity for interpre-tation, we dichotomized categorical variables at the median value. We calculated P values and hazard ratios associated with each interaction (eg, sex×LVEF category) for the outcome of interest. Because of the systematic nature of the analysis thereby creating multiple comparisons, we chose to highlight only those interactions with a P value of <0.01 (recognizing that a highly conservative Bonferroni correction for ≈150 tests of interaction would use a P value of 0.0003 for significance).
ResultsWe identified 30 094 adults with HF. Their mean age was 74 years, and 46% were women (Table 1). Overall, 49.5% of patients had HF-PEF, 16.2% had HF-BREF, and the remain-ing 34.3% had HF-REF. There was a high burden of comor-bidity across all LVEF categories. Median follow-up was 1.8 years (interquartile range, 0.8–3.1). During follow-up, 8060 (26.8%) patients died, 8108 (26.9%) were hospitalized for HF, and 20 272 (67.4%) were hospitalized for any reason. In comparison with the study cohort, patients excluded because of absence of an LVEF measure were older (mean age, 75.6 versus 73.7 years; P<0.001), more often white (78.9% versus
Table 2. Continued
Variable
Death From Any Cause Adjusted Hazard Ratio
(95% Confidence Interval); Reference=Reduced LVEF
Heart Failure HospitalizationAdjusted Hazard Ratio
(95% Confidence Interval); Reference=Reduced LVEF
Hospitalization for Any CauseAdjusted Hazard Ratio
(95% Confidence Interval); Reference=Reduced LVEF
Preserved vs Reduced (n=14 907)
Borderline vs Reduced (n=4862)
Preserved vs Reduced (n=14 907)
Borderline vs Reduced (n=4862)
Preserved vs Reduced (n=14 907)
Borderline vs Reduced (n=4862)
≤120 or missing 1.15 (1.07–1.24) 1.27 (1.14–1.40) 1.35 (1.24–1.46) 1.27 (1.15–1.40) 1.35 (1.25–1.46) 1.27 (1.15–1.40)
>120 1.10 (1.03–1.18) 1.18 (1.07–1.29) 1.15 (1.08–1.23) 1.16 (1.06–1.26) 1.16 (1.08–1.24) 1.16 (1.06–1.26)
HDL cholesterol, g/dL P=0.89 P=0.17 P=0.09 P=0.86 P=0.08 P=0.89
<40 or missing 1.12 (1.04–1.21) 1.16 (1.04–1.28) 1.29 (1.19–1.40) 1.21 (1.10–1.34) 1.30 (1.20–1.40) 1.21 (1.10–1.34)
≥40 1.13 (1.06–1.21) 1.27 (1.16–1.40) 1.19 (1.11–1.27) 1.20 (1.10–1.31) 1.19 (1.11–1.27) 1.20 (1.10–1.31)
LDL cholesterol, g/dL P=0.998 P=0.003 P=0.38 P=0.31 P=0.37 P=0.30
<140 or missing 1.13 (1.06–1.19) 1.18 (1.09–1.26) 1.22 (1.15–1.29) 1.19 (1.11–1.28) 1.22 (1.16–1.29) 1.19 (1.11–1.27)
≥140 1.12 (0.97–1.30) 1.67 (1.34–2.09) 1.30 (1.13–1.48) 1.31 (1.10–1.57) 1.31 (1.14–1.49) 1.31 (1.10–1.57)
Total cholesterol, g/dL P=0.68 P=0.15 P=0.73 P=0.42 P=0.66 P=0.45
<200 or missing 1.13 (1.07–1.20) 1.19 (1.11–1.28) 1.22 (1.15–1.29) 1.19 (1.10–1.28) 1.23 (1.16–1.30) 1.19 (1.10–1.28)
≥200 1.10 (0.98–1.24) 1.37 (1.15–1.62) 1.25 (1.12–1.39) 1.27 (1.10–1.47) 1.26 (1.13–1.40) 1.27 (1.09–1.46)
Serum sodium, mmol/L P=0.52 P=0.29 P=0.96 P=0.16 P=0.96 P=0.20
<140 or missing 1.11 (1.03–1.19) 1.26 (1.15–1.39) 1.23 (1.14–1.32) 1.26 (1.15–1.39) 1.23 (1.15–1.33) 1.26 (1.14–1.38)
≥140 1.14 (1.07–1.23) 1.17 (1.07–1.29) 1.23 (1.14–1.31) 1.15 (1.05–1.26) 1.23 (1.15–1.32) 1.16 (1.05–1.27)
Variables were not included if baseline comparison P value was >0.2. HDL indicates high-density lipoprotein; LDL, low-density lipoprotein; LVEF, left ventricular ejection fraction; and N/A, a variable was not adjusted for in the model.
by guest on November 30, 2013http://circheartfailure.ahajournals.org/Downloaded from

644 Circ Heart Fail July 2013
75.3%; P<0.001), trended toward more often women (47.3% versus 46.0%; P=0.06), had more prevalent HF (73.0% versus 60.1%; P<0.001), had less myocardial infarction (12.3 versus 13.9%), and generally had more comorbidity, including cere-brovascular disease (23.0% versus 21.1%; P<0.001), diabetes mellitus (26.2% versus 24.0%; P<0.001), dementia (10.0% versus 7.3%; P<0.001), and chronic lung disease (43.3% versus 41.1%); during follow-up there was no significant dif-ference between death (27.8% for those without a measure of LVEF; P=0.08) but had lower rates of HF hospitaliza-tion (22.6%; P<0.001) and all-cause hospitalization (63.4%; P<0.001).
In multivariable Cox models for all-cause death (Figure [A]), advanced age and severe anemia showed the strongest association with the outcome across all strata of LVEF (rec-ognizing that models did not include a measure of renal func-tion). Only systolic blood pressures <100 mm Hg showed significant association with increased mortality. Past medical history factors were either neutral or weakly associated with death, except for prior coronary revascularization, which was associated with survival.
In multivariable models for hospitalization from HF (Figure [B]), advanced age and anemia continued to be strong predic-tors of the outcome across all strata of LVEF. Only patients aged >85 years seemed to have a significantly increased risk of HF hospitalization. Hypertension, more than hypotension, was predictive of HF hospitalization. A variety of medical his-tory carried small increased risk of HF hospitalization; nota-bly prior coronary revascularization was not associated with hospitalization from HF.
Multivariable models for all-cause hospitalization (Figure [C]) were quite similar to those for HF hospitalization, despite the majority of all-cause admissions having a non-HF primary discharge diagnosis code. Anemia continued to show the largest adjusted hazards ratios for the outcome. Progressive hypertension was increasingly predictive of all-cause hospi-talization; systolic blood pressure <100 mm Hg was also asso-ciated with an increase in all-cause hospitalization, creating a U-shaped association for systolic blood pressure overall. Advanced age was not predictive of all-cause hospitalization, except for mild associations in the HF-BREF group and at age ≥85 years in the HF-REF group.
We found that multivariable models for each of the 3 out-comes were highly consistent across HF-PEF, HF-BREF, and HF-REF patients (Figure 1; complete data included as tables in the online-only Data Supplement). In simplified interaction models (Table 2), very few of the risk factors had a signifi-cant interaction with LVEF for any of the 3 outcomes (using P value <0.01). For the outcome of all-cause mortality, only a baseline history of dyslipidemia and hypertension performed differently by HF-PEF versus HF-REF and only low-density lipoprotein differed by HF-BREF versus HF-REF. For the outcome of heart failure hospitalization, only systolic blood pressure differed by HF-PEF versus HF-REF and only age differed by HF-BREF versus HF-REF. For the outcome of all-cause hospitalization, only systolic blood pressure differed by HF-PEF versus HF-REF and only age and hemoglobin dif-fered by HF-BREF versus HF-REF.
DiscussionWithin a large, contemporary, multicenter cohort of patients with HF, we found that commonly available risk factors car-ried surprisingly similar prognostic information for a variety of outcomes across all LVEF categories. Despite the existence of a variety of published HF risk models, this systematic assessment of relative risk factor performance across 3 LVEF strata for death, HF-related hospitalization, and all-cause hos-pitalization within a diverse, representative HF population provides novel HF risk information. For example, the popu-larized Seattle Heart Failure Model4 was derived and validated in randomized trial populations of patients with HF-REF. Its performance has subsequently been tested in a variety of other cohorts, including patients with a range of LVEF,21,22 but this piece-meal approach makes comparisons of individual risk factor performance across different LVEF categories more dif-ficult. Others have begun to look at the comparative prognostic performance of single risk factors by LVEF categories, such as a recent analysis showing that for a given serum B-type natriuretic peptide level the prognosis is essentially the same for patients with HF-PEF as those with HF-REF.23 Here, the analytic approach was specifically designed to provide infor-mation on comparative risk factor performance across a wide range of covariates by LVEF categories. We essentially found that none of the risk factors consistently interacted with LVEF.
Although LVEF dictates responsiveness to certain HF ther-apies,24 our data demonstrate that common risk factors have quite similar prognostic performance across major strata of LVEF. The number of statistically significant differences in risk factor performance across LVEF strata in our models was not much different than would have been predicted by chance alone. We conclude that a parsimonious approach to HF risk modeling is appropriate in most circumstances, at least for discrimination among singular end points. This may have important practical implications for HF risk stratifica-tion efforts, particularly because LVEF has been difficult to automatically extract from most electronic medical records without manual chart review.
Our findings extend those of previous HF risk studies, particularly into the population of patients with HF-PEF and HF-BREF. Our results are consistent with several smaller studies of hospitalized patients with HF-PEF, which have observed higher risks of hospitalization in patients with diabe-tes mellitus, depressive symptoms, and anemia.25–27
Potential LimitationsBecause of the large sample size, some associations within individual risk models may be statistically significant but not clinically meaningful. More important, even with the relative power of this sample size, we found strikingly few statistically and even fewer clinically significant differences between risk models, strengthening the primary conclusion that risk factor and overall model performance was quite similar within LVEF strata. Second, insured populations in our participating health plans may not be fully representative of the general popula-tion. Nevertheless, the breadth of geographic and demographic diversity represented across 4 geographically diverse health plans, as well as the community-based nature of healthcare
by guest on November 30, 2013http://circheartfailure.ahajournals.org/Downloaded from

Allen et al Prognostic Factors by LVEF Group 645
delivery, suggests that findings from our cohort are likely to be highly generalizable to HF patients with any level of LVEF in real-world practice settings. This is in stark contrast to pre-viously reported studies focused on highly selected patient samples enrolled into clinical trials or referral-based tertiary care academic medical centers. Finally, model construction did not include an exhaustive list of all previously known risk factors for adverse outcomes in HF. For example, measures of renal function, natriuretic peptide levels, and medication use were absent from the list of independent variables. Unlike the construction of risk models for clinical use where the goal is to optimize prognostic performance, the purpose of this analysis was to compare the relative performance of a variety of predictor variables across clinically important LVEF cat-egories for common clinical end points. Although inclusion of additional predictor variables may have led to quantitative adjustments in the reported adjusted hazards ratios (eg, degree of association of anemia in a model with and without a mea-sure of kidney dysfunction), meaningful relative comparisons across LVEF strata and clinical outcomes should qualitatively not be contingent on a single variable. In addition, both natri-uretic peptide levels and measures of renal function have been shown to be strongly predictive in both HF-PEF and HF-REF populations such that their addition to the current analysis would not be expected to disrupt the overall symmetry seen with the current list of covariates.23
ConclusionThis study systematically assessed predictor covariate per-formance across clinically important LVEF strata for relevant clinical outcomes. We found that in a large contemporary HF population, despite important therapeutic distinctions currently dictated by LVEF, risk assessment was strikingly similar regardless of LVEF. These data suggest that HF risk models using traditional risk markers can be applied to broad HF populations.
AcknowledgmentsWe thank all of the project managers, data programmers, and analysts for their critical technical contributions and support that made this study possible.
Sources of FundingThis study was conducted within the Cardiovascular Research Network sponsored by the National Heart, Lung, and Blood Institute (NHLBI; U19HL91179-01) and the American Recovery and Reinvestment Act of 2009 (NHLBI 1RC1HL099395).
DisclosuresDr Allen is supported by funding from the National Heart, Lung, and Blood Institute (NHLBI; 1K23HL105896). Dr Saczynski was supported in part by funding from the National Institute on Aging (K01AG33643) and the NHLBI (U01HL105268). The other authors have no conflict to report.
References 1. Go AS, Mozaffarian D, Roger VL, Benjamin EJ, Berry JD, Borden WB,
Bravata DM, Dai S, Ford ES, Fox CS, Franco S, Fullerton HJ, Gillespie
C, Hailpern SM, Heit JA, Howard VJ, Huffman MD, Kissela BM, Kittner SJ, Lackland DT, Lichtman JH, Lisabeth LD, Magid D, Marcus GM, Marelli A, Matchar DB, McGuire DK, Mohler ER, Moy CS, Mussolino ME, Nichol G, Paynter NP, Schreiner PJ, Sorlie PD, Stein J, Turan TN, Virani SS, Wong ND, Woo D, Turner MB; American Heart Association Statistics Committee and Stroke Statistics Subcommittee. Heart disease and stroke statistics–2013 update: a report from the American Heart Association. Circulation. 2013;127:e6–e245.
2. Hlatky MA, Greenland P, Arnett DK, Ballantyne CM, Criqui MH, Elkind MS, Go AS, Harrell FE Jr, Hong Y, Howard BV, Howard VJ, Hsue PY, Kramer CM, McConnell JP, Normand SL, O’Donnell CJ, Smith SC Jr, Wilson PW; American Heart Association Expert Panel on Subclinical Atherosclerotic Diseases and Emerging Risk Factors and the Stroke Council. Criteria for evaluation of novel markers of cardiovascular risk: a scientific statement from the American Heart Association. Circulation. 2009;119:2408–2416.
3. Lee DS, Austin PC, Rouleau JL, Liu PP, Naimark D, Tu JV. Predicting mortality among patients hospitalized for heart failure: derivation and validation of a clinical model. JAMA. 2003;290:2581–2587.
4. Levy WC, Mozaffarian D, Linker DT, Sutradhar SC, Anker SD, Cropp AB, Anand I, Maggioni A, Burton P, Sullivan MD, Pitt B, Poole-Wilson PA, Mann DL, Packer M. The Seattle Heart Failure Model: prediction of survival in heart failure. Circulation. 2006;113:1424–1433.
5. Aaronson KD, Schwartz JS, Chen TM, Wong KL, Goin JE, Mancini DM. Development and prospective validation of a clinical index to pre-dict survival in ambulatory patients referred for cardiac transplant evalu-ation. Circulation. 1997;95:2660–2667.
6. Fonarow GC, Adams KF Jr, Abraham WT, Yancy CW, Boscardin WJ; ADHERE Scientific Advisory Committee, Study Group, and Investigators. Risk stratification for in-hospital mortality in acutely de-compensated heart failure: classification and regression tree analysis. JAMA. 2005;293:572–580.
7. O’Connor CM, Hasselblad V, Mehta RH, Tasissa G, Califf RM, Fiuzat M, Rogers JG, Leier CV, Stevenson LW. Triage after hospitalization with advanced heart failure: the ESCAPE (Evaluation Study of Congestive Heart Failure and Pulmonary Artery Catheterization Effectiveness) risk model and discharge score. J Am Coll Cardiol. 2010;55:872–878.
8. Pocock SJ, Wang D, Pfeffer MA, Yusuf S, McMurray JJ, Swedberg KB, Ostergren J, Michelson EL, Pieper KS, Granger CB. Predictors of mor-tality and morbidity in patients with chronic heart failure. Eur Heart J. 2006;27:65–75.
9. Komajda M, Carson PE, Hetzel S, McKelvie R, McMurray J, Ptaszynska A, Zile MR, Demets D, Massie BM. Factors associated with outcome in heart failure with preserved ejection fraction: findings from the Irbesartan in Heart Failure with Preserved Ejection Fraction Study (I-PRESERVE). Circ Heart Fail. 2011;4:27–35.
10. Steinberg BA, Zhao X, Heidenreich PA, Peterson ED, Bhatt DL, Cannon CP, Hernandez AF, Fonarow GC; Get With the Guidelines Scientific Advisory Committee and Investigators. Trends in patients hospitalized with heart failure and preserved left ventricular ejection fraction: preva-lence, therapies, and outcomes. Circulation. 2012;126:65–75.
11. Owan TE, Hodge DO, Herges RM, Jacobsen SJ, Roger VL, Redfield MM. Trends in prevalence and outcome of heart failure with preserved ejection fraction. N Engl J Med. 2006;355:251–259.
12. Bhatia RS, Tu JV, Lee DS, Austin PC, Fang J, Haouzi A, Gong Y, Liu PP. Outcome of heart failure with preserved ejection fraction in a population-based study. N Engl J Med. 2006;355:260–269.
13. Go AS, Magid DJ, Wells B, Sung SH, Cassidy-Bushrow AE, Greenlee RT, Langer RD, Lieu TA, Margolis KL, Masoudi FA, McNeal CJ, Murata GH, Newton KM, Novotny R, Reynolds K, Roblin DW, Smith DH, Vupputuri S, White RE, Olson J, Rumsfeld JS, Gurwitz JH. The Cardiovascular Research Network: a new paradigm for cardiovascular quality and out-comes research. Circ Cardiovasc Qual Outcomes. 2008;1:138–147.
14. Go AS, Yang J, Gurwitz JH, Hsu J, Lane K, Platt R. Comparative ef-fectiveness of different beta-adrenergic antagonists on mortality among adults with heart failure in clinical practice. Arch Intern Med. 2008;168:2415–2421.
15. Magid DJ, Gurwitz JH, Rumsfeld JS, Go AS. Creating a research data network for cardiovascular disease: the CVRN. Expert Rev Cardiovasc Ther. 2008;6:1043–1045.
16. Go AS, Lee WY, Yang J, Lo JC, Gurwitz JH. Statin therapy and risks for death and hospitalization in chronic heart failure. JAMA. 2006;296:2105–2111.
17. Go AS, Yang J, Ackerson LM, Lepper K, Robbins S, Massie BM, Shlipak MG. Hemoglobin level, chronic kidney disease, and the risks of death
by guest on November 30, 2013http://circheartfailure.ahajournals.org/Downloaded from

646 Circ Heart Fail July 2013
and hospitalization in adults with chronic heart failure: the Anemia in Chronic Heart Failure: Outcomes and Resource Utilization (ANCHOR) Study. Circulation. 2006;113:2713–2723.
18. McKee PA, Castelli WP, McNamara PM, Kannel WB. The natural his-tory of congestive heart failure: the Framingham study. N Engl J Med. 1971;285:1441–1446.
19. Hendel RC, Budoff MJ, Cardella JF, Chambers CE, Dent JM, Fitzgerald DM, Hodgson JM, Klodas E, Kramer CM, Stillman AE, Tilkemeier PL, Ward RP, Weigold WG, White RD, Woodard PK; American College of Cardiology (ACC); American Heart Association (AHA). ACC/AHA/ACR/ASE/ASNC/HRS/NASCI/RSNA/SAIP/SCAI/SCCT/SCMR/SIR 2008 Key. Data Elements and Definitions for Cardiac Imaging A Report of the American College of Cardiology/American Heart Association Task Force on Clinical Data Standards (Writing Committee to Develop Clinical Data Standards for Cardiac Imaging). J Am Coll Cardiol. 2009;53:91–124.
20. Go AS, Chertow GM, Fan D, McCulloch CE, Hsu CY. Chronic kidney disease and the risks of death, cardiovascular events, and hospitalization. N Engl J Med. 2004;351:1296–1305.
21. Kalogeropoulos AP, Georgiopoulou VV, Giamouzis G, Smith AL, Agha SA, Waheed S, Laskar S, Puskas J, Dunbar S, Vega D, Levy WC, Butler J. Utility of the Seattle Heart Failure Model in patients with advanced heart failure. J Am Coll Cardiol. 2009;53:334–342.
22. Gorodeski EZ, Chu EC, Chow CH, Levy WC, Hsich E, Starling RC. Application of the Seattle Heart Failure Model in ambulatory patients
presented to an advanced heart failure therapeutics committee. Circ Heart Fail. 2010;3:706–714.
23. van Veldhuisen DJ, Linssen GC, Jaarsma T, van Gilst WH, Hoes AW, Tijssen JG, Paulus WJ, Voors AA, Hillege HL. B-type natriuretic peptide and prognosis in heart failure patients with preserved and reduced ejec-tion fraction. J Am Coll Cardiol. 2013;61:1498–1506.
24. Hunt SA, Abraham WT, Chin MH, Feldman AM, Francis GS, Ganiats TG, Jessup M, Konstam MA, Mancini DM, Michl K, Oates JA, Rahko PS, Silver MA, Stevenson LW, Yancy CW. 2009 focused update in-corporated into the ACC/AHA 2005 Guidelines for the Diagnosis and Management of Heart Failure in Adults: a report of the American College of Cardiology Foundation/American Heart Association Task Force on Practice Guidelines: developed in collaboration with the International Society for Heart and Lung Transplantation. Circulation. 2009;119:e391–e479.
25. Felker GM, Shaw LK, Stough WG, O’Connor CM. Anemia in patients with heart failure and preserved systolic function. Am Heart J. 2006;151:457–462.
26. Maréchaux S, Six-Carpentier MM, Bouabdallaoui N, Montaigne D, Bauchart JJ, Mouquet F, Auffray JL, Le Tourneau T, Asseman P, LeJemtel TH, Ennezat PV. Prognostic importance of comorbidities in heart failure with preserved left ventricular ejection fraction. Heart Vessels. 2011;26:313–320.
27. Song EK, Lennie TA, Moser DK. Depressive symptoms increase risk of rehospitalisation in heart failure patients with preserved systolic func-tion. J Clin Nurs. 2009;18:1871–1877.
CLINICAL PERSPECTIVEHeart failure (HF) is generally associated with high morbidity and mortality, but prognosis can vary significantly between patients. A variety of risk models exist to help risk stratify patients, thereby refining patients’ and families’ expectations for the future, guiding decisions around aggressiveness of care, and enabling for case mix adjustment in institutional outcome measures. Although HF is a syndrome with important differences in response to therapy by left ventricular ejection fraction (LVEF), existing models are typically derived and validated without careful consideration of potential differences in risk factor performance by LVEF. Therefore, we systematically assessed the relative performance of risk factors across clinically important LVEF strata for the relevant clinical outcomes of death and hospitalization. We found that in a large contemporary HF population, risk assessment was strikingly similar regardless of LVEF; we identified no clinically important interactions between LVEF and a wide range of predictor variables. These data suggest that it is unlikely for LVEF-specific HF risk models to provide markedly better prognostic information than general HF risk models; a parsimonious approach of HF risk modeling using traditional risk markers derived from broad HF populations seems reasonable.
by guest on November 30, 2013http://circheartfailure.ahajournals.org/Downloaded from

SUPPLEMENTAL MATERIAL
Supplemental Table 1. Multivariable predictors of death from any cause among 30,094 adults with heart failure and documented left ventricular systolic function assessment (2005‐2008).
Death from Any Cause
Variable
Preserved Systolic Function
(N = 14,907)
Borderline Reduced Systolic Function
(N = 4,862)
Reduced Systolic Function (N = 10,325)
Age group, yr <45 0.58 (0.32‐1.03) 0.15 (0.02‐1.11) 0.59 (0.38‐0.91) 45‐54 0.75 (0.55‐1.02) 1.04 (0.66‐1.64) 0.64 (0.48‐0.85) 55‐64 Reference Reference Reference 65‐74 1.43 (1.22‐1.68) 2.04 (1.53‐2.73) 1.39 (1.19‐1.62) 75‐84 2.22 (1.91‐2.58) 3.10 (2.35‐4.09) 2.17 (1.87‐2.51) >85 3.57 (3.05‐4.16) 4.60 (3.44‐6.16) 3.49 (2.98‐4.09)
Women 0.94 (0.87‐1.00) 0.87 (0.76‐1.00) 0.90 (0.83‐0.99) Medical History
Prevalent heart failure 1.23 (1.14‐1.32) 1.02 (0.89‐1.17) 1.11 (1.01‐1.22) Acute myocardial infarction 1.61 (1.46‐1.78) 1.66 (1.42‐1.95) 1.55 (1.40‐1.73) Unstable angina 0.79 (0.69‐0.90) N/A 1.07 (0.93‐1.22) Coronary artery bypass surgery 0.76 (0.66‐0.87) 0.58 (0.46‐0.74) 0.63 (0.54‐0.74) Percutaneous coronary intervention 0.87 (0.77‐0.97) 0.68 (0.57‐0.83) 0.73 (0.64‐0.82) Ischemic stroke or transient ischemic attack 1.55 (1.41‐1.70) 1.37 (1.15‐1.62) 1.47 (1.31‐1.66) Other thromboembolic event 1.41 (1.11‐1.80) 1.43 (0.95‐2.14) 1.08 (0.78‐1.49) Atrial fibrillation or flutter 1.18 (1.10‐1.26) 1.41 (1.24‐1.60) 1.22 (1.13‐1.33) Ventricular tachycardia or fibrillation N/A N/A 1.72 (1.51‐1.96) Mitral or aortic valve disease 1.01 (0.94‐1.08) 0.99 (0.86‐1.13) 1.04 (0.95‐1.14) Peripheral arterial disease 1.65 (1.51‐1.81) 1.69 (1.44‐1.99) 1.78 (1.59‐1.99) Rheumatic heart disease 1.58 (1.37‐1.82) 2.17 (1.65‐2.85) 1.66 (1.37‐2.02) Cardiac resynchronization therapy N/A N/A 1.16 (0.78‐1.71) Implantable cardioverter defibrillator 0.97 (0.75‐1.24) N/A N/A Pacemaker 1.04 (0.93‐1.15) 0.86 (0.72‐1.03) 0.88 (0.78‐1.00) Dyslipidemia 0.83 (0.76‐0.90) N/A 0.86 (0.78‐0.96) Hypertension N/A 1.01 (0.84‐1.21) 1.08 (0.98‐1.20) Diabetes mellitus 1.02 (0.94‐1.10) 1.03 (0.91‐1.17) 1.10 (1.01‐1.20) Hospitalized bleed 1.25 (1.14‐1.37) 1.29 (1.09‐1.53) 1.28 (1.13‐1.44) Diagnosed dementia 1.58 (1.45‐1.73) 1.60 (1.34‐1.89) 1.57 (1.39‐1.77) Diagnosed depression N/A N/A 0.96 (0.87‐1.07) Chronic lung disease 1.36 (1.27‐1.45) 1.22 (1.08‐1.37) 1.28 (1.18‐1.39) Chronic liver disease 1.59 (1.40‐1.82) N/A N/A Mechanical fall 1.52 (1.35‐1.72) 1.36 (1.07‐1.73) 1.53 (1.30‐1.81) Systemic cancer 1.80 (1.64‐1.97) 1.69 (1.42‐2.02) 1.57 (1.40‐1.77)
Hemoglobin, g/L > 16 1.00 (0.79‐1.27) 1.11 (0.77‐1.62) 0.81 (0.65‐1.02) 15.0‐15.9 0.86 (0.72‐1.04) 0.92 (0.67‐1.26) 0.76 (0.63‐0.91) 14‐14.9 0.92 (0.80‐1.05) 0.89 (0.70‐1.14) 0.82 (0.71‐0.95) 13.0‐13.9 Reference Reference Reference 12.0‐12.9 1.19 (1.07‐1.32) 1.41 (1.15‐1.72) 1.21 (1.07‐1.38) 11.0‐11.9 1.52 (1.37‐1.70) 1.70 (1.38‐2.08) 1.57 (1.37‐1.79) 10.0‐10.9 2.21 (1.97‐2.47) 2.54 (2.04‐3.17) 2.29 (1.98‐2.65) 9.0‐9.9 3.14 (2.74‐3.60) 4.05 (3.16‐5.18) 3.29 (2.75‐3.93) <9.0 4.19 (3.48‐5.04) 6.03 (4.18‐8.71) 3.95 (2.99‐5.21) Missing 1.18 (0.85‐1.63) 1.53 (0.92‐2.55) 1.06 (0.78‐1.45)
Systolic blood pressure, mmHg

SUPPLEMENTAL MATERIAL
Death from Any Cause
Variable
Preserved Systolic Function
(N = 14,907)
Borderline Reduced Systolic Function
(N = 4,862)
Reduced Systolic Function (N = 10,325)
>180 0.88 (0.66‐1.17) N/A 1.14 (0.71‐1.81) 160‐179 0.82 (0.69‐0.96) N/A 0.70 (0.52‐0.94) 140‐159 0.74 (0.67‐0.83) N/A 0.74 (0.64‐0.86) 130‐139 0.78 (0.70‐0.85) N/A 0.64 (0.56‐0.74) 121‐129 0.85 (0.77‐0.94) N/A 0.79 (0.70‐0.89) 110‐120 Reference Reference Reference 100‐109 1.18 (1.06‐1.32) N/A 1.16 (1.02‐1.31) <100 2.10 (1.87‐2.36) N/A 1.89 (1.68‐2.13) Missing 0.63 (0.47‐0.85) N/A 1.03 (0.75‐1.41)
HDL cholesterol category, g/dL >60 1.04 (0.94‐1.15) 1.03 (0.83‐1.27) 0.88 (0.76‐1.02) 50‐59 1.06 (0.96‐1.17) 1.03 (0.86‐1.25) 1.01 (0.90‐1.15) 40‐49 Reference Reference Reference 35‐39 1.08 (0.97‐1.21) 1.04 (0.85‐1.26) 0.96 (0.85‐1.09) <35 1.23 (1.11‐1.36) 1.21 (1.02‐1.43) 1.24 (1.11‐1.39) Missing 1.45 (0.98‐2.13) 0.92 (0.40‐2.09) 1.23 (0.72‐2.12)
LDL cholesterol category, g/dL >200 0.85 (0.52‐1.39) 1.46 (0.65‐3.27) 0.98 (0.57‐1.69) 160‐199 0.85 (0.65‐1.13) 1.05 (0.63‐1.75) 0.91 (0.65‐1.28) 130‐159 Reference Reference Reference 100‐129 0.98 (0.83‐1.15) 1.18 (0.84‐1.65) 0.81 (0.67‐0.99) 70‐99 0.94 (0.79‐1.13) 0.92 (0.64‐1.31) 0.70 (0.57‐0.87) <70 1.07 (0.89‐1.29) 1.18 (0.82‐1.69) 0.82 (0.66‐1.01) Missing 1.09 (0.78‐1.50) 2.16 (1.15‐4.08) 0.70 (0.42‐1.15)
Total cholesterol category, g/dL >240 1.27 (1.03‐1.58) 1.11 (0.72‐1.72) 0.88 (0.65‐1.20) 200‐240 1.08 (0.94‐1.23) 0.86 (0.65‐1.13) 0.96 (0.82‐1.14) <200 Reference Reference Reference Missing 1.10 (0.81‐1.48) 0.84 (0.42‐1.72) 1.25 (0.85‐1.84)
Serum sodium category, mmol/l >150 3.59 (1.91‐6.74) 1.62 (0.24‐10.88) 2.78 (1.18‐6.57) 140‐149 0.77 (0.72‐0.83) 0.81 (0.71‐0.91) 0.74 (0.68‐0.80) 130‐139 Reference Reference Reference <130 2.51 (2.03‐3.10) 2.16 (1.41‐3.29) 2.31 (1.67‐3.21) Missing 0.87 (0.68‐1.12) 0.97 (0.65‐1.46) 0.82 (0.63‐1.08)
*N/A denotes variable was not adjusted for in the model. Variables were not included if baseline comparison p‐value was greater than 0.2

SUPPLEMENTAL MATERIAL
Supplemental Table 2. Multivariable predictors of hospitalization for heart failure among 30,094 adults with heart failure and documented left ventricular systolic function assessment (2005‐2008).
Hospitalization for Heart Failure
Variable
Preserved Systolic Function
(N = 14,907)
Borderline Reduced Systolic Function
(N = 4,862)
Reduced Systolic Function (N = 10,325)
Age group, yr <45 0.80 (0.51‐1.25) 0.80 (0.47‐1.36) 1.22 (0.91‐1.64) 45‐54 0.97 (0.73‐1.29) 1.18 (0.84‐1.66) 1.24 (1.01‐1.52) 55‐64 Reference Reference Reference 65‐74 0.98 (0.85‐1.12) 1.34 (1.09‐1.66) 1.16 (1.01‐1.33) 75‐84 1.14 (1.00‐1.30) 1.52 (1.23‐1.86) 1.26 (1.09‐1.45) >85 1.51 (1.32‐1.74) 1.78 (1.42‐2.23) 1.58 (1.35‐1.86)
Women 1.11 (1.02‐1.19) 1.15 (1.01‐1.31) 1.04 (0.94‐1.15) Medical History
Prevalent heart failure 1.23 (1.14‐1.32) 1.05 (0.92‐1.21) 1.29 (1.17‐1.42) Acute myocardial infarction 1.31 (1.19‐1.44) 1.26 (1.09‐1.46) 1.16 (1.05‐1.28) Unstable angina N/A 1.04 (0.86‐1.27) 1.13 (0.99‐1.27) Coronary artery bypass surgery 0.90 (0.78‐1.03) N/A N/A Percutaneous coronary intervention N/A 0.96 (0.80‐1.14) N/A Ischemic stroke or transient ischemic attack 1.12 (1.01‐1.24) 1.12 (0.93‐1.35) 1.15 (1.00‐1.31) Other thromboembolic event N/A N/A 0.97 (0.73‐1.28) Atrial fibrillation or flutter 1.34 (1.25‐1.44) 1.49 (1.32‐1.68) 1.31 (1.20‐1.42) Mitral or aortic valve disease 1.16 (1.08‐1.25) 1.01 (0.89‐1.15) 1.02 (0.93‐1.11) Peripheral arterial disease N/A 1.34 (1.14‐1.56) 1.37 (1.21‐1.55) Rheumatic heart disease N/A 2.28 (1.78‐2.92) N/A Cardiac resynchronization therapy N/A N/A 1.49 (1.07‐2.08) Implantable cardioverter defribillator N/A N/A 1.31 (1.18‐1.46) Pacemaker 1.16 (1.04‐1.29) 1.01 (0.85‐1.20) 1.14 (1.01‐1.29) Dyslipidemia 1.00 (0.91‐1.09) 0.98 (0.85‐1.14) 1.03 (0.92‐1.14) Hypertension 1.23 (1.09‐1.40) 1.42 (1.19‐1.70) 1.30 (1.17‐1.43) Diabetes mellitus 1.08 (1.00‐1.17) 1.07 (0.93‐1.22) 1.13 (1.03‐1.24) Hospitalized bleed 1.16 (1.05‐1.28) 1.20 (1.00‐1.43) 1.09 (0.94‐1.27) Diagnosed depression 1.15 (1.06‐1.25) 1.27 (1.10‐1.46) 1.08 (0.97‐1.19) Chronic lung disease 1.39 (1.30‐1.49) 1.37 (1.22‐1.55) 1.47 (1.36‐1.59) Chronic liver disease N/A N/A 1.71 (1.48‐1.98) Mechanical fall 1.32 (1.17‐1.50) 1.39 (1.06‐1.83) 1.32 (1.10‐1.59)
Hemoglobin, g/L > 16 0.82 (0.66‐1.02) 0.88 (0.64‐1.21) 0.91 (0.76‐1.09) 15.0‐15.9 0.88 (0.74‐1.04) 0.80 (0.63‐1.02) 0.86 (0.74‐1.00) 14‐14.9 0.86 (0.76‐0.98) 0.88 (0.72‐1.08) 0.86 (0.76‐0.97) 13.0‐13.9 Reference Reference Reference 12.0‐12.9 1.20 (1.09‐1.33) 1.22 (1.02‐1.44) 1.22 (1.08‐1.37) 11.0‐11.9 1.64 (1.49‐1.82) 1.68 (1.41‐2.00) 1.41 (1.25‐1.59) 10.0‐10.9 1.96 (1.75‐2.19) 2.21 (1.84‐2.67) 1.86 (1.62‐2.13) 9.0‐9.9 2.96 (2.59‐3.38) 3.03 (2.40‐3.83) 2.66 (2.23‐3.16) <9.0 2.86 (2.33‐3.51) 2.59 (1.76‐3.81) 2.71 (2.11‐3.48) Missing 1.13 (0.83‐1.53) 1.06 (0.68‐1.66) 0.93 (0.74‐1.18)
Systolic blood pressure, mmHg >180 1.73 (1.43‐2.08) 1.64 (1.17‐2.30) 1.52 (1.13‐2.05) 160‐179 1.36 (1.19‐1.54) 1.60 (1.30‐1.98) 1.07 (0.88‐1.30) 140‐159 1.13 (1.03‐1.24) 1.12 (0.95‐1.31) 1.04 (0.94‐1.16)

SUPPLEMENTAL MATERIAL
Hospitalization for Heart Failure
Variable
Preserved Systolic Function
(N = 14,907)
Borderline Reduced Systolic Function
(N = 4,862)
Reduced Systolic Function (N = 10,325)
130‐139 0.94 (0.86‐1.02) 0.93 (0.81‐1.08) 0.88 (0.79‐0.97) 121‐129 0.91 (0.83‐0.99) 0.95 (0.81‐1.10) 0.80 (0.73‐0.89) 110‐120 Reference Reference Reference 100‐109 1.11 (0.99‐1.24) 1.06 (0.89‐1.27) 0.95 (0.85‐1.05) <100 1.54 (1.34‐1.76) 1.07 (0.86‐1.33) 1.45 (1.29‐1.63) Missing 0.94 (0.71‐1.25) 1.42 (0.79‐2.55) 1.19 (0.85‐1.65)
HDL cholesterol category, g/dL >60 0.87 (0.78‐0.97) 0.81 (0.66‐0.99) 1.01 (0.86‐1.19) 50‐59 0.95 (0.86‐1.05) 0.93 (0.79‐1.11) 0.90 (0.80‐1.02) 40‐49 Reference Reference Reference 35‐39 0.90 (0.80‐1.00) 1.22 (1.04‐1.44) 1.00 (0.89‐1.13) <35 1.12 (1.01‐1.24) 1.28 (1.10‐1.50) 1.14 (1.02‐1.27) Missing 0.72 (0.39‐1.31) 0.54 (0.25‐1.16) 0.80 (0.49‐1.31)
LDL cholesterol category, g/dL >200 1.17 (0.76‐1.79) N/A 1.27 (0.72‐2.24) 160‐199 1.17 (0.89‐1.53) N/A 0.90 (0.56‐1.45) 130‐159 Reference Reference Reference 100‐129 0.96 (0.82‐1.13) N/A 0.78 (0.62‐0.98) 70‐99 0.92 (0.77‐1.10) N/A 0.65 (0.52‐0.81) <70 1.10 (0.92‐1.32) N/A 0.73 (0.59‐0.91) Missing 1.35 (0.79‐2.31) N/A 1.01 (0.63‐1.62)
Total cholesterol category, g/dL >240 1.01 (0.79‐1.28) 1.33 (1.02‐1.74) 1.00 (0.61‐1.62) 200‐240 0.98 (0.86‐1.13) 1.01 (0.84‐1.21) 0.86 (0.73‐1.02) <200 Reference Reference Reference Missing 1.15 (0.74‐1.77) 2.23 (1.00‐4.99) 1.13 (0.81‐1.56)
Serum sodium category, mmol/l >150 1.64 (0.76‐3.53) 0.91 (0.12‐6.83) 0.72 (0.19‐2.76) 140‐149 0.92 (0.86‐0.98) 0.95 (0.85‐1.05) 0.87 (0.80‐0.94) 130‐139 Reference Reference Reference <130 1.88 (1.53‐2.32) 1.46 (1.00‐2.13) 1.67 (1.24‐2.25) Missing 0.90 (0.71‐1.15) 1.53 (1.12‐2.08) 1.04 (0.86‐1.27)
*N/A denotes variable was not adjusted for in the model. Variables were not included if baseline comparison p‐value was greater than 0.2

SUPPLEMENTAL MATERIAL
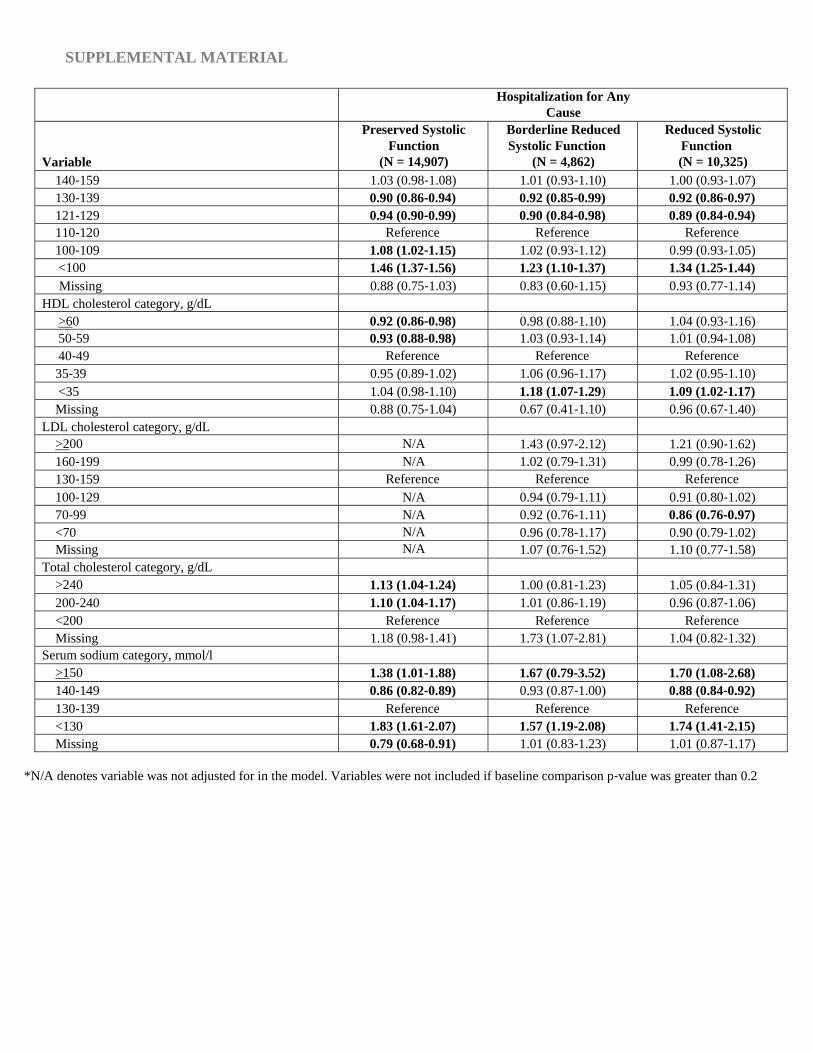
Supplemental Table 3. Multivariable predictors of hospitalization for any cause among 30,094 adults with heart failure and documented left ventricular systolic function assessment (2005‐2008).
Hospitalization for Any Cause
Variable
Preserved Systolic Function
(N = 14,907)
Borderline Reduced Systolic Function
(N = 4,862)
Reduced Systolic Function (N = 10,325)
Age group, yr <45 0.88 (0.71‐1.09) 0.95 (0.66‐1.36) 1.04 (0.87‐1.23) 45‐54 1.03 (0.91‐1.17) 1.11 (0.92‐1.35) 1.04 (0.91‐1.17) 55‐64 Reference Reference Reference 65‐74 0.96 (0.89‐1.03) 1.19 (1.06‐1.33) 0.98 (0.91‐1.07) 75‐84 0.96 (0.90‐1.03) 1.25 (1.12‐1.39) 1.08 (0.99‐1.17) >85 1.05 (0.97‐1.13) 1.34 (1.18‐1.52) 1.19 (1.08‐1.31)
Women 1.01 (0.97‐1.06) 1.01 (0.93‐1.10) 0.98 (0.92‐1.05) Medical History
Prevalent heart failure 1.06 (1.02‐1.11) 0.96 (0.87‐1.07) 1.05 (0.99‐1.12) Acute myocardial infarction 1.40 (1.32‐1.48) 1.29 (1.19‐1.40) 1.34 (1.26‐1.44) Unstable angina 1.26 (1.18‐1.35) 1.24 (1.10‐1.40) 1.26 (1.17‐1.37) Percutaneous coronary intervention 1.10 (1.03‐1.17) 1.04 (0.94‐1.15) 1.04 (0.96‐1.12) Ischemic stroke or transient ischemic attack 1.37 (1.29‐1.45) 1.23 (1.11‐1.35) 1.28 (1.19‐1.38) Other thromboembolic event N/A 1.27 (1.00‐1.63) 0.97 (0.80‐1.19) Atrial fibrillation or flutter 1.25 (1.20‐1.30) N/A 1.22 (1.16‐1.29) Ventricular tachycardia or fibrillation N/A N/A 1.60 (1.47‐1.75) Mitral or aortic valve disease 1.01 (0.97‐1.06) 1.06 (0.97‐1.14) 1.00 (0.94‐1.06) Peripheral arterial disease 1.50 (1.42‐1.59) 1.62 (1.48‐1.78) 1.67 (1.54‐1.80) Cardiac resynchronization therapy N/A N/A 1.36 (1.06‐1.74) Implantable cardioverter defribillator N/A 1.03 (0.87‐1.22) 1.00 (0.91‐1.09) Pacemaker 1.20 (1.13‐1.28) 1.12 (0.99‐1.27) 1.07 (0.99‐1.16) Dyslipidemia 0.94 (0.89‐1.00) 0.97 (0.86‐1.09) 0.96 (0.89‐1.03) Hypertension 1.17 (1.09‐1.26) 1.27 (1.14‐1.41) 1.25 (1.18‐1.33) Diabetes mellitus 1.07 (1.02‐1.12) 1.17 (1.08‐1.27) 1.09 (1.02‐1.16) Hospitalized bleed 1.43 (1.35‐1.52) 1.45 (1.31‐1.61) 1.51 (1.38‐1.64) Diagnosed dementia N/A 1.18 (1.03‐1.35) N/A Diagnosed depression 1.16 (1.10‐1.21) 1.19 (1.09‐1.30) 1.17 (1.10‐1.25) Chronic lung disease 1.30 (1.25‐1.36) 1.30 (1.21‐1.40) 1.35 (1.29‐1.42) Mechanical fall 1.53 (1.40‐1.66) 1.71 (1.44‐2.05) 1.64 (1.42‐1.90) Systemic cancer N/A 1.13 (0.99‐1.28) N/A
Hemoglobin, g/L > 16 0.88 (0.78‐0.99) 0.74 (0.61‐0.89) 0.85 (0.76‐0.95) 15.0‐15.9 0.89 (0.82‐0.98) 0.85 (0.74‐0.99) 0.82 (0.75‐0.90) 14‐14.9 0.90 (0.85‐0.96) 0.88 (0.78‐0.98) 0.94 (0.87‐1.01) 13.0‐13.9 Reference Reference Reference 12.0‐12.9 1.14 (1.08‐1.21) 1.13 (1.02‐1.25) 1.17 (1.10‐1.26) 11.0‐11.9 1.41 (1.34‐1.49) 1.33 (1.20‐1.48) 1.39 (1.29‐1.50) 10.0‐10.9 1.74 (1.62‐1.86) 1.68 (1.48‐1.90) 1.80 (1.64‐1.96) 9.0‐9.9 2.35 (2.17‐2.55) 2.35 (2.00‐2.77) 2.30 (2.07‐2.57) <9.0 3.15 (2.83‐3.51) 2.70 (2.14‐3.40) 3.07 (2.61‐3.61) Missing 0.77 (0.63‐0.94) 0.73 (0.53‐1.02) 0.72 (0.60‐0.87)
Systolic blood pressure, mmHg >180 1.40 (1.26‐1.57) 1.66 (1.36‐2.03) 1.46 (1.20‐1.79) 160‐179 1.19 (1.11‐1.27) 1.17 (1.03‐1.34) 1.18 (1.05‐1.33)
SUPPLEMENTAL MATERIAL
Hospitalization for Any Cause
Variable
Preserved Systolic Function
(N = 14,907)
Borderline Reduced Systolic Function
(N = 4,862)
Reduced Systolic Function (N = 10,325)
140‐159 1.03 (0.98‐1.08) 1.01 (0.93‐1.10) 1.00 (0.93‐1.07) 130‐139 0.90 (0.86‐0.94) 0.92 (0.85‐0.99) 0.92 (0.86‐0.97) 121‐129 0.94 (0.90‐0.99) 0.90 (0.84‐0.98) 0.89 (0.84‐0.94) 110‐120 Reference Reference Reference 100‐109 1.08 (1.02‐1.15) 1.02 (0.93‐1.12) 0.99 (0.93‐1.05) <100 1.46 (1.37‐1.56) 1.23 (1.10‐1.37) 1.34 (1.25‐1.44) Missing 0.88 (0.75‐1.03) 0.83 (0.60‐1.15) 0.93 (0.77‐1.14)
HDL cholesterol category, g/dL >60 0.92 (0.86‐0.98) 0.98 (0.88‐1.10) 1.04 (0.93‐1.16) 50‐59 0.93 (0.88‐0.98) 1.03 (0.93‐1.14) 1.01 (0.94‐1.08) 40‐49 Reference Reference Reference 35‐39 0.95 (0.89‐1.02) 1.06 (0.96‐1.17) 1.02 (0.95‐1.10) <35 1.04 (0.98‐1.10) 1.18 (1.07‐1.29) 1.09 (1.02‐1.17) Missing 0.88 (0.75‐1.04) 0.67 (0.41‐1.10) 0.96 (0.67‐1.40)
LDL cholesterol category, g/dL >200 N/A 1.43 (0.97‐2.12) 1.21 (0.90‐1.62) 160‐199 N/A 1.02 (0.79‐1.31) 0.99 (0.78‐1.26) 130‐159 Reference Reference Reference 100‐129 N/A 0.94 (0.79‐1.11) 0.91 (0.80‐1.02) 70‐99 N/A 0.92 (0.76‐1.11) 0.86 (0.76‐0.97) <70 N/A 0.96 (0.78‐1.17) 0.90 (0.79‐1.02) Missing N/A 1.07 (0.76‐1.52) 1.10 (0.77‐1.58)
Total cholesterol category, g/dL >240 1.13 (1.04‐1.24) 1.00 (0.81‐1.23) 1.05 (0.84‐1.31) 200‐240 1.10 (1.04‐1.17) 1.01 (0.86‐1.19) 0.96 (0.87‐1.06) <200 Reference Reference Reference Missing 1.18 (0.98‐1.41) 1.73 (1.07‐2.81) 1.04 (0.82‐1.32)
Serum sodium category, mmol/l >150 1.38 (1.01‐1.88) 1.67 (0.79‐3.52) 1.70 (1.08‐2.68) 140‐149 0.86 (0.82‐0.89) 0.93 (0.87‐1.00) 0.88 (0.84‐0.92) 130‐139 Reference Reference Reference <130 1.83 (1.61‐2.07) 1.57 (1.19‐2.08) 1.74 (1.41‐2.15) Missing 0.79 (0.68‐0.91) 1.01 (0.83‐1.23) 1.01 (0.87‐1.17)
*N/A denotes variable was not adjusted for in the model. Variables were not included if baseline comparison p‐value was greater than 0.2