Embed Size (px)
Citation preview
© 2015 Enroll America and Get Covered America EnrollAmerica.org | GetCoveredAmerica.org
Using Data to Support Partner Coordina3on John Malloy, Na,onal Partner Data Manager, Enroll America Erik Wallenius, Deputy Director of Outreach, Get Covered Illinois Andrew Greenberg, CO Data & Training Coordinator, Enroll America

• Understand how data can be used to support coali,ons
• Learn from case studies on partner coordina,on using data.
• Understand tools available to support data collabora,on between partner organiza,ons
Objec3ves
• Introduc,ons • The What & Why of Data • Program Planning & Management using Data in Illinois
• Coordina,ng Partner Ac,vity Using Data in Colorado
• Ques,ons
Agenda

Introduc3ons

5
So, What Is Data?
What Is Data A?er All?
• 1’s & 0’s? Like the Matrix?
What Is Data A?er All?
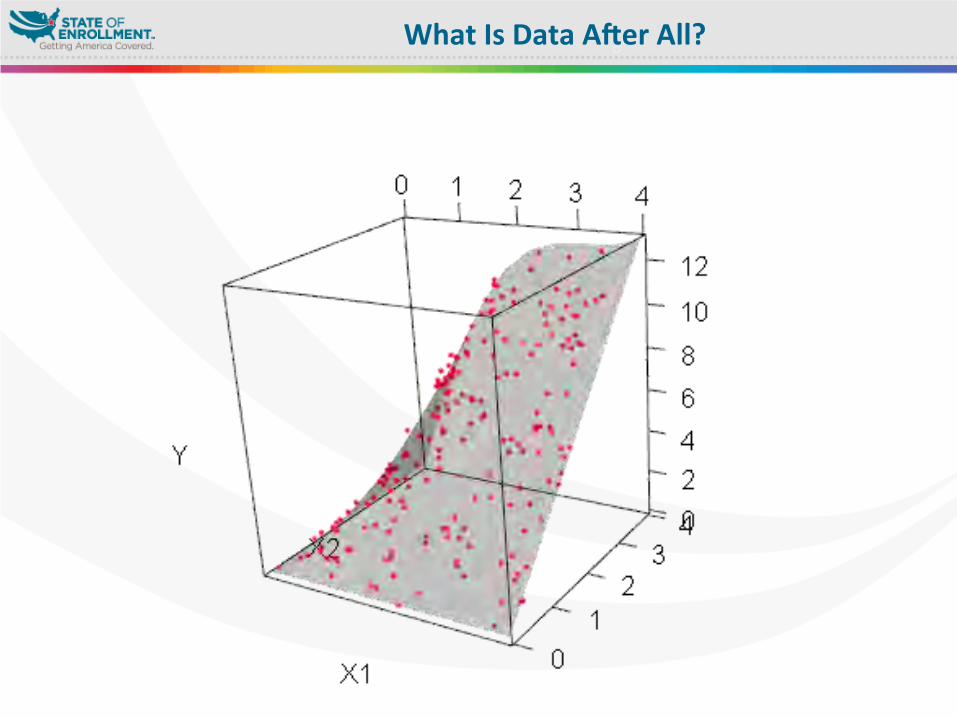
What Is Data A?er All?
• 1’s & 0’s? Like the Matrix?
• Complex Regression Graphs?
What Is Data A?er All?

What Is Data A?er All?
• 1’s & 0’s? Like the Matrix?
• Complex Regression Graphs? • Really cool heat maps?
What Is Data A?er All?

12
Data can be used to create all of those things.
However…

13
“Data” is simply tracking the
conversa3ons your program has with
its intended audience

14
Why Does Enroll America Care About
Data?
• Where are the Uninsured?
• What Strategies will work when we try to engage with consumers?
• How can we evaluate our program?
• How can we tell the story of our program?
We All have Big Ques3ons

• Where are the Uninsured? Using demographic data, we can find consumers who are more likely to be uninsured
• What Strategies will work when we try to engage with consumers?
Once we find them, we can track our strategies by tracking each conversa3on we have.
• How can we evaluate our program? With the data we gather on conversa3ons, we can evaluate our strategies against each other.
• How can we tell the story of our program? When you track your data as you go, you can provide snapshot reports to stakeholders quickly.
We All have Big Ques3ons

What makes up data?
Name & Demographics Contact Information Conversations Questions People Answer
…. And really anything else you can imagine

18
How can data be used to target outreach?

Let’s look at what data we can track on consumers
19
Uninsured Propensity Address
Age DOB
Gender
Name
Phone Number Race
Contacts
Insurance Status
Interest in New
Coverage
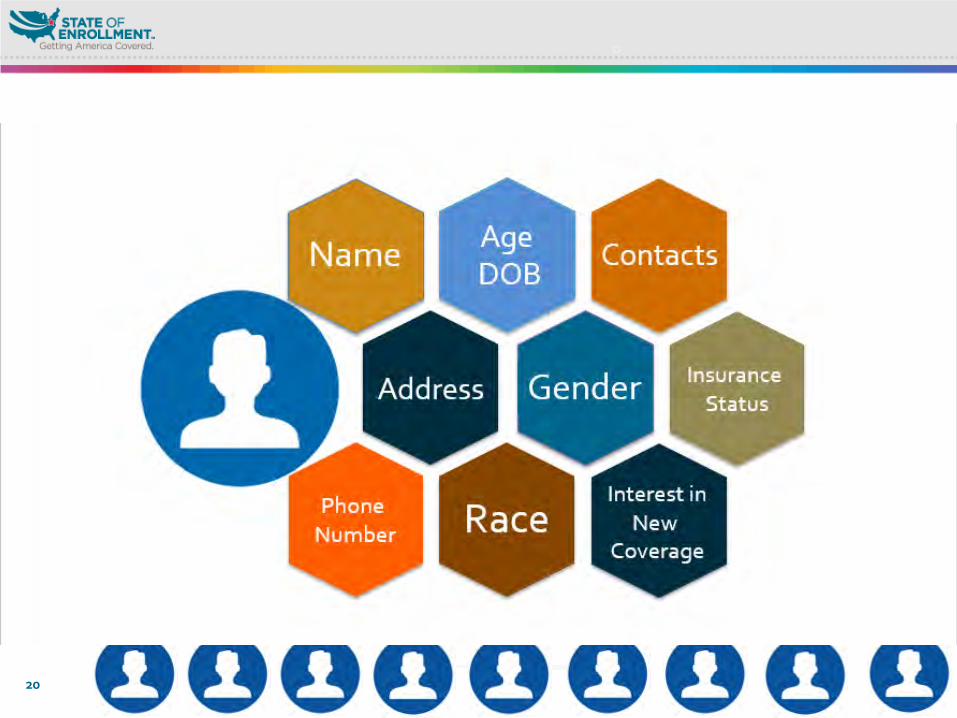
20
Uninsured Propensity

21 21

22
23
How we use data

Follow Up MaTers
0%
10%
20%
30%
40%
1 2 3 4+
Percent Successfully Enrolled (Among Uninsured Consumers)
Number of Field Conversa,ons
20% 22%
28%
33%

• …especially among important communities!
Follow Up MaTers

Using Data to Support Mass Contact
Bulk Mailing Virtual Phone Bank &
AutoDialer
RoboCalls &
RoboSurveys

Program Coordina3on
A B C

Geographic Coordina3on – “Turfing”
A B C

Communica3ons Channel Coordina3on
A B C
“Get Your House In Order (With Data)” Erik Wallenius Deputy Director, Outreach & Consumer Education
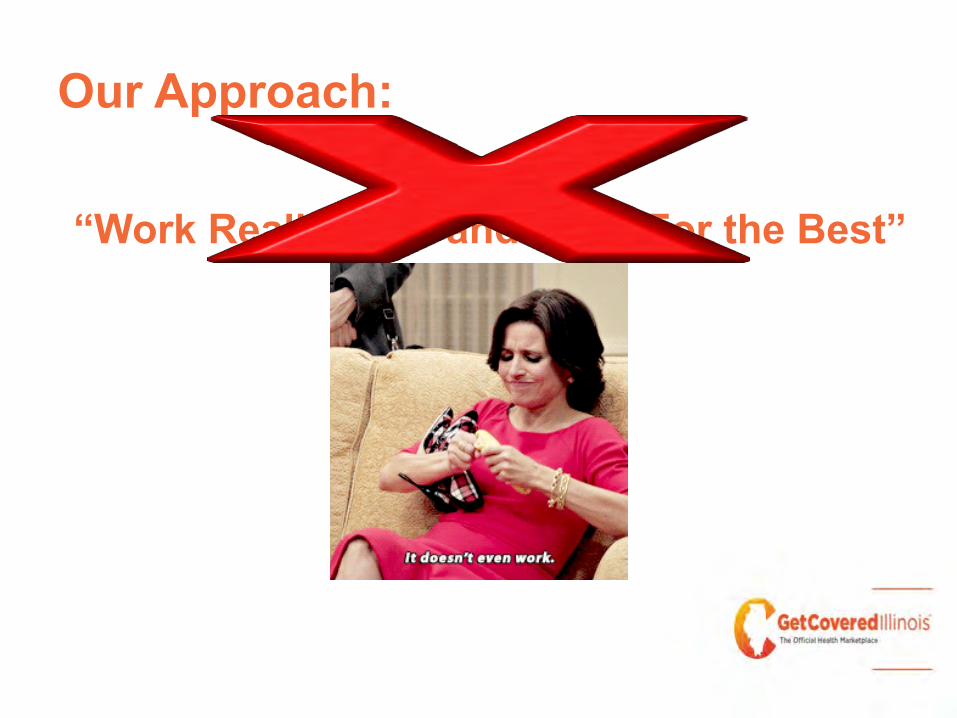
Our Approach:
“Work Really Hard and Hope For the Best”

Our Approach:
“Focus, Measure, and Track”
* (not an actual Navigator)

Data Can Help You Manage Turf

First Task: Outreach Regions
First Task: Outreach Regions
• The Census • Small Area Health Insurance Estimates (SAHIE) • Public Use Microdata Areas (PUMAs)

First Task: Outreach Regions
• A Brief Sidebar about PUMAs

First Task: Outreach Regions
• Healthcare-Related Nonprofits • Kaiser Family Foundation (KFF) • Shriver Center • Health & Disability Advocates (HDA)
• Illinois Health Matters

First Task: Outreach Regions
• Other Research and Data Entities • State Health Access Data Assistance Center (SHADAC)

First Task: Outreach Regions
• Tools Used • Microsoft Excel • Google Earth • Two computer monitors (optional, but recommended)
Data Can Help You Understand Consumers

Second Task: Consumer Data
Primary Data Collection Tool: the Request For Information Card (RFI Card)

Second Task: Consumer Data
Get Covered Data (GCD)

Data Can Help You Manage Assisters

Third Task: Navigator Management
• Weekly performance metrics

Third Task: Navigator Management
• Build data into grant application process

Thank you
• Engage local partners
• Provide data services to empower and increase efficiency
• Reach an ever-harder-to-reach population
Colorado Program Goals

• Existing Relationships within Vital Communities • Intricate knowledge of opportunities & challenges
in each community • Ability to create long-lasting institutions of
coverage outreach, education & enrollment.
Why Work with Partners?
• Convened 13 Organizations
• 10 Enrollment Assister Organizations
• 3 Outreach-Only Organizations
• Partner Organizations:
• Met with Enroll America to develop Program Goals & Strategies
• Used Get Covered Data to track their work and share data
• Engaged in joint training & planning meetings.
OE2 Program in Colorado

• Partners wanted to be able to collaborate on phone banks and canvassing.
• Partners wanted to identify consumers they were working with, while maintaining some data privacy between organizations.
Why Share Data?

• Each Enrollment Assister Organization had non-overlapping turf for outreach purposes • Enroll America staff helped define these areas based on Zip Codes,
to create very specific geographic areas.
• Partners did not call into each other’s areas
Turfing to Avoid Duplica3on

Direct Mail Campaign Funded by Piton
Foundation
Robocall Based on Mailing List
Major Data Coordina3on Pieces

• Multiple touches increase the likelihood that a consumer will enroll in coverage
Why Mail & Robocalls?
• Funded by the Piton Foundation
• Post cards with health coverage information sent to 75,000 likely uninsured consumers
• Coverage area touched several Partner Turfs
Direct Mail Campaign

• Encourage specific targeted consumers to enroll
• Provide Baseline Contact Attempt to Narrow Outreach Efforts
• Partners combining resources to reach the one group
Direct Mail Campaign

• Used GCD and Enroll America’s Uninsured Propensity Model to create list
• Divided the mailing list by ZIP codes for each partner to use for follow-up outreach
• Database structure made data sharing easy
Piton Mailing – Role of Data

• 15-second message
• Built on Piton mailing list
• Sent during hours people would be home
Robocall -‐ What

• An additional touch
• Give consumers information on enrollment deadline
• Provide better contact lists to Partners
Robocall -‐ Why
• Built In Robocall Tools in GCD
• Existing Piton list already in database – easy to access
• Database structure made data sharing easy
Robocall – Role of Data

• Used to share information between outreach-only groups and enrollment groups • Consumers ID’ed as needing a referral
• Typically a phone list within GCD
• Could also be an Excel export
Referrals
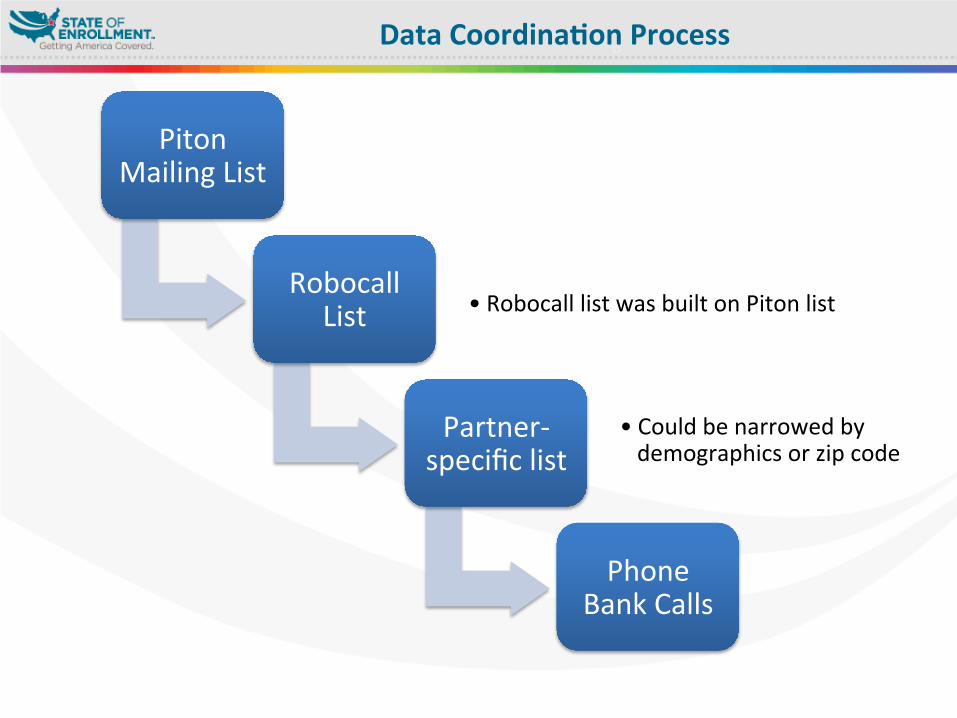
Piton Mailing List
Robocall List • Robocall list was built on Piton list
Partner-‐specific list
• Could be narrowed by demographics or zip code
Phone Bank Calls
Data Coordina3on Process
• Avoid overlapping areas of activity
• Develop a data-sharing system that includes referrals for enrollment assistance
• Data from large outreach efforts, like mailings and robocalls, should be shared
Recommenda3ons

• What We Know & How We Learned It • Friday – 10:15AM – 11:45AM • Mt. Vernon B (Meeting Room Level)
• Know Your Numbers: How to Quantify Qualitative Data on Media Outreach • Friday – 2:15PM – 3:15PM • Mt. Vernon A (Meeting Room Level)
Other Data & Analytics Workshops

• Getting Started with Google Docs • Friday – 10:15AM – 11:45AM
• Get Covered Data Interactive Demonstration • Friday – 2:15PM – 3:15PM
Get Covered Academy Learning Lab Meeting Room 16
Data & Analytics Interactive Trainings

The Data & Analytics Booth is on the Ballroom Level,
where you can…
Meet members of our Data & Analytics Team
Learn more about Data Services we provide to partner organizations,
including Get Covered Data Access & Support
Customized Mapping Services Customized Market Analysis Services
Data & Analytics Training Opportunities
Ask any follow up questions from any of our sessions
Data & Analytics Booth
ACA

67
New training resources
• Highly customized, action-oriented • New suite of training services
• Goal-setting • Planning • Coaching • In-person training
• FOR MORE INFO – [email protected]