Embed Size (px)
Citation preview
Delivering ResultsWells Fargo TMT ConferenceNovember 2014
Forward‐Looking Statement
Some slides and comments included here, particularly related to estimates,comments on expectations about future performance or business conditions, maycontain “forward‐looking statements” within the meaning of the federal securitieslaws which involve risks and uncertainties. You can identify forward‐lookingstatements because they contain words such as “believes,” “project,” “might,”“expects,” “may,” “will,” “should,” “seeks,” “approximately,” “intends,” “plans,”“estimates” or “anticipates” or similar expressions that concern our strategy, plansor intentions. These forward‐looking statements are subject to risks anduncertainties that may change at any time, and could cause actual results to differmaterially from those that we anticipate. While we believe that the expectationsreflected in such forward‐looking statements are reasonable, we caution that it isvery difficult to predict the impact of unknown factors, and it is impossible for us toanticipate all factors that could affect our actual results. Important factors,including those listed under Item 1A in the Partnership’s Form 10‐K could adverselyaffect our future financial performance and cause actual results to differ materiallyfrom our expectations.
2
Cedar Fair at a Glance
3(a) One hotel with indoor water park(b) See appendix for reconciliation of Adjusted EBITDA(c) Yield based on closing prices on November 7, 2014
Net Revenues
Adjusted EBITDA
Yield
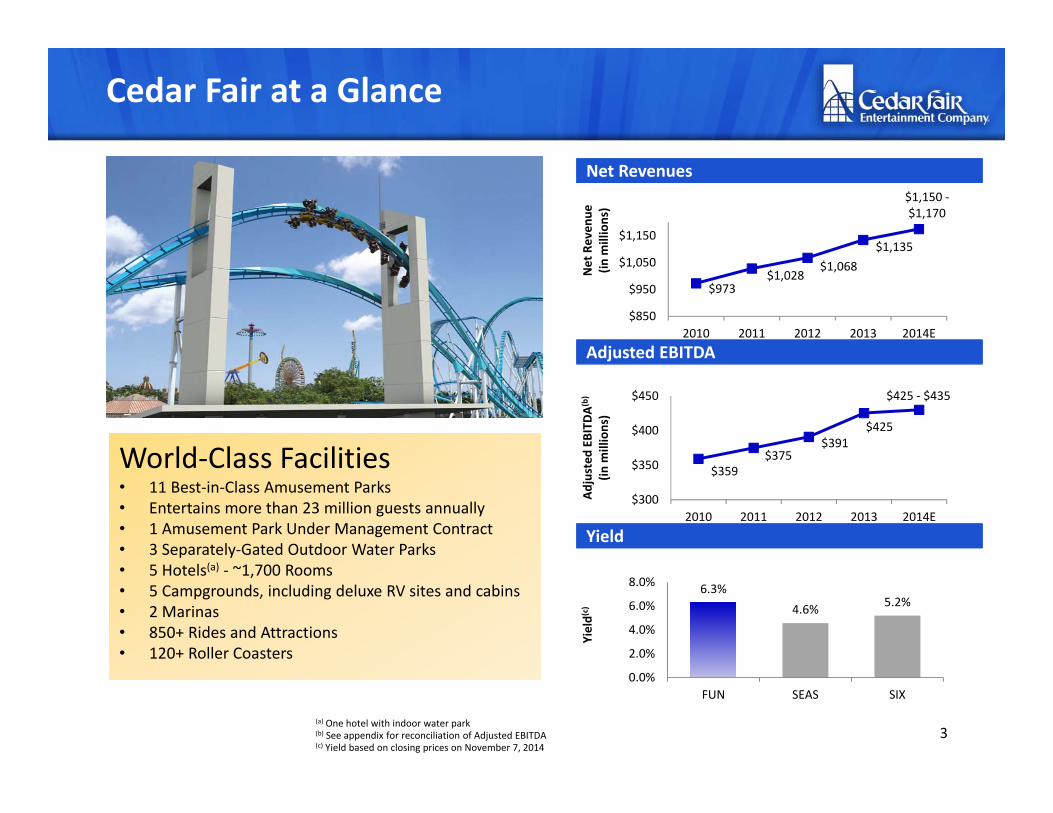
World‐Class Facilities• 11 Best‐in‐Class Amusement Parks• Entertains more than 23 million guests annually• 1 Amusement Park Under Management Contract• 3 Separately‐Gated Outdoor Water Parks• 5 Hotels(a) ‐ ~1,700 Rooms• 5 Campgrounds, including deluxe RV sites and cabins• 2 Marinas• 850+ Rides and Attractions• 120+ Roller Coasters
World‐Class Facilities• 11 Best‐in‐Class Amusement Parks• Entertains more than 23 million guests annually• 1 Amusement Park Under Management Contract• 3 Separately‐Gated Outdoor Water Parks• 5 Hotels(a) ‐ ~1,700 Rooms• 5 Campgrounds, including deluxe RV sites and cabins• 2 Marinas• 850+ Rides and Attractions• 120+ Roller Coasters
3
$359 $375
$391 $425
$425 ‐ $435
$300
$350
$400
$450
2010 2011 2012 2013 2014E
Adjusted
EBITD
A(b)
(in m
illions)
$973$1,028
$1,068$1,135
$1,150 ‐$1,170
$850
$950
$1,050
$1,150
2010 2011 2012 2013 2014E
Net Reven
ue
(in m
illions)
6.3%4.6% 5.2%
0.0%
2.0%
4.0%
6.0%
8.0%
FUN SEAS SIX
Yield(
c)
Key Differentiators
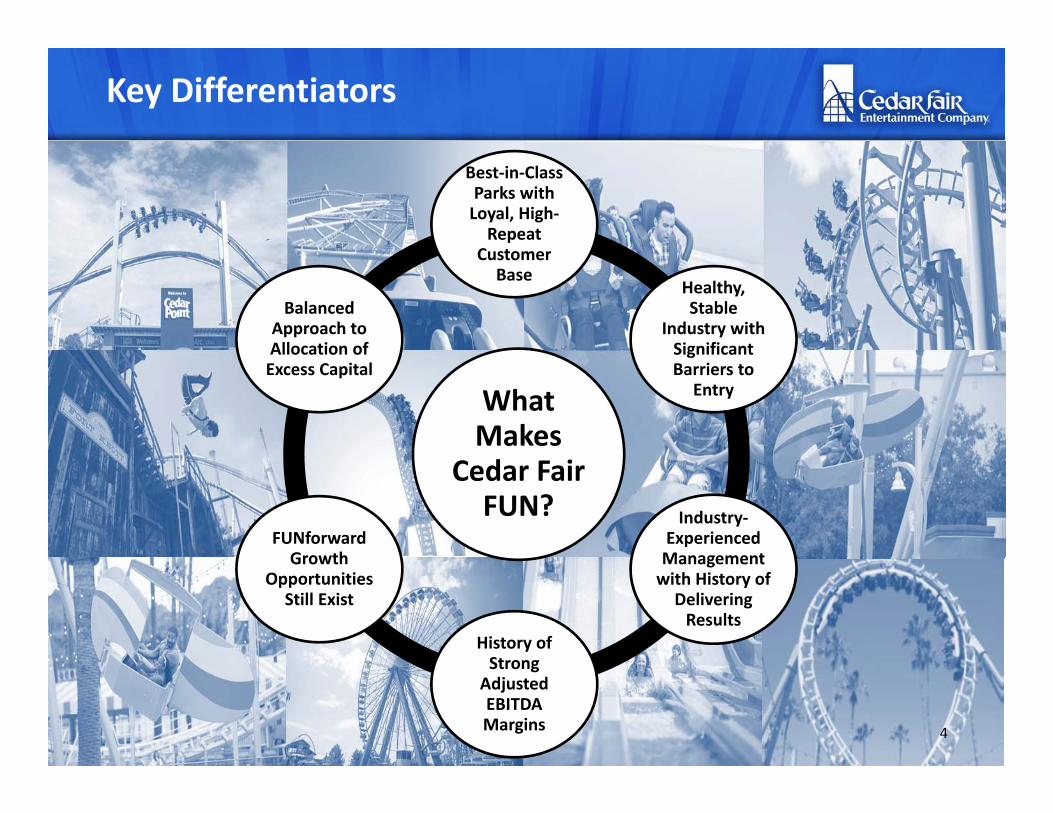
What Makes
Cedar Fair FUN?
Best‐in‐Class Parks with Loyal, High‐Repeat
Customer Base
Healthy, Stable
Industry with Significant Barriers to
Entry
Industry‐Experienced Management with History of Delivering Results
History of Strong Adjusted EBITDA Margins
FUNforwardGrowth
Opportunities Still Exist
Balanced Approach to Allocation of Excess Capital
4
Best‐in‐Class Parks
5
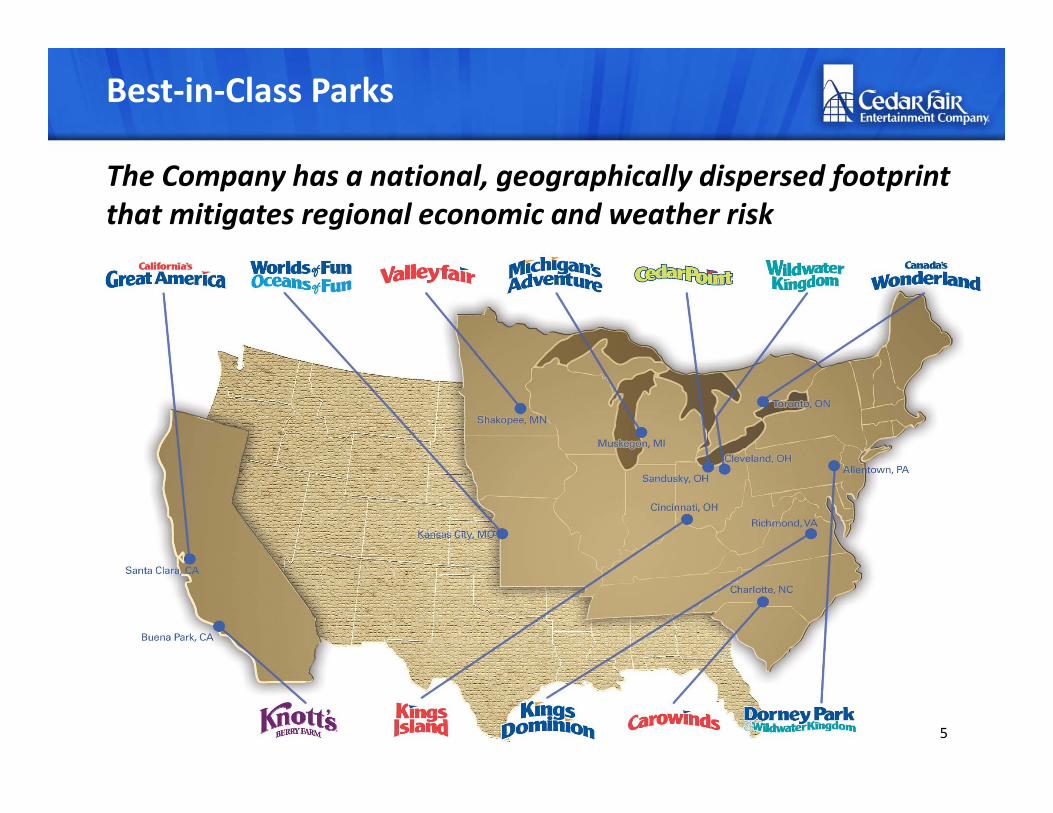
The Company has a national, geographically dispersed footprint that mitigates regional economic and weather risk
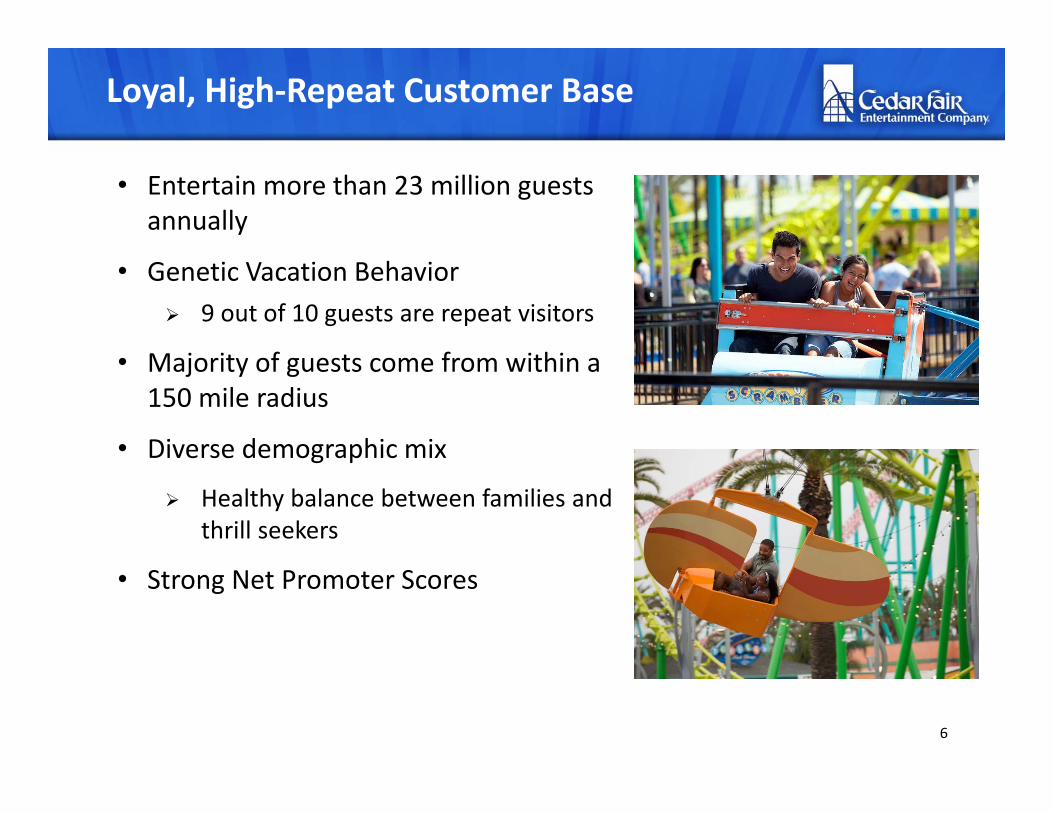
Loyal, High‐Repeat Customer Base
• Entertain more than 23 million guests annually
• Genetic Vacation Behavior 9 out of 10 guests are repeat visitors
• Majority of guests come from within a 150 mile radius
• Diverse demographic mix
Healthy balance between families and thrill seekers
• Strong Net Promoter Scores
6
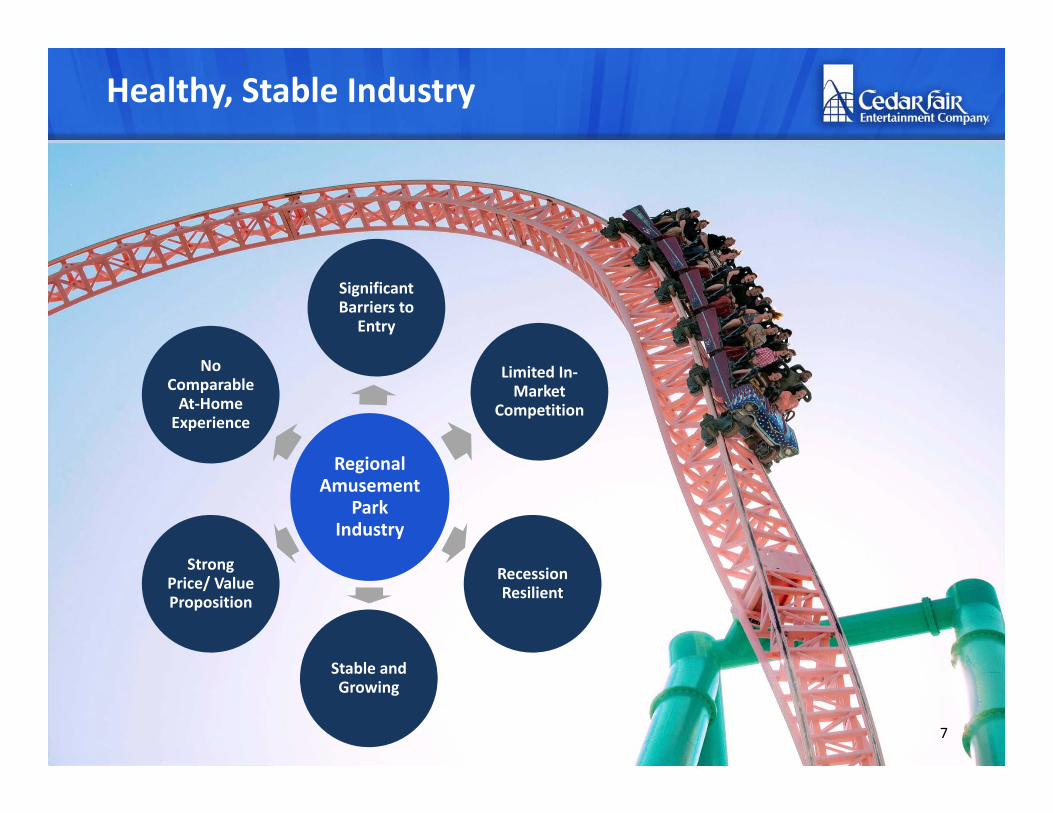
Healthy, Stable Industry
Regional Amusement
Park Industry
Significant Barriers to
Entry
Limited In‐Market
Competition
Recession Resilient
Stable and Growing
Strong Price/ Value Proposition
No Comparable At‐Home Experience
7

Strong, Experienced Management Team
Name Position Years with Cedar Fair
Years In Industry
Matt A. Ouimet (56) President and Chief Executive Officer 3 24
Richard A. Zimmerman (53) Chief Operating Officer 23 27
Brian C. Witherow (47) Executive Vice President and Chief Financial Officer 19 21
Kelley Semmelroth (49) Executive Vice President and Chief Marketing Officer 2 9
H. Philip Bender (58) Executive Vice President 35 42
David R. Hoffman (45) Senior Vice President and Chief Accounting Officer 8 8
Craig J. Freeman (60) Corporate Vice President of Administration 34 34
Duffield E. Milkie (48) Corporate Vice President and General Counsel 6 6
Robert A. Decker (53) Corporate Vice President of Planning & Design 15 25
Management team with proven experience both with Cedar Fair and in the leisure and hospitality industry
8
Long History of Growth
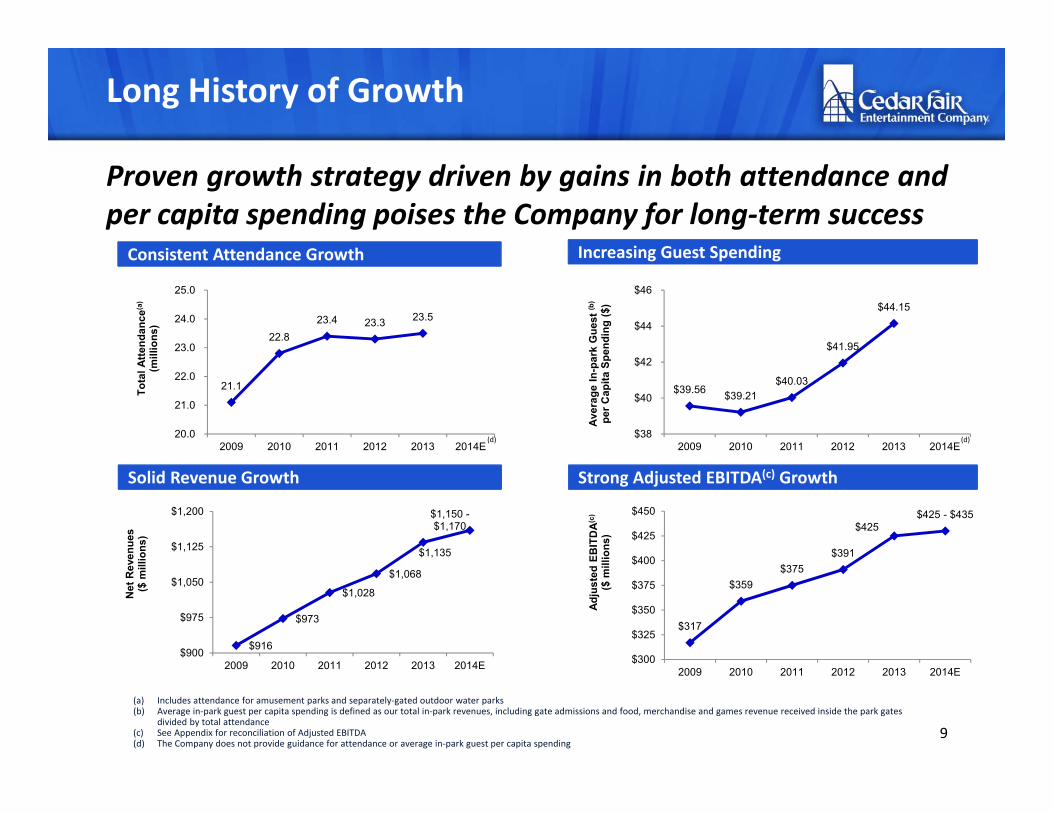
Proven growth strategy driven by gains in both attendance andper capita spending poises the Company for long‐term success
9
(a) Includes attendance for amusement parks and separately‐gated outdoor water parks (b) Average in‐park guest per capita spending is defined as our total in‐park revenues, including gate admissions and food, merchandise and games revenue received inside the park gates
divided by total attendance(c) See Appendix for reconciliation of Adjusted EBITDA(d) The Company does not provide guidance for attendance or average in‐park guest per capita spending
Consistent Attendance Growth Increasing Guest Spending
Solid Revenue Growth Strong Adjusted EBITDA(c) Growth
21.1
22.823.4 23.3 23.5
20.0
21.0
22.0
23.0
24.0
25.0
2009 2010 2011 2012 2013 2014E
Tota
l Atte
ndan
ce(a
)
(mill
ions
)
$39.56 $39.21$40.03
$41.95
$44.15
$38
$40
$42
$44
$46
2009 2010 2011 2012 2013 2014E
Aver
age
In-p
ark
Gue
st (b
)
per C
apita
Spe
ndin
g ($
)
(d)(d)
$317
$359$375
$391
$425$425 - $435
$300
$325
$350
$375
$400
$425
$450
2009 2010 2011 2012 2013 2014E
Adju
sted
EB
ITD
A(c)
($ m
illio
ns)
$916
$973
$1,028
$1,068
$1,135
$1,150 -$1,170
$900
$975
$1,050
$1,125
$1,200
2009 2010 2011 2012 2013 2014E
Net
Rev
enue
s($
mill
ions
)
Long History of Growth
10
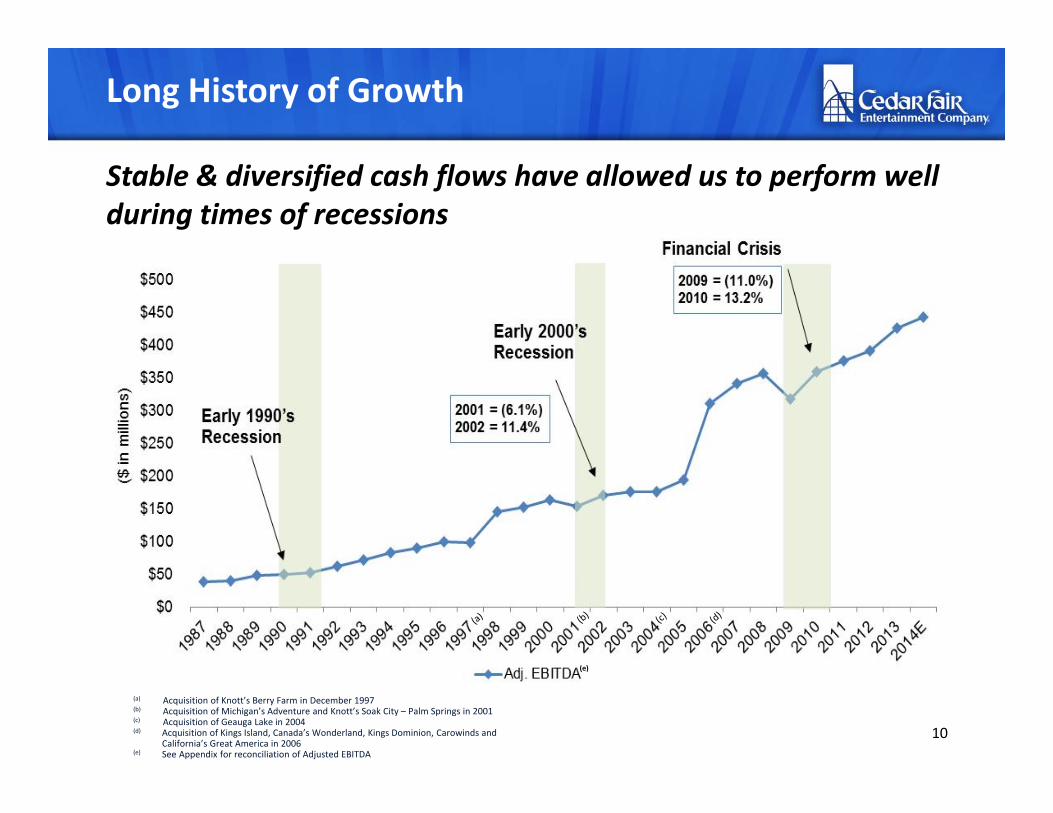
Stable & diversified cash flows have allowed us to perform well during times of recessions
(a) Acquisition of Knott’s Berry Farm in December 1997(b) Acquisition of Michigan’s Adventure and Knott’s Soak City – Palm Springs in 2001(c) Acquisition of Geauga Lake in 2004(d) Acquisition of Kings Island, Canada’s Wonderland, Kings Dominion, Carowinds and
California’s Great America in 2006(e) See Appendix for reconciliation of Adjusted EBITDA
FUNForward Growth Opportunities Exist
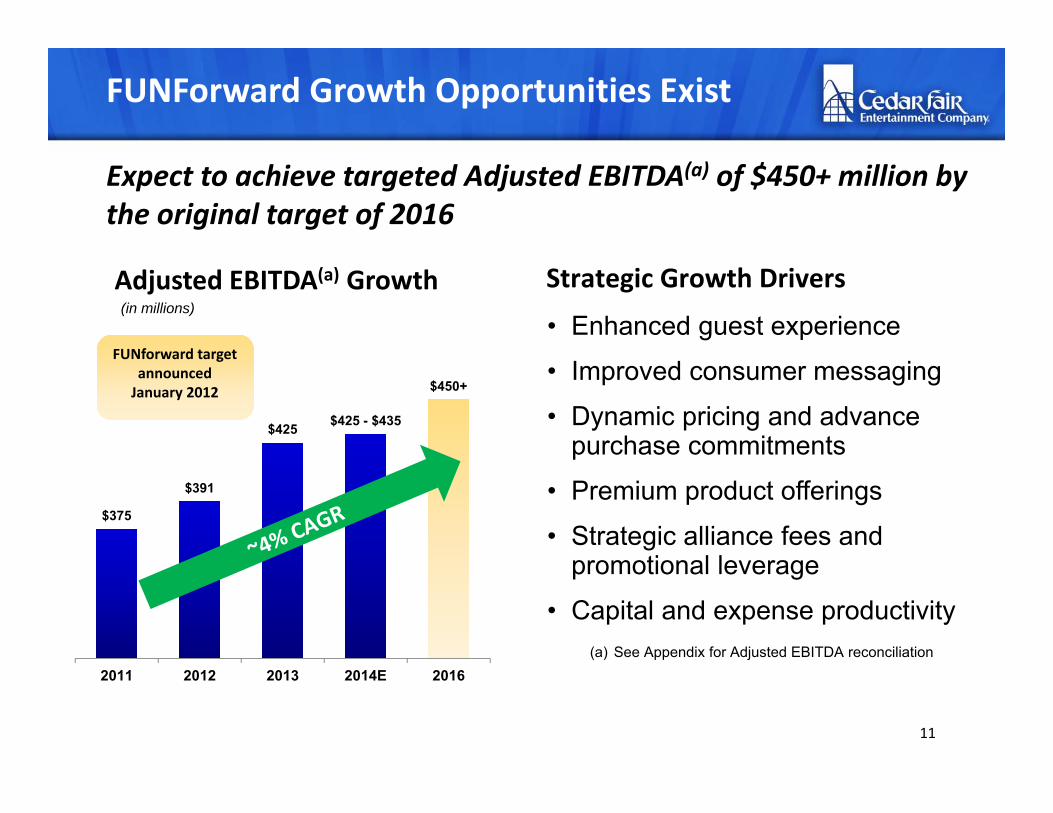
Expect to achieve targeted Adjusted EBITDA(a) of $450+ million by the original target of 2016
11
Adjusted EBITDA(a) Growth• Enhanced guest experience• Improved consumer messaging• Dynamic pricing and advance
purchase commitments• Premium product offerings• Strategic alliance fees and
promotional leverage• Capital and expense productivity
(in millions)
Strategic Growth Drivers
(a) See Appendix for Adjusted EBITDA reconciliation
FUNforward target announced January 2012
FUNforward target announced January 2012
$375
$391
$425 $425 - $435
$450+
2011 2012 2013 2014E 2016
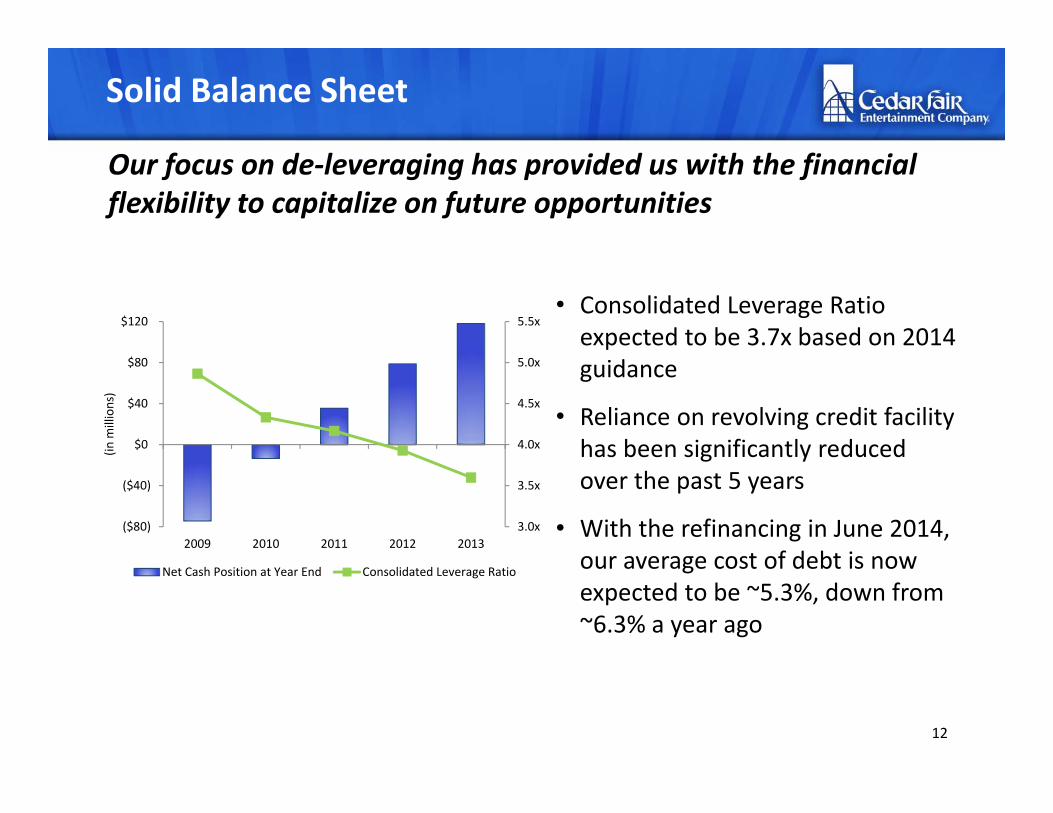
Solid Balance Sheet
Our focus on de‐leveraging has provided us with the financial flexibility to capitalize on future opportunities
• Consolidated Leverage Ratio expected to be 3.7x based on 2014 guidance
• Reliance on revolving credit facility has been significantly reduced over the past 5 years
• With the refinancing in June 2014, our average cost of debt is now expected to be ~5.3%, down from ~6.3% a year ago
12
3.0x
3.5x
4.0x
4.5x
5.0x
5.5x
($80)
($40)
$0
$40
$80
$120
2009 2010 2011 2012 2013
(in m
illions)
Net Cash Position at Year End Consolidated Leverage Ratio
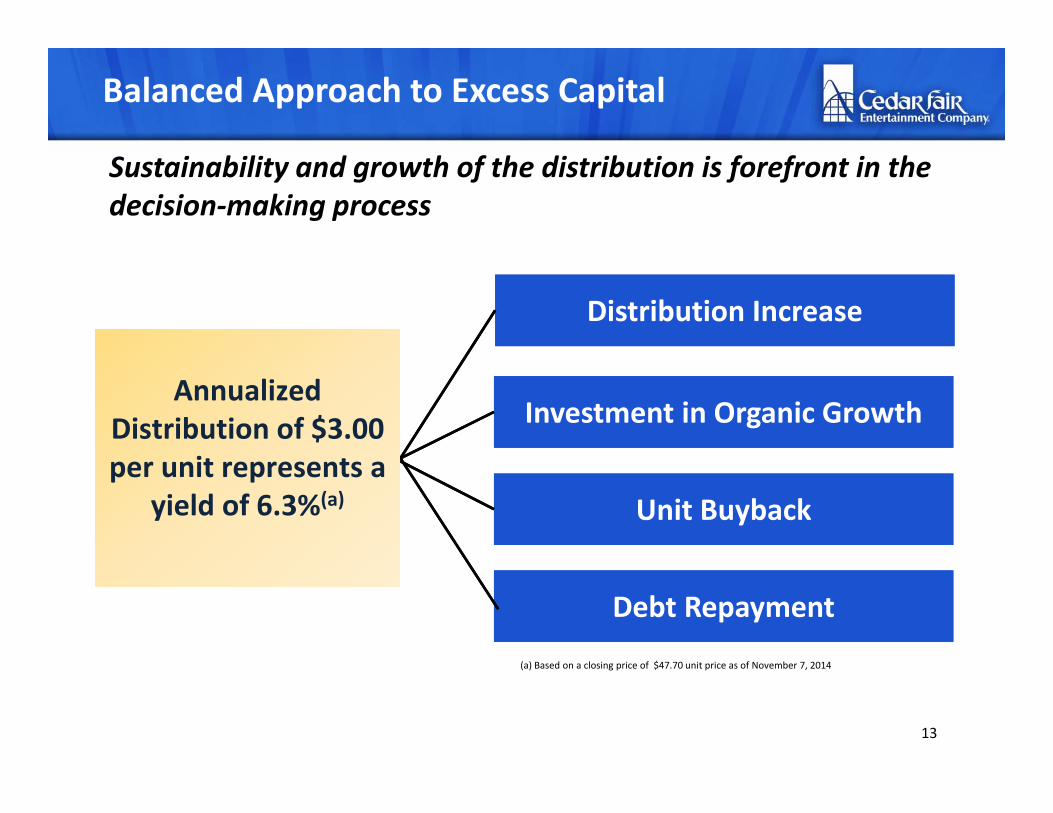
Balanced Approach to Excess Capital
Distribution IncreaseDistribution Increase
Unit BuybackUnit Buyback
Investment in Organic GrowthInvestment in Organic Growth
Sustainability and growth of the distribution is forefront in the decision‐making process
Debt RepaymentDebt Repayment
(a) Based on a closing price of $47.70 unit price as of November 7, 2014
13
Annualized Distribution of $3.00 per unit represents a
yield of 6.3%(a)
Annualized Distribution of $3.00 per unit represents a
yield of 6.3%(a)
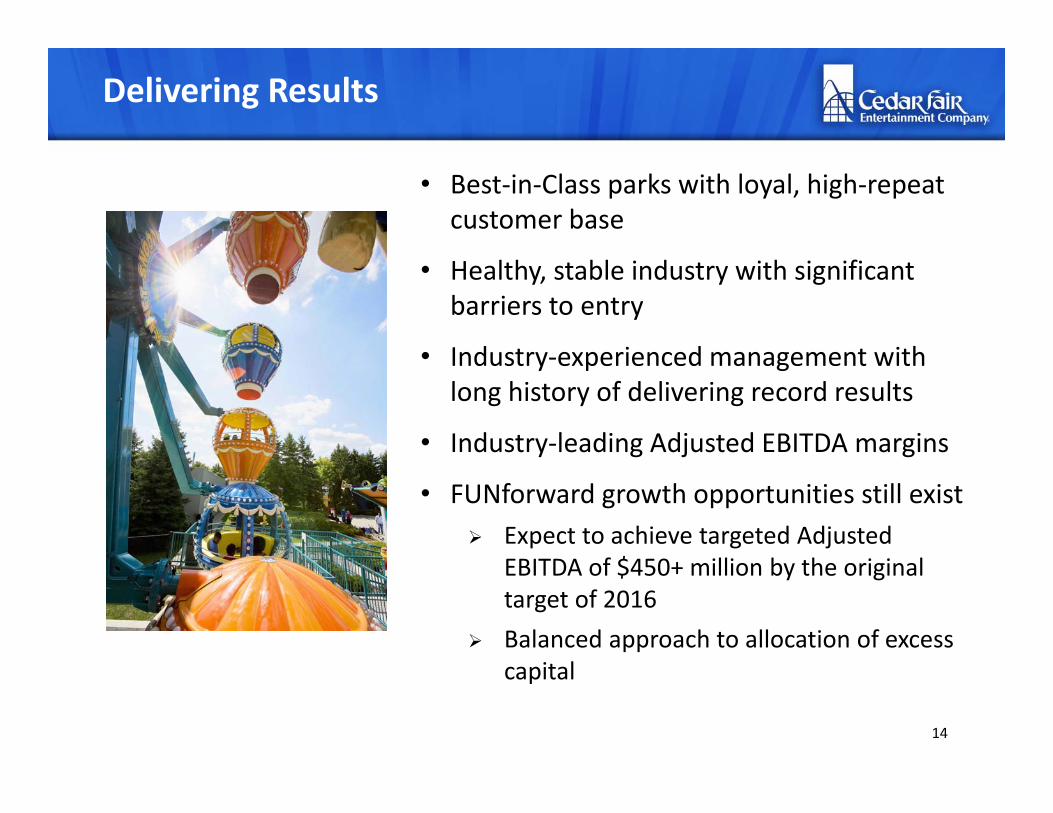
Delivering Results
14
• Best‐in‐Class parks with loyal, high‐repeat customer base
• Healthy, stable industry with significant barriers to entry
• Industry‐experienced management with long history of delivering record results
• Industry‐leading Adjusted EBITDA margins
• FUNforward growth opportunities still exist Expect to achieve targeted Adjusted
EBITDA of $450+ million by the original target of 2016
Balanced approach to allocation of excess capital
Appendix
15
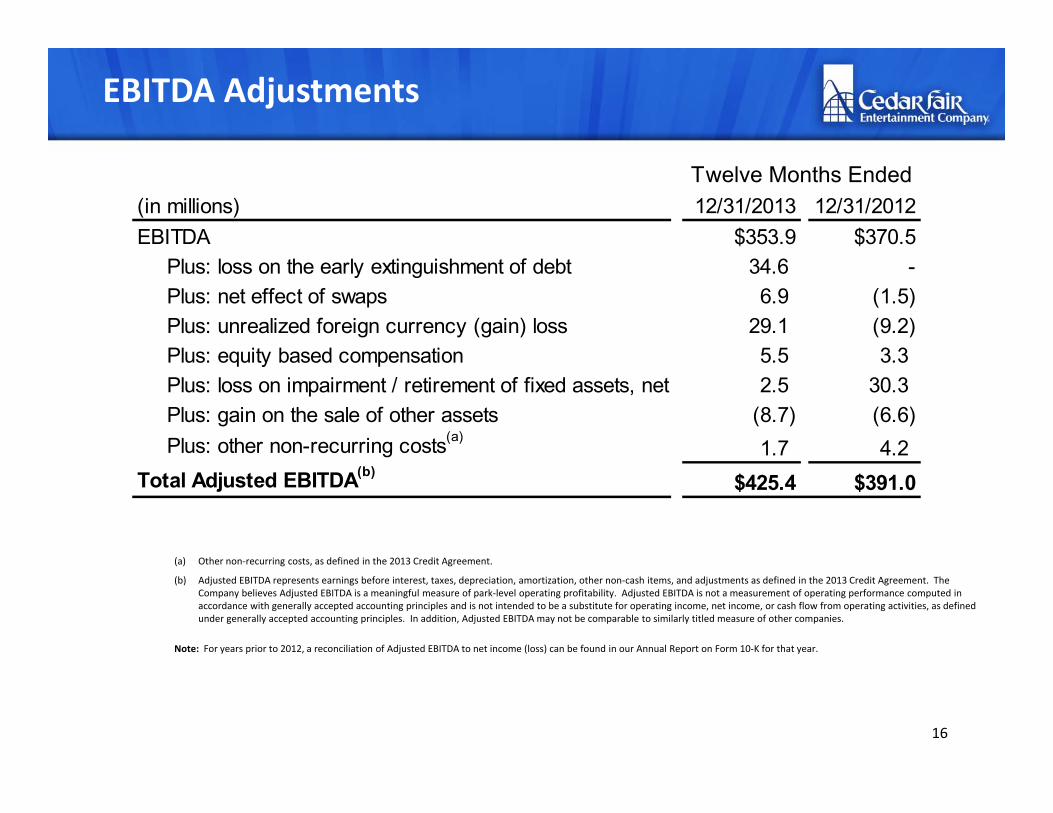
Note: For years prior to 2012, a reconciliation of Adjusted EBITDA to net income (loss) can be found in our Annual Report on Form 10‐K for that year.
(a) Other non‐recurring costs, as defined in the 2013 Credit Agreement.
(b) Adjusted EBITDA represents earnings before interest, taxes, depreciation, amortization, other non‐cash items, and adjustments as defined in the 2013 Credit Agreement. The Company believes Adjusted EBITDA is a meaningful measure of park‐level operating profitability. Adjusted EBITDA is not a measurement of operating performance computed in accordance with generally accepted accounting principles and is not intended to be a substitute for operating income, net income, or cash flow from operating activities, as defined under generally accepted accounting principles. In addition, Adjusted EBITDA may not be comparable to similarly titled measure of other companies.
EBITDA Adjustments
16
Twelve Months Ended(in millions) 12/31/2013 12/31/2012EBITDA $353.9 $370.5
Plus: loss on the early extinguishment of debt 34.6 -Plus: net effect of swaps 6.9 (1.5)Plus: unrealized foreign currency (gain) loss 29.1 (9.2)Plus: equity based compensation 5.5 3.3Plus: loss on impairment / retirement of fixed assets, net 2.5 30.3Plus: gain on the sale of other assets (8.7) (6.6)Plus: other non-recurring costs(a) 1.7 4.2
Total Adjusted EBITDA(b) $425.4 $391.0