Embed Size (px)
Citation preview

3Q 2016 Highlights and Operating ResultsOctober 25, 2016
1
2© 2016 Anixter Inc.
Safe Harbor Statement and Non-GAAP Financial Measures
Safe Harbor StatementThe statements in this release other than historical facts are forward-looking statements made in reliance upon the safe harbor of the Private Securities Litigation Reform Act of 1995. Theseforward-looking statements are subject to a number of factors that could cause our actual results to differ materially from what is indicated here. These factors include but are not limited togeneral economic conditions, the level of customer demand particularly for capital projects in the markets we serve, changes in supplier relationships or in supplier sales strategies or financialviability, risks associated with the sale of nonconforming products and services, political, economic or currency risks related to foreign operations, inventory obsolescence, copper price fluctuations,customer viability, risks associated with accounts receivable, the impact of regulation and regulatory, investigative and legal proceedings and legal compliance risks, information security risks,risks associated with substantial debt and restrictions contained in financial and operating covenants in our debt agreements, the impact and the uncertainty concerning the timing and terms ofthe withdrawal by the United Kingdom from the European Union, and risks associated with integration of acquired companies, including, but not limited to, the risk that the acquisitions may notprovide us with the synergies or other benefits that were anticipated. These uncertainties may cause our actual results to be materially different than those expressed in any forward lookingstatements. We do not undertake to update any forward looking statements. Please see our Securities and Exchange Commission (“SEC”) filings for more information.
Non-GAAP Financial Measures In addition to the results provided in accordance with U.S. Generally Accepted Accounting Principles (“GAAP”) above, this release includes certain financial measures computed using non-GAAP components as defined by the SEC. Specifically, net sales comparisons to the prior corresponding period, both worldwide and in relevant segments, are discussed in this release bothon a GAAP and non-GAAP basis. We believe that by providing non-GAAP organic growth, which adjusts for the impact of acquisitions (when applicable), foreign exchange fluctuations, copperprices and the number of billing days, both management and investors are provided with meaningful supplemental sales information to understand and analyze our underlying trends and otheraspects of our financial performance. We calculate the year-over-year organic sales growth and operating expenses impact relating to the Power Solutions acquisition by including its 2015comparable period results prior to the acquisition with our results (on a "pro forma" basis) as we believe this represents the most accurate representation of organic growth, considering thenature of the company we acquired and the synergistic revenues that have been or will be achieved. Historically and from time to time, we may also exclude other items from reported financialresults (e.g., impairment charges, inventory adjustments, restructuring charges, tax items, currency devaluations, pension settlements, etc.) in presenting adjusted operating expense, adjustedoperating income, adjusted income taxes and adjusted net income so that both management and financial statement users can use these non-GAAP financial measures to better understandand evaluate our performance period over period and to analyze the underlying trends of our business. As a result of the recent acquisitions we have also excluded amortization of intangibleassets associated with purchase accounting from acquisitions from the adjusted amounts for comparison of the non-GAAP financial measures period over period.
EBITDA is defined as net income from continuing operations before interest, income taxes, depreciation and amortization. Adjusted EBITDA is defined as EBITDA before foreign exchange andother non-operating expense and non-cash stock-based compensation, excluding the other items from reported financial results, as defined above. We believe that adjusted operating income,EBITDA and Adjusted EBITDA provide relevant and useful information, which is widely used by analysts, investors and competitors in our industry as well as by our management in assessingboth consolidated and business segment performance. Adjusted operating income provides an understanding of the results from the primary operations of our business by excluding the effectsof certain items that do not reflect the ordinary earnings of our operations. We use adjusted operating income to evaluate our period-over-period operating performance because we believethis provides a more comparable measure of our continuing business excluding certain items that are not reflective of expected ongoing operations. This measure may be useful to an investorin evaluating the underlying performance of our business. EBITDA provides us with an understanding of earnings before the impact of investing and financing charges and income taxes. AdjustedEBITDA further excludes the effects of foreign exchange and other non-cash stock-based compensation, and certain items that do not reflect the ordinary earnings of our operations and thatare also excluded for purposes of calculating adjusted net income, adjusted earnings per share and adjusted operating income. EBITDA and Adjusted EBITDA are used by our management forvarious purposes including as measures of performance of our operating entities and as a basis for strategic planning and forecasting. Adjusted EBITDA may be useful to an investor becausethis measure is widely used to evaluate a company’s operating performance without regard to items excluded from the calculation of such measure, which can vary substantially from companyto company depending on the accounting methods, book value of assets, capital structure and the method by which the assets were acquired, among other factors. They are not, however,intended as an alternative measure of operating results or cash flow from operations as determined in accordance with generally accepted accounting principles.
Non-GAAP financial measures provide insight into selected financial information and should be evaluated in the context in which they are presented. These non-GAAP financial measures havelimitations as analytical tools, and should not be considered in isolation from, or as a substitute for, financial information presented in compliance with GAAP, and non-GAAP financial measuresas reported by us may not be comparable to similarly titled amounts reported by other companies. The non-GAAP financial measures should be considered in conjunction with the CondensedConsolidated Financial Statements, including the related notes, and Management’s Discussion and Analysis of Financial Condition and Results of Operations included in this release. Managementdoes not use these non-GAAP financial measures for any purpose other than the reasons stated above.
3© 2016 Anixter Inc.
3Q 2016 Highlights and Operating Results
Table of Contents
1. Sales overview2. NSS overview3. EES overview4. UPS overview5. Financial performance trends6. Leverage metrics7. Financial details8. Outlook9. Appendix
4© 2016 Anixter Inc.
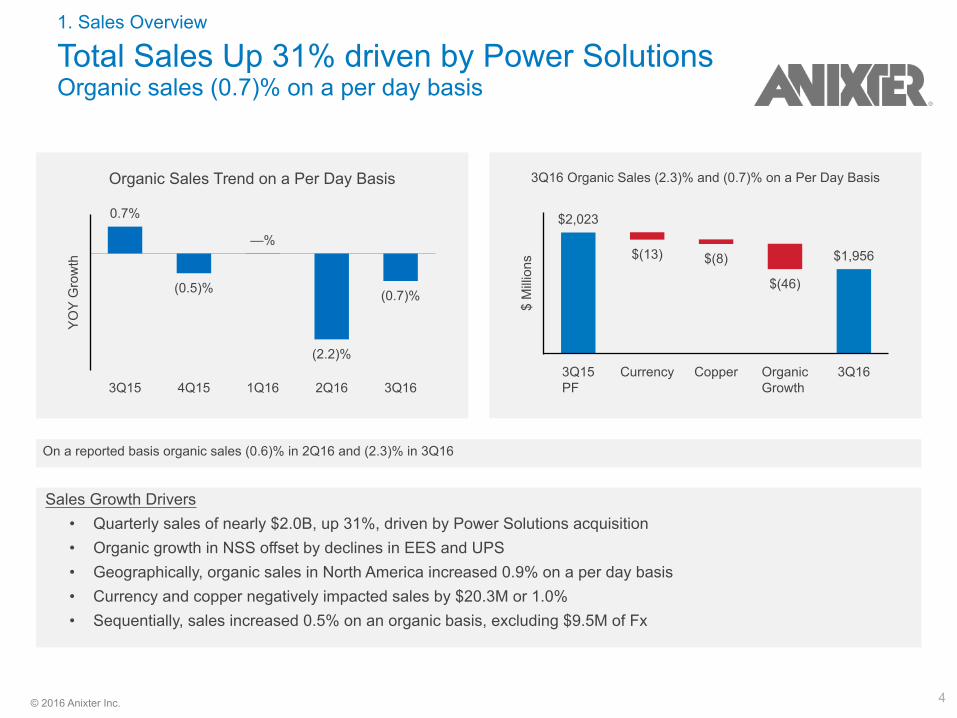
3Q16 Organic Sales (2.3)% and (0.7)% on a Per Day Basis
$M
illio
ns
3Q15PF
Currency Copper OrganicGrowth
3Q16
$2,023
$(13) $(8)
$(46)
$1,956
Sales Growth Drivers• Quarterly sales of nearly $2.0B, up 31%, driven by Power Solutions acquisition• Organic growth in NSS offset by declines in EES and UPS• Geographically, organic sales in North America increased 0.9% on a per day basis• Currency and copper negatively impacted sales by $20.3M or 1.0%• Sequentially, sales increased 0.5% on an organic basis, excluding $9.5M of Fx
1. Sales Overview
Total Sales Up 31% driven by Power SolutionsOrganic sales (0.7)% on a per day basis
On a reported basis organic sales (0.6)% in 2Q16 and (2.3)% in 3Q16
Organic Sales Trend on a Per Day Basis
YO
YG
row
th
3Q15 4Q15 1Q16 2Q16 3Q16
0.7%
(0.5)%
—%
(2.2)%
(0.7)%
5© 2016 Anixter Inc.
1. Sales Overview
Segment Sales Mix
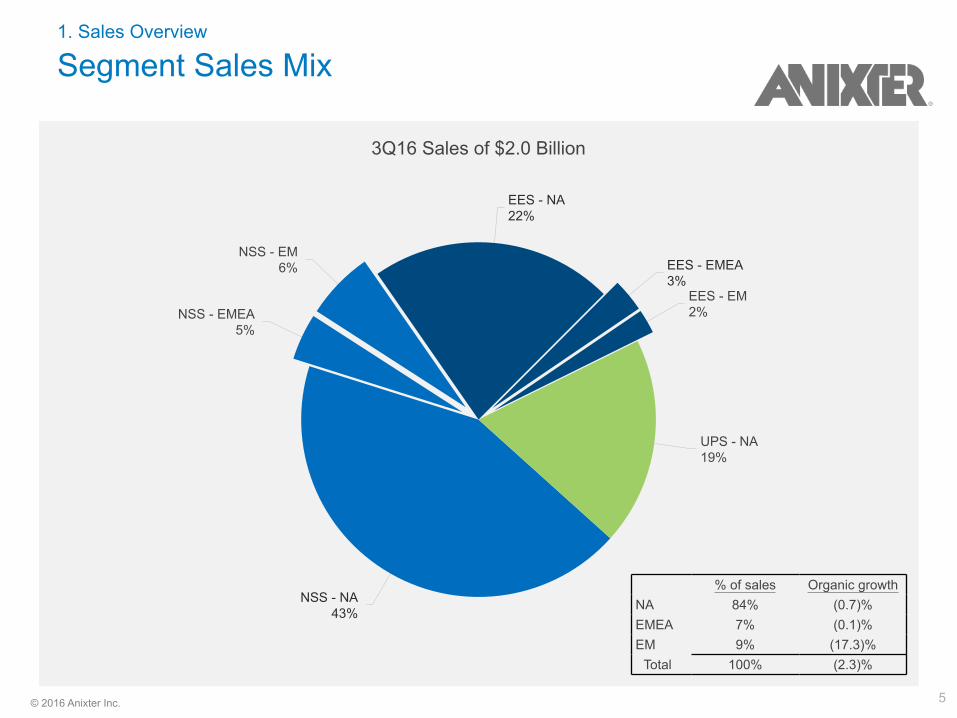
3Q16 Sales of $2.0 Billion
NSS - NA43%
NSS - EMEA5%
NSS - EM6%
EES - NA22%
EES - EMEA3%
EES - EM2%
UPS - NA19%
% of sales Organic growthNA 84% (0.7)%EMEA 7% (0.1)%EM 9% (17.3)%
Total 100% (2.3)%
6© 2016 Anixter Inc.
2. NSS Overview
Network & Security Solutions Sales Overview
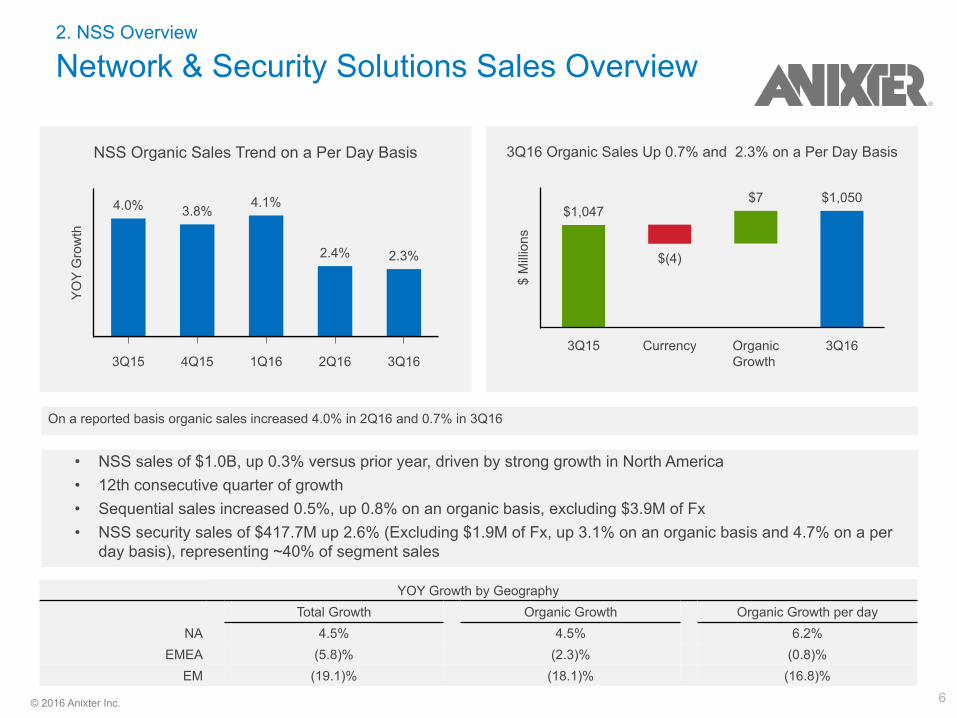
• NSS sales of $1.0B, up 0.3% versus prior year, driven by strong growth in North America• 12th consecutive quarter of growth• Sequential sales increased 0.5%, up 0.8% on an organic basis, excluding $3.9M of Fx• NSS security sales of $417.7M up 2.6% (Excluding $1.9M of Fx, up 3.1% on an organic basis and 4.7% on a per
day basis), representing ~40% of segment sales
NSS Organic Sales Trend on a Per Day Basis
YO
YG
row
th
3Q15 4Q15 1Q16 2Q16 3Q16
4.0% 3.8%4.1%
2.4% 2.3%
3Q16 Organic Sales Up 0.7% and 2.3% on a Per Day Basis
$M
illio
ns
3Q15 Currency OrganicGrowth
3Q16
$1,047
$(4)
$7 $1,050
On a reported basis organic sales increased 4.0% in 2Q16 and 0.7% in 3Q16
YOY Growth by GeographyTotal Growth Organic Growth Organic Growth per day
NA 4.5% 4.5% 6.2%EMEA (5.8)% (2.3)% (0.8)%
EM (19.1)% (18.1)% (16.8)%
7© 2016 Anixter Inc.
2. NSS Overview
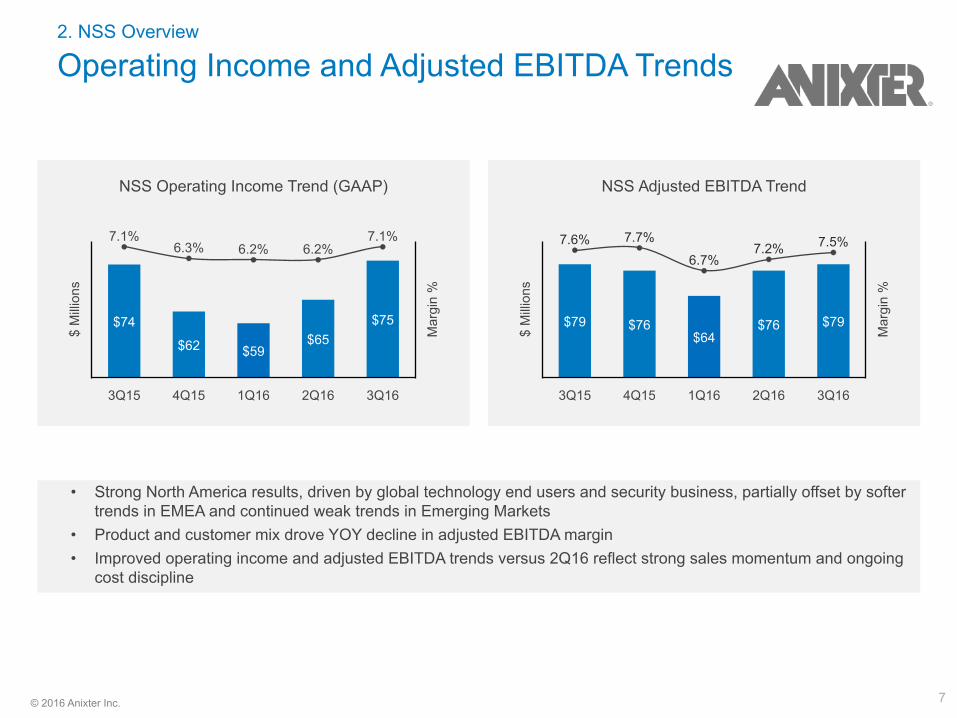
Operating Income and Adjusted EBITDA Trends
NSS Operating Income Trend (GAAP)
$M
illio
ns
Mar
gin
%
3Q15 4Q15 1Q16 2Q16 3Q16
$74
$62 $59$65
$75
7.1%6.3% 6.2% 6.2%
7.1%
• Strong North America results, driven by global technology end users and security business, partially offset by softertrends in EMEA and continued weak trends in Emerging Markets
• Product and customer mix drove YOY decline in adjusted EBITDA margin• Improved operating income and adjusted EBITDA trends versus 2Q16 reflect strong sales momentum and ongoing
cost discipline
NSS Adjusted EBITDA Trend
$M
illio
ns
Mar
gin
%
3Q15 4Q15 1Q16 2Q16 3Q16
$79 $76$64
$76 $79
7.6% 7.7%
6.7%7.2% 7.5%
8© 2016 Anixter Inc.
3. EES Overview
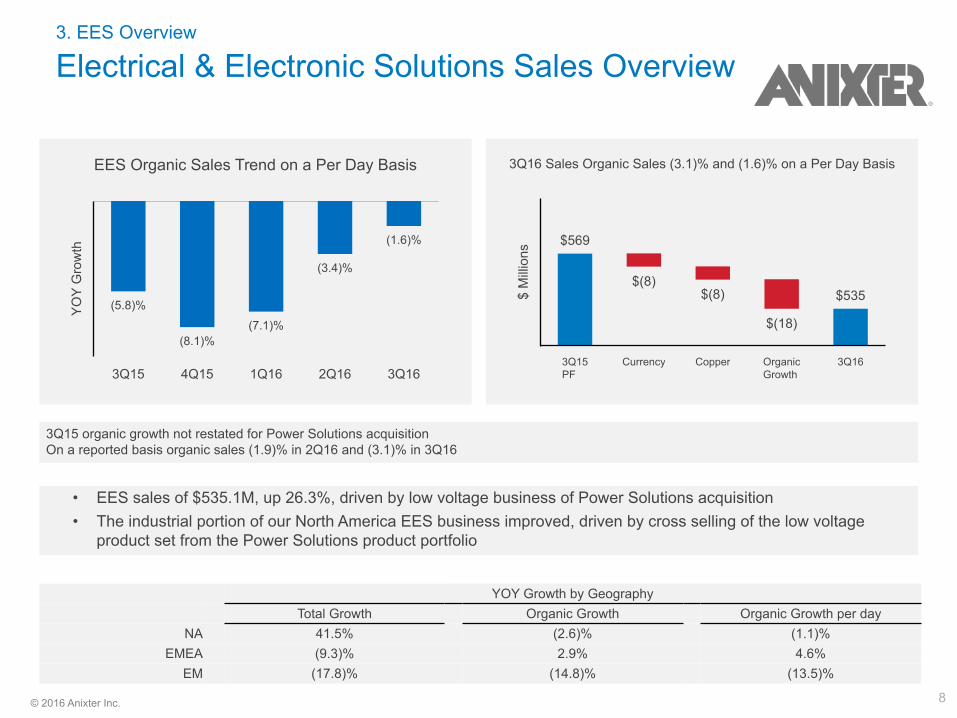
Electrical & Electronic Solutions Sales Overview
EES Organic Sales Trend on a Per Day Basis
YO
YG
row
th
3Q15 4Q15 1Q16 2Q16 3Q16
(5.8)%
(8.1)%(7.1)%
(3.4)%
(1.6)%
3Q16 Sales Organic Sales (3.1)% and (1.6)% on a Per Day Basis
$M
illio
ns
3Q15PF
Currency Copper OrganicGrowth
3Q16
$569
$(8)$(8)
$(18)
$535
• EES sales of $535.1M, up 26.3%, driven by low voltage business of Power Solutions acquisition• The industrial portion of our North America EES business improved, driven by cross selling of the low voltage
product set from the Power Solutions product portfolio
3Q15 organic growth not restated for Power Solutions acquisitionOn a reported basis organic sales (1.9)% in 2Q16 and (3.1)% in 3Q16
YOY Growth by GeographyTotal Growth Organic Growth Organic Growth per day
NA 41.5% (2.6)% (1.1)%EMEA (9.3)% 2.9% 4.6%
EM (17.8)% (14.8)% (13.5)%
9© 2016 Anixter Inc.
3. EES Overview
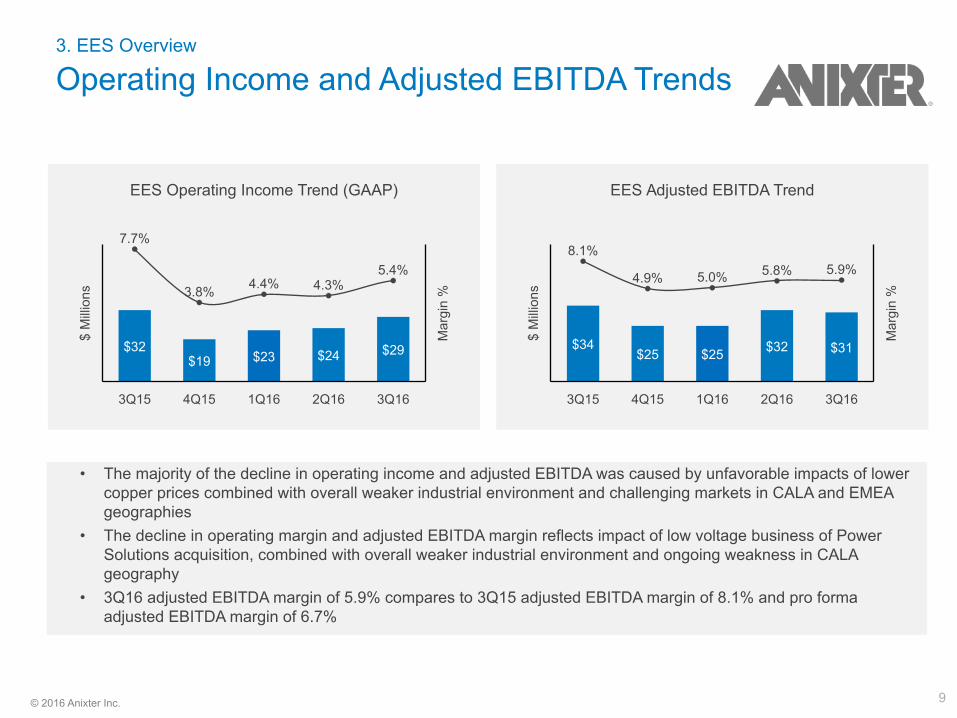
Operating Income and Adjusted EBITDA Trends
EES Adjusted EBITDA Trend
$M
illio
ns
Mar
gin
%
3Q15 4Q15 1Q16 2Q16 3Q16
$34$25 $25 $32 $31
8.1%
4.9% 5.0% 5.8% 5.9%
• The majority of the decline in operating income and adjusted EBITDA was caused by unfavorable impacts of lowercopper prices combined with overall weaker industrial environment and challenging markets in CALA and EMEAgeographies
• The decline in operating margin and adjusted EBITDA margin reflects impact of low voltage business of PowerSolutions acquisition, combined with overall weaker industrial environment and ongoing weakness in CALAgeography
• 3Q16 adjusted EBITDA margin of 5.9% compares to 3Q15 adjusted EBITDA margin of 8.1% and pro formaadjusted EBITDA margin of 6.7%
EES Operating Income Trend (GAAP)
$M
illio
ns
Mar
gin
%
3Q15 4Q15 1Q16 2Q16 3Q16
$32$19 $23 $24 $29
7.7%
3.8% 4.4% 4.3%5.4%
10© 2016 Anixter Inc.
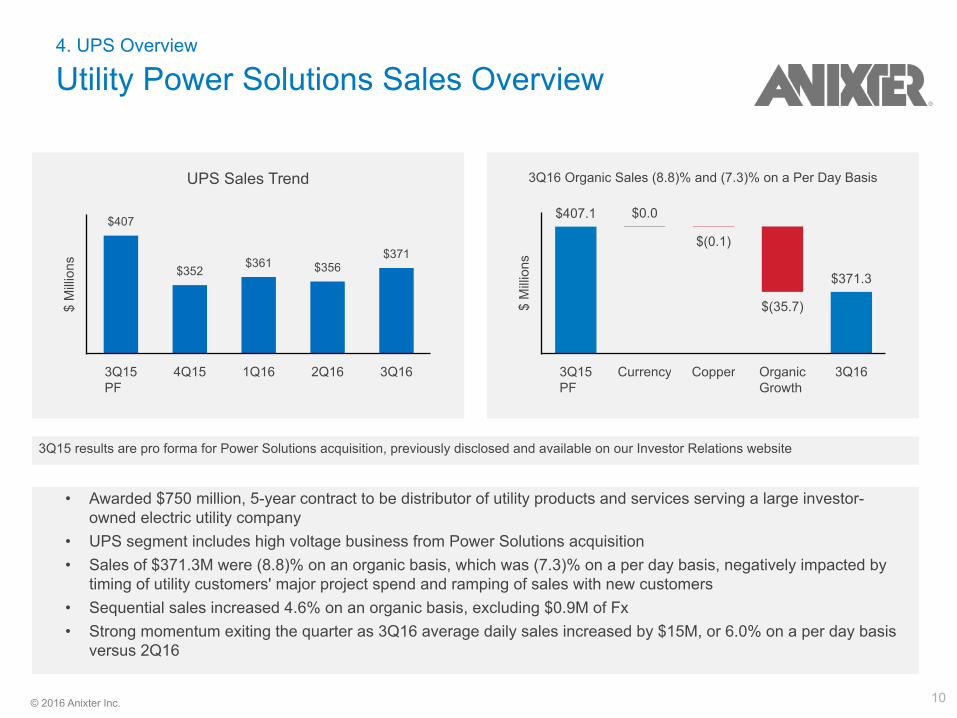
• Awarded $750 million, 5-year contract to be distributor of utility products and services serving a large investor-owned electric utility company
• UPS segment includes high voltage business from Power Solutions acquisition• Sales of $371.3M were (8.8)% on an organic basis, which was (7.3)% on a per day basis, negatively impacted by
timing of utility customers' major project spend and ramping of sales with new customers• Sequential sales increased 4.6% on an organic basis, excluding $0.9M of Fx• Strong momentum exiting the quarter as 3Q16 average daily sales increased by $15M, or 6.0% on a per day basis
versus 2Q16
4. UPS Overview
Utility Power Solutions Sales Overview
3Q16 Organic Sales (8.8)% and (7.3)% on a Per Day Basis
$M
illio
ns
3Q15PF
Currency Copper OrganicGrowth
3Q16
$407.1 $0.0
$(0.1)
$(35.7)
$371.3
UPS Sales Trend
$M
illio
ns
3Q15PF
4Q15 1Q16 2Q16 3Q16
$407
$352$361 $356
$371
3Q15 results are pro forma for Power Solutions acquisition, previously disclosed and available on our Investor Relations website
11© 2016 Anixter Inc.
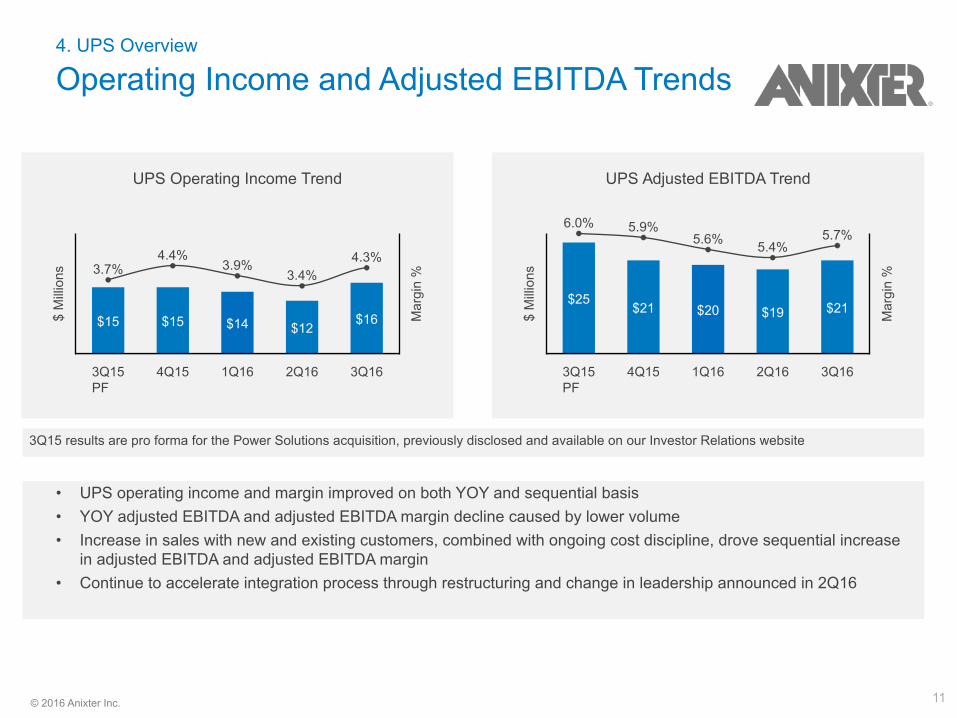
• UPS operating income and margin improved on both YOY and sequential basis• YOY adjusted EBITDA and adjusted EBITDA margin decline caused by lower volume• Increase in sales with new and existing customers, combined with ongoing cost discipline, drove sequential increase
in adjusted EBITDA and adjusted EBITDA margin• Continue to accelerate integration process through restructuring and change in leadership announced in 2Q16
4. UPS Overview
Operating Income and Adjusted EBITDA Trends
UPS Adjusted EBITDA Trend
$M
illio
ns
Mar
gin
%
3Q15PF
4Q15 1Q16 2Q16 3Q16
$25$21 $20 $19 $21
6.0% 5.9%5.6% 5.4%
5.7%
UPS Operating Income Trend
$M
illio
ns
Mar
gin
%
3Q15PF
4Q15 1Q16 2Q16 3Q16
$15 $15 $14 $12$16
3.7%4.4%
3.9%3.4%
4.3%
3Q15 results are pro forma for the Power Solutions acquisition, previously disclosed and available on our Investor Relations website
12© 2016 Anixter Inc.
5. Financial Performance Trends
Gross Margin
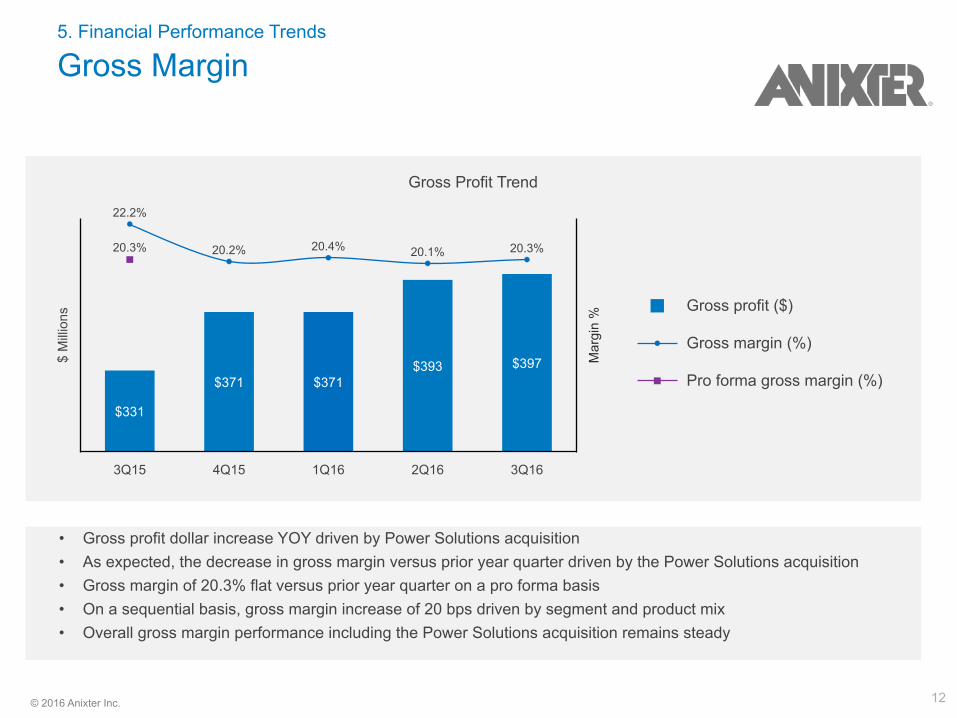
• Gross profit dollar increase YOY driven by Power Solutions acquisition• As expected, the decrease in gross margin versus prior year quarter driven by the Power Solutions acquisition• Gross margin of 20.3% flat versus prior year quarter on a pro forma basis• On a sequential basis, gross margin increase of 20 bps driven by segment and product mix• Overall gross margin performance including the Power Solutions acquisition remains steady
Gross profit ($)
Gross margin (%)
Pro forma gross margin (%)
Gross Profit Trend
$M
illio
ns
Mar
gin
%
3Q15 4Q15 1Q16 2Q16 3Q16
$331
$371 $371$393 $397
22.2%
20.2% 20.4% 20.1% 20.3%20.3%
13© 2016 Anixter Inc.
5. Financial Performance Trends
Operating Expense Trends
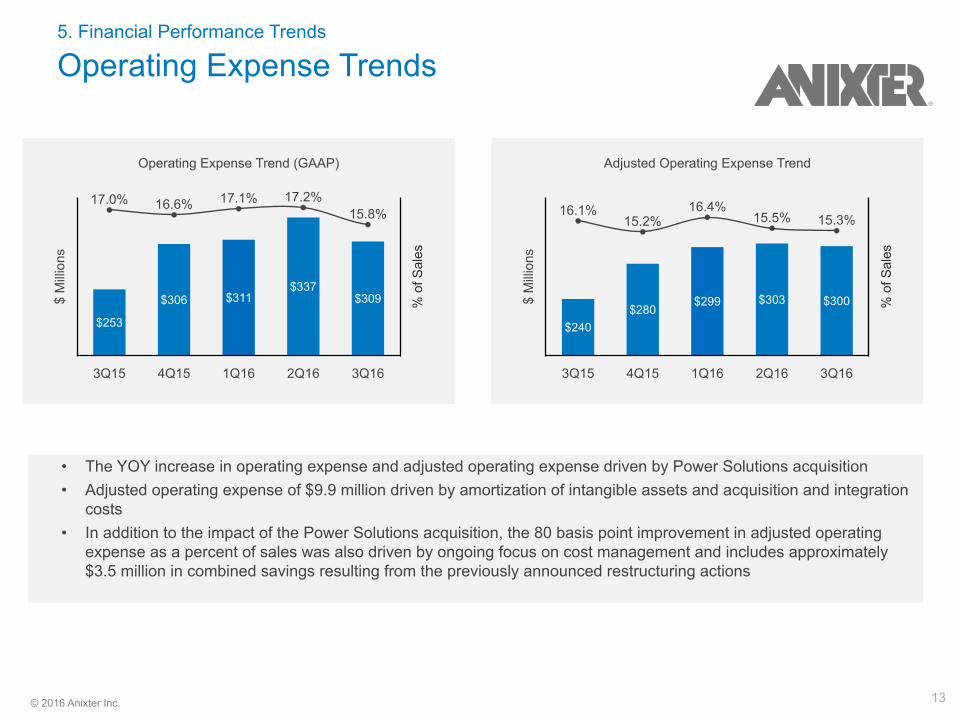
Adjusted Operating Expense Trend
$M
illio
ns
%of
Sal
es
3Q15 4Q15 1Q16 2Q16 3Q16
$240$280
$299 $303 $300
16.1%15.2%
16.4%15.5% 15.3%
Operating Expense Trend (GAAP)
$M
illio
ns
%of
Sal
es
3Q15 4Q15 1Q16 2Q16 3Q16
$253
$306 $311$337
$309
17.0% 16.6% 17.1% 17.2%15.8%
• The YOY increase in operating expense and adjusted operating expense driven by Power Solutions acquisition• Adjusted operating expense of $9.9 million driven by amortization of intangible assets and acquisition and integration
costs• In addition to the impact of the Power Solutions acquisition, the 80 basis point improvement in adjusted operating
expense as a percent of sales was also driven by ongoing focus on cost management and includes approximately$3.5 million in combined savings resulting from the previously announced restructuring actions
14© 2016 Anixter Inc.
5. Financial Performance Trends
Net Income and Adjusted EBITDA Trends
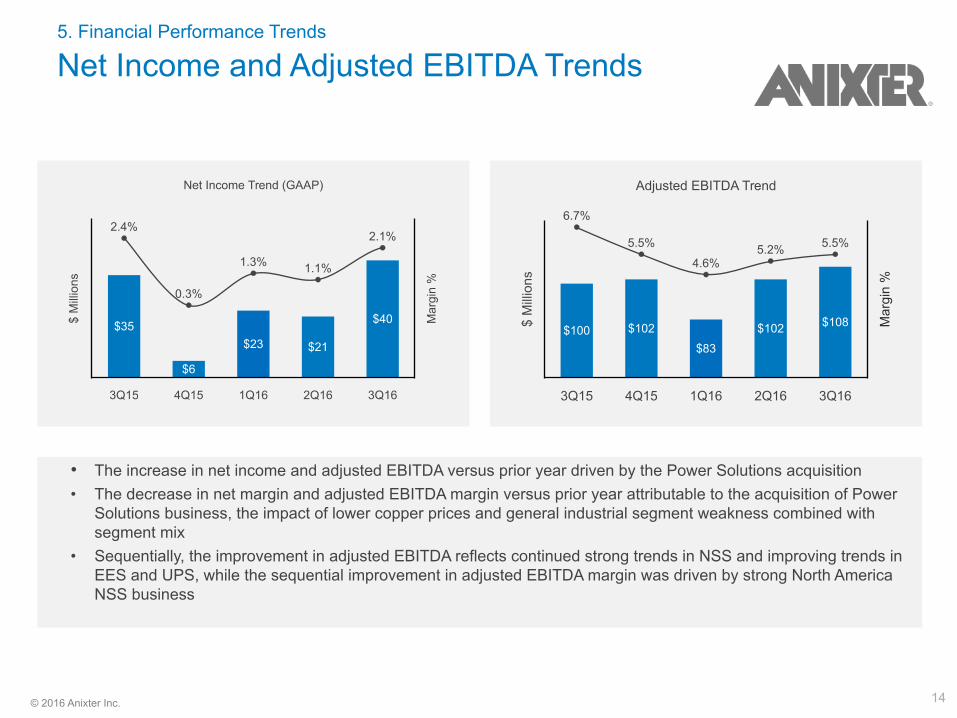
• The increase in net income and adjusted EBITDA versus prior year driven by the Power Solutions acquisition• The decrease in net margin and adjusted EBITDA margin versus prior year attributable to the acquisition of Power
Solutions business, the impact of lower copper prices and general industrial segment weakness combined withsegment mix
• Sequentially, the improvement in adjusted EBITDA reflects continued strong trends in NSS and improving trends inEES and UPS, while the sequential improvement in adjusted EBITDA margin was driven by strong North AmericaNSS business
Adjusted EBITDA Trend
$M
illio
ns
Mar
gin
%
3Q15 4Q15 1Q16 2Q16 3Q16
$100 $102
$83
$102 $108
6.7%
5.5%
4.6%5.2% 5.5%
Net Income Trend (GAAP)
$M
illio
ns
Mar
gin
%
3Q15 4Q15 1Q16 2Q16 3Q16
$35
$6
$23 $21
$40
2.4%
0.3%
1.3% 1.1%
2.1%
15© 2016 Anixter Inc.
5. Financial Performance Trends
Working Capital Trends
Adjusted ROTC
Adj
RO
TC
3Q15 4Q15 1Q16 2Q16 3Q16
33.0%
25.1%19.8%
25.3%27.9%
Working Capital as % of Sales
%of
Sal
es
3Q15 4Q15 1Q16 2Q16 3Q16
29.2%
21.4%21.0%
19.2% 18.6%
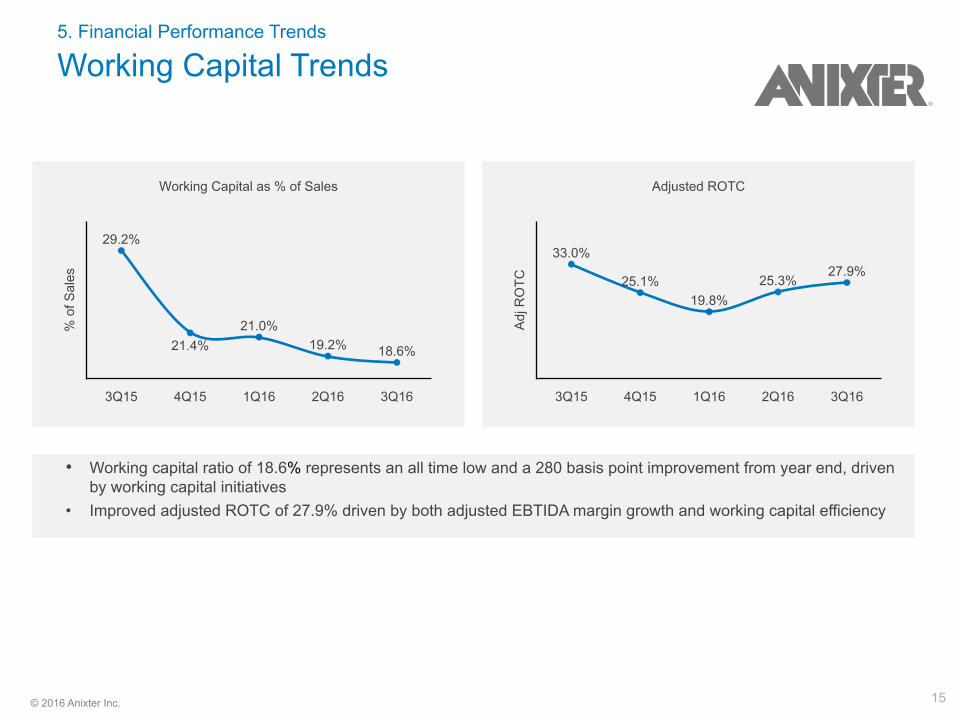
• Working capital ratio of 18.6% represents an all time low and a 280 basis point improvement from year end, drivenby working capital initiatives
• Improved adjusted ROTC of 27.9% driven by both adjusted EBTIDA margin growth and working capital efficiency
16© 2016 Anixter Inc.
5. Financial Performance Trends
Counter-Cyclical Free Cash Flow ProvidesFinancial Flexibility
Free Cash Flow Sales Growth
$M
illio
ns
45%
30%
15%
0%
-15%
-30%
YO
YS
ales
Gro
wth
2001 2002 2003 2004 2005 2006 2007 2008 2009 2010 2011 2012 2013 2014 2015 YTD 16
$267
$149
$98
$43
-$15
-$65
$102 $93
$419
$176
$119 $109
$302
$64 $63
$214
31.5%
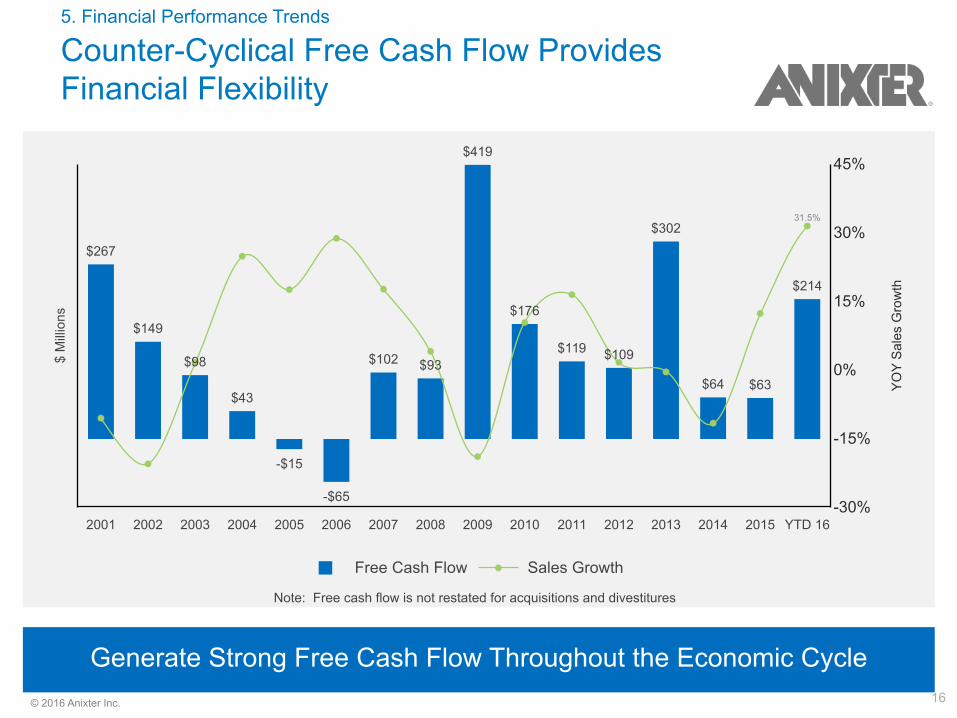
Generate Strong Free Cash Flow Throughout the Economic Cycle
Note: Free cash flow is not restated for acquisitions and divestitures
17© 2016 Anixter Inc.
Debt / Adjusted EBITDA
5x
4x
3x
2x
1x2001 2002 2003 2004 2005 2006 2007 2008 2009 2010 2011 2012 2013 2014 2015* 3Q16
2.3
3.9 4.0
2.6 2.92.2 2.0 2.3
3.42.8
2.02.4 2.1
2.9
3.8 3.6
6. Leverage Metrics
Near Term Cash Flow Allocation Priority isto Return to Target Debt Levels
Debt-to-Capital
60%
50%
40%
30%2001 2002 2003 2004 2005 2006 2007 2008 2009 2010 2011 2012 2013 2014 2015 3Q16
41% 41% 41%
35%
47% 46% 46%51%
45% 47% 45%50%
45%
52%
58%53%
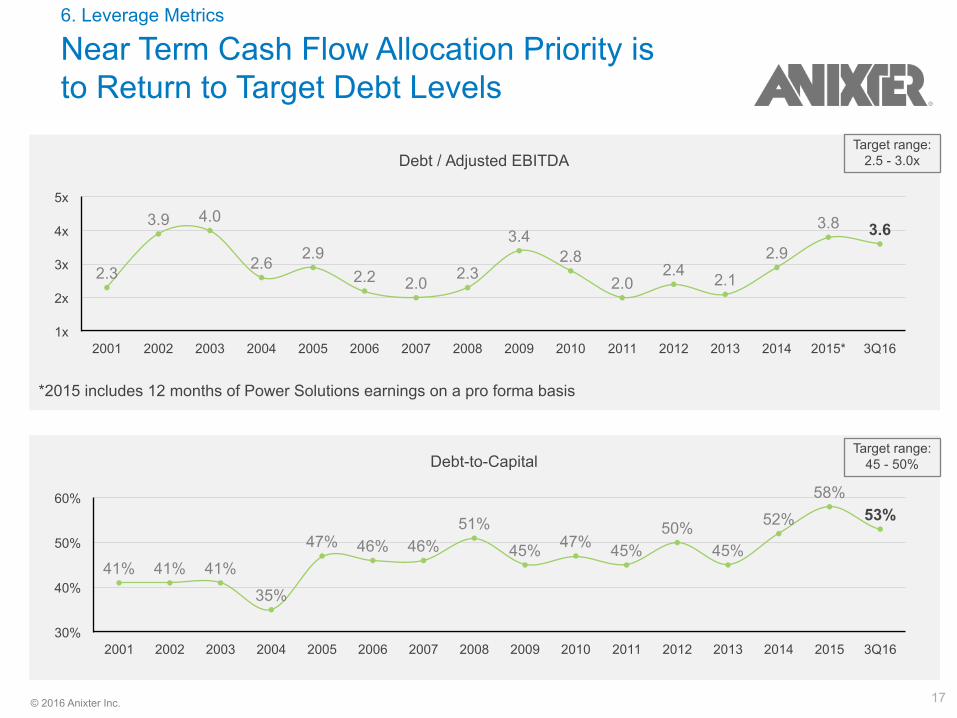
*2015 includes 12 months of Power Solutions earnings on a pro forma basis
Target range:2.5 - 3.0x
Target range:45 - 50%
18© 2016 Anixter Inc.
7. Financial Details
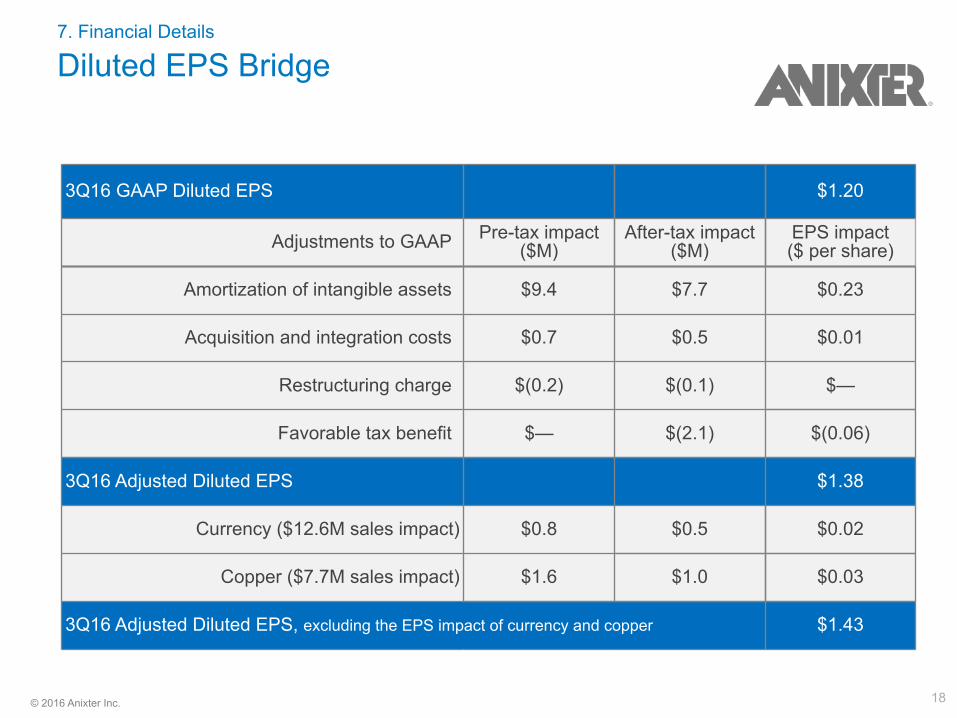
Diluted EPS Bridge
3Q16 GAAP Diluted EPS $1.20
Adjustments to GAAP Pre-tax impact($M)
After-tax impact($M)
EPS impact($ per share)
Amortization of intangible assets $9.4 $7.7 $0.23
Acquisition and integration costs $0.7 $0.5 $0.01
Restructuring charge $(0.2) $(0.1) $—
Favorable tax benefit $— $(2.1) $(0.06)
3Q16 Adjusted Diluted EPS $1.38
Currency ($12.6M sales impact) $0.8 $0.5 $0.02
Copper ($7.7M sales impact) $1.6 $1.0 $0.03
3Q16 Adjusted Diluted EPS, excluding the EPS impact of currency and copper $1.43
19© 2016 Anixter Inc.
7. Financial Details
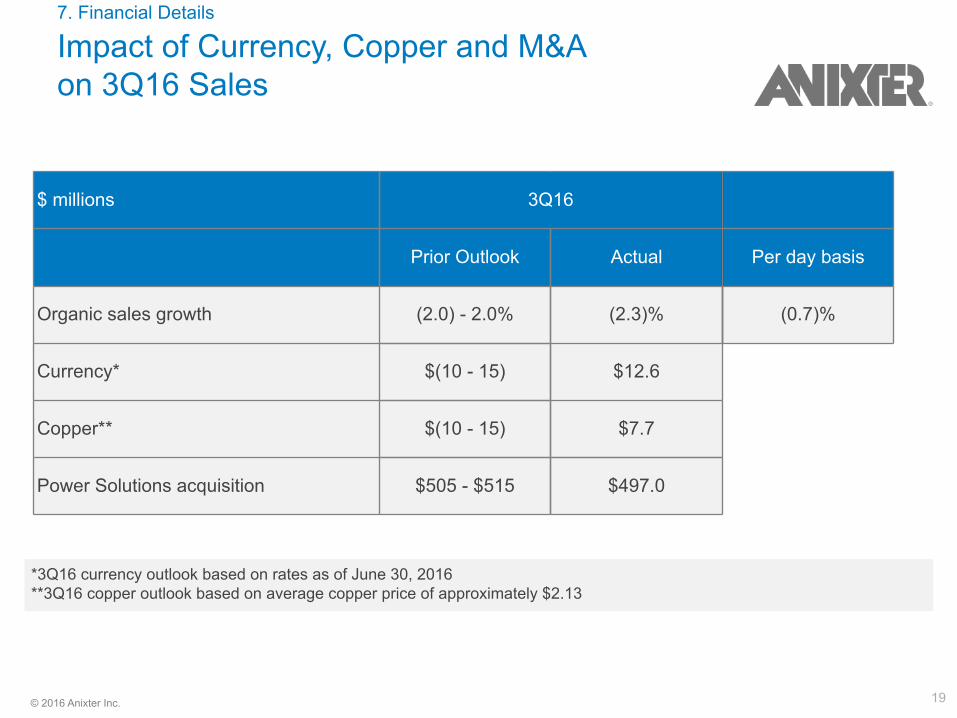
Impact of Currency, Copper and M&A on 3Q16 Sales
$ millions 3Q16
Prior Outlook Actual Per day basis
Organic sales growth (2.0) - 2.0% (2.3)% (0.7)%
Currency* $(10 - 15) $12.6
Copper** $(10 - 15) $7.7
Power Solutions acquisition $505 - $515 $497.0
*3Q16 currency outlook based on rates as of June 30, 2016**3Q16 copper outlook based on average copper price of approximately $2.13
20© 2016 Anixter Inc.
7. Financial Details
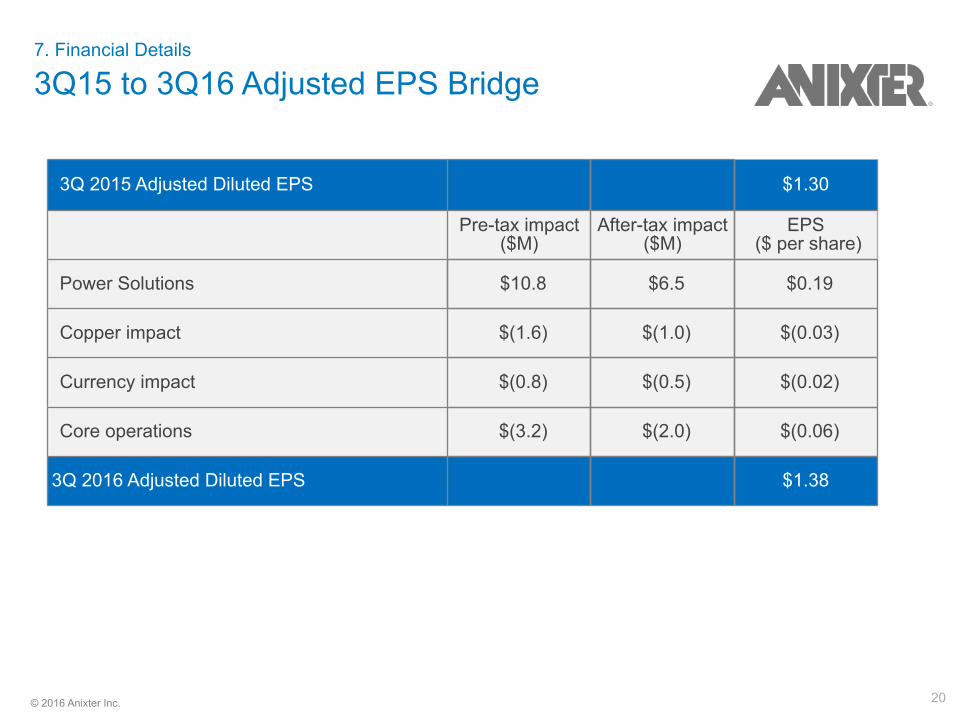
3Q15 to 3Q16 Adjusted EPS Bridge
3Q 2015 Adjusted Diluted EPS $1.30
Pre-tax impact($M)
After-tax impact($M)
EPS ($ per share)
Power Solutions $10.8 $6.5 $0.19
Copper impact $(1.6) $(1.0) $(0.03)
Currency impact $(0.8) $(0.5) $(0.02)
Core operations $(3.2) $(2.0) $(0.06)
3Q 2016 Adjusted Diluted EPS $1.38
21© 2016 Anixter Inc.
7. Financial Details
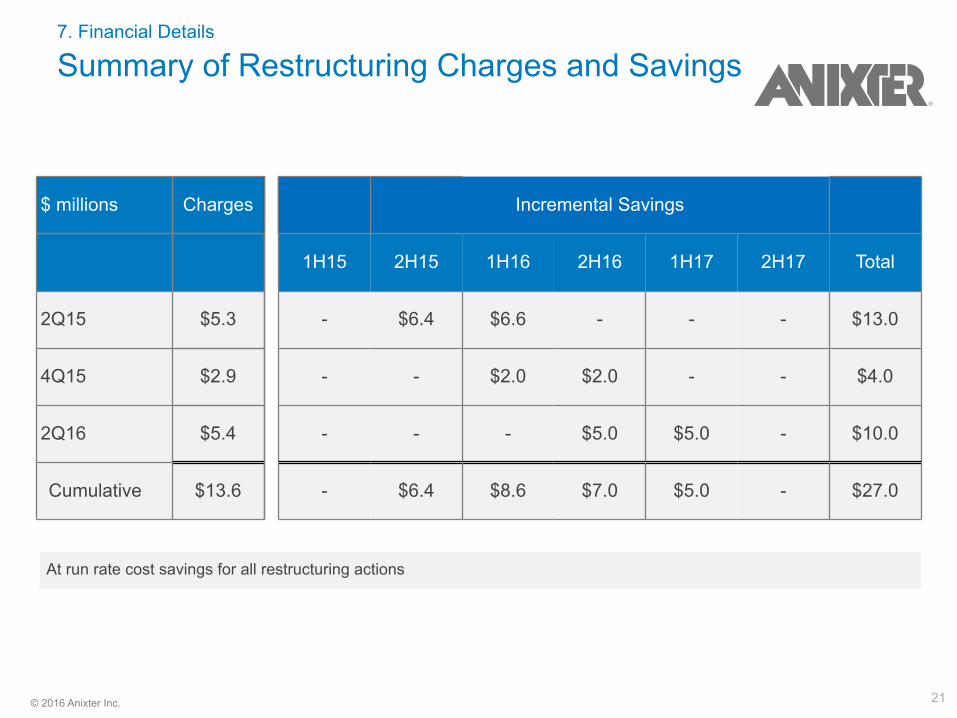
Summary of Restructuring Charges and Savings
$ millions Charges Incremental Savings
1H15 2H15 1H16 2H16 1H17 2H17 Total
2Q15 $5.3 - $6.4 $6.6 - - - $13.0
4Q15 $2.9 - - $2.0 $2.0 - - $4.0
2Q16 $5.4 - - - $5.0 $5.0 - $10.0
Cumulative $13.6 - $6.4 $8.6 $7.0 $5.0 - $27.0
At run rate cost savings for all restructuring actions
22© 2016 Anixter Inc.
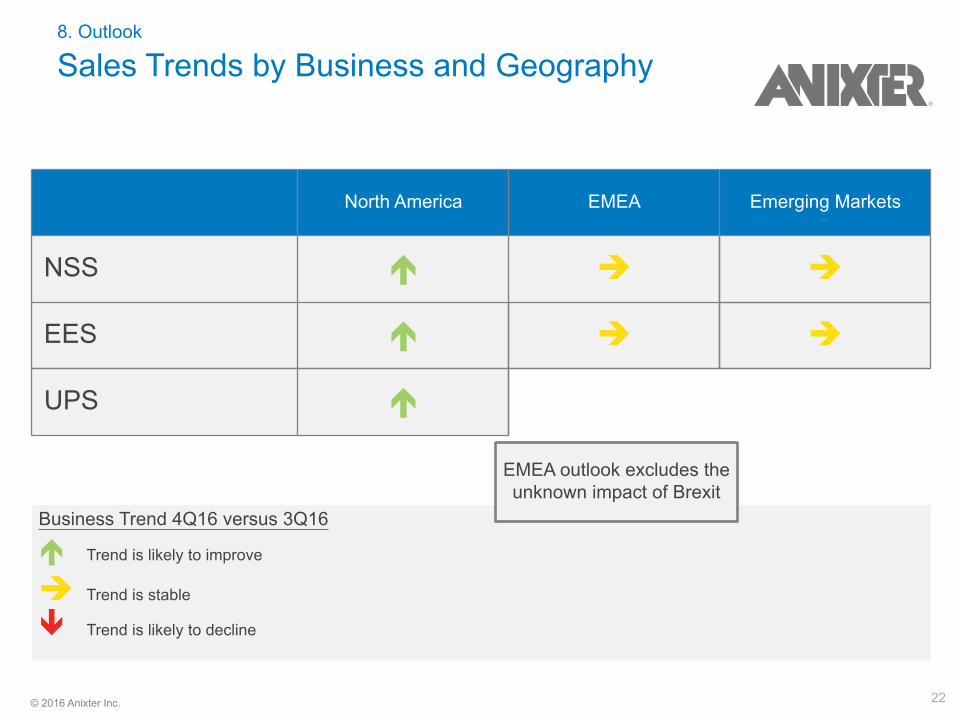
8. Outlook
Sales Trends by Business and Geography
North America EMEA Emerging Markets
NSS é è è
EES é è è
UPS é
Business Trend 4Q16 versus 3Q16
é Trend is likely to improve
è Trend is stable
ê Trend is likely to decline
EMEA outlook excludes theunknown impact of Brexit
23© 2016 Anixter Inc.
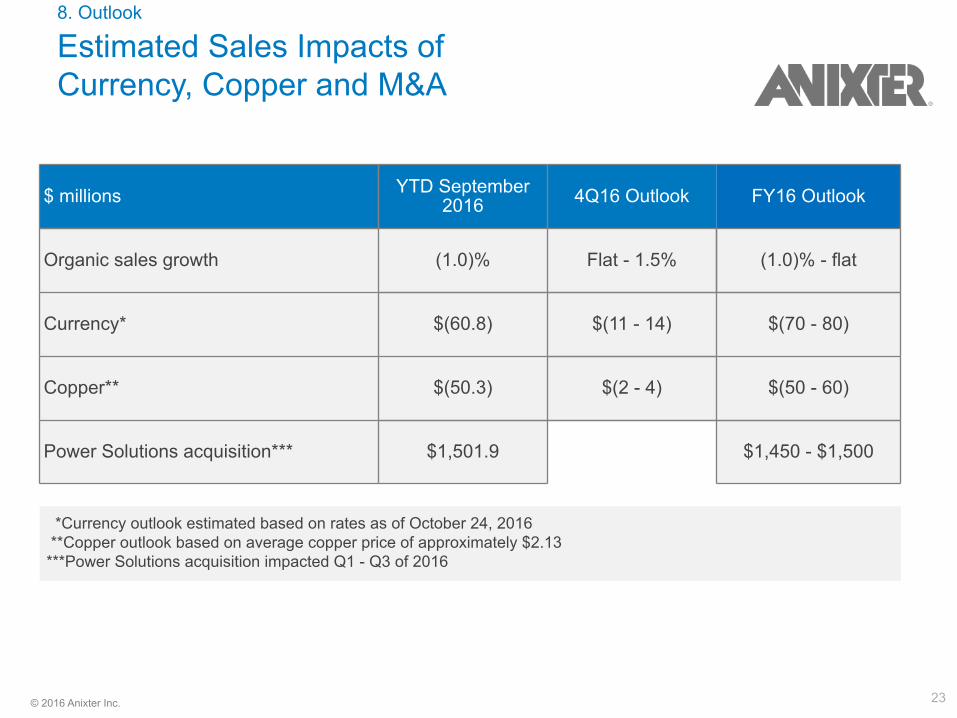
8. Outlook
Estimated Sales Impacts of Currency, Copper and M&A
$ millions YTD September2016 4Q16 Outlook FY16 Outlook
Organic sales growth (1.0)% Flat - 1.5% (1.0)% - flat
Currency* $(60.8) $(11 - 14) $(70 - 80)
Copper** $(50.3) $(2 - 4) $(50 - 60)
Power Solutions acquisition*** $1,501.9 $1,450 - $1,500
*Currency outlook estimated based on rates as of October 24, 2016 **Copper outlook based on average copper price of approximately $2.13***Power Solutions acquisition impacted Q1 - Q3 of 2016

24© 2016 Anixter Inc.
Appendix
25© 2016 Anixter Inc.
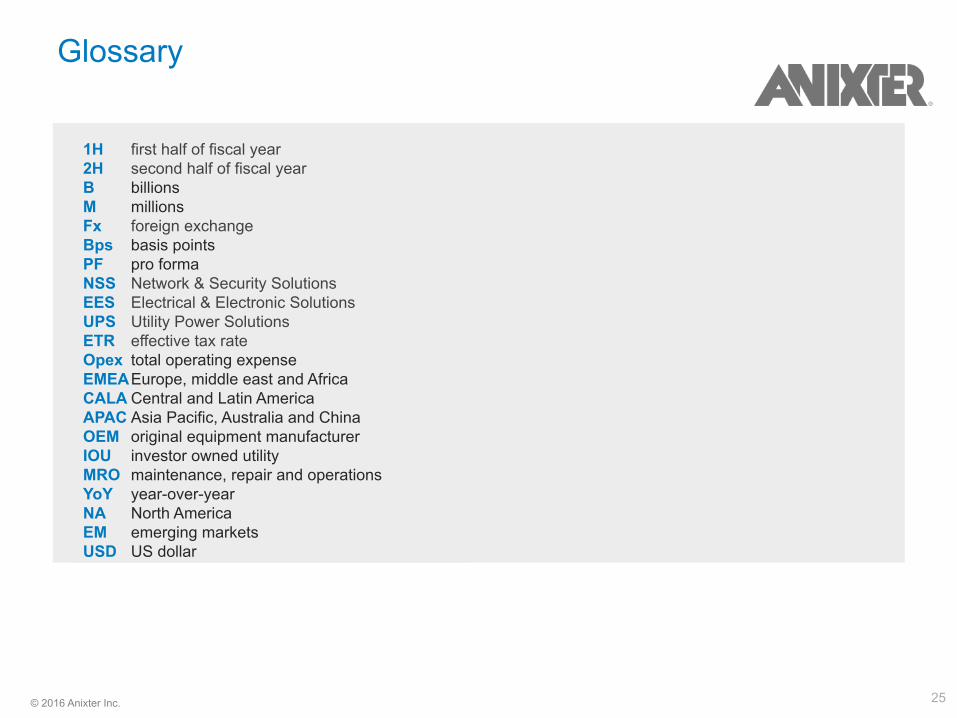
Glossary
1H first half of fiscal year 2H second half of fiscal yearB billionsM millionsFx foreign exchangeBps basis pointsPF pro formaNSS Network & Security SolutionsEES Electrical & Electronic SolutionsUPS Utility Power SolutionsETR effective tax rateOpex total operating expenseEMEAEurope, middle east and AfricaCALA Central and Latin AmericaAPAC Asia Pacific, Australia and ChinaOEM original equipment manufacturerIOU investor owned utilityMRO maintenance, repair and operationsYoY year-over-yearNA North AmericaEM emerging marketsUSD US dollar
26© 2016 Anixter Inc.
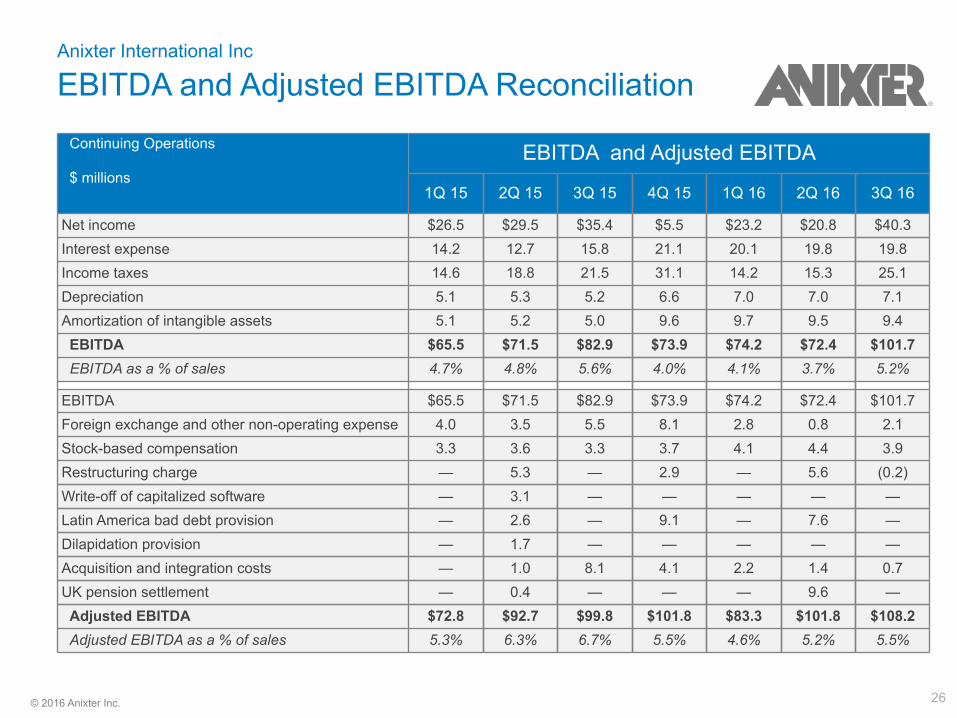
Anixter International Inc
EBITDA and Adjusted EBITDA ReconciliationContinuing Operations
$ millionsEBITDA and Adjusted EBITDA
1Q 15 2Q 15 3Q 15 4Q 15 1Q 16 2Q 16 3Q 16
Net income $26.5 $29.5 $35.4 $5.5 $23.2 $20.8 $40.3Interest expense 14.2 12.7 15.8 21.1 20.1 19.8 19.8Income taxes 14.6 18.8 21.5 31.1 14.2 15.3 25.1Depreciation 5.1 5.3 5.2 6.6 7.0 7.0 7.1Amortization of intangible assets 5.1 5.2 5.0 9.6 9.7 9.5 9.4EBITDA $65.5 $71.5 $82.9 $73.9 $74.2 $72.4 $101.7
EBITDA as a % of sales 4.7% 4.8% 5.6% 4.0% 4.1% 3.7% 5.2%
EBITDA $65.5 $71.5 $82.9 $73.9 $74.2 $72.4 $101.7Foreign exchange and other non-operating expense 4.0 3.5 5.5 8.1 2.8 0.8 2.1Stock-based compensation 3.3 3.6 3.3 3.7 4.1 4.4 3.9Restructuring charge — 5.3 — 2.9 — 5.6 (0.2)Write-off of capitalized software — 3.1 — — — — —Latin America bad debt provision — 2.6 — 9.1 — 7.6 —Dilapidation provision — 1.7 — — — — —Acquisition and integration costs — 1.0 8.1 4.1 2.2 1.4 0.7UK pension settlement — 0.4 — — — 9.6 —Adjusted EBITDA $72.8 $92.7 $99.8 $101.8 $83.3 $101.8 $108.2Adjusted EBITDA as a % of sales 5.3% 6.3% 6.7% 5.5% 4.6% 5.2% 5.5%

27© 2016 Anixter Inc.
Network & Security Solutions
EBITDA and Adjusted EBITDA Reconciliation
Continuing Operations
$ millionsEBITDA and Adjusted EBITDA
1Q 15 2Q 15 3Q 15 4Q 15 1Q 16 2Q 16 3Q 16
Net income $55.7 $66.6 $74.1 $61.8 $58.8 $64.9 $74.9Interest expense — — — — — — —Income taxes — — — — — — —Depreciation 0.9 0.9 0.9 0.9 0.9 0.8 0.8Amortization of intangible assets 3.7 3.7 3.7 3.6 3.6 3.6 3.3EBITDA $60.3 $71.2 $78.7 $66.3 $63.3 $69.3 $79.0
EBITDA as a % of sales 6.5% 7.0% 7.5% 6.8% 6.7% 6.6% 7.5%
EBITDA $60.3 $71.2 $78.7 $66.3 $63.3 $69.3 $79.0Stock-based compensation 0.4 0.6 0.4 0.5 0.5 0.6 0.2Restructuring charge — 1.8 — 0.6 — 1.9 (0.1)Latin America bad debt provision — 2.6 — 8.1 — 3.9 —Adjusted EBITDA $60.7 $76.2 $79.1 $75.5 $63.8 $75.7 $79.1Adjusted EBITDA as a % of sales 6.5% 7.5% 7.6% 7.7% 6.7% 7.2% 7.5%
28© 2016 Anixter Inc.
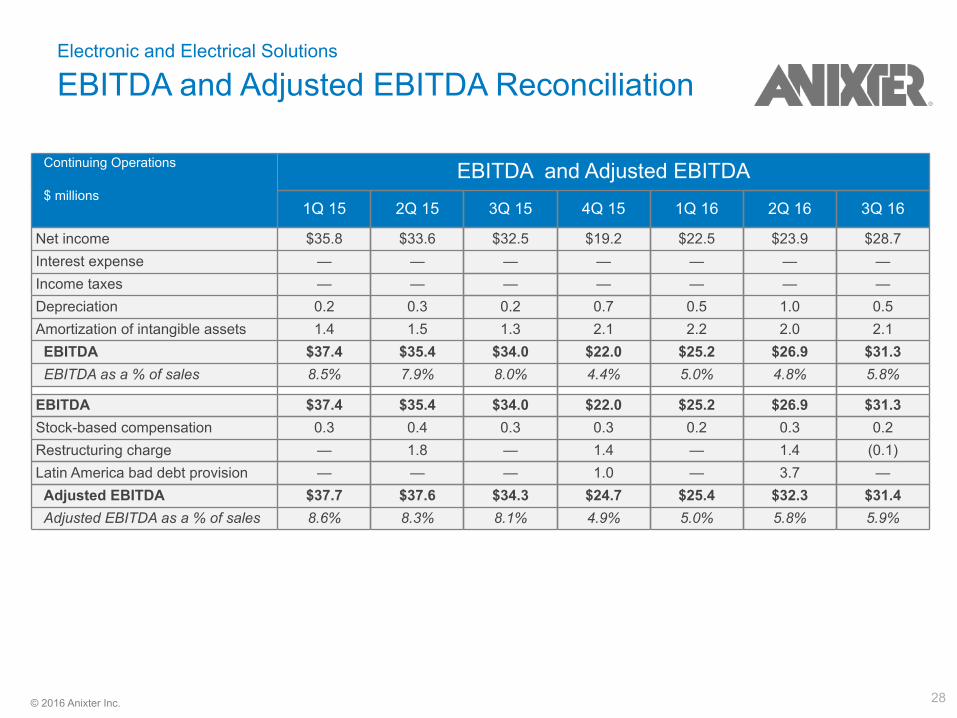
Electronic and Electrical Solutions
EBITDA and Adjusted EBITDA Reconciliation
Continuing Operations
$ millionsEBITDA and Adjusted EBITDA
1Q 15 2Q 15 3Q 15 4Q 15 1Q 16 2Q 16 3Q 16
Net income $35.8 $33.6 $32.5 $19.2 $22.5 $23.9 $28.7Interest expense — — — — — — —Income taxes — — — — — — —Depreciation 0.2 0.3 0.2 0.7 0.5 1.0 0.5Amortization of intangible assets 1.4 1.5 1.3 2.1 2.2 2.0 2.1EBITDA $37.4 $35.4 $34.0 $22.0 $25.2 $26.9 $31.3
EBITDA as a % of sales 8.5% 7.9% 8.0% 4.4% 5.0% 4.8% 5.8%
EBITDA $37.4 $35.4 $34.0 $22.0 $25.2 $26.9 $31.3Stock-based compensation 0.3 0.4 0.3 0.3 0.2 0.3 0.2Restructuring charge — 1.8 — 1.4 — 1.4 (0.1)Latin America bad debt provision — — — 1.0 — 3.7 —Adjusted EBITDA $37.7 $37.6 $34.3 $24.7 $25.4 $32.3 $31.4Adjusted EBITDA as a % of sales 8.6% 8.3% 8.1% 4.9% 5.0% 5.8% 5.9%
29© 2016 Anixter Inc.
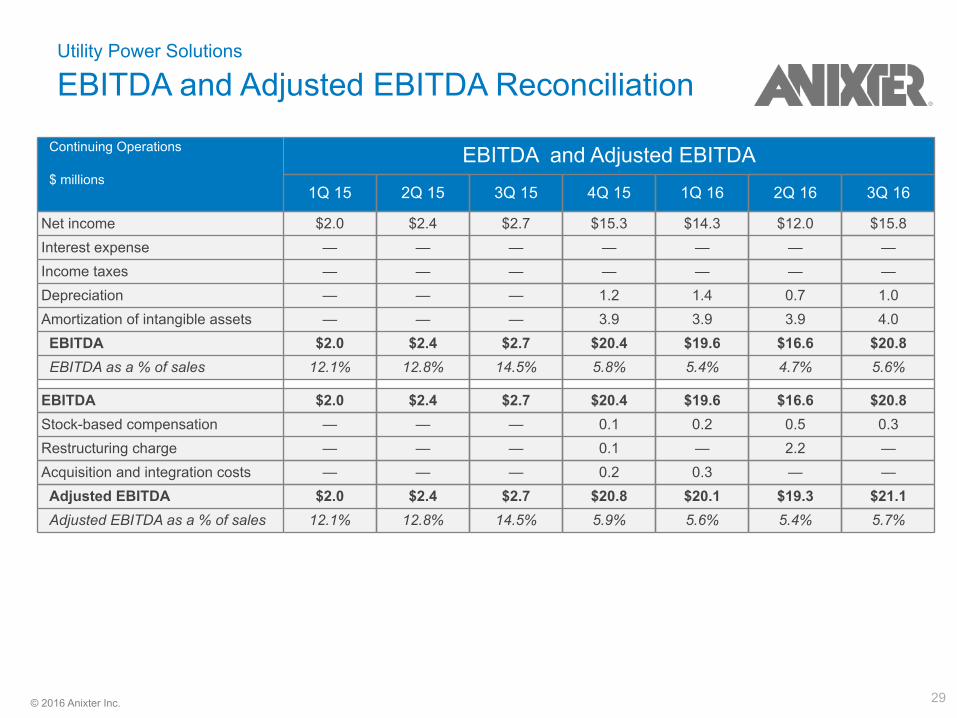
Utility Power Solutions
EBITDA and Adjusted EBITDA Reconciliation
Continuing Operations
$ millionsEBITDA and Adjusted EBITDA
1Q 15 2Q 15 3Q 15 4Q 15 1Q 16 2Q 16 3Q 16
Net income $2.0 $2.4 $2.7 $15.3 $14.3 $12.0 $15.8Interest expense — — — — — — —Income taxes — — — — — — —Depreciation — — — 1.2 1.4 0.7 1.0Amortization of intangible assets — — — 3.9 3.9 3.9 4.0EBITDA $2.0 $2.4 $2.7 $20.4 $19.6 $16.6 $20.8
EBITDA as a % of sales 12.1% 12.8% 14.5% 5.8% 5.4% 4.7% 5.6%
EBITDA $2.0 $2.4 $2.7 $20.4 $19.6 $16.6 $20.8Stock-based compensation — — — 0.1 0.2 0.5 0.3Restructuring charge — — — 0.1 — 2.2 —Acquisition and integration costs — — — 0.2 0.3 — —Adjusted EBITDA $2.0 $2.4 $2.7 $20.8 $20.1 $19.3 $21.1Adjusted EBITDA as a % of sales 12.1% 12.8% 14.5% 5.9% 5.6% 5.4% 5.7%
30© 2016 Anixter Inc.
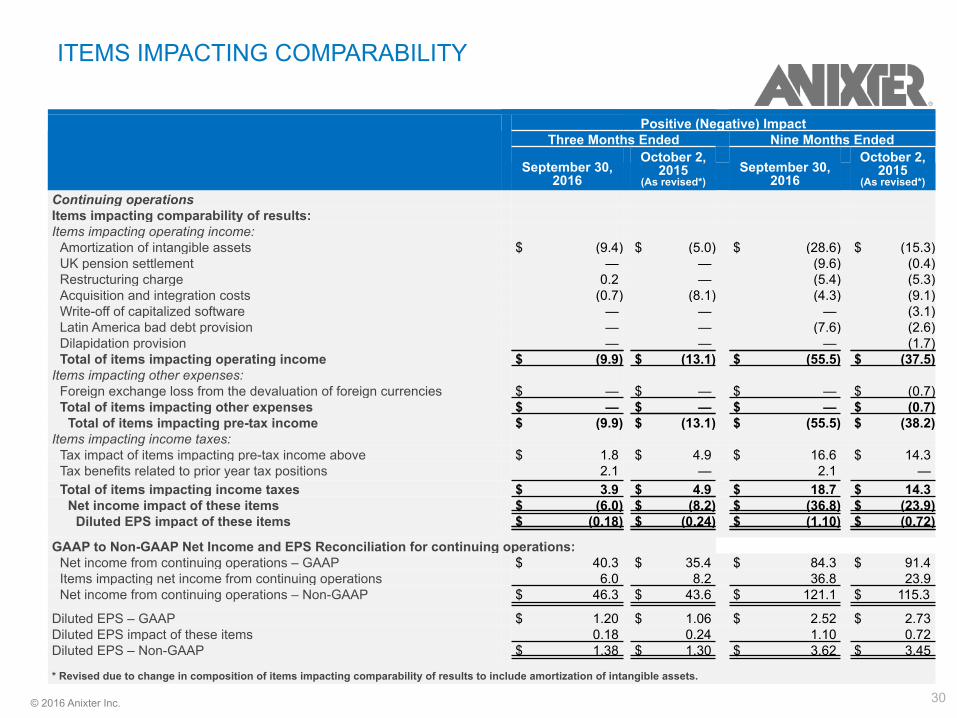
Positive (Negative) ImpactThree Months Ended Nine Months Ended
September 30,2016
October 2, 2015
(As revised*)September 30,
2016
October 2, 2015
(As revised*)
Continuing operationsItems impacting comparability of results:Items impacting operating income:
Amortization of intangible assets $ (9.4) $ (5.0) $ (28.6) $ (15.3)UK pension settlement — — (9.6) (0.4)Restructuring charge 0.2 — (5.4) (5.3)Acquisition and integration costs (0.7) (8.1) (4.3) (9.1)Write-off of capitalized software — — — (3.1)Latin America bad debt provision — — (7.6) (2.6)Dilapidation provision — — — (1.7)Total of items impacting operating income $ (9.9) $ (13.1) $ (55.5) $ (37.5)
Items impacting other expenses:Foreign exchange loss from the devaluation of foreign currencies $ — $ — $ — $ (0.7)Total of items impacting other expenses $ — $ — $ — $ (0.7)
Total of items impacting pre-tax income $ (9.9) $ (13.1) $ (55.5) $ (38.2)Items impacting income taxes:
Tax impact of items impacting pre-tax income above $ 1.8 $ 4.9 $ 16.6 $ 14.3Tax benefits related to prior year tax positions 2.1 — 2.1 —Total of items impacting income taxes $ 3.9 $ 4.9 $ 18.7 $ 14.3
Net income impact of these items $ (6.0) $ (8.2) $ (36.8) $ (23.9)Diluted EPS impact of these items $ (0.18) $ (0.24) $ (1.10) $ (0.72)
GAAP to Non-GAAP Net Income and EPS Reconciliation for continuing operations:Net income from continuing operations – GAAP $ 40.3 $ 35.4 $ 84.3 $ 91.4Items impacting net income from continuing operations 6.0 8.2 36.8 23.9Net income from continuing operations – Non-GAAP $ 46.3 $ 43.6 $ 121.1 $ 115.3
Diluted EPS – GAAP $ 1.20 $ 1.06 $ 2.52 $ 2.73Diluted EPS impact of these items 0.18 0.24 1.10 0.72Diluted EPS – Non-GAAP $ 1.38 $ 1.30 $ 3.62 $ 3.45
* Revised due to change in composition of items impacting comparability of results to include amortization of intangible assets.
ITEMS IMPACTING COMPARABILITY
31© 2016 Anixter Inc.
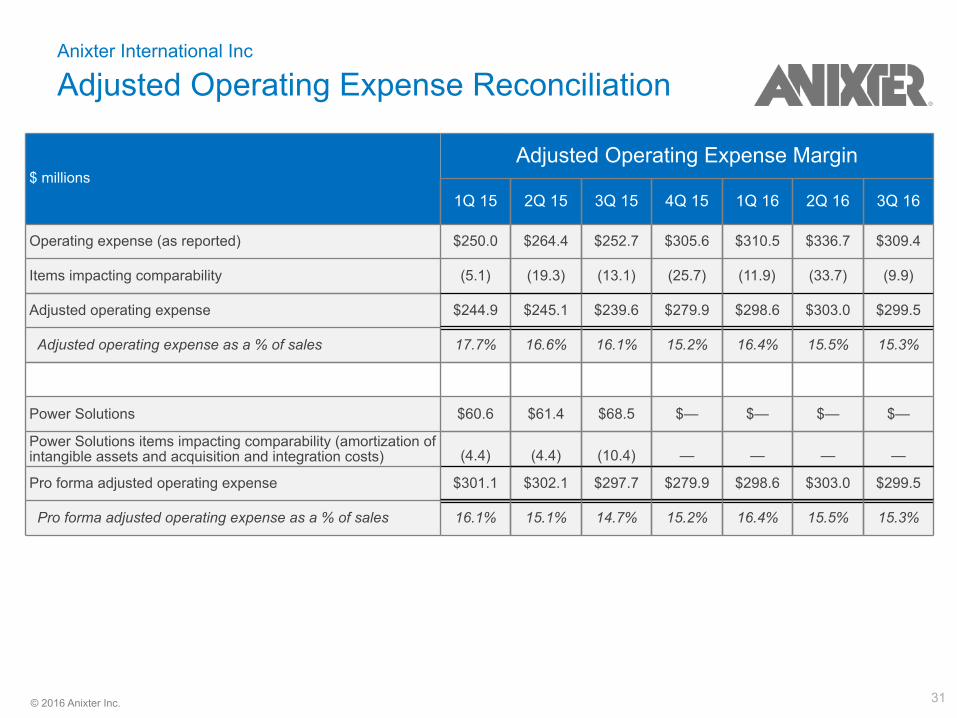
Anixter International Inc
Adjusted Operating Expense Reconciliation
$ millionsAdjusted Operating Expense Margin
1Q 15 2Q 15 3Q 15 4Q 15 1Q 16 2Q 16 3Q 16
Operating expense (as reported) $250.0 $264.4 $252.7 $305.6 $310.5 $336.7 $309.4
Items impacting comparability (5.1) (19.3) (13.1) (25.7) (11.9) (33.7) (9.9)
Adjusted operating expense $244.9 $245.1 $239.6 $279.9 $298.6 $303.0 $299.5
Adjusted operating expense as a % of sales 17.7% 16.6% 16.1% 15.2% 16.4% 15.5% 15.3%
Power Solutions $60.6 $61.4 $68.5 $— $— $— $—
Power Solutions items impacting comparability (amortization ofintangible assets and acquisition and integration costs) (4.4) (4.4) (10.4) — — — —
Pro forma adjusted operating expense $301.1 $302.1 $297.7 $279.9 $298.6 $303.0 $299.5
Pro forma adjusted operating expense as a % of sales 16.1% 15.1% 14.7% 15.2% 16.4% 15.5% 15.3%