Embed Size (px)
Citation preview
Investor Presentation &
2014 Q1 Bulletin
Istanbul Stock Exchange: BRISA www.brisa.com.tr
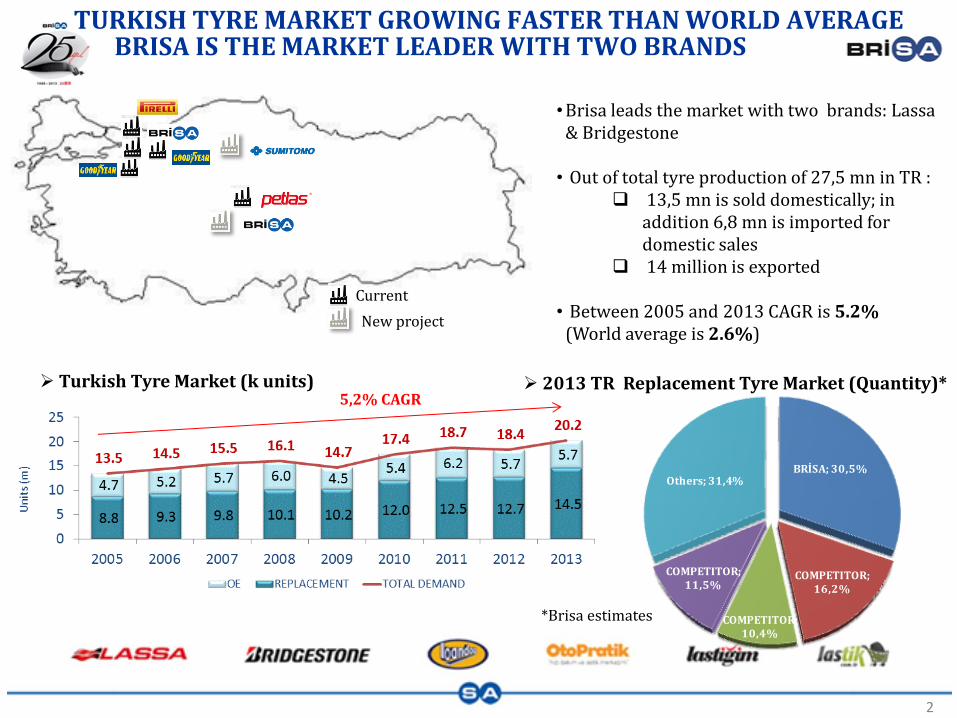
TURKISH TYRE MARKET GROWING FASTER THAN WORLD AVERAGE BRISA IS THE MARKET LEADER WITH TWO BRANDS
2
Current
2013 TR Replacement Tyre Market (Quantity)* Turkish Tyre Market (k units)
•Brisa leads the market with two brands: Lassa & Bridgestone • Out of total tyre production of 27,5 mn in TR :
13,5 mn is sold domestically; in addition 6,8 mn is imported for domestic sales
14 million is exported • Between 2005 and 2013 CAGR is 5.2%
(World average is 2.6%)
New project
*Brisa estimates
5,2% CAGR
BRİSA; 30,5%
COMPETITOR; 16,2%
COMPETITOR; 10,4%
COMPETITOR; 11,5%
Others; 31,4%
3
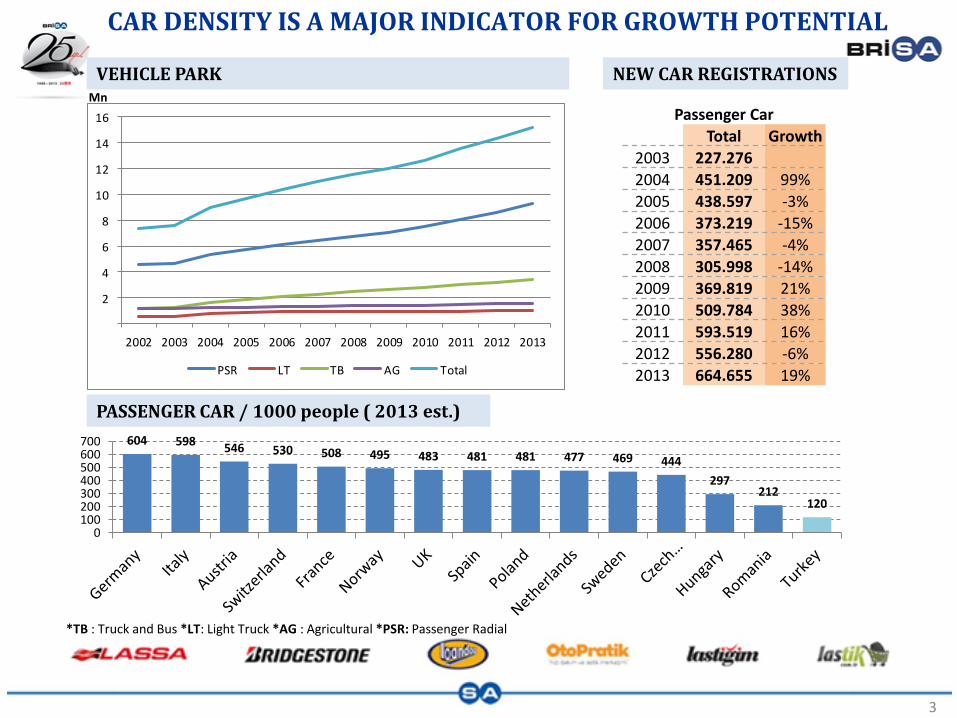
CAR DENSITY IS A MAJOR INDICATOR FOR GROWTH POTENTIAL
Mn
NEW CAR REGISTRATIONS
Passenger Car
Total Growth
2003 227.276
2004 451.209 99%
2005 438.597 -3%
2006 373.219 -15%
2007 357.465 -4%
2008 305.998 -14%
2009 369.819 21%
2010 509.784 38%
2011 593.519 16%
2012 556.280 -6%
2013 664.655 19%
VEHICLE PARK
604 598 546 530 508 495 483 481 481 477 469 444
297 212
120
0100200300400500600700
PASSENGER CAR / 1000 people ( 2013 est.)
*TB : Truck and Bus *LT: Light Truck *AG : Agricultural *PSR: Passenger Radial
2
4
6
8
10
12
14
16
2002 2003 2004 2005 2006 2007 2008 2009 2010 2011 2012 2013
PSR LT TB AG Total
4
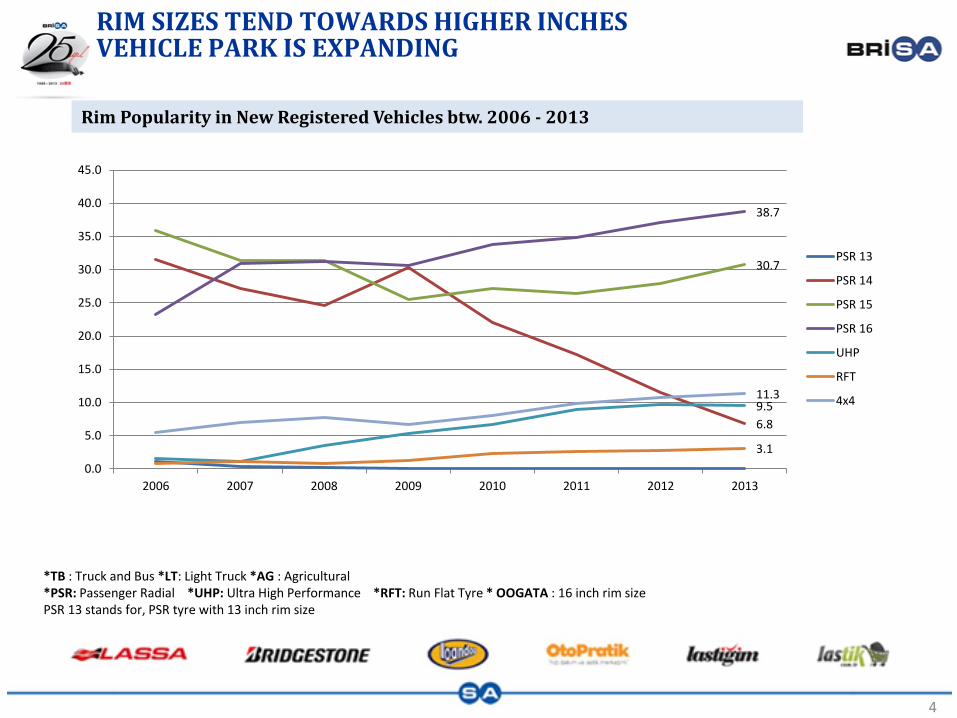
RIM SIZES TEND TOWARDS HIGHER INCHES VEHICLE PARK IS EXPANDING
*TB : Truck and Bus *LT: Light Truck *AG : Agricultural *PSR: Passenger Radial *UHP: Ultra High Performance *RFT: Run Flat Tyre * OOGATA : 16 inch rim size PSR 13 stands for, PSR tyre with 13 inch rim size
Rim Popularity in New Registered Vehicles btw. 2006 - 2013
6.8
30.7
38.7
9.5
3.1
11.3
0.0
5.0
10.0
15.0
20.0
25.0
30.0
35.0
40.0
45.0
2006 2007 2008 2009 2010 2011 2012 2013
PSR 13
PSR 14
PSR 15
PSR 16
UHP
RFT
4x4
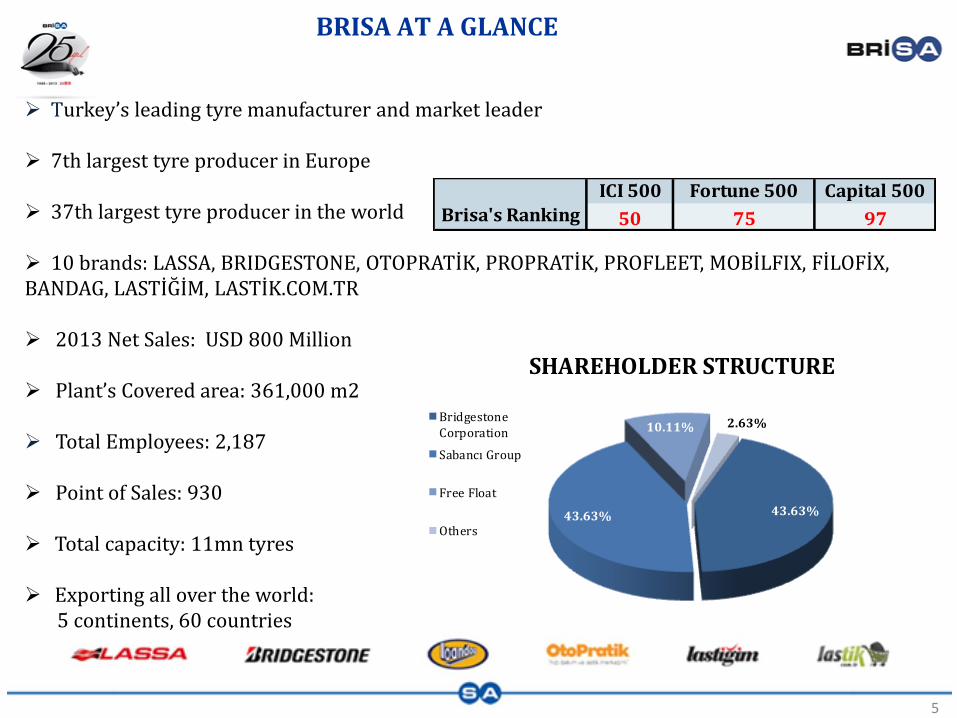
BRISA AT A GLANCE
Turkey’s leading tyre manufacturer and market leader
7th largest tyre producer in Europe
37th largest tyre producer in the world
10 brands: LASSA, BRIDGESTONE, OTOPRATİK, PROPRATİK, PROFLEET, MOBİLFIX, FİLOFİX, BANDAG, LASTİĞİM, LASTİK.COM.TR
2013 Net Sales: USD 800 Million Plant’s Covered area: 361,000 m2
Total Employees: 2,187
Point of Sales: 930
Total capacity: 11mn tyres
Exporting all over the world: 5 continents, 60 countries
5
43.63%43.63%
10.11% 2.63%
SHAREHOLDER STRUCTURE
BridgestoneCorporation
Sabancı Group
Free Float
Others
ICI 500 Fortune 500 Capital 500
Brisa's Ranking 50 75 97
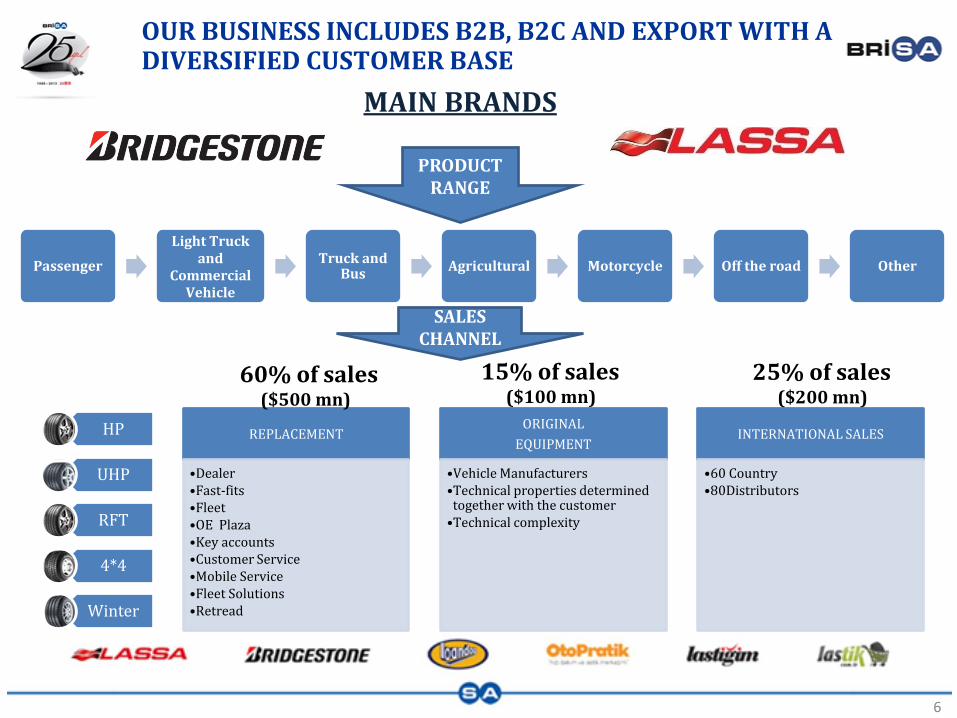
PRODUCT RANGE
Passenger
Light Truck and
Commercial Vehicle
Truck and Bus
Agricultural Motorcycle Off the road Other
SALES CHANNEL
REPLACEMENT
•Dealer •Fast-fits •Fleet •OE Plaza •Key accounts •Customer Service •Mobile Service •Fleet Solutions •Retread
ORIGINAL
EQUIPMENT
•Vehicle Manufacturers •Technical properties determined together with the customer
•Technical complexity
INTERNATIONAL SALES
•60 Country •80Distributors
MAIN BRANDS
OUR BUSINESS INCLUDES B2B, B2C AND EXPORT WITH A DIVERSIFIED CUSTOMER BASE
HP
UHP
RFT
4*4
Winter
6
60% of sales ($500 mn)
15% of sales ($100 mn)
25% of sales ($200 mn)
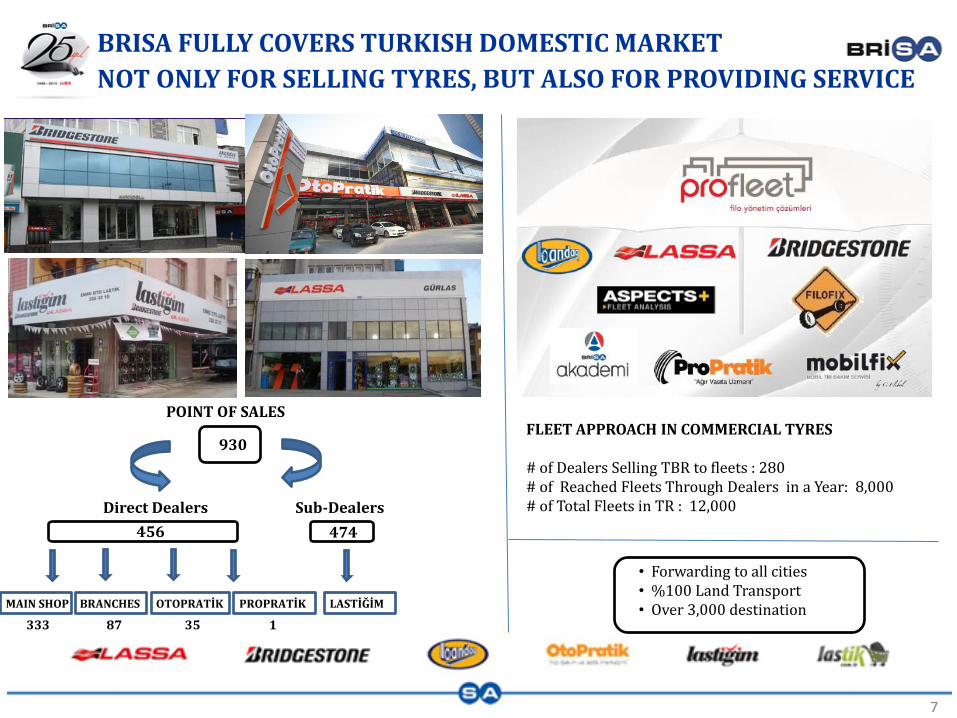
• Forwarding to all cities • %100 Land Transport • Over 3,000 destination
BRISA FULLY COVERS TURKISH DOMESTIC MARKET
NOT ONLY FOR SELLING TYRES, BUT ALSO FOR PROVIDING SERVICE
7
POINT OF SALES FLEET APPROACH IN COMMERCIAL TYRES # of Dealers Selling TBR to fleets : 280 # of Reached Fleets Through Dealers in a Year: 8,000 # of Total Fleets in TR : 12,000
930
Direct Dealers Sub-Dealers
474
MAIN SHOP BRANCHES OTOPRATİK PROPRATİK LASTİĞİM
333 87 35 1
456
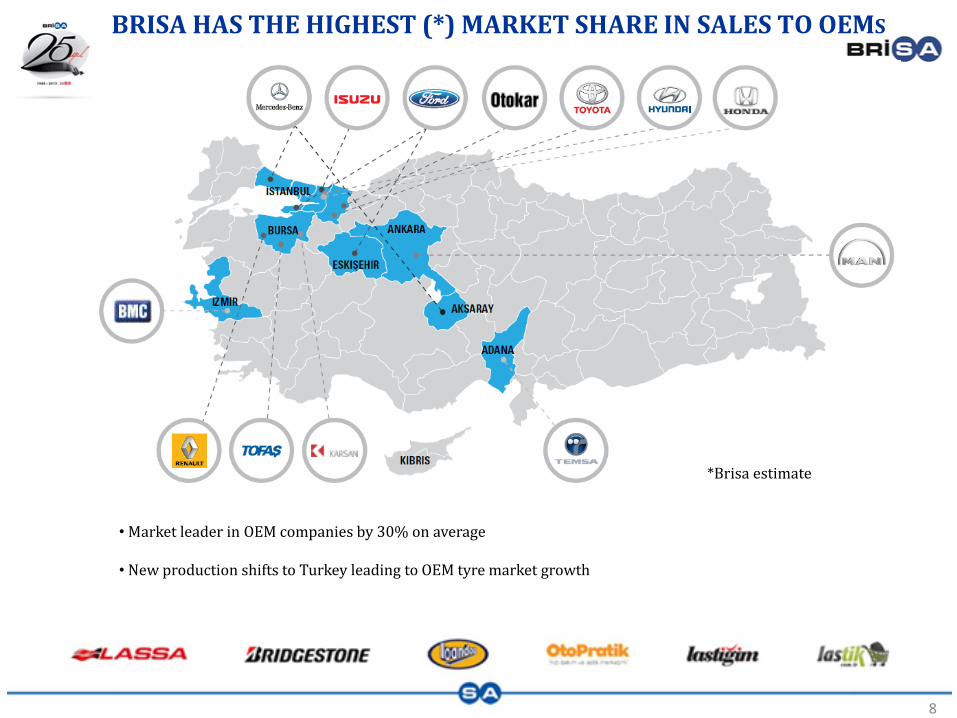
BRISA HAS THE HIGHEST (*) MARKET SHARE IN SALES TO OEMS
8
• Market leader in OEM companies by 30% on average • New production shifts to Turkey leading to OEM tyre market growth
*Brisa estimate
9
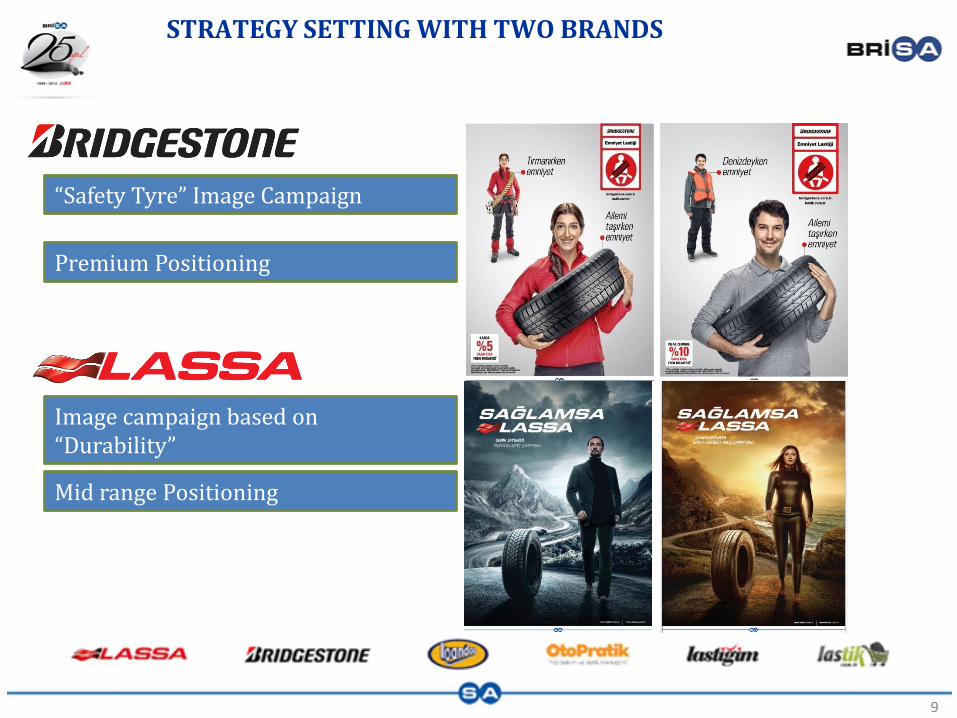
STRATEGY SETTING WITH TWO BRANDS
“Safety Tyre” Image Campaign
Image campaign based on “Durability”
Premium Positioning
Mid range Positioning
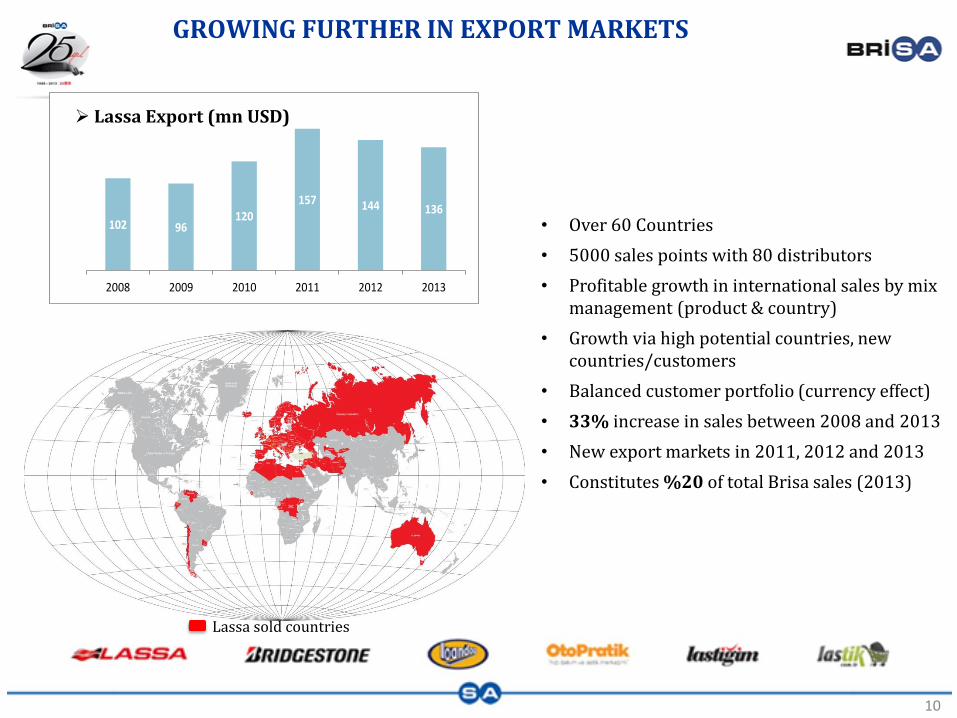
102 96120
157 144 136
0
20
40
60
80
100
120
140
160
180
2008 2009 2010 2011 2012 2013
GROWING FURTHER IN EXPORT MARKETS
10
• Over 60 Countries
• 5000 sales points with 80 distributors
• Profitable growth in international sales by mix management (product & country)
• Growth via high potential countries, new countries/customers
• Balanced customer portfolio (currency effect)
• 33% increase in sales between 2008 and 2013
• New export markets in 2011, 2012 and 2013
• Constitutes %20 of total Brisa sales (2013)
Lassa Export (mn USD)
Lassa sold countries
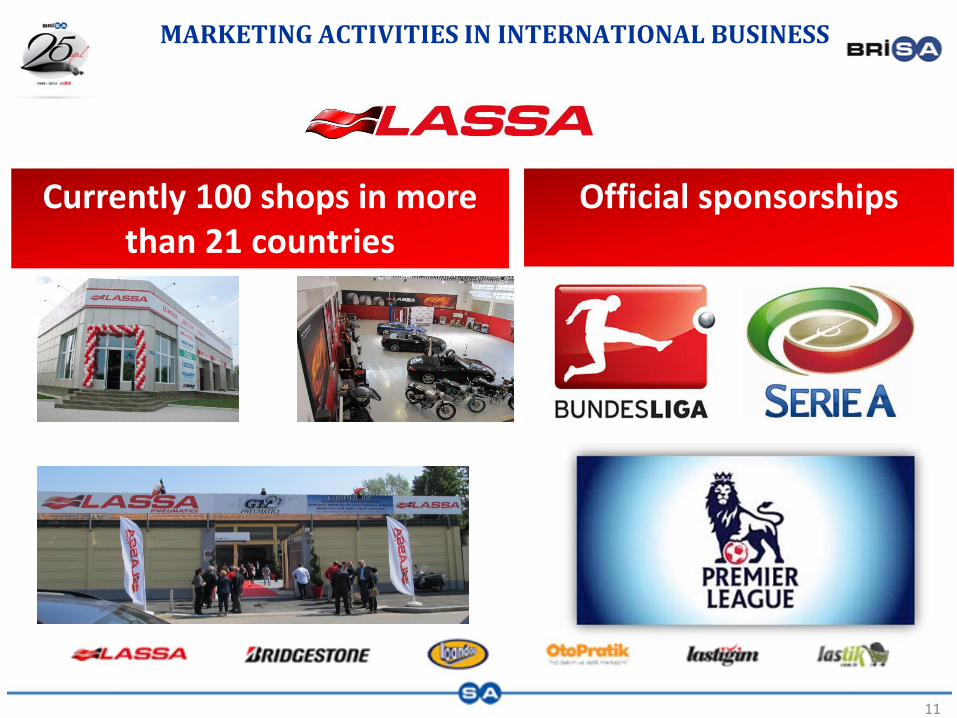
MARKETING ACTIVITIES IN INTERNATIONAL BUSINESS
Currently 100 shops in more than 21 countries
11
Official sponsorships
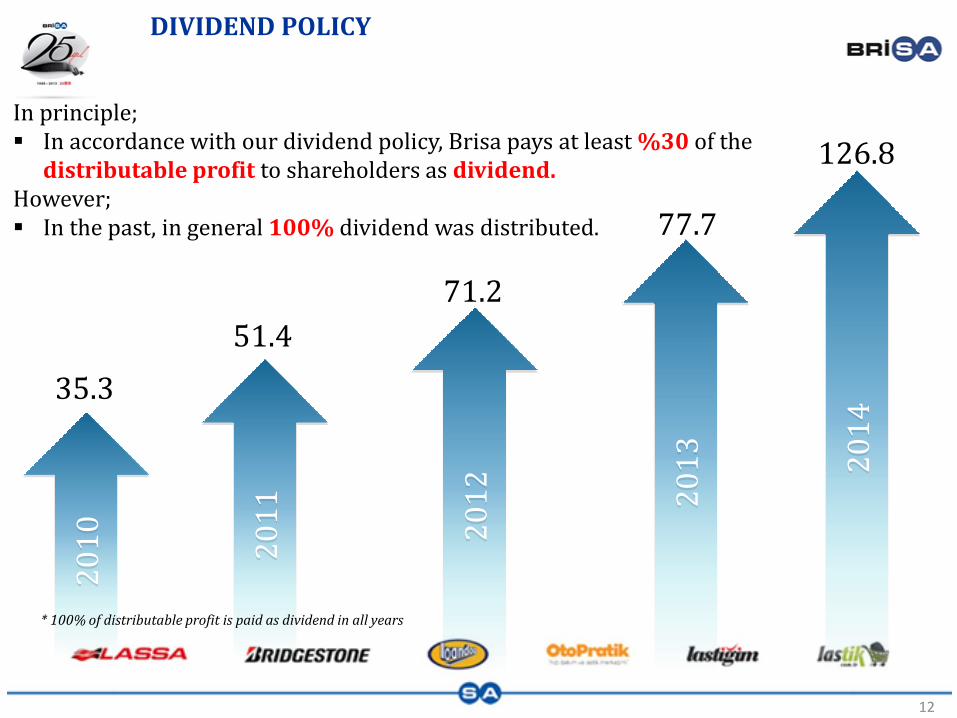
DIVIDEND POLICY
In principle; In accordance with our dividend policy, Brisa pays at least %30 of the
distributable profit to shareholders as dividend. However; In the past, in general 100% dividend was distributed.
20
10
20
11
20
12
35.3
51.4
71.2
12 2
01
3
77.7
* 100% of distributable profit is paid as dividend in all years
20
14
126.8
13
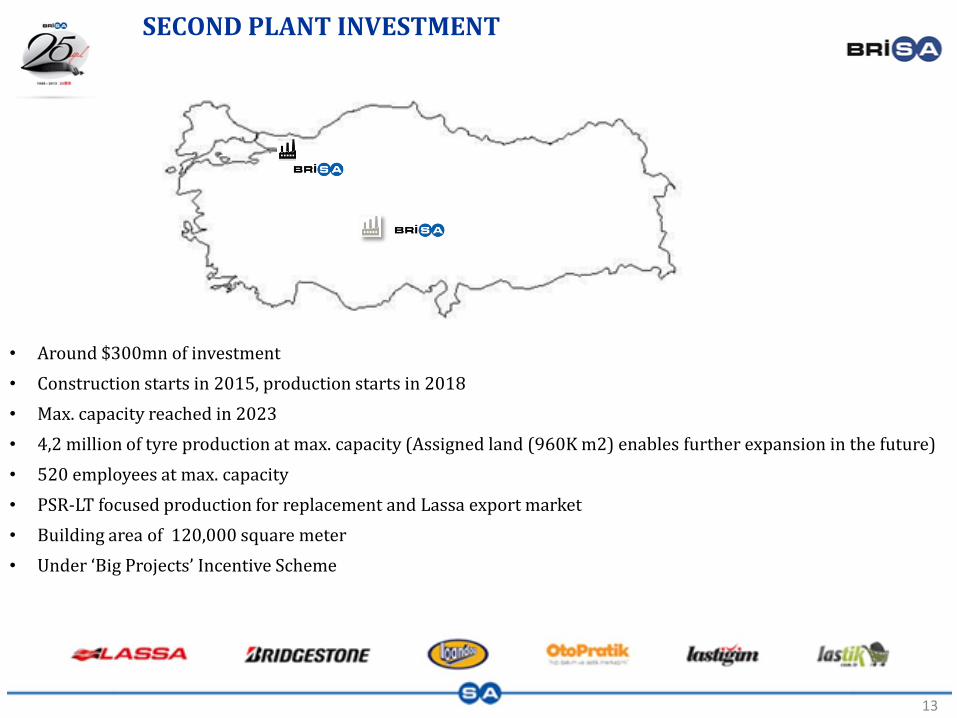
SECOND PLANT INVESTMENT
• Around $300mn of investment
• Construction starts in 2015, production starts in 2018
• Max. capacity reached in 2023
• 4,2 million of tyre production at max. capacity (Assigned land (960K m2) enables further expansion in the future)
• 520 employees at max. capacity
• PSR-LT focused production for replacement and Lassa export market
• Building area of 120,000 square meter
• Under ‘Big Projects’ Incentive Scheme
14
WHY INVEST IN BRISA...
Fast growing market: Increasing capacity of automotive manufacturers and old vehicle park
Further expansion with second plant
Access for new export markets
Strong brands, likely to benefit more strongly from growth
Focus on channel management and end-customer to secure and increase profitability
Diversified channel and customer portfolio
Continued leadership in market share, new products and services
Disclaimer Statement
The information and opinions contained in this document have been compiled or arrived at by Brisa from sources believed to be reliable and in good faith, but no representation or warranty, expressed or implied, is made as to their accuracy, completeness or correctness. All opinions and estimates contained in this document constitute the Company’s judgement as of the date of this document and are subject to change without notice. The information contained in this document is published for the assistance of recipients, but is not to be relied upon as authoritative or taken in substitution for the exercise of judgement by any recipient. The company does not accept any liability whatsoever for any direct or consequential loss arising from any use of this document or its contents.
Istanbul Stock Exchange: BRISA www.brisa.com.tr
2014 Q1 BULLETIN
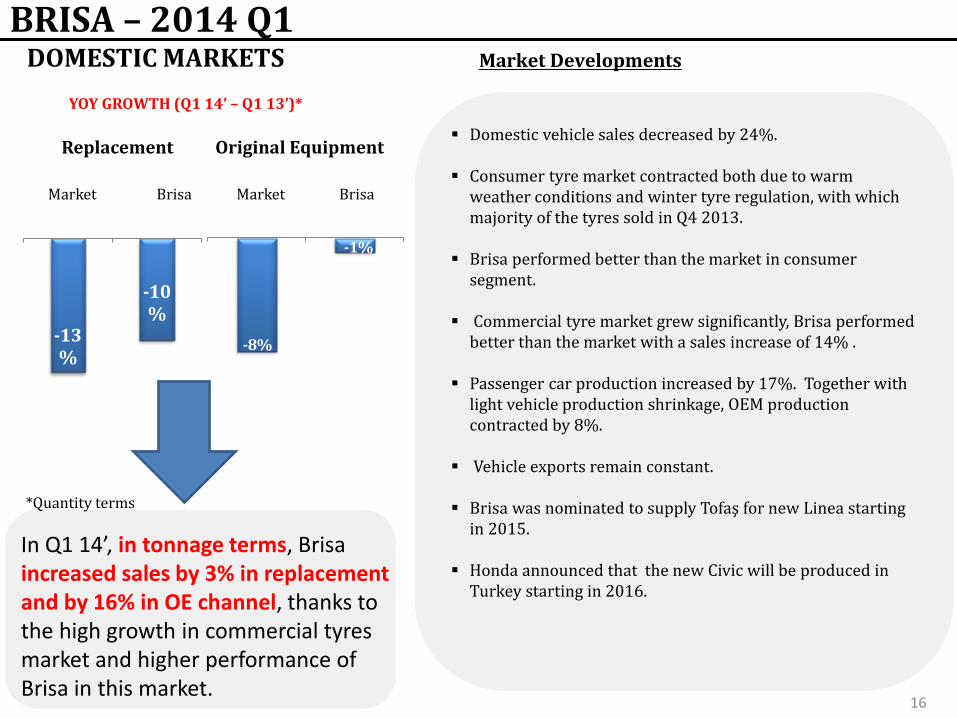
-13%
-10%
YOY GROWTH (Q1 14’ – Q1 13’)*
-8%
-1%
BRISA – 2014 Q1 DOMESTIC MARKETS Market Developments
Domestic vehicle sales decreased by 24%.
Consumer tyre market contracted both due to warm weather conditions and winter tyre regulation, with which majority of the tyres sold in Q4 2013.
Brisa performed better than the market in consumer segment.
Commercial tyre market grew significantly, Brisa performed better than the market with a sales increase of 14% .
Passenger car production increased by 17%. Together with light vehicle production shrinkage, OEM production contracted by 8%.
Vehicle exports remain constant. Brisa was nominated to supply Tofaş for new Linea starting
in 2015. Honda announced that the new Civic will be produced in
Turkey starting in 2016.
Replacement
Market
Original Equipment
Brisa Market Brisa
16
In Q1 14’, in tonnage terms, Brisa increased sales by 3% in replacement and by 16% in OE channel, thanks to the high growth in commercial tyres market and higher performance of Brisa in this market.
*Quantity terms
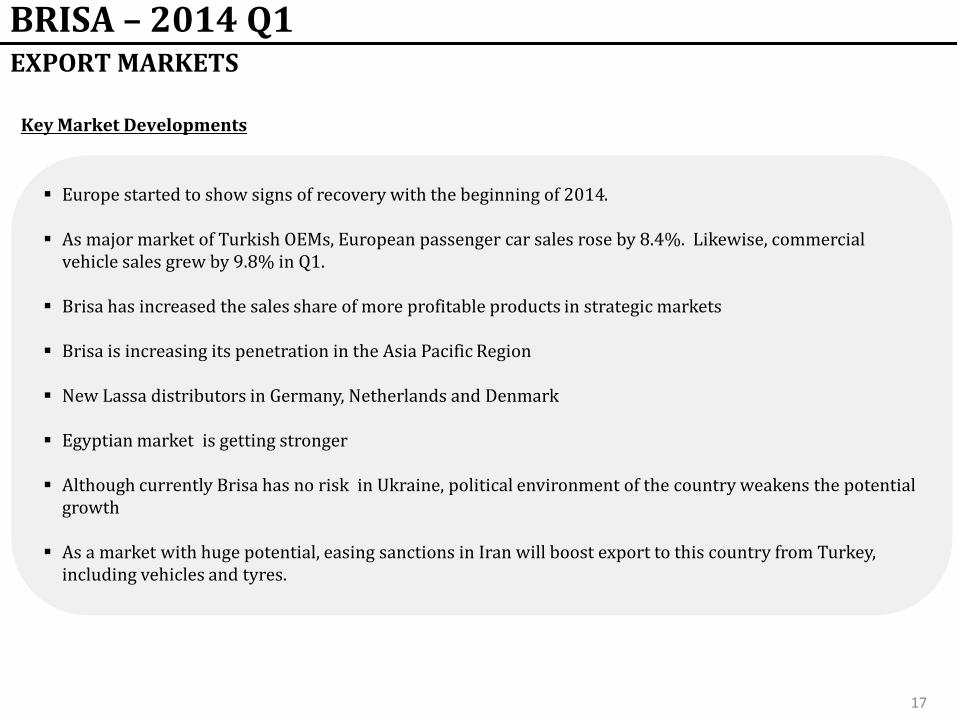
BRISA – 2014 Q1 EXPORT MARKETS
Key Market Developments
Europe started to show signs of recovery with the beginning of 2014.
As major market of Turkish OEMs, European passenger car sales rose by 8.4%. Likewise, commercial vehicle sales grew by 9.8% in Q1.
Brisa has increased the sales share of more profitable products in strategic markets
Brisa is increasing its penetration in the Asia Pacific Region
New Lassa distributors in Germany, Netherlands and Denmark
Egyptian market is getting stronger
Although currently Brisa has no risk in Ukraine, political environment of the country weakens the potential
growth
As a market with huge potential, easing sanctions in Iran will boost export to this country from Turkey, including vehicles and tyres.
17
2013 Q1 2014 Q1
83120
Gross Profit
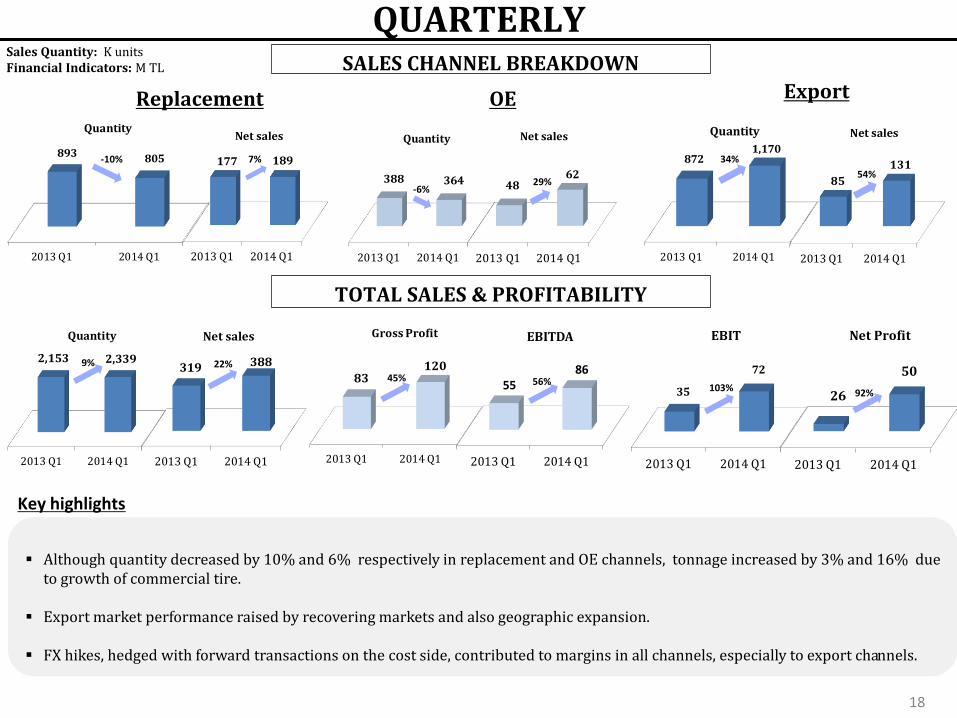
QUARTERLY
Replacement OE Export
SALES CHANNEL BREAKDOWN
TOTAL SALES & PROFITABILITY
Key highlights
Although quantity decreased by 10% and 6% respectively in replacement and OE channels, tonnage increased by 3% and 16% due
to growth of commercial tire.
Export market performance raised by recovering markets and also geographic expansion.
FX hikes, hedged with forward transactions on the cost side, contributed to margins in all channels, especially to export channels.
Sales Quantity: K units Financial Indicators: M TL
18
2013 Q1 2014 Q1
893 805
Quantity
-10%
2013 Q1 2014 Q1
177 189
Net sales
7%
2013 Q1 2014 Q1
388 364
Quantity
-6%
2013 Q1 2014 Q1
4862
Net sales
29%
2013 Q1 2014 Q1
8721,170
Quantity
34%
2013 Q1 2014 Q1
85
131
Net sales
54%
2013 Q1 2014 Q1
2,153 2,339
Quantity
9%
2013 Q1 2014 Q1
319 388
Net sales
22%
2013 Q1 2014 Q1
55 86
EBITDA
45% 56%
2013 Q1 2014 Q1
35
72
EBIT
2013 Q1 2014 Q1
26
50
Net Profit
103% 92%
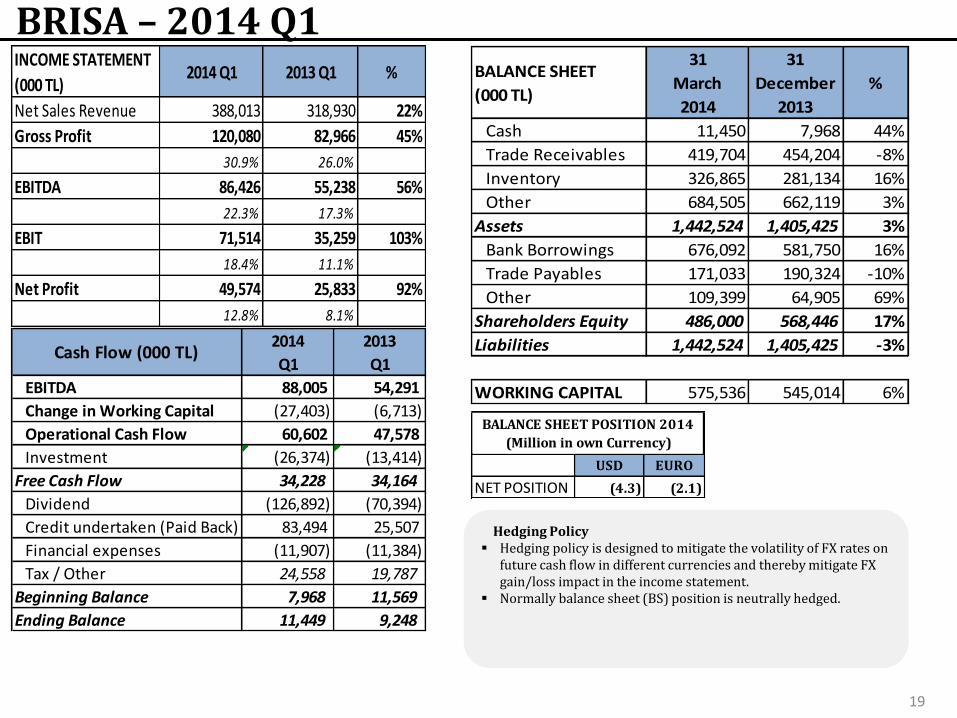
BRISA – 2014 Q1
Hedging Policy Hedging policy is designed to mitigate the volatility of FX rates on
future cash flow in different currencies and thereby mitigate FX gain/loss impact in the income statement.
Normally balance sheet (BS) position is neutrally hedged.
19
USD EURO
NET POSITION (4.3) (2.1)
BALANCE SHEET POSITION 2014
(Million in own Currency)
INCOME STATEMENT
(000 TL)2014 Q1 2013 Q1 %
Net Sales Revenue 388,013 318,930 22%
Gross Profit 120,080 82,966 45%
30.9% 26.0%
EBITDA 86,426 55,238 56%
22.3% 17.3%
EBIT 71,514 35,259 103%
18.4% 11.1%
Net Profit 49,574 25,833 92%
12.8% 8.1%
BALANCE SHEET
(000 TL)
31
March
2014
31
December
2013
%
Cash 11,450 7,968 44%
Trade Receivables 419,704 454,204 -8%
Inventory 326,865 281,134 16%
Other 684,505 662,119 3%
Assets 1,442,524 1,405,425 3%
Bank Borrowings 676,092 581,750 16%
Trade Payables 171,033 190,324 -10%
Other 109,399 64,905 69%
Shareholders Equity 486,000 568,446 17%
Liabilities 1,442,524 1,405,425 -3%
WORKING CAPITAL 575,536 545,014 6%
Cash Flow (000 TL)2014
Q1
2013
Q1
EBITDA 88,005 54,291
Change in Working Capital (27,403) (6,713)
Operational Cash Flow 60,602 47,578
Investment (26,374) (13,414)
Free Cash Flow 34,228 34,164
Dividend (126,892) (70,394)
Credit undertaken (Paid Back) 83,494 25,507
Financial expenses (11,907) (11,384)
Tax / Other 24,558 19,787
Beginning Balance 7,968 11,569
Ending Balance 11,449 9,248
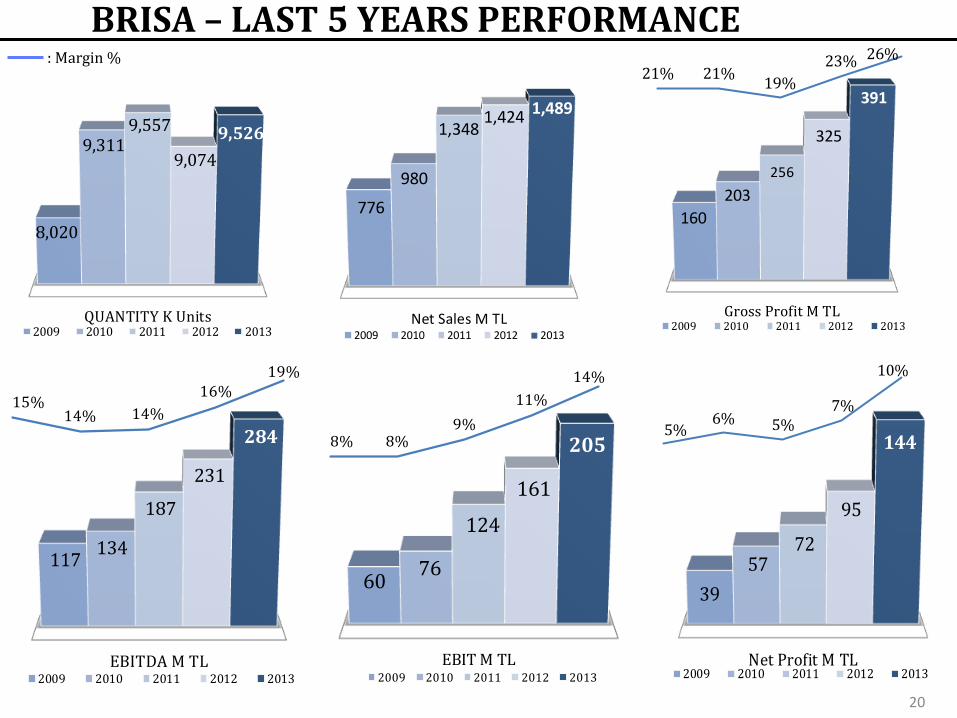
BRISA – LAST 5 YEARS PERFORMANCE
QUANTITY K Units
8,020
9,311 9,557
9,074
9,526
2009 2010 2011 2012 2013Net Sales M TL
776
980
1,348 1,424 1,489
2009 2010 2011 2012 2013
Net Profit M TL
39
57 72
95
144
2009 2010 2011 2012 2013
Gross Profit M TL
160
203
256
325
391
2009 2010 2011 2012 2013
21% 21%19%
23% 26%
EBITDA M TL
117 134
187
231
284
2009 2010 2011 2012 2013
15%14% 14%
16%19%
EBIT M TL
60 76
124
161
205
2009 2010 2011 2012 2013
8% 8%9%
11%
14%
5%6% 5%
7%
10%
: Margin %
20
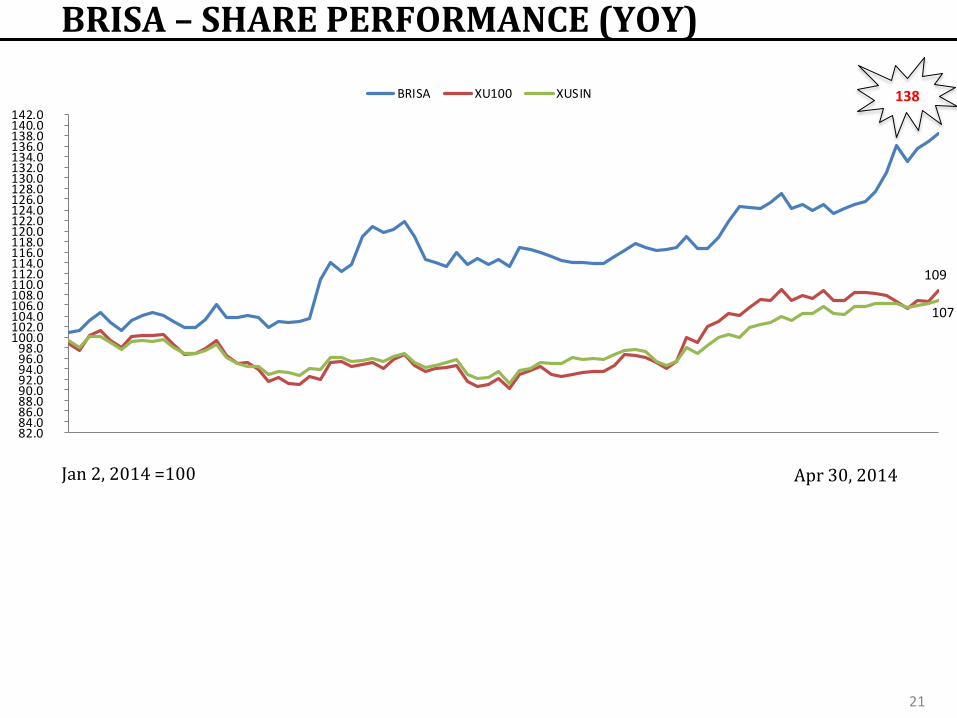
BRISA – SHARE PERFORMANCE (YOY)
Jan 2, 2014 =100 Apr 30, 2014
21
82.0 84.0 86.0 88.0 90.0 92.0 94.0 96.0 98.0
100.0 102.0 104.0 106.0 108.0 110.0 112.0 114.0 116.0 118.0 120.0 122.0 124.0 126.0 128.0 130.0 132.0 134.0 136.0 138.0 140.0 142.0
BRISA XU100 XUSIN 138
109
107
THANK YOU…
22
Contacts: Bora Çermikli Chief Financial Officer
+90 (262) 316 56 00 [email protected]
Reşat Oruç Budget and Finance Manager +90 (262) 316 57 00
[email protected] Disclaimer Statement
The information and opinions contained in this document have been compiled or arrived at by Brisa from sources believed to be reliable and in good faith, but no representation or warranty, expressed or implied, is made as to their accuracy, completeness or correctness. All opinions and estimates contained in this document constitute the Company’s judgement as of the date of this document and are subject to change without notice. The information contained in this document is published for the assistance of recipients, but is not to be relied upon as authoritative or taken in substitution for the exercise of judgement by any recipient. The company does not accept any liability whatsoever for any direct or consequential loss arising from any use of this document or its contents.
23