Embed Size (px)
Citation preview
1 | May 5, 2016 | © 2016 Curtiss-Wright
1Q 2016 Earnings Conference CallMay 5, 2016
NYSE: CW
2 | May 5, 2016 | © 2016 Curtiss-Wright
Safe Harbor Statement
Please note that the information provided in this presentation is accurate as of the date of the original
presentation. The presentation will remain posted on this web site from one to twelve months following the
initial presentation, but content will not be updated to reflect new information that may become available
after the original presentation posting. The presentation contains forward-looking statements including,
among other things, management's estimates of future performance, revenue and earnings, our
management's growth objectives and our management's ability to produce consistent operating
improvements. These forward-looking statements are based on expectations as of the time the statements
were made only, and are subject to a number of risks and uncertainties which could cause us to fail to
achieve our then-current financial projections and other expectations. We undertake no duty to update this
information. More information about potential factors that could affect our business and financial results is
included in our filings with the Securities and Exchange Commission, including our Annual Reports on
Form 10-K and Quarterly Reports on Form 10-Q, including, among other sections, under the captions,
"Risk Factors" and "Management's Discussion and Analysis of Financial Condition and Results of
Operations," which is on file with the SEC and available at the SEC's website at www.sec.gov.
3 | May 5, 2016 | © 2016 Curtiss-Wright
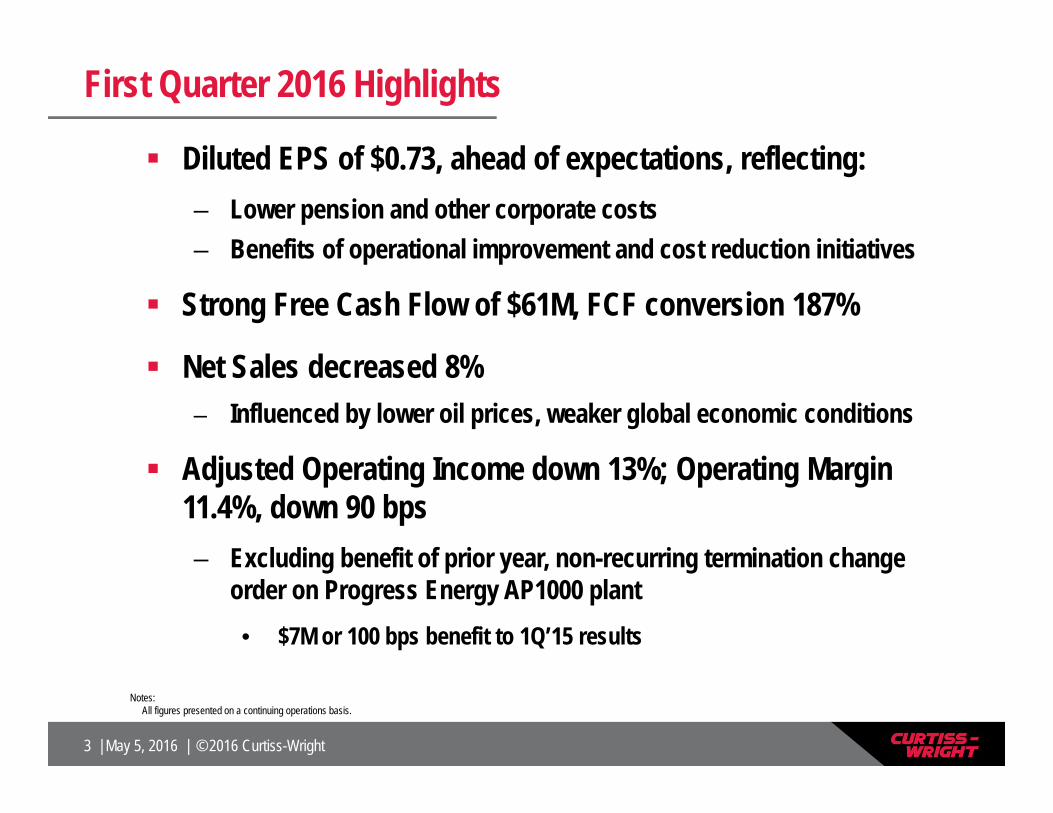
First Quarter 2016 Highlights
Diluted EPS of $0.73, ahead of expectations, reflecting:– Lower pension and other corporate costs– Benefits of operational improvement and cost reduction initiatives
Strong Free Cash Flow of $61M, FCF conversion 187%
Net Sales decreased 8%– Influenced by lower oil prices, weaker global economic conditions
Adjusted Operating Income down 13%; Operating Margin 11.4%, down 90 bps – Excluding benefit of prior year, non-recurring termination change
order on Progress Energy AP1000 plant• $7M or 100 bps benefit to 1Q’15 results
Notes:All figures presented on a continuing operations basis.
4 | May 5, 2016 | © 2016 Curtiss-Wright
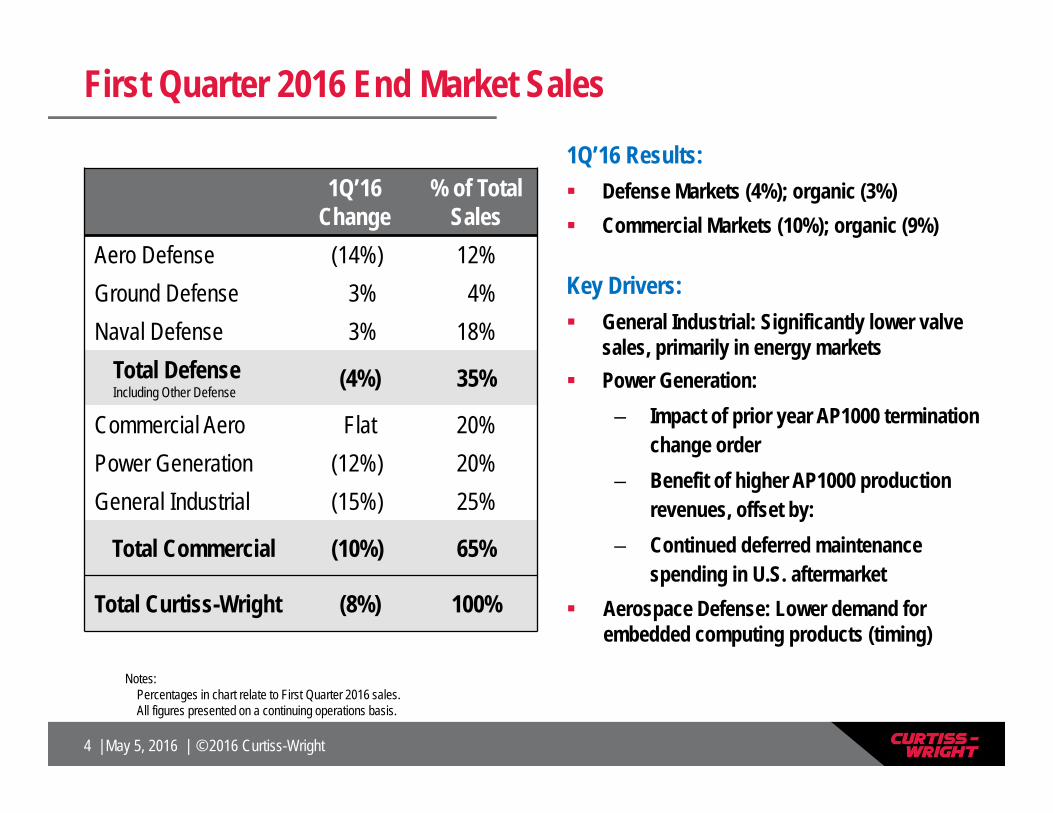
First Quarter 2016 End Market Sales
1Q’16 Results: Defense Markets (4%); organic (3%) Commercial Markets (10%); organic (9%)
Key Drivers: General Industrial: Significantly lower valve
sales, primarily in energy markets Power Generation:
– Impact of prior year AP1000 termination change order
– Benefit of higher AP1000 production revenues, offset by:
– Continued deferred maintenance spending in U.S. aftermarket
Aerospace Defense: Lower demand for embedded computing products (timing)
Notes: Percentages in chart relate to First Quarter 2016 sales. All figures presented on a continuing operations basis.
1Q’16 Change
% of Total Sales
Aero Defense (14%) 12%Ground Defense 3% 4%Naval Defense 3% 18%
Total DefenseIncluding Other Defense
(4%) 35%
Commercial Aero Flat 20%Power Generation (12%) 20%General Industrial (15%) 25%
Total Commercial (10%) 65%
Total Curtiss-Wright (8%) 100%
5 | May 5, 2016 | © 2016 Curtiss-Wright
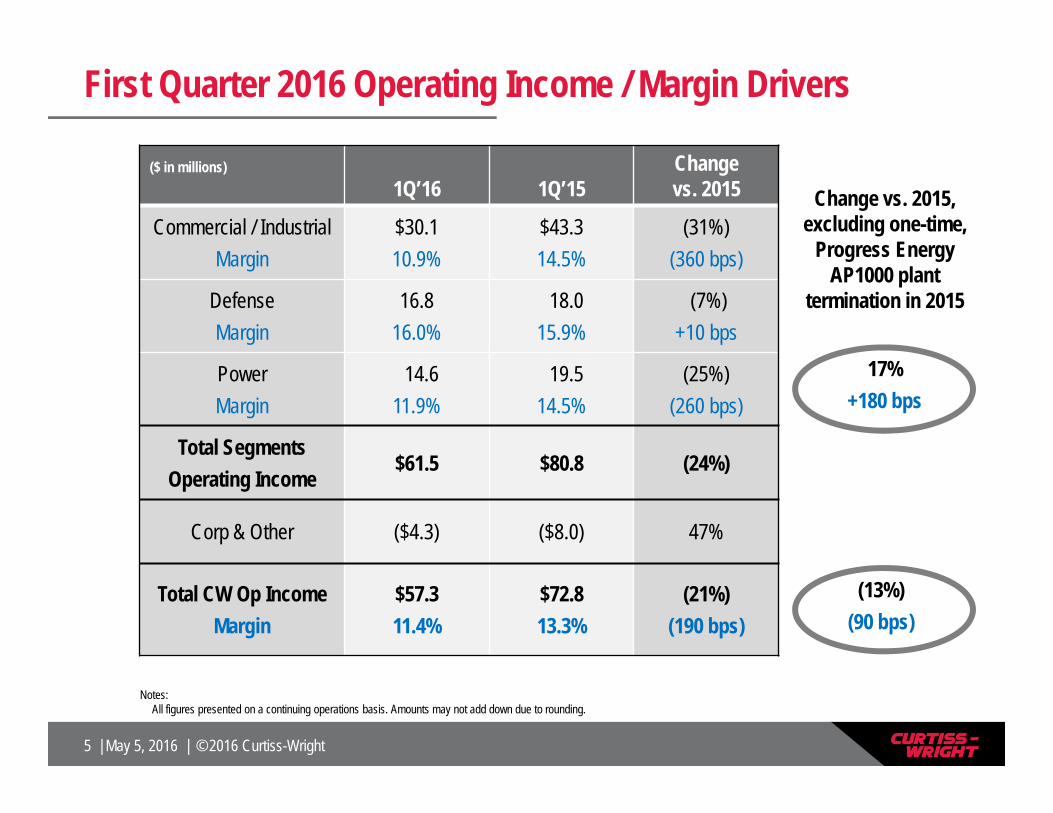
First Quarter 2016 Operating Income / Margin Drivers
($ in millions)1Q’16 1Q’15
Change vs. 2015
Commercial / IndustrialMargin
$30.110.9%
$43.314.5%
(31%)(360 bps)
DefenseMargin
16.816.0%
18.015.9%
(7%)+10 bps
PowerMargin
14.611.9%
19.514.5%
(25%)(260 bps)
Total SegmentsOperating Income
$61.5 $80.8 (24%)
Corp & Other ($4.3) ($8.0) 47%
Total CW Op IncomeMargin
$57.311.4%
$72.813.3%
(21%)(190 bps)
Notes:All figures presented on a continuing operations basis. Amounts may not add down due to rounding.
Change vs. 2014, excluding one-time, $20M AP1000 fees
(13%)(90 bps)
Change vs. 2015, excluding one-time,
Progress Energy AP1000 plant
termination in 2015
17%+180 bps
6 | May 5, 2016 | © 2016 Curtiss-Wright
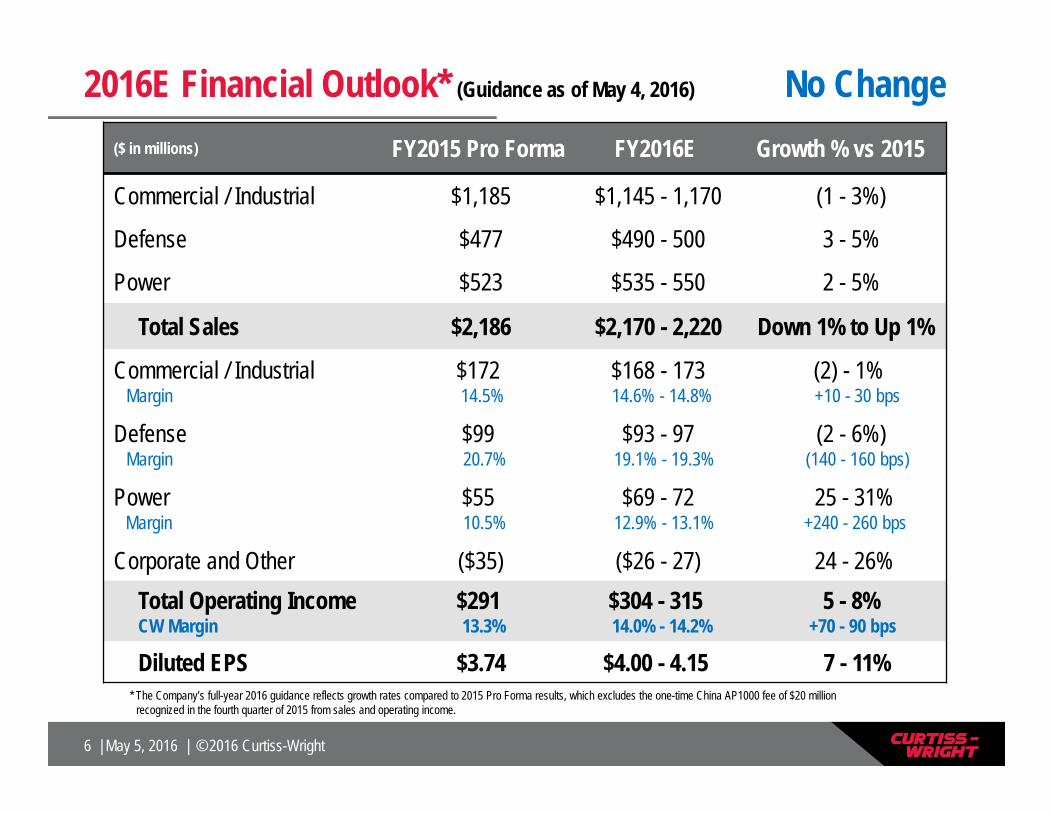
($ in millions) FY2015 Pro Forma FY2016E Growth % vs 2015
Commercial / Industrial $1,185 $1,145 - 1,170 (1 - 3%)
Defense $477 $490 - 500 3 - 5%
Power $523 $535 - 550 2 - 5%
Total Sales $2,186 $2,170 - 2,220 Down 1% to Up 1%
Commercial / IndustrialMargin
$17214.5%
$168 - 17314.6% - 14.8%
(2) - 1%+10 - 30 bps
DefenseMargin
$9920.7%
$93 - 9719.1% - 19.3%
(2 - 6%)(140 - 160 bps)
PowerMargin
$55 10.5%
$69 - 72 12.9% - 13.1%
25 - 31%+240 - 260 bps
Corporate and Other ($35) ($26 - 27) 24 - 26%Total Operating IncomeCW Margin
$29113.3%
$304 - 31514.0% - 14.2%
5 - 8%+70 - 90 bps
Diluted EPS $3.74 $4.00 - 4.15 7 - 11%
2016E Financial Outlook* (Guidance as of May 4, 2016) No Change
* The Company’s full-year 2016 guidance reflects growth rates compared to 2015 Pro Forma results, which excludes the one-time China AP1000 fee of $20 million recognized in the fourth quarter of 2015 from sales and operating income.
7 | May 5, 2016 | © 2016 Curtiss-Wright
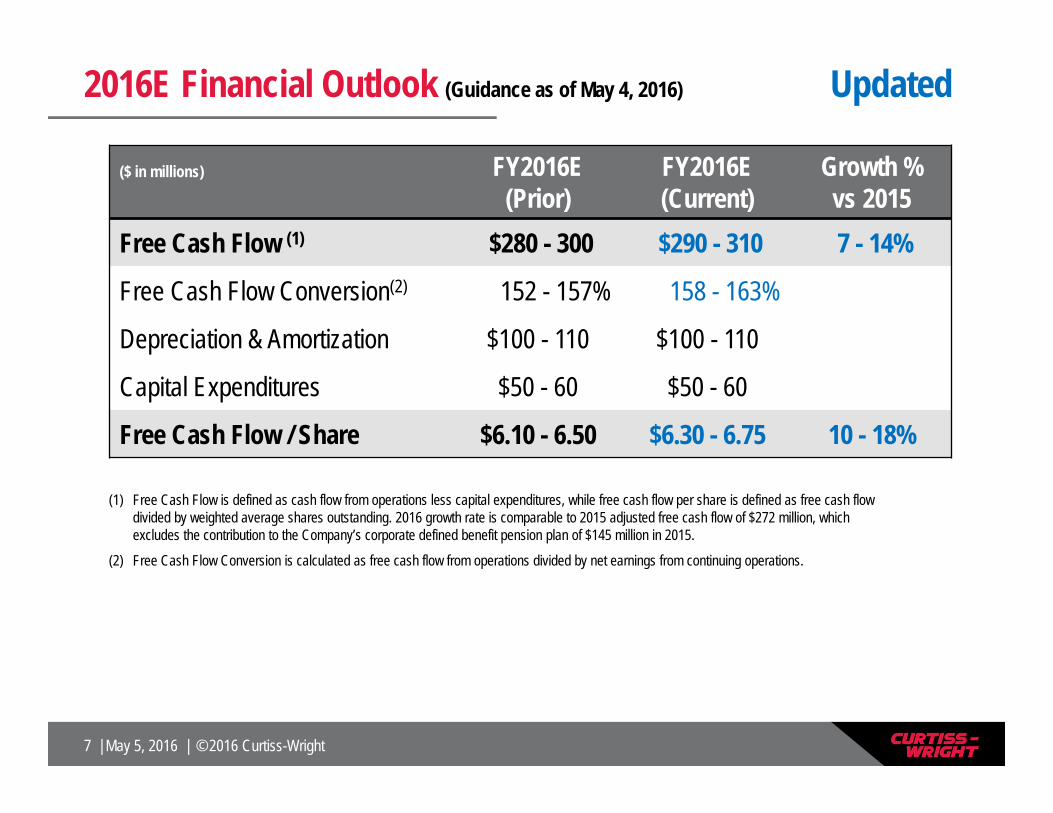
2016E Financial Outlook (Guidance as of May 4, 2016) Updated
($ in millions) FY2016E(Prior)
FY2016E(Current)
Growth %vs 2015
Free Cash Flow (1) $280 - 300 $290 - 310 7 - 14%
Free Cash Flow Conversion(2) 152 - 157% 158 - 163%
Depreciation & Amortization $100 - 110 $100 - 110
Capital Expenditures $50 - 60 $50 - 60
Free Cash Flow / Share $6.10 - 6.50 $6.30 - 6.75 10 - 18%
(1) Free Cash Flow is defined as cash flow from operations less capital expenditures, while free cash flow per share is defined as free cash flow divided by weighted average shares outstanding. 2016 growth rate is comparable to 2015 adjusted free cash flow of $272 million, which excludes the contribution to the Company’s corporate defined benefit pension plan of $145 million in 2015.
(2) Free Cash Flow Conversion is calculated as free cash flow from operations divided by net earnings from continuing operations.
8 | May 5, 2016 | © 2016 Curtiss-Wright
AP1000 Program Highlights
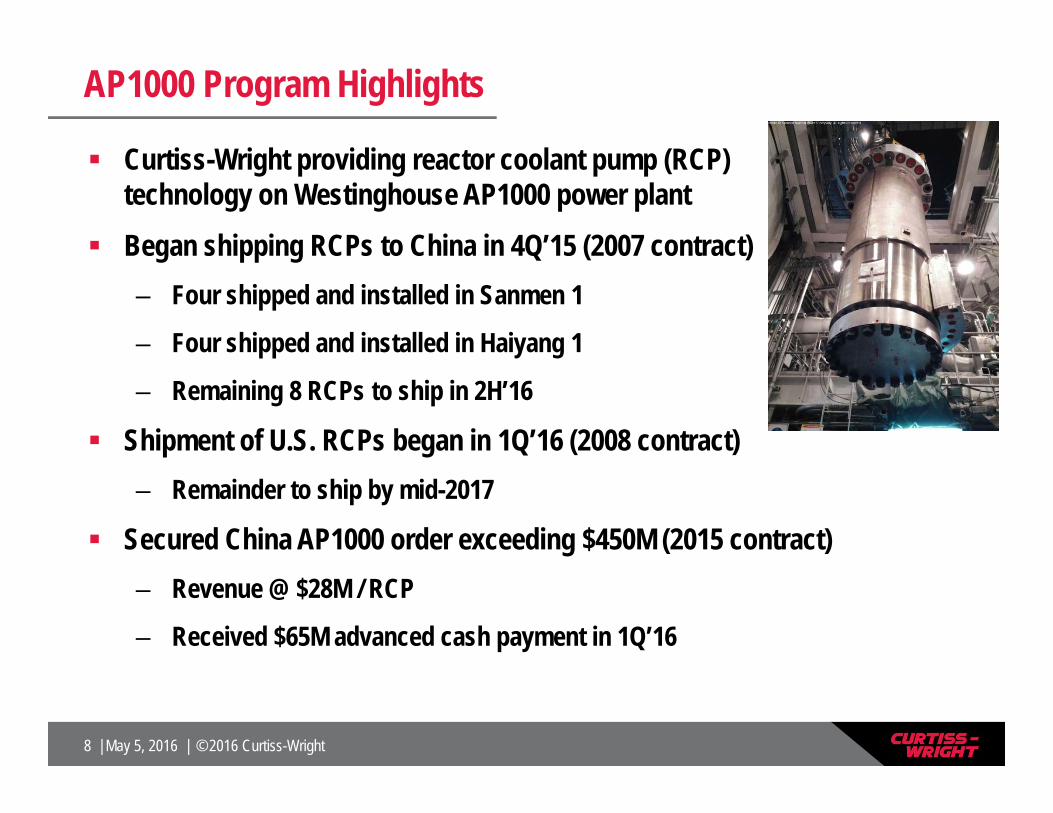
Curtiss-Wright providing reactor coolant pump (RCP) technology on Westinghouse AP1000 power plant
Began shipping RCPs to China in 4Q’15 (2007 contract)– Four shipped and installed in Sanmen 1
– Four shipped and installed in Haiyang 1
– Remaining 8 RCPs to ship in 2H’16
Shipment of U.S. RCPs began in 1Q’16 (2008 contract)– Remainder to ship by mid-2017
Secured China AP1000 order exceeding $450M (2015 contract)– Revenue @ $28M / RCP
– Received $65M advanced cash payment in 1Q’16
9 | May 5, 2016 | © 2016 Curtiss-Wright
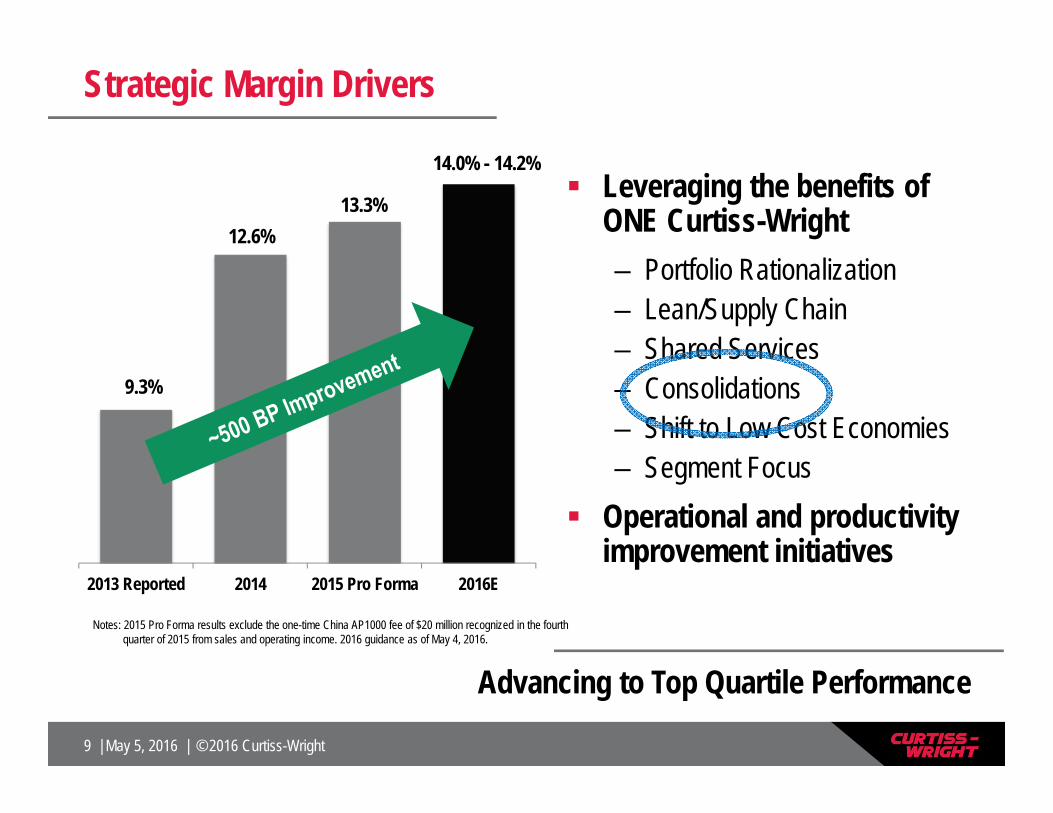
Strategic Margin Drivers
Advancing to Top Quartile Performance
Leveraging the benefits of ONE Curtiss-Wright– Portfolio Rationalization– Lean/Supply Chain– Shared Services– Consolidations– Shift to Low Cost Economies– Segment Focus
Operational and productivity improvement initiatives
2013 Reported 2014 2015 Pro Forma 2016E
9.3%
14.0% - 14.2%
12.6%13.3%
Notes: 2015 Pro Forma results exclude the one-time China AP1000 fee of $20 million recognized in the fourth quarter of 2015 from sales and operating income. 2016 guidance as of May 4, 2016.
10 | May 5, 2016 | © 2016 Curtiss-Wright
Balanced Capital Allocation
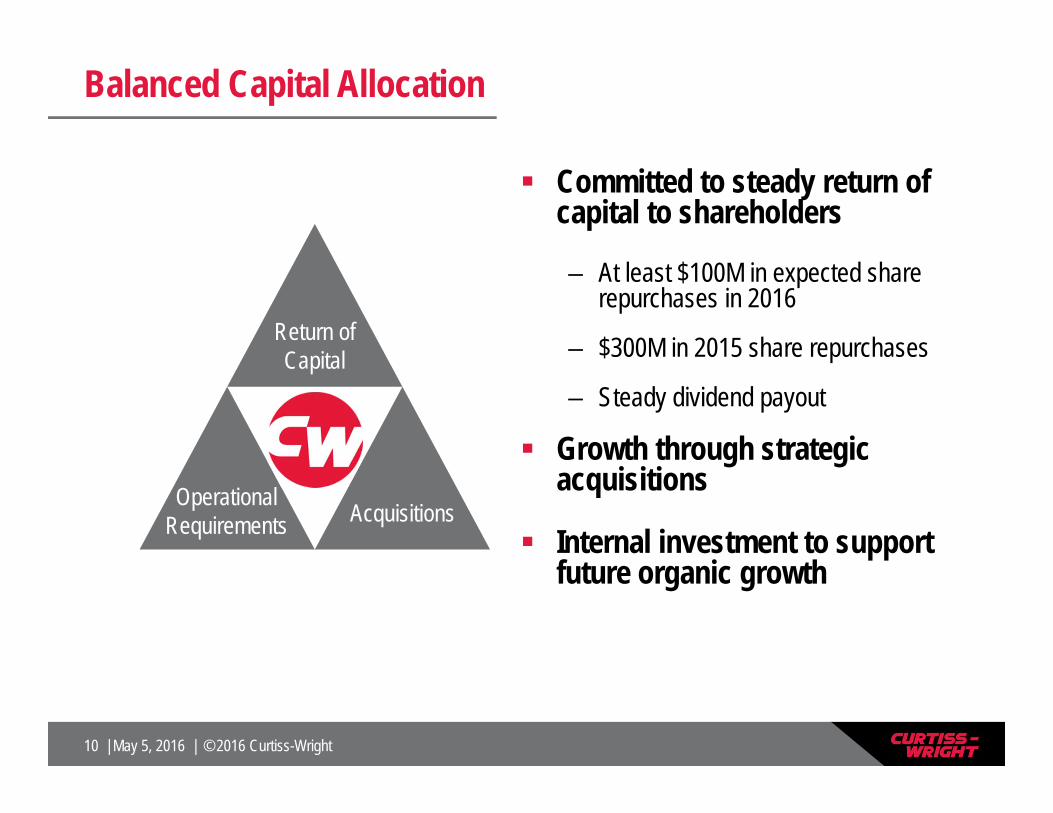
Return of Capital
Operational Requirements Acquisitions
Committed to steady return of capital to shareholders
– At least $100M in expected share repurchases in 2016
– $300M in 2015 share repurchases
– Steady dividend payout
Growth through strategic acquisitions
Internal investment to support future organic growth
11 | May 5, 2016 | © 2016 Curtiss-Wright
Outlook for 2016 and Closing Comments
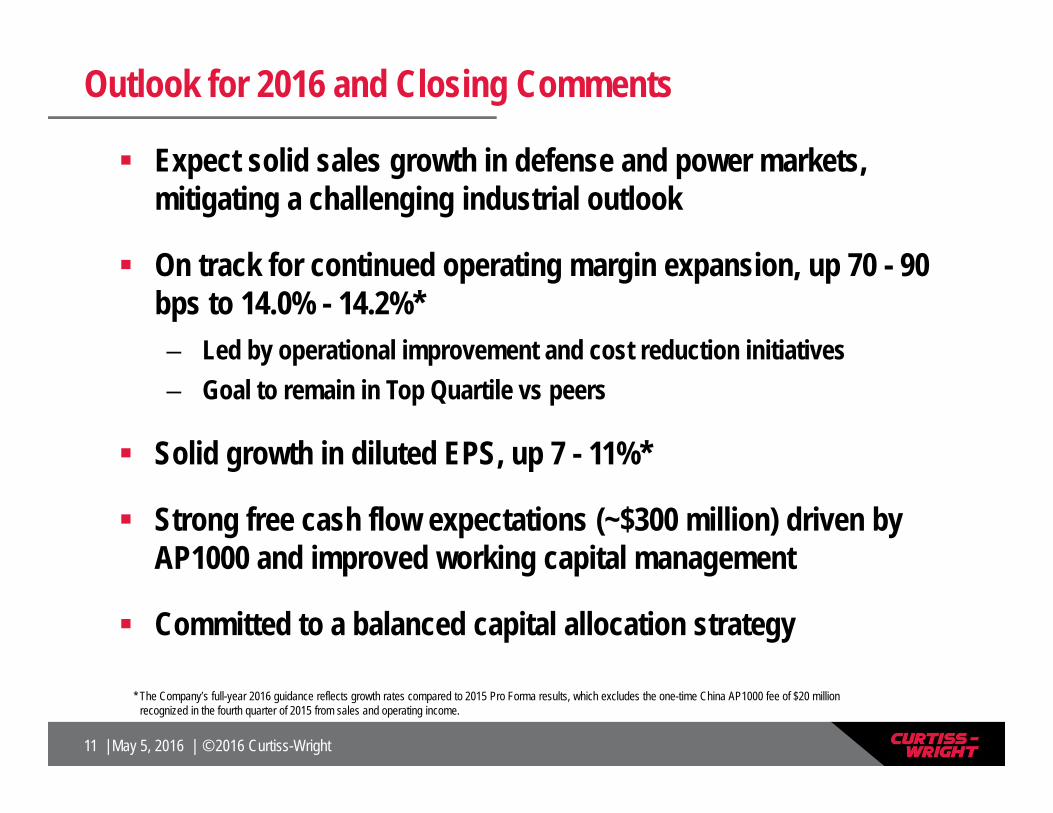
Expect solid sales growth in defense and power markets, mitigating a challenging industrial outlook
On track for continued operating margin expansion, up 70 - 90 bps to 14.0% - 14.2%*– Led by operational improvement and cost reduction initiatives– Goal to remain in Top Quartile vs peers
Solid growth in diluted EPS, up 7 - 11%*
Strong free cash flow expectations (~$300 million) driven by AP1000 and improved working capital management
Committed to a balanced capital allocation strategy
* The Company’s full-year 2016 guidance reflects growth rates compared to 2015 Pro Forma results, which excludes the one-time China AP1000 fee of $20 million recognized in the fourth quarter of 2015 from sales and operating income.
12 | May 5, 2016 | © 2016 Curtiss-Wright
Appendix
13 | May 5, 2016 | © 2016 Curtiss-Wright
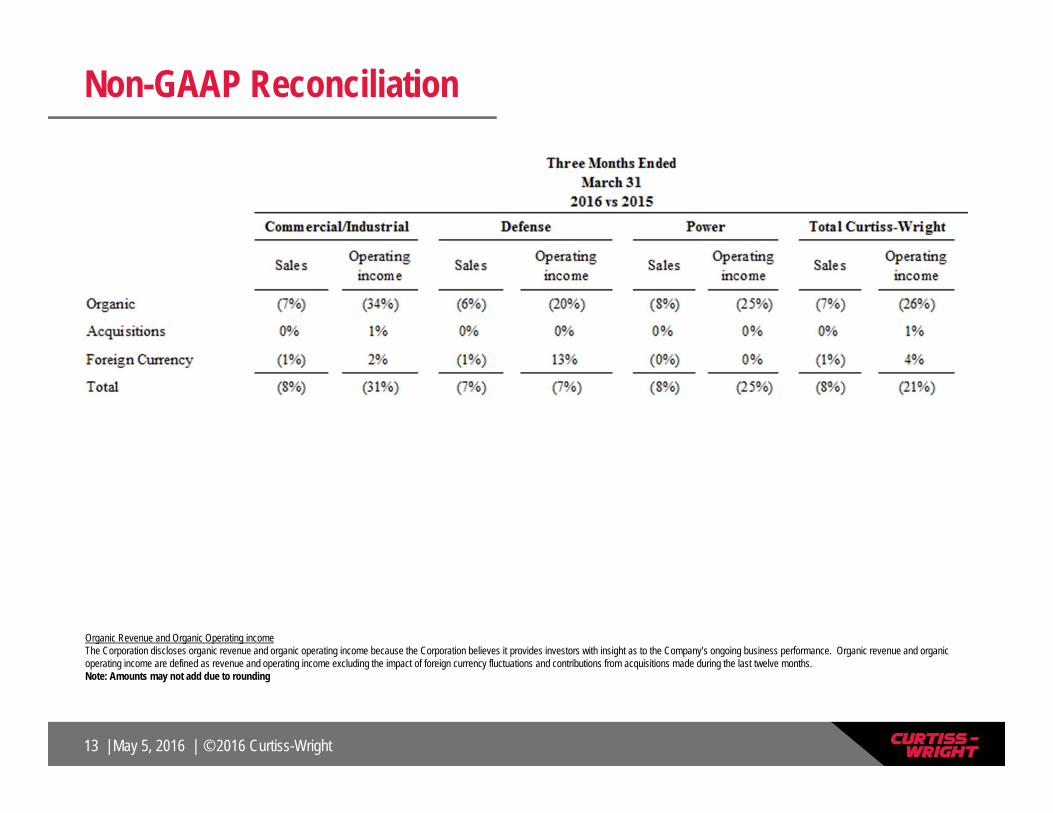
Non-GAAP Reconciliation
Organic Revenue and Organic Operating incomeThe Corporation discloses organic revenue and organic operating income because the Corporation believes it provides investors with insight as to the Company’s ongoing business performance. Organic revenue and organic operating income are defined as revenue and operating income excluding the impact of foreign currency fluctuations and contributions from acquisitions made during the last twelve months.Note: Amounts may not add due to rounding
14 | May 5, 2016 | © 2016 Curtiss-Wright
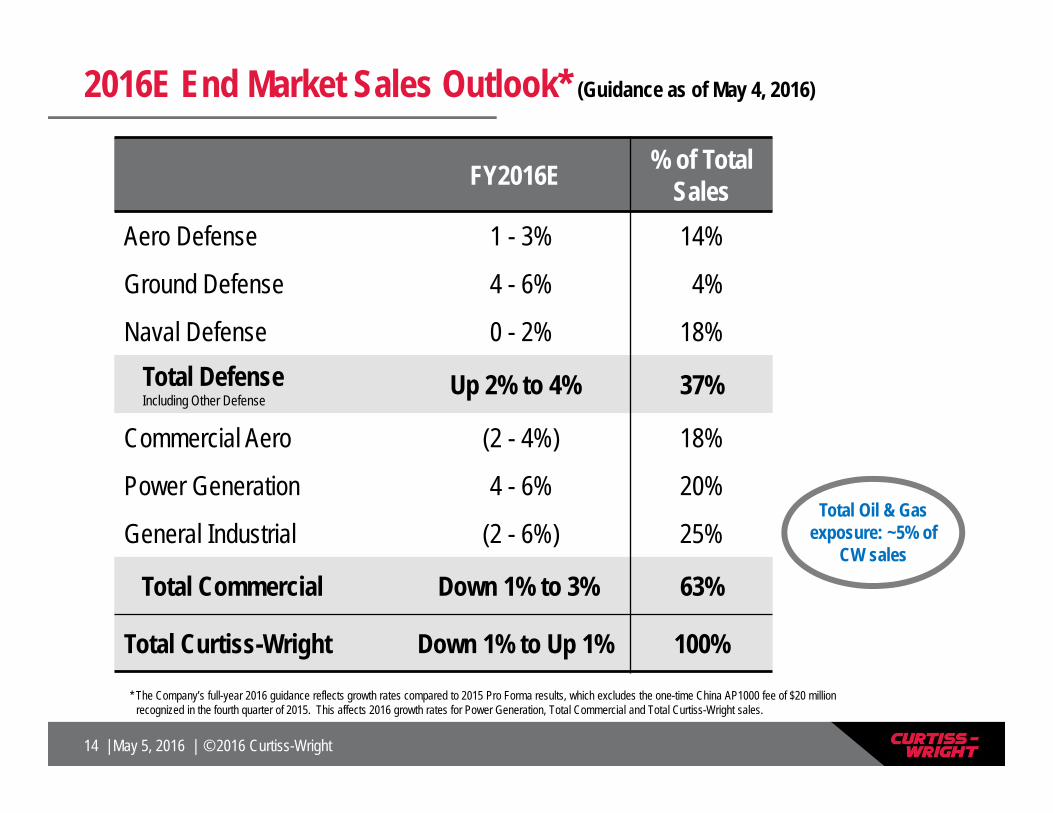
2016E End Market Sales Outlook* (Guidance as of May 4, 2016)
FY2016E % of Total Sales
Aero Defense 1 - 3% 14%
Ground Defense 4 - 6% 4%
Naval Defense 0 - 2% 18%Total DefenseIncluding Other Defense
Up 2% to 4% 37%
Commercial Aero (2 - 4%) 18%
Power Generation 4 - 6% 20%
General Industrial (2 - 6%) 25%
Total Commercial Down 1% to 3% 63%
Total Curtiss-Wright Down 1% to Up 1% 100%* The Company’s full-year 2016 guidance reflects growth rates compared to 2015 Pro Forma results, which excludes the one-time China AP1000 fee of $20 million
recognized in the fourth quarter of 2015. This affects 2016 growth rates for Power Generation, Total Commercial and Total Curtiss-Wright sales.
Total Oil & Gas exposure: ~5% of
CW sales
15 | May 5, 2016 | © 2016 Curtiss-Wright
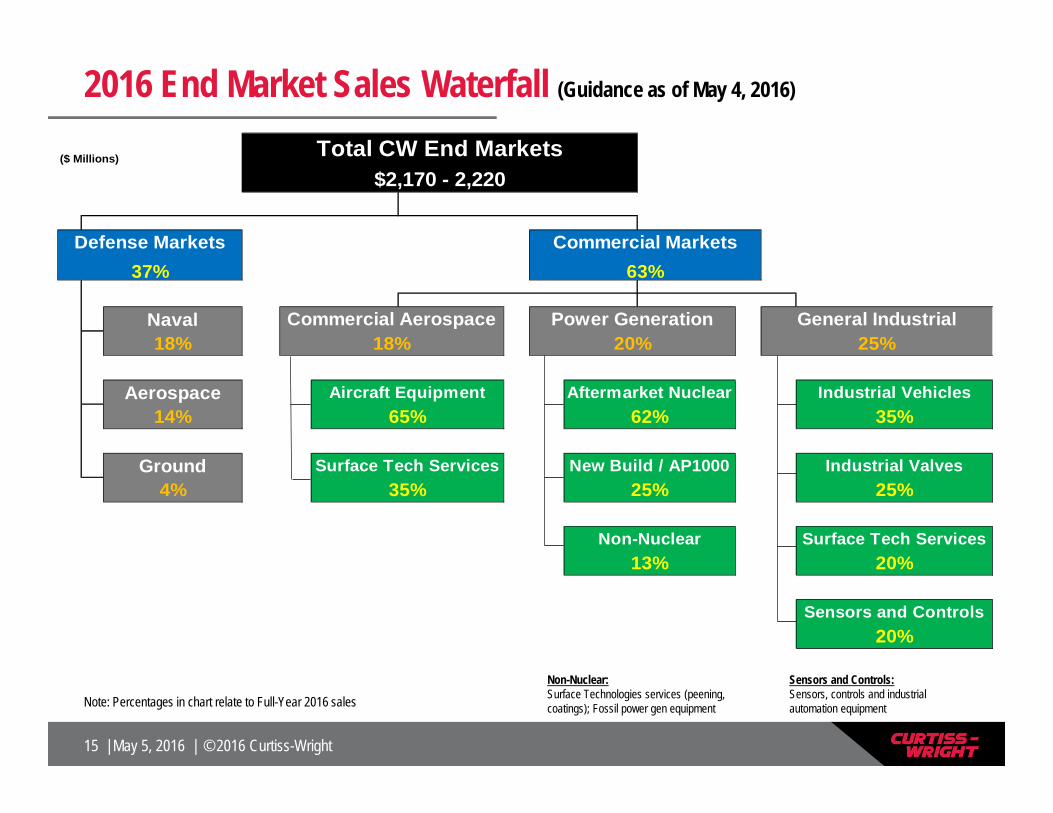
2016 End Market Sales Waterfall (Guidance as of May 4, 2016)
Sensors and Controls:Sensors, controls and industrial automation equipment
Non-Nuclear:Surface Technologies services (peening, coatings); Fossil power gen equipment
($ Millions)
Naval
Aerospace Industrial Vehicles
Ground Industrial Valves
Surface Tech Services
Sensors and Controls
37%Defense Markets
Total CW End Markets$2,170 - 2,220
35%
Commercial Aerospace
4%
18%
Aircraft Equipment65%
Surface Tech Services35%
18% 20%
63%
25%
Non-Nuclear
20%
20%
25%
14%
Power Generation
13%
Commercial Markets
Aftermarket Nuclear62%
New Build / AP1000
General Industrial25%
Note: Percentages in chart relate to Full-Year 2016 sales