Embed Size (px)
Citation preview

FOCUS ON PEOPLE | STRIVE FOR EXCELLENCE | BE ETHICAL | DELIVER RESULTS | BE GOOD STEWARDS
Operat ions ReportFEBRUARY 14, 2017

2
FORWARD-LOOKING STATEMENTSThis presentation contains forward-looking statements within the meaning of the federal securities laws. Although these statements reflectthe current views, assumptions and expectations of our management, the matters addressed herein involve certain assumptions, risks anduncertainties that could cause actual activities, performance, outcomes and results to differ materially from those indicated. Suchforward-looking statements include, but are not limited to, statements about guidance, projected or forecasted financial and operatingresults, projections regarding distributions and coverage ratio, projections regarding income taxes, operational results of our customers,results in certain basins, future rig count and volume information, objectives, project timing, expectations and intentions and otherstatements that are not historical facts. Factors that could result in such differences or otherwise materially affect our financial condition,results of operations and cash flows include, without limitation, (a) the dependence on Devon for a substantial portion of the natural gasthat we gather, process and transport, (b) developments that materially and adversely affect Devon or our other customers, (c) adversedevelopments in the midstream business may reduce our ability to make distributions, (d) our vulnerability to having a significant portion ofour operations concentrated in the Barnett Shale, (e) the amount of hydrocarbons transported in our gathering and transmission lines andthe level of our processing and fractionation operations, (f) impairments to goodwill, long-lived assets and equity method investments, (g)our ability to balance our purchases and sales, (h) fluctuations in oil, natural gas and NGL prices, (i) construction risks in our majordevelopment projects, (j) reductions in our credit ratings, (k) our debt levels and restrictions contained in our debt documents, (l) our abilityto consummate future acquisitions, successfully integrate any acquired businesses, realize any cost savings and other synergies from anyacquisition, (m) changes in the availability and cost of capital, (n) competitive conditions in our industry and their impact on our ability toconnect hydrocarbon supplies to our assets, (o) operating hazards, natural disasters, weather-related delays, casualty losses and othermatters beyond our control, (p) a failure in our computing systems or a cyber-attack on our systems, and (q) the effects of existing andfuture laws and governmental regulations, including environmental and climate change requirements and other uncertainties. These andother applicable uncertainties, factors and risks are described more fully in EnLink Midstream Partners, LP’s and EnLink Midstream, LLC’sfilings (collectively, “EnLink Midstream”) with the Securities and Exchange Commission, including EnLink Midstream Partners, LP’s and EnLinkMidstream, LLC’s Annual Reports on Form 10-K, Quarterly Reports on Form 10-Q and Current Reports on Form 8-K. Neither EnLink MidstreamPartners, LP nor EnLink Midstream, LLC assumes any obligation to update any forward-looking statements.The assumptions and estimates underlying the forecasted financial information included in the guidance information in this presentationare inherently uncertain and, though considered reasonable by the EnLink Midstream management team as of the date of its preparation,are subject to a wide variety of significant business, economic, and competitive risks and uncertainties that could cause actual results todiffer materially from those contained in the forecasted financial information. Accordingly, there can be no assurance that the forecastedresults are indicative of EnLink Midstream’s future performance or that actual results will not differ materially from those presented in theforecasted financial information. Inclusion of the forecasted financial information in this presentation should not be regarded as arepresentation by any person that the results contained in the forecasted financial information will be achieved.

3
NON-GAAP FINANCIAL INFORMATIONThis presentation contains non-generally accepted accounting principle financial measures that we refer to as gross operating margin,adjusted EBITDA, distributable cash flow, and ENLC cash available for distribution. Gross operating margin is defined as revenue less thecost of sales. Adjusted EBITDA is defined as net income (loss) plus interest expense, provision for income taxes, depreciation andamortization expense, impairment expense, unit-based compensation, (gain) loss on non-cash derivatives, (gain) loss on disposition ofassets, successful transaction costs, accretion expense associated with asset retirement obligations, reimbursed employee costs, non-cashrent and distributions from unconsolidated affiliate investments less payments under onerous performance obligation, non-controllinginterest, transferred interest adjusted EBITDA, and (income) loss from unconsolidated affiliate investments. Distributable cash flow is definedas adjusted EBITDA (as defined above), net to the Partnership, less interest expense (excluding amortization of the Tall Oak acquisitioninstallment payable discount), adjustments for the mandatorily redeemable non-controlling interest, interest rate swaps, cash taxes andother, and maintenance capital expenditures. ENLC’s cash available for distribution is defined as net income (loss) of ENLC less the netincome (loss) of ENLK, which is consolidated into ENLC’s net income (loss), plus ENLC’s (i) share of distributions from ENLK, (ii) share of EnLinkOklahoma Gas Processing, LP (together with its subsidiaries, “EnLink Oklahoma T.O.”) depreciation expense, (iii) deferred income taxexpense, (iv) interest in the adjusted EBITDA of Midstream Holdings prior to the EMH drop downs, (v) corporate goodwill impairment, (vi)acquisition transaction costs attributable to its share of the EnLink Oklahoma T.O. acquisition, and less ENLC’s interest in maintenancecapital expenditures of EnLink Oklahoma T.O. and Midstream Holdings prior to the EMH drop downs.Adjusted EBITDA of EnLink Oklahoma T.O. is defined as EnLink Oklahoma T.O.’s net income plus depreciation and amortization. AdjustedEBITDA of Midstream Holdings is defined as Midstream Holdings’ net income plus taxes, depreciation and amortization and distributionsfrom unconsolidated affiliate investments less income from unconsolidated affiliate investments. Growth capital expenditures generallyinclude capital expenditures made for acquisitions or capital improvements that we expect will increase our asset base, operating incomeor operating capacity over the long-term. Maintenance capital expenditures are capital expenditures made to replace partially or fullydepreciated assets in order to maintain the existing operating capacity of the assets and to extend their useful lives.EnLink Midstream believes these measures are useful to investors because they may provide users of this financial information withmeaningful comparisons between current results and prior-reported results and a meaningful measure of EnLink Midstream's cash flowafter satisfaction of the capital and related requirements of their respective operations. Adjusted EBITDA achievement is a primary metricused in ENLK’s credit facility and short-term incentive program for compensating its employees.Adjusted EBITDA, gross operating margin, distributable cash flow, and ENLC cash available for distribution, as defined above, are notmeasures of financial performance or liquidity under GAAP. They should not be considered in isolation or as an indicator of EnLinkMidstream’s performance. Furthermore, they should not be seen as a substitute for metrics prepared in accordance with GAAP.Reconciliations of these measures to their most directly comparable GAAP measures for the periods that are presented in this presentationare included the Appendix to this presentation. See ENLK’s and ENLC’s filings with the SEC for more information.

2016 RESULTS DELIVERED

5
Delivered on financial and operational prioritiesENLK: OUTPERFORMED GUIDANCE IN 2016
1Realized Net Loss was primarily due to non-cash impairment in 2016. 2Adjusted EBITDA is net to ENLK after non-controlling interest. 3 Growth Capital Expenditures are net to ENLK after non-controlling interest capital contribution, and reflect updated Guidance provided on November 2, 2016. 4 As defined by the ENLK credit facility. 5Distribution coverage is defined as ENLK’s Distributable Cash Flow divided by ENLK’s total distributions declared. Note: Adjusted EBITDA and ENLK’s Distributable Cash Flow are non-GAAP financial measures, which are explained on page 3.
Type Metric 2016 Guidance 2016 Actual StatusNet Income (Loss) N/A ($565MM)1 N/A
Adjusted EBITDA2 $765MM $775MM
Growth Capital Expenditures3 $425 – 490MM ~ $465MM
Maintenance Capital Expenditures $35MM ~ $30MM
Debt / Adjusted EBITDA4 < 4.0x ~ 3.70x
Distribution Coverage5 ~ 1.0x 1.03x
Net Income & Adjusted EBITDA
Capital Expenditures
Coverage & Debt to Adjusted EBITDA

6
Continued to benefit from GP structureENLC: SOLID PERFORMANCE IN 2016
1Realized Net Loss was primarily due to non-cash impairment in 2016. 2 Cash Available for Distribution is a non-GAAP financial measure. 3 Growth Capital Expenditures are net to ENLC, and reflect updates provided in 3rd Quarter 2016 Operations Report. 4 Distribution coverage is defined as ENLC’s Cash Available for Distribution divided by ENLC’s total distributions declared.
Type Metric 2016 Guidance 2016 Actual StatusNet Income (Loss) N/A ($460MM)1 N/A
Cash Available for Distribution2 ~ $205MM $202MM
Growth Capital Expenditures3 ~ $45MM ~ $45MM
Distribution Coverage4 ~ 1.1x 1.09x
Cash Taxes $2MM $0.6MM
Net Income & Cash Available for Distribution
Capital Expenditures
Coverage & Cash Taxes

7
A
B CD
Successfully completed 60 MMcf/d Lobo II processing expansion, for a total of 95 MMcf/d of processing capacity
Completed gathering expansions into New Mexico Established a JV with NGP1, enhancing financial strength and producer network
Midland Basin
Delaware Basin(JV with NGP1)
Louisiana
B
C Constructed new 100 MMcf/d Riptide processing facility,
for a total of 400 MMcf/d of processing capacity Multiple compression additions throughout footprint Expansion of crude services via construction of Greater Chickadee crude oil gathering system, which is supported by long-term, fixed-fee contracts and acreage dedications with key producers
Record gas volumes in 2016 Diversified services into gas storage and LPG exports Expansion of additional NGL services with construction of the Ascension Pipeline
D
E
E
Non-core Asset Sales2
$275 MM of non-core asset sales announced
E
Closed and integrated $1.5B3 acquisition Executed new agreement dedicating additional Newfield Exploration Company's STACK acreage Formed Cedar Cove joint venture with Kinder Morgan Inc. to provide gas gathering and processing services within an area of mutual interest in Blaine County
A Central Oklahoma
2016: SUCCESSFUL EXECUTION OF THE PLAN
1 Natural Gas Partners (NGP) 2 See EnLink Press Release dated 12/20/2016. 2 $1.5B excludes the installment payables discount within the total purchase price.
Right on track, focused on execution

2017 GUIDANCE

9
Focused on executing growth prioritiesENLK: 2017 GUIDANCE HIGHLIGHTS
2017 Guidance projects an adjusted EBITDA exit-rate of $925-950MM, an ~20% increase versus 2016 adjusted EBITDA 2017 Guidance assumes adjusted EBITDA growth to be focused in the 2H17 of the year
Expect flat 1Q17 results due to development timing
Project full-year 2017 coverage of >1.0x
Unchanged long-term distribution coverage target of 1.1-1.2x
Project flat quarterly distributions in 2017Operational metrics projected to ramp such that distribution growth could be supported at ENLK in 2018Committed to long-term distribution growth
2017 Guidance assumes preferred units do not convert in 2017Beginning in 3Q17, distributions on preferred units will be 7.5% cash pay plus PIK component
No near-term marketed equity needs
Adjusted EBITDA1 Distribution Coverage2
Distribution Growth Financing
1Adjusted EBITDA is net to ENLK after non-controlling interest. 2 Distribution coverage is defined as ENLK’s Distributable Cash Flow divided by ENLK’s total distributions declared. Note: Adjusted EBITDA and ENLK’s Distributable Cash Flow are non-GAAP financial measures, which are explained on page 3.

10
2017 ENLK GUIDANCE HIGHLIGHTS
1Adjusted EBITDA is net to ENLK after non-controlling interest. 2 Growth Capital Expenditures are net to ENLK excluding non-controlling interest capital contribution. 3 As defined by the ENLK credit facility. 4 Distribution coverage is defined as ENLK’s Distributable Cash Flow divided by ENLK’s total distributions declared. 5 Adjusted EBITDA, Gross Operating Margin, and ENLK’s Distributable Cash Flow are non-GAAP financial measures, which are explained on page 3.
2017 ENLK Guidance RangeNet Income $80 – $120Adjusted EBITDA 1,5 $815 – $885Growth Capital Expenditures 2 $505 – $645% Fee-based Gross Operating Margin 5 > 90%Debt / Adjusted EBITDA 3 (2017 exit rate) 3.75x – 4.0xDistribution Coverage 4 (2017 exit rate) > 1.0x
$MM unless otherwise noted
• Expect to exit 2017 with strong momentum; projected exit-rate Adjusted EBITDA of $925 -$950MM• 2017 Guidance reflects a reduction to adjusted EBITDA related to announced non-core asset sales announced in December 2016• Continuing to build excess coverage, creating potential distribution growth during 2018• Proceeds from asset sales and at-the-market equity issuances expected to generate sufficient capital to fund ENLK’s equity needs for 2017 Growth Capital Expenditures• Central OK expected to become EnLink’s largest and fastest growing operating region • Commodity assumptions (average): WTI $50.00/bbl, Henry Hub $3.00/MMBtu
Execute in core growth areas, preserve balance sheet

11
Continued focus on financial strengthENLK: 2017 FINANCING & LIQUIDITY
Sources of Cash ($MM)Asset Sales & ATM Equity $440 Debt Funding 385Total Sources of Cash 825Uses of Cash ($MM)ENLK Growth Capital Expenditures2 $575 2017 Tall Oak Installment Payment (waspaid in January 2017) 250Total Uses of Cash 825
• Investment grade: Investment-grade credit rating at ENLK since inception• Maturities: No debt maturities until 2019 • Leverage: 2017 exit-rate leverage ratio target of 3.75-4.0x1
• Liquidity: No near-term marketed equity needs• Significant liquidity in 2017, enhanced through Asset Sales:
– North Texas Pipeline (~$85MM closed 4Q16) – Announced sale of ~31% ownership in Howard Energy Partners ($190MM expected to close in 1Q17)
400
1,500
165550
750500 350 450
2017 CASH UTILIZATIONFINANCIAL METRICS
Debt Maturity3 ($MM)
Strong balance sheet ready for growth and execution
1 As defined by the ENLK credit facility. 2 Growth Capital Expenditures reflect the midpoint provided in 2017 Guidance, and are net to ENLK excluding non-controlling interest capital contribution. 3Installment payment obligations in 2018 are excluded from debt. $1,500MM in 2020 reflects the ENLK revolving credit facility maturity.

12
1 Includes volumes and segment profit associated with non-controlling interests. 2 Estimate for 2017. 3 Includes ~280 MMBtu/d and ~257 MMBtu/d (in 1,000s), for 2016 and 4Q16, respectively, associated with the North Texas Pipeline assets, which were divested in December 2016. 4 In evaluating YoY growth, 2016 average volumes were adjusted for NTPL sale. 5 Includes 30,000 Bbl/d from the MVC on VEX. Note: Segment profit (loss) is defined as operating income less general and administrative expenses, depreciation and amortization, gain (loss) on disposition of assets and impairments. See “Item 8. Financial Statements and Supplementary Data – Note 15 Segment Information” in ENLK’s Annual Report on Form 10-K for the year ended December 31, 2016 for further information about segment profit (loss).
Execution expected to drive growth in 201712017 SEGMENT PROFIT & VOLUME GUIDANCE
Volumes / Segment Profit 2016 4Q16 2017Guidance1%∆ 2017 Guidance vs. 2016
%∆ 2017 Guidance vs. 4Q16Avg. McfConversion2
Oklahoma (Volume in 1,000 MMBtu/d)Segment Profit ($MM) 200 53 326 63% n/aProcessing 575 584 930 62% 59% 1.23Gas Gathering & Transmission 626 644 1,000 60% 55%Texas (Volume in 1,000 MMBtu/d)Segment Profit ($MM) 416 103 418 0% n/aProcessing – Permian 282 278 410 45% 47% 1.33Gas Gathering & Transmission – Permian 245 258 380 55% 47%Processing – North TX 891 851 820 (8%) (4%) 1.16Gas Gathering & Transmission – North TX 2,3783 2,2603 1,910 (9%)4 (5%)4
Louisiana (Volume in 1,000 MMBtu/d unless noted)Segment Profit ($MM) 176 49 183 4% n/aNGL Fractionation (1,000 Bbl/d) 124 124 135 9% 9%Gas Processing 490 472 455 (7%) (4%) 1.09Gas Gathering & Transmission 1,677 1,898 1,430 (15%) (25%)Crude & Condensate (Volume in 1,000 Bbl/d)Segment Profit ($MM) 57 14 65 14% n/aTotal Volume 95 81 1655 74% 104%

13
GROWTH CAPITAL EXPENDITURES GUIDANCE
Segment Oklahoma Texas Louisiana Crude & Condensate Corporate Total Growth Capital MaintenanceCapital
$MM $360 – $460 $110 – $140 $88 – $102 $35 – $45 $17 – $23 $610 – $770 $38 – $48
2017 Projected Capital Expenditures by Segment
20%
60%
11%6%
3%
Texas OklahomaLouisana Crude & CondensateCorporate
610 - 770 505 - 64545 - 55
60 - 70
Growth CapitalExpenditures
JV PartnerContributions
ENLC's Share ofEnLink Oklahoma
T.O. Growth CapitalExpenditures
ENLK GrowthCapital
ExpendituresGuidance
2017 Net Capital Outlay Guidance ($MM) 2017 Growth Capital Expenditures Guidance
Portfolio of capital projects focused on core growth assets

14
2017 PROJECTS IN CORE GROWTH AREAS
A
B CD
Central Oklahoma Chisholm II & III 400 MMcf/d total expansion : ~$130MM Gathering and compression : ~$265MM Cedar Cove JV with Kinder Morgan Inc. : ~$10MM (net to ENLK’s interest)
A Lobo II plant expansion to full 120 MMcf/d Gathering and compression expansion :
~$60MM gross, $30MM net to ENLK
Delaware Basin(JV with NGP1)B
Midland Basin LouisianaCD Gas gathering and compression expansion : ~$55MM
Greater Chickadee crude oil gathering system : ~$25MM
Ascension NGL pipeline JV : ~$40MM gross, $20MM net to ENLK (JV with Marathon Petroleum Corp.) NGL bolt-on projects : ~$40MM
Top tier customers drive capital-efficient growth in core operating areas
1 Natural Gas Partners (NGP)

15
Leveraged to ENLK upside, capitalizing on growthENLC: 2017 GUIDANCE HIGHLIGHTS
2017 Guidance represents midpoint growth of ~10%, YoY 2016Throughout 2017, project consistent growth in cash available for distribution
Project full-year distribution coverage to range 1.1-1.2x4Q17 exit-rate coverage trajectory expected to drive strong position into 2018
Throughout 2017, project flat distributions, with excess coverage buildingIn light of excess coverage, there is potential to resume distribution growth at ENLC before ENLK
On conversion to common, preferred units positively impact IDRs
Project cash income taxes of approximately $5MM per year in 2017-2019
Cash Available for Distribution1 Distribution Coverage2
Distribution Growth Cash Taxes
1 Cash Available for Distribution is a non-GAAP financial measure, which is explained on page 3. 2 Distribution coverage is defined as ENLC’s Cash Available for Distribution divided by total distributions declared.

16
GP / LP structure enhances financial flexibility2017 ENLC GUIDANCE HIGHLIGHTS
1 Cash Available for Distribution is a non-GAAP financial measure, which is explained on page 3. 2 Distribution coverage is defined as ENLC’s Cash Available for Distribution divided by total distributions declared.
2017 ENLC Guidance RangeNet Income $45 – $105Cash Available for Distribution 1 $215 – $225Growth Capital Expenditures $60 - $70Cash Income Taxes ~$5Distribution Coverage 2 (2017 exit rate) 1.1x – 1.2x
$MM unless otherwise noted
• Cash Available for Distribution mid-point of $220MM reflects attractive YoY growth• Project to exit 2017 with distribution coverage of 1.1x – 1.2x assuming flat distributions• Committed to long term distribution growth• Potential to resume ENLC distribution growth before ENLK due to excess coverage at ENLC• Commodity assumptions (average): WTI $50.00/bbl, Henry Hub $3.00/MMBtu

17
ENLC TAX OUTLOOK: 2017 – 2019 HORIZON
LP and GP Distributions received from ENLKDistributions received from ENLK Incentive Distribution Rights (IDRs)
Distributions from EnLink Oklahoma T.O.
Given ENLC’s current tax profile and outer year assumptions, it is forecasted that LP and GP distributions received from ENLK will average a tax shield of approximately 80% for 2017, 2018 and 2019
ENLC receives an annual special allocation of taxable income with respect to the IDR payouts from ENLK such that the effective tax shield is 0%
ENLC owns an approximate interest of 16% in EnLink Oklahoma T.O. The tax shield on distributions from this ownership interest is expected to be, on average, significantly above 100% for 2017, 2018, and 2019
No federal cash taxes estimated from 2017 to 2019Estimated state income taxes of ~$5MM per year from 2017 to 2019
ENLC has three principal sources of taxable income or loss

Operat ions Overv iew
18

19
Continued drilling success is driving significant activity in early 2017RIG ACTIVITY IN OUR GROWTH BASINS
1 See October 2016 EnLink Operations Report. 2 As of December 30, 2016 according to Drilling Info. 3 As of February 6, 2017 according to Drilling Info. Includes rigs on assets with partial ownership.
Acreage dedicated to G&P systemCentral Oklahoma
Acreage dedicated to G&P systemAcreage dedicated to Chickadee
Midland Basin
• Strong drilling activity in key growth basins supports continued investment • 31 rigs currently operating on acreage dedicated to EnLink• Expect an average of around 30 rigs operating in 2017
Growth Basin Rig SynopsisDelaware Basin
• The above chart excludes rigs with volume commitments

20
Expanding strategic position in the STACKOKLAHOMA
1 According to Drilling Info as of January 6, 2017. Assets above include those with partial ownership.
Rig Count1
17rigs
Cedar Cove JV dedicated acreage
21
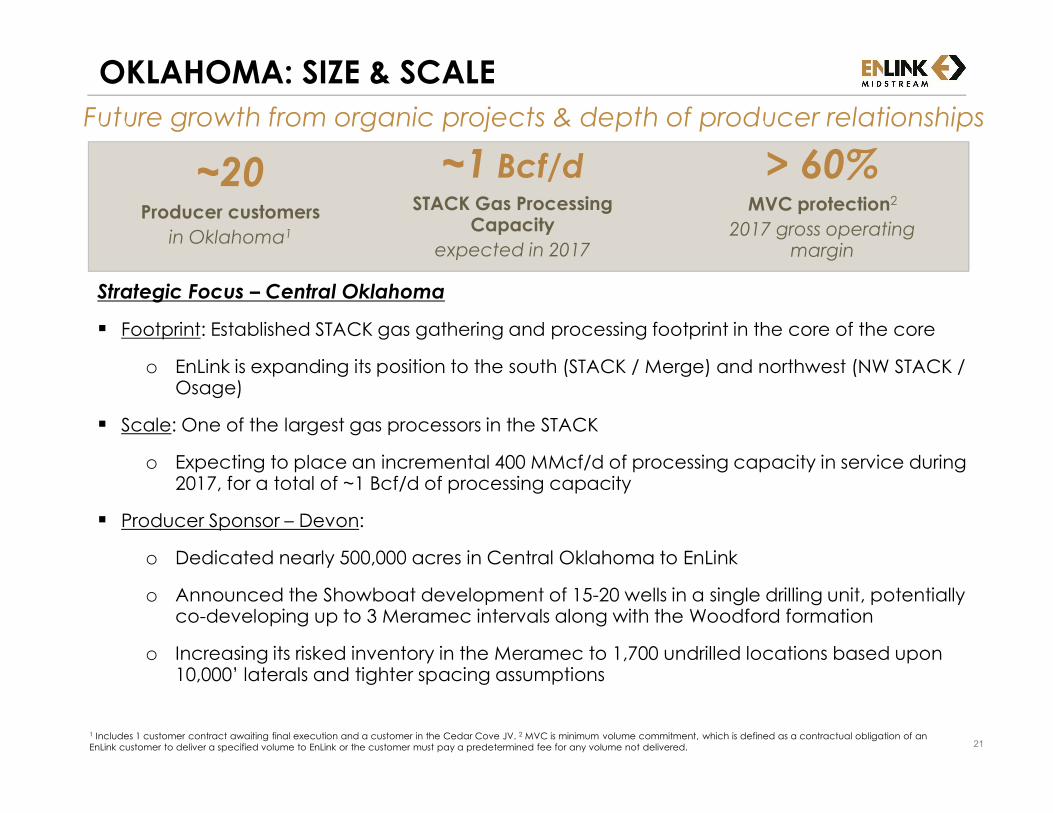
Strategic Focus – Central Oklahoma Footprint: Established STACK gas gathering and processing footprint in the core of the core
o EnLink is expanding its position to the south (STACK / Merge) and northwest (NW STACK / Osage) Scale: One of the largest gas processors in the STACK
o Expecting to place an incremental 400 MMcf/d of processing capacity in service during 2017, for a total of ~1 Bcf/d of processing capacity Producer Sponsor – Devon:
o Dedicated nearly 500,000 acres in Central Oklahoma to EnLink o Announced the Showboat development of 15-20 wells in a single drilling unit, potentially co-developing up to 3 Meramec intervals along with the Woodford formationo Increasing its risked inventory in the Meramec to 1,700 undrilled locations based upon 10,000’ laterals and tighter spacing assumptions
Future growth from organic projects & depth of producer relationshipsOKLAHOMA: SIZE & SCALE
1 Includes 1 customer contract awaiting final execution and a customer in the Cedar Cove JV. 2 MVC is minimum volume commitment, which is defined as a contractual obligation of an EnLink customer to deliver a specified volume to EnLink or the customer must pay a predetermined fee for any volume not delivered.
~20Producer customers
in Oklahoma1
> 60%MVC protection2
2017 gross operating margin
~1 Bcf/dSTACK Gas ProcessingCapacity
expected in 2017

22
Diverse assets delivering services across products & the value chainMIDLAND BASIN
1 According to Drilling Info as of January 6, 2017. Assets above include those with partial ownership.
13rigs
Rig Count1
2Crude System rigs
11Gas System rigs

23
Strategic Focus Footprint: Two distinct asset platforms offering gas and crude gathering, and gas processing
Established gas gathering and processing footprint in the core of the core o Acreage dedications in counties where producers have continuously increased rig activity and developed acreageo Scale:
o 400 MMcf/d of interconnected gas processing capacityo 100 MMcf/d capital efficient potential Riptide processing expansion provides future G&P growth
Diversification in the Basin: Greater Chickadee crude gathering & transportation projecto Leverages LPC trucking operationso Expected to be in full-service 1Q17o Benefits from long-term, fee-based contracts with investment-grade customers
Diversifying producer services from a core gas operating positionMIDLAND BASIN: ESTABLISHED FOOTPRINT
1POP is a term used for percent of proceed contracts, which are broadly defined to include fees for service that are dependent upon the price received for the product at the time of sale. This is a point in time analysis, and was completed in conjunction with 2017 Guidance.
~20G&P producer customers
~400 MMcf/dGas Processing Capacity
~35%POP contracts1
G&P gross operatingmargin in 2017

24
Serving strong producers, expanding strategic footprintDELAWARE BASIN: LOBO SYSTEM
1 According to Drilling Info as of January 6, 2017. Assets above include those with partial ownership.
1 Rig on Dedicated Acreage
Rig Activity1
8 Rigs Running on acreage with volume commitments to the Lobo System

25
Serving strong producers, expanding strategic footprint
1 Natural Gas Partners (NGP). Note: All Information on this slide is gross.
Footprint: Developing asset base in three key counties Scale: Expanding processing capacity coincides with expected producer volume ramp and demonstrates EnLink’s capital efficient planning
o 95 MMcf/d gas processing capacity currently in-serviceo 60 MMcf/d additional gas processing capacity expansion at Lobo II facility to be operational in 2Q17
Customers and Contracts: o Long-term, fee-based contracts in place with multiple producerso Acreage dedication associated with two producerso Newly executed commercial contract increases volumes committed to Lobo gathering and processing system
Strategic Partnership: 50% partnership with NGP1 provides enhanced relationship network, financial flexibility and project de-risking
Strategic Focus
DELAWARE BASIN: DELIBERATE GROWTH
155 MMcf/dGas Processing Capacityto be operational in 2017

26
Size and scale in mature basin provides stabilityNORTH TEXAS
• Natural Gas Premier gas asset ~4,000 miles of pipeline ~2.0 Bcf of gas gathering capacity 4 processing plants with ~1.1 Bcf/d
capacity• NGLs
~35 miles of pipelines 1 fractionator with ~15,000 Bbl/d
of y-grade capacity 2 MMbbls of storage Rail and truck terminal for loading and unloading

27
Strategic Focus Footprint: Established gas gathering and processing footprint in the core of the basin Scale: The largest gas processor in the Barnett, with ~1.1 Bcf of processing capacity Strategic Cash Flow: Strong, stable cash flows in near to mid-term provide foundation to invest in core growth plays Devon Energy2 announced up to $50MM in 2017 Barnett capital expenditures, with spend to
o focus on optimizing base production & further de-risking development activity,o test completion technologies to reduce horizontal refrac costs to $700,000 per well, a 25% improvement from previous estimates,o initiate a drilling pilot of 5 to 10 wells that will leverage modern drilling and completion technology in this legacy field The success of these efforts could lead to additional capital being allocated to the Barnett during 2017
Strong 2017 cash generationNORTH TEXAS: ANCHOR POSITION
1 MVC is minimum volume commitment, which is defined as a contractual obligation of an EnLink customer to deliver a specified volume to EnLink or the customer must pay a predetermined fee for any volume not delivered. 2 Please see the Devon Energy Investor website for recent presentations. Note: Gross operating margin is a non-GAAP financial measure and is explained on page 3.
> 100Producer Customersin Barnett
~ 1.1 BcfTotal Processing Capacity
> 80%Gross Operating Margin Protected by MVCs1
in 2017

28
Franchise position serving growing demand marketsLOUISIANA
• Natural Gas Premier gas asset position with ~3,100
miles of pipeline 6 processing plants with ~1.9 Bcf/d
capacity, ~1 Bcf/d operational ~12 Bcf of working natural gas storage
capacity• NGLs ~720 miles of pipelines 4 fractionators (including ~175,000 Bbl/d of y-grade fractionation capacity) ~3.9 MMbbls of storage
Select Customers

29
Franchise position serving growing demand marketsLOUISIANA: ADVANTAGED ASSET LOCATION
1 These opportunities are not currently under construction and are included for illustrative purposes only.
Two Distinct Premier Asset Platforms Steady, Slow Growth in Near-term Step-change Long-Term Growth Opportunities1
NGL fractionation, transportation, storage &distribution system from Mont Belvieu supply region to demand markets throughout southern LA Gas gathering, processing, transportation, & storage network supplying rising demand markets such as LNG, industrial, and power
Expanding NGL presence with Ascension pipeline (to be operational 2Q 2017) Recently reinstated 12 Bcf of gas storage, growing financial contribution Commenced LPG export services Latent capacity in system allows capital-efficient growth as demand increases
Inter-basin connectivity with EnLink controlled liquids from Central Oklahoma Expansion of NGL transportation, storage, and supply network Conversion of duplicative Louisiana gas pipelines to liquids transportation Connection to large, new sources of demand such as LNG operators Positively positioned to participate in dynamic changing gas flow patterns in East Texas and West Louisiana

APPENDIX

31
Intentional business model, confident in growthPOSITIONED FOR ONGOING SUCCESS
1 Expected for the twelve months 2017. 2 Credit rating is defined by internal or external metrics. 3 As defined by the credit facility. 4 Distribution coverage is defined as distributable cash flow or cash available for distribution divided by total distributions made. 5 Represents the full borrowing amount of the revolving credit facilities.Adjusted EBITDA and gross operating margin are non-GAAP financial measures, which are explained on page 3.
Further develop and extend our strategic asset portfolio throughout our positions in top U.S. supply basins and demand regions Provide integrated midstream solutions across products, basins and services Continue execution in 2017 based upon foundation of strength and confidence solidified in 2016 Strong producer sponsor in Devon; quality partners across our business > 90% fee-based gross operating margin1; ~ 55% of gross operating margin backed by MVCs or firm contracts1 ~90% of top 50 customers hold investment-grade credit ratings2
Financial Tenets: (1) Remain Investment Grade; (2) Long-term target Debt/Adj. EBITDA of 3.5x - 4.0x3; (3) Target annual distribution coverage of at least 1.1x at ENLK and ENLC4 ENLK – Investment Grade MLP with ample liquidity via the $1.5B revolving credit facility5 ENLC – Ample liquidity via the $250MM revolving credit facility5
TBD EXECUTIONof the plan
TBD STRONGfinancial position
TBD PROVENbusiness model

32
Diversified across products, geographies, & servicesPROVEN BUSINESS MODEL
Note: Assets above include those with partial ownership. Gathering is defined as a pipeline that transports hydrocarbons from a production facility to a transmission line. Transportation is defined to include pipelines connected to gathering lines or a facility.
Midland &Delaware Central OK Louisiana North Texas
Gas Se
rvices Gas gathering / compression ● ● ● ●
Gas processing ● ● ● ●Gas transportation ● ●Gas storage ● ●
NGL S
ervice
s NGL gathering ● ●NGL fractionation ● ● ●NGL transportation ● ●NGL storage ● ●LPG Exports ●
Crude
& Co
nden
sate Crude/condensate gathering ● ●
Crude/condensate storage ● ● ●Crude/Condensate transportation ●Condensate stabilization ● ● ●
Financial stability further enhanced by expanding business diversification
Legacy Operations2015-16 New or Significantly Expanded2017+ Future Expected Development

33
SEGMENT VOLUMES1
1 Includes volumes associated with non-controlling interests.
Oklahoma Texas
Louisiana Crude & Condensate
617 619 625644
1Q16 2Q16 3Q16 4Q16
570 576 570 584
1Q16 2Q16 3Q16 4Q16
929 895 889 851
270 299 283 278
1Q16 2Q16 3Q16 4Q16
North TX Permian
2,525 2,402 2,325 2,260
218 249 255 258
1Q16 2Q16 3Q16 4Q16
North TX Permian
1,475 1,576 1,754 1,898
518 484 488 472
1Q16 2Q16 3Q16 4Q16
120 126 125 124
1Q16 2Q16 3Q16 4Q16
Gathering & Transmission (1,000 MMBtu/d) Processing(1,000 MMBtu/d) Gathering & Transmission (1,000 MMBtu/d) Processing(1,000 MMBtu/d)
G&T and Processing (1,000 MMBtu/d) NGL Fractionation(1,000 bbls/d)
66 52 51 58
3219 3 4
1517
15 18
1210 4 1
1Q16 2Q16 3Q16 4Q16
Crude Mktg. ORVSouth TX West TX 125
9873 81
1Q16 2Q16 3Q16 4Q16
Crude & Condensate Volumes (1,000 bbls/d) Total(1,000 bbls/d)

34Note: Segment profit (loss) is defined as operating income less general and administrative expenses, depreciation and amortization, gain (loss) on disposition of assets and impairments. See “Item 8. Financial Statements and Supplementary Data – Note 15 Segment Information” in ENLK’s Annual Report on Form 10-K for the year ended December 31, 2016 for further information about segment profit (loss).
Oklahoma Texas
Louisiana Crude & Condensate
14.8 13.615.1 13.7
1Q16 2Q16 3Q16 4Q16
46.4 47.753.2 52.7
1Q16 2Q16 3Q16 4Q16
95.9 90.2 90.2 89.0
11.0 12.9 13.0 14.2
106.9 103.1 103.2 103.2
1Q16 2Q16 3Q16 4Q16
North TX Permian
24.8 28.9 33.5 32.612.8 13.1 13.9 16.337.6 42.0 47.4 48.9
1Q16 2Q16 3Q16 4Q16
NGL Gas (G&T and Processing)
SEGMENT PROFIT (in $MM)

35
2016 SEGMENT PROFIT & VOLUMES
Note: Gross operating margin is a non-GAAP financial measure and is explained on page 3. Includes volumes associated with non-controlling interests. See “Item 8. Financial Statements and Supplementary Data – Note 15 Segment Information” in ENLK’s Annual Report on Form 10-K for the year ended December 31, 2016 for further information about segment profit (loss).
Three Months Ended Twelve Months EndedMarch 31,
2016June 30,
2016September
30, 2016December 31, 2016 December 31, 2016
TexasSegment Profit (in $ millions) $106.9 $103.1 $103.2 $103.2 $416.4Gross Operating Margin (in $ millions) $146.2 $146.1 $146.1 $146.5 $584.9Gathering and Transportation (MMBtu/d) 2,743,400 2,651,000 2,579,500 2,518,100 2,622,600Processing (MMBtu/d) 1,198,100 1,194,200 1,172,200 1,128,200 1,173,100LouisianaSegment Profit (in $ millions) $37.6 $42.0 $47.4 $48.9 $175.9Gross Operating Margin (in $ millions) $60.9 $67.4 $70.9 $73.3 $272.5Gathering and Transportation (MMBtu/d) 1,475,000 1,576,200 1,754,400 1,897,600 1,676,600Processing (MMBtu/d) 517,800 483,600 487,900 472,100 490,300NGL Fractionation (Gals/d) 5,020,200 5,303,700 5,259,400 5,204,300 5,197,100OklahomaSegment Profit (in $ millions) $46.4 $47.7 $53.2 $52.7 $200.0Gross Operating Margin (in $ millions) $59.2 $59.5 $65.8 $67.6 $252.1Gathering and Transportation (MMBtu/d) 617,000 619,300 624,500 644,200 626,300Processing (MMBtu/d) 569,700 575,600 570,100 584,100 574,900Crude & CondensateSegment Profit (in $ millions) $14.8 $13.6 $15.1 $13.7 $57.2Gross Operating Margin (in $ millions) $37.6 $33.5 $34.1 $33.3 $138.5Crude Oil Handling (Bbls/d) 124,600 97,700 72,800 81,200 94,000Brine Disposal (Bbls/d) 3,600 3,300 3,700 3,800 3,600

36
Stability and growth exhibited during a volatile yearKEY FINANCIAL METRIC SUMMARYIn $millions unless otherwise noted 1Q16 2Q16 3Q16 4Q16 2016EnLink Midstream Partners (ENLK)Net Income (Loss) Attributable to ENLK $(560.4) $5.0 $18.8 $(28.6) $(565.2)Net Cash Provided by Operating Activities $189.1 $110.5 $209.6 $153.4 $662.6Adjusted EBITDA1 $195.0 $187.4 $197.5 $195.0 $774.6Debt to Adjusted EBITDA (x) 2 ~3.8x ~3.9x ~3.75x ~3.70x ~3.70xDistribution Coverage (x) 3 1.09x 1.03x 1.04x 0.98x 1.03xDistribution per Unit ($/unit) $0.390 $0.390 $0.390 $0.390 $1.560
EnLink Midstream LLC (ENLC)ENLC Interest in Net Income (Loss) $(310.9) $(3.8) $(7.7) $(0.6) $(323.0)Cash Available for Distribution 4 $48.4 $49.8 $51.1 $52.4 $201.7Distribution Coverage (x) 5 1.04x 1.07x 1.10x 1.13x 1.09xDistribution per Unit ($/unit) $0.255 $0.255 $0.255 $0.255 $1.020
1Adjusted EBITDA is net to ENLK after non-controlling interest. 2 As defined by the ENLK credit facility. 3 ENLK’s Distribution Coverage is defined as ENLK’s Distributable Cash Flow divided by ENLK’s total distributions declared. 4 Cash Available for Distribution is a non-GAAP financial measure, which is explained on page 3. 5 ENLC’s Distribution coverage is defined as ENLC’s Cash Available for Distribution divided by total distributions declared. Note: Adjusted EBITDA and ENLK’s Distributable Cash Flow are non-GAAP financial measures, which are explained on page 3 and are included in reconciliations in the Appendix.

37
7Fractionators
260 Mbbl/dFractionationCapacity
Integrated across products, basins, & servicesTHE RIGHT ASSET PLATFORM
Note: Assets above include those with partial ownership.
20ProcessingFacilities
~4.3 Bcf/dProcessingCapacity
~11k Milesof Pipeline
~1,450 EmployeesOperating assets in 7 states
130 Mbbl/dNGL pipelineCapacity

38
ORGANIZATIONAL CHART
1 Represents TPG Capital and funds managed by the Merchant Banking Division of Goldman Sachs2 Represents current Incentive Distribution Rights (IDR) split level plus GP ownership3 Information on this slide is as of December 31, 2016
Devon Energy Corp.NYSE: DVN(BBB+/BBB/Ba1)PublicUnitholders
EnLink Midstream, LLCGeneral PartnerNYSE: ENLC
EnLink Midstream Partners, LPMaster Limited PartnershipNYSE: ENLK(BBB-/BBB-/Ba2)
EnLink Oklahoma Gas Processing, LP
~ 64% ~ 36%
~ 84%
~ 0.4% GP~ 22% LP~ 24% LP ~ 40% LP
ENLC owns 100% of IDRs
IDR SplitsDist. / Q Split Level2
< $0.2500 0.4% / 99.6%< $0.3125 13.4% / 86.6%< $0.3750 23.4% / 76.6%> $0.3750 48.4% / 51.6%
TPG Capital & Goldman Sachs1Preferred Equity Owners
~ 13% LP
~ 16%

39
All amounts in millions Low Mid-point HighNet income (2) $80 $100 $120
Interest expense 176 176 176Depreciation and amortization 570 580 590(Income) loss from unconsolidated affiliate investments (7) (9) (11)Distribution from unconsolidated affiliate investments 5 10 15Unit-based compensation 40 43 46Income taxes 5 5 5
(18) (18) (18)Other (3) 4 4 4
Adjusted EBITDA before non-controlling interest $855 $891 $927Non-controlling interest share of adjusted EBITDA (4) (40) (41) (42)
Adjusted EBITDA, net to EnLink Midstream Partners, LP $815 $850 $885Interest expense (176) (176) (176)Amortization of Tall Oak installment payable discount included in interest expense (5) 26 26 26Convertible Preferred Distribution (32) (32) (32)Cash taxes and other (5) (5) (5)Maintenance capital expenditures (38) (43) (48)
Distributable cash flow $590 $620 $650
2017 Outlook
term liabilities
(1) The forecast net income guidance for the year ended December 31, 2017 excludes the potential impact of gains or losses on derivative activity, gains or losses on disposition of assets, impairment expense, gains or losses as a result of legal settlements, gains or losses on extinguishment of debt, and the financial effects of future acquisitions. The exclusion of these items is due to the uncertainty regarding the occurrence, timing and/or amount of these events.(2) Net income includes estimated net income attributable to ENLK's non-controlling interest in (i) ENLC's 16% share of net income from EnLink Oklahoma T.O., (ii) NGP's 49.9% share of net income from the Delaware Basin JV, and (iii) Marathon's 50% share of net income from the Ascension JV.(3) Includes estimated accretion expense associated with asset retirement obligations and estimated non-cash rent, which relates to lease incentives pro-rated over the lease term.(4) Non-controlling interest share of Adjusted EBITDA includes estimates for Adjusted EBITDA from (i) ENLC’s 16% share of EnLink Oklahoma T.O., (ii) NGP’s 49.9% share of the Delaware Basin JV, and (iii) Marathon's 50% share of adjusted EBITDA from the Ascension JV.(5) Amortization of the Tall Oak installment payable discount is considered non-cash interest under our credit facility since the payment under the payable is consideration for the acquisition of the Tall Oak assets.
EnLink Midstream does not provide a reconciliation of forward-looking Adjusted EBITDA to Net Cash Provided by Operating Activities because the companies are unable to predict with reasonable certainty changes in working capital, which may impact cash provided or used during the year. Working capital includes accounts receivable, accounts payable and other current assets and liabilities. These items are uncertain and depend on various factors outside the companies' control.
ENLK FORWARD LOOKING RECONCILIATIONForecast ENLK Net Income to Adjusted EBITDA and Distributable Cash Flow 1

40
Texas Louisiana OklahomaCrude and
Condensate Corporate TotalsOperating income (loss) (1) 272.6$
General and administrative expenses 138.0 Depreciation and amortization 580.5
Segment profit (loss) (2) 417.7$ 183.2$ 325.6$ 64.6$ -$ 991.1$
For the Year Ended December 31, 2017
(1) The projected operating income guidance excludes the potential impact of gains or losses on derivative activity, gains or losses on disposition of assets, impairment expense, gains or losses as a result of legal settlements, gains or losses on extinguishment of debt and the financial effects of future acquisitions. The exclusion of these items is due to the uncertainty regarding the occurrence, timing and/or amount of these events.(2) Segment profit (loss) is defined as operating income less general and administrative expenses, depreciation and amortization, (gain) loss on disposition of assets and impairments. Segment profit (loss) includes non-cash compensation expenses reflected in operating expenses.
See “Item 8. Financial Statements and Supplementary Data – Note 15 Segment Information” in ENLK’s Annual Report on Form 10-K for the year ended December 31, 2016 for further information about segment profit (loss).
Forecast Reconciliation of Operating Income (Loss) to Segment Profit (Loss)ENLK FORWARD LOOKING RECONCILIATION
All amounts in millions

41
(1) The forecast net income Guidance for the year ended December 31, 2017 excludes the potential impact of gains or losses on derivative activity, gains or losses on disposition of assets, impairment expense, gains or losses as a result of legal settlements, gains or losses on extinguishment of debt, and the financial effects of future acquisitions. The exclusion of these items is due to the uncertainty regarding the occurrence, timing and/or amount of these events.(2) Net income of ENLC includes estimated net income attributable to ENLC's non-controlling interest in ENLK.(3) Represents quarterly distributions estimated to be paid to ENLC by ENLK during 2017.(4) Represents ENLC's estimated stand-alone deferred taxes.(5) Maintenance capital expenditures attributable to ENLC’s share of EnLink Oklahoma T.O. are projected to be immaterial during 2017.
Forecast ENLC Net Income to ENLC Cash Available for Distribution 1ENLC FORWARD LOOKING RECONCILIATIONAll amounts in millions
Low Mid-point HighNet income of ENLC (2) $45 $75 $105
Less: Net income attributable to ENLK 57 85 113Net loss of ENLC excluding ENLK ($12) ($10) ($8)
ENLC's share of distributions from ENLK (3) 199 199 199ENLC's interest in EnLink Oklahoma T.O. depreciation 16 17 18ENLC deferred income tax expense (4) 12 14 16Maintenance capital expenditures (5) 0 0 0
ENLC cash available for distribution $215 $220 $225
2017 Outlook

42
Year Ended3/31/2016 6/30/2016 9/30/2016 12/31/2016 12/31/2016
Net cash provided by operating activities 189.1$ 110.5$ 209.6$ 153.4$ 662.6$ Interest expense, net (1) 31.4 32.8 34.5 36.6 135.3 Current income tax 1.0 (2.0) 2.6 0.3 1.9 Distributions from unconsolidated affiliate investments in excess of earnings (2) 9.2 5.6 4.1 3.0 21.9 Other (3) 4.5 0.9 1.0 (2.2) 4.2
Changes in operating assets and liabilities which used (provided) cash:Accounts receivable, accrued revenues, inventories and other (46.9) 61.3 (0.2) 93.5 107.7 Accounts payable, accrued gas and crude oil purchases and other (4) 7.5 (19.6) (50.8) (87.2) (150.1)
Adjusted EBITDA before non-controlling interest 195.8$ 189.5$ 200.8$ 197.4$ 783.5$ Non-controlling interest share of adjusted EBITDA (5) (0.8) (2.1) (3.3) (2.7) (8.9)
Adjusted EBITDA, net to EnLink Midstream Partners, LP 195.0$ 187.4$ 197.5$ 194.7$ 774.6$ Interest expense (43.7) (46.2) (48.0) (50.2) (188.1)
12.4 13.3 13.3 13.3 52.3 Non-cash adjustment for mandatorily redeemable non-controlling interest 0.2 0.1 - - 0.3 Interest rate swap (7) - - 0.4 - 0.4 Cash taxes and other (1.0) 2.0 (2.6) (0.3) (1.9) Maintenance capital expenditures (7.5) (5.7) (6.2) (11.1) (30.5)
Distributable cash flow 155.4$ 150.9$ 154.4$ 146.4$ 607.1$
Amortization of EnLink Oklahoma T.O. installment payable discount included in interest expense (6)
Three Months Ended
RECONCILIATION OF NET CASH PROVIDED BY OPERATING ACTIVITIES TO ADJUSTED EBITDA AND DISTRIBUTION CASH FLOW OF ENLK
(1) Net of amortization of debt issuance costs, discount and premium, and valuation adjustment for mandatorily redeemable non-controlling interest included in interest expense but not included in net cash provided by operating activities.(2) Distributions for the three months ended September 30, 2016 do not include $32.7 million of distributions received from HEP during the third quarter of 2016 attributable to the redemption of preferred units in HEP that ENLK previously held. The preferred units were issued to us by HEP during the second and third quarters of 2016 for contributions of $29.5 million and $3.2 million, respectively.(3) Includes the following: reimbursed employee costs from Devon and LPC, which are costs reimbursed to us by the previous employer in connection with the acquisition or merger; and successful acquisition transaction costs, which we do not consider in determining adjusted EBITDA because operating cash flows are not used to fund such costs.(4) Net of payments under onerous performance obligation offset to other current and long-term liabilities.(5) Includes ENLC’s 16% share of adjusted EBITDA from EnLink Oklahoma T.O., NGP’s 49.9% share of adjusted EBITDA from the Delaware Basin JV and the non-controlling interest share of adjusted EBITDA from the E2 entities.(6) Amortization of the EnLink Oklahoma T.O. installment payable discount is considered non-cash interest under our credit facility since the payment under the payable is consideration for the acquisition of the EnLink Oklahoma T.O. assets.(7) During the third quarter of 2016 and second quarter of 2015, ENLK entered into interest rate swap arrangements to mitigate ENLK's exposure to interest rate movements prior to ENLK's note issuances. The gain on settlement of the interest rate swaps was considered excess proceeds for the note issuance and is therefore excluded from distributable cash flow.
All amounts in millions

43
Year Ended3/31/2016 6/30/2016 9/30/2016 12/31/2016 12/31/2016
Net income (loss) of ENLC (871.3)$ 1.2$ 11.1$ (29.2)$ (888.2)$ Less: Net income (loss) attributable to ENLK (560.4) 5.0 18.8 (28.6) (565.2)
Net loss of ENLC excluding ENLK (310.9)$ (3.8)$ (7.7)$ (0.6)$ (323.0)$ ENLC's share of distributions from ENLK (1) 48.9 49.2 49.4 49.5 197.0 ENLC's interest in EnLink Oklahoma T.O. depreciation 3.2 3.6 3.6 3.9 14.3 ENLC deferred income tax expense (2) (0.8) 0.5 5.0 (1.9) 2.8 Maintenance capital expenditures (3) - - - (0.1) (0.1) ENLC corporate goodwill impairment 307.0 - - - 307.0 Other items (4) 1.0 0.3 0.8 1.6 3.7
ENLC cash available for distribution 48.4$ 49.8$ 51.1$ 52.4$ 201.7$
Three Months Ended
RECONCILIATION OF NET INCOME OF ENLC TO ENLC CASH AVAILABLE FOR DISTRIBUTION
(1) Represents distributions declared by ENLK and to be paid to ENLC on February 11, 2017 and distributions paid by ENLK to ENLC on November 11, 2016, August 11, 2016 and May 12, 2016.(2) Represents ENLC's stand-alone deferred taxes.(3) Represents ENLC’s share of EnLink Oklahoma T.O.’s maintenance capital expenditures during 2016.(4) Represents transaction costs attributable to ENLC’s share of the acquisition of EnLink Oklahoma T.O. and other non-cash items not included in cash available for distributions.
All amounts in millions
44
Year Ended3/31/2016 6/30/2016 9/30/2016 12/31/2016 12/31/2016
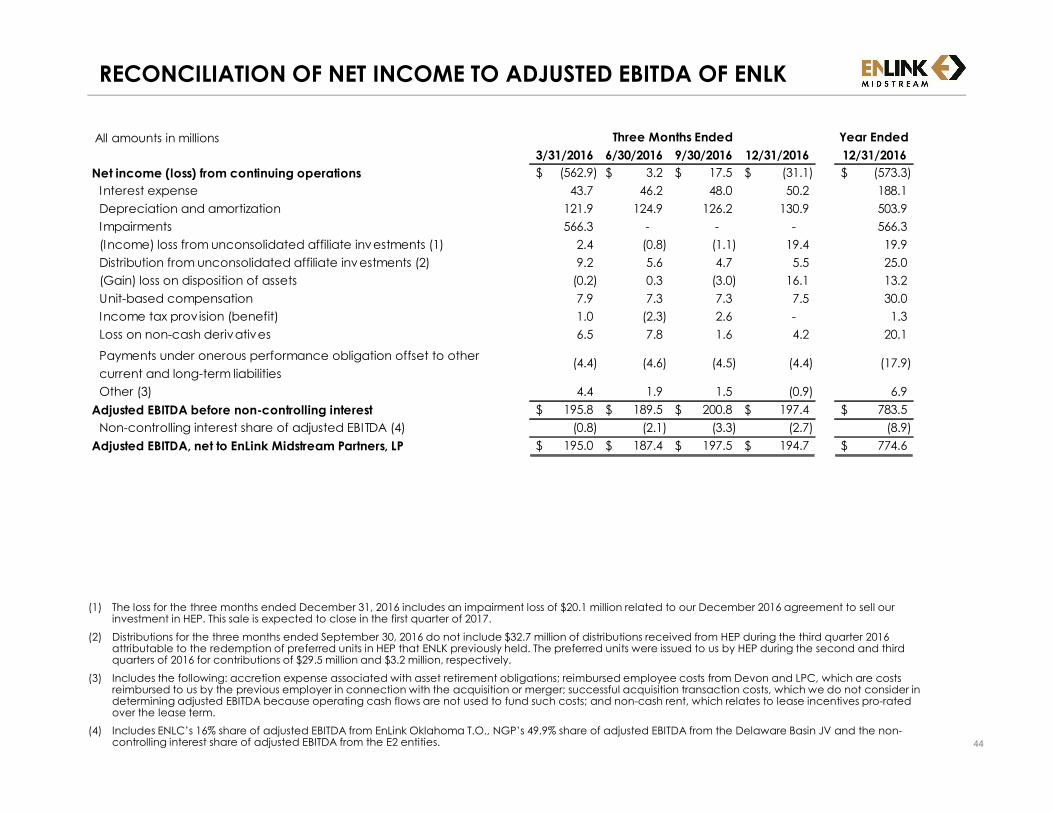
Net income (loss) from continuing operations (562.9)$ 3.2$ 17.5$ (31.1)$ (573.3)$ Interest expense 43.7 46.2 48.0 50.2 188.1 Depreciation and amortization 121.9 124.9 126.2 130.9 503.9 Impairments 566.3 - - - 566.3
2.4 (0.8) (1.1) 19.4 19.9 9.2 5.6 4.7 5.5 25.0
(Gain) loss on disposition of assets (0.2) 0.3 (3.0) 16.1 13.2 Unit-based compensation 7.9 7.3 7.3 7.5 30.0 Income tax prov ision (benefit) 1.0 (2.3) 2.6 - 1.3 Loss on non-cash derivatives 6.5 7.8 1.6 4.2 20.1
(4.4) (4.6) (4.5) (4.4) (17.9) Other (3) 4.4 1.9 1.5 (0.9) 6.9
Adjusted EBITDA before non-controlling interest 195.8$ 189.5$ 200.8$ 197.4$ 783.5$ Non-controlling interest share of adjusted EBITDA (4) (0.8) (2.1) (3.3) (2.7) (8.9)
Adjusted EBITDA, net to EnLink Midstream Partners, LP 195.0$ 187.4$ 197.5$ 194.7$ 774.6$
Three Months Ended
(Income) loss from unconsolidated affiliate investments (1)Distribution from unconsolidated affiliate investments (2)
Payments under onerous performance obligation offset to other current and long-term liabilities
RECONCILIATION OF NET INCOME TO ADJUSTED EBITDA OF ENLK
(1) The loss for the three months ended December 31, 2016 includes an impairment loss of $20.1 million related to our December 2016 agreement to sell our investment in HEP. This sale is expected to close in the first quarter of 2017.(2) Distributions for the three months ended September 30, 2016 do not include $32.7 million of distributions received from HEP during the third quarter 2016 attributable to the redemption of preferred units in HEP that ENLK previously held. The preferred units were issued to us by HEP during the second and third quarters of 2016 for contributions of $29.5 million and $3.2 million, respectively.(3) Includes the following: accretion expense associated with asset retirement obligations; reimbursed employee costs from Devon and LPC, which are costs reimbursed to us by the previous employer in connection with the acquisition or merger; successful acquisition transaction costs, which we do not consider in determining adjusted EBITDA because operating cash flows are not used to fund such costs; and non-cash rent, which relates to lease incentives pro-rated over the lease term.(4) Includes ENLC’s 16% share of adjusted EBITDA from EnLink Oklahoma T.O., NGP’s 49.9% share of adjusted EBITDA from the Delaware Basin JV and the non-controlling interest share of adjusted EBITDA from the E2 entities.
All amounts in millions

45
(1) Segment profit (loss) is defined as operating income less general and administrative expenses, depreciation and amortization, gain (loss) on disposition of assets and impairments. (2) Gross operating margin is defined as operating income (loss) less general and administrative expenses, depreciation and amortization, gain (loss) on disposition of assets, impairments and operating expenses. Note: See “Item 8. Financial Statements and Supplementary Data – Note 15 Segment Information” in ENLK’s Annual Report on Form 10-K for the year ended December 31, 2016 for further information about segment profit (loss).
RECONCILIATION OF ENLK’S OPERATING INCOME (LOSS) TO GROSS OPERATING MARGIN OF ENLKYear Ended 12/31/2016 Texas Louisiana Oklahoma
Crude and Condensate Corporate Totals
Operating income (loss) (364.3)$ General and administrative expenses 119.3 Depreciation and amortization 503.9 (Gain) loss on disposition of assets 13.2 Impairments 566.3
Segment profit (loss) (1) 416.4$ 175.9$ 200.0$ 57.2$ (11.1)$ 838.4$ Operating expenses 168.5 96.6 52.1 81.3 - 398.5
Gross operating margin (2) 584.9$ 272.5$ 252.1$ 138.5$ (11.1)$ 1,236.9$
Q4 2016 Texas Louisiana OklahomaCrude and
Condensate Corporate TotalsOperating income (loss) 38.3$
General and administrative expenses 28.7 Depreciation and amortization 130.9 (Gain) loss on disposition of assets 16.1 Impairments -
Segment profit (loss) (1) 103.2$ 48.9$ 52.7$ 13.7$ (4.5)$ 214.0$ Operating expenses 43.3 24.4 14.9 19.6 - 102.2
Gross operating margin (2) 146.5$ 73.3$ 67.6$ 33.3$ (4.5)$ 316.2$
Q3 2016 Texas Louisiana OklahomaCrude and
Condensate Corporate TotalsOperating income (loss) 66.9$
General and administrative expenses 28.3 Depreciation and amortization 126.2 (Gain) loss on disposition of assets (3.0) Impairments -
Segment profit (loss) (1) 103.2$ 47.4$ 53.2$ 15.1$ (0.5)$ 218.4$ Operating expenses 42.9 23.5 12.6 19.0 - 98.0
Gross operating margin (2) 146.1$ 70.9$ 65.8$ 34.1$ (0.5)$ 316.4$
All amounts in millions

46
RECONCILIATION OF ENLK’S OPERATING INCOME (LOSS) TO GROSS OPERATING MARGIN OF ENLK (CONT.)
(1) Segment profit (loss) is defined as operating income less general and administrative expenses, depreciation and amortization, (gain) loss on disposition of assets and impairments. Segment profit (loss) includes non-cash compensation expenses reflected in operating expenses.(2) Gross operating margin is defined as operating income (loss) less general and administrative expenses, depreciation and amortization, gain (loss) on disposition of assets, impairments and operating expenses.Note: See “Item 8. Financial Statements and Supplementary Data – Note 15 Segment Information” in ENLK’s Annual Report on Form 10-K for the year ended December 31, 2016 for further information about segment profit (loss).
All amounts in millionsQ2 2016 Texas Louisiana Oklahoma
Crude and Condensate Corporate Totals
Operating income (loss) 46.4$ General and administrative expenses 29.1 Depreciation and amortization 124.9 (Gain) loss on disposition of assets 0.3 Impairments -
Segment profit (loss) (1) 103.1$ 42.0$ 47.7$ 13.6$ (5.7)$ 200.7$ Operating expenses 43.0 25.4 11.8 19.9 - 100.1
Gross operating margin (2) 146.1$ 67.4$ 59.5$ 33.5$ (5.7)$ 300.8$
Q1 2016 Texas Louisiana OklahomaCrude and
Condensate Corporate TotalsOperating income (loss) (515.9)$
General and administrative expenses 33.2 Depreciation and amortization 121.9 (Gain) loss on disposition of assets (0.2) Impairments 566.3
Segment profit (loss) (1) 106.9$ 37.6$ 46.4$ 14.8$ (0.4)$ 205.3$ Operating expenses 39.3 23.3 12.8 22.8 - 98.2
Gross operating margin (2) 146.2$ 60.9$ 59.2$ 37.6$ (0.4)$ 303.5$

FOCUS ON PEOPLE | STRIVE FOR EXCELLENCE | BE ETHICAL | DELIVER RESULTS | BE GOOD STEWARDS