Embed Size (px)
Citation preview

Metso’s Interim Review January 1 – March 31, 2016
Interim ReviewJanuary 1 – March 31, 2016

Metso’s Interim Review January 1 – March 31, 2016
Figures in brackets refer to the corresponding period in 2015, unless otherwise stated. The Process Automation Systems (PAS) business was divested on April 1, 2015. The comparison numbers for Metso Group and Flow Control including the PAS business can be found in the tables section.
First quarter 2016 in brief • Challenging market conditions had a negative impact on the demand for services in the
mining and aggregates industry as well as on the demand for valves sold to the oil & gas transportation segment in North America.
• Orders for aggregates equipment increased and those for mining equipment were at the same level compared to the first quarter of 2015.
• Orders received totaled EUR 663 million (EUR 737 million), of which EUR 433 million (EUR 507 million) were services orders.
• Net sales were EUR 601 million (EUR 733 million), of which EUR 409 million for services (EUR 441 million). The decline was mainly due to a slowdown in project deliveries.
• Adjusted EBITA totaled EUR 56 million, or 9.3% of net sales (EUR 78 million, 10.6%). The profitability of the services business remained healthy as expected, whereas profitability of the mining equipment business was weak.
Outlook for 2016 (changes in brackets)
Metso’s overall trading conditions in 2016 will be somewhat weaker compared to 2015. Demand for our products and services is expected to develop as follows:
• remain weak for mining equipment and satisfactory for mining services
• remain satisfactory for aggregates equipment and services
• remain satisfactory for Flow Control products related to customers’ new investments and good for Flow Control services.
From our end of March, 2016 backlog we expect to invoice EUR 1.1 billion during 2016. Internal effi-ciency actions will continue to improve competitiveness and mitigate the price pressure that can be seen in markets that are facing weak or satisfactory demand. Restructuring costs are expected to be on the same level as in 2015 (previously: lower than in 2015). Capital expenditure without acquisitions and net financial costs are expected to be lower than in 2015 (previously: at the same level as in 2015).
2
Metso’s Interim Review January 1 – March 31, 2016

EUR millionQ1/
2016Q1/
2015 * Change % 2015 *
Orders received 663 737 -10 2,965
Orders received by the services business 433 507 -15 1,879
% of orders received 65 69 63
Order backlog at the end of the period 1,300 1,445 -10 1,268
Net sales 601 733 -18 2,923
Net sales of the services business 409 441 -7 1,840
% of net sales 68 60 63
Earnings before interest, tax and amortization (EBITA), adjusted 56 78 -28 356
% of net sales 9.3 10.6 12.2
Personnel at the end of the period 12,386 14,015 -12 12,619
Key figures
* Comparison numbers including the divested PAS business can be found in the tables section.
President and CEO Matti Kähkönen:
Orders and net sales were at a low level in the project businesses during the first quarter, as uncertainties in the markets tend to slow down both the decision-making relating to new orders and the execution of ongoing projects. This is most visible in the mining business and to some extent also in the oil & gas-related valve business in North America. In addition, the low order volume for capex driven engineered services in particular resulted in a slow start for mining services in the first quarter. Positive development was seen in the aggregates business, where equipment orders grew in India and some other regions.
Despite the challenges with volumes in the equipment businesses, our profitability remains at a satisfactory level, thanks to the services business and overall cost control. Services net sales have been somewhat impacted by our customers’ cost cutting, which we have offset with internal initiatives; profitability of the services business in both Minerals and Flow Control improved in the first quarter. Going forward, we do not foresee any significant changes in the activity of our end-markets and our focus continues to be on developing our cost competitiveness and our product and services offering to help our customers to improve their productivity.
EUR millionQ1/
2016Q1/
2015 Change % 2015
Operating profit 50 65 -23 555
% of net sales 8.4 8.3 18.7
Earnings per share, EUR 0.18 0.25 -28 2.95
Free cash flow 62 87 -29 341
Return on capital employed (ROCE) before taxes, annualized, % 9.4 12.9 25.7
Equity-to-asset ratio at the end of the period, % 43.9 36.6 48.3
Net gearing at the end of the period, % 6.9 41.4 10.6
3
Metso’s Interim Review January 1 – March 31, 2016

Q1/2016 Change %
Q1/2016Change % using
constant rates
Minerals -11 -6
Services business -17 -12
Flow Control -6 -4
Services business -3 0
Metso total -10 -6
Services business -15 -9
Currency impact on orders receivedcompared to the same period in 2015
Currency impact on net salescompared to the same period in 2015
Operating environment, orders received and backlog
Activity in our customer industries was broadly unchanged in the first quarter. Metal prices increased somewhat, but the trading activity in the mining market did not improve. The market remains challenging as miners are cautious with regards to spending in both capital equipment and services. The demand for aggregates equipment increased in some regions while weaker demand in the emerging countries impacted services orders in this business. Project delays and postponements within the oil & gas sector continued as the oil price remains at a relatively low level. While the adverse effect of the lower oil price on upstream investments has been apparent, also downstream pro-jects have been put on hold or postponed.
Our order intake during the first quarter declined 10 percent to EUR 663 million (EUR 737 million), following a weaker order intake for Minerals. The Group’s services orders amounted to EUR 433 million (EUR 507 million). The Group’s equipment orders were flat year-on-year. Orders declined in both emerging and developed countries and emerging countries accounted for 50 percent (51%) of total orders. Orders from BRIC countries declined 17 percent, mainly due to a 42 percent decline in Brazil. Orders from Russia and India increased 15 percent, while orders from China declined 13 percent.
Our backlog increased by 3 percent from the end of 2015 and totaled EUR 1,300 million at the end of March. We expect to recognize around 87 percent of this backlog, i.e. EUR 1,135 million, as net sales in 2016 and EUR 137 million in 2017.
Net sales
Net sales in the first quarter totaled EUR 601 million (EUR 733 million). The most significant decline was seen in the mining equipment business, where deliveries have been slowing down due to uncertainties in the markets. The sales of new equipment declined 39 percent in Minerals and 22 percent in Flow Control. Net sales of the services business declined 7 percent year-on-year and totaled EUR 409 million (EUR 441 million), accounting for 68 percent of total net sales. Services net sales declined 3 percent in Flow Control and 8 percent in Minerals.
Q1/2016 Change %
Q1/2016Change % using
constant rates
Minerals -20 -15
Services business -8 -2
Flow Control -13 -12
Services business -3 0
Metso total -18 -14
Services business -7 -2
4
Metso’s Interim Review January 1 – March 31, 2016

Financial performance
Adjusted EBITA (earnings before interest, taxes and amortization) in the first quarter was EUR 56 million, or 9.3 percent of net sales (EUR 78 million and 10.6%). Profitability of the services business remained healthy, but EBITA was negatively impacted by lower sales in the mining and aggregates equipment business and the oil & gas-related valve business.
Net financing expenses in January-March were EUR 12 million (EUR 10 million). Interest expenses accounted for EUR 9 million (EUR 6 million), interest income for EUR 2 million (EUR 1 million), foreign exchange losses for EUR 2 million (EUR 1 million loss), and other net financial expenses for EUR 3 million (EUR 4 million).
Operating profit (EBIT) during the first quarter was EUR 50 million and 8.4 percent of net sales (EUR 65 million and 8.3%). Profit before taxes was EUR 38 million (EUR 55 million). Net cash generated by operating activities totaled EUR 67 million (EUR 91 million) and free cash flow was EUR 62 million (EUR 87 million). Changes in net working capital had a EUR 11 million negative impact on cash flow.
Financial position
Metso’s liquidity position remains solid. Total cash assets at the end of March 2016 were EUR 721 million (EUR 657 million at the end of 2015), of which EUR 95 million (EUR 67 million) was invested in financial instruments with an initial maturity exceeding three months, and the remaining EUR 626 million (EUR 590 million) is accounted for as cash and cash equivalents. Metso has a committed EUR 500 million revolving credit facility, which is undrawn.
The Group’s balance sheet remains strong. Net interest-bearing liabilities totaled EUR 90 million at the end of March (EUR 153 million at the end of 2015) and gearing was 6.9 percent (10.6%). The equity-to-asset ratio was 43.9 percent (48.3%).
There were no changes in our credit rating during the reporting period. Standard & Poor’s Ratings Services confirmed the latest rating in March 2016: long-term corporate credit rating BBB and short-term A-2, outlook stable.
Capital expenditure and RTD
Gross capital expenditure in January-March, excluding business acquisitions, was EUR 6 million (EUR 12 million). Maintenance accounted for 83 percent, i.e. EUR 5 million (83% and EUR 10 million). Capital expenditure in 2016 is expected to decline compared to 2015 (EUR 46 million). Research and development expenses in January-March totaled EUR 9 million, i.e. 1.5 percent of net sales (EUR 9 million and 1.2%).
0Q1
200
400
600
800
1,000
1,200
1,400
EUR million
Orders received Net sales Adjusted EBITA %
0
2
4
6
8
10
12
14
%
Q2 Q3 Q42014 2015
Q1 Q2 Q3 Q4 Q12016
11.4
13.712.4
13.0
10.6
12.413.6
12.0
9.3
Orders received, net sales and EBITA margin
5
Metso’s Interim Review January 1 – March 31, 2016

Reporting Segments
Minerals
EUR millionQ1/
2016Q1/
2015Change
% 2015
Orders received 494 558 -11 2,260
Orders received by the services business 335 406 -17 1,477
% of orders received 68 73 65
Order backlog at the end of the period 1,020 1,120 -9 1,006
Net sales 453 563 -20 2,198
Net sales of the services business 323 351 -8 1,437
% of net sales 71 62 65
Earnings before interest, tax and amortization (EBITA), adjusted 37 55 -33 241
% of net sales 8.1 9.9 11.0
Operating profit 35 54 -36 213
% of net sales 7.7 9.6 9.7
Return on operative capital employed (ROCE), % 11.7 16.9 17.5
Personnel at the end of the period 9,068 10,372 -13 9,222
• Services profitability improved
• Equipment orders increased
• Lower delivery volume impacted EBITA margin
6
Metso’s Interim Review January 1 – March 31, 2016

Minerals, rolling net sales and EBITA
In the aggregates business, we saw healthy equipment demand in some regions, while activity in most of the emerging markets continued to be weak. Growth originated from India, Australia and North America, while Brazil in particular continued to decline. Overall, orders from aggregates customers declined 1 percent, resulting from 11 percent growth in equipment orders and offset by a 14 percent decline in services orders. Services orders declined only 2 percent when adjusted for the orders for the Tampere foundry, which was divested in April 2015.
The mining business continued to be affected by customers’ cost cutting measures, which was clearly seen in the services activity, especially for engineered services and wear parts. Overall, orders from mining customers declined 17 percent during the quarter, resulting from a 9 percent decline in equipment orders and 19 percent decline in services orders. Weakness in equipment orders was seen across the sector. The demand for services held up in Australia, the Nordic countries and Russia, while other markets saw lower activity. In addition, a weakening of the currencies of the countries in the emerging markets had a negative impact on services orders.
The segment’s net sales totaled EUR 453 million in the first quarter, which is 20 percent less than in the compari-son period. Net sales related to equipment and projects for mining customers were down 47 percent, due to the slower pace of deliveries, while those for aggregates customers decreased 32 percent. Services net sales decreased 8 percent to EUR 323 million, accounting for 71 percent (62%) of the segment’s total net sales. Both mining and aggregates services sales decreased 8 percent, negatively impacted by customers’ cost cutting measures and a weakening of the currencies of countries in the emerging markets.
The segment’s adjusted EBITA was EUR 37 million, which is 8.1 percent of net sales (EUR 55 million and 9.9%). Prof-itability of the services business improved, but was not enough to compensate for the weakening of the mining equipment business. Operating profit was EUR 35 million and 7.7% of net sales (EUR 54 million and 9.6%).
The order backlog in Minerals at the end of March was EUR 1,020 million, which is 1 percent higher than at the end of 2015. We expect 85 percent of the order backlog to be delivered in 2016.
Services net sales, rolling 12 months
Capital net sales, mining, rolling 12 months
Adjusted EBITA %, rolling 12 months
Capital net sales, aggregates, rolling 12 months
0
2
4
6
10
0
500
1,000
1,500
2,000
2,500
3,000
%EUR million
2012 2013 2014 2015
12
3,500
2016Q1Q2 Q3 Q4Q1 Q2 Q3 Q4 Q1 Q2 Q3 Q4 Q1 Q2 Q3 Q4 Q1
10.9%11.6% 11.9% 11.9%
12.5% 12.3% 12.7% 13.0% 12.7%13.2% 12.8% 12.6% 12.3%
11.6% 11.5%11.0% 10.6%
8
14
7
Metso’s Interim Review January 1 – March 31, 2016
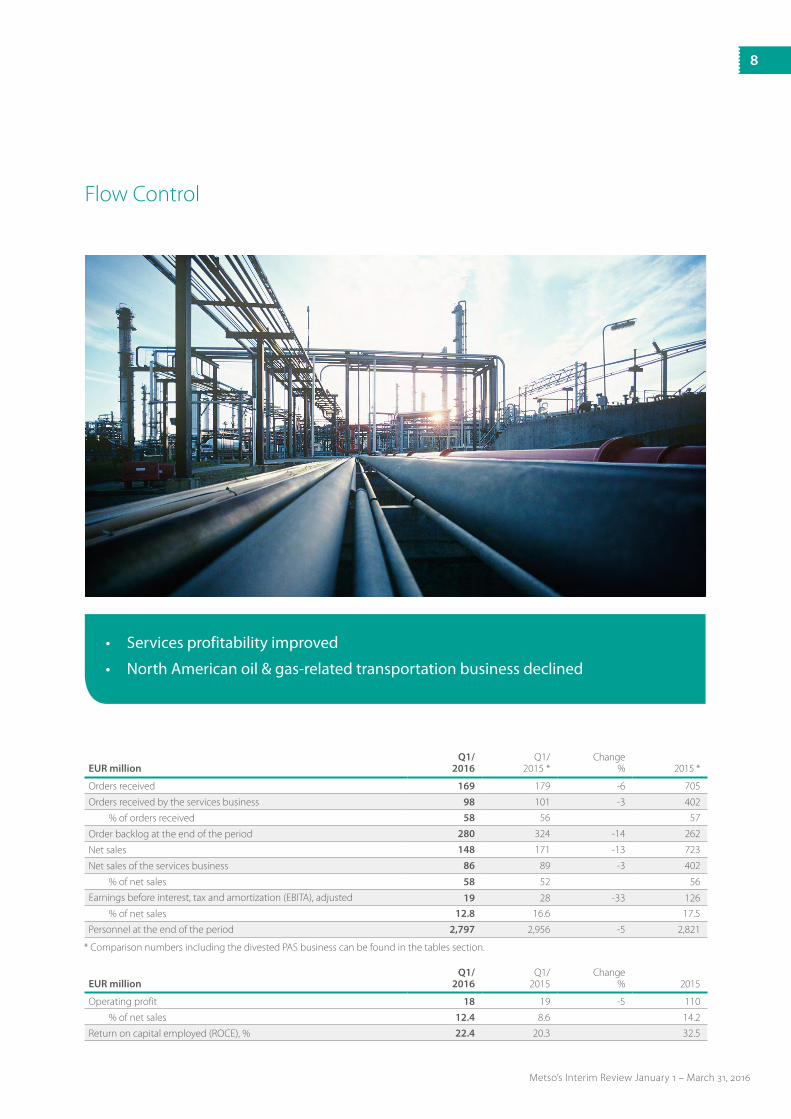
Flow Control
EUR millionQ1/
2016Q1/
2015 *Change
% 2015 *
Orders received 169 179 -6 705
Orders received by the services business 98 101 -3 402
% of orders received 58 56 57
Order backlog at the end of the period 280 324 -14 262
Net sales 148 171 -13 723
Net sales of the services business 86 89 -3 402
% of net sales 58 52 56
Earnings before interest, tax and amortization (EBITA), adjusted 19 28 -33 126
% of net sales 12.8 16.6 17.5
Personnel at the end of the period 2,797 2,956 -5 2,821
• Services profitability improved
• North American oil & gas-related transportation business declined
* Comparison numbers including the divested PAS business can be found in the tables section.
EUR millionQ1/
2016Q1/
2015Change
% 2015
Operating profit 18 19 -5 110
% of net sales 12.4 8.6 14.2
Return on capital employed (ROCE), % 22.4 20.3 32.5
8
Metso’s Interim Review January 1 – March 31, 2016
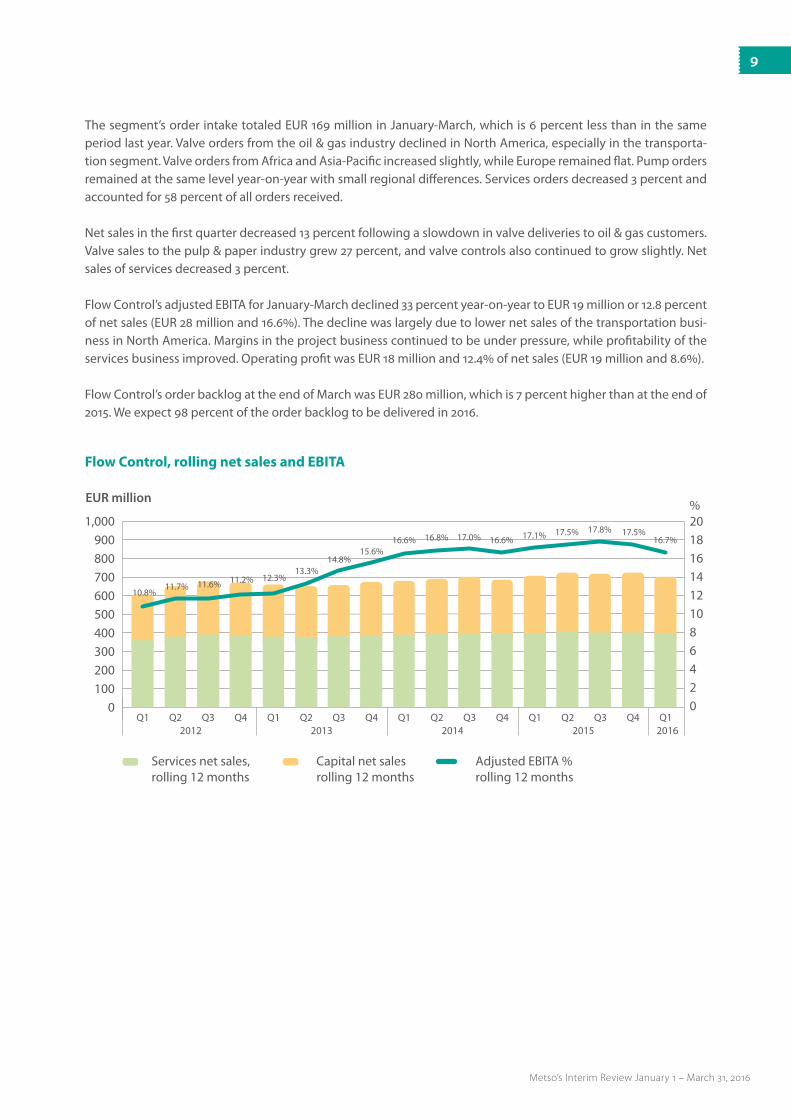
Flow Control, rolling net sales and EBITA
0100
300
500
700
EUR million
024681012141618900201,000
800
200
400
600
%
10.8%11.7% 11.6% 11.2% 12.3%
13.3%14.8%
15.6%16.6% 16.8% 17.0% 16.6% 17.1% 17.5% 17.8% 17.5%
16.7%
2012 2013 2014 2015 2016Q1Q2 Q3 Q4Q1 Q2 Q3 Q4 Q1 Q2 Q3 Q4 Q1 Q2 Q3 Q4 Q1
Services net sales,rolling 12 months
Adjusted EBITA % rolling 12 months
Capital net sales rolling 12 months
The segment’s order intake totaled EUR 169 million in January-March, which is 6 percent less than in the same period last year. Valve orders from the oil & gas industry declined in North America, especially in the transporta-tion segment. Valve orders from Africa and Asia-Pacific increased slightly, while Europe remained flat. Pump orders remained at the same level year-on-year with small regional differences. Services orders decreased 3 percent and accounted for 58 percent of all orders received.
Net sales in the first quarter decreased 13 percent following a slowdown in valve deliveries to oil & gas customers. Valve sales to the pulp & paper industry grew 27 percent, and valve controls also continued to grow slightly. Net sales of services decreased 3 percent.
Flow Control’s adjusted EBITA for January-March declined 33 percent year-on-year to EUR 19 million or 12.8 percent of net sales (EUR 28 million and 16.6%). The decline was largely due to lower net sales of the transportation busi-ness in North America. Margins in the project business continued to be under pressure, while profitability of the services business improved. Operating profit was EUR 18 million and 12.4% of net sales (EUR 19 million and 8.6%).
Flow Control’s order backlog at the end of March was EUR 280 million, which is 7 percent higher than at the end of 2015. We expect 98 percent of the order backlog to be delivered in 2016.
9
Metso’s Interim Review January 1 – March 31, 2016
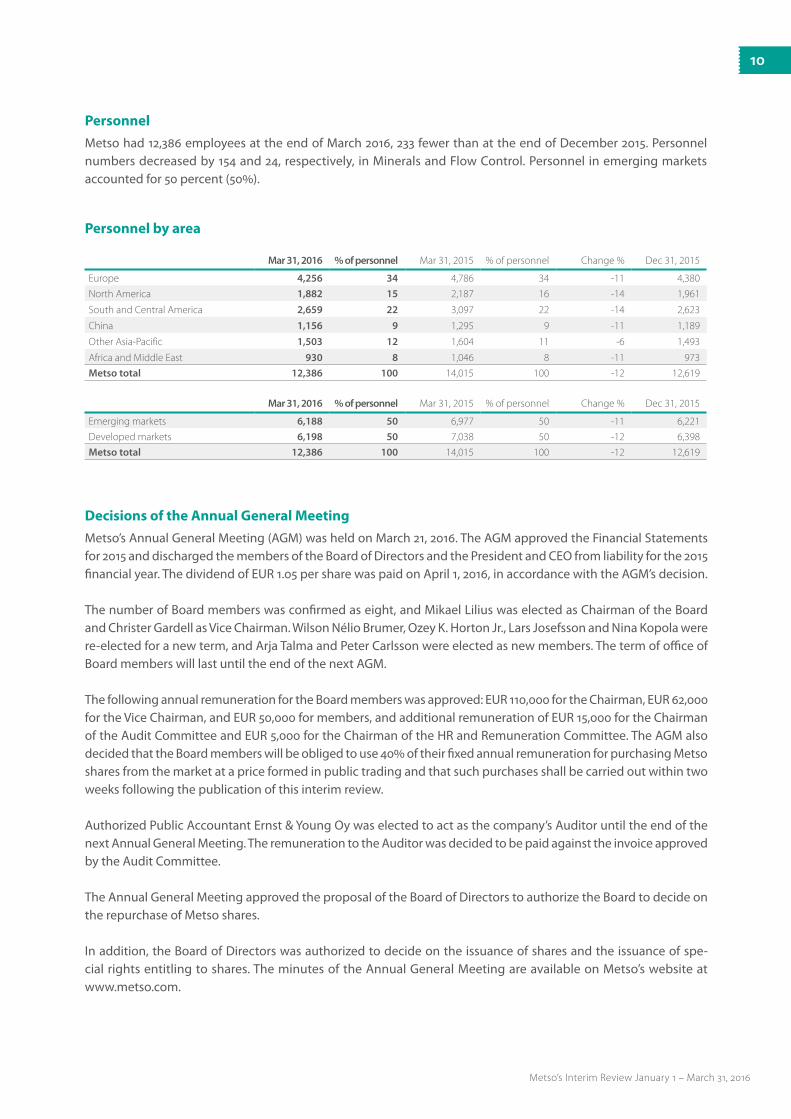
Mar 31, 2016 % of personnel Mar 31, 2015 % of personnel Change % Dec 31, 2015
Europe 4,256 34 4,786 34 -11 4,380
North America 1,882 15 2,187 16 -14 1,961
South and Central America 2,659 22 3,097 22 -14 2,623
China 1,156 9 1,295 9 -11 1,189
Other Asia-Pacific 1,503 12 1,604 11 -6 1,493
Africa and Middle East 930 8 1,046 8 -11 973
Metso total 12,386 100 14,015 100 -12 12,619
Personnel by area
Personnel
Metso had 12,386 employees at the end of March 2016, 233 fewer than at the end of December 2015. Personnel numbers decreased by 154 and 24, respectively, in Minerals and Flow Control. Personnel in emerging markets accounted for 50 percent (50%).
Mar 31, 2016 % of personnel Mar 31, 2015 % of personnel Change % Dec 31, 2015
Emerging markets 6,188 50 6,977 50 -11 6,221
Developed markets 6,198 50 7,038 50 -12 6,398
Metso total 12,386 100 14,015 100 -12 12,619
Decisions of the Annual General Meeting
Metso’s Annual General Meeting (AGM) was held on March 21, 2016. The AGM approved the Financial Statements for 2015 and discharged the members of the Board of Directors and the President and CEO from liability for the 2015 financial year. The dividend of EUR 1.05 per share was paid on April 1, 2016, in accordance with the AGM’s decision.
The number of Board members was confirmed as eight, and Mikael Lilius was elected as Chairman of the Board and Christer Gardell as Vice Chairman. Wilson Nélio Brumer, Ozey K. Horton Jr., Lars Josefsson and Nina Kopola were re-elected for a new term, and Arja Talma and Peter Carlsson were elected as new members. The term of office of Board members will last until the end of the next AGM.
The following annual remuneration for the Board members was approved: EUR 110,000 for the Chairman, EUR 62,000 for the Vice Chairman, and EUR 50,000 for members, and additional remuneration of EUR 15,000 for the Chairman of the Audit Committee and EUR 5,000 for the Chairman of the HR and Remuneration Committee. The AGM also decided that the Board members will be obliged to use 40% of their fixed annual remuneration for purchasing Metso shares from the market at a price formed in public trading and that such purchases shall be carried out within two weeks following the publication of this interim review.
Authorized Public Accountant Ernst & Young Oy was elected to act as the company’s Auditor until the end of the next Annual General Meeting. The remuneration to the Auditor was decided to be paid against the invoice approved by the Audit Committee.
The Annual General Meeting approved the proposal of the Board of Directors to authorize the Board to decide on the repurchase of Metso shares.
In addition, the Board of Directors was authorized to decide on the issuance of shares and the issuance of spe-cial rights entitling to shares. The minutes of the Annual General Meeting are available on Metso’s website at www.metso.com.
10
Metso’s Interim Review January 1 – March 31, 2016

Shares and share trading
As of March 31, 2016, Metso’s share capital was EUR 140,982,843.80 and the number of shares was 150,348,256. This included 363,718 shares held by the Parent Company, which represented 0.2 percent of all shares and votes. The average number of shares outstanding in January-March 2016, excluding those held by the Parent Company, was 149,984,538, and the average number of diluted shares was 150,026,217.
A total of 40,023,404 Metso shares were traded on NASDAQ OMX Helsinki in January-March 2016, equivalent to a turnover of EUR 795 million. The average trading price for the period was EUR 19.86. The highest quotation was EUR 22.91, and the lowest EUR 17.40. The share price on the last trading day of the period, March 31, 2016, was EUR 20.97, giving Metso a market capitalization, excluding shares held by the Parent Company, of EUR 3,145 million (EUR 3,105 million at the end of 2015). Metso is not aware of any shareholders’ agreements regarding the ownership of Metso shares and voting rights.
Metso’s ADRs (American Depositary Receipts) are traded on the International OTCQX, the premier tier of the OTC (over-the-counter) market in the United States, under the ticker symbol ‘MXCYY’, with each ADR representing one Metso share. The closing price of the Metso ADR on March 31 was USD 6.20.
Events after the reporting period
In accordance with the decision of the AGM on March 21, 2016, a dividend of EUR 1.05 per share was paid on April 1, 2016. The total payout amounted to EUR 157 million, which was accounted for as short-term debt on March 31, 2016.
Flaggings
There were no flagging notifications during the period.
Short-term business risks and market uncertainties
Uncertainties surrounding economic growth globally might affect our customer industries and weaken the demand for Metso’s products and services. A significant slowdown in global growth might further reduce market size and lead to tougher price competition. Our backlog, projects under negotiation and other business operations might also be adversely affected by political turbulence seen, for example, in Eastern Europe, Russia and the Middle East.
A prolonged uncertainty in the Chinese economy might affect our business negatively through declining foreign investments made in the country and falling commodity prices. Low commodity prices reduce the investment appetite and cut spending among our customers. This may cause projects to be postponed, delayed or discontin-ued. A tougher pricing environment also makes it harder to integrate increasing labor and manufacturing costs into our prices.
Economic uncertainty could lead to short-term financing deficits and indirect adverse effects on Metso’s operations due to our customers’ reduced investment appetite. Exchange rate fluctuations are likely to increase with economic uncertainty, although the wide geographical scope of our operations reduces the impact of any individual currency. Metso Group hedges currency exposure linked to firm delivery and purchase agreements. Sufficient funding and financing is crucial at all times in order to ensure the continuity of our own operations. Our current cash assets and funding are considered sufficient to secure liquidity and flexibility in the short and long run.
11
Metso’s Interim Review January 1 – March 31, 2016

Helsinki, April 21, 2016Metso Corporation’s Board of Directors
It should be noted that certain statements herein which are not historical facts, including, without limitation, those regarding expectations for general economic development and the market situation, expectations for customer industry profitability and investment willingness, expectations for company growth, development and profitability and the realization of synergy benefits and cost savings, and statements preceded by “expects”, “estimates”, “forecasts” or similar expressions, are forward-looking statements. These statements are based on current decisions and plans and currently known factors. They involve risks and uncertainties that may cause the actual results to materially differ from the results currently expected by the company.
Such factors include, but are not limited to:(1) general economic conditions, including fluctuations in exchange
rates and interest levels which influence the operating environment and profitability of customers and thereby the orders received by the company and their margins,
(2) the competitive situation, especially significant technological solutions developed by competitors,
(3) the company’s own operating conditions, such as the success of production, product development and project management and their continuous development and improvement,
(4) the success of pending and future acquisitions and restructuring.
Outlook for 2016 (changes in brackets)
Metso’s overall trading conditions in 2016 will be somewhat weaker compared to 2015. Demand for our products and services is expected to develop as follows:• remain weak for mining equipment and satisfactory for mining services • remain satisfactory for aggregates equipment and services• remain satisfactory for Flow Control products related to customers’ new investments and good for Flow Control
services.
From our end of March, 2016 backlog we expect to invoice EUR 1.1 billion during 2016. Internal efficiency actions will continue to improve competitiveness and mitigate the price pressure that can be seen in markets that are facing weak or satisfactory demand. Restructuring costs are expected to be on the same level as in 2015 (previously: lower than in 2015). Capital expenditure without acquisitions and net financial costs are expected to be lower than in 2015 (previously: at the same level as in 2015).
12
Metso’s Interim Review January 1 – March 31, 2016
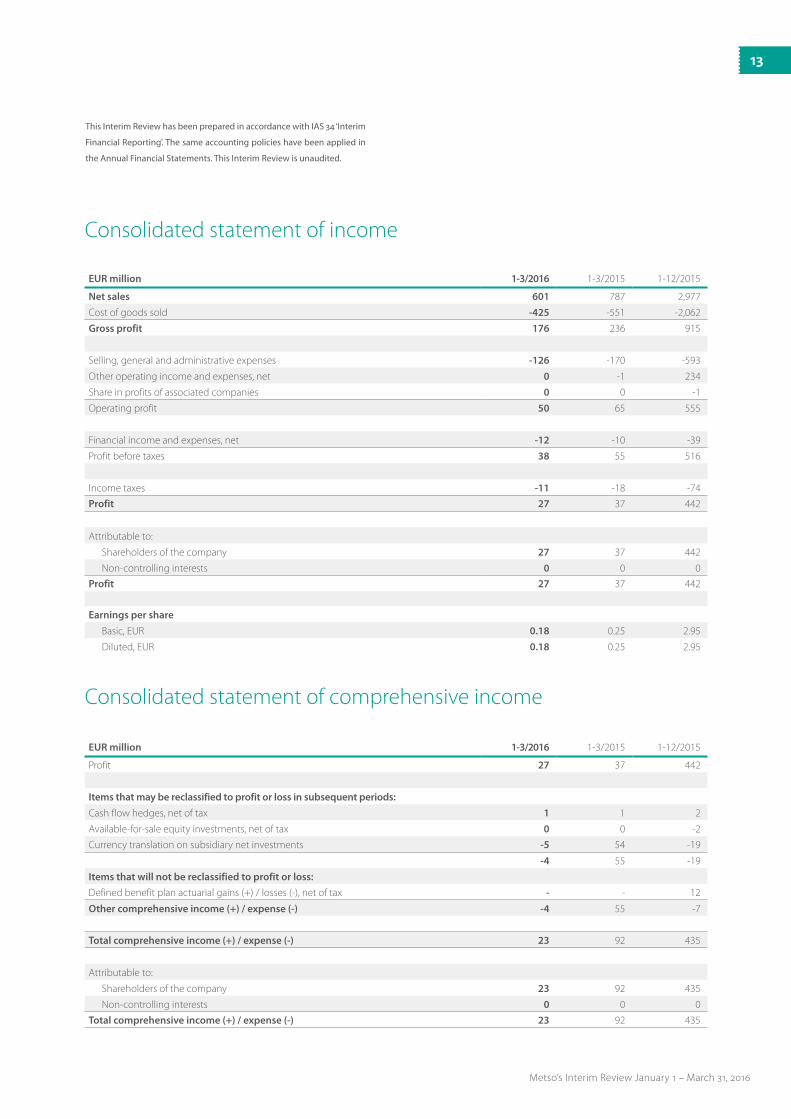
EUR million 1-3/2016 1-3/2015 1-12/2015
Net sales 601 787 2,977
Cost of goods sold -425 -551 -2,062
Gross profit 176 236 915
Selling, general and administrative expenses -126 -170 -593
Other operating income and expenses, net 0 -1 234
Share in profits of associated companies 0 0 -1
Operating profit 50 65 555
Financial income and expenses, net -12 -10 -39
Profit before taxes 38 55 516
Income taxes -11 -18 -74
Profit 27 37 442
Attributable to:
Shareholders of the company 27 37 442
Non-controlling interests 0 0 0
Profit 27 37 442
Earnings per share
Basic, EUR 0.18 0.25 2.95
Diluted, EUR 0.18 0.25 2.95
Consolidated statement of income
EUR million 1-3/2016 1-3/2015 1-12/2015
Profit 27 37 442
Items that may be reclassified to profit or loss in subsequent periods:
Cash flow hedges, net of tax 1 1 2
Available-for-sale equity investments, net of tax 0 0 -2
Currency translation on subsidiary net investments -5 54 -19
-4 55 -19
Items that will not be reclassified to profit or loss:
Defined benefit plan actuarial gains (+) / losses (-), net of tax - - 12
Other comprehensive income (+) / expense (-) -4 55 -7
Total comprehensive income (+) / expense (-) 23 92 435
Attributable to:
Shareholders of the company 23 92 435
Non-controlling interests 0 0 0
Total comprehensive income (+) / expense (-) 23 92 435
Consolidated statement of comprehensive income
This Interim Review has been prepared in accordance with IAS 34 ‘Interim
Financial Reporting’. The same accounting policies have been applied in
the Annual Financial Statements. This Interim Review is unaudited.
13
Metso’s Interim Review January 1 – March 31, 2016
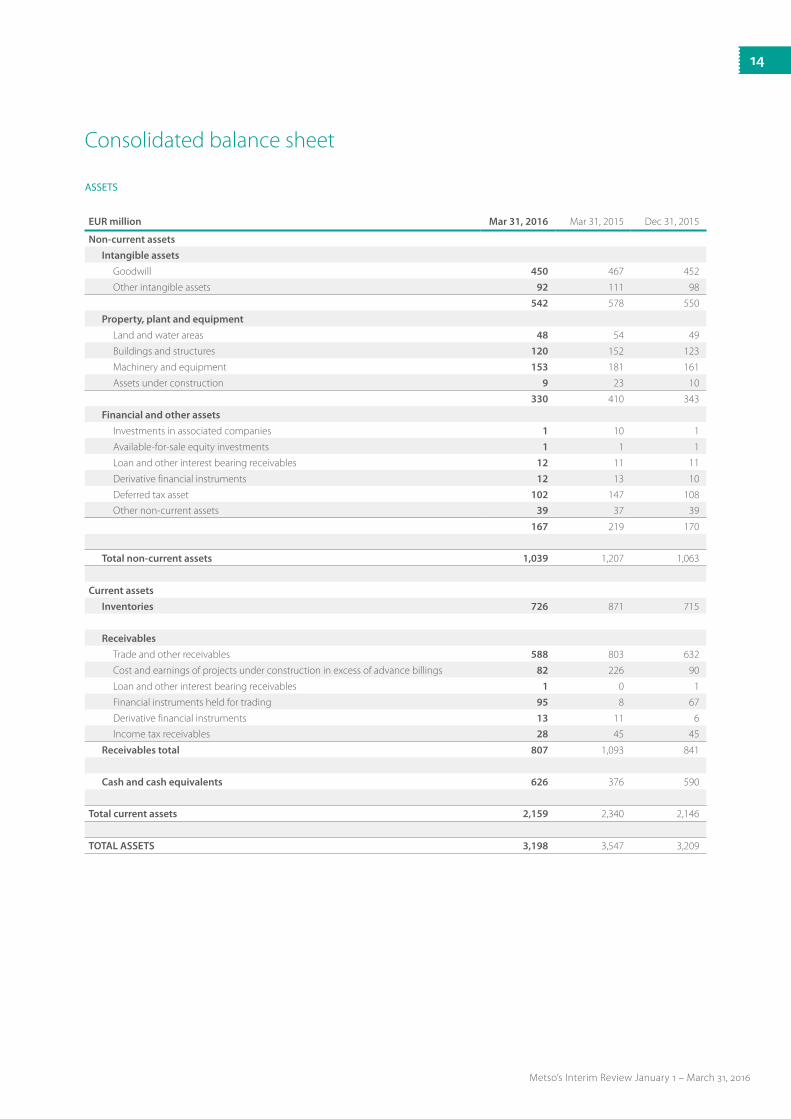
Consolidated balance sheet
ASSETS
EUR million Mar 31, 2016 Mar 31, 2015 Dec 31, 2015
Non-current assets
Intangible assets
Goodwill 450 467 452
Other intangible assets 92 111 98
542 578 550
Property, plant and equipment
Land and water areas 48 54 49
Buildings and structures 120 152 123
Machinery and equipment 153 181 161
Assets under construction 9 23 10
330 410 343
Financial and other assets
Investments in associated companies 1 10 1
Available-for-sale equity investments 1 1 1
Loan and other interest bearing receivables 12 11 11
Derivative financial instruments 12 13 10
Deferred tax asset 102 147 108
Other non-current assets 39 37 39
167 219 170
Total non-current assets 1,039 1,207 1,063
Current assets
Inventories 726 871 715
Receivables
Trade and other receivables 588 803 632
Cost and earnings of projects under construction in excess of advance billings 82 226 90
Loan and other interest bearing receivables 1 0 1
Financial instruments held for trading 95 8 67
Derivative financial instruments 13 11 6
Income tax receivables 28 45 45
Receivables total 807 1,093 841
Cash and cash equivalents 626 376 590
Total current assets 2,159 2,340 2,146
TOTAL ASSETS 3,198 3,547 3,209
14
Metso’s Interim Review January 1 – March 31, 2016
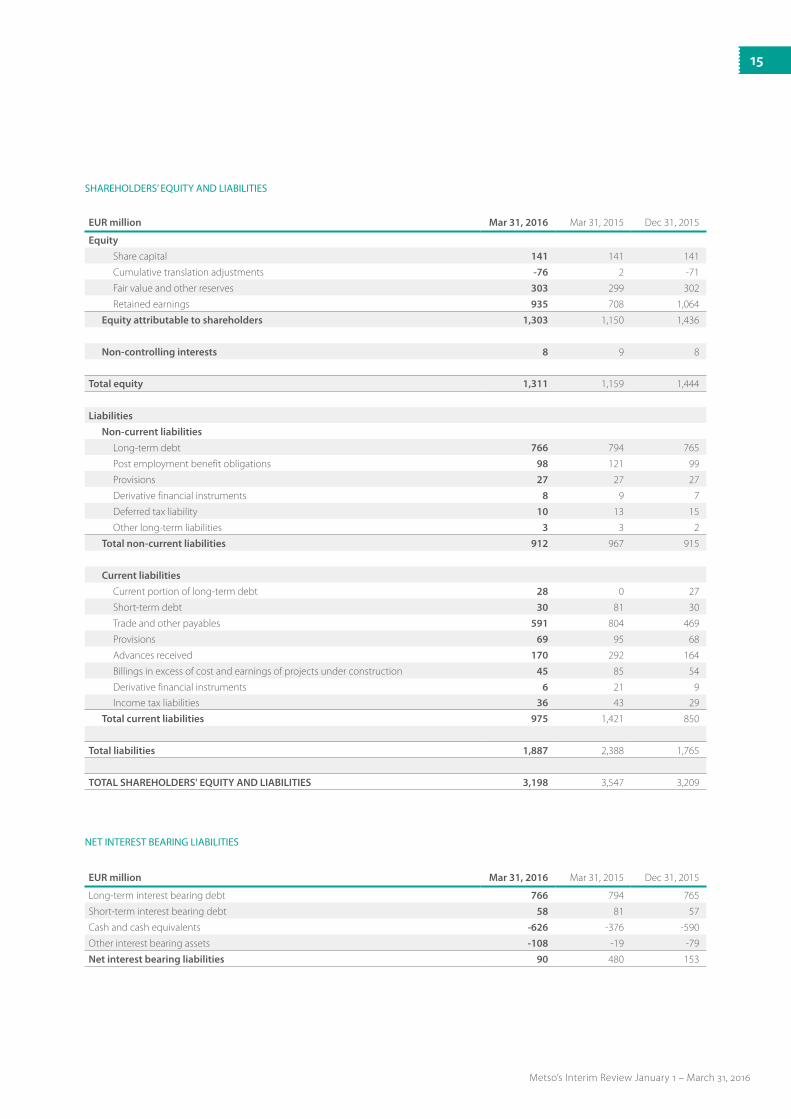
SHAREHOLDERS’ EQUITY AND LIABILITIES
EUR million Mar 31, 2016 Mar 31, 2015 Dec 31, 2015
Long-term interest bearing debt 766 794 765
Short-term interest bearing debt 58 81 57
Cash and cash equivalents -626 -376 -590
Other interest bearing assets -108 -19 -79
Net interest bearing liabilities 90 480 153
NET INTEREST BEARING LIABILITIES
EUR million Mar 31, 2016 Mar 31, 2015 Dec 31, 2015
Equity
Share capital 141 141 141
Cumulative translation adjustments -76 2 -71
Fair value and other reserves 303 299 302
Retained earnings 935 708 1,064
Equity attributable to shareholders 1,303 1,150 1,436
Non-controlling interests 8 9 8
Total equity 1,311 1,159 1,444
Liabilities
Non-current liabilities
Long-term debt 766 794 765
Post employment benefit obligations 98 121 99
Provisions 27 27 27
Derivative financial instruments 8 9 7
Deferred tax liability 10 13 15
Other long-term liabilities 3 3 2
Total non-current liabilities 912 967 915
Current liabilities
Current portion of long-term debt 28 0 27
Short-term debt 30 81 30
Trade and other payables 591 804 469
Provisions 69 95 68
Advances received 170 292 164
Billings in excess of cost and earnings of projects under construction 45 85 54
Derivative financial instruments 6 21 9
Income tax liabilities 36 43 29
Total current liabilities 975 1,421 850
Total liabilities 1,887 2,388 1,765
TOTAL SHAREHOLDERS' EQUITY AND LIABILITIES 3,198 3,547 3,209
15
Metso’s Interim Review January 1 – March 31, 2016

EUR million 1-3/2016 1-3/2015 1-12/2015
Cash flows from operating activities:
Profit 27 37 442
Adjustments to reconcile profit to net cash provided by operating activities
Depreciation and amortization 16 19 69
Financial income and expenses, net 12 10 39
Income taxes 12 18 74
Other 3 4 -232
Change in net working capital -11 36 64
Cash flows from operations 59 124 456
Financial income and expenses, net paid -4 -3 -24
Income taxes paid 12 -30 -72
Net cash provided by operating activities 67 91 360
Cash flows from investing activities:
Capital expenditures on fixed assets -6 -12 -46
Proceeds from sale of fixed assets 0 6 17
Business acquisitions, net of cash acquired - - -
Proceeds from sale of businesses, net of cash sold - - 305
Proceeds from (+)/ Investments in (-) financial assets -25 4 -56
Other 0 -2 -5
Net cash provided by (+) / used in (-) investing activities -31 -4 215
Cash flows from financing activities:
Dividends paid - - -217
Net funding 1 - -40
Other 0 - 0
Net cash provided by (-) / used in (-) financing activities 1 - -257
Net increase (+) / decrease (-) in cash and cash equivalents 37 87 318
Effect from changes in exchange rates -1 10 -7
Cash and cash equivalents at beginning of period 590 279 279
Cash and cash equivalents at end of period 626 376 590
Condensed consolidated cash flow statement
EUR million 1-3/2016 1-3/2015 1-12/2015
Net cash provided by operating activities 67 91 360
Capital expenditures on maintenance investments -5 -10 -36
Proceeds from sale of fixed assets 0 6 17
Free cash flow 62 87 341
FREE CASH FLOW
16
Metso’s Interim Review January 1 – March 31, 2016

EUR millionShare
capital
Cumulativetranslation
adjustments
Fair valueand other
reservesRetainedearnings
Equityattributable to
shareholders
Non-controlling
interestsTotal
equity
Balance at Jan 1, 2015 141 -52 302 830 1,221 8 1,229
Profit - - - 37 37 0 37
Other comprehensive income (+) / expense (-)
Cash flow hedges, net of tax - - 1 - 1 - 1
Available-for-sale equity investments, net of tax - - 0 - 0 - 0
Currency translation on subsidiary net investments - 54 - - 54 - 54
Net investment hedge gains (losses), net of tax - - - - - - -
Total comprehensive income (+) / expense (-) - 54 1 37 92 0 92
Dividends - - - -157 -157 0 -157
Share-based payments, net of tax - - 0 0 0 - 0
Other - - -4 -2 -6 1 -5
Changes in non-controlling interests - - - - - - -
Balance at March 31, 2015 141 2 299 708 1,150 9 1,159
Balance at Jan 1, 2016 141 -71 302 1,064 1,436 8 1,444
Profit - - - 27 27 0 27
Other comprehensive income (+) / expense (-)
Cash flow hedges, net of tax - - 1 - 1 - 1
Available-for-sale equity investments, net of tax - - 0 - 0 - 0
Currency translation on subsidiary net investments - -5 - - -5 - -5
Total comprehensive income (+) / expense (-) - -5 1 27 23 0 23
Dividends - - - -157 -157 0 -157
Share-based payments, net of tax - - 0 0 0 - 0
Other - - 0 1 1 0 1
Changes in non-controlling interests - - - - - - -
Balance at March 31, 2016 141 -76 303 935 1,303 8 1,311
Consolidated statement of changes in shareholders’ equity
17
Metso’s Interim Review January 1 – March 31, 2016
Metso made no business acquisitions during 2016 or 2015.
On April 13, 2015, Metso completed the sale of its Tampere foundry in Finland to a Finnish company TEVO Oy. The divestment
was treated as sale of fixed assets and it had no significant effect on Metso’s result.
On April 1, 2015 Metso closed the disposal of Process Automation Systems (PAS) business. The PAS business included process
automation solutions for the pulp, paper and power industries, covering automation and quality control systems, analyzers and
measurements and related services and was reported in Metso’s Flow Control segment.
The final cash consideration was EUR 312 million. The net assets of the entity disposed of were EUR 55 million, direct transaction
costs were EUR 6 million and related cumulative translation adjustments were EUR 1 million positive, whereby Metso booked a
gain of EUR 252 million on the transaction.
Acquisitions and disposals of businesses
18
Metso’s Interim Review January 1 – March 31, 2016
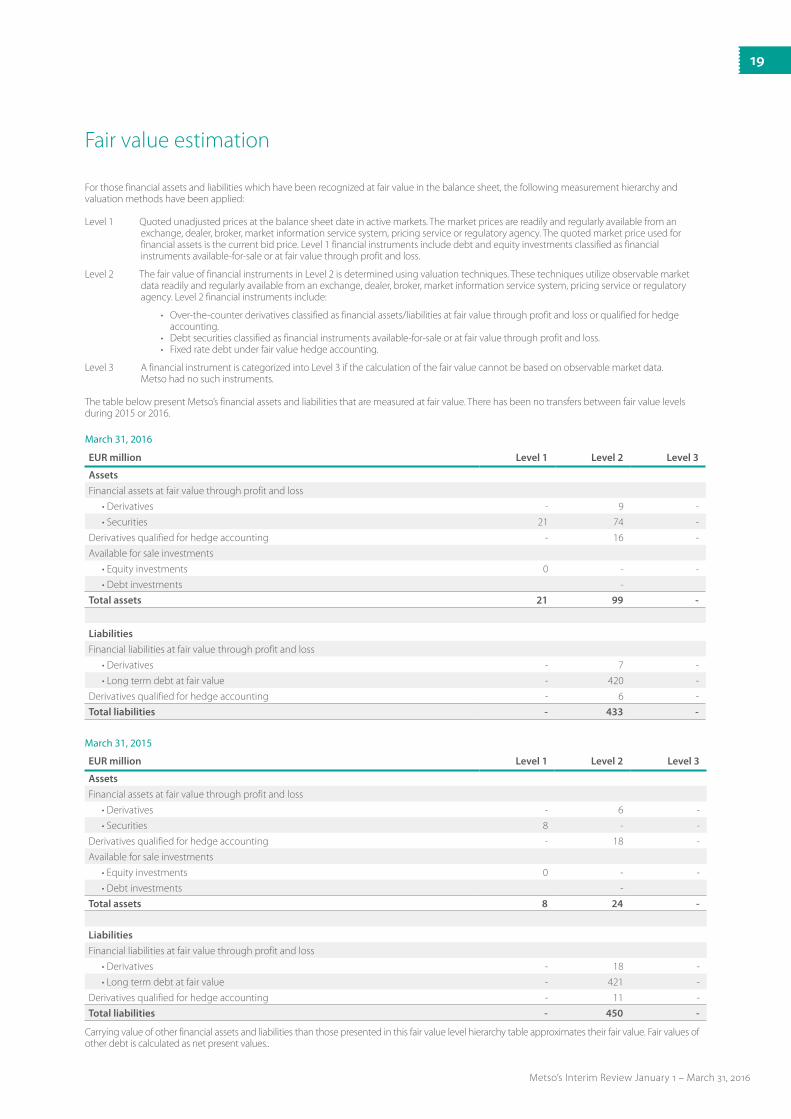
Fair value estimation
EUR million Level 1 Level 2 Level 3
Assets
Financial assets at fair value through profit and loss
• Derivatives - 9 -
• Securities 21 74 -
Derivatives qualified for hedge accounting - 16 -
Available for sale investments
• Equity investments 0 - -
• Debt investments -
Total assets 21 99 -
Liabilities
Financial liabilities at fair value through profit and loss
• Derivatives - 7 -
• Long term debt at fair value - 420 -
Derivatives qualified for hedge accounting - 6 -
Total liabilities - 433 -
March 31, 2016
EUR million Level 1 Level 2 Level 3
Assets
Financial assets at fair value through profit and loss
• Derivatives - 6 -
• Securities 8 - -
Derivatives qualified for hedge accounting - 18 -
Available for sale investments
• Equity investments 0 - -
• Debt investments -
Total assets 8 24 -
Liabilities
Financial liabilities at fair value through profit and loss
• Derivatives - 18 -
• Long term debt at fair value - 421 -
Derivatives qualified for hedge accounting - 11 -
Total liabilities - 450 -
March 31, 2015
For those financial assets and liabilities which have been recognized at fair value in the balance sheet, the following measurement hierarchy and valuation methods have been applied:
Level 1 Quoted unadjusted prices at the balance sheet date in active markets. The market prices are readily and regularly available from an exchange, dealer, broker, market information service system, pricing service or regulatory agency. The quoted market price used for financial assets is the current bid price. Level 1 financial instruments include debt and equity investments classified as financial instruments available-for-sale or at fair value through profit and loss.
Level 2 The fair value of financial instruments in Level 2 is determined using valuation techniques. These techniques utilize observable market data readily and regularly available from an exchange, dealer, broker, market information service system, pricing service or regulatory agency. Level 2 financial instruments include:
• Over-the-counter derivatives classified as financial assets/liabilities at fair value through profit and loss or qualified for hedge accounting.
• Debt securities classified as financial instruments available-for-sale or at fair value through profit and loss. • Fixed rate debt under fair value hedge accounting.
Level 3 A financial instrument is categorized into Level 3 if the calculation of the fair value cannot be based on observable market data. Metso had no such instruments.
The table below present Metso’s financial assets and liabilities that are measured at fair value. There has been no transfers between fair value levels during 2015 or 2016.
Carrying value of other financial assets and liabilities than those presented in this fair value level hierarchy table approximates their fair value. Fair values of other debt is calculated as net present values..
19
Metso’s Interim Review January 1 – March 31, 2016

EUR million Mar 31, 2016 Mar 31, 2015 Dec 31, 2015
On own behalf
Mortgages - 1 -
On behalf of others
Guarantees - 0 1
Other commitments
Repurchase commitments 2 2 2
Other contingencies 3 2 3
Lease commitments 128 157 142
EUR million Mar 31, 2016 Mar 31, 2015 Dec 31, 2015
Forward exchange rate contracts 980 1,074 1,009
Interest rate swaps 225 265 265
Cross currency swaps 244 244 244
Option agreements
Bought - - -
Sold - 20 20
Assets pledged and contingent liabilities
Notional amounts of derivative financial instruments
The notional amount of electricity forwards was 59 GWh as of March 31, 2016 and 101 GWh as of March 31, 2015.
The notional amount of nickel forwards to hedge stainless steel prices was 294 tons as of March 31, 2016 and 360 tons as of March 31, 2015.
The notional amounts indicate the volumes in the use of derivatives, but do not indicate the exposure to risk.
20
Metso’s Interim Review January 1 – March 31, 2016

1-3/2016 1-3/2015 1-12/2015
Earnings per share, EUR 0.18 0.25 2.95
Diluted earnings per share, EUR 0.18 0.25 2.95
Equity/share at end of period, EUR 8.69 7.66 9.58
Return on equity (ROE), % 7.8 12.6 33.1
Return on capital employed (ROCE) before taxes, % 9.4 12.9 25.7
Return on capital employed (ROCE) after taxes, % 7.2 9.4 22.4
Equity to assets ratio at end of period, % 43.9 36.6 48.3
Net gearing at end of period, % 6.9 41.4 10.6
Free cash flow, EUR million 62 87 341
Free cash flow/share, EUR 0.41 0.58 2.27
Cash conversion, % * 230 235 180
Gross capital expenditure (excl. business acquisitions), EUR million 6 12 46
Business acquisitions, net of cash acquired, EUR million - - -
Depreciation and amortization, EUR million 16 19 69
Number of outstanding shares at end of period (thousands) 149,985 149,985 149,985
Average number of shares (thousands) 149,985 149,904 149,965
Average number of diluted shares (thousands) 150,026 149,927 149,989
1-3/2016 1-3/2015 1-12/2015 Mar 31, 2016 Mar 31, 2015 Dec 31, 2015
USD (US dollar) 1.1020 1.1361 1.1130 1.1385 1.0759 1.0887
SEK (Swedish krona) 9.2713 9.3534 9.3414 9.2253 9.2901 9.1895
GBP (Pound sterling) 0.7689 0.7463 0.7284 0.7916 0.7273 0.7340
CAD (Canadian dollar) 1.4996 1.4030 1.4236 1.4738 1.3738 1.5116
BRL (Brazilian real) 4.2995 3.2465 3.7024 4.1174 3.4958 4.3117
CNY (Chinese yuan) 7.1821 7.0798 6.9924 7.3514 6.6710 7.0608
AUD (Australian dollar) 1.5088 1.4469 1.4836 1.4807 1.4154 1.4897
Key ratios
Exchange rates used
* Gain on disposal of the PAS business is excluded from profit, when calculating cash conversion in 1-12/2015.
21
Metso’s Interim Review January 1 – March 31, 2016
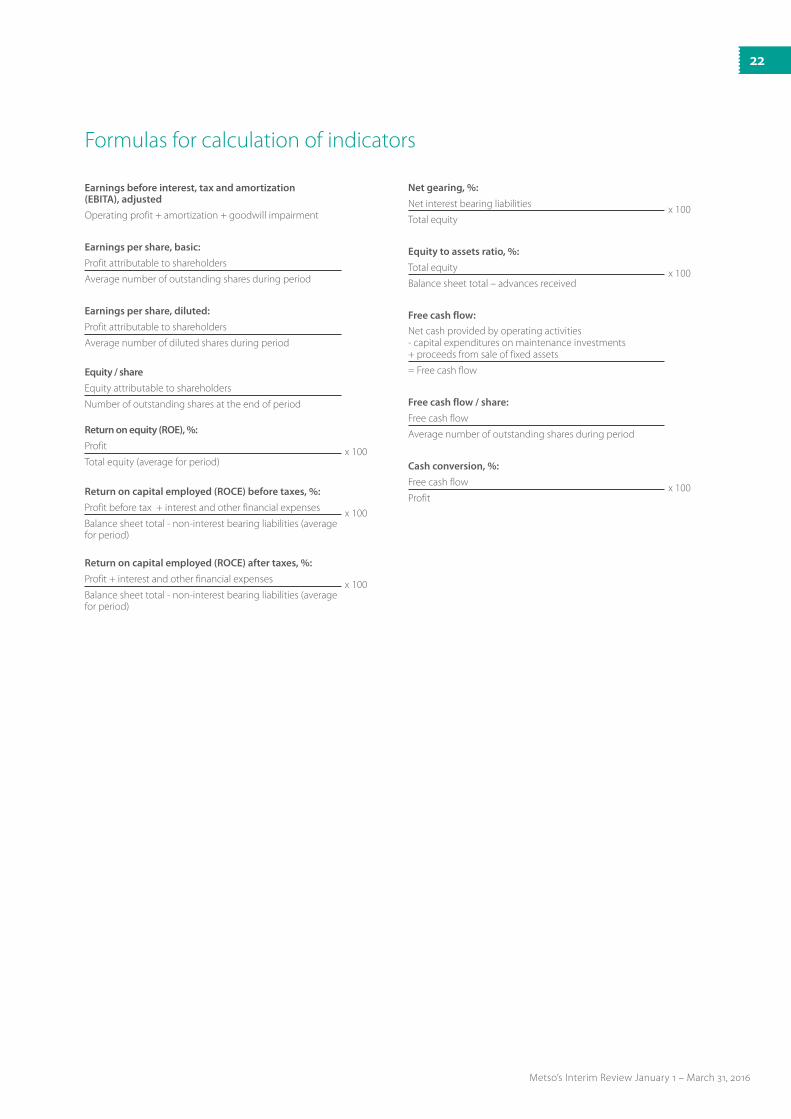
Formulas for calculation of indicators
Earnings before interest, tax and amortization (EBITA), adjusted
Operating profit + amortization + goodwill impairment
Earnings per share, basic:
Profit attributable to shareholders
Average number of outstanding shares during period
Earnings per share, diluted:
Profit attributable to shareholders
Average number of diluted shares during period
Equity / share
Equity attributable to shareholders
Number of outstanding shares at the end of period
Return on equity (ROE), %:
Profit x 100Total equity (average for period)
Return on capital employed (ROCE) before taxes, %:
Profit before tax + interest and other financial expenses x 100Balance sheet total - non-interest bearing liabilities (average for period)
Return on capital employed (ROCE) after taxes, %:
Profit + interest and other financial expenses x 100Balance sheet total - non-interest bearing liabilities (average for period)
Net gearing, %:
Net interest bearing liabilities x 100Total equity
Equity to assets ratio, %:
Total equity x 100Balance sheet total – advances received
Free cash flow:
Net cash provided by operating activities- capital expenditures on maintenance investments+ proceeds from sale of fixed assets
= Free cash flow
Free cash flow / share:
Free cash flow
Average number of outstanding shares during period
Cash conversion, %:
Free cash flow x 100Profit
22
Metso’s Interim Review January 1 – March 31, 2016
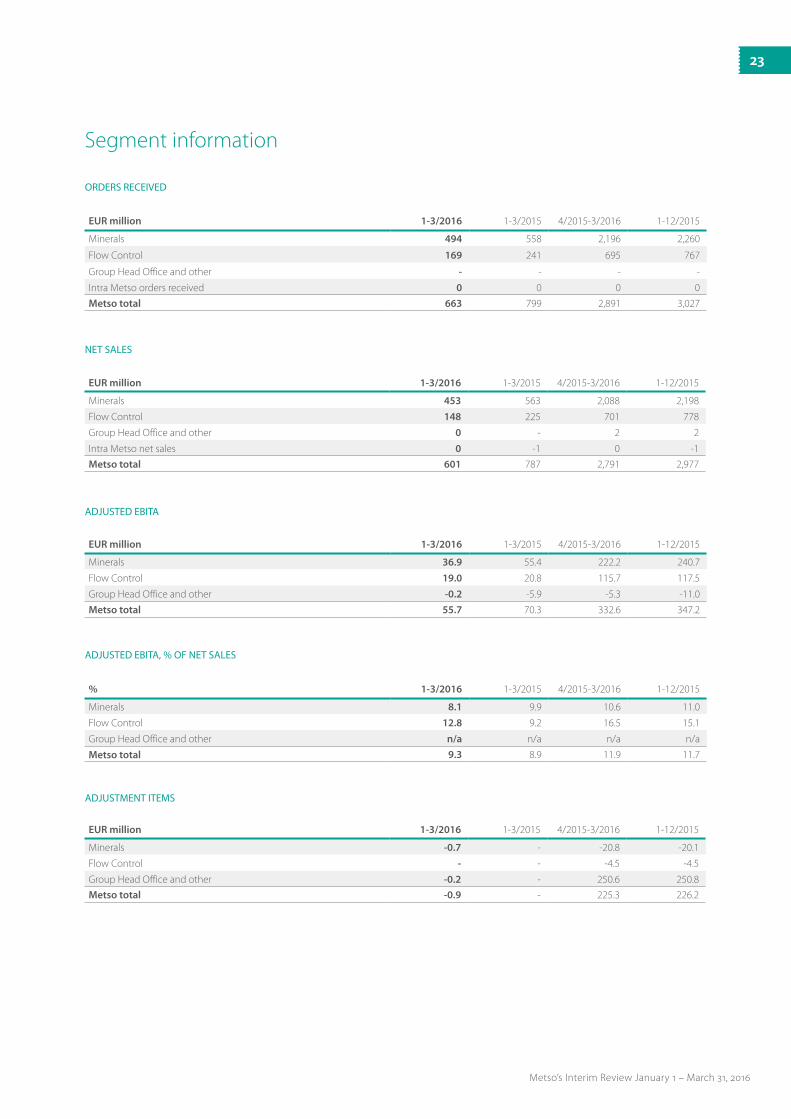
Segment information
EUR million 1-3/2016 1-3/2015 4/2015-3/2016 1-12/2015
Minerals 453 563 2,088 2,198
Flow Control 148 225 701 778
Group Head Office and other 0 - 2 2
Intra Metso net sales 0 -1 0 -1
Metso total 601 787 2,791 2,977
NET SALES
EUR million 1-3/2016 1-3/2015 4/2015-3/2016 1-12/2015
Minerals 36.9 55.4 222.2 240.7
Flow Control 19.0 20.8 115.7 117.5
Group Head Office and other -0.2 -5.9 -5.3 -11.0
Metso total 55.7 70.3 332.6 347.2
ADJUSTED EBITA
% 1-3/2016 1-3/2015 4/2015-3/2016 1-12/2015
Minerals 8.1 9.9 10.6 11.0
Flow Control 12.8 9.2 16.5 15.1
Group Head Office and other n/a n/a n/a n/a
Metso total 9.3 8.9 11.9 11.7
ADJUSTED EBITA, % OF NET SALES
EUR million 1-3/2016 1-3/2015 4/2015-3/2016 1-12/2015
Minerals -0.7 - -20.8 -20.1
Flow Control - - -4.5 -4.5
Group Head Office and other -0.2 - 250.6 250.8
Metso total -0.9 - 225.3 226.2
ADJUSTMENT ITEMS
EUR million 1-3/2016 1-3/2015 4/2015-3/2016 1-12/2015
Minerals 494 558 2,196 2,260
Flow Control 169 241 695 767
Group Head Office and other - - - -
Intra Metso orders received 0 0 0 0
Metso total 663 799 2,891 3,027
ORDERS RECEIVED
23
Metso’s Interim Review January 1 – March 31, 2016

EUR million 1-3/2016 1-3/2015 4/2015-3/2016 1-12/2015
Minerals 34.7 53.8 194.1 213.2
Flow Control 18.4 19.4 109.4 110.4
Group Head Office and other -2.7 -7.9 236.9 231.7
Metso total 50.4 65.3 540.4 555.3
OPERATING PROFIT (LOSS)
% 1-3/2016 1-3/2015 4/2015-3/2016 1-12/2015
Minerals 7.7 9.6 9.3 9.7
Flow Control 12.4 8.6 15.6 14.2
Group Head Office and other n/a n/a n/a n/a
Metso total 8.4 8.3 19.4 18.7
OPERATING PROFIT (LOSS), % OF NET SALES
EUR million 1-3/2016 1-3/2015 4/2015-3/2016 1-12/2015
Minerals -1.6 -1.6 -7.4 -7.4
Flow Control -0.6 -1.3 -1.9 -2.6
Group Head Office and other -2.2 -2.0 -8.3 -8.1
Metso total -4.4 -4.9 -17.6 -18.1
AMORTIZATION
24
Metso’s Interim Review January 1 – March 31, 2016
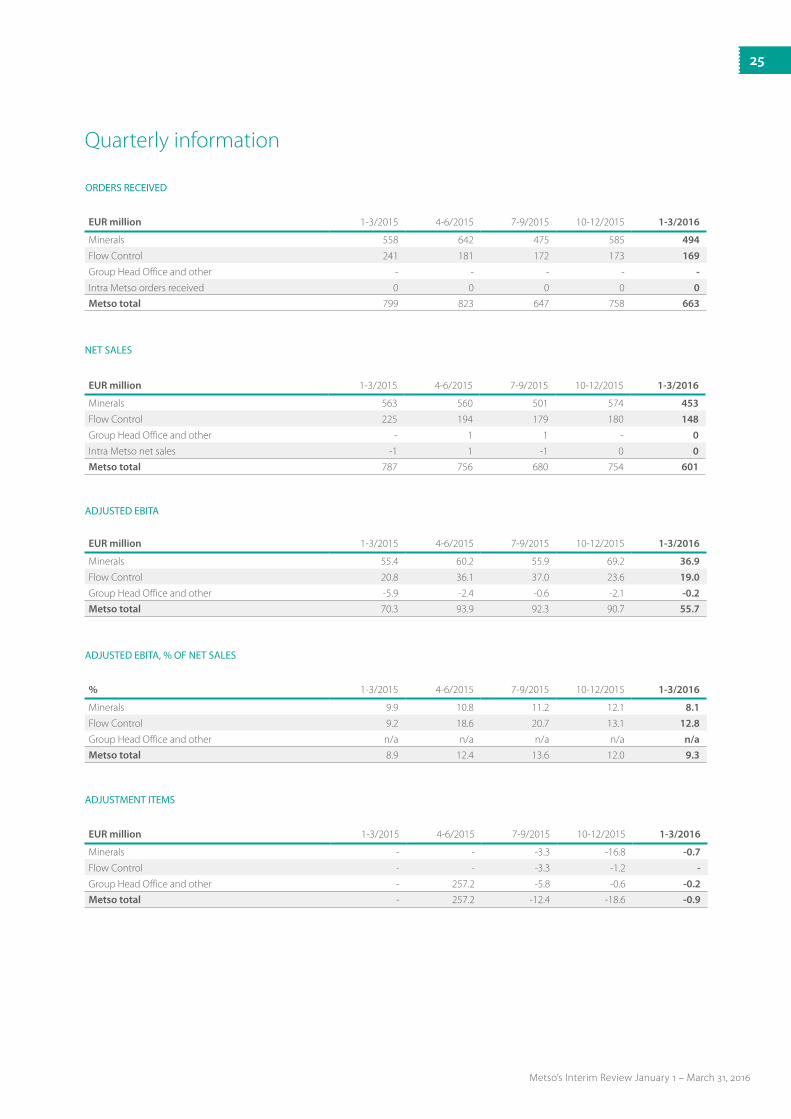
EUR million 1-3/2015 4-6/2015 7-9/2015 10-12/2015 1-3/2016
Minerals 563 560 501 574 453
Flow Control 225 194 179 180 148
Group Head Office and other - 1 1 - 0
Intra Metso net sales -1 1 -1 0 0
Metso total 787 756 680 754 601
NET SALES
EUR million 1-3/2015 4-6/2015 7-9/2015 10-12/2015 1-3/2016
Minerals 55.4 60.2 55.9 69.2 36.9
Flow Control 20.8 36.1 37.0 23.6 19.0
Group Head Office and other -5.9 -2.4 -0.6 -2.1 -0.2
Metso total 70.3 93.9 92.3 90.7 55.7
ADJUSTED EBITA
% 1-3/2015 4-6/2015 7-9/2015 10-12/2015 1-3/2016
Minerals 9.9 10.8 11.2 12.1 8.1
Flow Control 9.2 18.6 20.7 13.1 12.8
Group Head Office and other n/a n/a n/a n/a n/a
Metso total 8.9 12.4 13.6 12.0 9.3
ADJUSTED EBITA, % OF NET SALES
EUR million 1-3/2015 4-6/2015 7-9/2015 10-12/2015 1-3/2016
Minerals - - -3.3 -16.8 -0.7
Flow Control - - -3.3 -1.2 -
Group Head Office and other - 257.2 -5.8 -0.6 -0.2
Metso total - 257.2 -12.4 -18.6 -0.9
ADJUSTMENT ITEMS
Quarterly information
EUR million 1-3/2015 4-6/2015 7-9/2015 10-12/2015 1-3/2016
Minerals 558 642 475 585 494
Flow Control 241 181 172 173 169
Group Head Office and other - - - - -
Intra Metso orders received 0 0 0 0 0
Metso total 799 823 647 758 663
ORDERS RECEIVED
25
Metso’s Interim Review January 1 – March 31, 2016

% 1-3/2015 4-6/2015 7-9/2015 10-12/2015 1-3/2016
Minerals 9.6 10.4 10.2 8.7 7.7
Flow Control 8.6 18.6 18.4 12.2 12.4
Group Head Office and other n/a n/a n/a n/a n/a
Metso total 8.3 45.9 11.1 8.9 8.4
OPERATING PROFIT (LOSS), % OF NET SALES
EUR million Mar 31, 2015 June 30, 2015 Sep 30, 2015 Dec 31, 2015 Mar 31, 2016
Minerals 1,308 1,252 1,167 1,162 1,142
Flow Control 389 329 322 321 323
Group Head Office and other 494 695 718 784 827
Metso total 2,191 2,276 2,207 2,267 2,292
Capital employed includes only external balance sheet items.
CAPITAL EMPLOYED
EUR million Mar 31, 2015 June 30, 2015 Sep 30, 2015 Dec 31, 2015 Mar 31, 2016
Minerals 1,120 1,109 1,004 1,006 1,020
Flow Control 510 300 285 262 280
Intra Metso order backlog 1 2 1 0 0
Metso total 1,631 1,411 1,290 1,268 1,300
ORDER BACKLOG
PERSONNEL
EUR million 1-3/2015 4-6/2015 7-9/2015 10-12/2015 1-3/2016
Minerals -1.6 -1.9 -1.7 -2.2 -1.6
Flow Control -1.3 -0.1 -0.7 -0.5 -0.6
Group Head Office and other -2.0 -2.1 -2.0 -2.0 -2.2
Metso total -4.9 -4.1 -4.4 -4.7 -4.4
AMORTIZATION
EUR million 1-3/2015 4-6/2015 7-9/2015 10-12/2015 1-3/2016
Minerals 53.8 58.3 50.9 50.2 34.7
Flow Control 19.4 36.1 33.0 21.9 18.4
Group Head Office and other -7.9 252.7 -8.4 -4.7 -2.7
Metso total 65.3 347.1 75.5 67.4 50.4
OPERATING PROFIT (LOSS)
Mar 31, 2015 June 30, 2015 Sep 30, 2015 Dec 31, 2015 Mar 31, 2016
Minerals 10,372 9,920 9,493 9,222 9,068
Flow Control 2,956 2,966 2,858 2,821 2,797
Group Head Office and other 687 664 589 576 521
Metso total 14,015 13,550 12,940 12,619 12,386
26
Metso’s Interim Review January 1 – March 31, 2016

1-3/2016 EUR million Minerals Flow Control
Group Head office and other Metso total
Adjusted EBITA 36.9 19.0 -0.2 55.7
% of net sales 8.2 12.8 - 9.3
Capacity adjustment expenses -0.7 - -0.2 -0.9
Amortization of intangible assets -1.6 -0.6 -2.2 -4.4
Operating profit (EBIT) 34.7 18.4 -2.7 50.4
Adjustments and amortization of intangible assets
1-3/2015 EUR million Minerals Flow Control
Group Head office and other Metso total
Adjusted EBITA, excluding PAS 55.4 28.4 -5.9 77.9
% of net sales 9.9 16.6 - 10.6
PAS adjustment - -7.6 - -7.6
Adjusted EBITA 55.4 20.8 -5.9 70.3
Amortization of intangible assets -1.6 -1.3 -2.0 -4.9
Operating profit (EBIT) 53.8 19.4 -7.9 65.3
1-12/2015 EUR million Minerals Flow Control
Group Head office and other Metso total
Adjusted EBITA, excluding PAS 240.7 126.2 -11.0 355.9
% of net sales 11.0 17.5 - 12.2
PAS adjustment - -8.7 - -8.7
Adjusted EBITA 240.7 117.5 -11.0 347.2
Gain on disposal of the PAS business - - 252.3 252.3
Capacity adjustment expenses -20.1 -1.2 - -21.3
Other costs - -3.3 -1.5 -4.8
Amortization of intangible assets -7.4 -2.6 -8.1 -18.1
Operating profit (EBIT) 213.2 110.4 231.7 555.3
27
Metso’s Interim Review January 1 – March 31, 2016
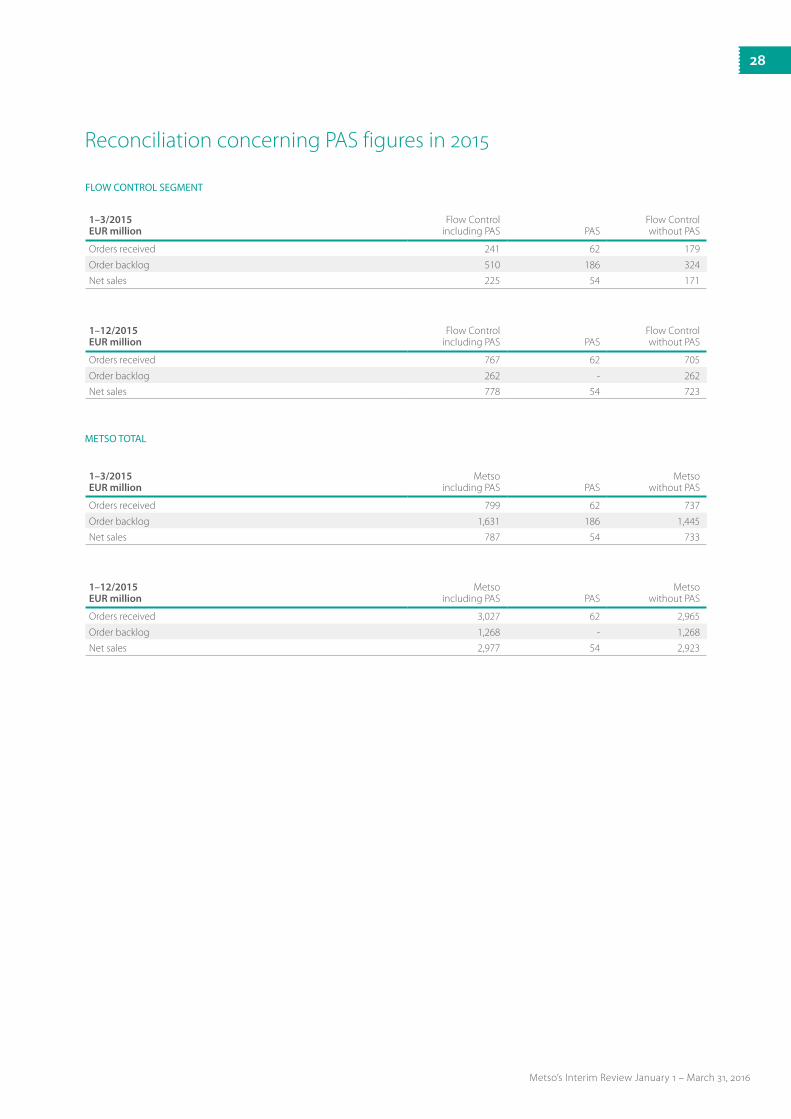
Reconciliation concerning PAS figures in 2015
METSO TOTAL
1–3/2015EUR million
Flow Control including PAS PAS
Flow Control without PAS
Orders received 241 62 179
Order backlog 510 186 324
Net sales 225 54 171
FLOW CONTROL SEGMENT
1–12/2015EUR million
Flow Control including PAS PAS
Flow Control without PAS
Orders received 767 62 705
Order backlog 262 - 262
Net sales 778 54 723
1–3/2015EUR million
Metso including PAS PAS
Metso without PAS
Orders received 799 62 737
Order backlog 1,631 186 1,445
Net sales 787 54 733
1–12/2015EUR million
Metso including PAS PAS
Metso without PAS
Orders received 3,027 62 2,965
Order backlog 1,268 - 1,268
Net sales 2,977 54 2,923
28
Metso’s Interim Review January 1 – March 31, 2016

Metso Corporation, Group Head Office, Fabianinkatu 9 A, PO Box 1220, FIN-00101 Helsinki, FinlandTel. +358 20 484 100 • Fax +358 20 484 101 • www.metso.com
Metso’s Financial Reporting in 2016
Metso’s upcoming Interim Reviews for 2016 will be published as follows: January–June on July 21, and January–September on October 21.