Embed Size (px)
Citation preview


© Metso
Forward looking statements
It should be noted that certain statements herein which are not historical facts, including, without limitation, those regardingexpectations for general economic development and the market situation, expectations for customer industry profitability and investment willingness, expectations for company growth, development and profitability and the realization of synergy benefits and cost savings, and statements preceded by ”expects”, ”estimates”, ”forecasts” or similar expressions, are forward looking statements. These statements are based on current decisions and plans and currently known factors. They involve risks and uncertainties which may cause the actual results to materially differ from the results currently expected by the company.
Such factors include, but are not limited to:
1) general economic conditions, including fluctuations in exchange rates and interest levels which influence the operating environment and profitability of customers and thereby the orders received by the company and their margins
2) the competitive situation, especially significant technological solutions developed by competitors
3) the company’s own operating conditions, such as the success of production, product development and project management and their continuous development and improvement
4) the success of pending and future acquisitions and restructuring.
2

© Metso
50
100
150
200
250
300
350
400
0
2
4
6
8
10
12
14
Lost time incident frequency (LTIF)
Total number of lost time incidents
3 * LTIF September 2016
Safety is an important driver for successContinuous focus on safety leads to results
• Safe working environment for all employees• Improved safety performance supports
productivity• Demand from customers: license to operate• Actions leading to improvement:
• Active and visible management support
• Safety being part of every decision• Safety included in incentive plans• Continuous development of safety
culture • High focus on safe working methods• Continuous learning
LTIF2.6 *

© Metso
Third quarter 2016 in brief
• Market environment continued to be challenging
• Minerals equipment orders increased 19%
• Flow Control saw weakening in the oil and gas sector
• Profitability at a healthy level
• Good free cash flow
• Strong balance sheet
4 Figures in brackets refer to the corresponding period in 2015, unless otherwise stated.
Orders received:EUR 628 million, -3%
Net sales:EUR 638 million, -6%
Adjusted EBITA margin:12.1% (13.6%)
Free cash flow:EUR 106 million (117 million)
Net gearing:5.1% (15.0%)
© Metso
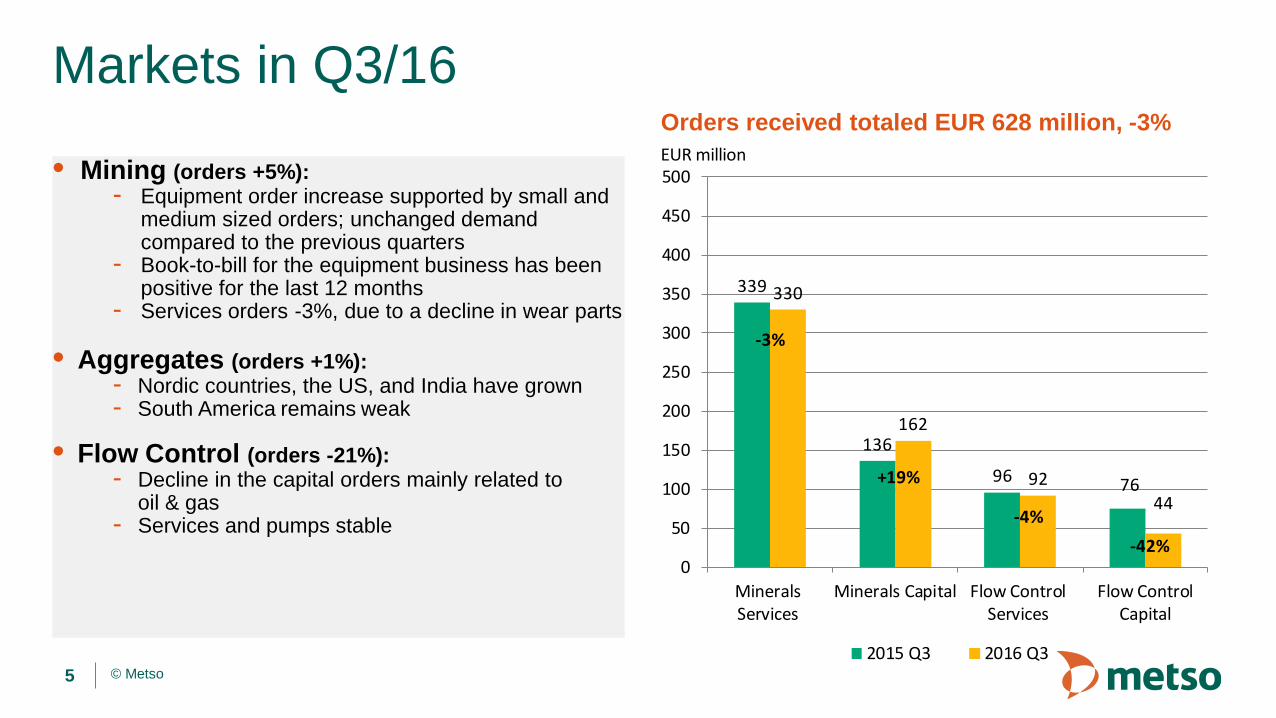
• Mining (orders +5%):- Equipment order increase supported by small and
medium sized orders; unchanged demand compared to the previous quarters
- Book-to-bill for the equipment business has been positive for the last 12 months
- Services orders -3%, due to a decline in wear parts
• Aggregates (orders +1%):- Nordic countries, the US, and India have grown- South America remains weak
• Flow Control (orders -21%):- Decline in the capital orders mainly related to
oil & gas- Services and pumps stable
Markets in Q3/16
5
Orders received totaled EUR 628 million, -3%
339
136
96 76
330
162
9244
0
50
100
150
200
250
300
350
400
450
500
MineralsServices
Minerals Capital Flow ControlServices
Flow ControlCapital
2015 Q3 2016 Q3
-3%
+19%
-4%-42%
EUR million

© Metso
Orders received by market area
6
North America Q3/ EUR 134 million, -4%Q1-Q3/ EUR 420 million, -13%
South and Central AmericaQ3/ EUR 114 million, -9%Q1-Q3/ EUR 444 million, -6%
Europe Q3/ EUR 179 million, +16%Q1-Q3/ EUR 522 million, +3%
Africa and Middle EastQ3/ EUR 61 million, +2%Q1-Q3/ EUR 208 million, -2%
China Q3/ EUR 34 million, -4%Q1-Q3/ EUR 119 million, -31%
Asia-PacificQ3/ EUR 106 million, -20%Q1-Q3/ EUR 339 million, -6%
48% from the emerging markets (Q3/2016)

© Metso
Financial highlights• Healthy profitability in the current market
situation- 12.1% adjusted EBITA margin
• Services margins remain good
• Cost control measures have delivered results and actions will continue
• Strong cash flow and balance sheet
7
791 834728 721 737
823
647
758
663761
628757
885800
921
733756
680 754
601671 638
11.4
13.7
12.413.0
10.6
12.4
13.6
12.0
9.3
11.512.1
0
2
4
6
8
10
12
14
0
200
400
600
800
1,000
1,200
1,400
Q1 Q2 Q3 Q4 Q1 Q2 Q3 Q4 Q1 Q2 Q3
2014 2015 2016
Orders received Net sales Adjusted EBITA %
EUR million %

Eeva SipiläCFO
Financial performance

© Metso
Minerals quarterly performance• Equipment orders increased 19 percent while
services orders decreased 3 percent
• EBITA remained at a good level even with lower volumes, thanks to sales mix and cost control
• Equipment business is making small profit with current volumes
• Cost efficiency actions continue
• Strong cashflow
9
597662
558 544 558642
475
585494
593492
608706
619 743 563
560501 574
453504 477
11.3
13.6
11.9
13.5
9.910.8 11.2
12.1
8.2
10.8 10.8
0
2
4
6
8
10
12
14
16
0
100
200
300
400
500
600
700
800
Q1 Q2 Q3 Q4 Q1 Q2 Q3 Q4 Q1 Q2 Q3
2014 2015 2016
EUR million
Minerals Orders Received Minerals Net SalesMinerals adjusted EBITA %
%

© Metso
Flow Control quarterly performance• Order intake was low in the quarter driven by
oil & gas, both projects and day-to-day business were affected
• Service orders stable
• Net sales down 10 percent y-o-y reflecting lower North American order backlog
• Healthy profitability in the quarter- Decline of year-to-date profitability remains
volume driven, as gross margins are holding up
• Cost-efficiency actions continue
10
194172 172 178 179 181 172 173 169 168
136149
177185
173 170
194179 180
148 167 161
14.2
17.3
20.2
14.2
16.718.6
20.7
13.1 12.8 13.2
17.5
0
5
10
15
20
25
0
50
100
150
200
250
Q1 Q2 Q3 Q4 Q1 Q2 Q3 Q4 Q1 Q2 Q3
2014 2015 2016
EUR million
Flow Control Orders Received Flow Control Net SalesFlow Control adjusted EBITA %
%

© Metso
Volume decline biggest single factor in profitability
11
Note: Graph is illustrative: Volume, margin and SG&A changes have been calculated with constant currencies. Currency impact is included in ’FX rates & Others’.
262 210
0
50
100
150
200
250
300
Q1-Q3/2015 AdjustedEBITA
Volume Margin S, G & A FX rates & Others Q1-Q3/2016 AdjustedEBITA
EUR million

© Metso
Gross margin is holding up despite lower volume
• Healthy product margins in all businesses despite lower volume indicate successful cost and pricing management in challenging markets
• Ongoing cost actions in businesses continue to improve structure going forward
• COGS headcount is down by over 600 persons year-to-date 2016
- approx. 1,800 down since beginning of 2015
• Procurement savings target is similar as last year (EUR 50 million)
12
211
252240
261
222235
224 220
176196
181
27.9 28.430.0
28.330.3 31.2
32.9
29.2 29.2 29.2 28.4
0
5
10
15
20
25
30
35
0
50
100
150
200
250
300
350
Q1 Q2 Q3 Q4 Q1 Q2 Q3 Q4 Q1 Q2 Q3
2014 2015 2016Gross profit Gross margin
EUR million %

© Metso
SG&A costs flat in proportion to sales
• Efficiency measures have reduced SG&A headcount by over 300 persons year-to-date 2016
- over 900 reduction since the beginning of 2015
• Actions will continue but also incur restructuring costs in fourth quarter
• Discretionary spend controls continue
• No significant credit losses
13
139151
142
167
147 147
127
149
126 130 125
18.417.0 17.7 18.1
20.1 19.418.6
19.820.9
19.4 19.6
0
5
10
15
20
25
0
50
100
150
200
250
Q1 Q2 Q3 Q4 Q1 Q2 Q3 Q4 Q1 Q2 Q3
2014 2015 2016
EUR million
SGA SGA %
%

© Metso
Healthy cash flow and solid financial position
EUR million Q3/2016 Q3/2015 Change % Q1-Q3/ 2016 Q1-Q3/ 2015 Change % 2015
EBIT 63 76 -17 183 488* -63 555*
Earnings per share, EUR 0.24 0.29 -17 0.70 2.60* -73 2.95*
Free cash flow 106 117 -9 242 282 -14 341
* Including capital gain from divestment of PAS14
Sep 30, 2016 Dec 31, 2015
Return on equity (ROE), annualized, % 9.8 33.1*
Return on capital employed (ROCE) before taxes, annualized, % 11.2 25.7*
Gearing at the end of the period, % 5.1 10.6
Cash conversion, % 233 180
Equity to assets ratio at the end of the period, % 48.1 48.3

© Metso
592 598 609 588 550
537 590 626511 620
552 550 542541
537
345 343 330331 310
181 186 185193 180
2,207 2,267 2,2922,164 2,197
0
500
1,000
1,500
2,000
2,500
Q3 Q4 Q1 Q2 Q3
2015 2016
EUR Million
Capital employed and net working capital
15
Net working capital
Cash
Intangible assets
Tangible assets
Other
Net working capital
Inventories
Trade payables
Advances + POC
Other
Trade receivables
752 715 726 728 709
486 482 450 476 459
-279 -249 -234 -255 -241
-155 -128 -133 -152 -173
-212 -222 -200 -209 -204
592 598 609 588 550
-1,000
-500
0
500
1,000
1,500
Q3 Q4 Q1 Q2 Q3
2015 2016
EUR million

Matti Kähkönen President and CEO
Outlook and backlog

© Metso
24% of net sales of which 60% services*
Outlook:• Satisfactory for products related to
customers’ new investments as well as services
• Increased uncertainty in the oil & gas market
*Based on rolling 12 months net sales
Short-term market outlook largely unchanged
17
50% of net sales of which 70% services*
Outlook:• Weakness to continue in the
equipment and systems business• Order pipeline consists of small and
midsize orders• Demand for services satisfactory;
activity in engineered services is soft and miners’ cost actions continue
23% of net sales of which 45% services*
Outlook:• Satisfactory for both equipment and
services• The Nordics, North America and India
remain positive• Brazil continues to be weak
Mining Aggregates Flow Control

© Metso
Order backlog
18
Flow ControlMinerals, services
• Backlog 3% higher compared to the end of 2015• Deliveries for the following year 18% higher year-on-year• Market uncertainties causing some delays in deliveries
Minerals, capital
1,780 1,735 1,672
1,402 1,445 1,4111,289 1,268 1,300
1,3991,305
0
500
1,000
1,500
2,000
Q1 Q2 Q3 Q4 Q1 Q2 Q3 Q4 Q1 Q2 Q3
2014 2015 2016
EUR Million
Deliveries in 2016
Deliveries after 2016
Deliveries in 2015
Deliveries after 2015
0
200
400
600
800
1,000
1,200
1,400
Order backlog Sep 30, 2015 Order backlog Sep 30, 2016
EUR million

© Metso19
Outlook for 2016
Metso’s overall trading conditions will be somewhat weaker in 2016 compared to 2015. Demand for our products and services is expected to develop as follows:
• remain weak for mining equipment and satisfactory for mining services • remain satisfactory for aggregates equipment and services• remain satisfactory for Flow Control products related to customers’ new
investments and has changed to satisfactory (previously: good) for Flow Control services, with increased uncertainty in the oil & gas market
At the end of September 2016, our backlog for the remainder of 2016 totaled approximately EUR 680 million but due to current market conditions we expect some deliveries to be postponed into 2017.
Internal efficiency actions will continue to improve competitiveness, resulting in net adjustment items of approximately EUR 30 million in 2016. Capital expenditure excluding acquisitions is expected to be lower than in 2015. Net financial costs are expected to be on the same level as in 2015.

company/metso metsogroup metsoworldmetsoworld metsogroup
www.metso.com

Appendix
© Metso
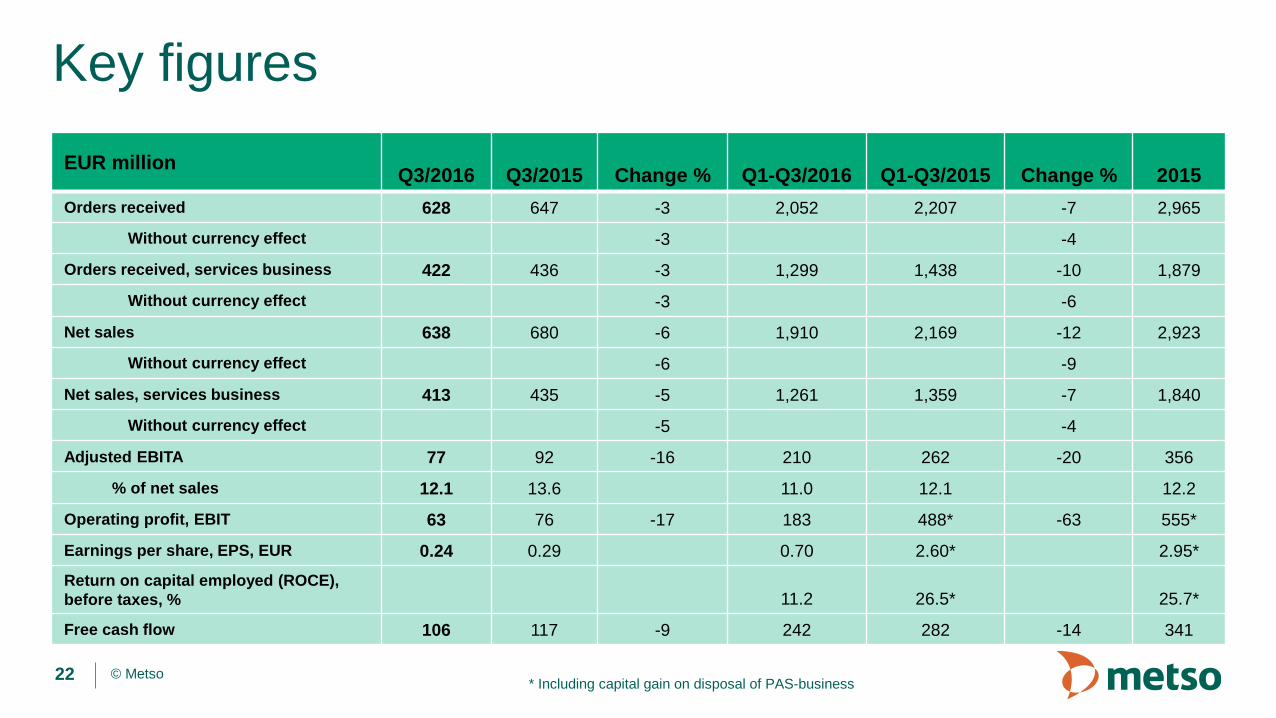
Key figures
22 * Including capital gain on disposal of PAS-business
EUR million Q3/2016 Q3/2015 Change % Q1-Q3/2016 Q1-Q3/2015 Change % 2015Orders received 628 647 -3 2,052 2,207 -7 2,965
Without currency effect -3 -4
Orders received, services business 422 436 -3 1,299 1,438 -10 1,879
Without currency effect -3 -6
Net sales 638 680 -6 1,910 2,169 -12 2,923
Without currency effect -6 -9
Net sales, services business 413 435 -5 1,261 1,359 -7 1,840
Without currency effect -5 -4
Adjusted EBITA 77 92 -16 210 262 -20 356
% of net sales 12.1 13.6 11.0 12.1 12.2
Operating profit, EBIT 63 76 -17 183 488* -63 555*
Earnings per share, EPS, EUR 0.24 0.29 0.70 2.60* 2.95*
Return on capital employed (ROCE), before taxes, % 11.2 26.5* 25.7*
Free cash flow 106 117 -9 242 282 -14 341