Embed Size (px)
Citation preview
1Moscow, 27 March 2015
Q4 AND 12M’14 US GAAP CONSOLIDATED FINANCIAL RESULTS
This document is confidential and has been prepared by NLMK (the “Company”) solely for use at the presentation of the Company and may not be reproduced, retransmitted or further distributed to any other person or published, in whole or in part, for any other purpose.
This document does not constitute or form part of any advertisement of securities, any offer or invitation to sell or issue or any solicitation of any offer to purchase or subscribe for, any shares in the Company or Global Depositary Shares (GDSs), nor shall it or any part of it nor the fact of its presentation or distribution form the basis of, or be relied on in connection with, any contract or investment decision.
No reliance may be placed for any purpose whatsoever on the information contained in this document or on assumptions made as to its completeness. No representation or warranty, express or implied, is given by the Company, its subsidiaries or any of their respective advisers, officers, employees or agents, as to the accuracy of the information or opinions or for any loss howsoever arising, directly or indirectly, from any use of this presentation or its contents.
The distribution of this document in other jurisdictions may be restricted by law and any person into whose possession this document comes should inform themselves about, and observe, any such restrictions.
This document may include forward-looking statements. These forward-looking statements include matters that are not historical facts or statements regarding the Company’s intentions, beliefs or current expectations concerning, among other things, the Company’s results of operations, financial condition, liquidity, prospects, growth, strategies, and the industry in which the Company operates. By their nature, forwarding-looking statements involve risks and uncertainties because they relate to events and depend on circumstances that may or may not occur in the future. The Company cautions you that forward-looking statements are not guarantees of future performance and that the Company’s actual results of operations, financial condition and liquidity and the development of the industry in which the Company operates may differ materially from those made in or suggested by the forward-looking statements contained in this document. In addition, even if the Company’s results of operations, financial condition and liquidity and the development of the industry in which the Company operates areconsistent with the forward-looking statements contained in this document, those results or developments may not be indicative of results or developments in future periods. The Company does not undertake any obligation to review or confirm analysts’ expectations or estimates or to update any forward-looking statements to reflect events that occur or circumstances that arise after the date of this presentation.
By attending this presentation you agree to be bound by the foregoing terms.
2
DISCLAIMER
CONTENT
1. Key results
2. Financial highlights
3. Segment results
4. Annex
3
OPERATING RESULTS
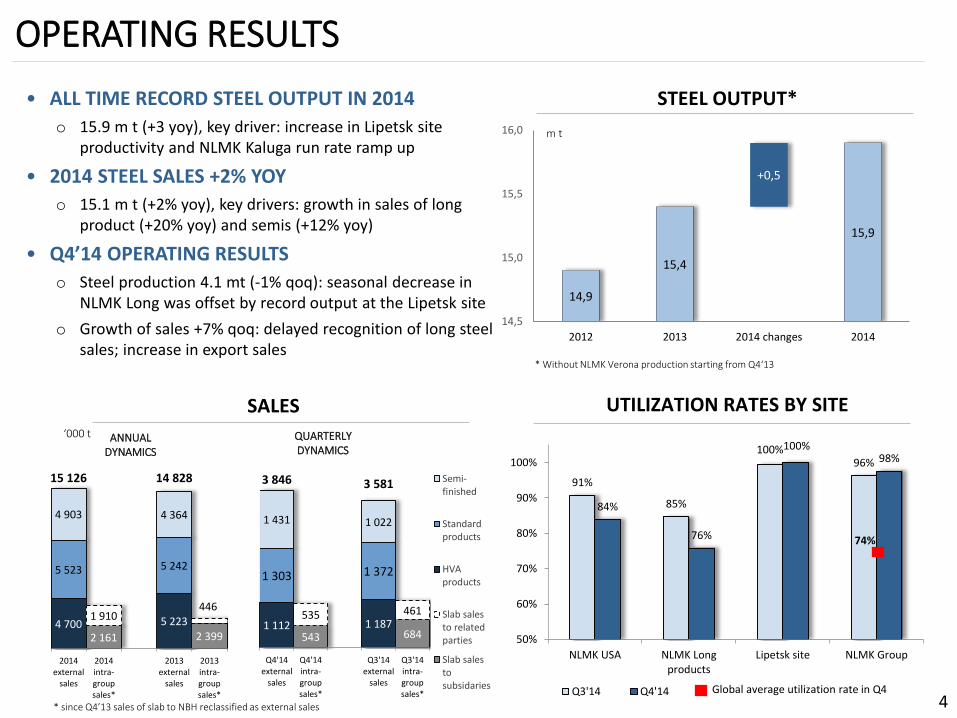
• ALL TIME RECORD STEEL OUTPUT IN 2014
o 15.9 m t (+3 yoy), key driver: increase in Lipetsk site productivity and NLMK Kaluga run rate ramp up
• 2014 STEEL SALES +2% YOY
o 15.1 m t (+2% yoy), key drivers: growth in sales of long product (+20% yoy) and semis (+12% yoy)
• Q4’14 OPERATING RESULTS
o Steel production 4.1 mt (-1% qoq): seasonal decrease in NLMK Long was offset by record output at the Lipetsk site
o Growth of sales +7% qoq: delayed recognition of long steel sales; increase in export sales
4
STEEL OUTPUT*
m t
14,9
15,4
15,9
+0,5
14,5
15,0
15,5
16,0
2012 2013 2014 changes 2014
91%
85%
100%96%
84%
76%
100%98%
50%
60%
70%
80%
90%
100%
NLMK USA NLMK Longproducts
Lipetsk site NLMK Group
Q3'14 Q4'14 Global average utilization rate in Q4
74%
UTILIZATION RATES BY SITE
* Without NLMK Verona production starting from Q4‘13
SALES
543 684
535 4611 112 1 187
1 303 1 372
1 431 1 022
3 846 3 581
Q4'14external
sales
Q4'14intra-groupsales*
Q3'14external
sales
Q3'14intra-groupsales*
Semi-finished
Standardproducts
HVAproducts
Slab salesto relatedparties
Slab salestosubsidaries
‘000 t
2 161 2 3994 700 5 223
5 523 5 242
4 903 4 364
1 910446
15 126 14 828
2014external
sales
2014intra-groupsales*
2013external
sales
2013intra-groupsales*
ANNUAL DYNAMICS
QUARTERLY DYNAMICS
* since Q4’13 sales of slab to NBH reclassified as external sales
FINANCIAL HIGHLIGHTS
5
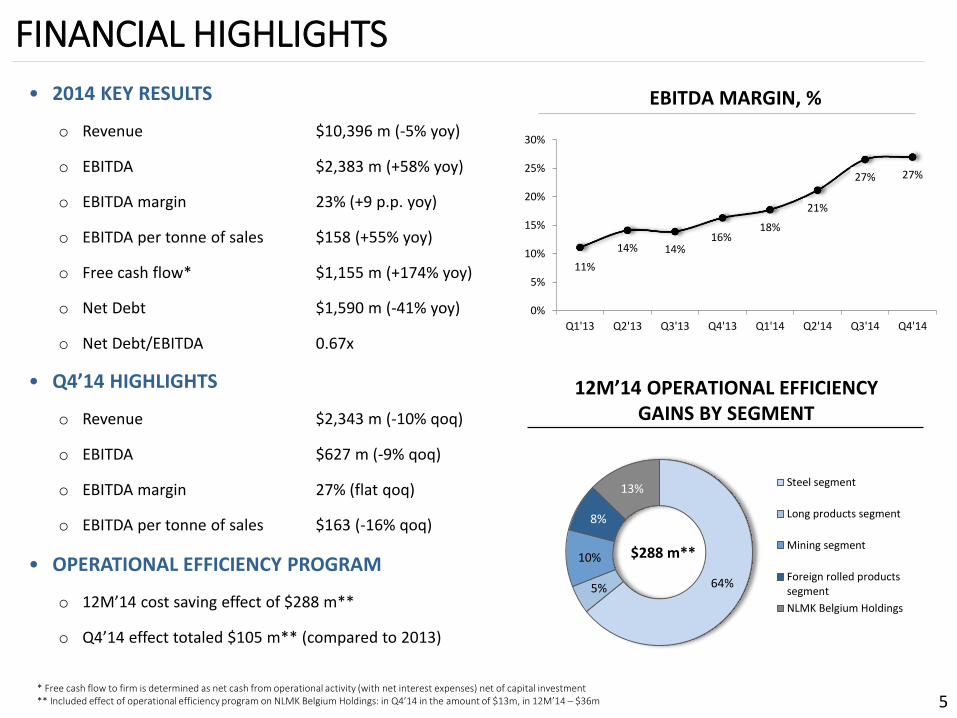
• 2014 KEY RESULTS
o Revenue $10,396 m (-5% yoy)
o EBITDA $2,383 m (+58% yoy)
o EBITDA margin 23% (+9 p.p. yoy)
o EBITDA per tonne of sales $158 (+55% yoy)
o Free cash flow* $1,155 m (+174% yoy)
o Net Debt $1,590 m (-41% yoy)
o Net Debt/EBITDA 0.67х
• Q4’14 HIGHLIGHTS
o Revenue $2,343 m (-10% qoq)
o EBITDA $627 m (-9% qoq)
o EBITDA margin 27% (flat qoq)
o EBITDA per tonne of sales $163 (-16% qoq)
• OPERATIONAL EFFICIENCY PROGRAM
o 12M’14 cost saving effect of $288 m**
o Q4’14 effect totaled $105 m** (compared to 2013)
EBITDA MARGIN, %
11%
14% 14%16%
18%
21%
27% 27%
0%
5%
10%
15%
20%
25%
30%
Q1'13 Q2'13 Q3'13 Q4'13 Q1'14 Q2'14 Q3'14 Q4'14
* Free cash flow to firm is determined as net cash from operational activity (with net interest expenses) net of capital investment** Included effect of operational efficiency program on NLMK Belgium Holdings: in Q4’14 in the amount of $13m, in 12M’14 – $36m
12M’14 OPERATIONAL EFFICIENCY GAINS BY SEGMENT
64%5%
10%
8%
13%Steel segment
Long products segment
Mining segment
Foreign rolled productssegment
NLMK Belgium Holdings
$288 m**
Q1’15 OUTLOOK
• MARKET
o Russia
◦ Consumption growth (+2% yoy in January-February 2015) on the back of trader restocking and increased demand for pipe products (+13% yoy in January-February 2015)
◦ Seasonal slowdown in the construction sector
◦ Decrease in import deliveries by 30% yoy
◦ Decrease in prices denominated in dollars by 10% qoq due to ruble devaluation and the increase in ruble prices during the quarter
o Europe: stable demand for steel products
o USA: weakening business activity and steel demand
• OPERATIONAL RESULTS
o Stable operational results qoq expected
6
CONTENT
1. Key results
2. Financial highlights
3. Segment results
4. Annex
7
1 757
1 505
252
121149
230
125
2 383
EBITDA2013
Efficiencyprogram**
Volumeand
structure
Spreadand costinflation
FXeffect
NBHdeconso-lidation
EBITDA2014
395411
383361 364
348329
349
310 308295
225
21 22 21 23 23 22 23 22 19 18 1914
0
20
40
60
80
100
100
150
200
250
300
350
400
450
Q1'12
Q2'12
Q3'12
Q4'12
Q1'13
Q2'13
Q3'13
Q4'13
Q1'14
Q2'14
Q3'14
Q4'14
Slab cash cost(Lipetsk site)
Iron ore concentrate cash cost(SGOK, rh)
2014 PROFITABILITY ANALYSIS
8
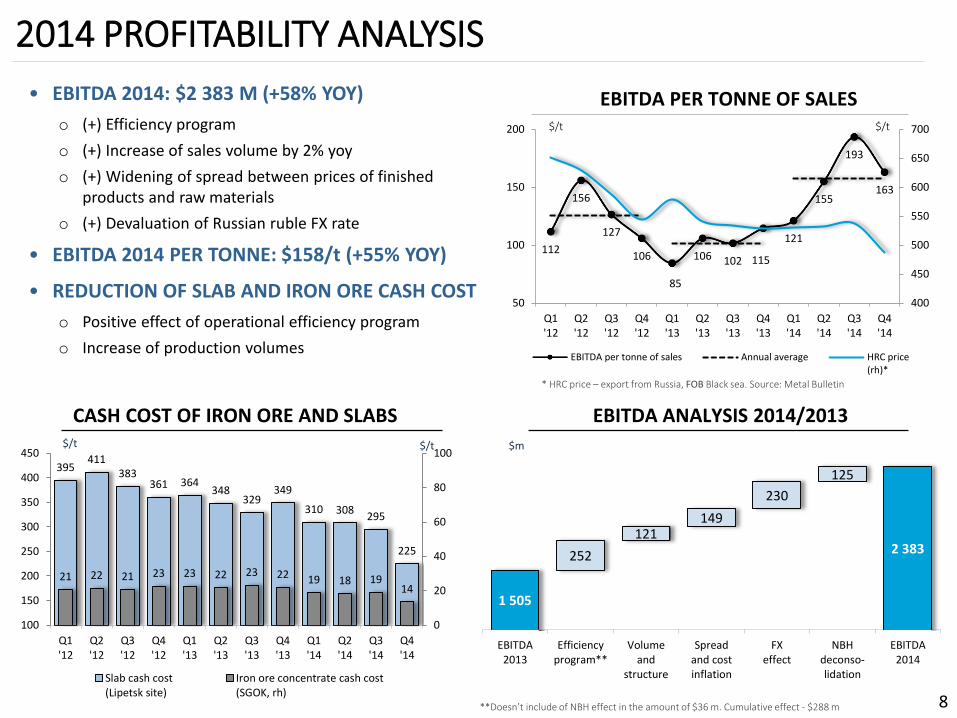
• EBITDA 2014: $2 383 M (+58% YOY)
o (+) Efficiency program
o (+) Increase of sales volume by 2% yoy
o (+) Widening of spread between prices of finished products and raw materials
o (+) Devaluation of Russian ruble FX rate
• EBITDA 2014 PER TONNE: $158/t (+55% YOY)
• REDUCTION OF SLAB AND IRON ORE CASH COST
o Positive effect of operational efficiency program
o Increase of production volumes
EBITDA PER TONNE OF SALES
112
156
127
106
85
106 102 115
121
155
193
163
400
450
500
550
600
650
700
50
100
150
200
Q1'12
Q2'12
Q3'12
Q4'12
Q1'13
Q2'13
Q3'13
Q4'13
Q1'14
Q2'14
Q3'14
Q4'14
EBITDA per tonne of sales Annual average HRC price(rh)*
$/t
EBITDA ANALYSIS 2014/2013
$m
$/t
* HRC price – export from Russia, FOB Black sea. Source: Metal Bulletin
CASH COST OF IRON ORE AND SLABS$/t $/t
**Doesn’t include of NBH effect in the amount of $36 m. Cumulative effect - $288 m
Q4’14 PROFITABILITY ANALYSIS
9
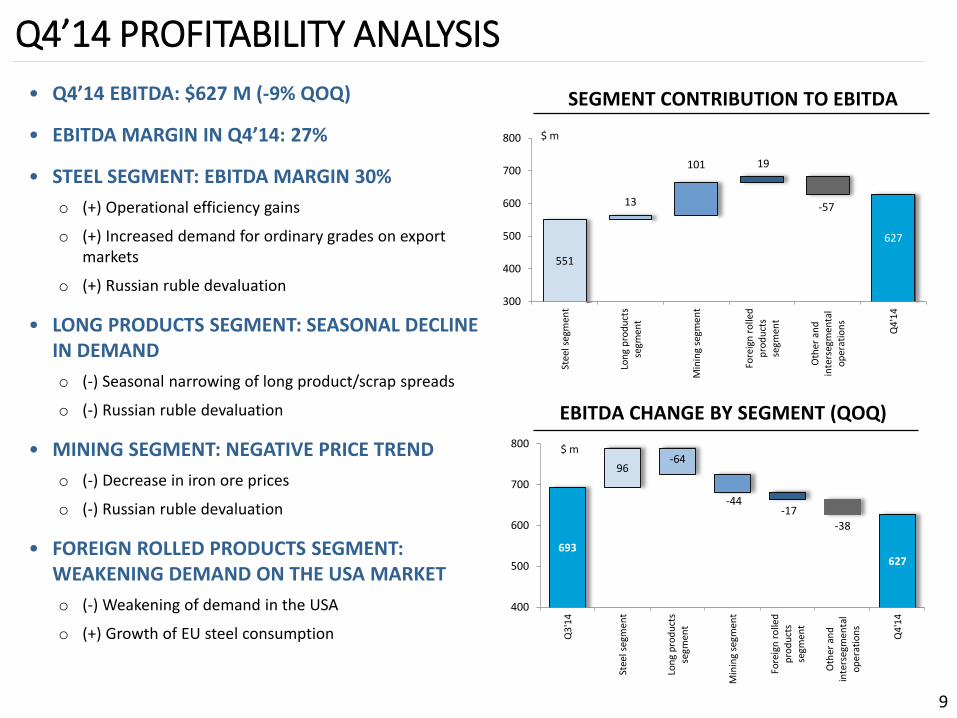
• Q4’14 EBITDA: $627 M (-9% QOQ)
• EBITDA MARGIN IN Q4’14: 27%
• STEEL SEGMENT: EBITDA MARGIN 30%
o (+) Operational efficiency gains
o (+) Increased demand for ordinary grades on export markets
o (+) Russian ruble devaluation
• LONG PRODUCTS SEGMENT: SEASONAL DECLINE IN DEMAND
o (-) Seasonal narrowing of long product/scrap spreads
o (-) Russian ruble devaluation
• MINING SEGMENT: NEGATIVE PRICE TREND
o (-) Decrease in iron ore prices
o (-) Russian ruble devaluation
• FOREIGN ROLLED PRODUCTS SEGMENT: WEAKENING DEMAND ON THE USA MARKET
o (-) Weakening of demand in the USA
o (+) Growth of EU steel consumption
EBITDA CHANGE BY SEGMENT (QOQ)
$ m
551
13
101 19
-57
627
300
400
500
600
700
800
Stee
l seg
men
t
Lon
g p
rod
uct
sse
gmen
t
Min
ing
segm
ent
Fore
ign
ro
lled
pro
du
cts
segm
ent
Oth
er a
nd
inte
rseg
men
tal
op
erat
ion
s
Q4
'14
$ m
SEGMENT CONTRIBUTION TO EBITDA
693
96-64
-44-17
-38
627
400
500
600
700
800
Q3
'14
Stee
l seg
men
t
Lon
g p
rod
uct
sse
gmen
t
Min
ing
segm
ent
Fore
ign
ro
lled
pro
du
cts
segm
ent
Oth
er a
nd
inte
rseg
men
tal
op
erat
ion
s
Q4
'14
EBITDA
Working capital changes
Other non-cash operations*
Income tax
Net interest **
NET OPERATING CASH FLOW
Capital expenditures ***
FREE CASH FLOW TO THE FIRM
Net repayments of borrowings/attraction of funds
FREE CASH FLOW TO EQUITY
Change in deposits and financial investment
Dividends
FX rate change
CHANGE IN CASH
CASH FLOW IN Q4’14
10
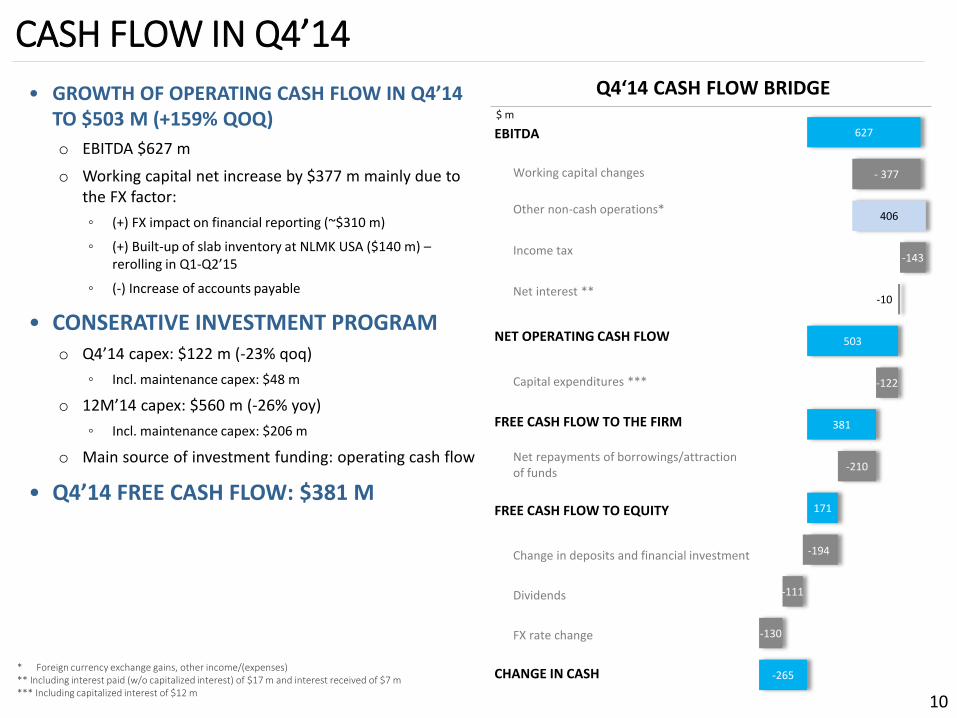
Q4‘14 CASH FLOW BRIDGE• GROWTH OF OPERATING CASH FLOW IN Q4’14 TO $503 M (+159% QOQ)
o EBITDA $627 m
o Working capital net increase by $377 m mainly due to the FX factor:
◦ (+) FX impact on financial reporting (~$310 m)
◦ (+) Built-up of slab inventory at NLMK USA ($140 m) –rerolling in Q1-Q2’15
◦ (-) Increase of accounts payable
• CONSERATIVE INVESTMENT PROGRAM o Q4’14 capex: $122 m (-23% qoq)
◦ Incl. maintenance capex: $48 m
o 12M’14 capex: $560 m (-26% yoy)
◦ Incl. maintenance capex: $206 m
o Main source of investment funding: operating cash flow
• Q4’14 FREE CASH FLOW: $381 M
$ m
* Foreign currency exchange gains, other income/(expenses)** Including interest paid (w/o capitalized interest) of $17 m and interest received of $7 m*** Including capitalized interest of $12 m
-265
-130
-111
-194
171
-210
381
-122
503
-10
-143
406
- 377
627
FREE CASH FLOW GROWTH
11
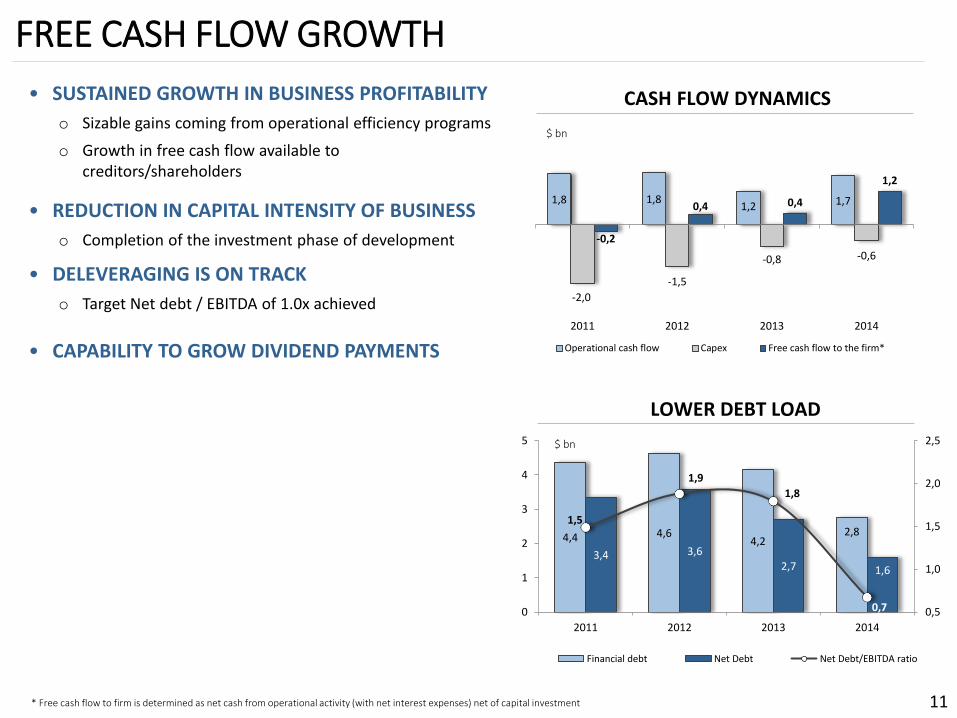
• SUSTAINED GROWTH IN BUSINESS PROFITABILITY
o Sizable gains coming from operational efficiency programs
o Growth in free cash flow available to creditors/shareholders
• REDUCTION IN CAPITAL INTENSITY OF BUSINESS
o Completion of the investment phase of development
• DELEVERAGING IS ON TRACK
o Target Net debt / EBITDA of 1.0x achieved
• CAPABILITY TO GROW DIVIDEND PAYMENTS
1,8 1,81,2 1,7
-2,0
-1,5
-0,8 -0,6
-0,2
0,4 0,4
1,2
2011 2012 2013 2014
Operational cash flow Capex Free cash flow to the firm*
CASH FLOW DYNAMICS
$ bn
4,4 4,64,2
2,8
3,4 3,62,7 1,6
1,5
1,9
1,8
0,7 0,5
1,0
1,5
2,0
2,5
0
1
2
3
4
5
2011 2012 2013 2014
Financial debt Net Debt Net Debt/EBITDA ratio
LOWER DEBT LOAD
$ bn
* Free cash flow to firm is determined as net cash from operational activity (with net interest expenses) net of capital investment
DEBT POSITION
12
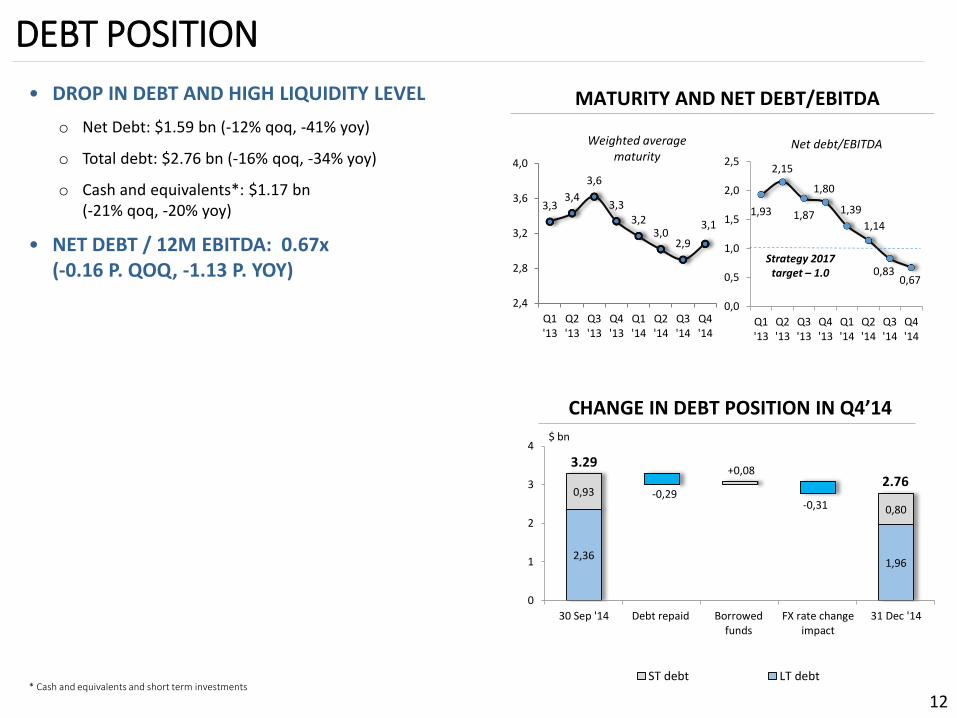
• DROP IN DEBT AND HIGH LIQUIDITY LEVEL
o Net Debt: $1.59 bn (-12% qoq, -41% yoy)
o Total debt: $2.76 bn (-16% qoq, -34% yoy)
o Cash and equivalents*: $1.17 bn(-21% qoq, -20% yoy)
• NET DEBT / 12M EBITDA: 0.67x(-0.16 P. QOQ, -1.13 P. YOY)
MATURITY AND NET DEBT/EBITDA
* Cash and equivalents and short term investments
Weighted average maturity
1,93
2,15
1,87
1,80
1,39
1,14
0,830,67
0,0
0,5
1,0
1,5
2,0
2,5
Q1'13
Q2'13
Q3'13
Q4'13
Q1'14
Q2'14
Q3'14
Q4'14
Net debt/EBITDA
Strategy 2017 target – 1.0
3,33,4
3,6
3,33,2
3,02,9
3,1
2,4
2,8
3,2
3,6
4,0
Q1'13
Q2'13
Q3'13
Q4'13
Q1'14
Q2'14
Q3'14
Q4'14
2,361,96
0,93 -0,29
+0,08
-0,31 0,80
0
1
2
3
4
30 Sep '14 Debt repaid Borrowedfunds
FX rate changeimpact
31 Dec '14
ST debt LT debt
CHANGE IN DEBT POSITION IN Q4’14$ bn
3.29
2.76
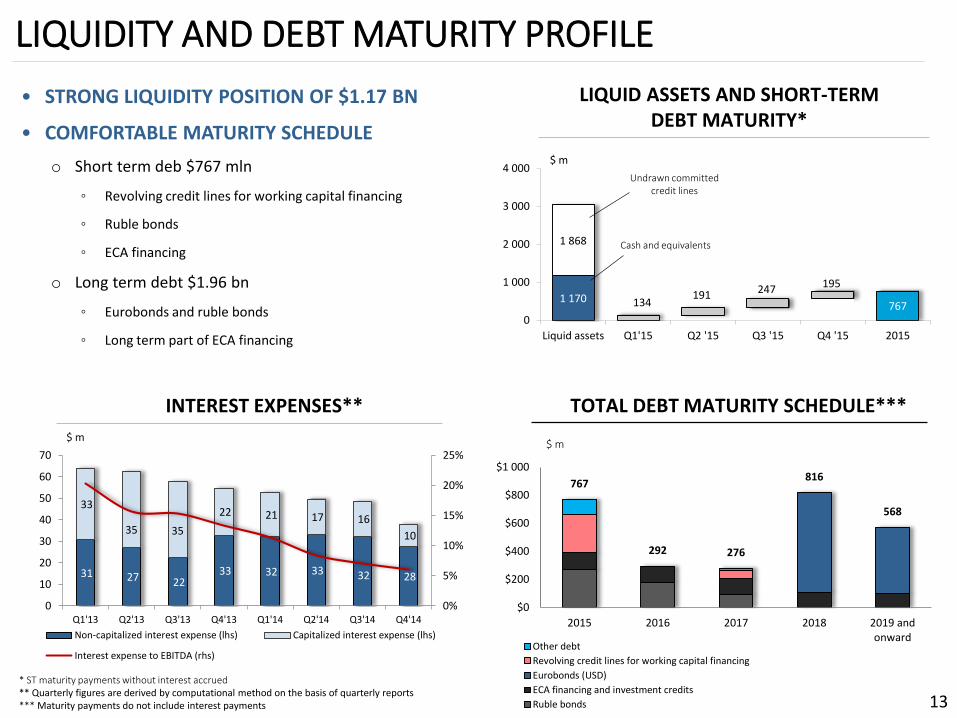
1 170767
1 868
134191 247 195
0
1 000
2 000
3 000
4 000
Liquid assets Q1'15 Q2 '15 Q3 '15 Q4 '15 2015
767
292 276
816
568
$0
$200
$400
$600
$800
$1 000
2015 2016 2017 2018 2019 andonward
Other debt
Revolving credit lines for working capital financing
Eurobonds (USD)
ECA financing and investment credits
Ruble bonds
LIQUIDITY AND DEBT MATURITY PROFILE
13
• STRONG LIQUIDITY POSITION OF $1.17 BN
• COMFORTABLE MATURITY SCHEDULE
o Short term deb $767 mln
◦ Revolving credit lines for working capital financing
◦ Ruble bonds
◦ ECA financing
o Long term debt $1.96 bn
◦ Eurobonds and ruble bonds
◦ Long term part of ECA financing
TOTAL DEBT MATURITY SCHEDULE***INTEREST EXPENSES**
$ m
$ m
Undrawn committed credit lines
Cash and equivalents
LIQUID ASSETS AND SHORT-TERM DEBT MATURITY*
31 27 22 33 32 33 32 28
33
35 35
22 21 17 16
10
0%
5%
10%
15%
20%
25%
0
10
20
30
40
50
60
70
Q1'13 Q2'13 Q3'13 Q4'13 Q1'14 Q2'14 Q3'14 Q4'14
Non-capitalized interest expense (lhs) Capitalized interest expense (lhs)
Interest expense to EBITDA (rhs)
* ST maturity payments without interest accrued** Quarterly figures are derived by computational method on the basis of quarterly reports*** Maturity payments do not include interest payments
$ m
STRUCTURAL IMPOVEMENT OF FINANCIAL PERFOMANCE
• Sizable effect coming from operational efficiency programs
• Leadership in low-cost production
• Profitability growing since beginning of 2013 through six quarters
• Structural reduction in capex
• Debt reduced below Strategy 2017 target level
• Capability in free cash flow growth available for distribution to shareholders
14
CONTENT
1. Key results
2. Financial highlights
3. Segment results
4. Annex
15
1,66 1,68
1,53 1,60 1,74 1,73
1,64 1,48
0,35 0,37 0,47 0,21
0,30 0,27 0,37 0,34
0,080,21 0,19 0,15
0,26 0,350,46 0,55
0,0
0,5
1,0
1,5
2,0
2,5
Q1'13 Q2'13 Q3'13 Q4'13 Q1'14 Q2'14 Q3'14 Q4'14
Revenue from intercompany sales Revenue from sales to third parties
EBITDA
4%
10% 9%8%
13%18%
23%
30%
EBITDA margin
22%
21%
9%7%7%
5%
6%
10%
3%9%
Iron ore materials
Coke and coal
Scrap
Ferroalloys
Other raw materials
Electricity
Natural gas
Other energy resources
Personnel costs
Other expenses and changes in inventories
Depreciation
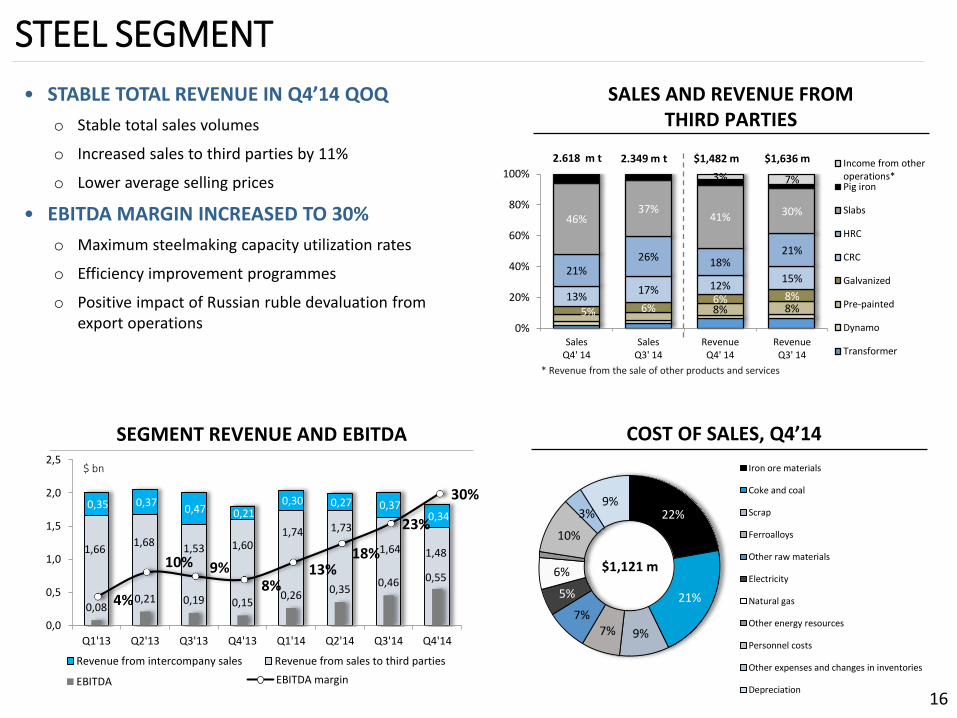
STEEL SEGMENT
• STABLE TOTAL REVENUE IN Q4’14 QOQ
o Stable total sales volumes
o Increased sales to third parties by 11%
o Lower average selling prices
• EBITDA MARGIN INCREASED TO 30%
o Maximum steelmaking capacity utilization rates
o Efficiency improvement programmes
o Positive impact of Russian ruble devaluation from export operations
COST OF SALES, Q4’14SEGMENT REVENUE AND EBITDA
SALES AND REVENUE FROM THIRD PARTIES
$ bn
16
8% 8%5% 6%6% 8%13%
17% 12%15%
21%26% 18%
21%
46%37%
41% 30%
3% 7%
0%
20%
40%
60%
80%
100%
SalesQ4' 14
SalesQ3' 14
RevenueQ4' 14
RevenueQ3' 14
Income from otheroperations*Pig iron
Slabs
HRC
CRC
Galvanized
Pre-painted
Dynamo
Transformer
2.618 m t $1,482 m
* Revenue from the sale of other products and services
2.349 m t $1,636 m
$1,121 m
288 314355 371 337
430 378302
59
113 114102
57
101115
94
20 2340
12 752
77
130
70
140
210
280
350
420
490
560
Q1'13 Q2'13 Q3'13 Q4'13 Q1'14 Q2'14 Q3'14 Q4'14
Revenue from intra-group sales Revenue from third parties EBITDA
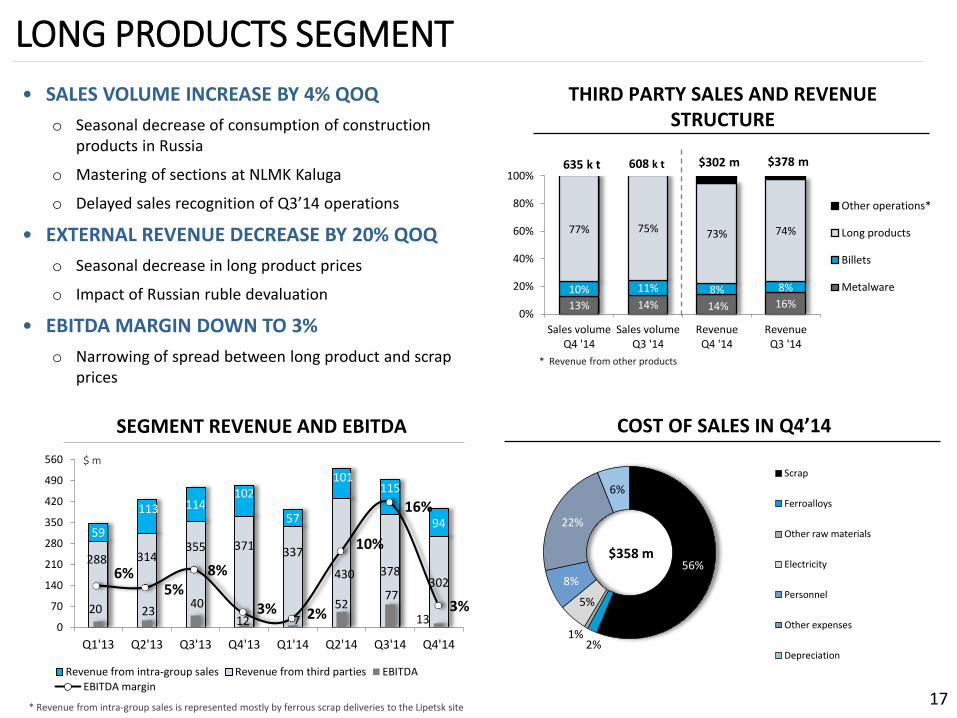
6%5%
8%
3% 2%
10%
16%
3%
EBITDA margin
56%
2%1%
5%
8%
22%
6%
Scrap
Ferroalloys
Other raw materials
Electricity
Personnel
Other expenses
Depreciation
$358 m
LONG PRODUCTS SEGMENT
• SALES VOLUME INCREASE BY 4% QOQ
o Seasonal decrease of consumption of construction products in Russia
o Mastering of sections at NLMK Kaluga
o Delayed sales recognition of Q3’14 operations
• EXTERNAL REVENUE DECREASE BY 20% QOQ
o Seasonal decrease in long product prices
o Impact of Russian ruble devaluation
• EBITDA MARGIN DOWN TO 3%
o Narrowing of spread between long product and scrap prices
SEGMENT REVENUE AND EBITDA
THIRD PARTY SALES AND REVENUE STRUCTURE
$ m
17
COST OF SALES IN Q4’14
* Revenue from intra-group sales is represented mostly by ferrous scrap deliveries to the Lipetsk site
13% 14% 14% 16%10% 11% 8% 8%
77% 75% 73% 74%
0%
20%
40%
60%
80%
100%
Sales volumeQ4 '14
Sales volumeQ3 '14
RevenueQ4 '14
RevenueQ3 '14
Other operations*
Long products
Billets
Metalware
608 k t $378 m
* Revenue from other products
$302 m635 k t
92 100 86 94 88 117
70 70
245 249 226
259 229 189
178
126 215 227190
228 209185
145101
0
100
200
300
400
500
Q1 '13 Q2 '13 Q3 '13 Q4 '13 Q1 '14 Q2 '14 Q3 '14 Q4 '14Revenue from intersegmental salesRevenue from third partiesEBITDA
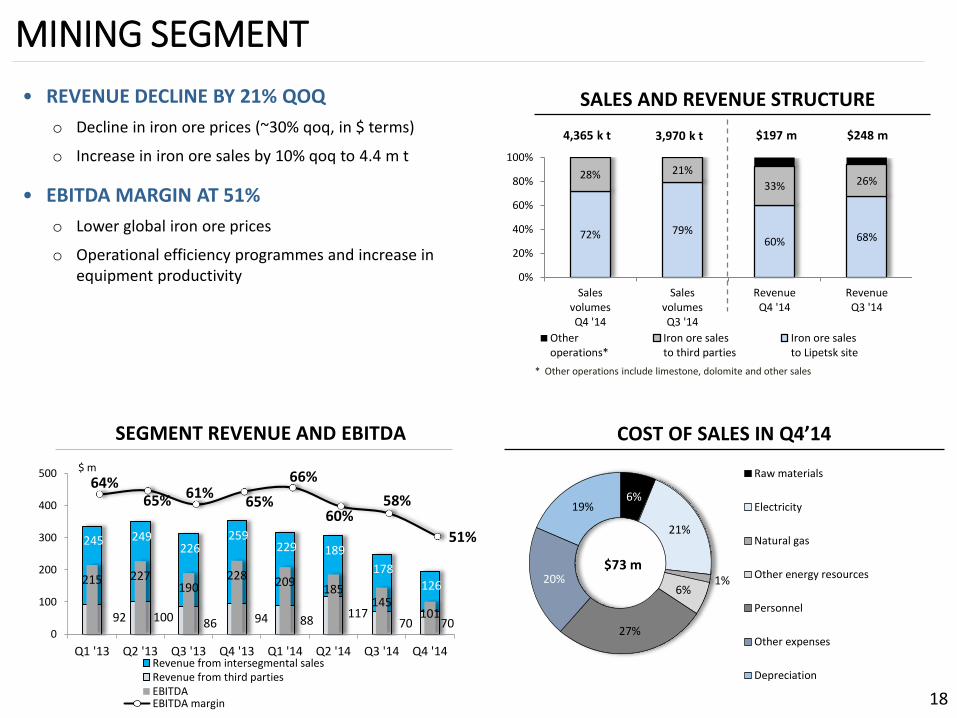
64%65% 61%
65%
66%
60%58%
51%
EBITDA margin
6%
21%
1%6%
27%
20%
19%
Raw materials
Electricity
Natural gas
Other energy resources
Personnel
Other expenses
Depreciation
MINING SEGMENT
• REVENUE DECLINE BY 21% QOQ
o Decline in iron ore prices (~30% qoq, in $ terms)
o Increase in iron ore sales by 10% qoq to 4.4 m t
• EBITDA MARGIN AT 51%
o Lower global iron ore prices
o Operational efficiency programmes and increase in equipment productivity
SALES AND REVENUE STRUCTURE
18
COST OF SALES IN Q4’14
72% 79%60% 68%
28% 21%
33% 26%
0%
20%
40%
60%
80%
100%
SalesvolumesQ4 '14
SalesvolumesQ3 '14
RevenueQ4 '14
RevenueQ3 '14
Otheroperations*
Iron ore salesto third parties
Iron ore salesto Lipetsk site
3,970 k t $248 m$197 m4,365 k t
* Other operations include limestone, dolomite and other sales
SEGMENT REVENUE AND EBITDA
$ m
$73 m
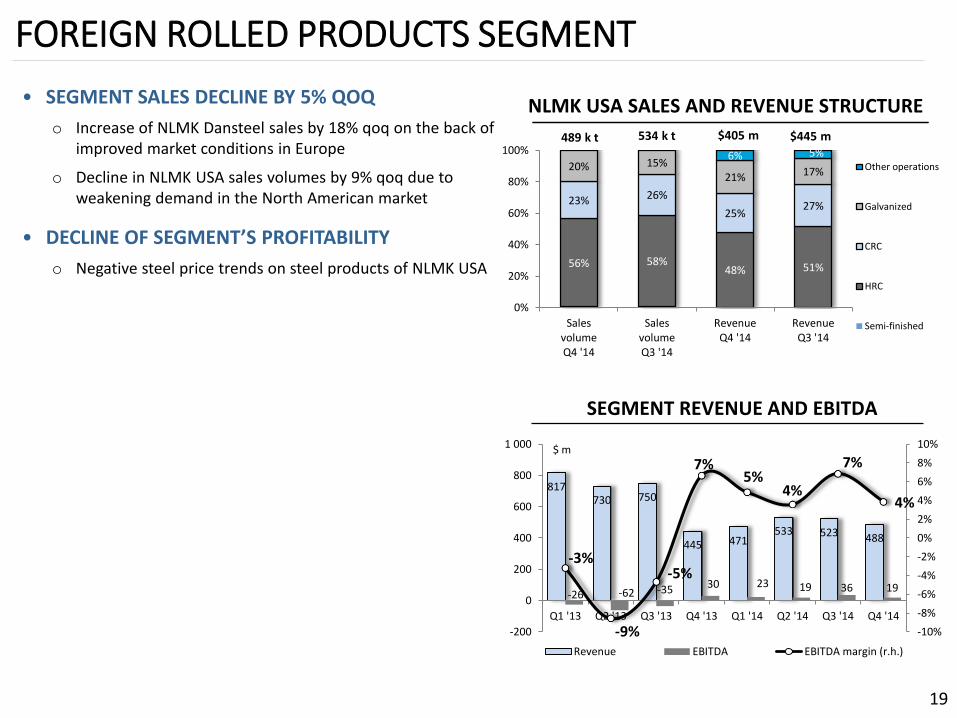
817730 750
445 471533 523 488
-26 -62 -35 30 23 19 36 19
-3%
-9%
-5%
7%5%
4%
7%
4%
-10%
-8%
-6%
-4%
-2%
0%
2%
4%
6%
8%
10%
-200
0
200
400
600
800
1 000
Q1 '13 Q2 '13 Q3 '13 Q4 '13 Q1 '14 Q2 '14 Q3 '14 Q4 '14
Revenue EBITDA EBITDA margin (r.h.)
FOREIGN ROLLED PRODUCTS SEGMENT
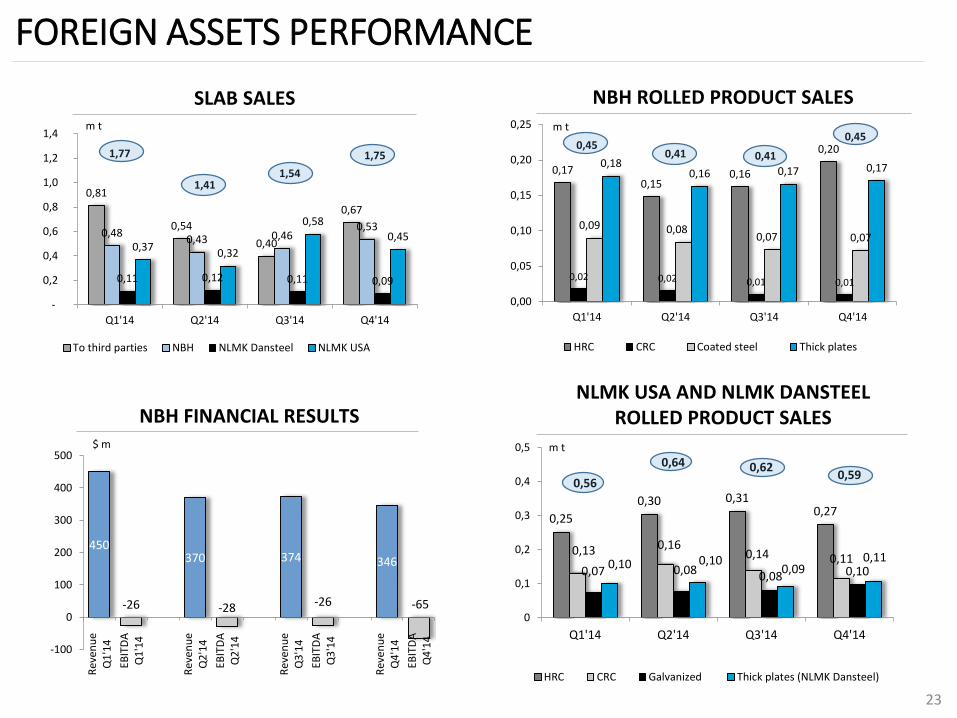
• SEGMENT SALES DECLINE BY 5% QOQ
o Increase of NLMK Dansteel sales by 18% qoq on the back of improved market conditions in Europe
o Decline in NLMK USA sales volumes by 9% qoq due to weakening demand in the North American market
• DECLINE OF SEGMENT’S PROFITABILITY
o Negative steel price trends on steel products of NLMK USA
NLMK USA SALES AND REVENUE STRUCTURE
19
$ m
SEGMENT REVENUE AND EBITDA
56% 58%48% 51%
23% 26%
25%27%
20% 15%21% 17%
6% 5%
0%
20%
40%
60%
80%
100%
SalesvolumeQ4 '14
SalesvolumeQ3 '14
RevenueQ4 '14
RevenueQ3 '14
Other operations
Galvanized
CRC
HRC
Semi-finished
534 k t $445 m$405 m489 k t
APPENDICES
20
SALES STRUCTURE
21
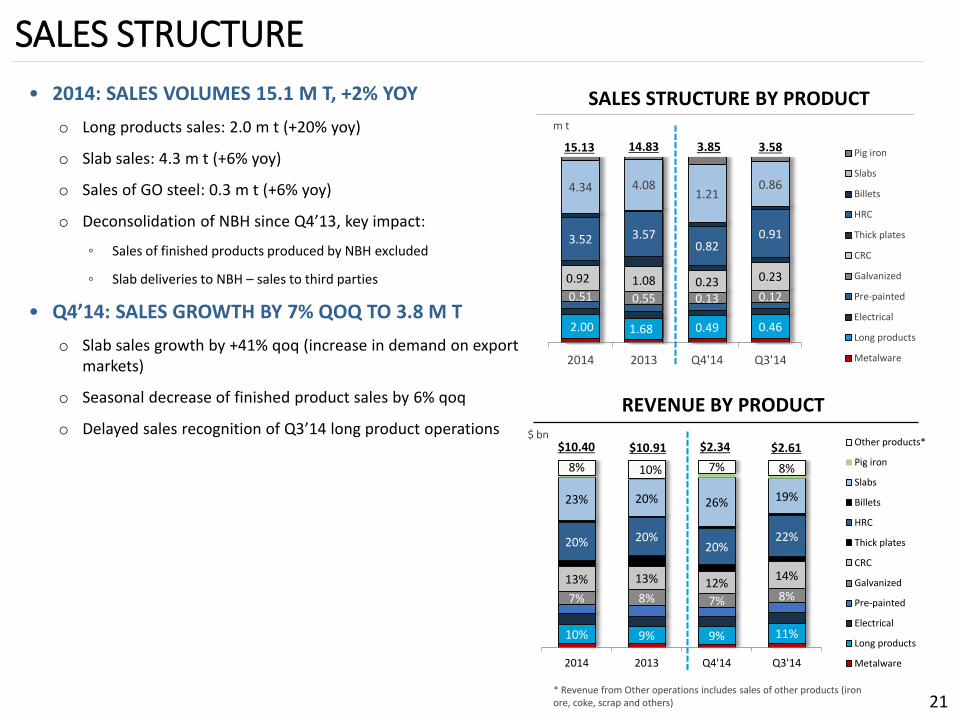
• 2014: SALES VOLUMES 15.1 M T, +2% YOY
o Long products sales: 2.0 m t (+20% yoy)
o Slab sales: 4.3 m t (+6% yoy)
o Sales of GO steel: 0.3 m t (+6% yoy)
o Deconsolidation of NBH since Q4’13, key impact:
◦ Sales of finished products produced by NBH excluded
◦ Slab deliveries to NBH – sales to third parties
• Q4’14: SALES GROWTH BY 7% QOQ TO 3.8 M T
o Slab sales growth by +41% qoq (increase in demand on export markets)
o Seasonal decrease of finished product sales by 6% qoq
o Delayed sales recognition of Q3’14 long product operations
SALES STRUCTURE BY PRODUCT
REVENUE BY PRODUCT
2.00 1.68 0.49 0.46
0.51 0.55 0.13 0.12
0.92 1.08 0.23 0.23
3.52 3.570.82
0.91
4.34 4.081.21
0.86
2014 2013 Q4'14 Q3'14
Pig iron
Slabs
Billets
HRC
Thick plates
CRC
Galvanized
Pre-painted
Electrical
Long products
Metalware
15.13 3.85
m t
3.58
10% 9% 9% 11%
7% 8% 7% 8%
13% 13% 12%14%
20% 20%20%
22%
23% 20% 26% 19%
8% 10% 7% 8%
2014 2013 Q4'14 Q3'14
Other products*
Pig iron
Slabs
Billets
HRC
Thick plates
CRC
Galvanized
Pre-painted
Electrical
Long products
Metalware
$10.91$10.40
14.83
$ bn$2.34 $2.61
* Revenue from Other operations includes sales of other products (iron ore, coke, scrap and others)
SALES GEOGRAPHY
22
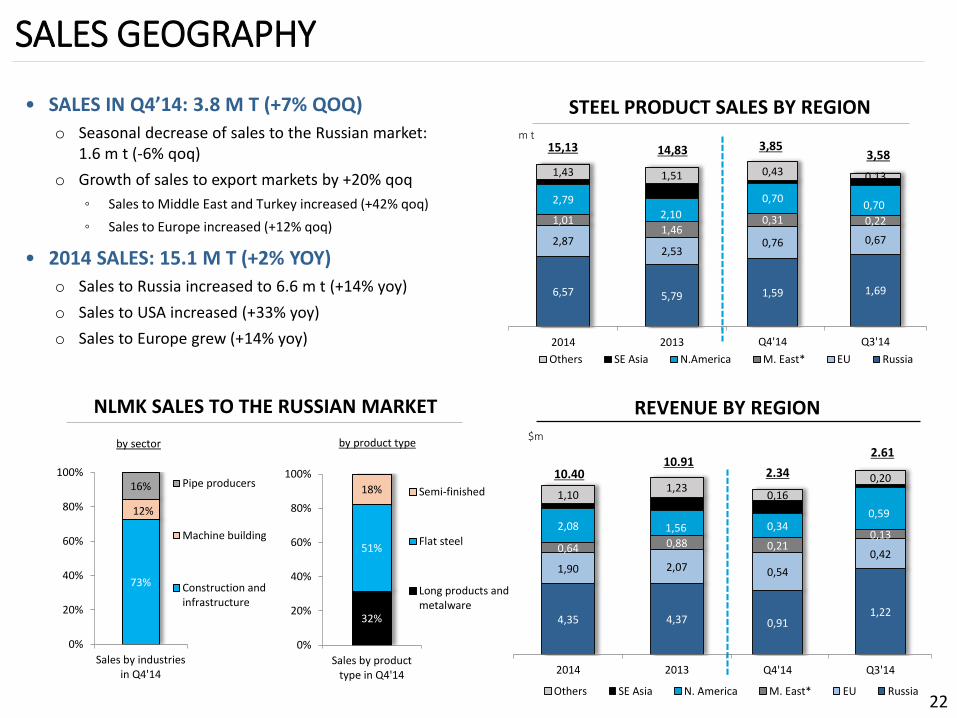
• SALES IN Q4’14: 3.8 M T (+7% QOQ)
o Seasonal decrease of sales to the Russian market: 1.6 m t (-6% qoq)
o Growth of sales to export markets by +20% qoq
◦ Sales to Middle East and Turkey increased (+42% qoq)
◦ Sales to Europe increased (+12% qoq)
• 2014 SALES: 15.1 M T (+2% YOY)
o Sales to Russia increased to 6.6 m t (+14% yoy)
o Sales to USA increased (+33% yoy)
o Sales to Europe grew (+14% yoy)
NLMK SALES TO THE RUSSIAN MARKET
by sector by product type
0,911,22
0,54
0,420,21
0,130,34
0,59
0,16
0,20
Q4'14 Q3'14
Others SE Asia N. America M. East* EU Russia
4,35 4,37
1,90 2,07
0,64 0,88
2,08 1,56
1,101,23
2014 2013
1,59 1,69
0,76 0,67
0,31 0,22
0,700,70
0,43 0,13
Q4'14 Q3'14
Others SE Asia N.America M. East* EU Russia
6,57 5,79
2,872,53
1,011,46
2,792,10
1,43 1,51
2014 2013
m t
STEEL PRODUCT SALES BY REGION
REVENUE BY REGION
15,13 14,83 3,853,58
10.4010.91
2.34
2.61$m
73%
12%
16%
0%
20%
40%
60%
80%
100%
Sales by industriesin Q4'14
Pipe producers
Machine building
Construction andinfrastructure
32%
51%
18%
0%
20%
40%
60%
80%
100%
Sales by producttype in Q4'14
Semi-finished
Flat steel
Long products andmetalware
450
-26
370
-28
374
-26
346
-65
-100
0
100
200
300
400
500
Rev
enu
eQ
1'1
4
EBIT
DA
Q1
'14
Rev
enu
eQ
2'1
4
EBIT
DA
Q2
'14
Rev
enu
eQ
3'1
4
EBIT
DA
Q3
'14
Rev
enu
eQ
4'1
4
EBIT
DA
Q4
'14
FOREIGN ASSETS PERFORMANCE
23
NBH FINANCIAL RESULTS$ m
NLMK USA AND NLMK DANSTEEL ROLLED PRODUCT SALES
0,25
0,30 0,310,27
0,13 0,160,14 0,11
0,07 0,08 0,08 0,100,10 0,10
0,090,11
0,56
0,64 0,620,59
0,00
0,10
0,20
0,30
0,40
0,50
0,60
0,70
0
0,1
0,2
0,3
0,4
0,5
Q1'14 Q2'14 Q3'14 Q4'14
HRC CRC Galvanized Thick plates (NLMK Dansteel)
m t
NBH ROLLED PRODUCT SALES
0,170,15
0,16
0,20
0,02 0,02 0,01 0,01
0,09 0,080,07 0,07
0,180,16 0,17 0,17
0,450,41 0,41
0,45
0,00
0,10
0,20
0,30
0,40
0,50
0,60
0,00
0,05
0,10
0,15
0,20
0,25
Q1'14 Q2'14 Q3'14 Q4'14
HRC CRC Coated steel Thick plates
m t
SLAB SALES
0,81
0,54
0,40
0,67
0,480,43 0,46
0,53
0,11 0,12 0,11 0,09
0,370,32
0,58
0,45
1,77
1,411,54
1,75
0,00
0,50
1,00
1,50
2,00
-
0,2
0,4
0,6
0,8
1,0
1,2
1,4
Q1'14 Q2'14 Q3'14 Q4'14
To third parties NBH NLMK Dansteel NLMK USA
m t
Jan
13
Feb
13
Mar
13
Ap
r 1
3M
ay 1
3Ju
n 1
3Ju
l 13
Au
g 1
3Se
p 1
3O
ct 1
3N
ov
13
Dec
13
Jan
14
Feb
14
Mar
14
Ap
r 1
4M
ay 1
4Ju
n 1
4Ju
l 14
Au
g 1
4Se
p 1
4O
ct 1
4N
ov
14
Dec
14
Jan
15
Feb
15
Mar
15
25
35
45
55
65
FX RATES CHANGE EXPOSURE
24
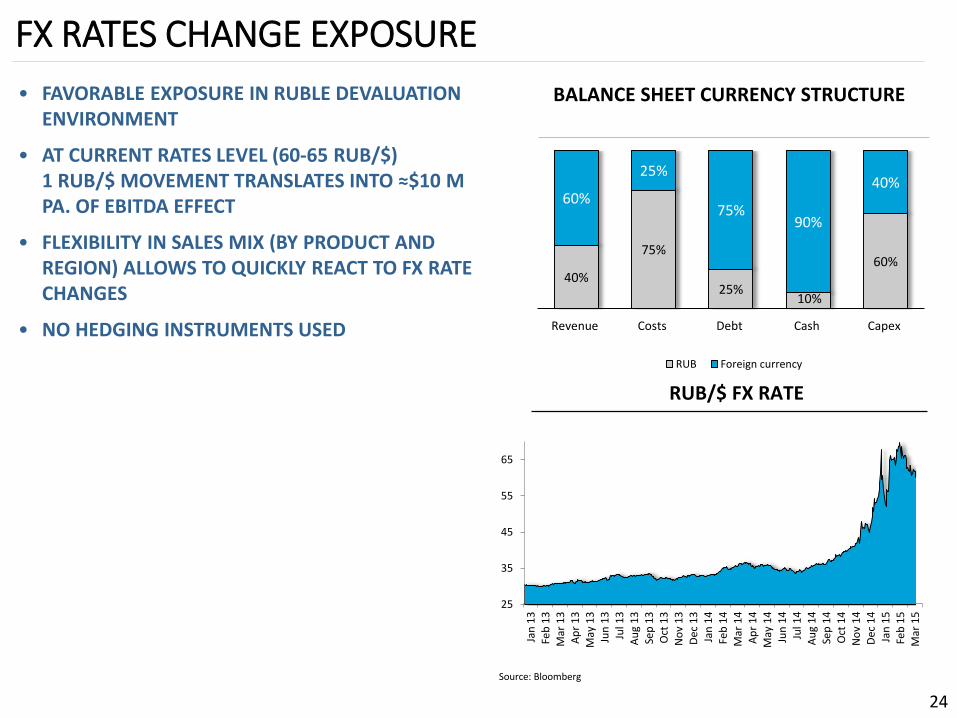
• FAVORABLE EXPOSURE IN RUBLE DEVALUATION ENVIRONMENT
• AT CURRENT RATES LEVEL (60-65 RUB/$) 1 RUB/$ MOVEMENT TRANSLATES INTO ≈$10 M PA. OF EBITDA EFFECT
• FLEXIBILITY IN SALES MIX (BY PRODUCT AND REGION) ALLOWS TO QUICKLY REACT TO FX RATE CHANGES
• NO HEDGING INSTRUMENTS USED
BALANCE SHEET CURRENCY STRUCTURE
RUB/$ FX RATE
40%
75%
25%10%
60%
60%
25%
75%90%
40%
Revenue Costs Debt Cash Capex
RUB Foreign currency
Source: Bloomberg
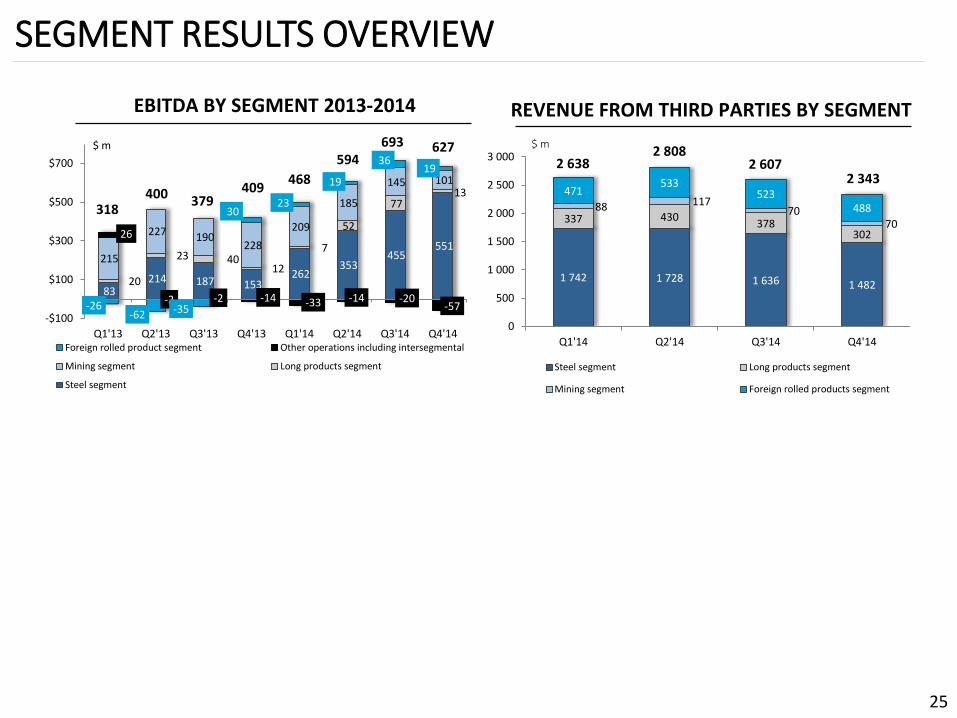
SEGMENT RESULTS OVERVIEW
REVENUE FROM THIRD PARTIES BY SEGMENT
83 214 187 153
262 353
455 551
20
23 40 12
7
52
77 13
215
227 190 228
209
185
145 101
26
-2 -2 -14 -33 -14 -20-57-26
-62 -35
30 23
19
36 19
-$100
$100
$300
$500
$700
Q1'13 Q2'13 Q3'13 Q4'13 Q1'14 Q2'14 Q3'14 Q4'14Foreign rolled product segment Other operations including intersegmental
Mining segment Long products segment
Steel segment
$ m
409379400
318
594
468
EBITDA BY SEGMENT 2013-2014
693 627
25
$ m
1 742 1 728 1 636 1 482
337 430378
302
88 11770
70
471533
523488
0
500
1 000
1 500
2 000
2 500
3 000
Q1'14 Q2'14 Q3'14 Q4'14
Steel segment Long products segment
Mining segment Foreign rolled products segment
2 6382 808
2 6072 343
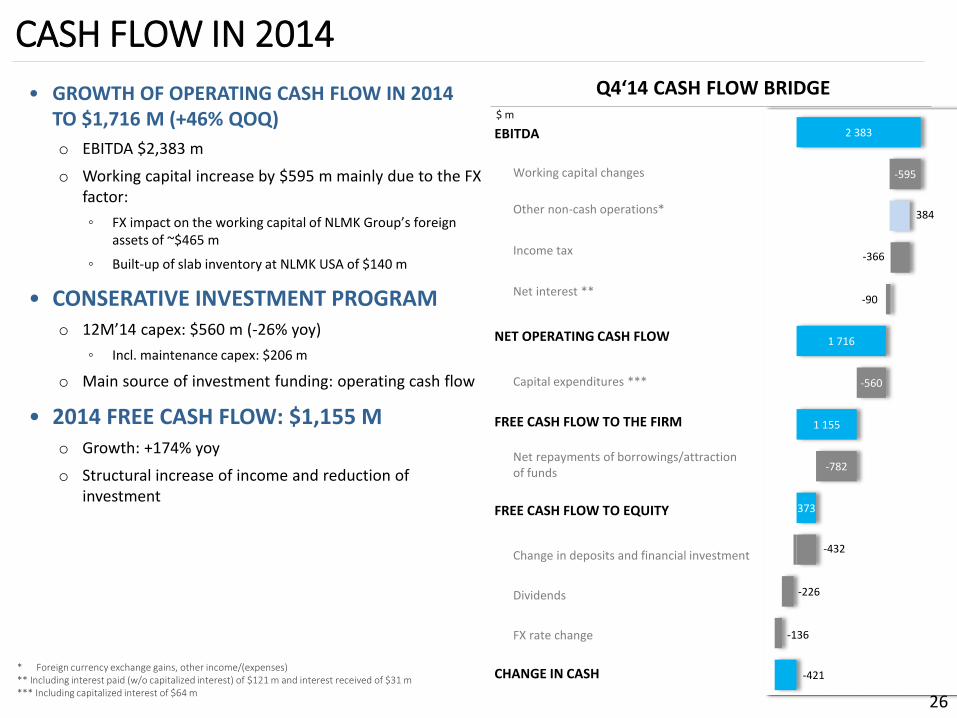
EBITDA
Working capital changes
Other non-cash operations*
Income tax
Net interest **
NET OPERATING CASH FLOW
Capital expenditures ***
FREE CASH FLOW TO THE FIRM
Net repayments of borrowings/attraction of funds
FREE CASH FLOW TO EQUITY
Change in deposits and financial investment
Dividends
FX rate change
CHANGE IN CASH
CASH FLOW IN 2014
26
Q4‘14 CASH FLOW BRIDGE• GROWTH OF OPERATING CASH FLOW IN 2014 TO $1,716 M (+46% QOQ)
o EBITDA $2,383 m
o Working capital increase by $595 m mainly due to the FX factor:
◦ FX impact on the working capital of NLMK Group’s foreign assets of ~$465 m
◦ Built-up of slab inventory at NLMK USA of $140 m
• CONSERATIVE INVESTMENT PROGRAM o 12M’14 capex: $560 m (-26% yoy)
◦ Incl. maintenance capex: $206 m
o Main source of investment funding: operating cash flow
• 2014 FREE CASH FLOW: $1,155 M o Growth: +174% yoy
o Structural increase of income and reduction of investment
$ m
* Foreign currency exchange gains, other income/(expenses)** Including interest paid (w/o capitalized interest) of $121 m and interest received of $31 m*** Including capitalized interest of $64 m
-421
-136
-226
-432
373
-782
1 155
-560
1 716
-90
-366
384
-595
2 383
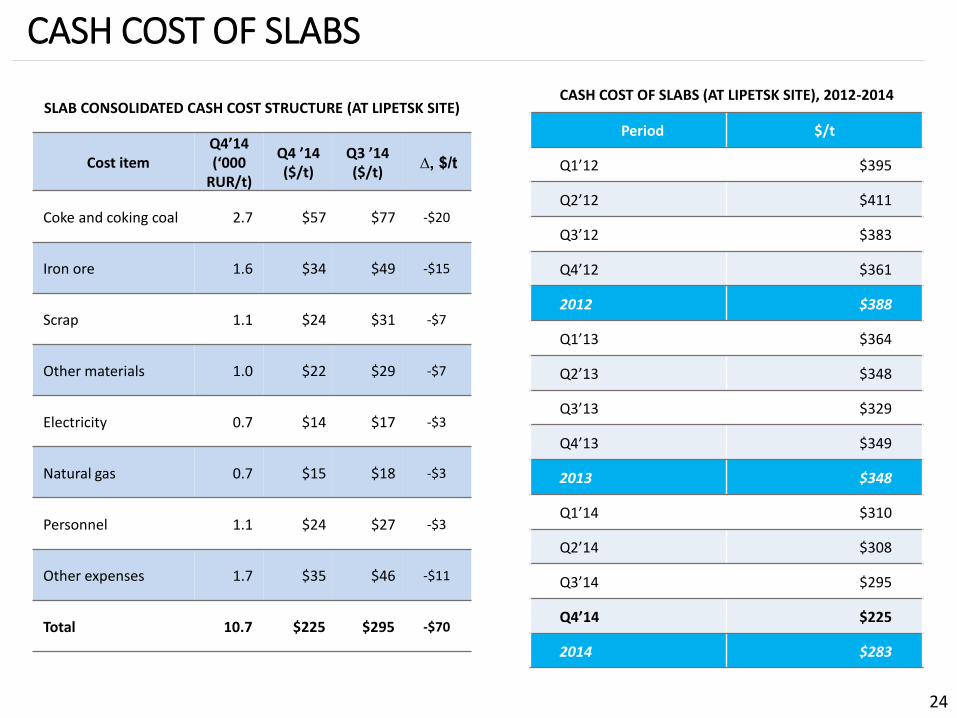
CASH COST OF SLABS
SLAB CONSOLIDATED CASH COST STRUCTURE (AT LIPETSK SITE)
Cost itemQ4’14(‘000
RUR/t)
Q4 ’14($/t)
Q3 ’14($/t)
∆, $/t
Coke and coking coal 2.7 $57 $77 -$20
Iron ore 1.6 $34 $49 -$15
Scrap 1.1 $24 $31 -$7
Other materials 1.0 $22 $29 -$7
Electricity 0.7 $14 $17 -$3
Natural gas 0.7 $15 $18 -$3
Personnel 1.1 $24 $27 -$3
Other expenses 1.7 $35 $46 -$11
Total 10.7 $225 $295 -$70
CASH COST OF SLABS (AT LIPETSK SITE), 2012-2014
Period $/t
Q1’12 $395
Q2’12 $411
Q3’12 $383
Q4’12 $361
2012 $388
Q1’13 $364
Q2’13 $348
Q3’13 $329
Q4’13 $349
2013 $348
Q1’14 $310
Q2’14 $308
Q3’14 $295
Q4’14 $225
2014 $283
24
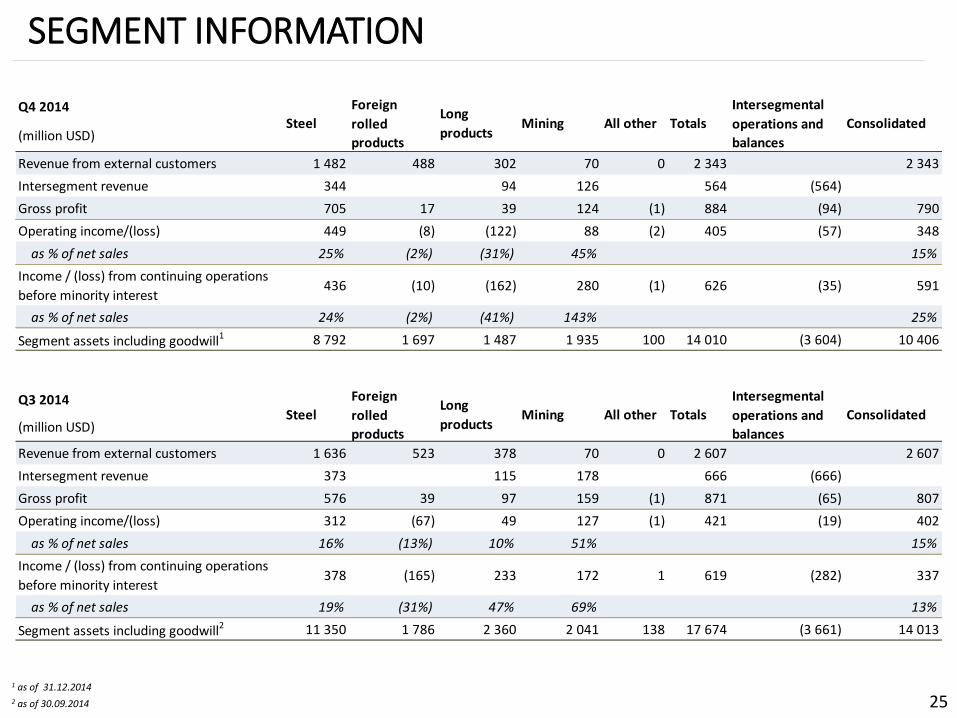
1 as of 31.12.2014
2 as of 30.09.2014
SEGMENT INFORMATION
25
Q4 2014
(million USD)
Revenue from external customers 1 482 488 302 70 0 2 343 2 343
Intersegment revenue 344 94 126 564 (564)
Gross profit 705 17 39 124 (1) 884 (94) 790
Operating income/(loss) 449 (8) (122) 88 (2) 405 (57) 348
as % of net sales 25% (2%) (31%) 45% 15%
Income / (loss) from continuing operations
before minority interest436 (10) (162) 280 (1) 626 (35) 591
as % of net sales 24% (2%) (41%) 143% 25%
Segment assets including goodwill1 8 792 1 697 1 487 1 935 100 14 010 (3 604) 10 406
Q3 2014
(million USD)
Revenue from external customers 1 636 523 378 70 0 2 607 2 607
Intersegment revenue 373 115 178 666 (666)
Gross profit 576 39 97 159 (1) 871 (65) 807
Operating income/(loss) 312 (67) 49 127 (1) 421 (19) 402
as % of net sales 16% (13%) 10% 51% 15%
Income / (loss) from continuing operations
before minority interest378 (165) 233 172 1 619 (282) 337
as % of net sales 19% (31%) 47% 69% 13%
Segment assets including goodwill2 11 350 1 786 2 360 2 041 138 17 674 (3 661) 14 013
Totals
Intersegmental
operations and
balances
Consolidated
Steel
Foreign
rolled
products
Long
productsMining All other Totals
Intersegmental
operations and
balances
Consolidated
Steel
Foreign
rolled
products
Long
productsMining All other
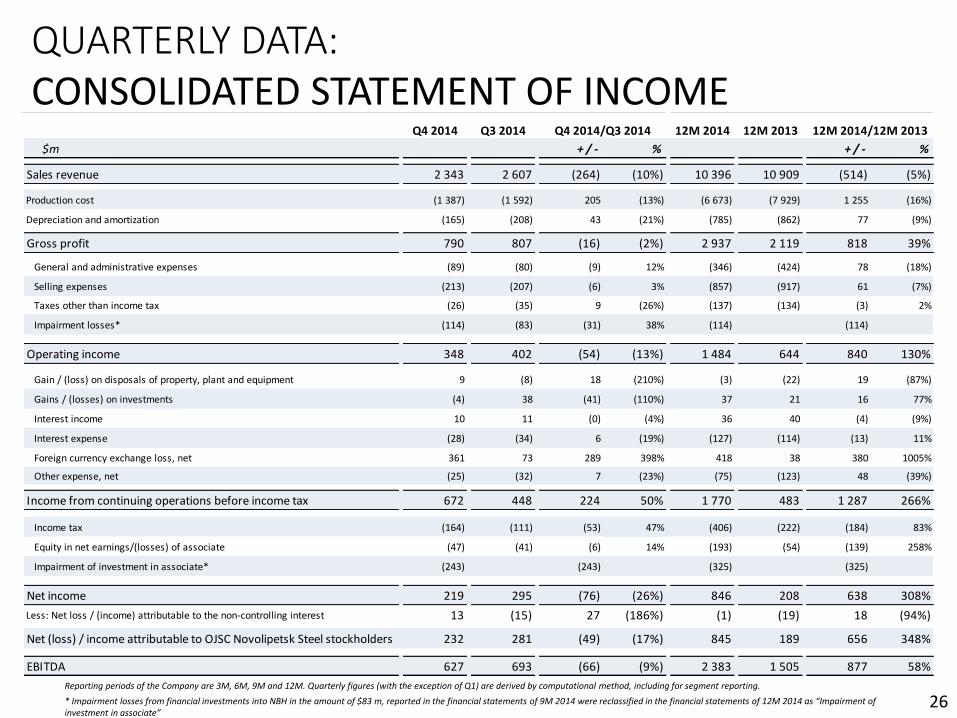
QUARTERLY DATA: CONSOLIDATED STATEMENT OF INCOME
Reporting periods of the Company are 3M, 6M, 9M and 12M. Quarterly figures (with the exception of Q1) are derived by computational method, including for segment reporting.
* Impairment losses from financial investments into NBH in the amount of $83 m, reported in the financial statements of 9M 2014 were reclassified in the financial statements of 12M 2014 as “Impairment of investment in associate”
26
Q4 2014 Q3 2014 12M 2014 12M 2013
$m + / - % + / - %
Sales revenue 2 343 2 607 (264) (10%) 10 396 10 909 (514) (5%)
Production cost (1 387) (1 592) 205 (13%) (6 673) (7 929) 1 255 (16%)
Depreciation and amortization (165) (208) 43 (21%) (785) (862) 77 (9%)
Gross profit 790 807 (16) (2%) 2 937 2 119 818 39%
General and administrative expenses (89) (80) (9) 12% (346) (424) 78 (18%)
Selling expenses (213) (207) (6) 3% (857) (917) 61 (7%)
Taxes other than income tax (26) (35) 9 (26%) (137) (134) (3) 2%
Impairment losses* (114) (83) (31) 38% (114) (114)
Operating income 348 402 (54) (13%) 1 484 644 840 130%
Gain / (loss) on disposals of property, plant and equipment 9 (8) 18 (210%) (3) (22) 19 (87%)
Gains / (losses) on investments (4) 38 (41) (110%) 37 21 16 77%
Interest income 10 11 (0) (4%) 36 40 (4) (9%)
Interest expense (28) (34) 6 (19%) (127) (114) (13) 11%
Foreign currency exchange loss, net 361 73 289 398% 418 38 380 1005%
Other expense, net (25) (32) 7 (23%) (75) (123) 48 (39%)
Income from continuing operations before income tax 672 448 224 50% 1 770 483 1 287 266%
Income tax (164) (111) (53) 47% (406) (222) (184) 83%
Equity in net earnings/(losses) of associate (47) (41) (6) 14% (193) (54) (139) 258%
Impairment of investment in associate* (243) (243) (325) (325)
Net income 219 295 (76) (26%) 846 208 638 308%
Less: Net loss / (income) attributable to the non-controlling interest 13 (15) 27 (186%) (1) (19) 18 (94%)
Net (loss) / income attributable to OJSC Novolipetsk Steel stockholders 232 281 (49) (17%) 845 189 656 348%
EBITDA 627 693 (66) (9%) 2 383 1 505 877 58%
Q4 2014/Q3 2014 12M 2014/12M 2013
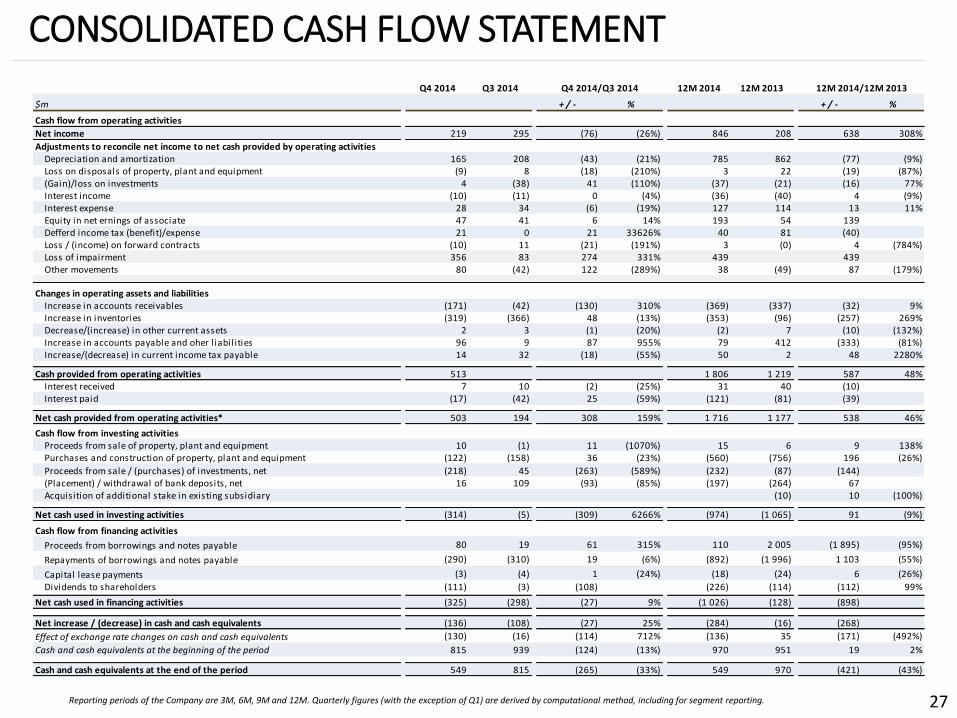
CONSOLIDATED CASH FLOW STATEMENT
Reporting periods of the Company are 3M, 6M, 9M and 12M. Quarterly figures (with the exception of Q1) are derived by computational method, including for segment reporting. 27
Q4 2014 Q3 2014 12M 2014 12M 2013
$m + / - % + / - %
Cash flow from operating activities
Net income 219 295 (76) (26%) 846 208 638 308%
Adjustments to reconcile net income to net cash provided by operating activitiesDepreciation and amortization 165 208 (43) (21%) 785 862 (77) (9%)Loss on disposals of property, plant and equipment (9) 8 (18) (210%) 3 22 (19) (87%)(Gain)/loss on investments 4 (38) 41 (110%) (37) (21) (16) 77%Interest income (10) (11) 0 (4%) (36) (40) 4 (9%)Interest expense 28 34 (6) (19%) 127 114 13 11%Equity in net ernings of associate 47 41 6 14% 193 54 139Defferd income tax (benefit)/expense 21 0 21 33626% 40 81 (40)Loss / (income) on forward contracts (10) 11 (21) (191%) 3 (0) 4 (784%)Loss of impairment 356 83 274 331% 439 439Other movements 80 (42) 122 (289%) 38 (49) 87 (179%)
Changes in operating assets and liabilitiesIncrease in accounts receivables (171) (42) (130) 310% (369) (337) (32) 9%Increase in inventories (319) (366) 48 (13%) (353) (96) (257) 269%Decrease/(increase) in other current assets 2 3 (1) (20%) (2) 7 (10) (132%)Increase in accounts payable and oher l iabilities 96 9 87 955% 79 412 (333) (81%)Increase/(decrease) in current income tax payable 14 32 (18) (55%) 50 2 48 2280%
Cash provided from operating activities 513 1 806 1 219 587 48%Interest received 7 10 (2) (25%) 31 40 (10)Interest paid (17) (42) 25 (59%) (121) (81) (39)
Net cash provided from operating activities* 503 194 308 159% 1 716 1 177 538 46%
Cash flow from investing activities Proceeds from sale of property, plant and equipment 10 (1) 11 (1070%) 15 6 9 138%Purchases and construction of property, plant and equipment (122) (158) 36 (23%) (560) (756) 196 (26%)
Proceeds from sale / (purchases) of investments, net (218) 45 (263) (589%) (232) (87) (144)(Placement) / withdrawal of bank deposits, net 16 109 (93) (85%) (197) (264) 67Acquisition of additional stake in existing subsidiary (10) 10 (100%)
Net cash used in investing activities (314) (5) (309) 6266% (974) (1 065) 91 (9%)0
Cash flow from financing activities
Proceeds from borrowings and notes payable 80 19 61 315% 110 2 005 (1 895) (95%)
Repayments of borrowings and notes payable (290) (310) 19 (6%) (892) (1 996) 1 103 (55%)
Capital lease payments (3) (4) 1 (24%) (18) (24) 6 (26%)
Dividends to shareholders (111) (3) (108) (226) (114) (112) 99%
Net cash used in financing activities (325) (298) (27) 9% (1 026) (128) (898)
Net increase / (decrease) in cash and cash equivalents (136) (108) (27) 25% (284) (16) (268)
Effect of exchange rate changes on cash and cash equivalents (130) (16) (114) 712% (136) 35 (171) (492%)
Cash and cash equivalents at the beginning of the period 815 939 (124) (13%) 970 951 19 2%
Cash and cash equivalents at the end of the period 549 815 (265) (33%) 549 970 (421) (43%)
Q4 2014/Q3 2014 12M 2014/12M 2013
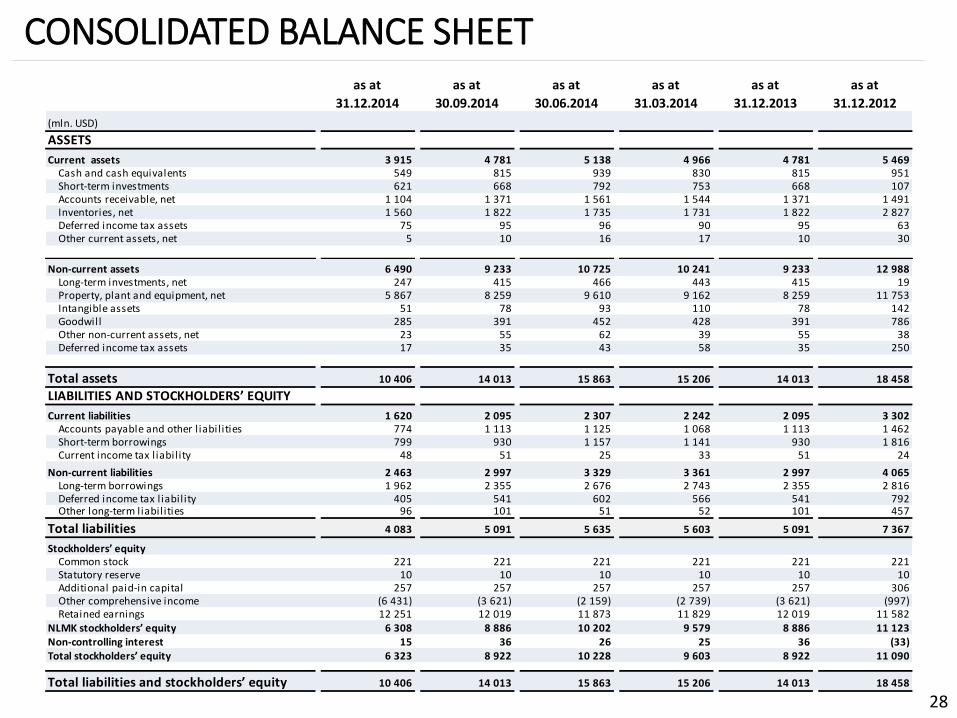
CONSOLIDATED BALANCE SHEET
28
as at
31.12.2014
as at
30.09.2014
as at
30.06.2014
as at
31.03.2014
as at
31.12.2013
as at
31.12.2012
(mln. USD)
ASSETS
Current assets 3 915 4 781 5 138 4 966 4 781 5 469Cash and cash equivalents 549 815 939 830 815 951Short-term investments 621 668 792 753 668 107Accounts receivable, net 1 104 1 371 1 561 1 544 1 371 1 491Inventories, net 1 560 1 822 1 735 1 731 1 822 2 827Deferred income tax assets 75 95 96 90 95 63Other current assets, net 5 10 16 17 10 30
Non-current assets 6 490 9 233 10 725 10 241 9 233 12 988Long-term investments, net 247 415 466 443 415 19Property, plant and equipment, net 5 867 8 259 9 610 9 162 8 259 11 753Intangible assets 51 78 93 110 78 142Goodwill 285 391 452 428 391 786Other non-current assets, net 23 55 62 39 55 38Deferred income tax assets 17 35 43 58 35 250
Total assets 10 406 14 013 15 863 15 206 14 013 18 458
LIABILITIES AND STOCKHOLDERS’ EQUITY
Current liabilities 1 620 2 095 2 307 2 242 2 095 3 302Accounts payable and other l iabilities 774 1 113 1 125 1 068 1 113 1 462Short-term borrowings 799 930 1 157 1 141 930 1 816Current income tax liability 48 51 25 33 51 24
Non-current liabilities 2 463 2 997 3 329 3 361 2 997 4 065Long-term borrowings 1 962 2 355 2 676 2 743 2 355 2 816Deferred income tax liability 405 541 602 566 541 792Other long-term liabilities 96 101 51 52 101 457
Total liabilities 4 083 5 091 5 635 5 603 5 091 7 367
Stockholders’ equityCommon stock 221 221 221 221 221 221Statutory reserve 10 10 10 10 10 10Additional paid-in capital 257 257 257 257 257 306Other comprehensive income (6 431) (3 621) (2 159) (2 739) (3 621) (997)Retained earnings 12 251 12 019 11 873 11 829 12 019 11 582
NLMK stockholders’ equity 6 308 8 886 10 202 9 579 8 886 11 123Non-controlling interest 15 36 26 25 36 (33)Total stockholders’ equity 6 323 8 922 10 228 9 603 8 922 11 090
Total liabilities and stockholders’ equity 10 406 14 013 15 863 15 206 14 013 18 458
www.nlmk.com
NLMK
Investor Relations
Russia, 115054, Moscow
18, Bakhrushina str, bldg 1
t. +7 495 915 15 75
f. +7 495 915 79 04
29