Embed Size (px)
Citation preview
Owens Corning Focused on Shareholder Value
Q1 2017This presentation shared at the following event(s):
2/22/17 OC Roadshow Hosted by SunTrust – Los Angeles Mike Thaman, Chief Executive Officer
22
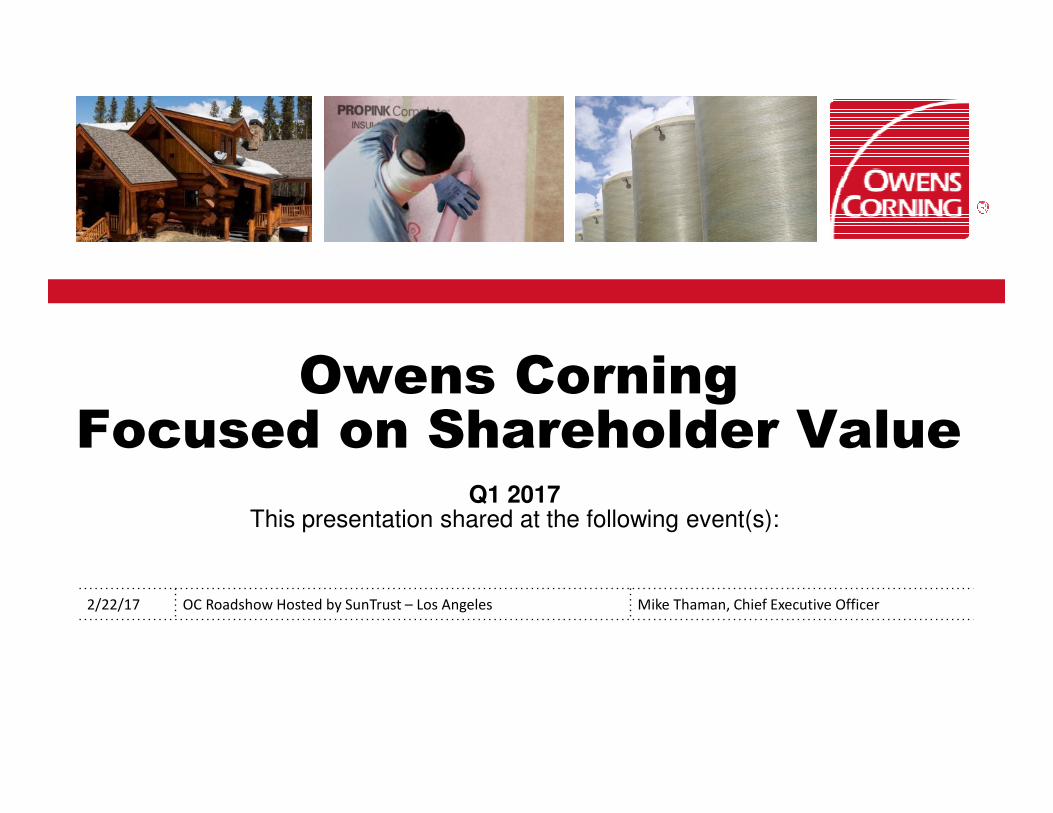
Forward-Looking Statements and Non-GAAP Measures
This presentation and the associated remarks and comments contain forward-looking statements. We caution you against relying on these statements as they involve risks and uncertainties that are difficult to predict and the Company’s actual results may differ materially from those projected in these statements. Such risks and uncertainties include, without limitation: relationships with key customers and demand for our products; macroeconomic factors like levels of construction activity, global industrial production, industry, economic and political conditions, including new legislation, policies or other governmental actions by the new U.S. presidential administration and Congress; competitive and pricing factors; currency, commodity and interest rate fluctuations; our level of indebtedness and the availability and cost of credit; weather conditions; energy and raw material availability, price volatility and cost issues; ability to protect our intellectual property and information technology systems; labor disputes, legal and regulatory proceedings; our ability to utilize our net operating loss carry-forwards; issues related to acquisitions, divestitures and joint ventures; and, factors detailed from time to time in the Company’s SEC filings.
For purposes of this presentation, any discussion referring to “year to date” or last twelve months (“LTM”) refers to the period ended on the last calendar day of the quarter preceding the date of the investor event referred to on the first page of this document. Otherwise the information in this presentation speaks as of the date of the investor event, and is subject to change. The Company does not undertake any obligation to update or revise forward-looking statements beyond what is required under applicable securities laws. Any distribution of this presentation after the date of the investor event is not intended and should not be construed as updating or confirming such information.
This presentation contains references to certain "non-GAAP financial measures" as defined by the SEC, including EBIT, adjusted EBIT, adjusted earnings, adjusted EPS, adjusted pre-tax earnings, free cash flow, free cash flow conversion of adjusted earnings, free cash flow yield and return on capital. Management uses non-GAAP measures for various purposes, including reporting results of operations to the Board of Directors, analysis of performance and related employee compensation measures. Although management believes these measures, and exclusions from GAAP therein, provide a useful representation of performance or liquidity, non-GAAP measures should not be considered in isolation or as a substitute for the corresponding GAAP measures. A reconciliation of these non-GAAP financial measures to their most directly comparable financial measures calculated and presented in accordance with GAAP can be found in the text and tables of our most recent earnings Press Release filed with the SEC on Form 8-K and in Appendix B. When the company provides forward-looking expectations for non-GAAP measures, the most comparable GAAP measures and a reconciliation between the non-GAAP expectations and the corresponding GAAP measures are generally not available without unreasonable effort due to the variability,complexity and limited visibility of the adjusting items that would be excluded from the non-GAAP measures in future periods. The variability in timing and amount of adjusting items could have significant and unpredictable effects on future GAAP results.
Adjusted EBIT, adjusted earnings, adjusted EPS, adjusted pre-tax earnings and return on capital exclude certain items that management does not allocate to its segment results because it believes they are not representative of the Company’s ongoing operations. Free cash flow is a non-GAAP liquidity measure used by investors, financial analysts and management to help evaluate the company's ability to generate cash to pursue opportunities that enhance shareholder value. Free cash flow is not a measure of residual cash flow available for discretionary expenditures due to the company’s mandatory debt service requirements. As a conversion ratio, free cash flow is compared to adjusted earnings. Free cash flow yield is a non-GAAP liquidity measure that management believes is useful to investors to compare a company’s ability to generate free cash flow to its market valuation. Free cash flow yield is not a measure of cash flow which accrues directly to the benefit of common stock share owners.
The Company
Investment Thesis
Three Strong Businesses
Additional Financial Information
Agenda
44
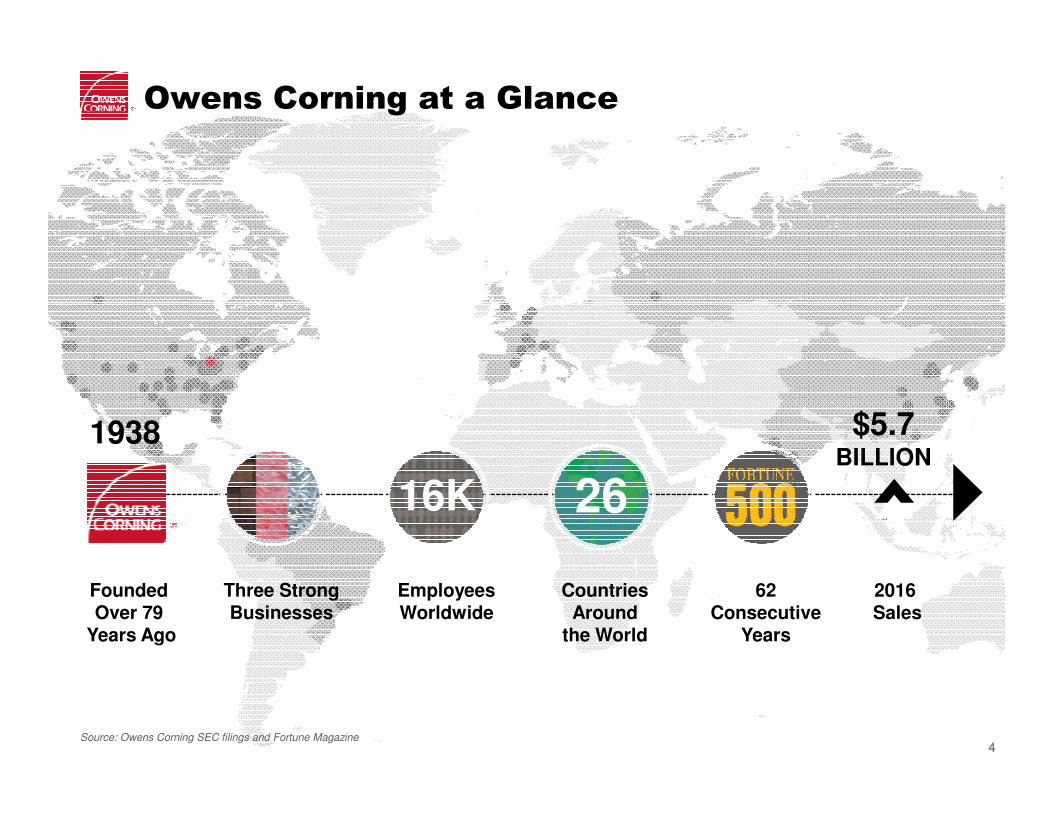
Owens Corning at a Glance
1938
Founded Over 79
Years Ago
2016 Sales
CountriesAround
the World
EmployeesWorldwide
62 Consecutive
Years
Three Strong Businesses
$5.7 BILLION
16K 26
Source: Owens Corning SEC filings and Fortune Magazine
55
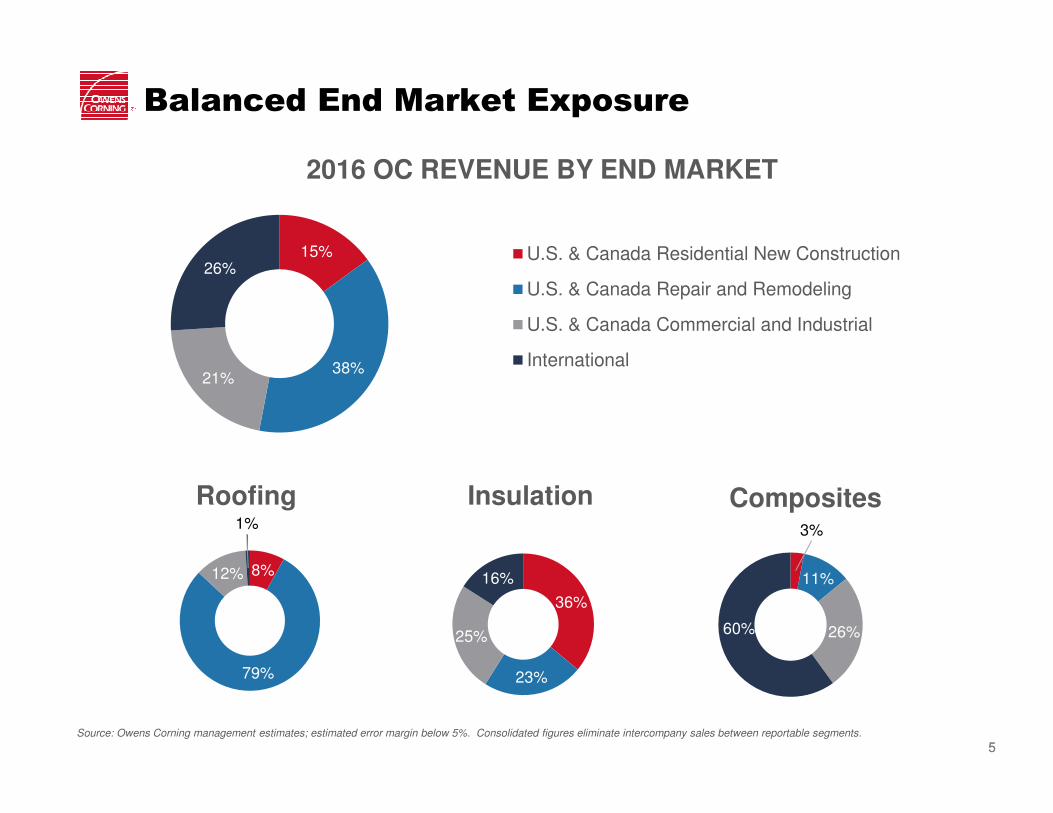
Balanced End Market Exposure
Source: Owens Corning management estimates; estimated error margin below 5%. Consolidated figures eliminate intercompany sales between reportable segments.
15%
38%21%
26%
2016 OC REVENUE BY END MARKET
U.S. & Canada Residential New Construction
U.S. & Canada Repair and Remodeling
U.S. & Canada Commercial and Industrial
International
8%
79%
12%
1%
Roofing
36%
23%
25%
16%
Insulation3%
11%
26%60%
Composites
The Company
Investment Thesis
Three Strong Businesses
Additional Financial Information
Agenda
77
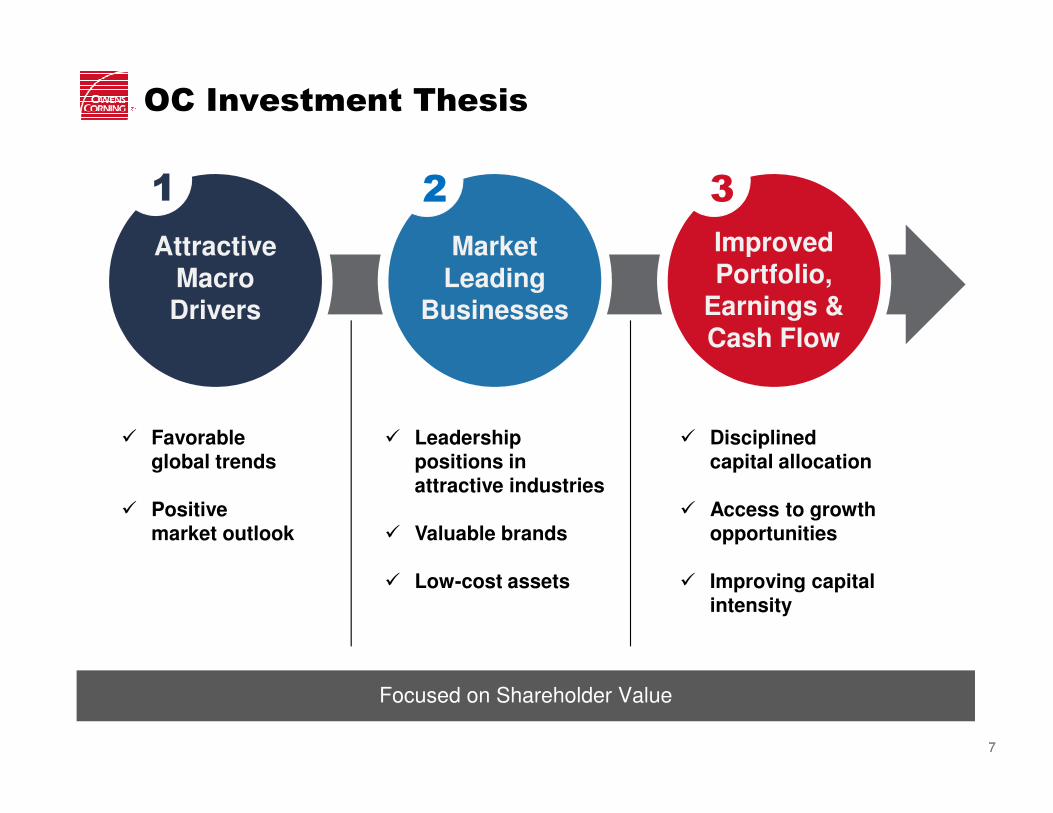
OC Investment Thesis
Focused on Shareholder Value
Market Leading
Businesses
2
Improved Portfolio,
Earnings & Cash Flow
3
Attractive Macro Drivers
1
� Favorable global trends
� Positive market outlook
� Leadership positions in attractive industries
� Valuable brands
� Low-cost assets
� Disciplined capital allocation
� Access to growth opportunities
� Improving capital intensity
88
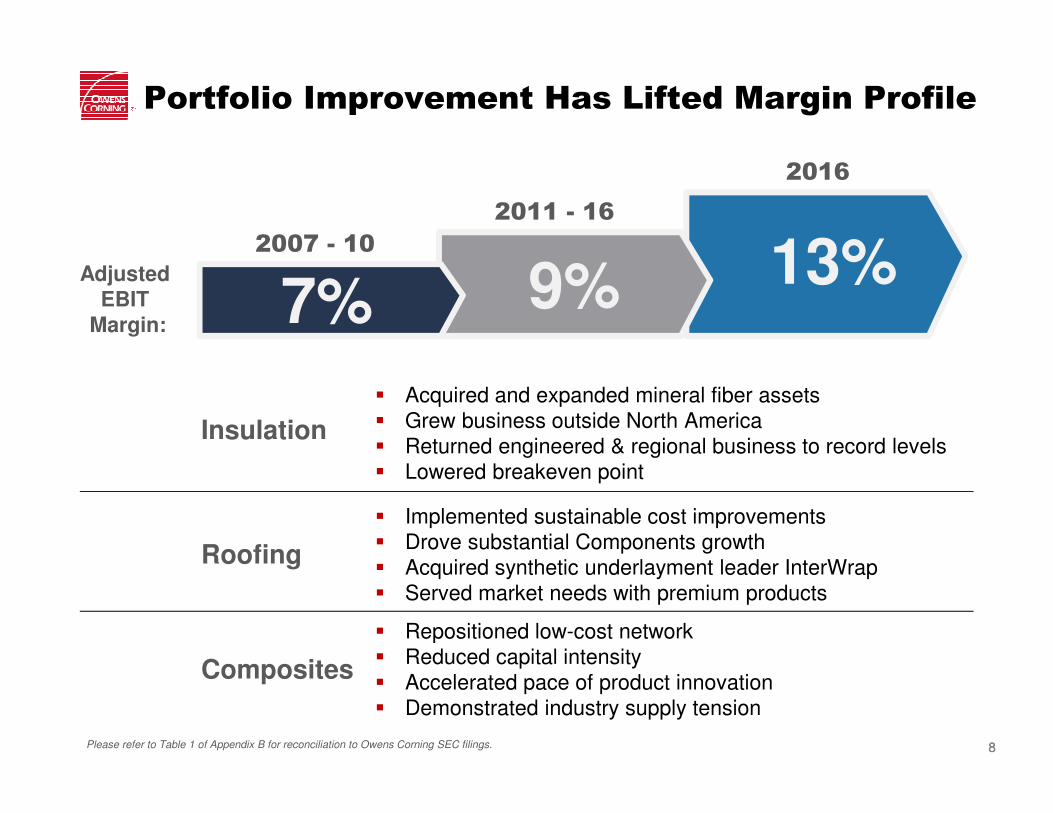
Portfolio Improvement Has Lifted Margin Profile
� Implemented sustainable cost improvements� Drove substantial Components growth� Acquired synthetic underlayment leader InterWrap� Served market needs with premium products
� Acquired and expanded mineral fiber assets� Grew business outside North America� Returned engineered & regional business to record levels� Lowered breakeven point
� Repositioned low-cost network� Reduced capital intensity� Accelerated pace of product innovation� Demonstrated industry supply tension
Adjusted EBIT
Margin:
Insulation
Roofing
Composites
13%2007 - 10
2011 - 16
2016
9%7%
Please refer to Table 1 of Appendix B for reconciliation to Owens Corning SEC filings.
99
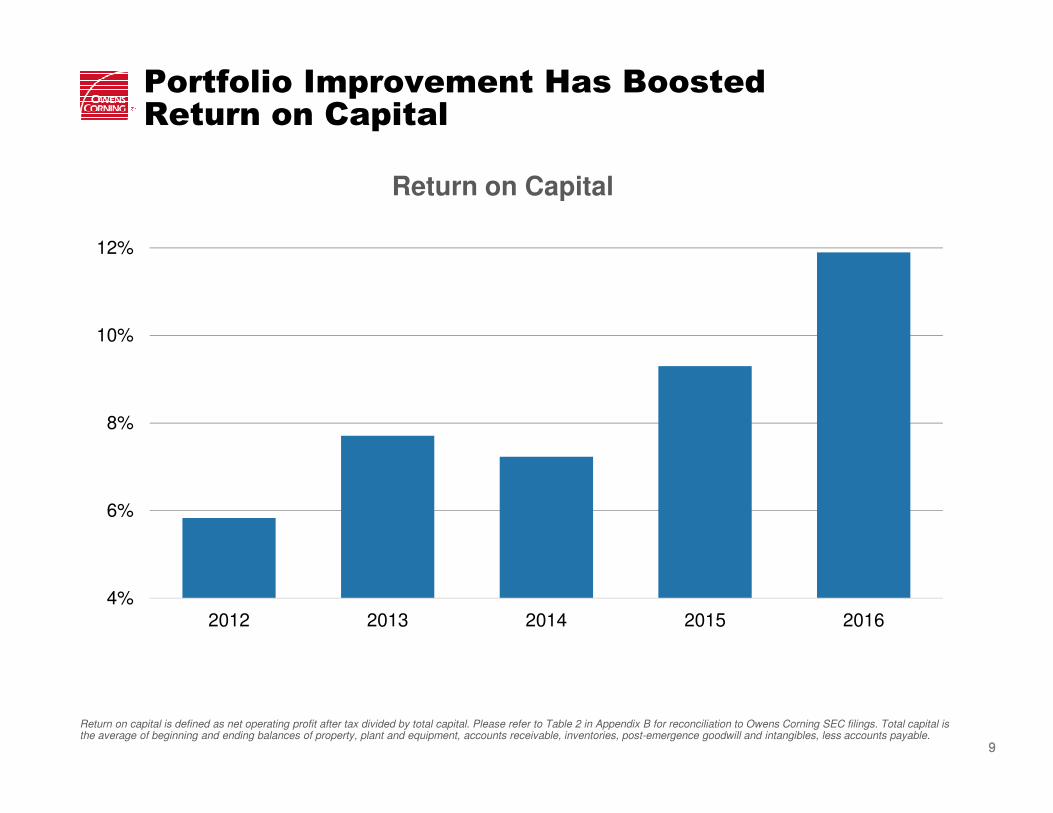
Return on capital is defined as net operating profit after tax divided by total capital. Please refer to Table 2 in Appendix B for reconciliation to Owens Corning SEC filings. Total capital is the average of beginning and ending balances of property, plant and equipment, accounts receivable, inventories, post-emergence goodwill and intangibles, less accounts payable.
Portfolio Improvement Has BoostedReturn on Capital
4%
6%
8%
10%
12%
2012 2013 2014 2015 2016
Return on Capital
1010
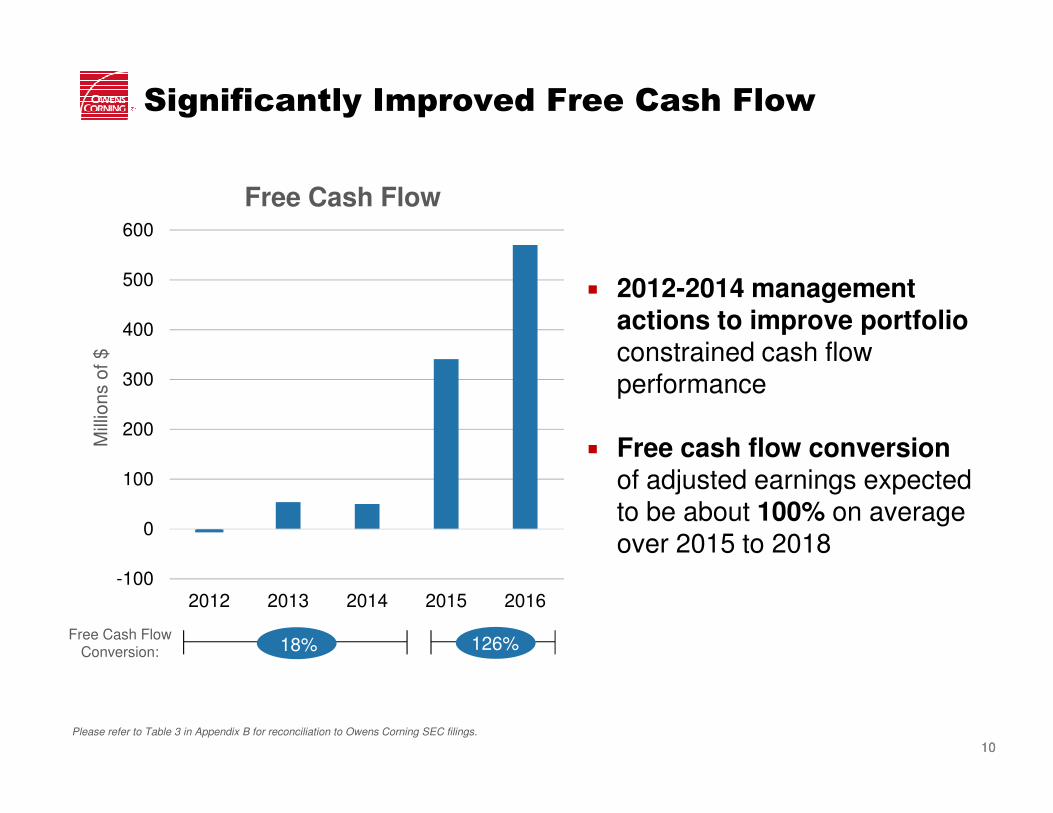
18%
Significantly Improved Free Cash Flow
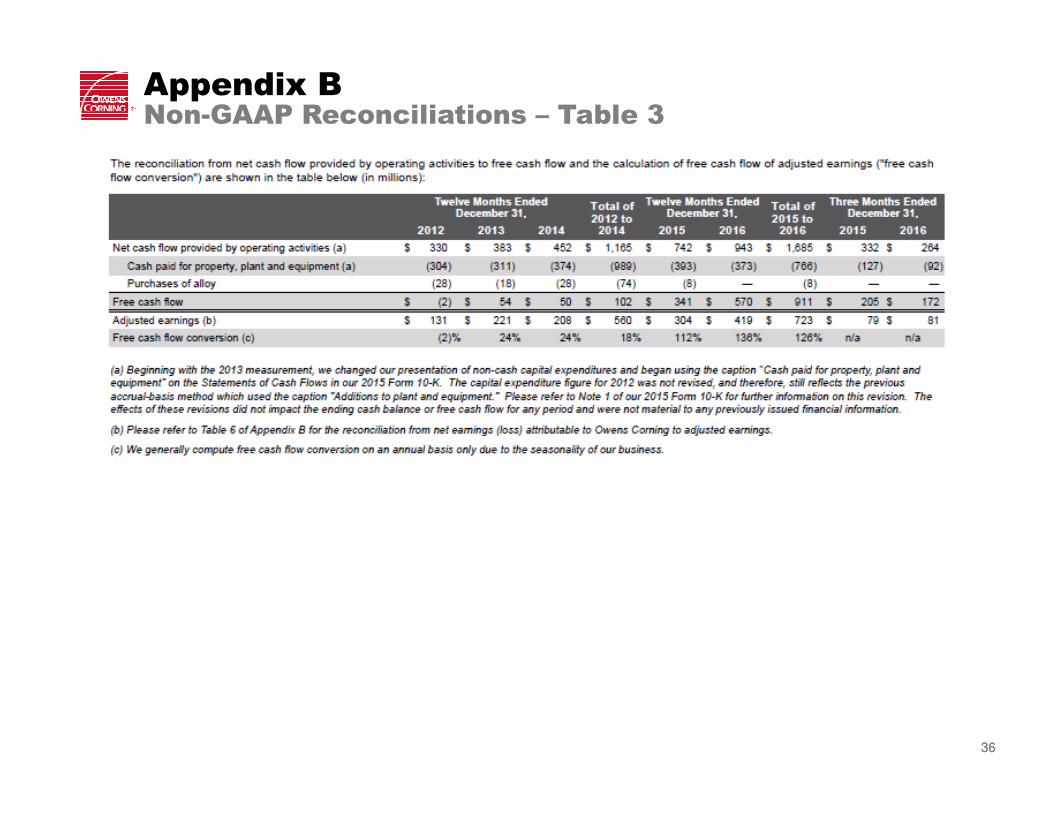
Please refer to Table 3 in Appendix B for reconciliation to Owens Corning SEC filings.
-100
0
100
200
300
400
500
600
2012 2013 2014 2015 2016
Mill
ions o
f $
� 2012-2014 management actions to improve portfolio constrained cash flow performance
� Free cash flow conversionof adjusted earnings expected to be about 100% on average over 2015 to 2018
Free Cash Flow
Free Cash FlowConversion: 126%
1111
0%
1%
2%
3%
4%
5%
6%
7%
8%
9%
10%
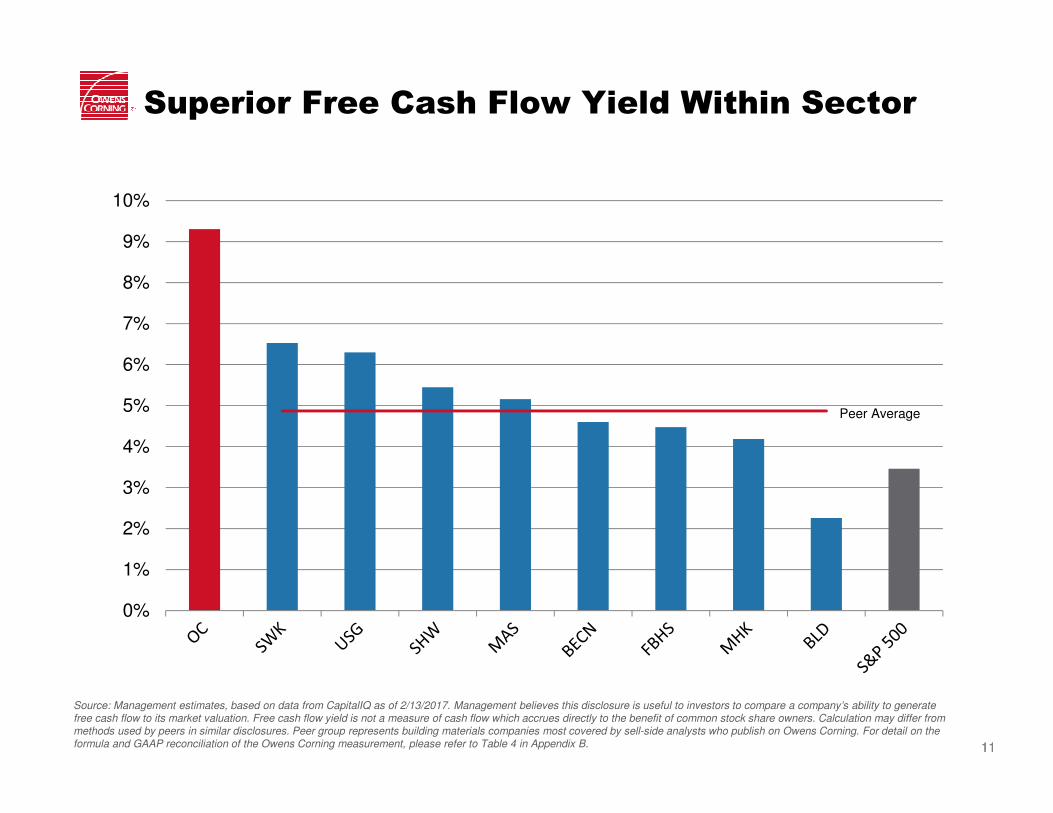
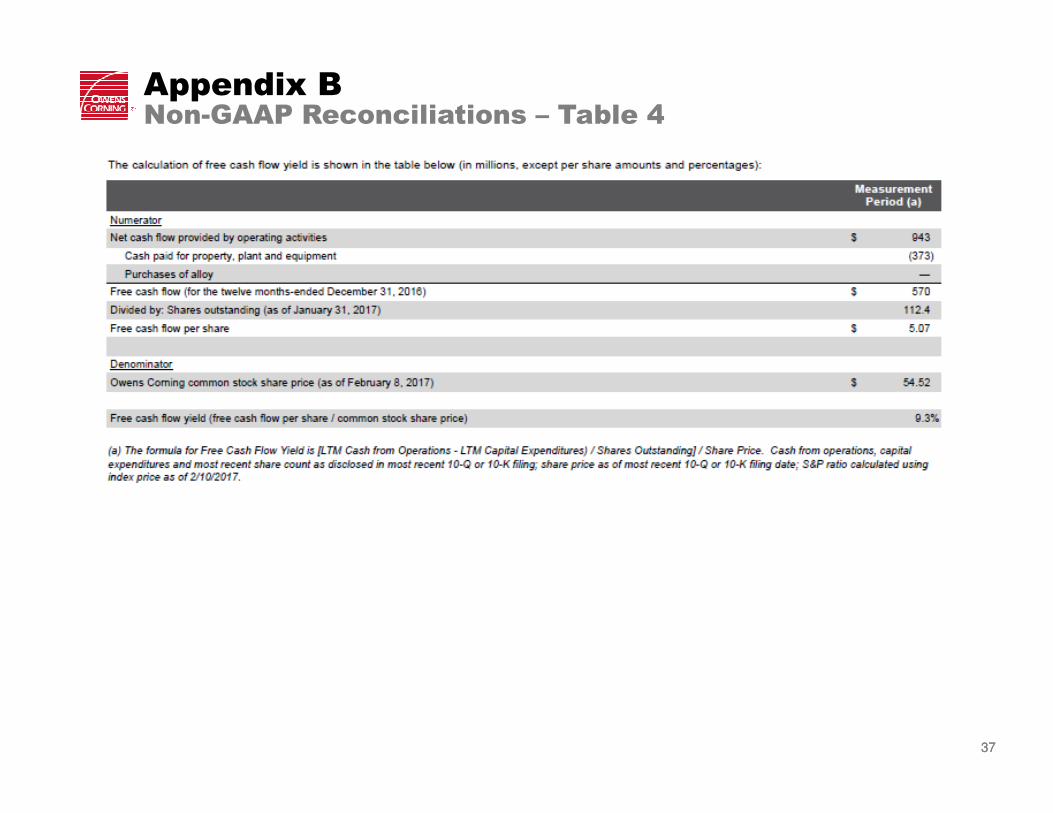
Source: Management estimates, based on data from CapitalIQ as of 2/13/2017. Management believes this disclosure is useful to investors to compare a company’s ability to generate free cash flow to its market valuation. Free cash flow yield is not a measure of cash flow which accrues directly to the benefit of common stock share owners. Calculation may differ from methods used by peers in similar disclosures. Peer group represents building materials companies most covered by sell-side analysts who publish on Owens Corning. For detail on the formula and GAAP reconciliation of the Owens Corning measurement, please refer to Table 4 in Appendix B.
Superior Free Cash Flow Yield Within Sector
Peer Average
1212
Disciplined Capital Allocation Strategy
� Drive shareholder returns by enabling organic and inorganic growth and supporting the balance sheet
o Maintain investment grade
� Capital allocation strategy
o Investing in attractive organic growth
o Pursuing value-creating acquisitions
o Returning cash to shareholders
� Strong cash flow outlook supports dividend growth, share repurchase and acquisitions
� Benefit from $1.8B U.S. Federal N.O.L. with estimated present value of approximately $5 per share
Source: U.S. Federal et operating loss (“N.O.L.”) as of 12/31/2016, as reported in Owens Corning SEC filings.
The Company
Investment Thesis
Three Strong Businesses
Additional Financial Information
Agenda
1414
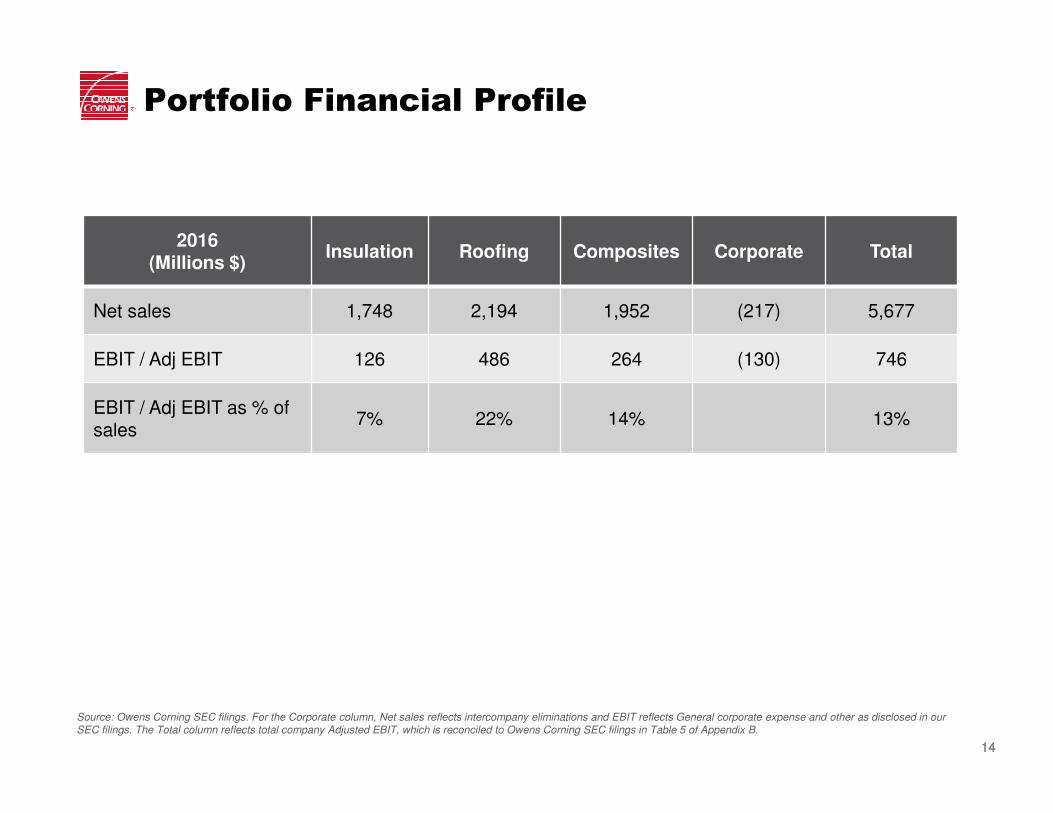
2016(Millions $)
Insulation Roofing Composites Corporate Total
Net sales 1,748 2,194 1,952 (217) 5,677
EBIT / Adj EBIT 126 486 264 (130) 746
EBIT / Adj EBIT as % of sales
7% 22% 14% 13%
Portfolio Financial Profile
Source: Owens Corning SEC filings. For the Corporate column, Net sales reflects intercompany eliminations and EBIT reflects General corporate expense and other as disclosed in our SEC filings. The Total column reflects total company Adjusted EBIT, which is reconciled to Owens Corning SEC filings in Table 5 of Appendix B.
1515
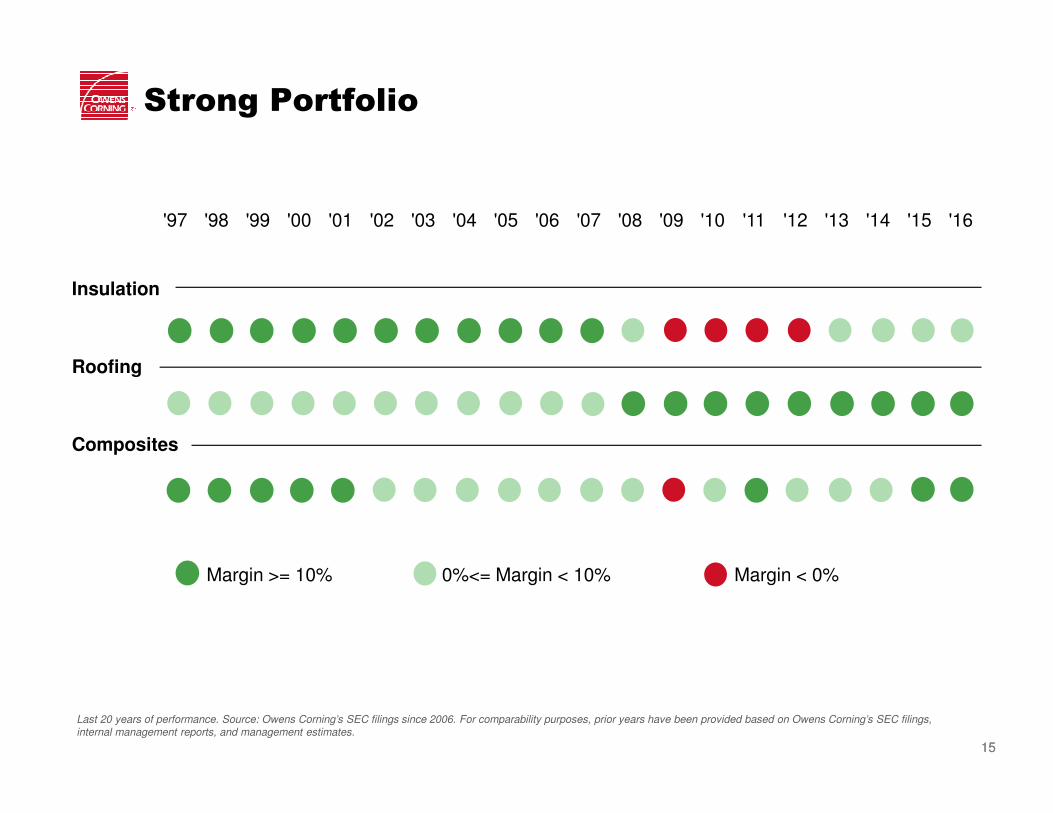
Margin >= 10% 0%<= Margin < 10% Margin < 0%
'97 '98 '99 '00 '01 '02 '03 '04 '05 '06 '07 '08 '09 '10 '11 '12 '13 '14 '15 '16
Insulation
Roofing
Composites
Strong Portfolio
Last 20 years of performance. Source: Owens Corning’s SEC filings since 2006. For comparability purposes, prior years have been provided based on Owens Corning’s SEC filings, internal management reports, and management estimates.
1616
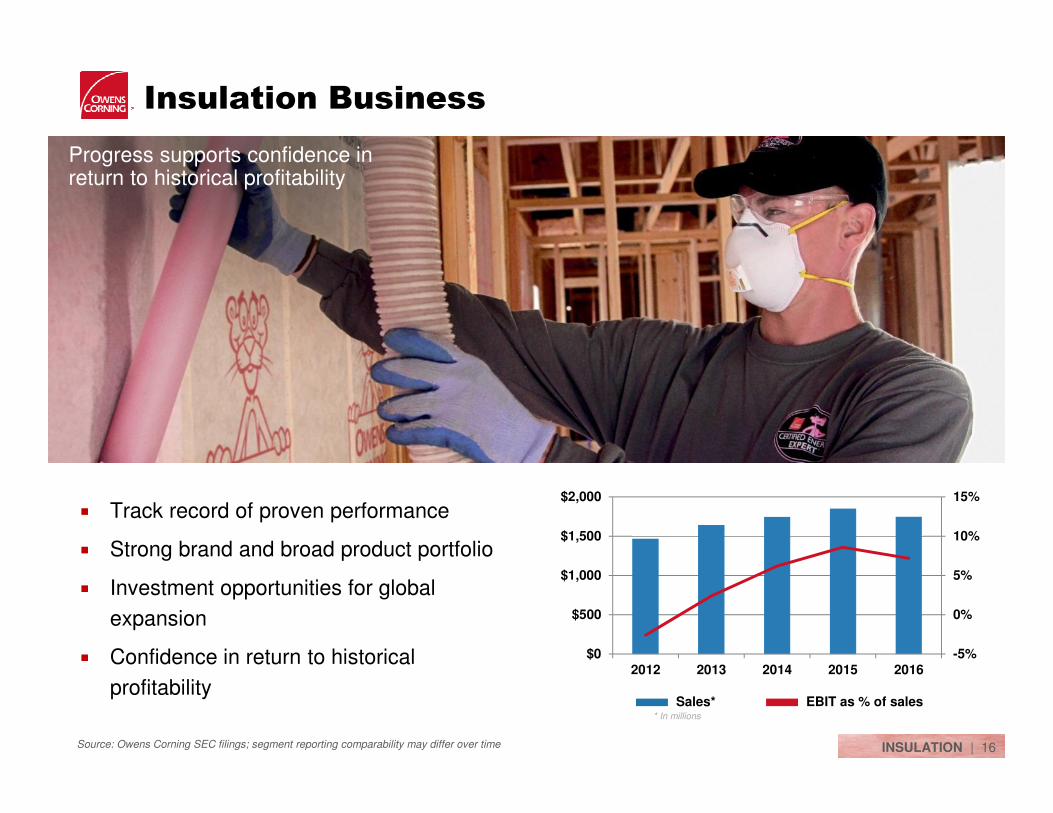
Insulation Business
� Track record of proven performance
� Strong brand and broad product portfolio
� Investment opportunities for global
expansion
� Confidence in return to historical
profitability
Source: Owens Corning SEC filings; segment reporting comparability may differ over time
* In millions
Sales* EBIT as % of sales
-5%
0%
5%
10%
15%
$0
$500
$1,000
$1,500
$2,000
2012 2013 2014 2015 2016
Progress supports confidence in return to historical profitability
INSULATION | 16
1717
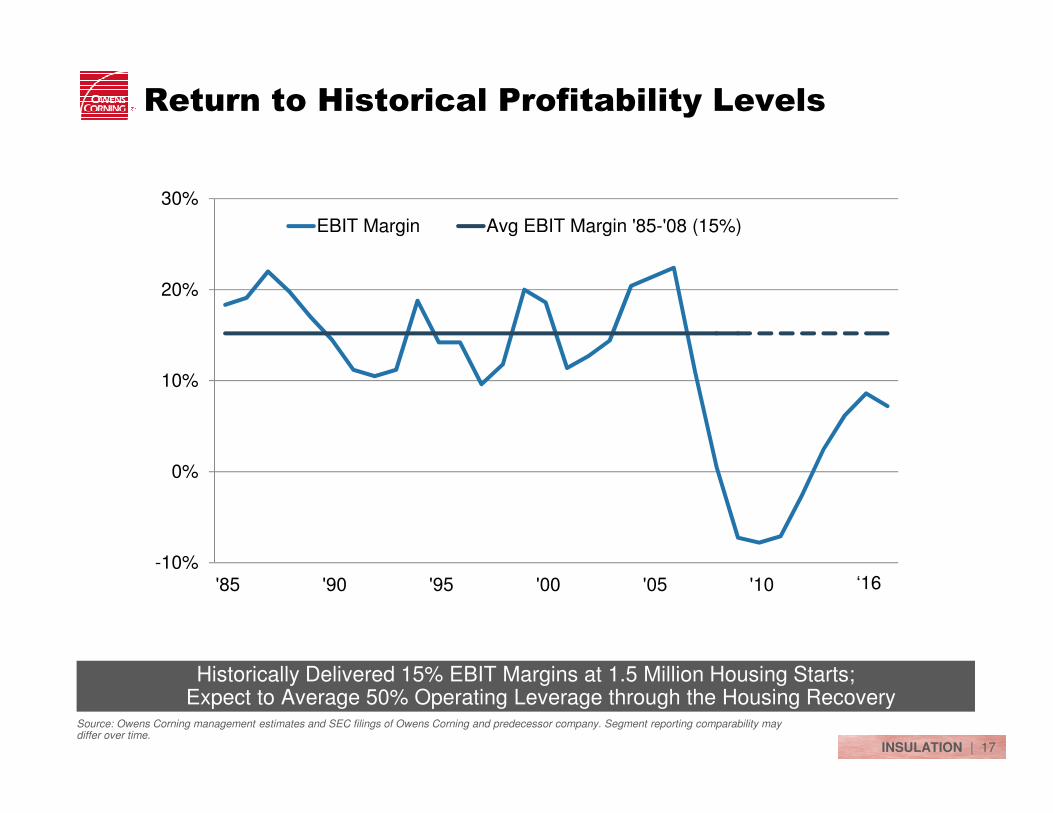
-10%
0%
10%
20%
30%
'85 '90 '95 '00 '05 '10 '15
EBIT Margin Avg EBIT Margin '85-'08 (15%)
Return to Historical Profitability Levels
Historically Delivered 15% EBIT Margins at 1.5 Million Housing Starts; Expect to Average 50% Operating Leverage through the Housing Recovery
Source: Owens Corning management estimates and SEC filings of Owens Corning and predecessor company. Segment reporting comparability may differ over time.
INSULATION | 17
‘16
1818
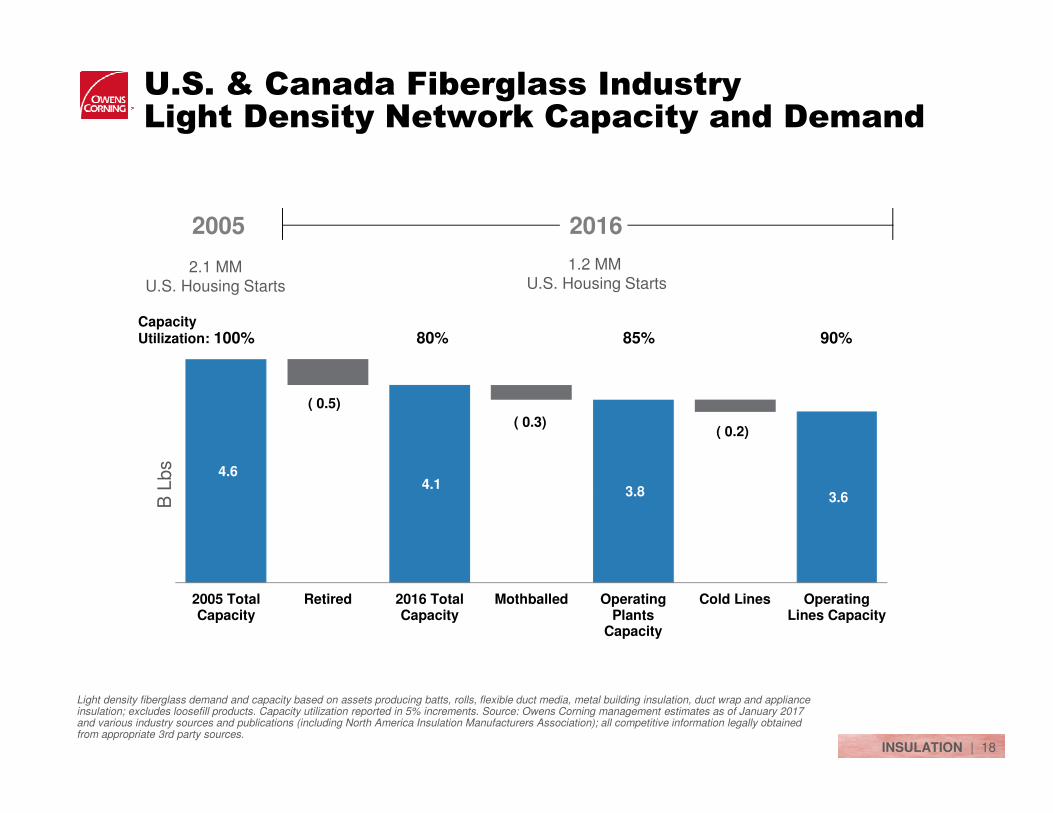
( 0.5)
( 0.3) ( 0.2)
4.6 4.1
3.8 3.6
2005 TotalCapacity
Retired 2016 TotalCapacity
Mothballed OperatingPlants
Capacity
Cold Lines OperatingLines Capacity
Capacity Utilization: 100% 73% 85% 90%
2005
B L
bs
U.S. & Canada Fiberglass Industry Light Density Network Capacity and Demand
Light density fiberglass demand and capacity based on assets producing batts, rolls, flexible duct media, metal building insulation, duct wrap and appliance insulation; excludes loosefill products. Capacity utilization reported in 5% increments. Source: Owens Corning management estimates as of January 2017 and various industry sources and publications (including North America Insulation Manufacturers Association); all competitive information legally obtained from appropriate 3rd party sources.
INSULATION | 18
80% 85% 90%
2016
2.1 MM U.S. Housing Starts
1.2 MMU.S. Housing Starts
1919
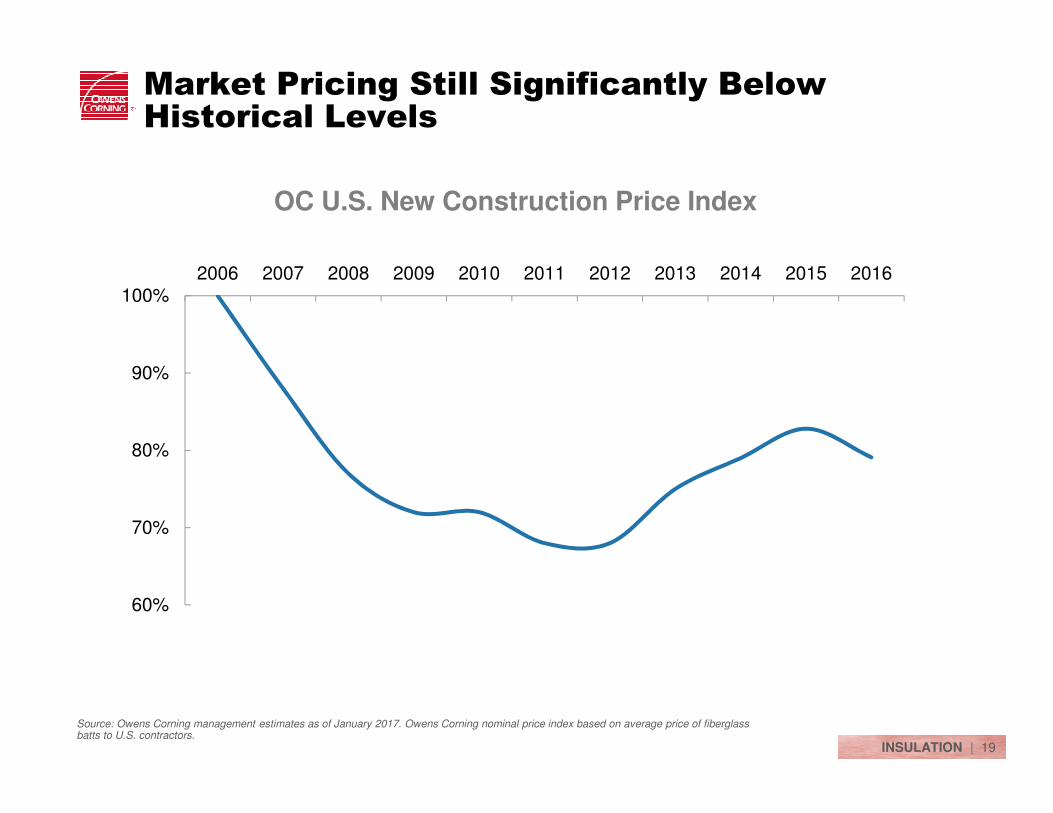
Market Pricing Still Significantly Below Historical Levels
OC U.S. New Construction Price Index
INSULATION | 19
60%
70%
80%
90%
100%2006 2007 2008 2009 2010 2011 2012 2013 2014 2015 2016
Source: Owens Corning management estimates as of January 2017. Owens Corning nominal price index based on average price of fiberglass batts to U.S. contractors.
2020
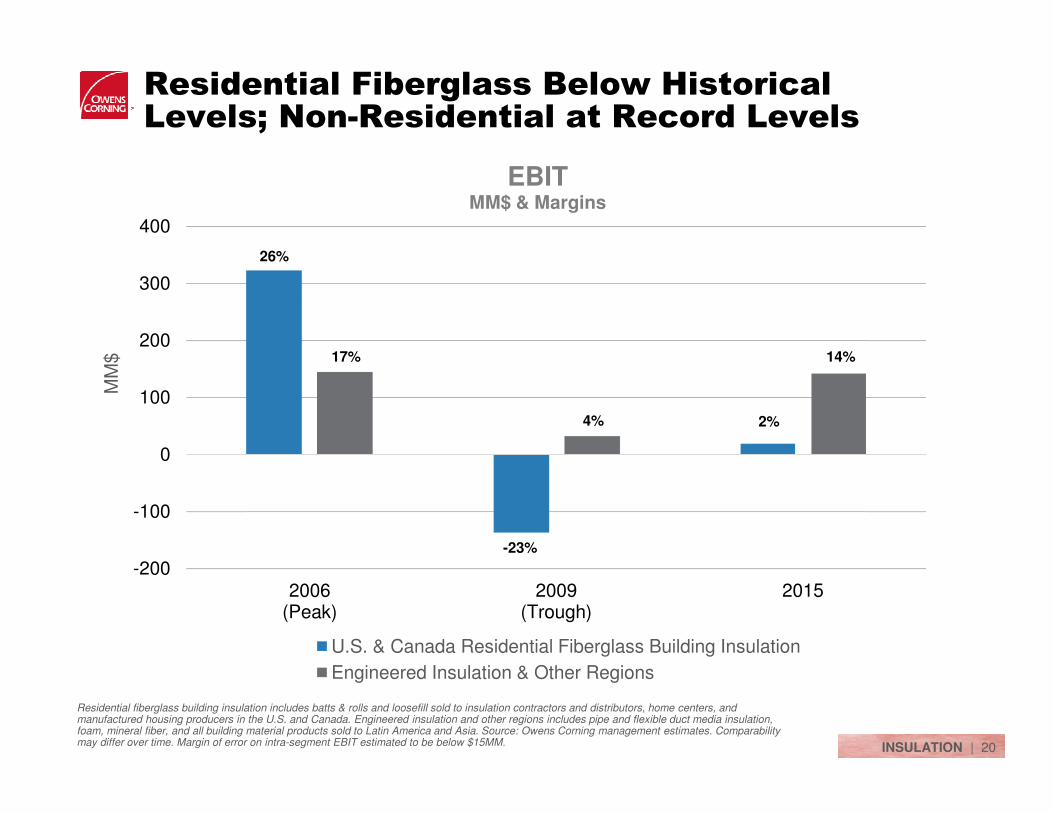
Residential Fiberglass Below Historical Levels; Non-Residential at Record Levels
Residential fiberglass building insulation includes batts & rolls and loosefill sold to insulation contractors and distributors, home centers, and manufactured housing producers in the U.S. and Canada. Engineered insulation and other regions includes pipe and flexible duct media insulation, foam, mineral fiber, and all building material products sold to Latin America and Asia. Source: Owens Corning management estimates. Comparability may differ over time. Margin of error on intra-segment EBIT estimated to be below $15MM.
-200
-100
0
100
200
300
400
2006(Peak)
2009(Trough)
2015
MM
$
EBITMM$ & Margins
U.S. & Canada Residential Fiberglass Building Insulation
Engineered Insulation & Other Regions
26%
17%
-23%
4% 2%
14%
INSULATION | 20
2121
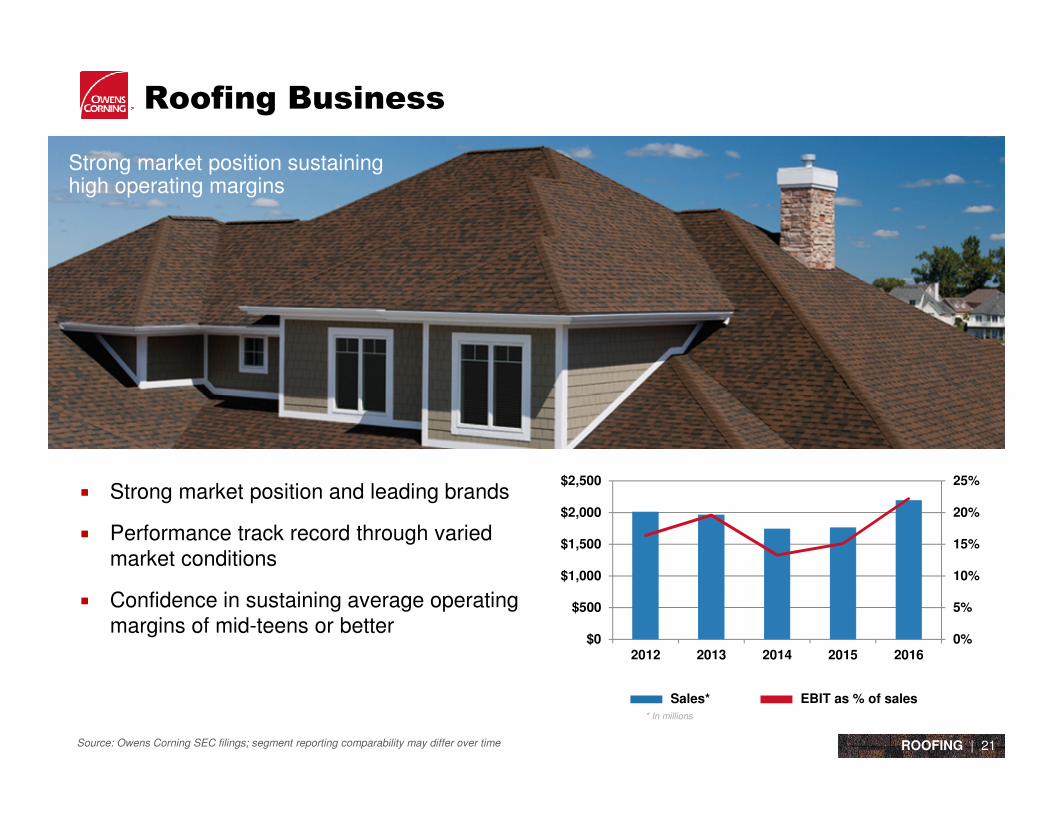
Roofing Business
� Strong market position and leading brands
� Performance track record through varied market conditions
� Confidence in sustaining average operating margins of mid-teens or better
* In millions
Sales* EBIT as % of sales
0%
5%
10%
15%
20%
25%
$0
$500
$1,000
$1,500
$2,000
$2,500
2012 2013 2014 2015 2016
Strong market position sustaining high operating margins
ROOFING | 21Source: Owens Corning SEC filings; segment reporting comparability may differ over time
2222
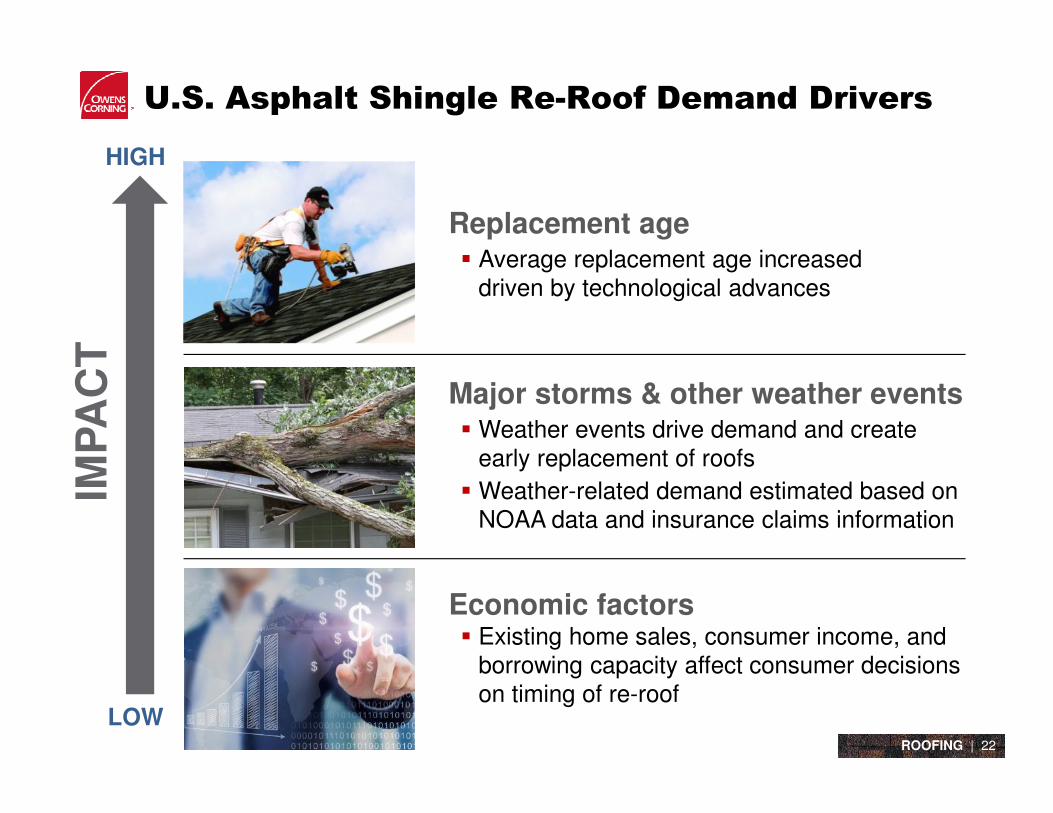
U.S. Asphalt Shingle Re-Roof Demand Drivers
Replacement age� Average replacement age increased
driven by technological advances
Major storms & other weather events� Weather events drive demand and create
early replacement of roofs
� Weather-related demand estimated based on NOAA data and insurance claims information
Economic factors� Existing home sales, consumer income, and
borrowing capacity affect consumer decisions on timing of re-roof
IMP
AC
T
LOW
HIGH
ROOFING | 22
2323
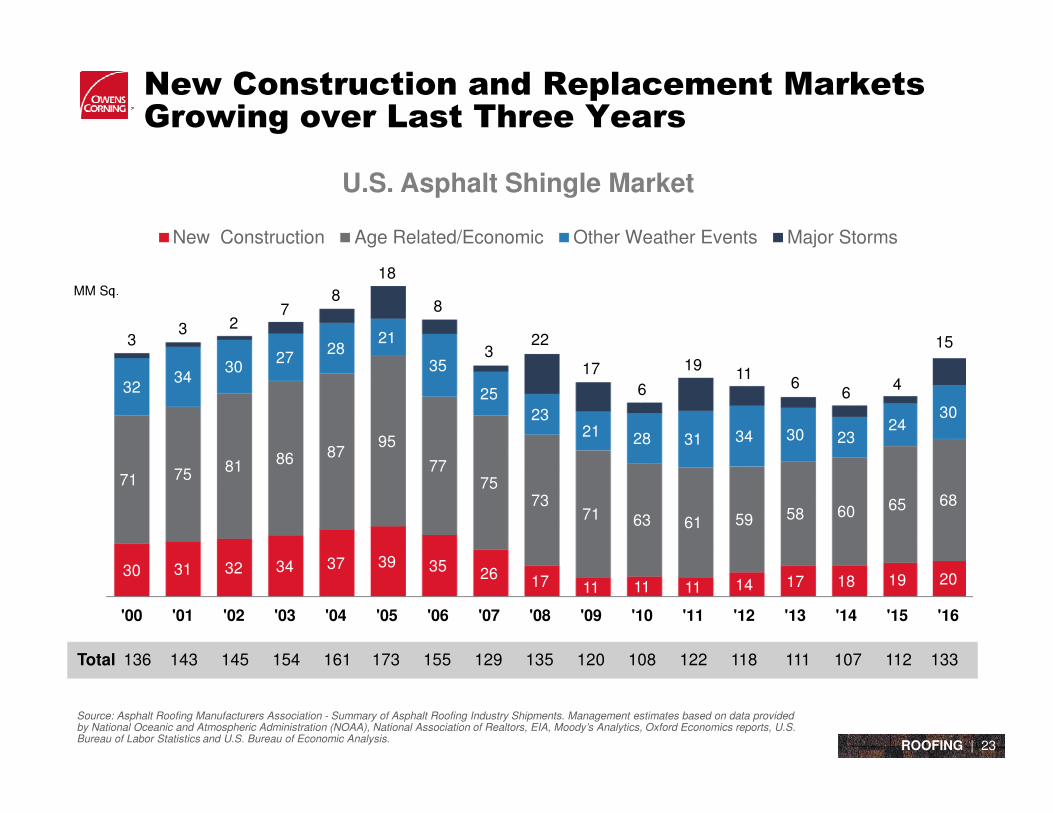
New Construction and Replacement Markets Growing over Last Three Years
Source: Asphalt Roofing Manufacturers Association - Summary of Asphalt Roofing Industry Shipments. Management estimates based on data provided by National Oceanic and Atmospheric Administration (NOAA), National Association of Realtors, EIA, Moody’s Analytics, Oxford Economics reports, U.S. Bureau of Labor Statistics and U.S. Bureau of Economic Analysis.
MM Sq.
Total 136 143 145 154 161 173 155 129 135 120 108 122 118 111 107 112 133
U.S. Asphalt Shingle Market
ROOFING | 23
30 31 32 34 37 39 35 26 17 11 11 11 14 17 18 19 20
71 7581 86 87
95
7775
7371 63 61 59 58 60 65 68
3234
3027
2821
35
25
2321 28 31 34 30 23
2430
33 2
78
18
8
322
17
6
1911
66
4
'00 '01 '02 '03 '04 '05 '06 '07 '08 '09 '10 '11 '12 '13 '14 '15 '16
New Construction Age Related/Economic Other Weather Events Major Storms
15
2424
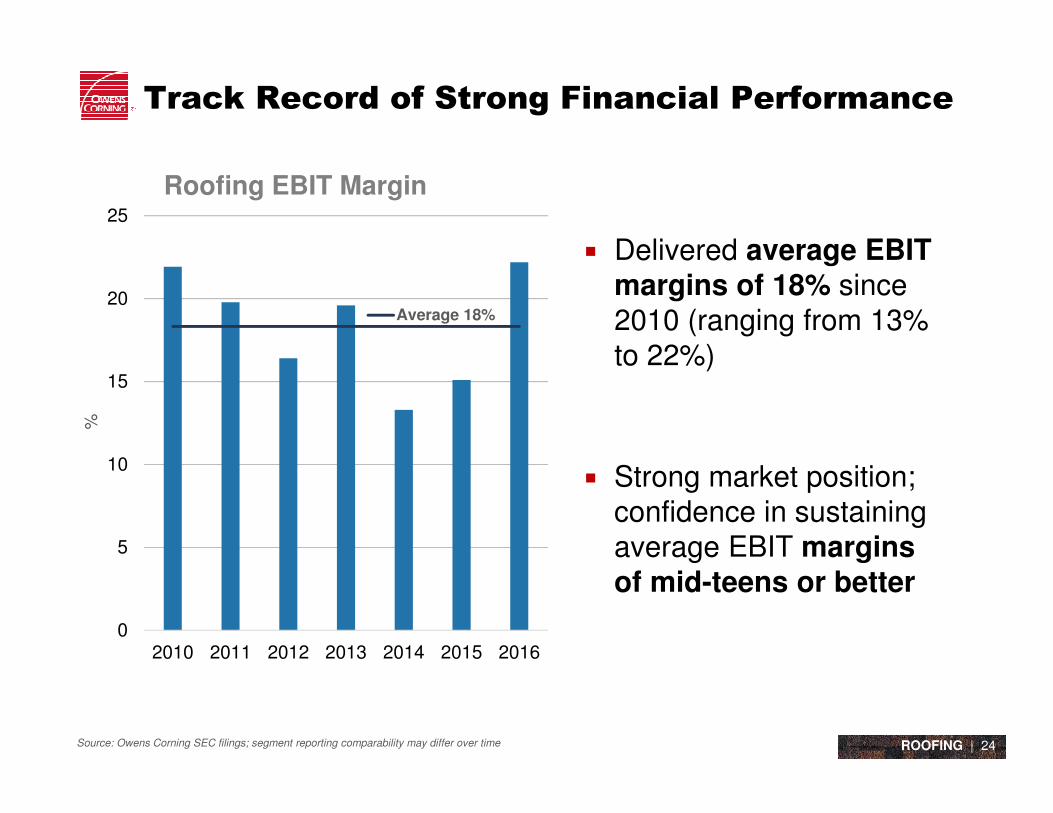
Track Record of Strong Financial Performance
� Delivered average EBIT margins of 18% since 2010 (ranging from 13% to 22%)
� Strong market position; confidence in sustaining average EBIT margins of mid-teens or better
ROOFING | 24
0
5
10
15
20
25
2010 2011 2012 2013 2014 2015 2016
%
Roofing EBIT Margin
Average 18%
Source: Owens Corning SEC filings; segment reporting comparability may differ over time
2525
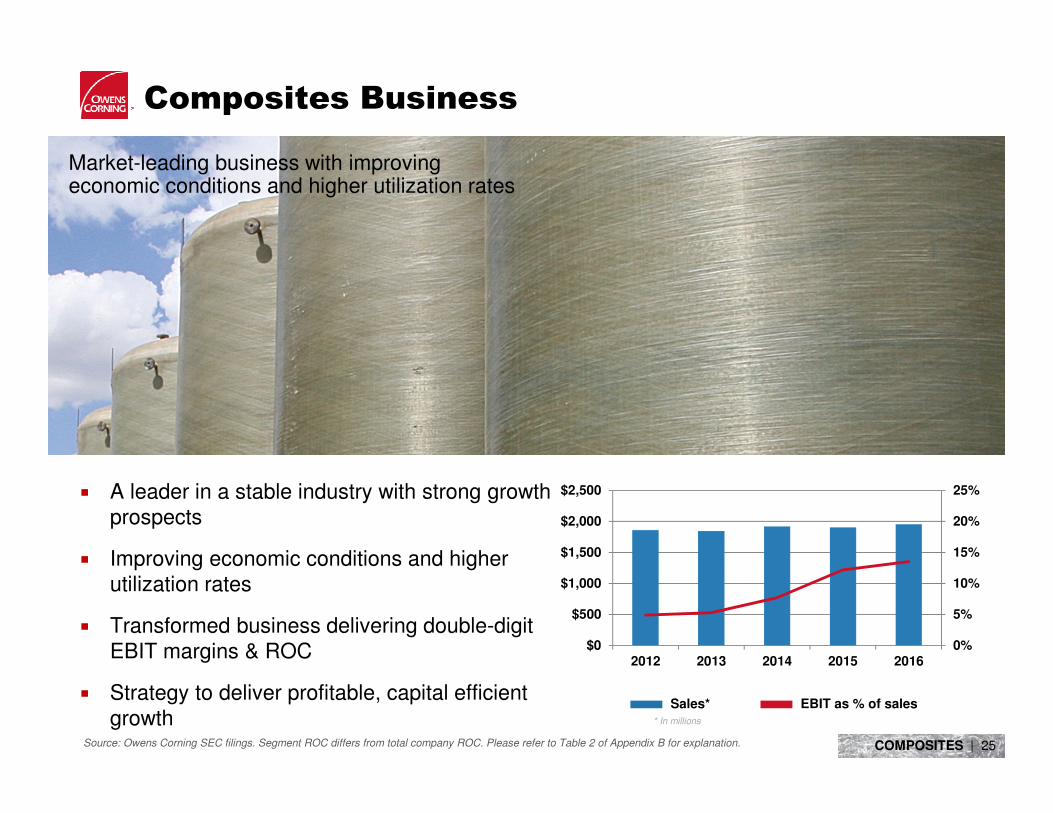
Composites Business
� A leader in a stable industry with strong growth prospects
� Improving economic conditions and higher utilization rates
� Transformed business delivering double-digit EBIT margins & ROC
� Strategy to deliver profitable, capital efficient growth
Source: Owens Corning SEC filings. Segment ROC differs from total company ROC. Please refer to Table 2 of Appendix B for explanation.
* In millions
Sales* EBIT as % of sales
Market-leading business with improving economic conditions and higher utilization rates
0%
5%
10%
15%
20%
25%
$0
$500
$1,000
$1,500
$2,000
$2,500
2012 2013 2014 2015 2016
COMPOSITES | 25
2626
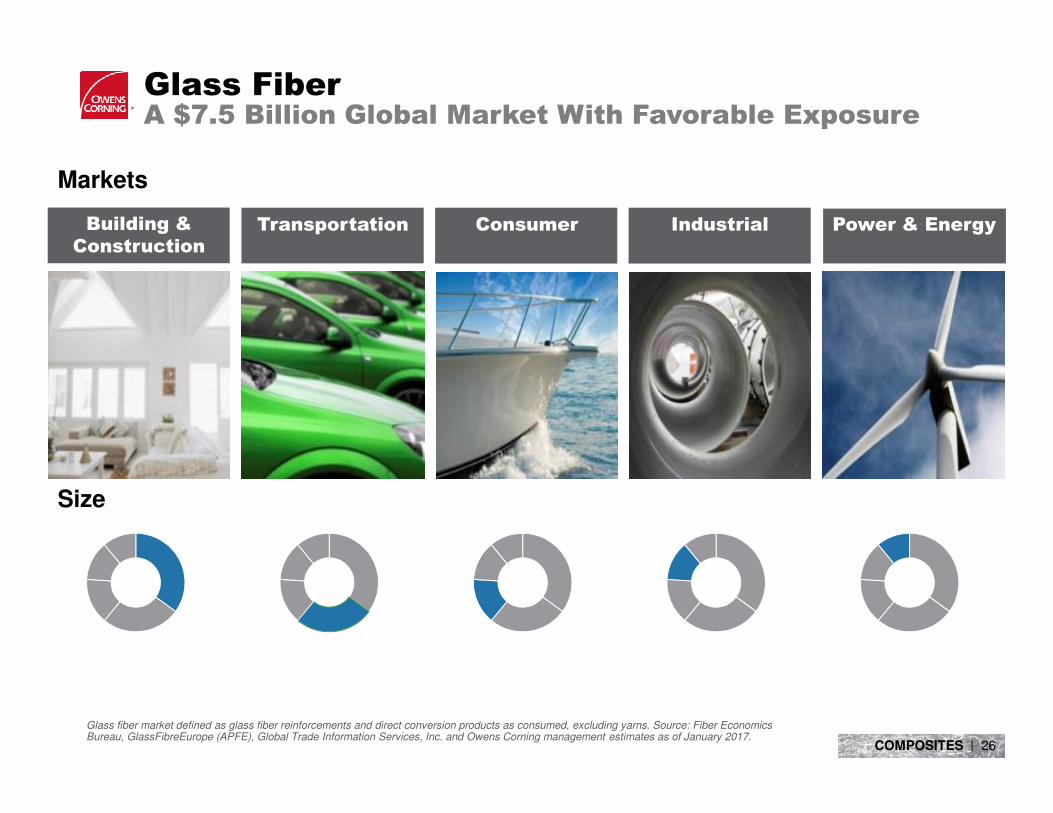
Glass Fiber A $7.5 Billion Global Market With Favorable Exposure
Glass fiber market defined as glass fiber reinforcements and direct conversion products as consumed, excluding yarns. Source: Fiber Economics Bureau, GlassFibreEurope (APFE), Global Trade Information Services, Inc. and Owens Corning management estimates as of January 2017.
Markets
Size
Power & EnergyConsumerBuilding & Construction
Transportation Industrial
COMPOSITES | 26
2727
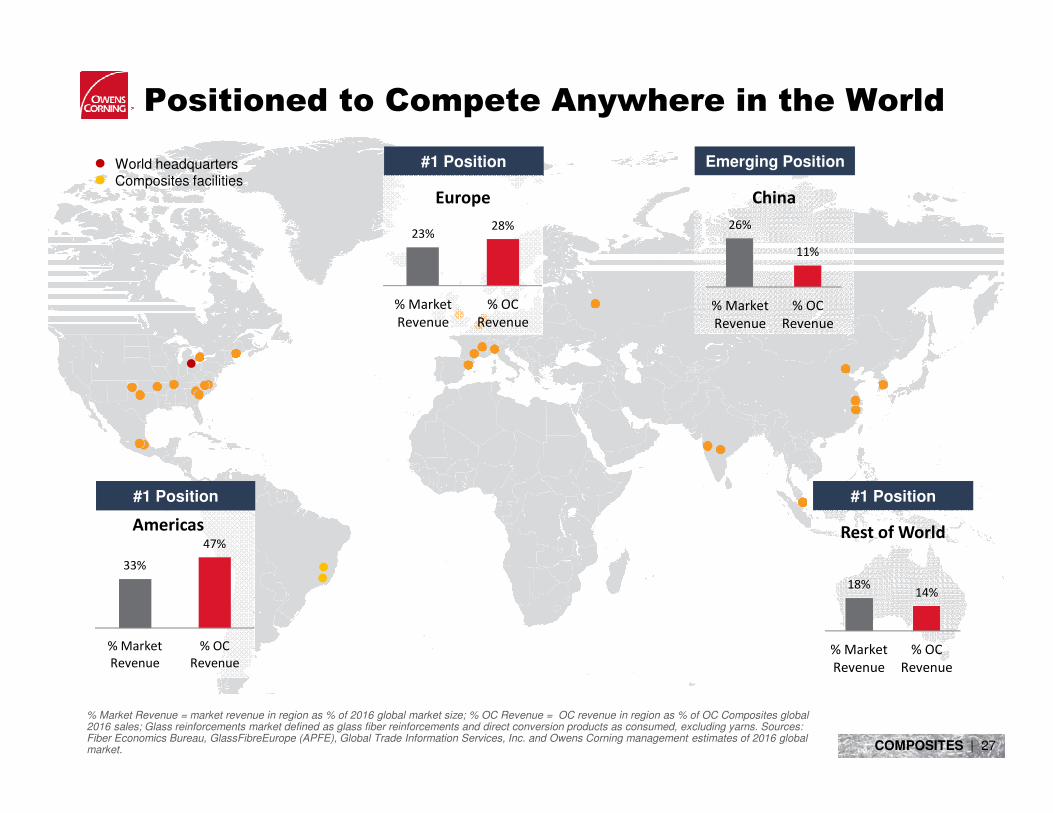
Positioned to Compete Anywhere in the World
% Market Revenue = market revenue in region as % of 2016 global market size; % OC Revenue = OC revenue in region as % of OC Composites global 2016 sales; Glass reinforcements market defined as glass fiber reinforcements and direct conversion products as consumed, excluding yarns. Sources: Fiber Economics Bureau, GlassFibreEurope (APFE), Global Trade Information Services, Inc. and Owens Corning management estimates of 2016 global market.
33%
47%
% Market
Revenue
% OC
Revenue
Americas
#1 Position
26%
11%
% Market
Revenue
% OC
Revenue
China
Emerging PositionWorld headquartersComposites facilities
#1 Position
23%28%
% Market
Revenue
% OC
Revenue
Europe
#1 Position
18%14%
% Market
Revenue
% OC
Revenue
Rest of World
COMPOSITES | 27
2828
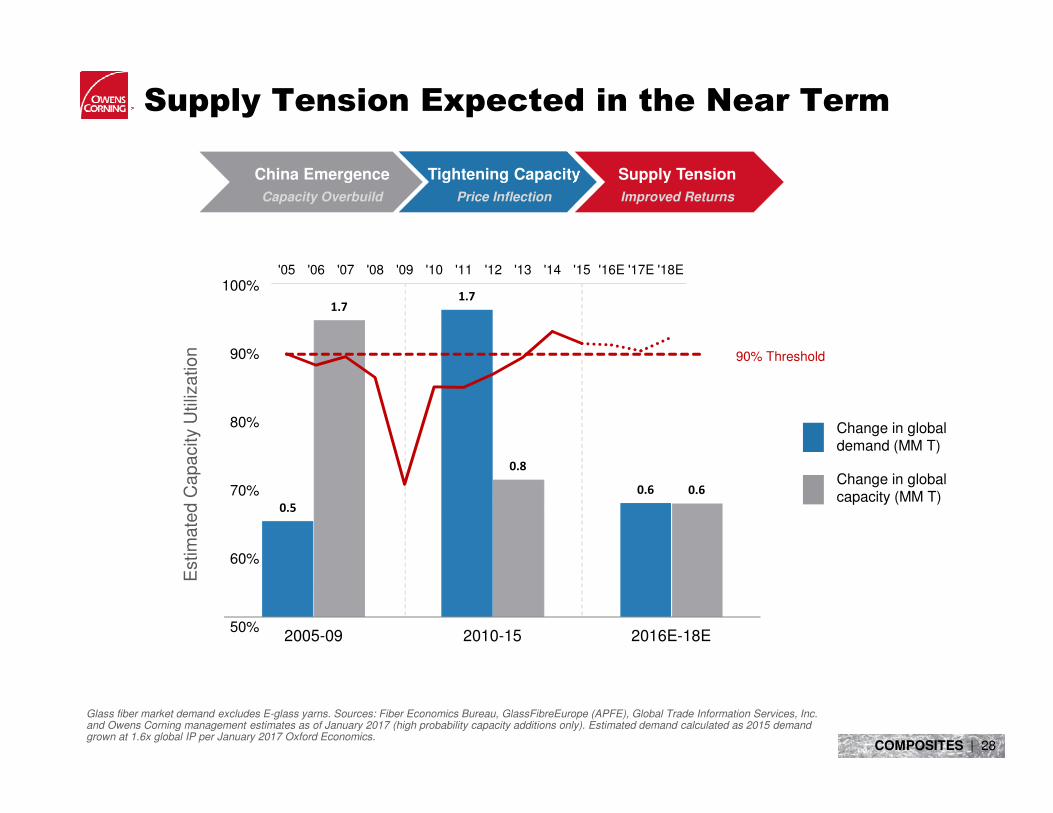
Supply Tension Expected in the Near Term
Glass fiber market demand excludes E-glass yarns. Sources: Fiber Economics Bureau, GlassFibreEurope (APFE), Global Trade Information Services, Inc. and Owens Corning management estimates as of January 2017 (high probability capacity additions only). Estimated demand calculated as 2015 demand grown at 1.6x global IP per January 2017 Oxford Economics.
0.5
1.7
0.6
1.7
0.8
0.6
2005-09 2010-15 2016E-18E
Change in global demand (MM T)
Change in global capacity (MM T)
Estim
ate
d C
ap
acity
Utiliz
atio
nChina Emergence
Capacity Overbuild
Tightening Capacity
Price Inflection
Supply Tension
Improved Returns
90% Threshold
50%
60%
70%
80%
90%
100%'05 '06 '07 '08 '09 '10 '11 '12 '13 '14 '15 '16E '17E '18E
COMPOSITES | 28

The Company
Investment Thesis
Three Strong Businesses
Additional Financial Information
Agenda
3030
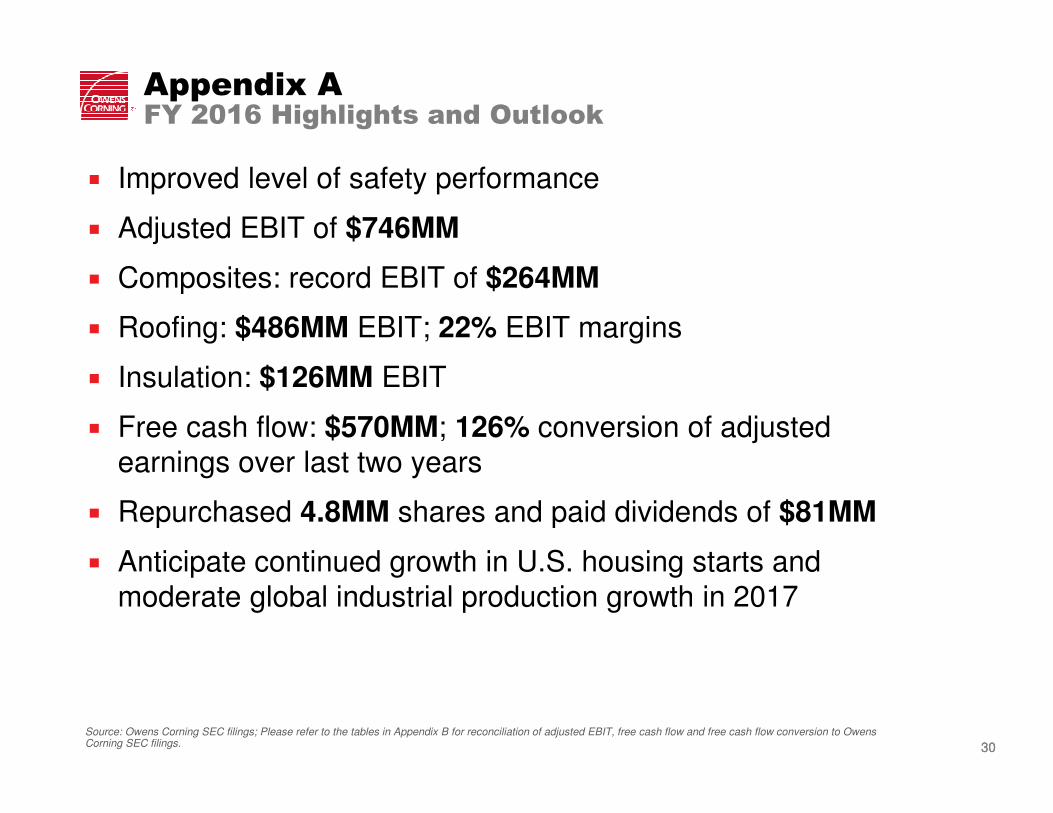
� Improved level of safety performance
� Adjusted EBIT of $746MM
� Composites: record EBIT of $264MM
� Roofing: $486MM EBIT; 22% EBIT margins
� Insulation: $126MM EBIT
� Free cash flow: $570MM; 126% conversion of adjusted earnings over last two years
� Repurchased 4.8MM shares and paid dividends of $81MM
� Anticipate continued growth in U.S. housing starts and moderate global industrial production growth in 2017
Appendix A FY 2016 Highlights and Outlook
Source: Owens Corning SEC filings; Please refer to the tables in Appendix B for reconciliation of adjusted EBIT, free cash flow and free cash flow conversion to Owens Corning SEC filings.
3131
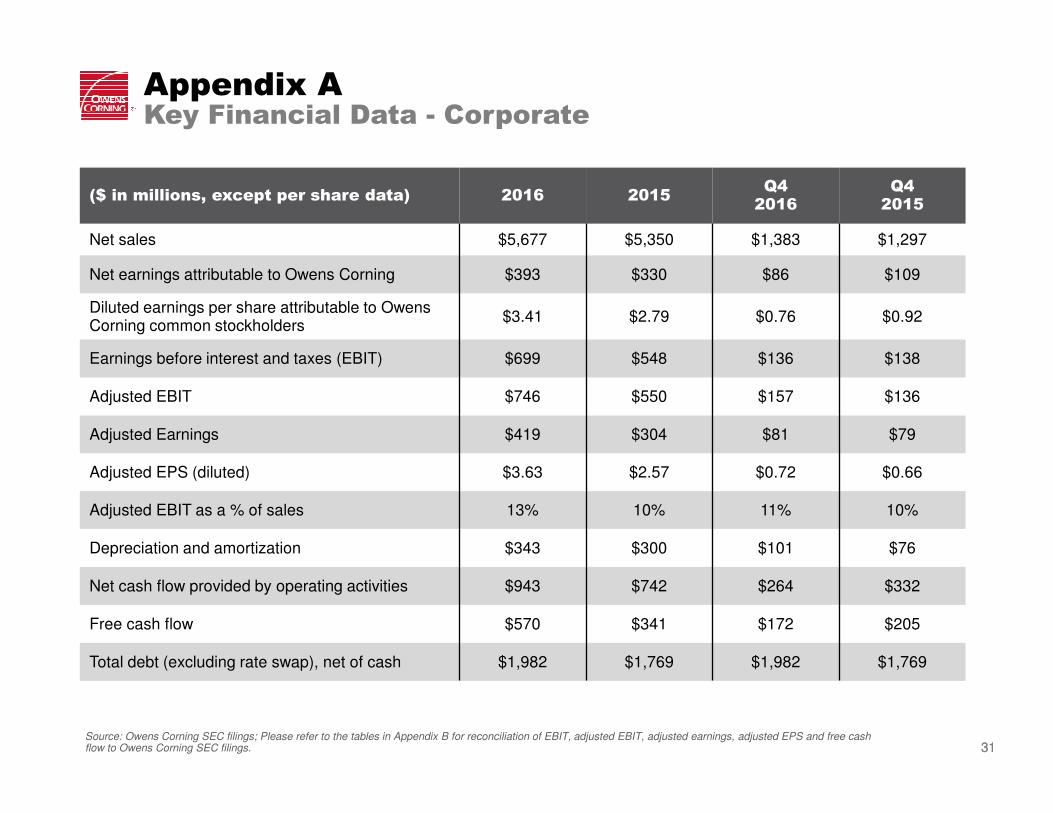
($ in millions, except per share data) 2016 2015Q42016
Q42015
Net sales $5,677 $5,350 $1,383 $1,297
Net earnings attributable to Owens Corning $393 $330 $86 $109
Diluted earnings per share attributable to Owens Corning common stockholders
$3.41 $2.79 $0.76 $0.92
Earnings before interest and taxes (EBIT) $699 $548 $136 $138
Adjusted EBIT $746 $550 $157 $136
Adjusted Earnings $419 $304 $81 $79
Adjusted EPS (diluted) $3.63 $2.57 $0.72 $0.66
Adjusted EBIT as a % of sales 13% 10% 11% 10%
Depreciation and amortization $343 $300 $101 $76
Net cash flow provided by operating activities $943 $742 $264 $332
Free cash flow $570 $341 $172 $205
Total debt (excluding rate swap), net of cash $1,982 $1,769 $1,982 $1,769
Appendix A Key Financial Data - Corporate
Source: Owens Corning SEC filings; Please refer to the tables in Appendix B for reconciliation of EBIT, adjusted EBIT, adjusted earnings, adjusted EPS and free cash flow to Owens Corning SEC filings.
3232
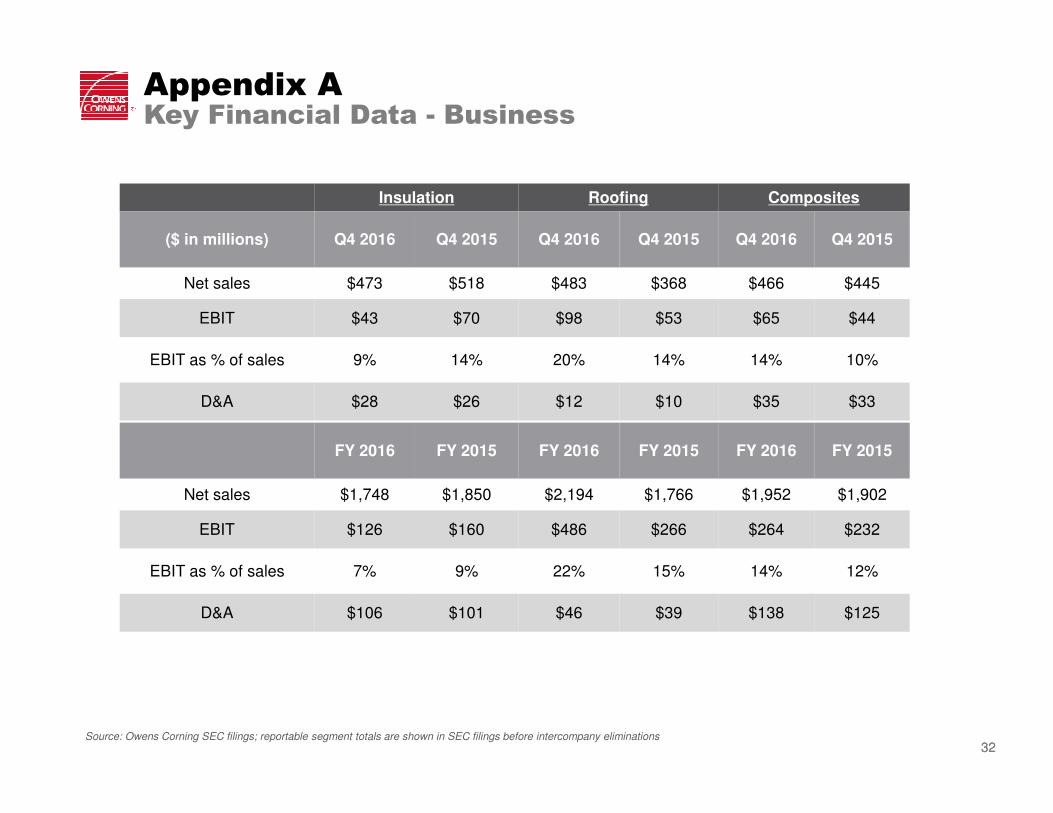
Insulation Roofing Composites
($ in millions) Q4 2016 Q4 2015 Q4 2016 Q4 2015 Q4 2016 Q4 2015
Net sales $473 $518 $483 $368 $466 $445
EBIT $43 $70 $98 $53 $65 $44
EBIT as % of sales 9% 14% 20% 14% 14% 10%
D&A $28 $26 $12 $10 $35 $33
Appendix A Key Financial Data - Business
FY 2016 FY 2015 FY 2016 FY 2015 FY 2016 FY 2015
Net sales $1,748 $1,850 $2,194 $1,766 $1,952 $1,902
EBIT $126 $160 $486 $266 $264 $232
EBIT as % of sales 7% 9% 22% 15% 14% 12%
D&A $106 $101 $46 $39 $138 $125
Source: Owens Corning SEC filings; reportable segment totals are shown in SEC filings before intercompany eliminations
3333
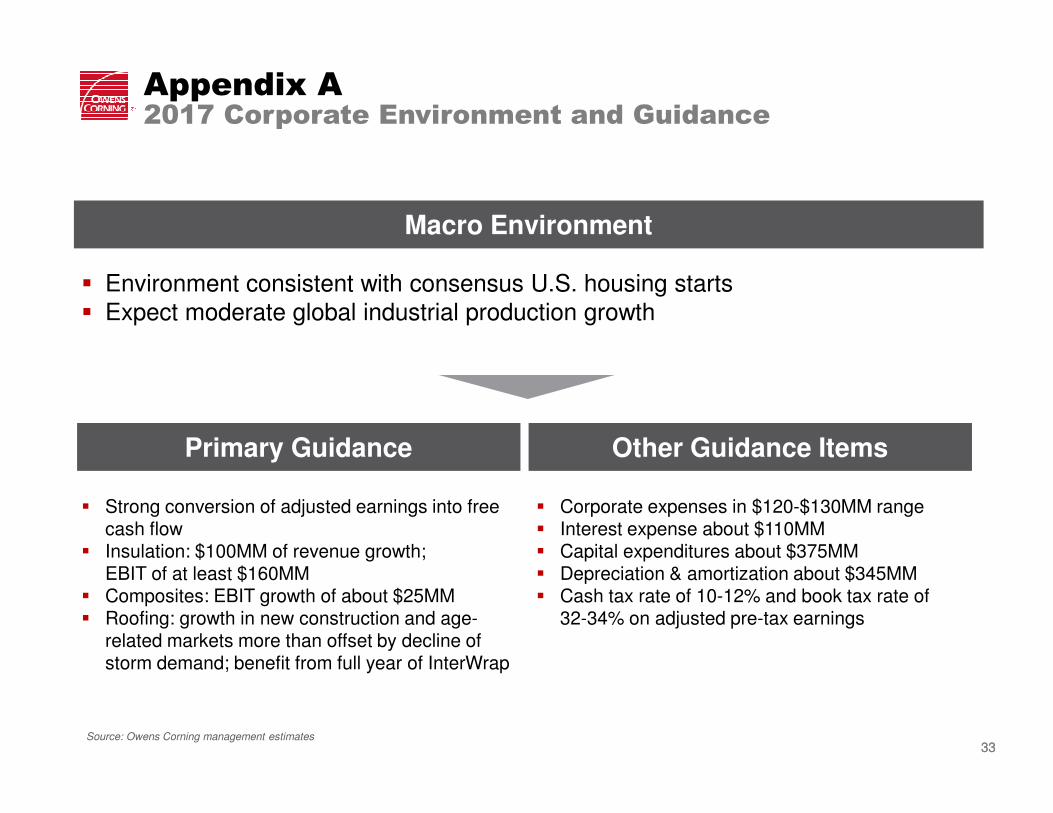
Macro Environment
� Environment consistent with consensus U.S. housing starts� Expect moderate global industrial production growth
Primary Guidance
� Strong conversion of adjusted earnings into free cash flow
� Insulation: $100MM of revenue growth;EBIT of at least $160MM
� Composites: EBIT growth of about $25MM� Roofing: growth in new construction and age-
related markets more than offset by decline of storm demand; benefit from full year of InterWrap
� Corporate expenses in $120-$130MM range� Interest expense about $110MM� Capital expenditures about $375MM� Depreciation & amortization about $345MM� Cash tax rate of 10-12% and book tax rate of
32-34% on adjusted pre-tax earnings
Source: Owens Corning management estimates
Other Guidance Items
Appendix A 2017 Corporate Environment and Guidance
3434
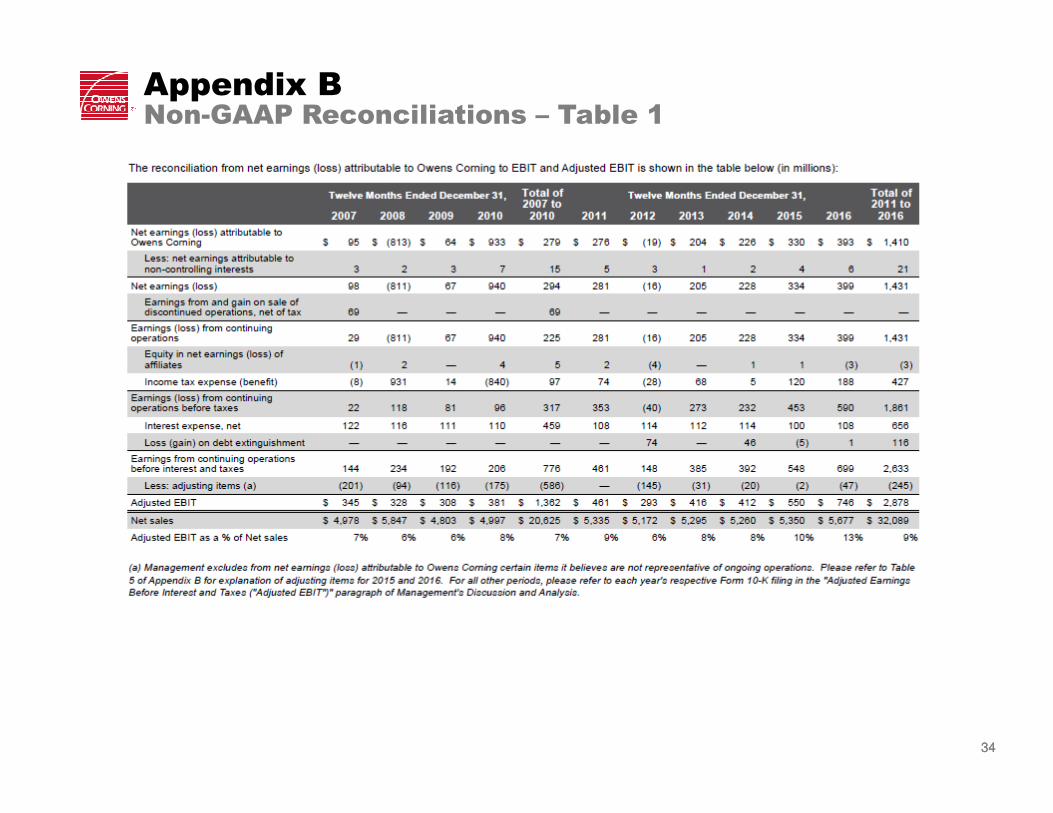
Appendix B Non-GAAP Reconciliations – Table 1
3535
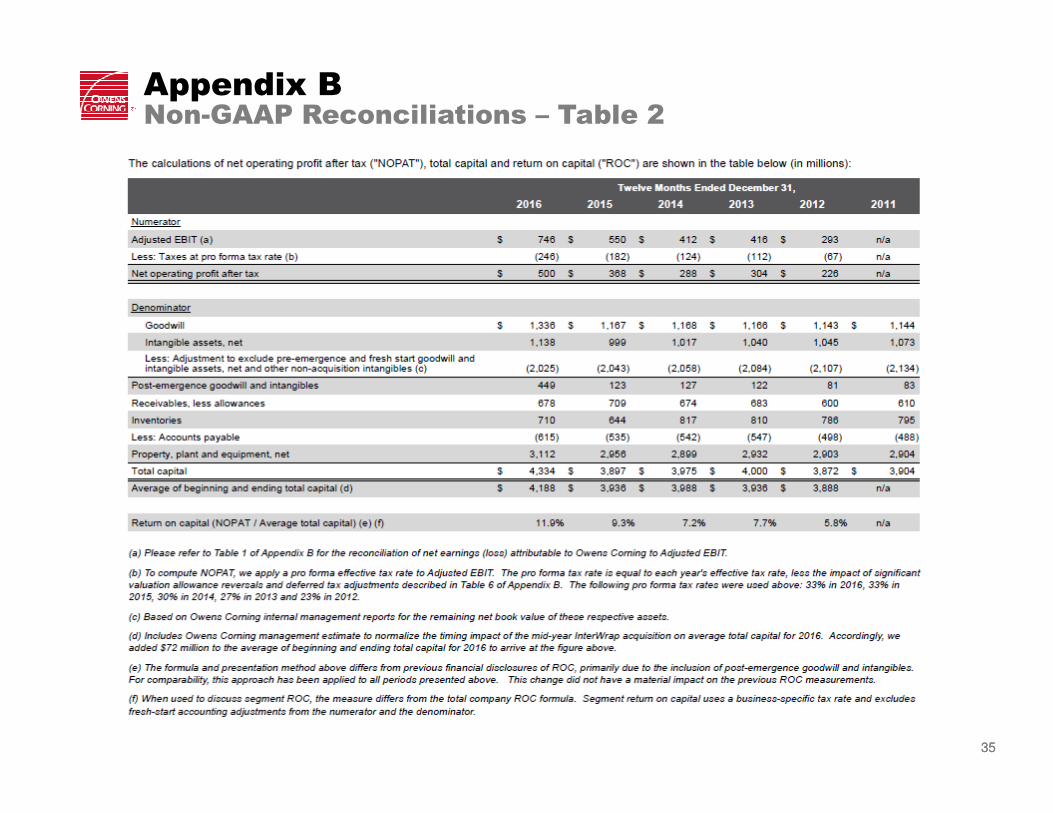
Appendix B Non-GAAP Reconciliations – Table 2
3636
Appendix B Non-GAAP Reconciliations – Table 3
3737
Appendix B Non-GAAP Reconciliations – Table 4
3838
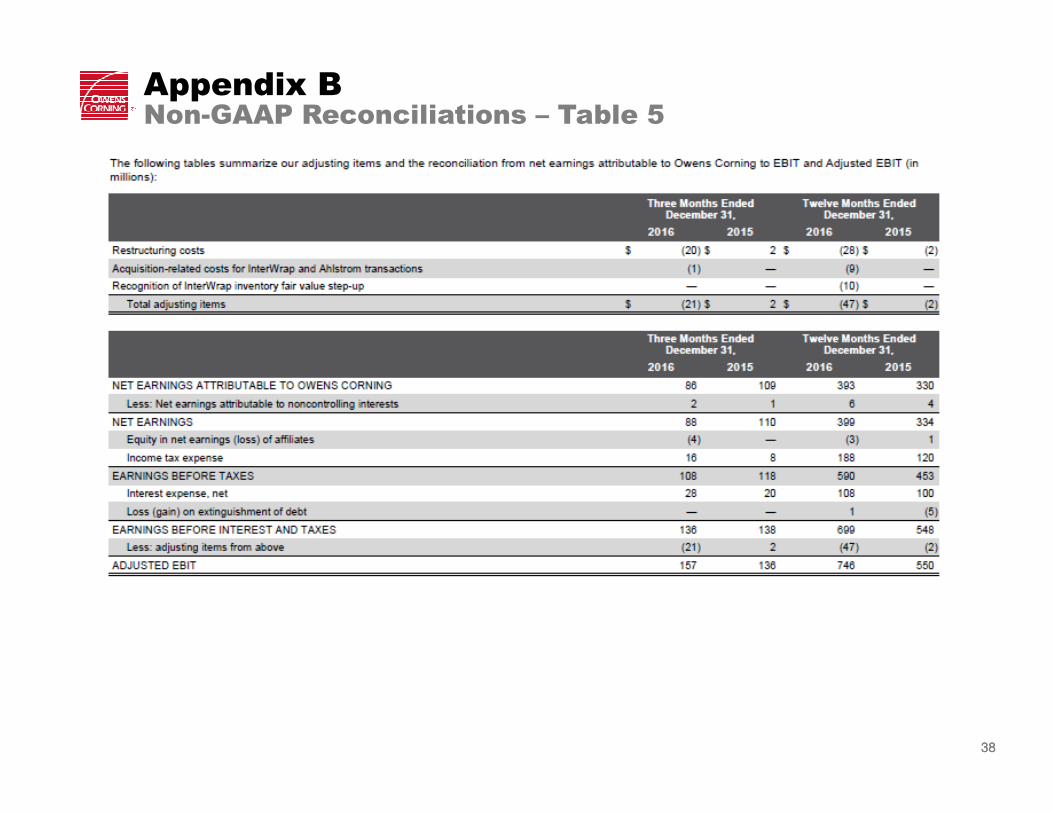
Appendix B Non-GAAP Reconciliations – Table 5
3939
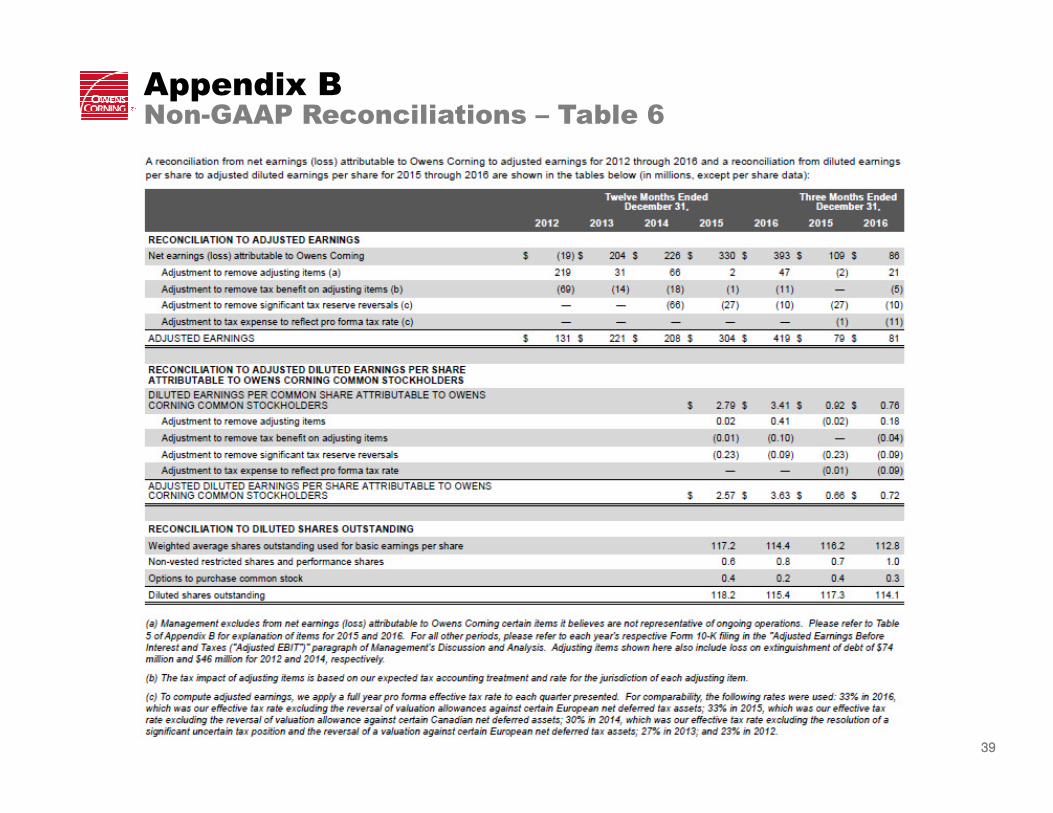
Appendix B Non-GAAP Reconciliations – Table 6