Embed Size (px)
Citation preview
© Copyright 2013, Cardinal Health. All rights reserved. CARDINAL HEALTH, the Cardinal Health LOGO and ESSENTIAL TO CARE are trademarks or registered trademarks of Cardinal Health. All other marks are the property of their respective owners.
August 1, 2013
Q4 FY2013 earnings
investor/analyst call
© Copyright 2013, Cardinal Health. All rights reserved. CARDINAL HEALTH, the Cardinal Health LOGO and ESSENTIAL TO CARE are trademarks or registered trademarks of Cardinal Health. All other marks are the property of their respective owners.
Forward-looking statements and GAAP reconciliation
Cautions Concerning Forward-Looking StatementsThis presentation contains forward-looking statements addressing expectations, prospects, estimates and other matters that are dependent upon future events or developments. These statements may be identified by words such as "expect," "anticipate," "intend," "plan," "believe," "will," "should," "could," "would," "project," "continue," "likely," and similar expressions, and include statements reflecting future results or guidance, statements of outlook and expense accruals. These matters are subject to risks and uncertainties that could cause actual results to differ materially from those projected, anticipated or implied. These risks and uncertainties include competitive pressures in Cardinal Health's various lines of business; the ability to achieve the expected benefits from the AssuraMed acquisition, including the expected accretion in non-GAAP earnings; the timing of generic and branded pharmaceutical introductions and the frequency or rate of pharmaceutical price appreciation or deflation; the non-renewal, early termination or a default under one or more key customer or supplier arrangements or changes to the terms of or level of purchases under those arrangements; uncertainties due to government health care reform including federal health care reform legislation; changes in the distribution patterns or reimbursement rates for health care products and services; and the effects of any investigation or action by any regulatory authority; changes in the cost of commodities such as oil-based resins, cotton, latex and diesel fuel. Cardinal Health is subject to additional risks and uncertainties described in Cardinal Health's Form 10-K, Form 10-Q and Form 8-K reports and exhibits to those reports. This presentation reflects management's views as of August 1, 2013. Except to the extent required by applicable law, Cardinal Health undertakes no obligation to update or revise any forward-looking statement. Cardinal Health provides definitions and reconciling information at the end of this presentation and on its Investors page at www.cardinalhealth.com. An audio replay of the conference call will be available on the Investors page at www.cardinalhealth.com.
2
© Copyright 2013, Cardinal Health. All rights reserved. CARDINAL HEALTH, the Cardinal Health LOGO and ESSENTIAL TO CARE are trademarks or registered trademarks of Cardinal Health. All other marks are the property of their respective owners.
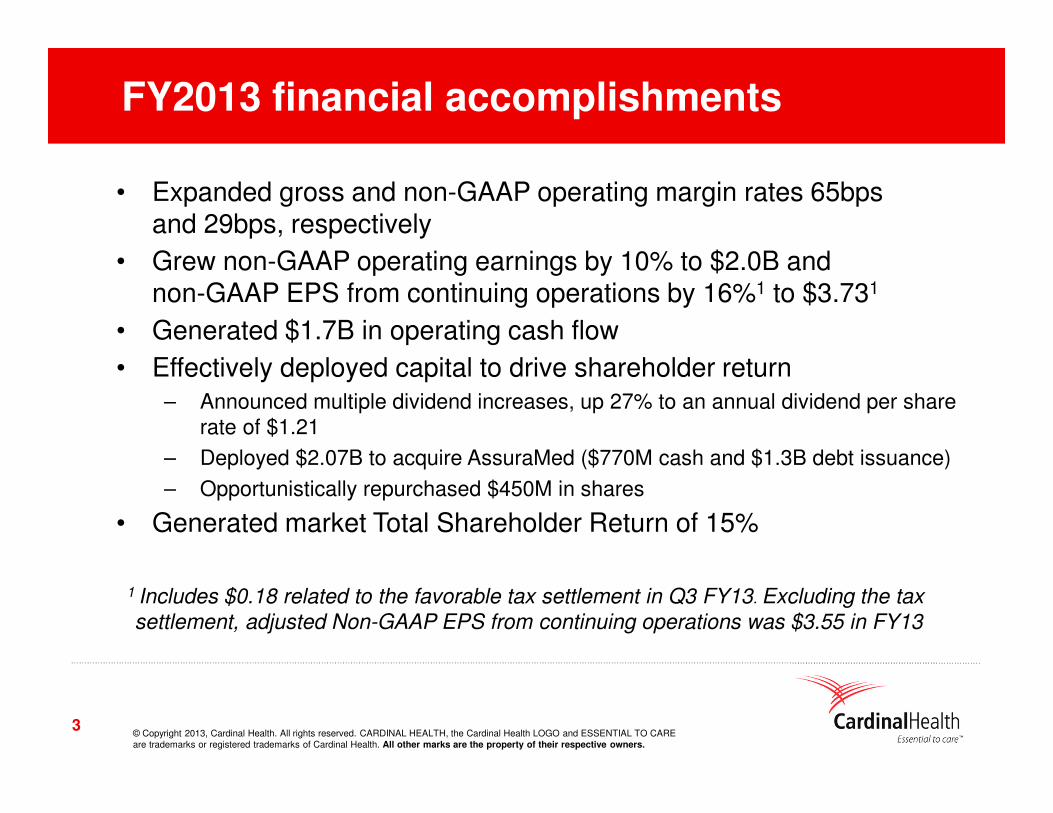
FY2013 financial accomplishments
3
1 Includes $0.18 related to the favorable tax settlement in Q3 FY13. Excluding the tax settlement, adjusted Non-GAAP EPS from continuing operations was $3.55 in FY13
• Expanded gross and non-GAAP operating margin rates 65bps and 29bps, respectively
• Grew non-GAAP operating earnings by 10% to $2.0B and non-GAAP EPS from continuing operations by 16%1 to $3.731
• Generated $1.7B in operating cash flow
• Effectively deployed capital to drive shareholder return– Announced multiple dividend increases, up 27% to an annual dividend per share
rate of $1.21
– Deployed $2.07B to acquire AssuraMed ($770M cash and $1.3B debt issuance)
– Opportunistically repurchased $450M in shares
• Generated market Total Shareholder Return of 15%
© Copyright 2013, Cardinal Health. All rights reserved. CARDINAL HEALTH, the Cardinal Health LOGO and ESSENTIAL TO CARE are trademarks or registered trademarks of Cardinal Health. All other marks are the property of their respective owners.
Q4 and FY2013 results
4
© Copyright 2013, Cardinal Health. All rights reserved. CARDINAL HEALTH, the Cardinal Health LOGO and ESSENTIAL TO CARE are trademarks or registered trademarks of Cardinal Health. All other marks are the property of their respective owners.
5
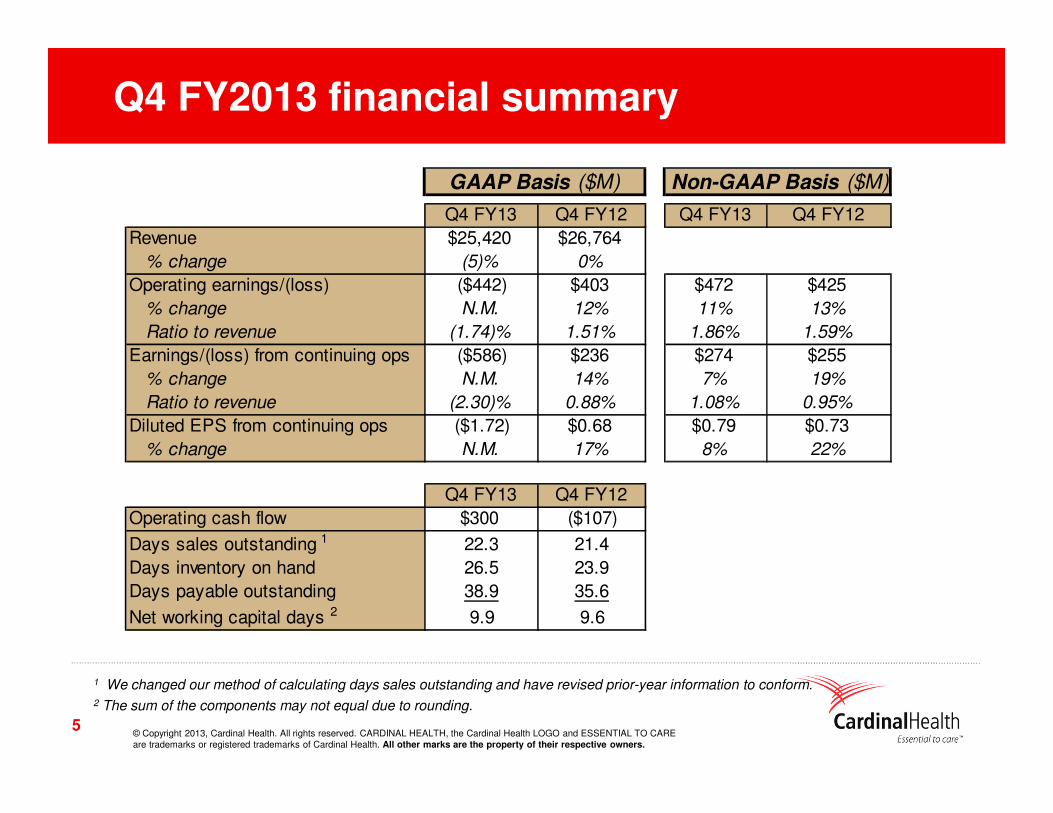
Q4 FY2013 financial summary
Q4 FY13 Q4 FY12 Q4 FY13 Q4 FY12
Revenue $25,420 $26,764
% change (5)% 0%
Operating earnings/(loss) ($442) $403 $472 $425
% change N.M. 12% 11% 13%
Ratio to revenue (1.74)% 1.51% 1.86% 1.59%
Earnings/(loss) from continuing ops ($586) $236 $274 $255
% change N.M. 14% 7% 19%
Ratio to revenue (2.30)% 0.88% 1.08% 0.95%
Diluted EPS from continuing ops ($1.72) $0.68 $0.79 $0.73
% change N.M. 17% 8% 22%
Q4 FY13 Q4 FY12
Operating cash flow $300 ($107)
Days sales outstanding 1 22.3 21.4
Days inventory on hand 26.5 23.9
Days payable outstanding 38.9 35.6
Net working capital days 2 9.9 9.6
Non-GAAP Basis ($M)GAAP Basis ($M)
1 We changed our method of calculating days sales outstanding and have revised prior-year information to conform.2 The sum of the components may not equal due to rounding.
© Copyright 2013, Cardinal Health. All rights reserved. CARDINAL HEALTH, the Cardinal Health LOGO and ESSENTIAL TO CARE are trademarks or registered trademarks of Cardinal Health. All other marks are the property of their respective owners.
6
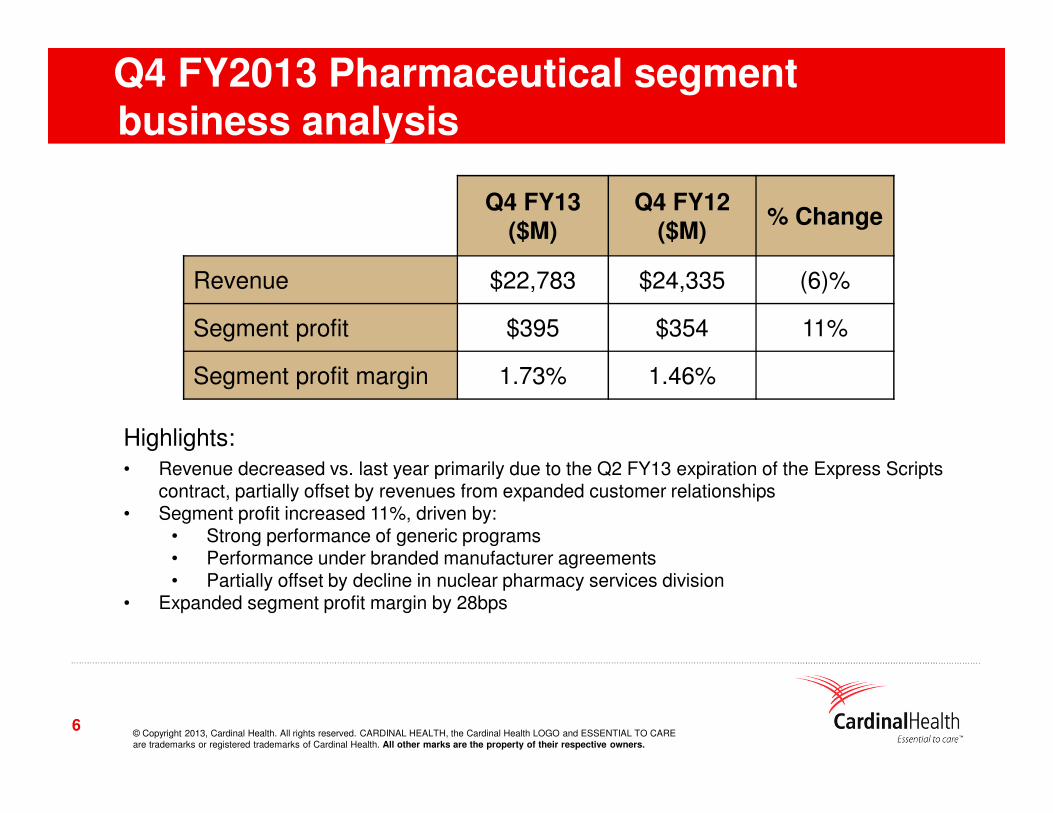
Q4 FY2013 Pharmaceutical segment business analysis
Highlights: • Revenue decreased vs. last year primarily due to the Q2 FY13 expiration of the Express Scripts
contract, partially offset by revenues from expanded customer relationships • Segment profit increased 11%, driven by:
• Strong performance of generic programs• Performance under branded manufacturer agreements• Partially offset by decline in nuclear pharmacy services division
• Expanded segment profit margin by 28bps
Q4 FY13($M)
Q4 FY12($M)
% Change
Revenue $22,783 $24,335 (6)%
Segment profit $395 $354 11%
Segment profit margin 1.73% 1.46%
© Copyright 2013, Cardinal Health. All rights reserved. CARDINAL HEALTH, the Cardinal Health LOGO and ESSENTIAL TO CARE are trademarks or registered trademarks of Cardinal Health. All other marks are the property of their respective owners.
7
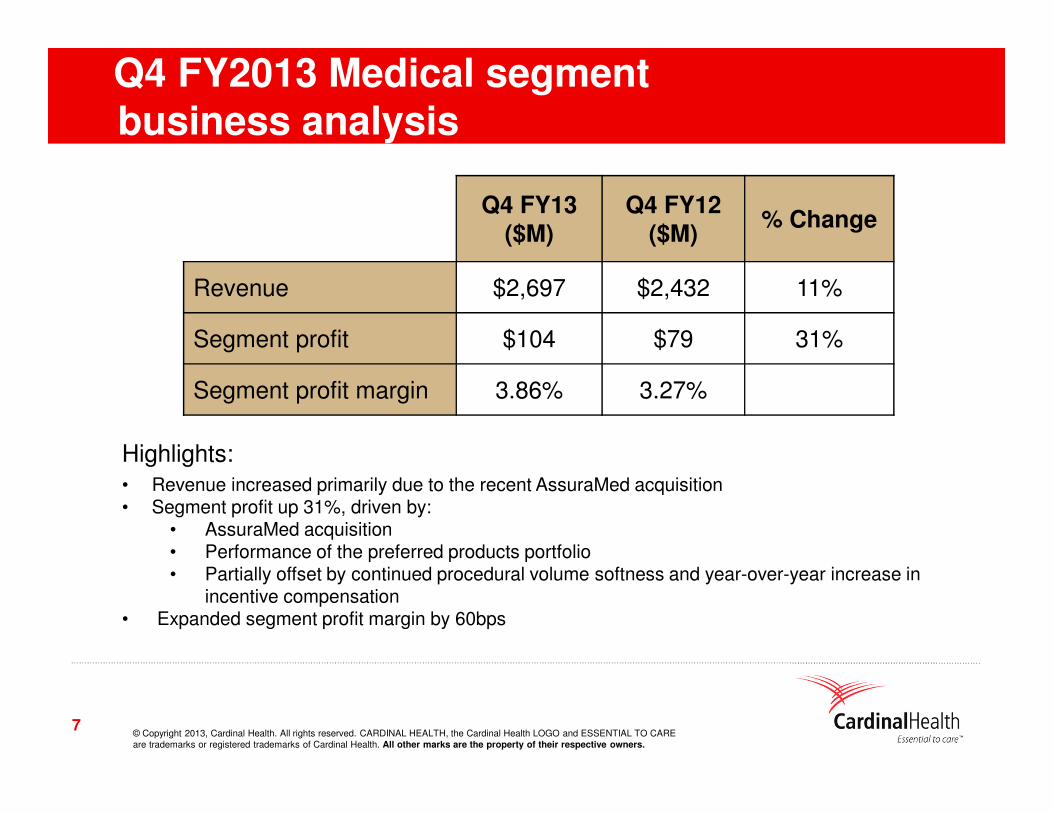
Q4 FY2013 Medical segmentbusiness analysis
Highlights: • Revenue increased primarily due to the recent AssuraMed acquisition• Segment profit up 31%, driven by:
• AssuraMed acquisition• Performance of the preferred products portfolio• Partially offset by continued procedural volume softness and year-over-year increase in
incentive compensation• Expanded segment profit margin by 60bps
Q4 FY13($M)
Q4 FY12($M)
% Change
Revenue $2,697 $2,432 11%
Segment profit $104 $79 31%
Segment profit margin 3.86% 3.27%
© Copyright 2013, Cardinal Health. All rights reserved. CARDINAL HEALTH, the Cardinal Health LOGO and ESSENTIAL TO CARE are trademarks or registered trademarks of Cardinal Health. All other marks are the property of their respective owners.
8
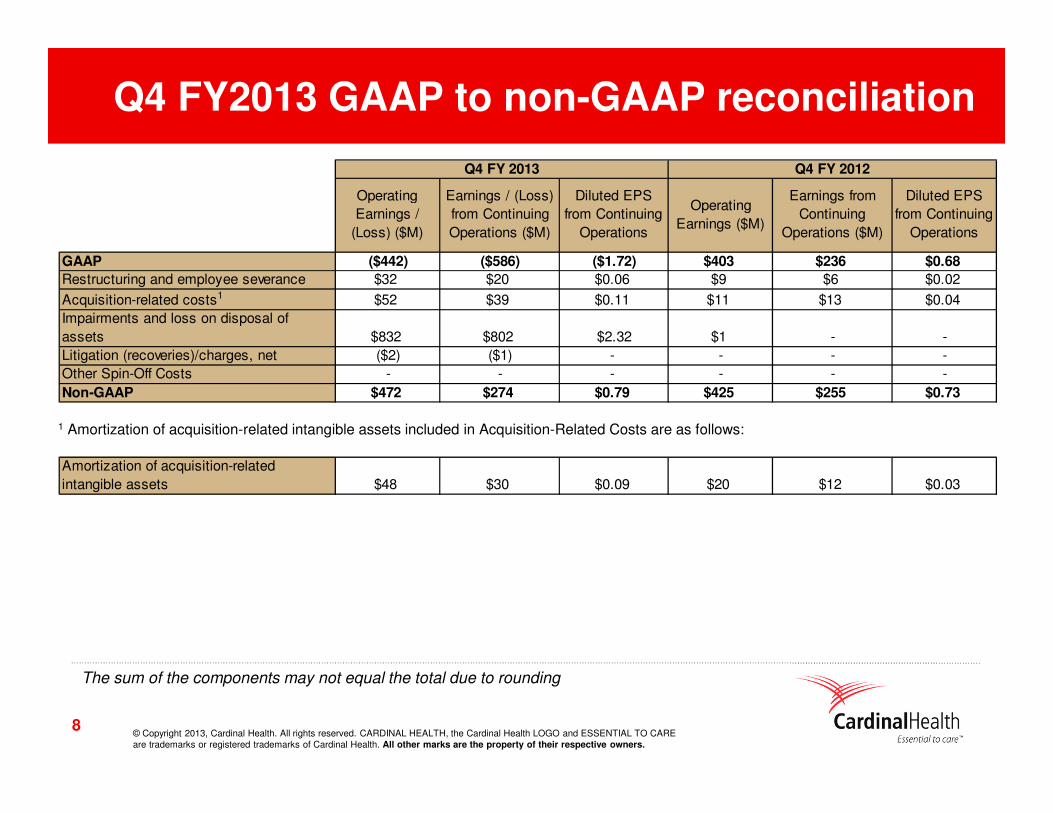
Q4 FY2013 GAAP to non-GAAP reconciliation
Operating
Earnings /
(Loss) ($M)
Earnings / (Loss)
from Continuing
Operations ($M)
Diluted EPS
from Continuing
Operations
Operating
Earnings ($M)
Earnings from
Continuing
Operations ($M)
Diluted EPS
from Continuing
Operations
GAAP ($442) ($586) ($1.72) $403 $236 $0.68
Restructuring and employee severance $32 $20 $0.06 $9 $6 $0.02
Acquisition-related costs1 $52 $39 $0.11 $11 $13 $0.04
Impairments and loss on disposal of
assets $832 $802 $2.32 $1 - -
Litigation (recoveries)/charges, net ($2) ($1) - - - -
Other Spin-Off Costs - - - - - -
Non-GAAP $472 $274 $0.79 $425 $255 $0.73
Amortization of acquisition-related
intangible assets $48 $30 $0.09 $20 $12 $0.03
Q4 FY 2012Q4 FY 2013
The sum of the components may not equal the total due to rounding
1 Amortization of acquisition-related intangible assets included in Acquisition-Related Costs are as follows:
© Copyright 2013, Cardinal Health. All rights reserved. CARDINAL HEALTH, the Cardinal Health LOGO and ESSENTIAL TO CARE are trademarks or registered trademarks of Cardinal Health. All other marks are the property of their respective owners.
9
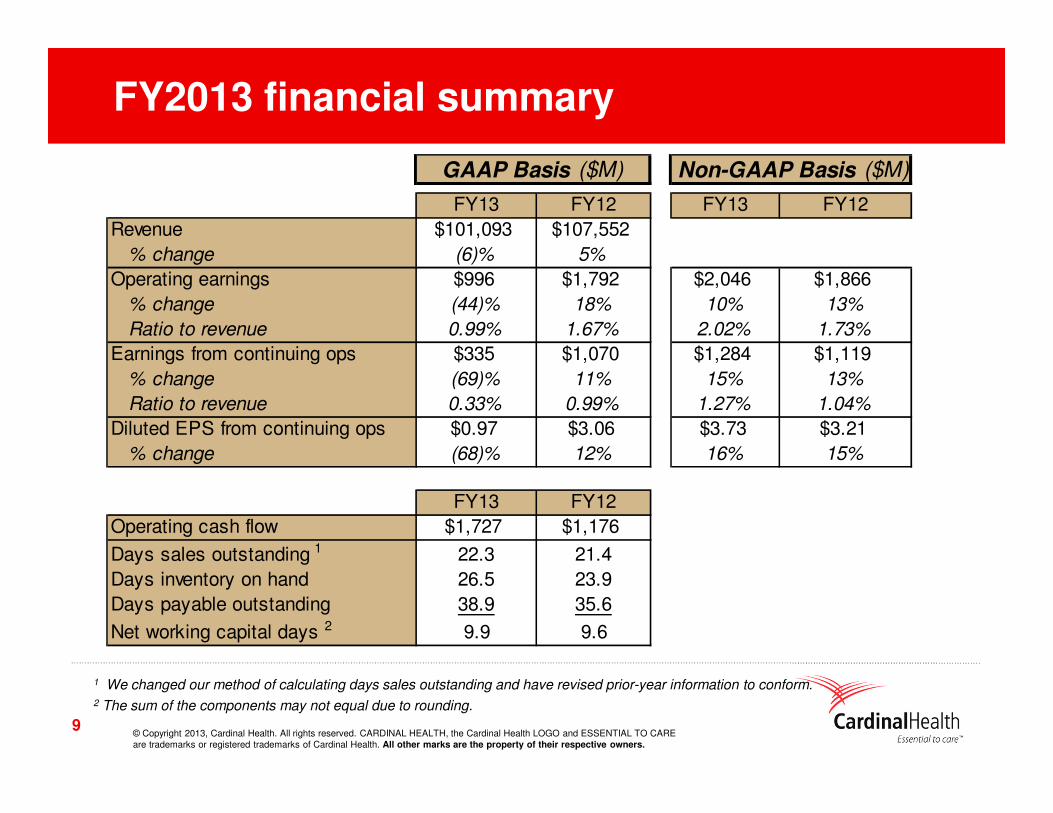
FY2013 financial summary
FY13 FY12 FY13 FY12
Revenue $101,093 $107,552
% change (6)% 5%
Operating earnings $996 $1,792 $2,046 $1,866
% change (44)% 18% 10% 13%
Ratio to revenue 0.99% 1.67% 2.02% 1.73%
Earnings from continuing ops $335 $1,070 $1,284 $1,119
% change (69)% 11% 15% 13%
Ratio to revenue 0.33% 0.99% 1.27% 1.04%
Diluted EPS from continuing ops $0.97 $3.06 $3.73 $3.21
% change (68)% 12% 16% 15%
FY13 FY12
Operating cash flow $1,727 $1,176
Days sales outstanding 1 22.3 21.4
Days inventory on hand 26.5 23.9
Days payable outstanding 38.9 35.6
Net working capital days 2 9.9 9.6
Non-GAAP Basis ($M)GAAP Basis ($M)
1 We changed our method of calculating days sales outstanding and have revised prior-year information to conform.2 The sum of the components may not equal due to rounding.
© Copyright 2013, Cardinal Health. All rights reserved. CARDINAL HEALTH, the Cardinal Health LOGO and ESSENTIAL TO CARE are trademarks or registered trademarks of Cardinal Health. All other marks are the property of their respective owners.
10
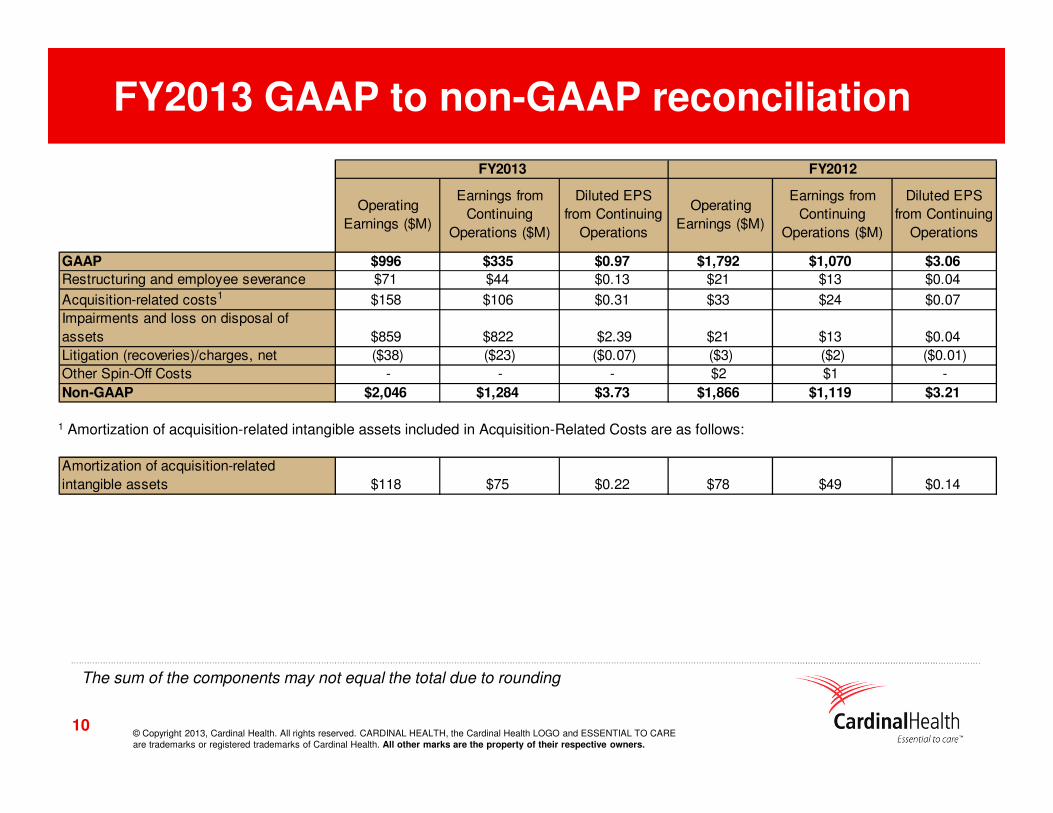
FY2013 GAAP to non-GAAP reconciliation
Operating
Earnings ($M)
Earnings from
Continuing
Operations ($M)
Diluted EPS
from Continuing
Operations
Operating
Earnings ($M)
Earnings from
Continuing
Operations ($M)
Diluted EPS
from Continuing
Operations
GAAP $996 $335 $0.97 $1,792 $1,070 $3.06
Restructuring and employee severance $71 $44 $0.13 $21 $13 $0.04
Acquisition-related costs1 $158 $106 $0.31 $33 $24 $0.07
Impairments and loss on disposal of
assets $859 $822 $2.39 $21 $13 $0.04
Litigation (recoveries)/charges, net ($38) ($23) ($0.07) ($3) ($2) ($0.01)
Other Spin-Off Costs - - - $2 $1 -
Non-GAAP $2,046 $1,284 $3.73 $1,866 $1,119 $3.21
Amortization of acquisition-related
intangible assets $118 $75 $0.22 $78 $49 $0.14
FY2012FY2013
The sum of the components may not equal the total due to rounding
1 Amortization of acquisition-related intangible assets included in Acquisition-Related Costs are as follows:

© Copyright 2013, Cardinal Health. All rights reserved. CARDINAL HEALTH, the Cardinal Health LOGO and ESSENTIAL TO CARE are trademarks or registered trademarks of Cardinal Health. All other marks are the property of their respective owners.
11
FY2014 outlook
© Copyright 2013, Cardinal Health. All rights reserved. CARDINAL HEALTH, the Cardinal Health LOGO and ESSENTIAL TO CARE are trademarks or registered trademarks of Cardinal Health. All other marks are the property of their respective owners.
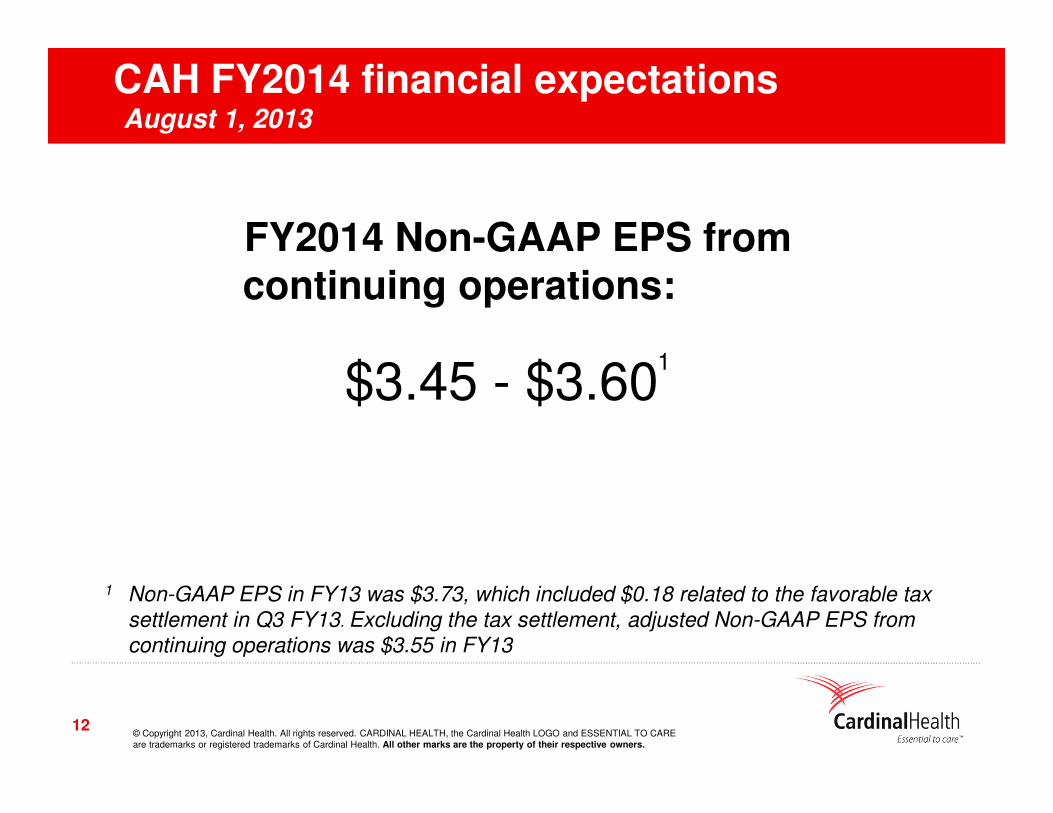
CAH FY2014 financial expectationsAugust 1, 2013
12
1 Non-GAAP EPS in FY13 was $3.73, which included $0.18 related to the favorable tax settlement in Q3 FY13. Excluding the tax settlement, adjusted Non-GAAP EPS from continuing operations was $3.55 in FY13
FY2014 Non-GAAP EPS from continuing operations:
$3.45 - $3.60 1
© Copyright 2013, Cardinal Health. All rights reserved. CARDINAL HEALTH, the Cardinal Health LOGO and ESSENTIAL TO CARE are trademarks or registered trademarks of Cardinal Health. All other marks are the property of their respective owners.
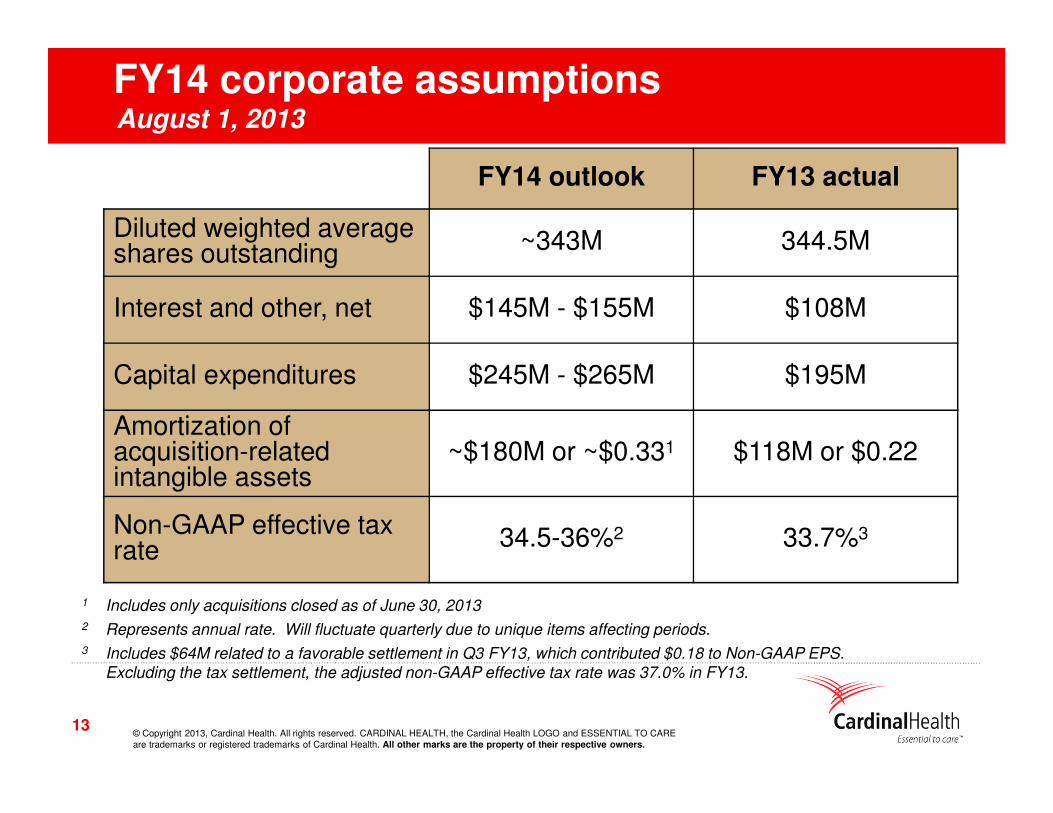
FY14 corporate assumptionsAugust 1, 2013
13
FY14 outlook FY13 actual
Diluted weighted average shares outstanding ~343M 344.5M
Interest and other, net $145M - $155M $108M
Capital expenditures $245M - $265M $195M
Amortization of acquisition-related intangible assets
~$180M or ~$0.331 $118M or $0.22
Non-GAAP effective tax rate 34.5-36%2 33.7%3
1 Includes only acquisitions closed as of June 30, 20132 Represents annual rate. Will fluctuate quarterly due to unique items affecting periods.3 Includes $64M related to a favorable settlement in Q3 FY13, which contributed $0.18 to Non-GAAP EPS.
Excluding the tax settlement, the adjusted non-GAAP effective tax rate was 37.0% in FY13.
© Copyright 2013, Cardinal Health. All rights reserved. CARDINAL HEALTH, the Cardinal Health LOGO and ESSENTIAL TO CARE are trademarks or registered trademarks of Cardinal Health. All other marks are the property of their respective owners.
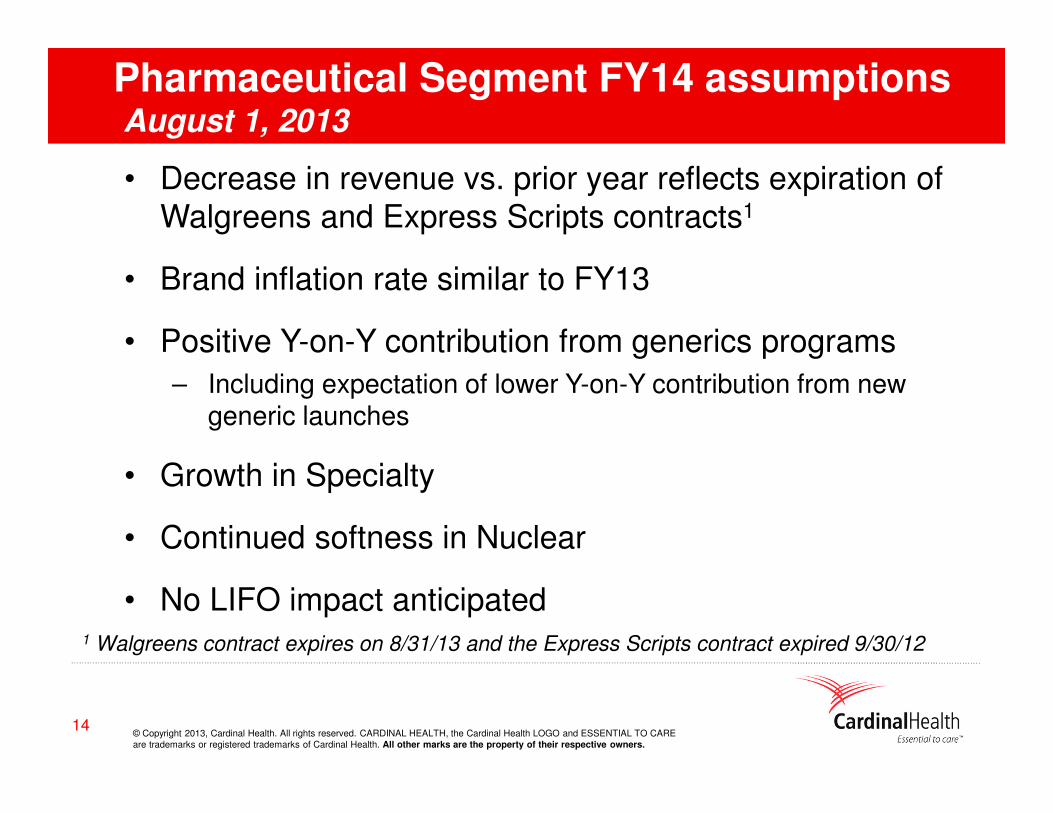
Pharmaceutical Segment FY14 assumptions August 1, 2013
• Decrease in revenue vs. prior year reflects expiration of Walgreens and Express Scripts contracts1
• Brand inflation rate similar to FY13
• Positive Y-on-Y contribution from generics programs
– Including expectation of lower Y-on-Y contribution from new generic launches
• Growth in Specialty
• Continued softness in Nuclear
• No LIFO impact anticipated
14
1 Walgreens contract expires on 8/31/13 and the Express Scripts contract expired 9/30/12
© Copyright 2013, Cardinal Health. All rights reserved. CARDINAL HEALTH, the Cardinal Health LOGO and ESSENTIAL TO CARE are trademarks or registered trademarks of Cardinal Health. All other marks are the property of their respective owners.
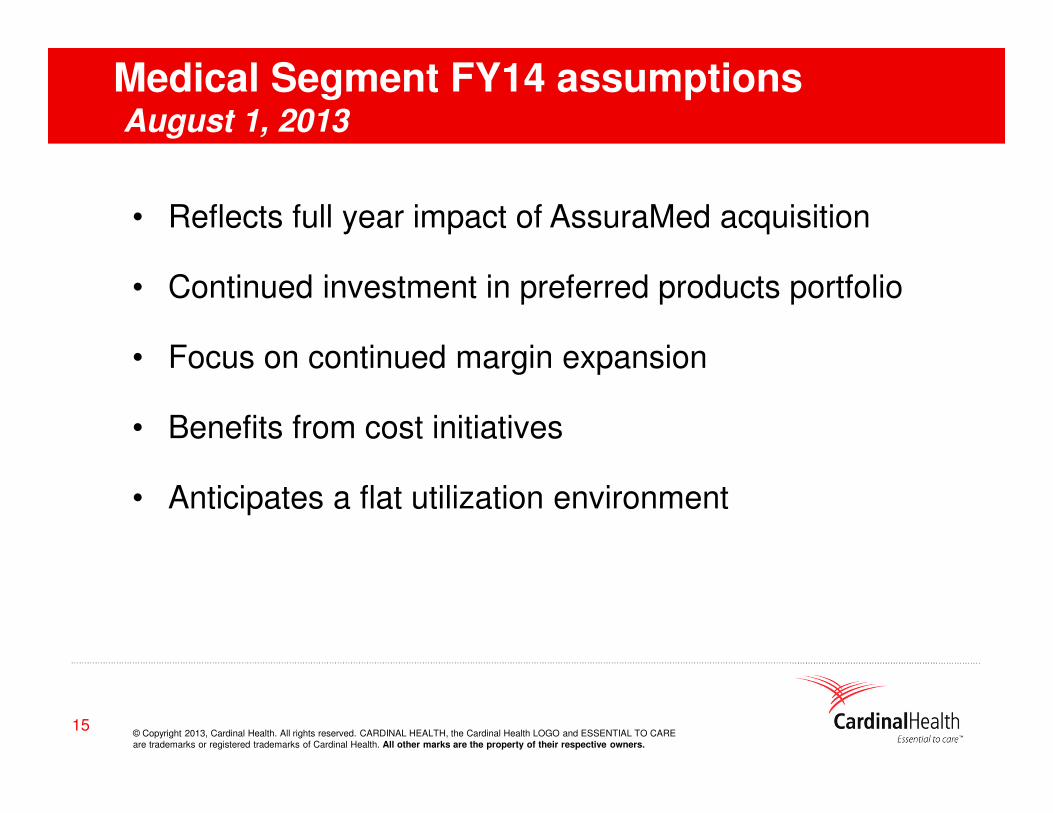
Medical Segment FY14 assumptions August 1, 2013
15
• Reflects full year impact of AssuraMed acquisition
• Continued investment in preferred products portfolio
• Focus on continued margin expansion
• Benefits from cost initiatives
• Anticipates a flat utilization environment
© Copyright 2013, Cardinal Health. All rights reserved. CARDINAL HEALTH, the Cardinal Health LOGO and ESSENTIAL TO CARE are trademarks or registered trademarks of Cardinal Health. All other marks are the property of their respective owners.
16
© Copyright 2013, Cardinal Health. All rights reserved. CARDINAL HEALTH, the Cardinal Health LOGO and ESSENTIAL TO CARE are trademarks or registered trademarks of Cardinal Health. All other marks are the property of their respective owners.
1717
Q4 FY2013 trailing five quartersand GAAP to Non-GAAP reconciliation statements
© Copyright 2013, Cardinal Health. All rights reserved. CARDINAL HEALTH, the Cardinal Health LOGO and ESSENTIAL TO CARE are trademarks or registered trademarks of Cardinal Health. All other marks are the property of their respective owners.
18
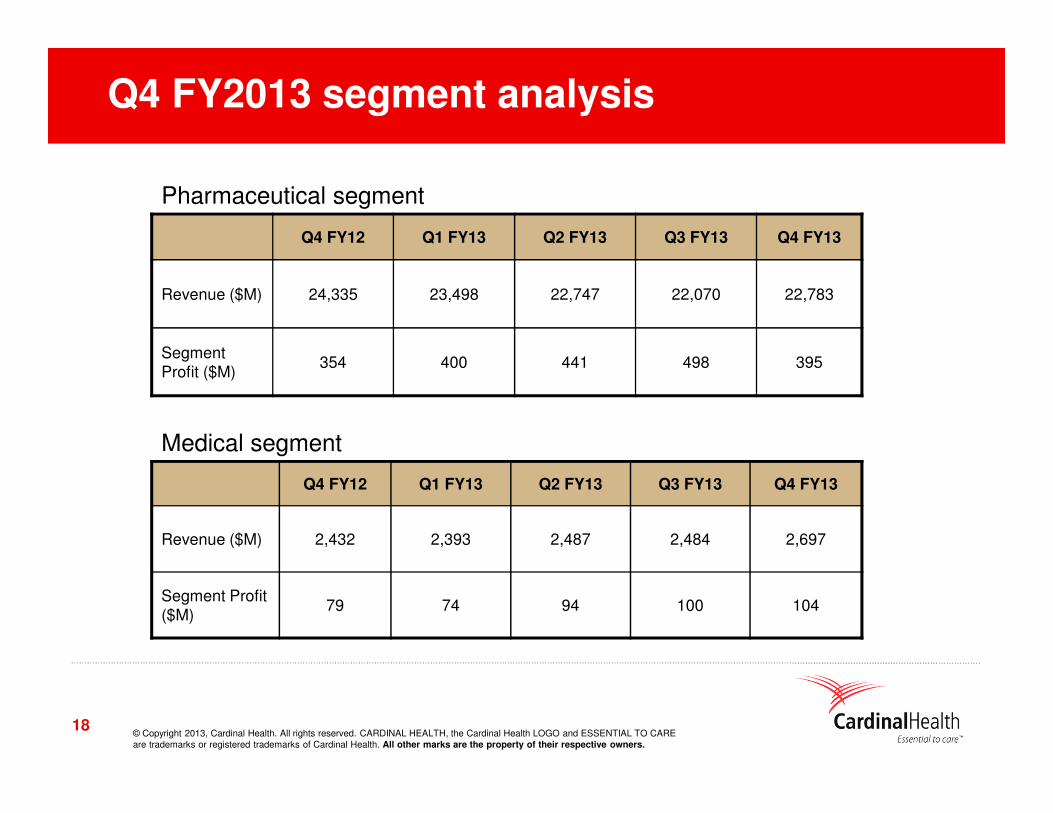
Q4 FY12 Q1 FY13 Q2 FY13 Q3 FY13 Q4 FY13
Revenue ($M) 24,335 23,498 22,747 22,070 22,783
Segment Profit ($M)
354 400 441 498 395
Q4 FY12 Q1 FY13 Q2 FY13 Q3 FY13 Q4 FY13
Revenue ($M) 2,432 2,393 2,487 2,484 2,697
Segment Profit ($M)
79 74 94 100 104
Pharmaceutical segment
Medical segment
Q4 FY2013 segment analysis
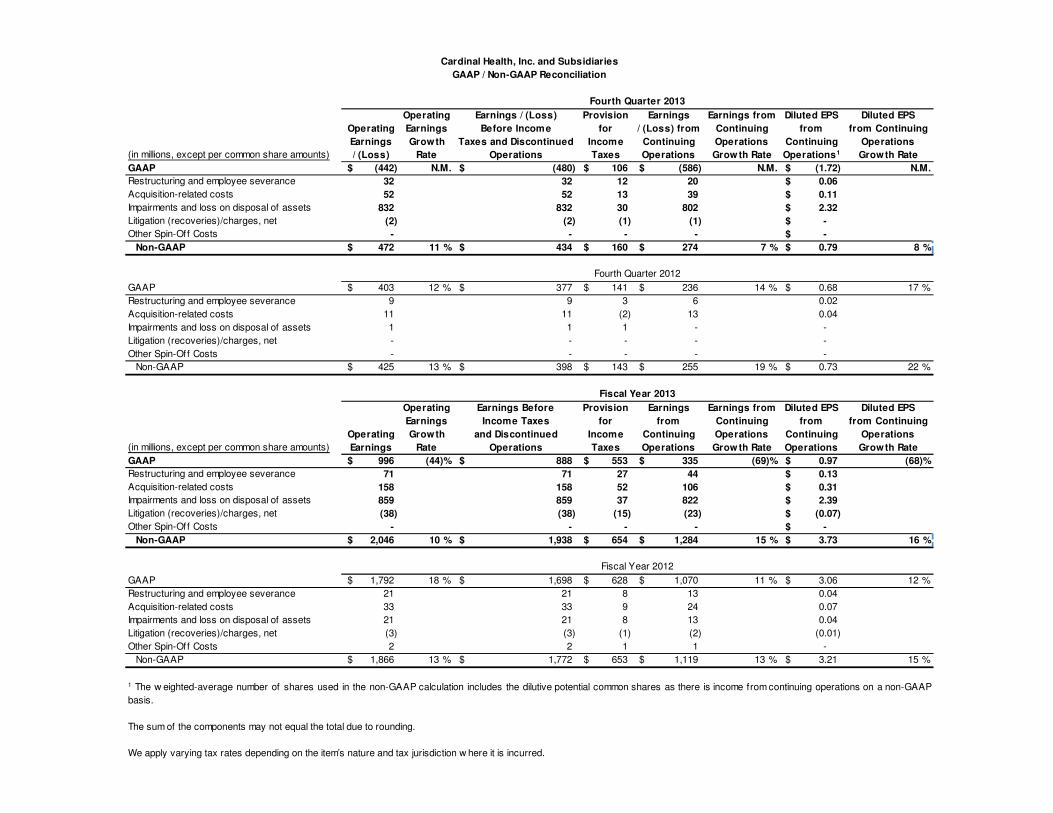
Operating Earnings / (Loss) Provision Earnings Earnings from Diluted EPS Diluted EPS
Operating Earnings Before Income for / (Loss) from Continuing from from Continuing
Earnings Growth Taxes and Discontinued Income Continuing Operations Continuing Operations
(in millions, except per common share amounts) / (Loss) Rate Operations Taxes Operations Grow th Rate Operations1 Growth Rate
GAAP (442)$ N.M. (480)$ 106$ (586)$ N.M. (1.72)$ N.M.
Restructuring and employee severance 32 32 12 20 0.06$
Acquisition-related costs 52 52 13 39 0.11$
Impairments and loss on disposal of assets 832 832 30 802 2.32$
Litigation (recoveries)/charges, net (2) (2) (1) (1) -$
Other Spin-Off Costs - - - - -$
Non-GAAP 472$ 11 % 434$ 160$ 274$ 7 % 0.79$ 8 %
GAAP 403$ 12 % 377$ 141$ 236$ 14 % 0.68$ 17 %
Restructuring and employee severance 9 9 3 6 0.02
Acquisition-related costs 11 11 (2) 13 0.04
Impairments and loss on disposal of assets 1 1 1 - -
Litigation (recoveries)/charges, net - - - - -
Other Spin-Off Costs - - - - -
Non-GAAP 425$ 13 % 398$ 143$ 255$ 19 % 0.73$ 22 %
Operating Earnings Before Provision Earnings Earnings from Diluted EPS Diluted EPS
Earnings Income Taxes for from Continuing from from Continuing
Operating Growth and Discontinued Income Continuing Operations Continuing Operations
(in millions, except per common share amounts) Earnings Rate Operations Taxes Operations Grow th Rate Operations Growth Rate
GAAP 996$ (44)% 888$ 553$ 335$ (69)% 0.97$ (68)%
Restructuring and employee severance 71 71 27 44 0.13$
Acquisition-related costs 158 158 52 106 0.31$
Impairments and loss on disposal of assets 859 859 37 822 2.39$
Litigation (recoveries)/charges, net (38) (38) (15) (23) (0.07)$
Other Spin-Off Costs - - - - -$
Non-GAAP 2,046$ 10 % 1,938$ 654$ 1,284$ 15 % 3.73$ 16 %
GAAP 1,792$ 18 % 1,698$ 628$ 1,070$ 11 % 3.06$ 12 %
Restructuring and employee severance 21 21 8 13 0.04
Acquisition-related costs 33 33 9 24 0.07
Impairments and loss on disposal of assets 21 21 8 13 0.04
Litigation (recoveries)/charges, net (3) (3) (1) (2) (0.01)
Other Spin-Off Costs 2 2 1 1 -
Non-GAAP 1,866$ 13 % 1,772$ 653$ 1,119$ 13 % 3.21$ 15 %
Cardinal Health, Inc. and Subsidiaries
GAAP / Non-GAAP Reconciliation
Fourth Quarter 2013
Fourth Quarter 2012
The sum of the components may not equal the total due to rounding.
We apply varying tax rates depending on the item’s nature and tax jurisdiction w here it is incurred.
1 The w eighted-average number of shares used in the non-GAAP calculation includes the dilutive potential common shares as there is income from continuing operations on a non-GAAP
basis.
Fiscal Year 2013
Fiscal Year 2012
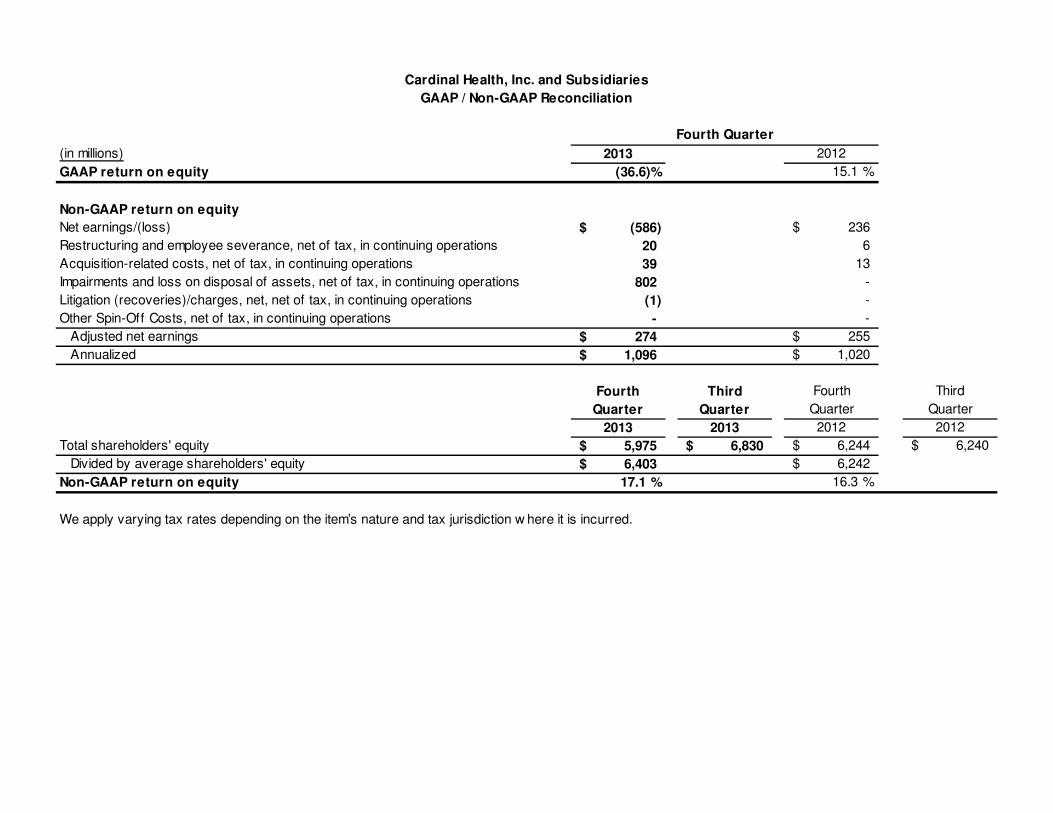
(in millions) 2013 2012
GAAP return on equity (36.6)% 15.1 %
Non-GAAP return on equity
Net earnings/(loss) (586)$ 236$
Restructuring and employee severance, net of tax, in continuing operations 20 6
Acquisition-related costs, net of tax, in continuing operations 39 13
Impairments and loss on disposal of assets, net of tax, in continuing operations 802 -
Litigation (recoveries)/charges, net, net of tax, in continuing operations (1) -
Other Spin-Off Costs, net of tax, in continuing operations - -
Adjusted net earnings 274$ 255$
Annualized 1,096$ 1,020$
Fourth Third Fourth Third
Quarter Quarter Quarter Quarter
2013 2013 2012 2012
Total shareholders' equity 5,975$ 6,830$ 6,244$ 6,240$
Divided by average shareholders' equity 6,403$ 6,242$
Non-GAAP return on equity 17.1 % 16.3 %
We apply varying tax rates depending on the item’s nature and tax jurisdiction w here it is incurred.
Cardinal Health, Inc. and Subsidiaries
GAAP / Non-GAAP Reconciliation
Fourth Quarter
(in millions) 2013 2012
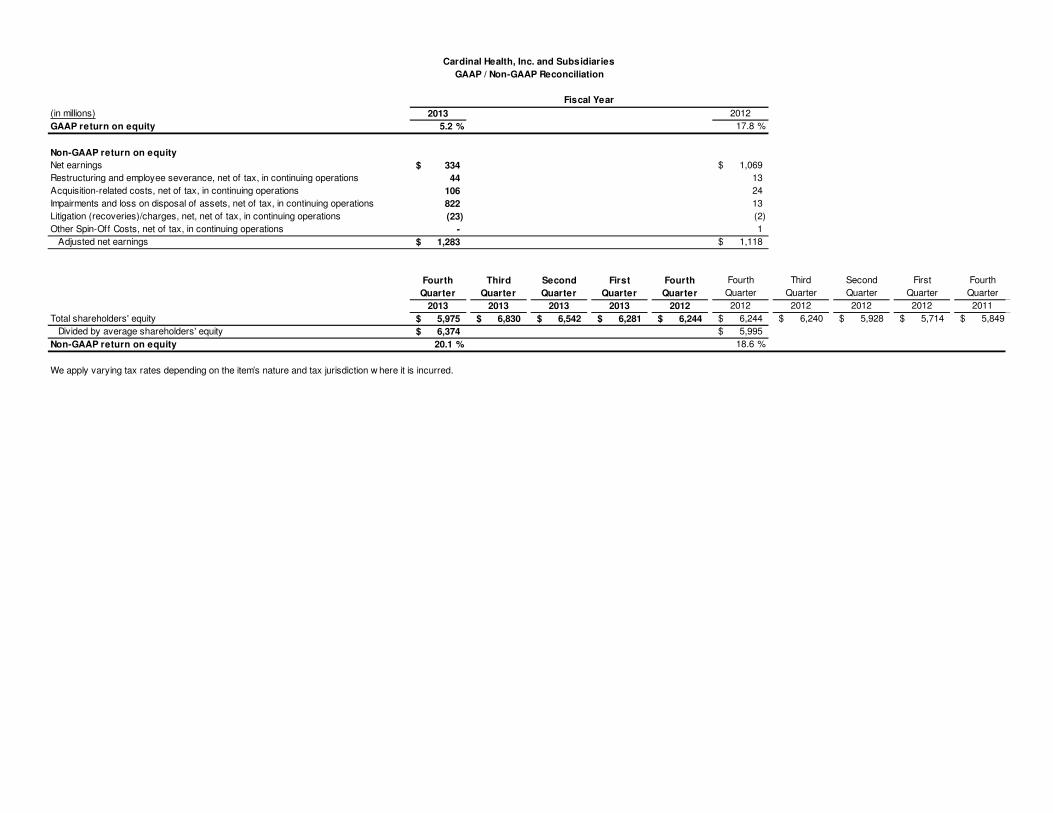
GAAP return on equity 5.2 % 17.8 %
Non-GAAP return on equity
Net earnings 334$ 1,069$
Restructuring and employee severance, net of tax, in continuing operations 44 13
Acquisition-related costs, net of tax, in continuing operations 106 24
Impairments and loss on disposal of assets, net of tax, in continuing operations 822 13
Litigation (recoveries)/charges, net, net of tax, in continuing operations (23) (2)
Other Spin-Off Costs, net of tax, in continuing operations - 1
Adjusted net earnings 1,283$ 1,118$
Fourth Third Second First Fourth Fourth Third Second First Fourth
Quarter Quarter Quarter Quarter Quarter Quarter Quarter Quarter Quarter Quarter
2013 2013 2013 2013 2012 2012 2012 2012 2012 2011
Total shareholders' equity 5,975$ 6,830$ 6,542$ 6,281$ 6,244$ 6,244$ 6,240$ 5,928$ 5,714$ 5,849$
Divided by average shareholders' equity 6,374$ 5,995$
Non-GAAP return on equity 20.1 % 18.6 %
We apply varying tax rates depending on the item’s nature and tax jurisdiction w here it is incurred.
Cardinal Health, Inc. and Subsidiaries
GAAP / Non-GAAP Reconciliation
Fiscal Year
(in millions) 2013 2012 2013 2012
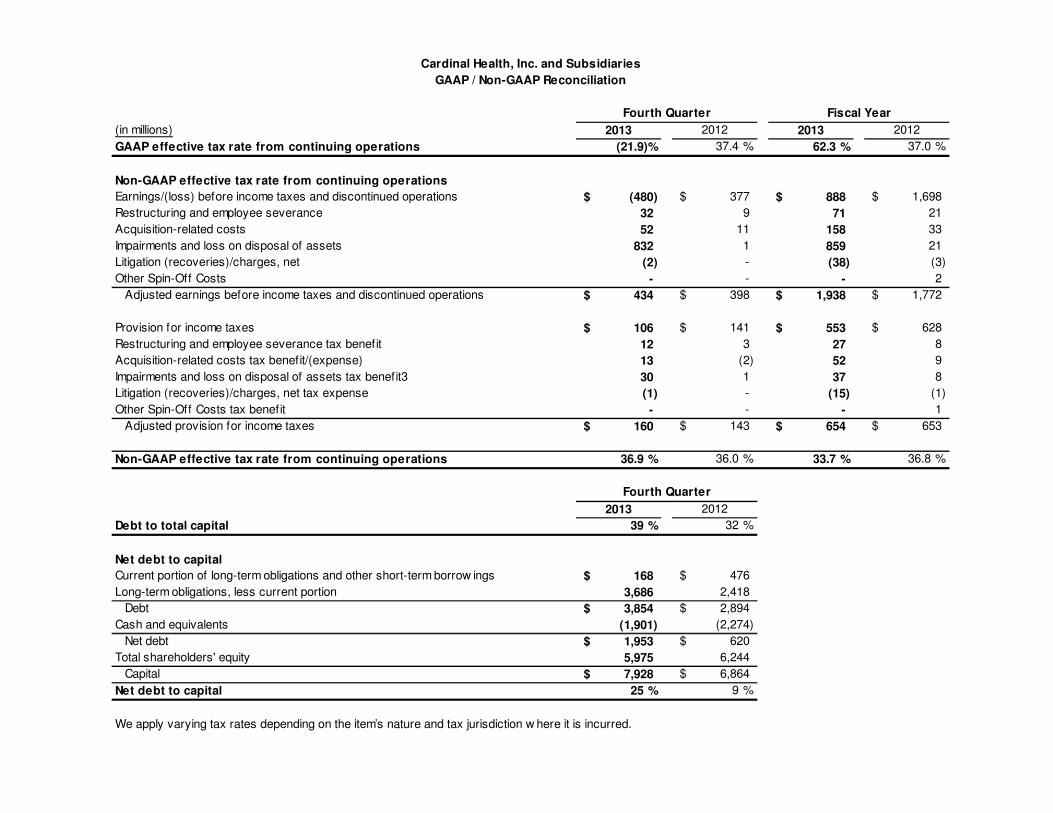
GAAP effective tax rate from continuing operations (21.9)% 37.4 % 62.3 % 37.0 %
Non-GAAP effective tax rate from continuing operations
Earnings/(loss) before income taxes and discontinued operations (480)$ 377$ 888$ 1,698$
Restructuring and employee severance 32 9 71 21
Acquisition-related costs 52 11 158 33
Impairments and loss on disposal of assets 832 1 859 21
Litigation (recoveries)/charges, net (2) - (38) (3)
Other Spin-Off Costs - - - 2
Adjusted earnings before income taxes and discontinued operations 434$ 398$ 1,938$ 1,772$
Provision for income taxes 106$ 141$ 553$ 628$
Restructuring and employee severance tax benefit 12 3 27 8
Acquisition-related costs tax benefit/(expense) 13 (2) 52 9
Impairments and loss on disposal of assets tax benefit3 30 1 37 8
Litigation (recoveries)/charges, net tax expense (1) - (15) (1)
Other Spin-Off Costs tax benefit - - - 1
Adjusted provision for income taxes 160$ 143$ 654$ 653$
Non-GAAP effective tax rate from continuing operations 36.9 % 36.0 % 33.7 % 36.8 %
2013 2012
Debt to total capital 39 % 32 %
Net debt to capital
Current portion of long-term obligations and other short-term borrow ings 168$ 476$
Long-term obligations, less current portion 3,686 2,418
Debt 3,854$ 2,894$
Cash and equivalents (1,901) (2,274)
Net debt 1,953$ 620$
Total shareholders' equity 5,975 6,244
Capital 7,928$ 6,864$
Net debt to capital 25 % 9 %
Fourth Quarter
We apply varying tax rates depending on the item’s nature and tax jurisdiction w here it is incurred.
Cardinal Health, Inc. and Subsidiaries
GAAP / Non-GAAP Reconciliation
Fourth Quarter Fiscal Year
(in millions) 2013 2012 2013 2012
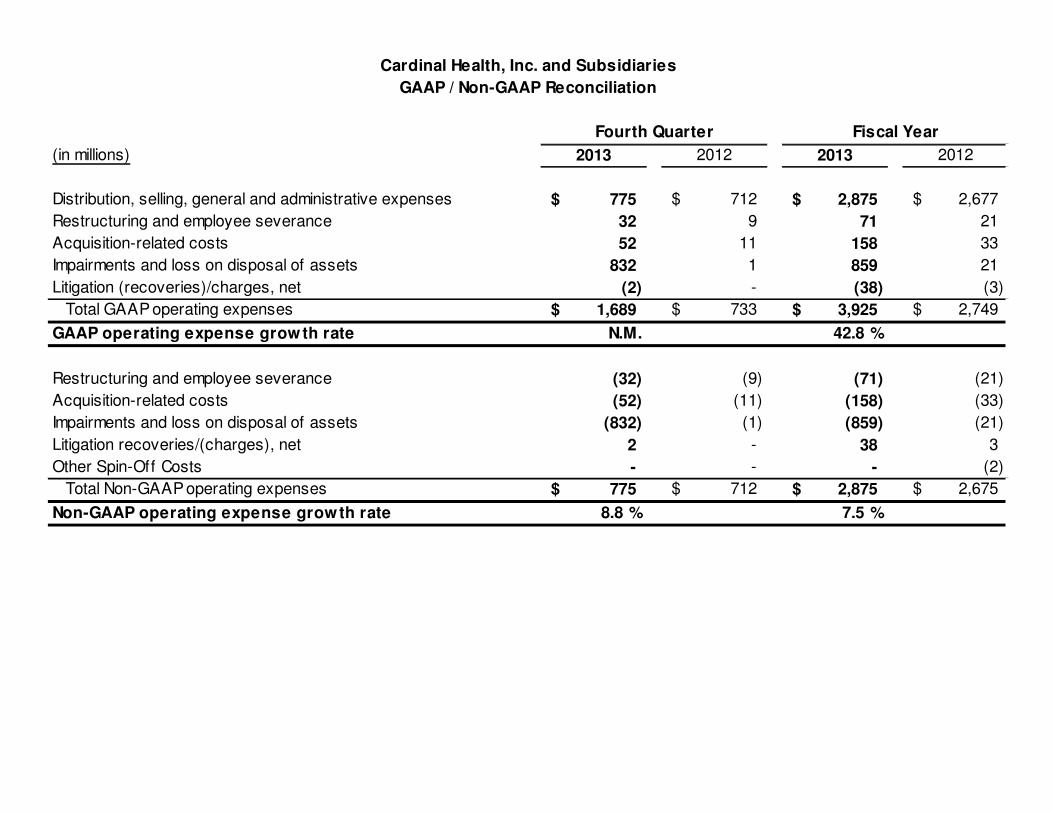
Distribution, selling, general and administrative expenses 775$ 712$ 2,875$ 2,677$
Restructuring and employee severance 32 9 71 21
Acquisition-related costs 52 11 158 33
Impairments and loss on disposal of assets 832 1 859 21
Litigation (recoveries)/charges, net (2) - (38) (3)
Total GAAP operating expenses 1,689$ 733$ 3,925$ 2,749$
GAAP operating expense grow th rate N.M. 42.8 %
Restructuring and employee severance (32) (9) (71) (21)
Acquisition-related costs (52) (11) (158) (33)
Impairments and loss on disposal of assets (832) (1) (859) (21)
Litigation recoveries/(charges), net 2 - 38 3
Other Spin-Off Costs - - - (2)
Total Non-GAAP operating expenses 775$ 712$ 2,875$ 2,675$
Non-GAAP operating expense growth rate 8.8 % 7.5 %
Cardinal Health, Inc. and Subsidiaries
GAAP / Non-GAAP Reconciliation
Fourth Quarter Fiscal Year
(in millions) 2013 2012 2013 2012
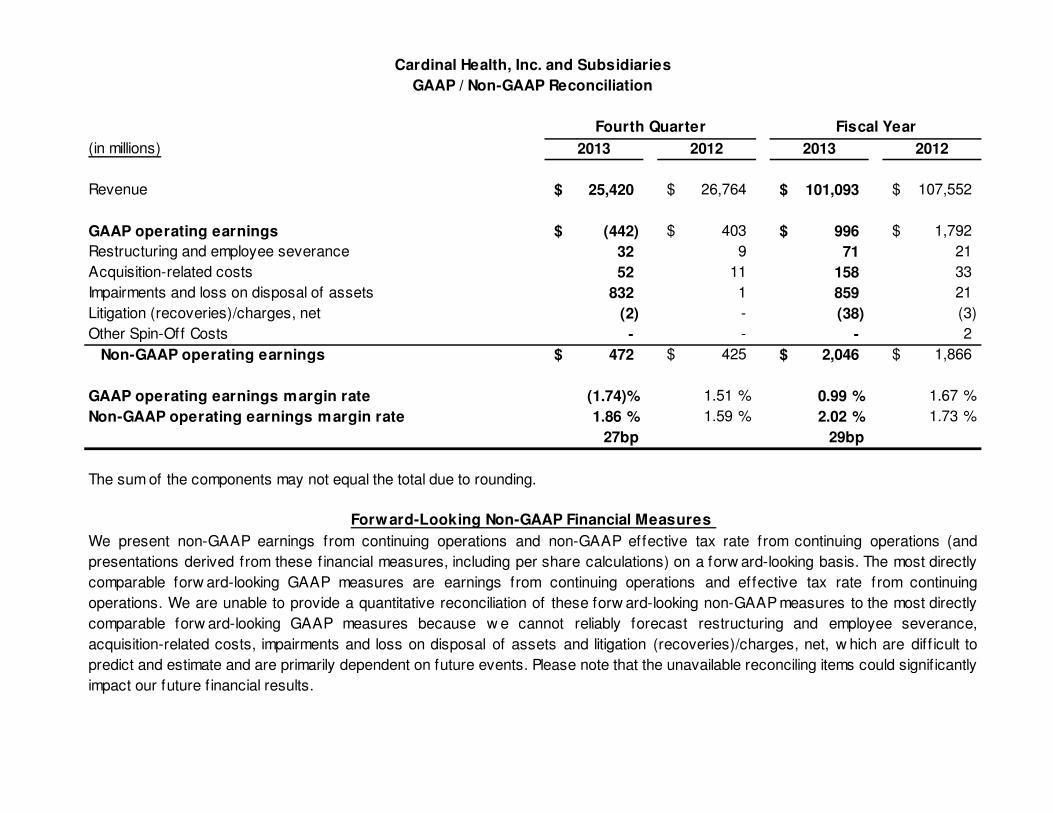
Revenue 25,420$ 26,764$ 101,093$ 107,552$
GAAP operating earnings (442)$ 403$ 996$ 1,792$
Restructuring and employee severance 32 9 71 21
Acquisition-related costs 52 11 158 33
Impairments and loss on disposal of assets 832 1 859 21
Litigation (recoveries)/charges, net (2) - (38) (3)
Other Spin-Off Costs - - - 2
Non-GAAP operating earnings 472$ 425$ 2,046$ 1,866$
GAAP operating earnings margin rate (1.74)% 1.51 % 0.99 % 1.67 %
Non-GAAP operating earnings margin rate 1.86 % 1.59 % 2.02 % 1.73 %
27bp 29bp
We present non-GAAP earnings from continuing operations and non-GAAP effective tax rate from continuing operations (and
presentations derived from these financial measures, including per share calculations) on a forw ard-looking basis. The most directly
comparable forw ard-looking GAAP measures are earnings from continuing operations and effective tax rate from continuing
operations. We are unable to provide a quantitative reconciliation of these forw ard-looking non-GAAP measures to the most directly
comparable forw ard-looking GAAP measures because w e cannot reliably forecast restructuring and employee severance,
acquisition-related costs, impairments and loss on disposal of assets and litigation (recoveries)/charges, net, w hich are diff icult to
predict and estimate and are primarily dependent on future events. Please note that the unavailable reconciling items could significantly
impact our future financial results.
Cardinal Health, Inc. and Subsidiaries
GAAP / Non-GAAP Reconciliation
Fourth Quarter Fiscal Year
The sum of the components may not equal the total due to rounding.
Forward-Looking Non-GAAP Financial Measures
(in millions, except per common share amounts) 2013 2012 2013 2012
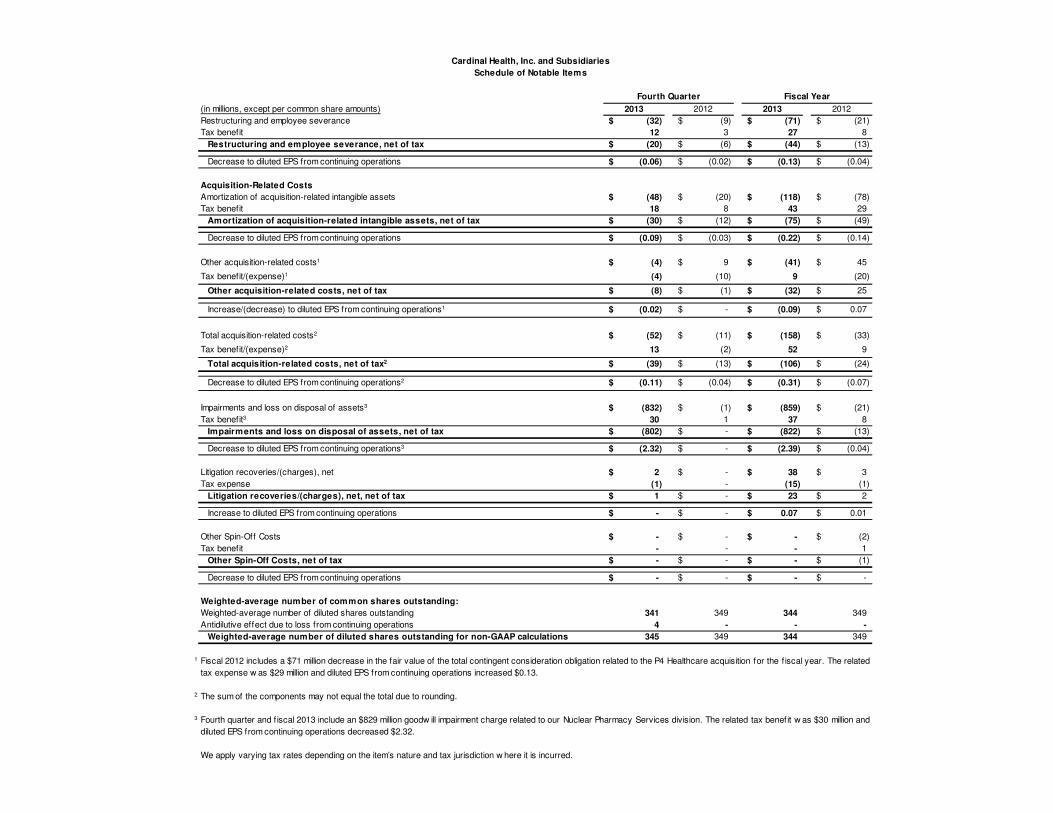
Restructuring and employee severance (32)$ (9)$ (71)$ (21)$
Tax benefit 12 3 27 8
Restructuring and employee severance, net of tax (20)$ (6)$ (44)$ (13)$
Decrease to diluted EPS from continuing operations (0.06)$ (0.02)$ (0.13)$ (0.04)$
Acquisition-Related Costs
Amortization of acquisition-related intangible assets (48)$ (20)$ (118)$ (78)$
Tax benefit 18 8 43 29
Amortization of acquisition-related intangible assets, net of tax (30)$ (12)$ (75)$ (49)$
Decrease to diluted EPS from continuing operations (0.09)$ (0.03)$ (0.22)$ (0.14)$
Other acquisition-related costs1 (4)$ 9$ (41)$ 45$
Tax benefit/(expense)1 (4) (10) 9 (20)
Other acquisition-related costs, net of tax (8)$ (1)$ (32)$ 25$
Increase/(decrease) to diluted EPS from continuing operations1 (0.02)$ -$ (0.09)$ 0.07$
Total acquisition-related costs2 (52)$ (11)$ (158)$ (33)$
Tax benefit/(expense)2 13 (2) 52 9
Total acquisition-related costs, net of tax2 (39)$ (13)$ (106)$ (24)$
Decrease to diluted EPS from continuing operations2 (0.11)$ (0.04)$ (0.31)$ (0.07)$
Impairments and loss on disposal of assets3 (832)$ (1)$ (859)$ (21)$
Tax benefit3 30 1 37 8
Impairments and loss on disposal of assets, net of tax (802)$ -$ (822)$ (13)$
Decrease to diluted EPS from continuing operations3 (2.32)$ -$ (2.39)$ (0.04)$
Litigation recoveries/(charges), net 2$ -$ 38$ 3$
Tax expense (1) - (15) (1)
Litigation recoveries/(charges), net, net of tax 1$ -$ 23$ 2$
Increase to diluted EPS from continuing operations -$ -$ 0.07$ 0.01$
Other Spin-Off Costs -$ -$ -$ (2)$
Tax benefit - - - 1
Other Spin-Off Costs, net of tax -$ -$ -$ (1)$
Decrease to diluted EPS from continuing operations -$ -$ -$ -$
Weighted-average number of common shares outstanding:
Weighted-average number of diluted shares outstanding 341 349 344 349
Antidilutive effect due to loss from continuing operations 4 - - -
Weighted-average number of diluted shares outstanding for non-GAAP calculations 345 349 344 349
1
2
3
Cardinal Health, Inc. and Subsidiaries
Schedule of Notable Items
Fourth Quarter Fiscal Year
We apply varying tax rates depending on the item’s nature and tax jurisdiction w here it is incurred.
Fiscal 2012 includes a $71 million decrease in the fair value of the total contingent consideration obligation related to the P4 Healthcare acquisition for the fiscal year. The related
tax expense w as $29 million and diluted EPS from continuing operations increased $0.13.
The sum of the components may not equal the total due to rounding.
Fourth quarter and fiscal 2013 include an $829 million goodw ill impairment charge related to our Nuclear Pharmacy Services division. The related tax benefit w as $30 million and
diluted EPS from continuing operations decreased $2.32.
2013 2012 2013 2012
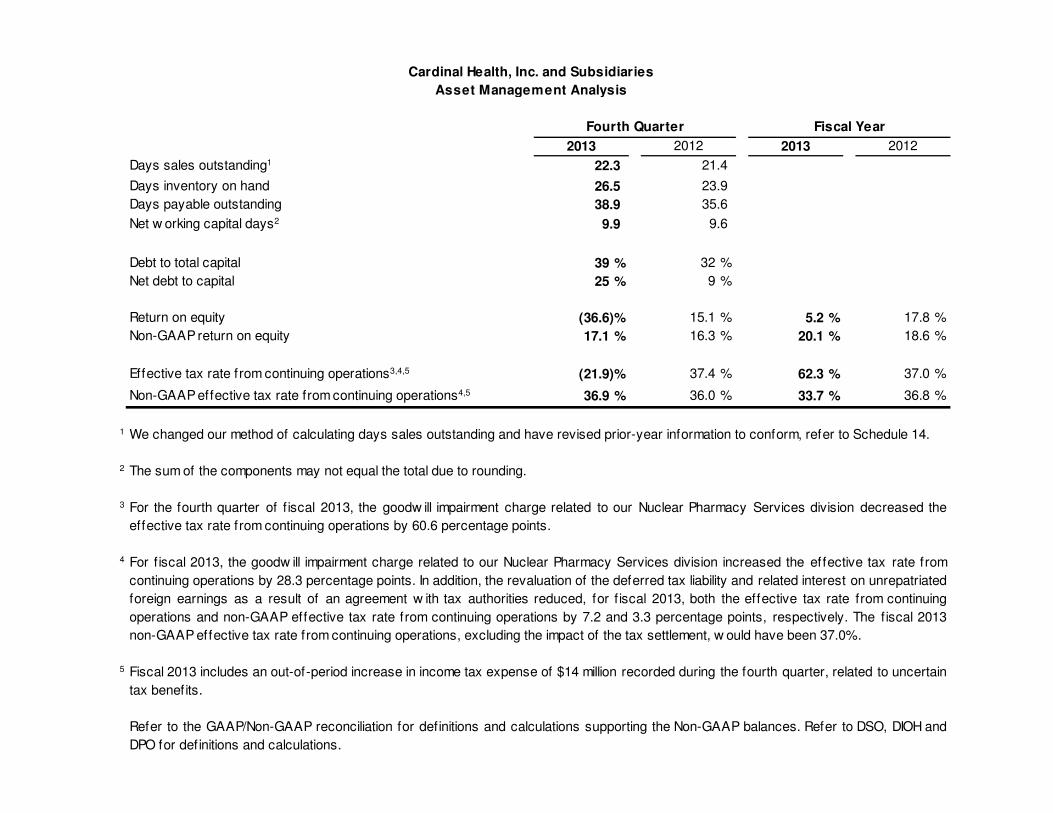
Days sales outstanding1 22.3 21.4
Days inventory on hand 26.5 23.9
Days payable outstanding 38.9 35.6
Net w orking capital days2 9.9 9.6
Debt to total capital 39 % 32 %
Net debt to capital 25 % 9 %
Return on equity (36.6)% 15.1 % 5.2 % 17.8 %
Non-GAAP return on equity 17.1 % 16.3 % 20.1 % 18.6 %
Effective tax rate from continuing operations3,4,5 (21.9)% 37.4 % 62.3 % 37.0 %
Non-GAAP effective tax rate from continuing operations4,5 36.9 % 36.0 % 33.7 % 36.8 %
1
2
3
4
5
We changed our method of calculating days sales outstanding and have revised prior-year information to conform, refer to Schedule 14.
The sum of the components may not equal the total due to rounding.
For the fourth quarter of fiscal 2013, the goodw ill impairment charge related to our Nuclear Pharmacy Services division decreased the
effective tax rate from continuing operations by 60.6 percentage points.
Cardinal Health, Inc. and Subsidiaries
Asset Management Analysis
Fourth Quarter Fiscal Year
Refer to the GAAP/Non-GAAP reconciliation for definitions and calculations supporting the Non-GAAP balances. Refer to DSO, DIOH and
DPO for definitions and calculations.
For fiscal 2013, the goodw ill impairment charge related to our Nuclear Pharmacy Services division increased the effective tax rate from
continuing operations by 28.3 percentage points. In addition, the revaluation of the deferred tax liability and related interest on unrepatriated
foreign earnings as a result of an agreement w ith tax authorities reduced, for fiscal 2013, both the effective tax rate from continuing
operations and non-GAAP effective tax rate from continuing operations by 7.2 and 3.3 percentage points, respectively. The fiscal 2013
non-GAAP effective tax rate from continuing operations, excluding the impact of the tax settlement, w ould have been 37.0%.
Fiscal 2013 includes an out-of-period increase in income tax expense of $14 million recorded during the fourth quarter, related to uncertain
tax benefits.
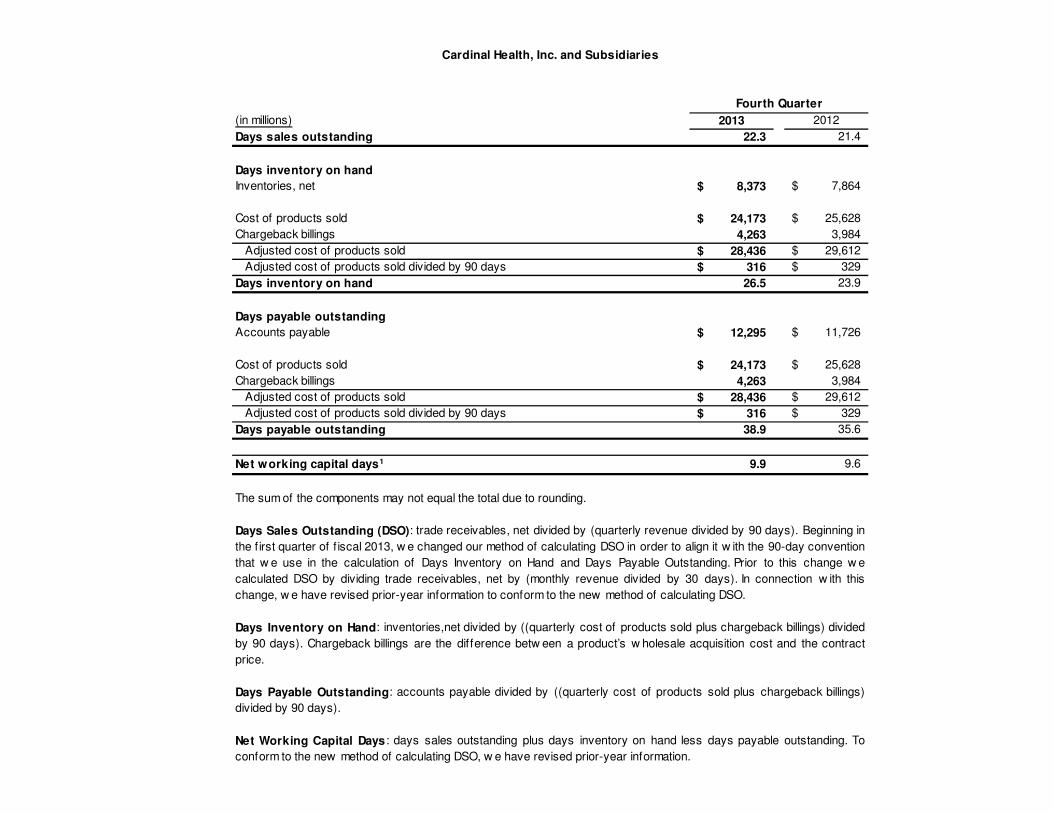
(in millions) 2013 2012
Days sales outstanding 22.3 21.4
Days inventory on hand
Inventories, net 8,373$ 7,864$
Cost of products sold 24,173$ 25,628$
Chargeback billings 4,263 3,984
Adjusted cost of products sold 28,436$ 29,612$
Adjusted cost of products sold divided by 90 days 316$ 329$
Days inventory on hand 26.5 23.9
Days payable outstanding
Accounts payable 12,295$ 11,726$
Cost of products sold 24,173$ 25,628$
Chargeback billings 4,263 3,984
Adjusted cost of products sold 28,436$ 29,612$
Adjusted cost of products sold divided by 90 days 316$ 329$
Days payable outstanding 38.9 35.6
Net working capital days1 9.9 9.6
Cardinal Health, Inc. and Subsidiaries
Fourth Quarter
The sum of the components may not equal the total due to rounding.
Days Sales Outstanding (DSO): trade receivables, net divided by (quarterly revenue divided by 90 days). Beginning in
the first quarter of f iscal 2013, w e changed our method of calculating DSO in order to align it w ith the 90-day convention
that w e use in the calculation of Days Inventory on Hand and Days Payable Outstanding. Prior to this change w e
calculated DSO by dividing trade receivables, net by (monthly revenue divided by 30 days). In connection w ith this
change, w e have revised prior-year information to conform to the new method of calculating DSO.
Days Inventory on Hand: inventories,net divided by ((quarterly cost of products sold plus chargeback billings) divided
by 90 days). Chargeback billings are the difference betw een a product’s w holesale acquisition cost and the contract
price.
Days Payable Outstanding: accounts payable divided by ((quarterly cost of products sold plus chargeback billings)
divided by 90 days).
Net Working Capital Days : days sales outstanding plus days inventory on hand less days payable outstanding. To
conform to the new method of calculating DSO, w e have revised prior-year information.
1
2
3
4
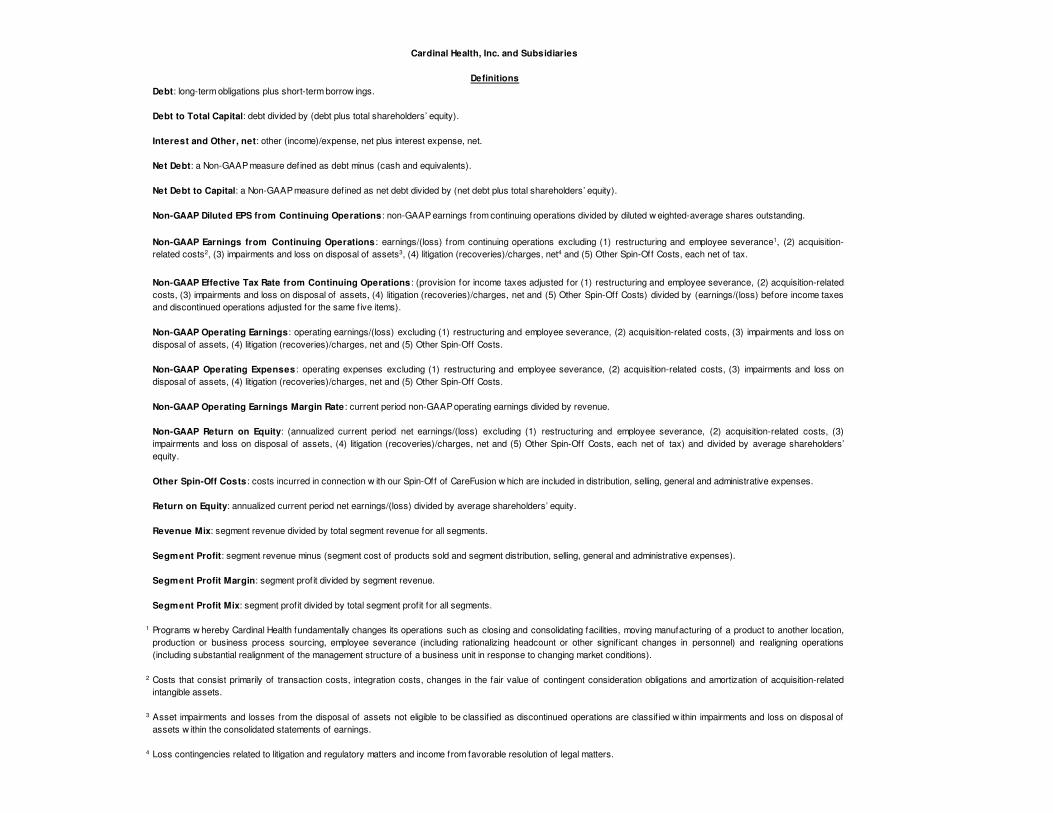
Cardinal Health, Inc. and Subsidiaries
Definitions
Debt: long-term obligations plus short-term borrow ings.
Debt to Total Capital: debt divided by (debt plus total shareholders’ equity).
Net Debt: a Non-GAAP measure defined as debt minus (cash and equivalents).
Net Debt to Capital: a Non-GAAP measure defined as net debt divided by (net debt plus total shareholders’ equity).
Asset impairments and losses from the disposal of assets not eligible to be classified as discontinued operations are classif ied w ithin impairments and loss on disposal of
assets w ithin the consolidated statements of earnings.
Loss contingencies related to litigation and regulatory matters and income from favorable resolution of legal matters.
Return on Equity: annualized current period net earnings/(loss) divided by average shareholders’ equity.
Revenue Mix: segment revenue divided by total segment revenue for all segments.
Segment Profit: segment revenue minus (segment cost of products sold and segment distribution, selling, general and administrative expenses).
Segment Profit Margin: segment prof it divided by segment revenue.
Segment Profit Mix: segment prof it divided by total segment profit for all segments.
Interest and Other, net: other (income)/expense, net plus interest expense, net.
Non-GAAP Operating Expenses : operating expenses excluding (1) restructuring and employee severance, (2) acquisition-related costs, (3) impairments and loss on
disposal of assets, (4) litigation (recoveries)/charges, net and (5) Other Spin-Off Costs.
Non-GAAP Operating Earnings Margin Rate : current period non-GAAP operating earnings divided by revenue.
Programs w hereby Cardinal Health fundamentally changes its operations such as closing and consolidating facilities, moving manufacturing of a product to another location,
production or business process sourcing, employee severance (including rationalizing headcount or other signif icant changes in personnel) and realigning operations
(including substantial realignment of the management structure of a business unit in response to changing market conditions).
Costs that consist primarily of transaction costs, integration costs, changes in the fair value of contingent consideration obligations and amortization of acquisition-related
intangible assets.
Non-GAAP Earnings from Continuing Operations : earnings/(loss) from continuing operations excluding (1) restructuring and employee severance1, (2) acquisition-
related costs2, (3) impairments and loss on disposal of assets3, (4) litigation (recoveries)/charges, net4 and (5) Other Spin-Off Costs, each net of tax.
Non-GAAP Effective Tax Rate from Continuing Operations : (provision for income taxes adjusted for (1) restructuring and employee severance, (2) acquisition-related
costs, (3) impairments and loss on disposal of assets, (4) litigation (recoveries)/charges, net and (5) Other Spin-Off Costs) divided by (earnings/(loss) before income taxes
and discontinued operations adjusted for the same f ive items).
Non-GAAP Operating Earnings: operating earnings/(loss) excluding (1) restructuring and employee severance, (2) acquisition-related costs, (3) impairments and loss on
disposal of assets, (4) litigation (recoveries)/charges, net and (5) Other Spin-Off Costs.
Non-GAAP Return on Equity: (annualized current period net earnings/(loss) excluding (1) restructuring and employee severance, (2) acquisition-related costs, (3)
impairments and loss on disposal of assets, (4) litigation (recoveries)/charges, net and (5) Other Spin-Off Costs, each net of tax) and divided by average shareholders’
equity.
Other Spin-Off Costs : costs incurred in connection w ith our Spin-Off of CareFusion w hich are included in distribution, selling, general and administrative expenses.
Non-GAAP Diluted EPS from Continuing Operations: non-GAAP earnings from continuing operations divided by diluted w eighted-average shares outstanding.